

Page 1
USER GUIDE
Rockwell Automation Publication HIST-UM001K-EN-E-June 2014
Supersedes Publication HIST-UM001J-EN-P-December 2011
Page 2

Contacting Rockwell
Copyright Notice
Trademark Notices
Other Trademarks
Warranty
Customer Support Telephone — 1.440.646.3434
Online Support — http://www.rockwellautomation.com/support/overview.page
© 2014 Rockwell Automation Technologies, Inc. All Rights Reserved.
This document and any accompanying Rockwell Software products are copyrighted by Rockwell Automation,
Inc. Any reproduction and/or distribution without prior written consent from Rockwell Automation, Inc. is
strictly prohibited. Please refer to the license agreement for details.
FactoryTalk, FactoryTalk Activation, FactoryTalk Diagnostics, FactoryTalk Directory, FactoryTalk Live Data,
FactoryTalk Metrics, FactoryTalk Services Platform, FactoryTalk Transaction Manager, FactoryTalk
VantagePoint, FactoryTalk ProductionCentre, Report Expert, Rockwell, Rockwell Automation, Rockwell
Software, and RSBizWare are trademarks of Rockwell Automation, Inc.
Any Rockwell Automation logo, software or hardware not mentioned herein is also a trademark, registered or
otherwise, of Rockwell Automation, Inc.
For a complete list of products and their respective trademarks, go to
http://www.rockwellautomation.com/rockwellautomation/legal-notices/overview.page?%23tab4#/tab4
.
ActiveX, Microsoft, Microsoft Access, SQL Server, Visual Basic, Visual C++, Visual SourceSafe, Windows,
Windows ME, Windows NT, Windows 2000, Windows Server, Windows XP, Windows 7, Windows Vista, and
Windows 8 are either registered trademarks or trademarks of Microsoft Corporation in the United States
and/or other countries.
Adobe, Acrobat, and Reader are either registered trademarks or trademarks of Adobe Systems Incorporated in
the United States and/or other countries.
ControlNet is a registered trademark of ControlNet International.
DeviceNet is a trademark of the Open DeviceNet Vendor Association, Inc. (ODVA)
OLE for Process Control (OPC) is a registered trademark of the OPC Foundation.
Oracle, SQL*Net, and SQL*Plus are registered trademarks of Oracle Corporation.
All other trademarks are the property of their respective holders and are hereby acknowledged.
This product is warranted in accordance with the product license. The product’s performance may be affected
by system configuration, the application being performed, operator control, maintenance, and other related
factors. Rockwell Automation is not responsible for these intervening factors. The instructions in this
document do not cover all the details or variations in the equipment, procedure, or process described, nor do
they provide directions for meeting every possible contingency during installation, operation, or
maintenance. This product’s implementation may vary among users.
This document is current as of the time of release of the product; however, the accompanying software may
have changed since the release. Rockwell Automation, Inc. reserves the right to change any information
contained in this document or the software at any time without prior notice. It is your responsibility to obtain
the most current information available from Rockwell when installing or using this product.
Page 3

Welcome to FactoryTalk
Historian Classic
Getting Started
Collecting FactoryTalk Historian
Classic Data
Analyzing FactoryTalk Historian
Classic Data
Table of Contents
Chapter 1
What is FactoryTalk Historian Classic? .................................................. 9
Features and Benefits .............................................................................. 9
Intended Audience ........................................................................................ 9
Where Can I Go for Help? ....................................................................... 11
Chapter 2
The RSBizWare Architecture .................................................................. 13
Connecting to the Information Services Manager .............................. 14
Using the Information Services Manager in Internet Explorer .. 14
Using the Configuration Console ..................................................... 15
Exploring the User Interface ..................................................................... 16
The Report Explorer ............................................................................. 16
The Report Design and Display Work Area ................................... 16
Shortcut Menus ...................................................................................... 17
Chapter 3
The Plant Model .......................................................................................... 19
Configuring the Plant Model .............................................................. 20
Configure Time-Series Data Collection ................................................ 22
Types of control connectors for the data collection ...................... 23
Enterprise Connectors .......................................................................... 24
Tutorial .................................................................................................... 25
Step 1: Start the Time-Series Data Collection Wizard ........... 25
Step 2: Select the Source and Destination of the Time-Series
Data 25
Step 3: Create or Select Data Points ............................................ 27
Step 4: Configure Collection Parameters ................................... 31
Step 5: Configure Transaction Settings ...................................... 34
Step 6: Create Transactions ........................................................... 36
Organize FactoryTalk Historian Classic Reporting Tags ................. 36
Start Data Collection ................................................................................. 39
Rockwell Automation Publication HIST-UM001K-EN-E-June 2014 3
Chapter 4
Create a New RSBizWare Report ........................................................... 41
Insert Text, Pictures, and Hyperlinks ..................................................... 42
Page 4

Table of Contents
Save the Report ............................................................................................ 44
Add a Saved Report Object to Your Report ......................................... 45
Configure the Report Object To Use Global Credentials ................ 48
Create a New Chart .................................................................................... 51
Step 1: Plan the Chart ........................................................................... 52
Step 2: Select the Data On Which To Report ................................ 53
Step 3: Choose a Chart Type .............................................................. 53
Step 4: Describe the Data ..................................................................... 53
Step 5: Select Summary or Detail ....................................................... 54
Step 6: Select the Fields To Be Charted ........................................... 55
Step 7: Enter the Chart Title .............................................................. 56
Step 8: Filter the Data ........................................................................... 56
Step 9: Insert Your New Chart Into the Report ............................ 59
Create a New Text Report Object .......................................................... 60
Step 1: Start the Text Report Object Wizard ................................. 61
Step 2: Select the Data On Which To Report ................................ 61
Step 3: Group the Records ................................................................... 62
Step 4: Sort the Records ....................................................................... 63
Step 5: Format the Table ...................................................................... 64
Step 6: Name the Report Object ........................................................ 66
Step 7: Filter the Data ........................................................................... 66
Step 8: Insert Your New Table Into the Report ............................. 66
Create a Time-series Chart ....................................................................... 67
Step 1: Create the Report Object ....................................................... 67
Step 2: Name the Report Object ........................................................ 68
Step 3: Add Reporting Tags ................................................................ 68
Step 4: Apply an Analysis Tool ........................................................... 69
Step 5: Customize the Chart Legend ................................................ 70
Step 6: Insert Your New Chart Into the Report ............................ 71
Step 7: Adjust the Time Range ........................................................... 71
Step 3: Add Reporting Tags ................................................................ 73
Step 9: Remove a Reporting Tag or an Analysis Tool ................... 76
Create a Simple Batch/Event Chart ....................................................... 76
Add a Comment to a Value, X-axis, or Y-axis on a Time-series Chart
79
Value Comments ................................................................................... 80
4 Rockwell Automation Publication HIST-UM001K-EN-E-June 2014
Page 5

Table of Contents
Customizing RSBizWare Charts
and Tables
Advanced Reporting Topics
X-axis Comments .................................................................................. 81
Y-axis Comments ................................................................................... 82
Ad Comment As .................................................................................... 84
Export the Report to HTML ................................................................... 84
Load the Report From File ........................................................................ 85
Chapter 5
Customizing Charts ................................................................................... 87
Working With the Component Parts of a Chart .......................... 88
Resizing a Component .................................................................... 89
Moving a Component ..................................................................... 89
Deleting a Component .................................................................... 89
Editing the Chart Title or Text Field .......................................... 89
Changing Chart Component Properties .................................... 90
Working With Chart “Pens” .................................................................... 90
Customizing Text Report Objects .......................................................... 90
Show and Hide Columns ..................................................................... 91
Resize Table Columns .......................................................................... 92
Aggregate, Group, Format, Sort, Chart, and Rename Columns 92
Aggregate ............................................................................................ 93
Group 94
Format 94
Sort 94
Chart 95
Rename 95
Quick Filter ................................................................................................... 95
Rockwell Automation Publication HIST-UM001K-EN-E-June 2014 5
Chapter 6
The Excel Add-in ........................................................................................ 97
Scheduling Report Objects and Reports ............................................. 101
Schedule a Report Object .................................................................. 102
Schedule a Report ............................................................................... 105
View the History of the Scheduled Task ....................................... 109
Analyzing Non-RSBizWare Data ........................................................ 110
Create an External Data Source....................................................... 110
Create a Report Data Source ............................................................ 111
Step 1: Start the Report Data Source Wizard ......................... 111
Page 6

Table of Contents
Creating RSBizWare Custom
Analysis Tools
Step 2: Give the Report Data Source a Name ......................... 116
Step 3: Select a Database Table or View ................................... 117
Step 4: Choose the Columns That Will Be Included ........... 117
Step 5: Enable the Time Selection Toolbar ............................. 119
Step 6: Specify the Format of the Table or View.................... 120
Step 7: Specify the Role That Each Field Plays In Time-Series
Analysis 122
Step 8: Create a Data Point Configuration Table ................. 123
Chapter 7
Why Use Custom Analysis Tools? ....................................................... 125
Intended Audience ................................................................................... 125
A Quick Tour of a Sample Custom Analysis Tool .......................... 126
Registering a Sample Analysis Tool ................................................ 127
Using the Sample Analysis Tool for Time-series Analysis ........ 129
What You Need to Know Before You Start ...................................... 129
Analysis Tool Architecture ............................................................... 130
What a Time-series Data Set Looks Like ...................................... 132
Interpreting the Parameters Passed into the Calculate() Function
133
Limitations ........................................................................................... 134
The RSBizWare Calculator COM Interface ..................................... 134
Looking at the Type Library ............................................................. 135
Developing Analysis Tools with Visual Basic .................................... 136
Creating a New Project...................................................................... 137
Configuring Important Project Settings ....................................... 137
Referencing the RSBizWare Calculator Component ................ 138
Writing the Calculate() Function ................................................... 138
Saving and Compiling the Project .................................................. 140
Trying Out the New Custom Analysis Tool ................................ 141
Debugging Custom Analysis Tools in Visual Basic .................... 142
Developing Analysis Tools with Visual C++ .................................... 143
Creating a New Project...................................................................... 144
Referencing the RSBizWare Calculator Component ................ 145
Working with VARIANTs in Visual C++ .................................. 147
Writing the Calculate() Function ................................................... 148
6 Rockwell Automation Publication HIST-UM001K-EN-E-June 2014
Page 7

Table of Contents
Object Permissions
Saving and Compiling the Project .................................................. 151
Trying Out the Custom Analysis Tool.......................................... 153
Debugging Custom Analysis Tools in Visual C++ .................... 154
Why Use Custom Analysis Tools? ....................................................... 155
Chapter 8
Filter permissions ..................................................................................... 158
Report permissions ................................................................................... 158
Report data source permissions ............................................................. 159
Report object permissions ...................................................................... 159
Rockwell Automation Publication HIST-UM001K-EN-E-June 2014 7
Page 8

Table of Contents
8 Rockwell Automation Publication HIST-UM001K-EN-E-June 2014
Page 9

What is FactoryTalk Historian Classic?
Features and Benefits
Intended Audience
Chapter 1
Welcome to FactoryTalk Historian Classic
The RSBizWare software is a suite of tools and services aimed at
increasing your manufacturing floor effectiveness and profitability
with solutions that target performance analysis and improvement
and with data acquisition and integration. FactoryTalk Historian
Classic is just one of the applications that is available within the
RSBizWare software. FactoryTalk Historian Classic is a repository
for historical data, built for today’s networked and distributed
enterprise. Tightly coupled to FactoryTalk Transaction Manager for
data collection, FactoryTalk Historian Classic ships with a
complete, predesigned data model for time-series data logging, and
offers the ability to analyze data from external database tables.
FactoryTalk Historian Classic offers the following features and
benefits:
• Rich reporting, graphing, time-series analysis, and querying
functionality provide a complete and easy-to-use solution for
performance analysis.
• A direct link between the shop floor, where data is collected,
and the enterprise, where data can be analyzed and reported
on.
• The ability to embed a report object in any Microsoft ActiveX
container, such as Visual Basic or Internet Explorer.
• The ability to analyze data contained in non-RSBizWare
databases.
The FactoryTalk Historian Classic User Guide is designed to help
you understand how to access and use the FactoryTalk Historian
Classic product. This document focuses on the end-user functions of
Rockwell Automation Publication HIST-UM001K-EN-E-June 2014 9
Page 10

Chapter 1 Welcome to FactoryTalk Historian Classic
FactoryTalk Historian Classic and does not cover installation and
operation of underlying system services.
This document is intended for the following types of users of the
RSBizWare software:
• RSBizWare administrators
RSBizWare administrators configure the RSBizWare system
so that it can capture performance data for use by report
designers and report users.
They should be familiar with:
• Control systems, process information (line and plant), and
databases.
• Microsoft Windows operating system.
• The location and structure of databases.
• Report designers
Report designers create the reports that will be used by report
users.
They should be familiar with:
• Process information (the physical representation of the
production line and plant).
• Microsoft Windows operating systems.
• Query logic (how to write a database query).
• Web publishing tools.
• The location and structure of databases.
• Report users
Report users make use of the reports created by the report
designer to perform their jobs.
They should be familiar with:
10 Rockwell Automation Publication HIST-UM001K-EN-E-June 2014
Page 11

Welcome to FactoryTalk Historian Classic Chapter 1
Where Can I Go for Help?
• Microsoft Windows operating systems.
Consult the following resources for additional information about
the product:
• Release Notes
The release notes contain current information about the
product, including hardware and software requirements, new
features, known and fixed anomalies.
• RSBizWare Administration Guide
The administration guide helps the RSBizWare administrator
install and configure the software as well as understand the
architecture of the RSBizWare suite and its components.
• Online help
The online help provides general information and step-by-step
procedures for working with the product.
• Rockwell Automation Support Center
The support center provides a variety of services, such as
trainings, webinars, and online support that will improve your
experience using the RSBizWare suite.
Rockwell Automation Publication HIST-UM001K-EN-E-June 2014 11
Page 12

Chapter 1 Welcome to FactoryTalk Historian Classic
12 Rockwell Automation Publication HIST-UM001K-EN-E-June 2014
Page 13
The RSBizWare Architecture
Chapter 2
Getting Started
Before you walk through the examples and tutorials that are
discussed in this book, it is assumed that the RSBizWare
administrator has installed, configured, and started the Information
Services Manager on the server computer.
Rockwell Automation Publication HIST-UM001K-EN-E-June 2014 13
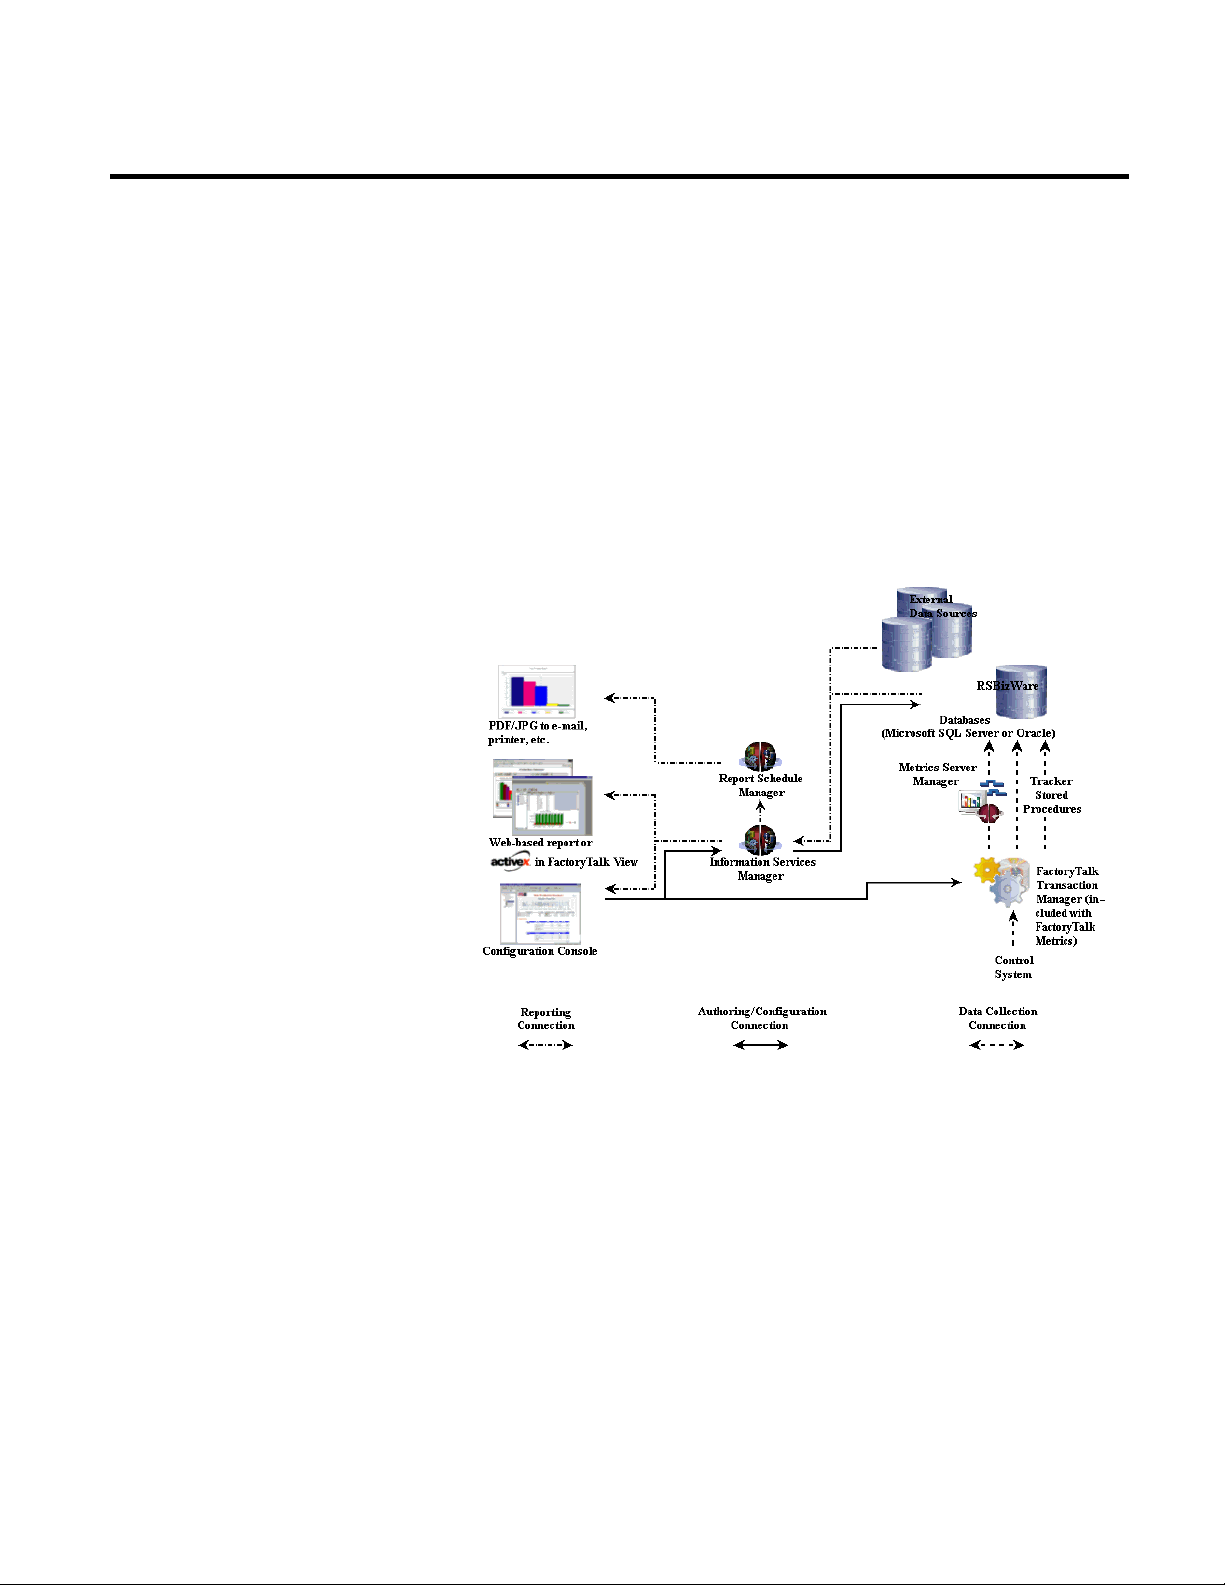
The RSBizWare architecture is a scalable, multi-tiered, distributed
architecture consisting of a data collection subsystem, an Oracle or
SQL Server database repository, the Information Services Manager,
and clients. Rockwell Automation’s FactoryTalk Transaction
Manager is the embedded engine that collects data from the control
system(s), and the Metrics Server Manager logs it to the predefined
RSBizWare database repository. There are several types of clients,
including the Configuration Console and the Internet Explorer
Web client.
Page 14

Chapter 2 Getting Started
Connecting to the Information Services Manager
Using the Information Services Manager in Internet Explorer
The RSBizWare architecture can be configured to run on a single
computer, or it can be distributed across multiple computers. In the
simplest case, the Configuration Console, the Information Services
Manager, the RSBizWare administrative tools used by the
RSBizWare administrator, the database, the Metrics Server
Manager, and the FactoryTalk Transaction Manager data collection
engine run on a single computer. In a distributed setting, these
components may reside on separate computers. Clients connect to
the Information Services Manager using TCP/IP, so they can be
deployed over a LAN, WAN, intranet, or the Internet. The
scalability of the RSBizWare architecture allows many clients to
connect to a single server.
RSBizWare reports created by the report designer are saved to the
Information Services Manager, and are available online over a
TCP/IP network. If you wish to create and edit RSBizWare reports
using Microsoft Internet Explorer, you need to run the
Configuration Console.
Using Microsoft Internet Explorer to view RSBizWare reports, you
can connect to the Information Services Manager without having
the RSBizWare software installed on your computer. Instead, the
server hosts a special Web page, the Quick Web, to give you access to
the RSBizWare reports stored on the server. This option only allows
you to view RSBizWare reports.
To access the Quick Web, open Internet Explorer, type the Web
address for the Information Services Manager computer, and press
Enter on your keyboard.
The Web address is made up of the name of the server computer and
the HTTP port number used by the server computer, separated by a
colon.
For example, if you were attempting to connect to a server computer
named
rsi-rockwell that uses the default HTTP port 8080, you
14 Rockwell Automation Publication HIST-UM001K-EN-E-June 2014
Page 15

Getting Started Chapter 2
Using the Configuration Console
would use the following address: http://rsi-rockwell:8080.
Please contact your RSBizWare administrator for the specific
Information Services Manager Web address to which you should
connect.
The first time you try to use the Quick Web, you need to download
several ActiveX controls from the server computer. The download
will begin automatically.
After you have downloaded the ActiveX controls from the
Information Services Manager, you may be prompted to log on. If
prompted, type the user name and password for the account that
your RSBizWare administrator has authorized for you, and then
click OK. A connection to the RSBizWare server is established.
If you wish to configure your plant model, manage the collection of
control system data, and/or edit RSBizWare reports, you should
connect to the Information Services Manager via the Configuration
Console. Your RSBizWare administrator must assign a FactoryTalk
Metrics Author license and the appropriate privileges to you before
you will be able to perform these functions.
You must have the Client software installed on your computer
before you can run the Configuration Console. To install the
Configuration Console from the RSBizWare CD, select the
“Minimal” install option.
1. To start the Configuration Console, select Programs >
Rockwell Software > RSBizWare > Configuration Console.
2. If you have not already logged into RSBizWare, the Login
dialog will display. Enter the user name and password for the
account your RSBizWare administrator has authorized for
you. Enter the name of the server computer where the
Information Services Manager is running in the Server box.
Click Login.
Rockwell Automation Publication HIST-UM001K-EN-E-June 2014 15
Page 16
Chapter 2 Getting Started
Exploring the User Interface
The Report Explorer
The Report Design and Display Work Area
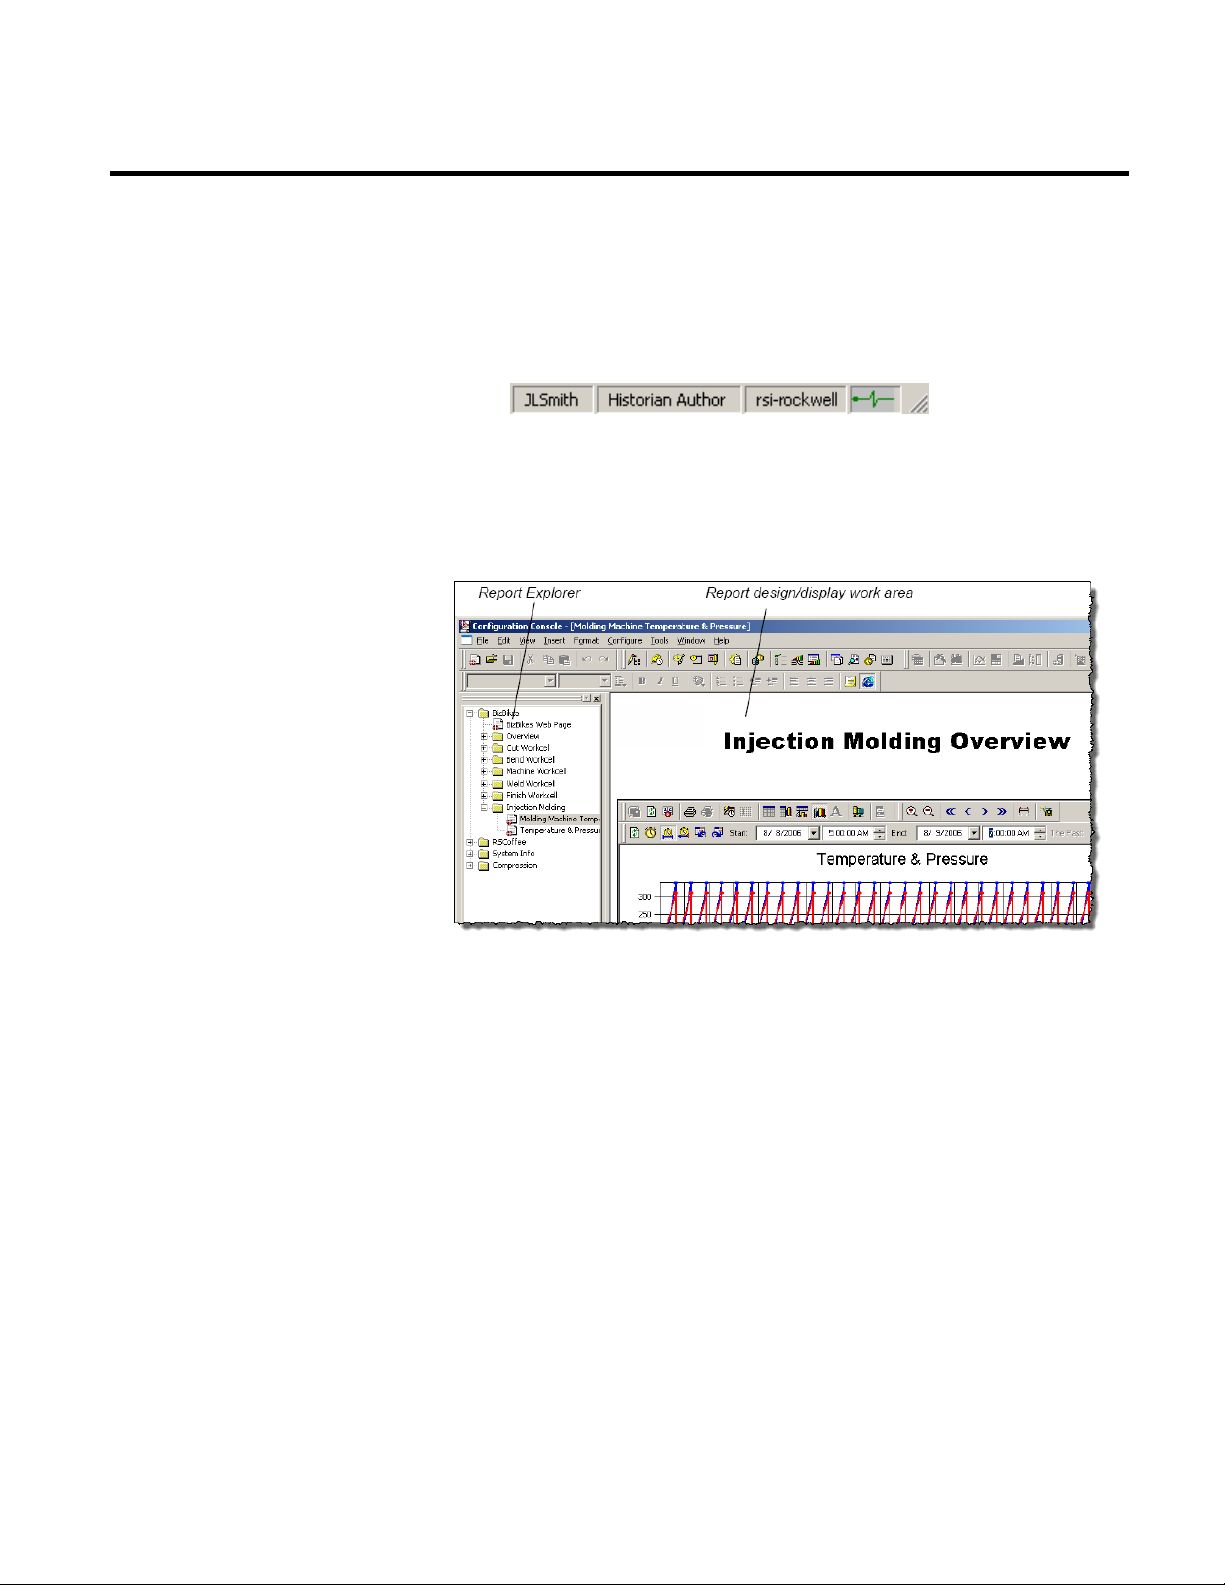
The status bar at the bottom of the client application shows
your user name, the activations that have been assigned to you,
and the Information Services Manager to which you are
connected.
When you start the Configuration Console, you will notice that the
user interface is made up of two main components: the Report
Explorer and the report design and display work area.
16 Rockwell Automation Publication HIST-UM001K-EN-E-June 2014
The Report Explorer is a hierarchical navigation tool used for
organizing RSBizWare reports that have been saved for future use.
The Report Explorer contains the reports that have been saved on
the Information Services Manager to which you are connected and
for which you have been granted view permissions. Your ability to
modify and delete the reports listed on the Report Explorer is
dependent on the licenses and features that have been assigned to
you by your RSBizWare administrator and the permissions that
have been granted to you by the creator of each individual report.
When you click an item in the Report Explorer, the specified
RSBizWare report will display in the work area to the right of the
Page 17

Getting Started Chapter 2
Shortcut Menus
Report Explorer. The work area is the region where report designers
can create and modify reports.
Many areas of the application give you access to shortcut menus.
The shortcut menu allows you to perform frequently used
commands without using the main application menu or toolbar
buttons. To view the shortcut menu, you need to right-click in the
area of the desired application. The shortcut menu contains
commands that are appropriate for the selected area. For example, if
you right-click the Report Explorer, the shortcut menu will contain
commands that apply to the Report Explorer.
Rockwell Automation Publication HIST-UM001K-EN-E-June 2014 17
Page 18

Chapter 2 Getting Started
18 Rockwell Automation Publication HIST-UM001K-EN-E-June 2014
Page 19

The Plant Model
Chapter 3
Collecting FactoryTalk Historian Classic Data
The primary functions of FactoryTalk Historian Classic are to
collect and analyze time-series data. Before the report designer can
create time-series analysis reports for the report user, the RSBizWare
administrator must set up the application to collect data from the
control system. The tutorials in this chapter will help you
understand how to use FactoryTalk Historian Classic to collect
time-series data. We will:
• Configure the plant model for your FactoryTalk Historian
Classic installation
• Configure time-series data collection
• Organize FactoryTalk Historian Classic reporting tags
• Start and stop data collection
The tutorial in "Analyzing FactoryTalk Historian Classic Data (page
41)" will help you understand how to analyze the data that is
collected in FactoryTalk Historian Classic.
The plant model is made up of activity areas - enterprises, sites, areas,
lines, and workcells - as well as of equipment and labor resources.
The activity areas are based on the terms defined by the Instrument
Society of America (ISA) S95 standard in order to provide common
terminology for improved communication and integration between
control systems and enterprise systems.
Rockwell Automation Publication HIST-UM001K-EN-E-June 2014 19
Page 20
Chapter 3 Collecting FactoryTalk Historian Classic Data
workcell in the line).
location.
location at which products are manufactured.
Enterprise
The highest-level activity area, typically representing the business.
To create and edit the plant model, you must be granted the
Activity Areas".
Configuring the Plant Model
Item Description
Workcell A location and/or group of equipment used to perform work in a
Line A collection of one or more workcells that are combined to perform
Area A physical, geographical, or logical grouping of lines and/or
manufacturing process. The operations in a manufacturing process
are performed at workcells. A workcell is typically a physical
location and a primary resource (e.g., a machine); however, it may
also represent a logical grouping of primary resources from which a
selection is made.
work. The workcells in a line are either physically located close to
one another, or are related to one another in the production process
(the production result of the first workcell in a line feeds the second
workcells within a site, typically representing a main production
capability (e.g., electronic assembly) within a manufacturing
Site A group of areas, lines, and workcells representing a geographical
The plant model may be used by all RSBizWare applications in your
organization (FactoryTalk Metrics, FactoryTalk Historian Classic,
and FactoryTalk Scheduler). The enterprises, sites, areas, lines, and
workcells in your plant model are the subjects of your performance
parameter evaluation. For implementations of RSBizWare that
incorporate the FactoryTalk Scheduler application, the plant model
also includes capacity, which is the property of an activity area
describing its availability over time. The performance parameters
can also be configured for resources.
NOTE:
Organize Plant Model privilege by your RSBizWare administrator.
If you want to have access to sample data, see "Loading Sample
To configure the plant model in the Configuration Console:
20 Rockwell Automation Publication HIST-UM001K-EN-E-June 2014
1. On the Configure menu, click Plant Model.
Page 21
Collecting FactoryTalk Historian Classic Data Chapter 3
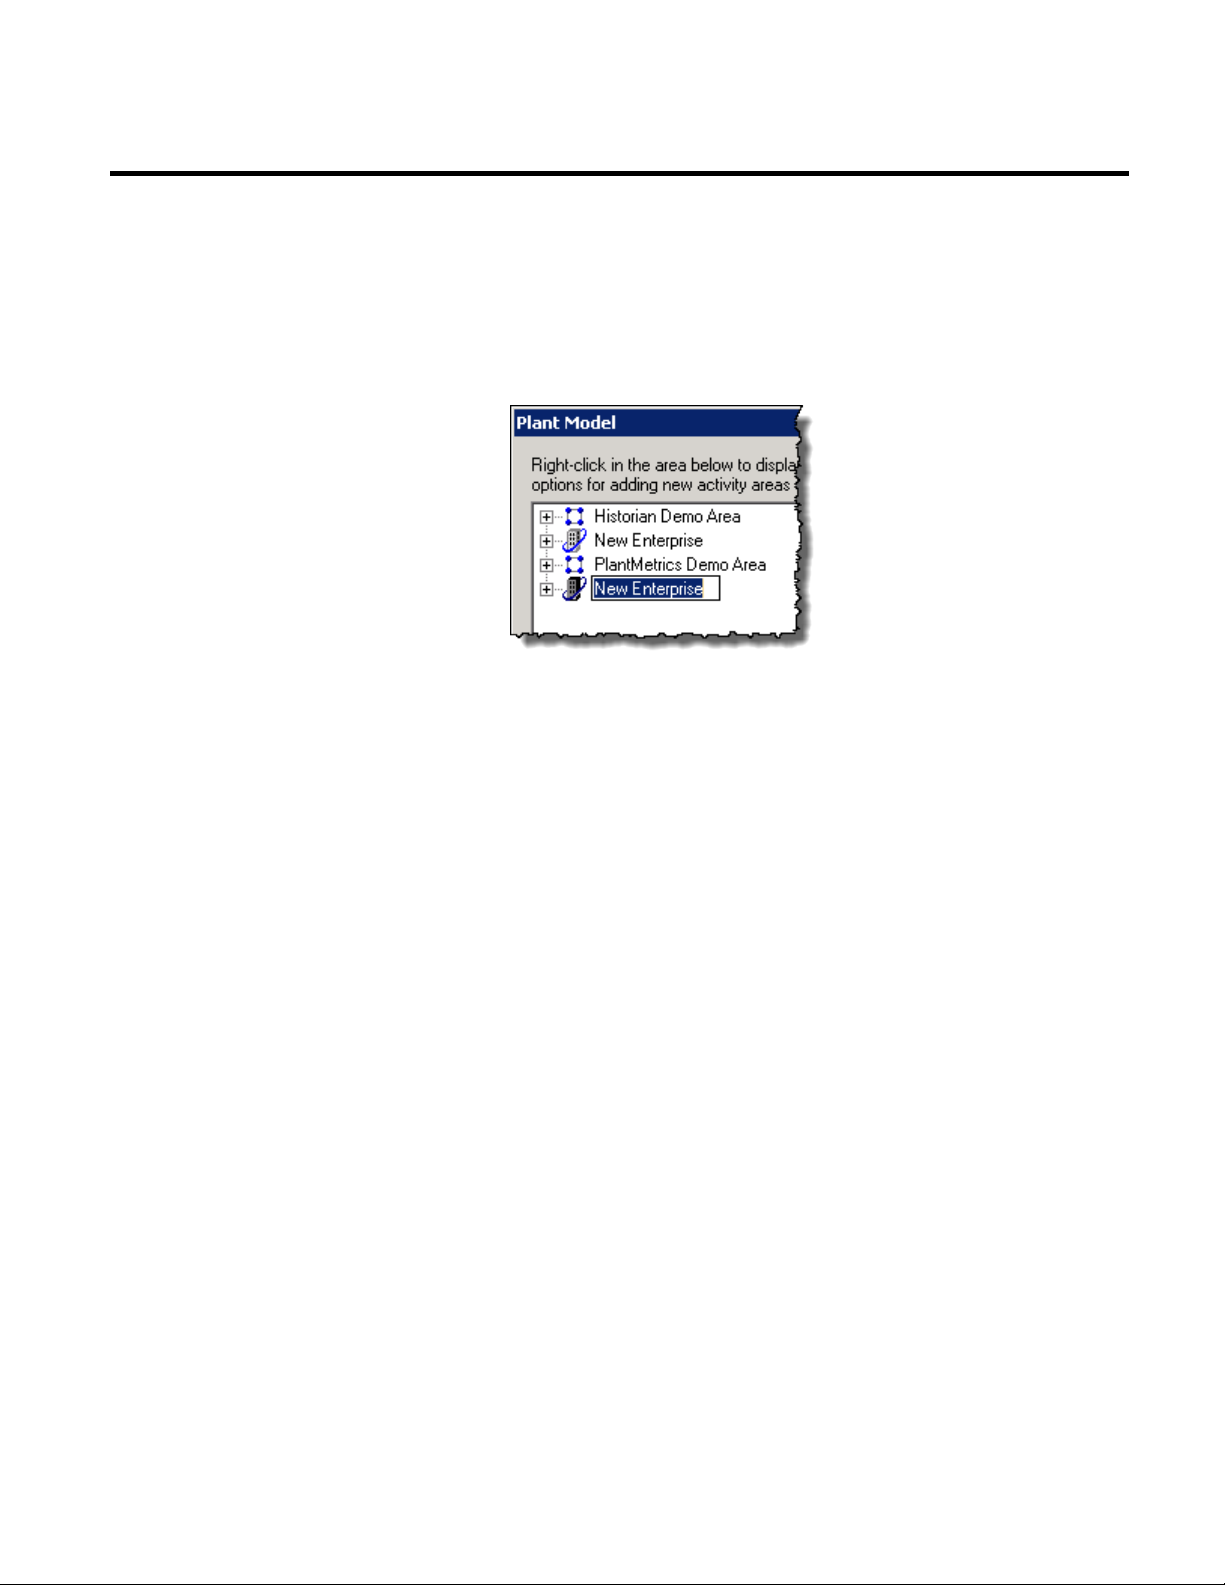
The Plant Model dialog box appears.
2. Right-click in the area under the plant model tree, and then
click New Root Enterprise.
A new enterprise is added to the tree.
3. Change the default name to
Sample Enterprise, and then press
Enter.
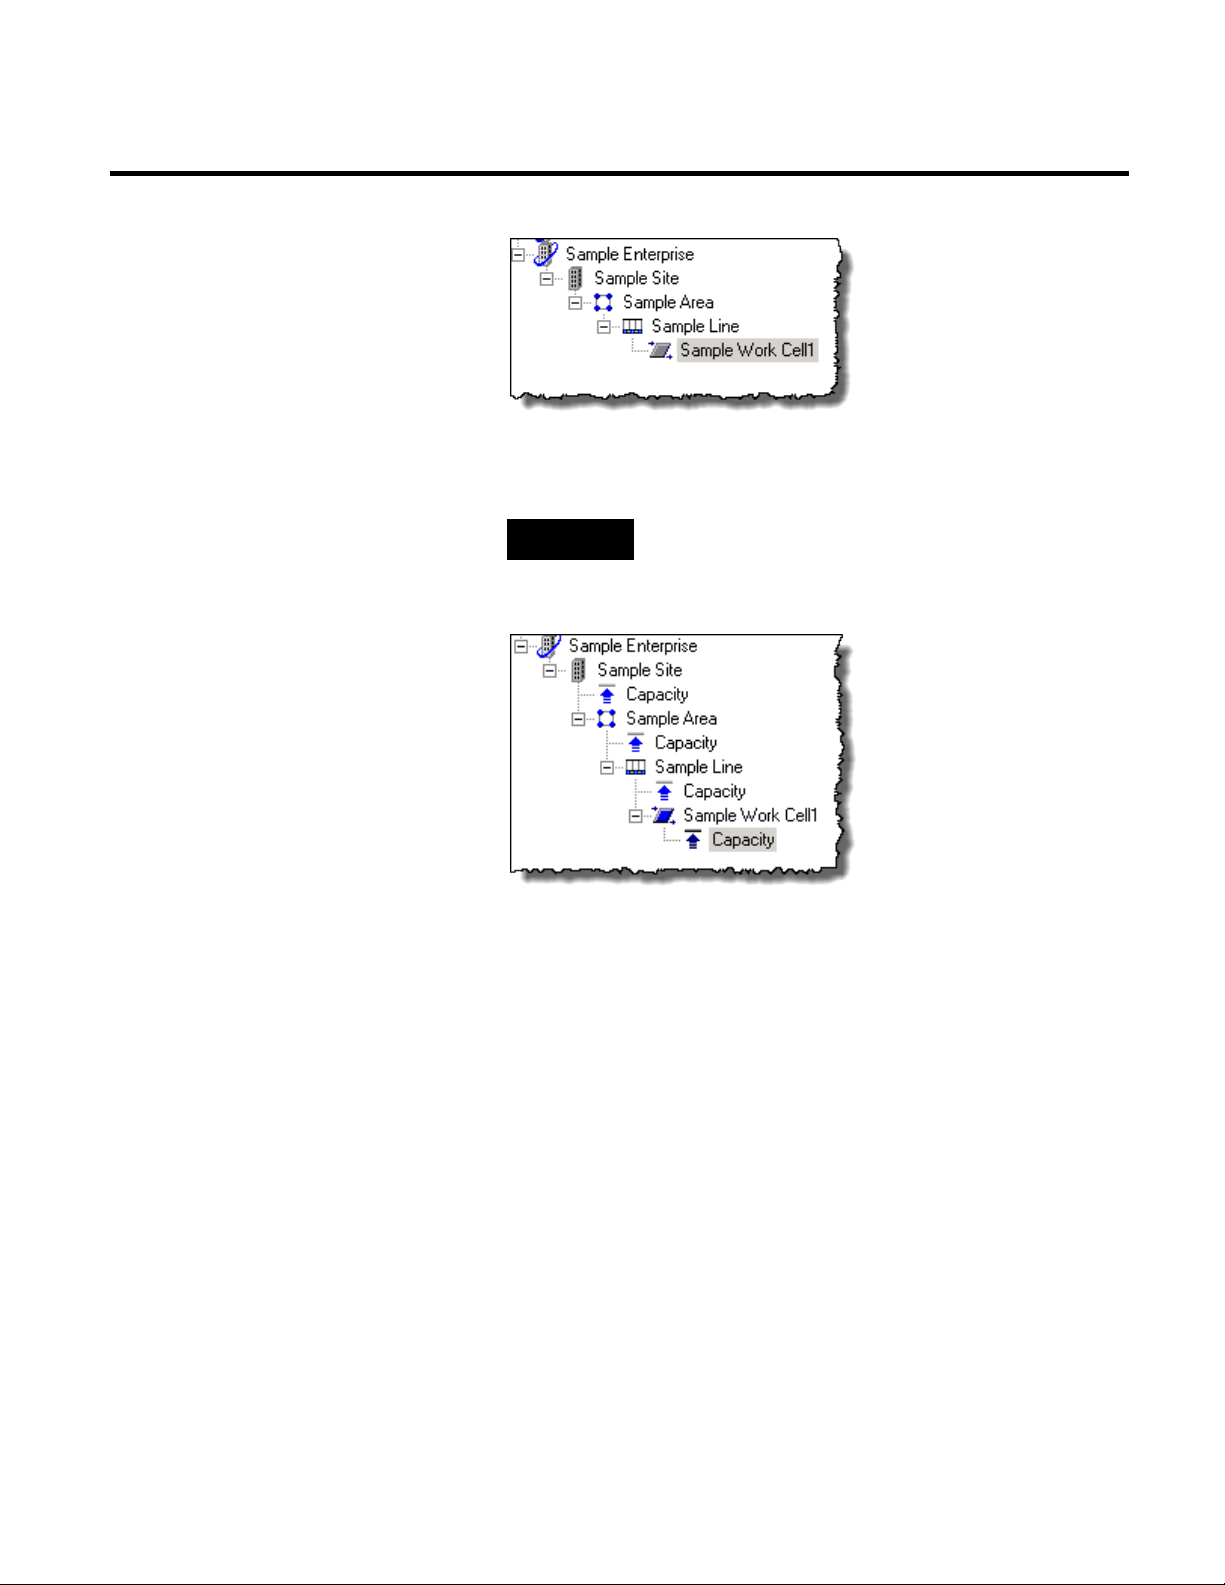
4. Right-click Sample Enterprise, and then click New Activity
Area > Site.
A new site is added to the tree.
5. Change the default name to
Sample Site.
6. Right-click Sample Site, and then click New Activity Area >
Area.
A new area is added to the tree.
7. Change the default name to
Sample Area.
8. Right-click Sample Area, and then click New Activity Area >
Line.
A new line is added to the tree.
9. Change the default name to
Sample Line.
10. Right-click Sample Line, and then click New Activity Area >
Work Cell.
A new workcell is added to the tree.
11. Change the default name to
Rockwell Automation Publication HIST-UM001K-EN-E-June 2014 21
Sample Work Cell 1.
Page 22
Chapter 3 Collecting FactoryTalk Historian Classic Data
them with time patterns.
Configure Time-Series Data Collection
12. Right-click each activity area that you have created, and then
click Add Capacity.
TIP
The capacity of an activity area describes its availability over
time.
Add capacity for your activity areas so that you can associate
13. Click OK.
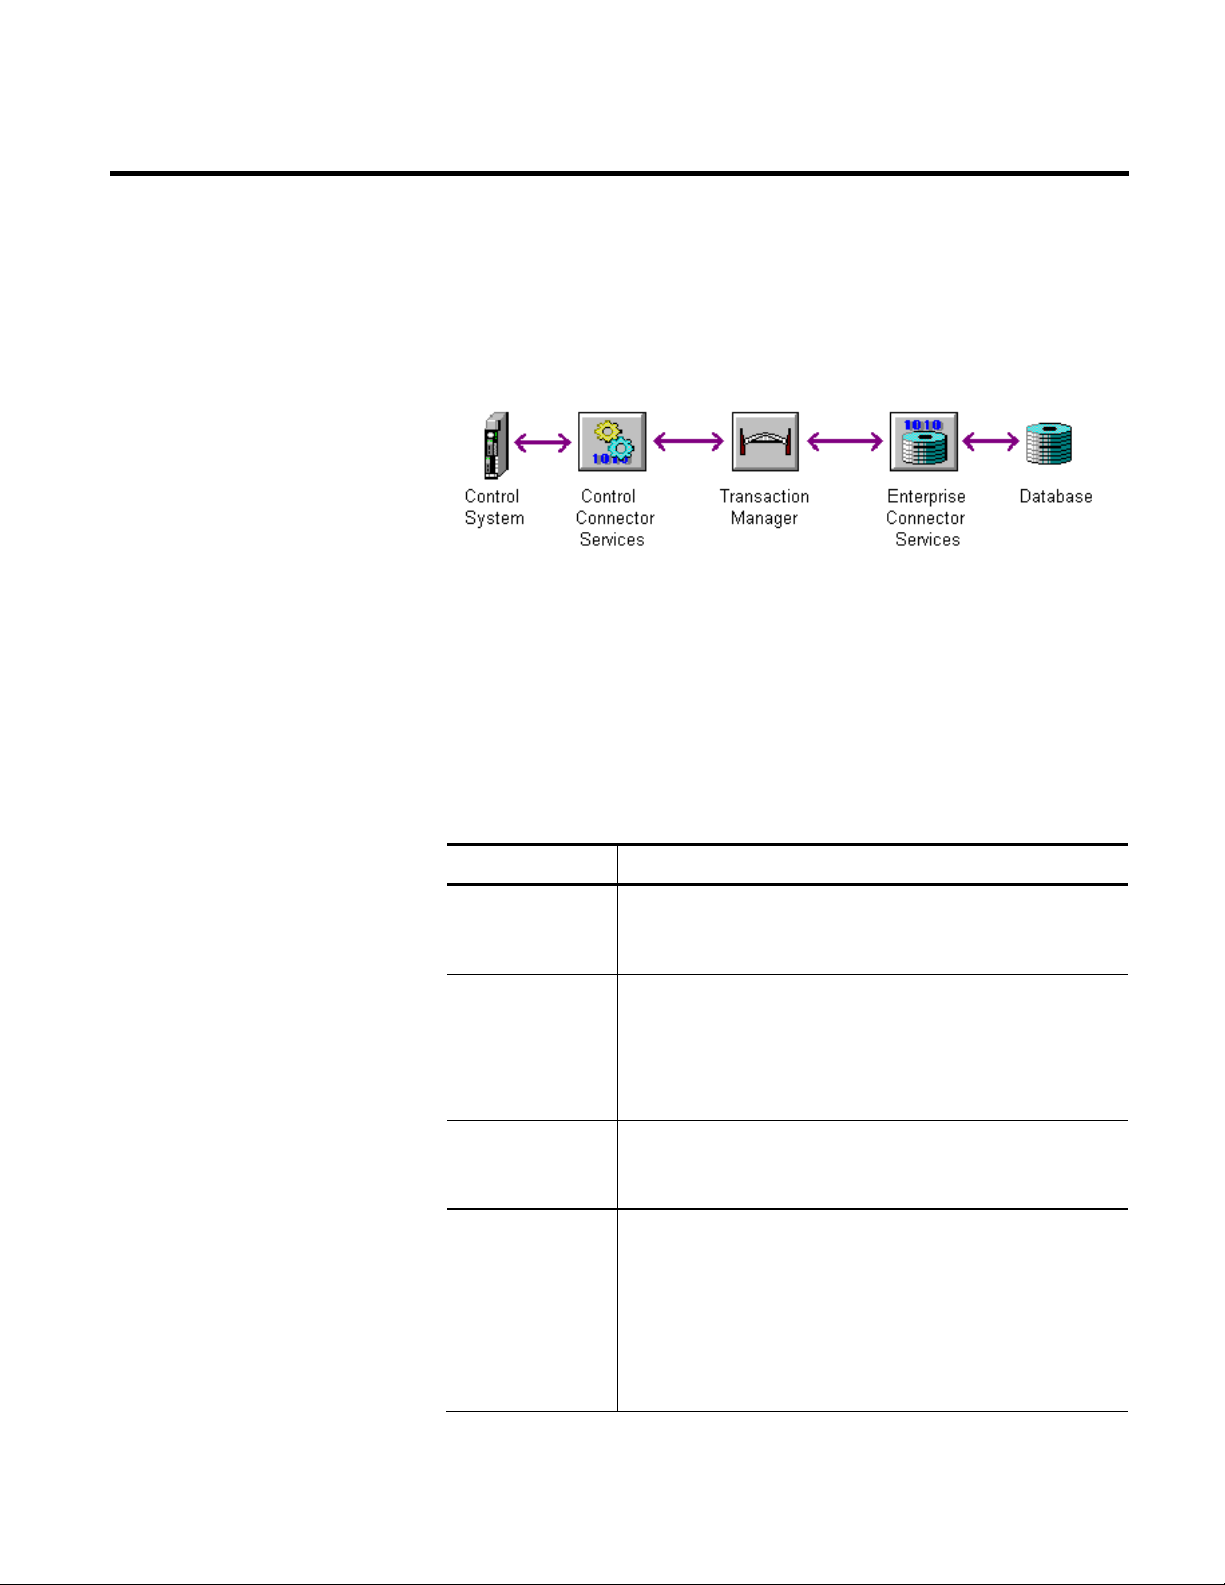
FactoryTalk Historian Classic uses FactoryTalk Transaction
Manager to collect data from the control system and log it into the
RSBizWare database. A FactoryTalk Transaction Manager
configuration connects any control system from which data will be
collected to the predefined data model used by the RSBizWare
database to store time-series data. The configuration consists of
transactions and the connectors, data points, and data objects
required to implement the transactions.
22 Rockwell Automation Publication HIST-UM001K-EN-E-June 2014
A transaction is a single exchange of data between the industrial
control system - typically a network of programmable logic
controllers (PLCs) - and a database. An example of a transaction is a
temperature value that is collected from a data point on a
programmable logic controller and logged to a database table.
Page 23
Collecting FactoryTalk Historian Classic Data Chapter 3
supported by the OPC specification.
with ControlLogix 555x processors.
specifications.
online edits with your configuration.
Types of control connectors for the data collection
A data point is a specific data location or register in the control
system that is made available to FactoryTalk Transaction Manager
transactions. After it is defined, a data point can be used by any
FactoryTalk Transaction Manager transaction.
The FactoryTalk Transaction Manager interfaces with the industrial
control system device via a control connector. A control connector is
a Windows service that collects data from a data server, such as a
PLC and sends it to the FactoryTalk Transaction Manager.
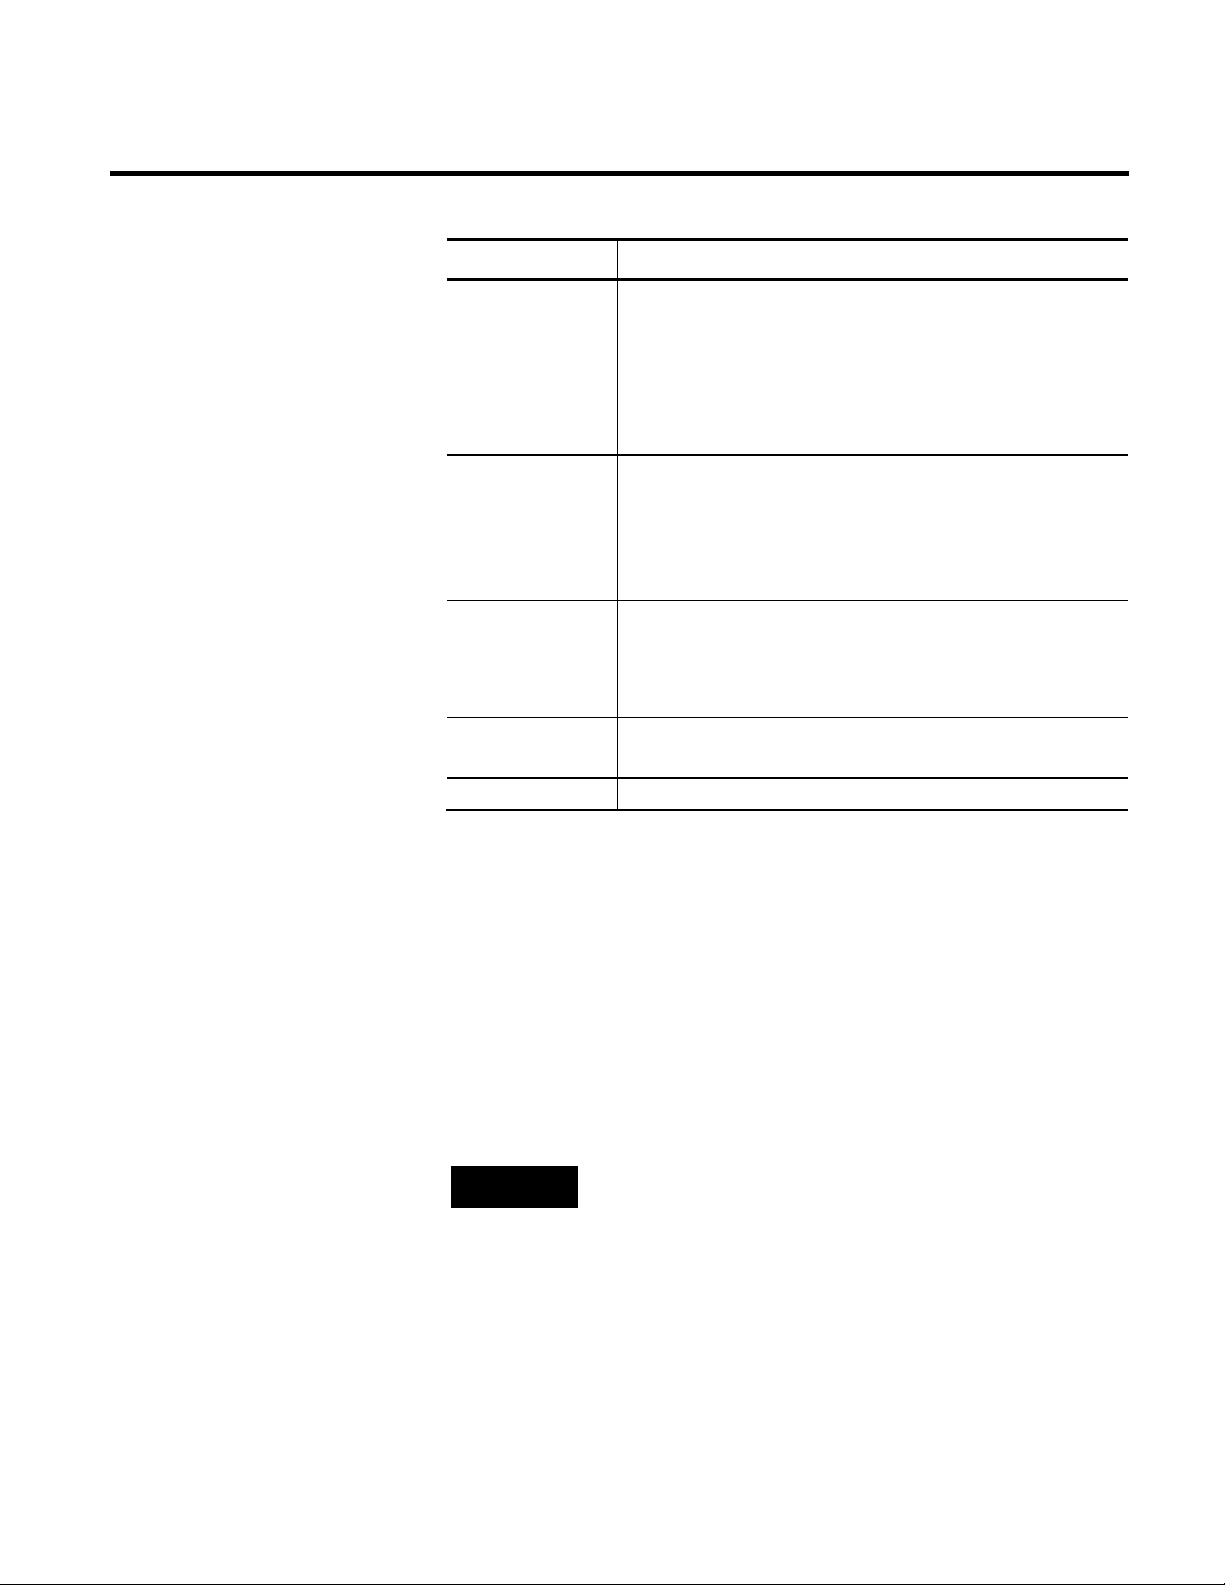
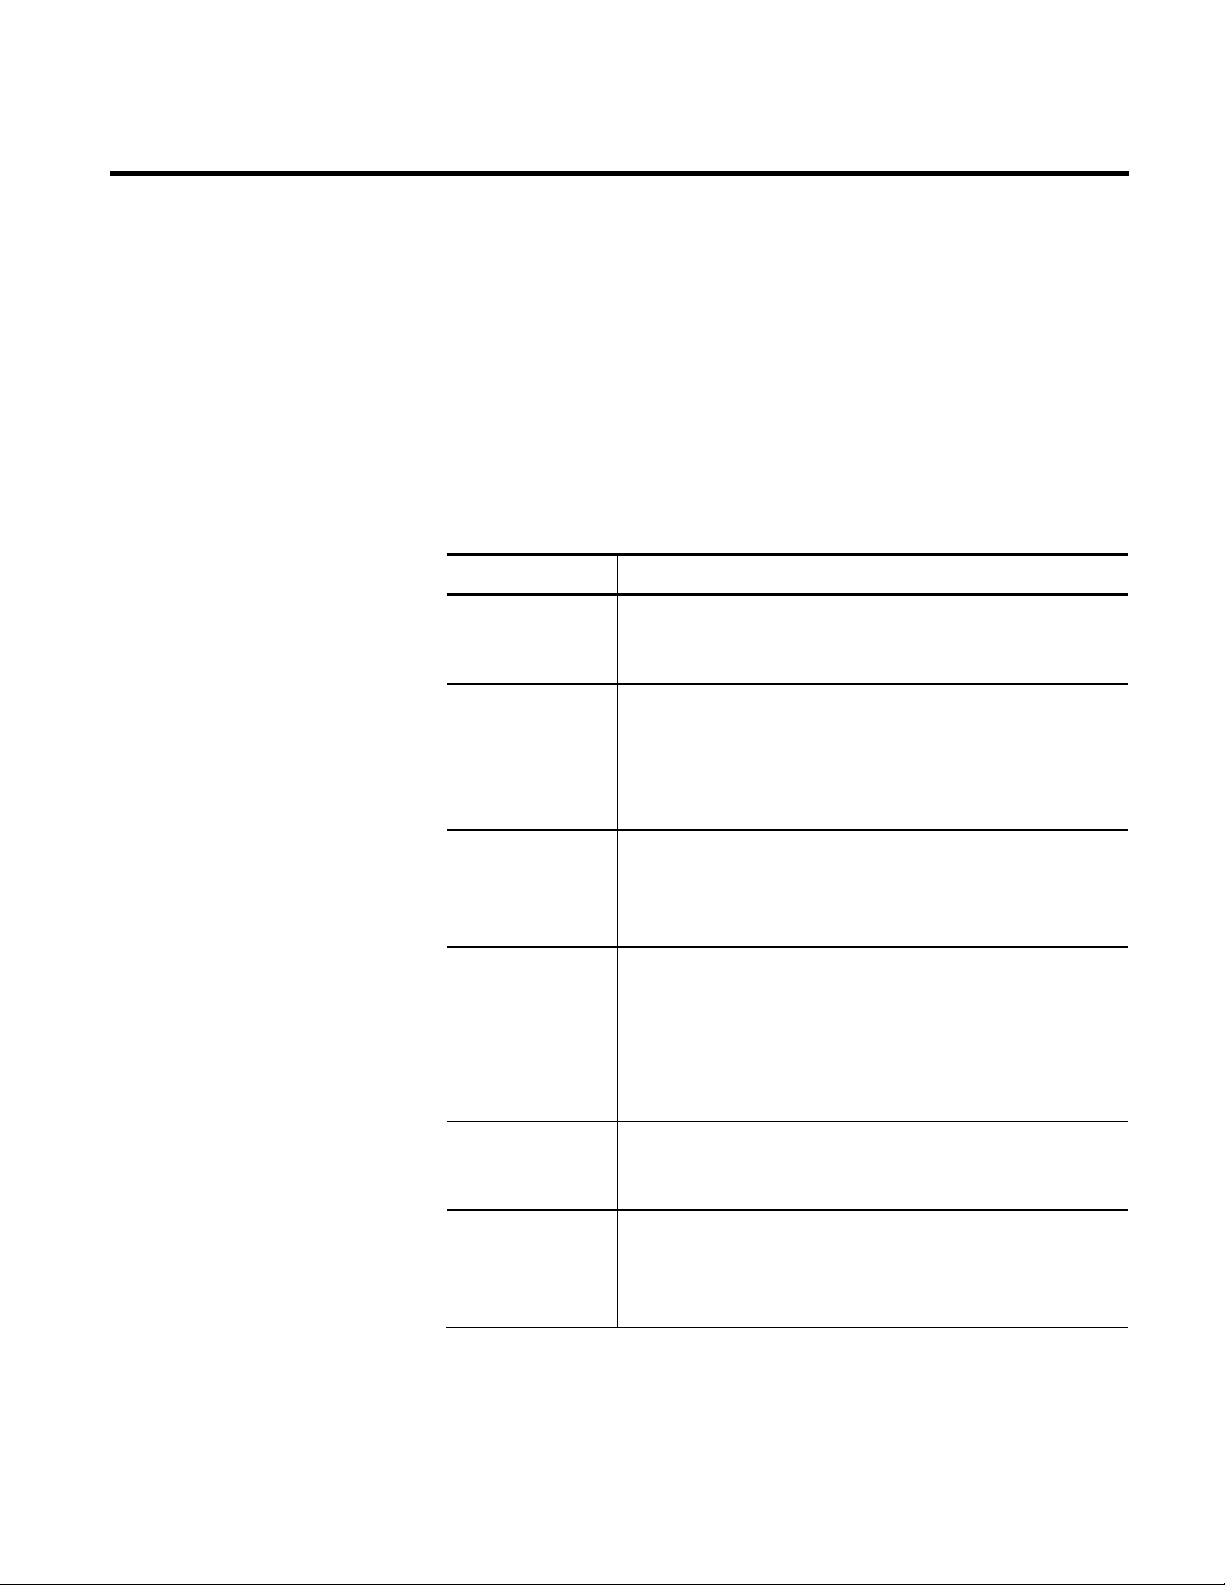
You can use the following types of control connectors:
Item Description
Dynamic Data
Exchange (DDE)
RSLinx Classic OPC The RSLinx Classic control connector service is the preferred method
Generic OPC The Generic OPC control connector service is used to interface with
FactoryTalk LiveData
Connector
The DDE control connector service is provided for legacy
connections to DDE servers or to provide functionality that is not
to use when browsing for data tags that reside in Allen-Bradley
Programmable Logic Controllers, except for ControlLogix 555x
processor items. You should use Generic OPC control connectors
items provided by any OPC server that conforms to OPC interface
FactoryTalk Transaction Manager uses FactoryTalk Live Data to
communicate with FactoryTalk Live Data servers, such as RSLinx
Classic and RSView Supervisory Edition. FactoryTalk Transaction
Manager connects to the FactoryTalk Directory, which allows
FactoryTalk Transaction Manager to browse the available data
items. This control connector is required if you plan to perform
Rockwell Automation Publication HIST-UM001K-EN-E-June 2014 23
Page 24
Chapter 3 Collecting FactoryTalk Historian Classic Data
The ODBC enterprise database connector allows you to interface
Access, Microsoft SQL Server 6.5 or later, IBM DB2 or Sybase.
to an Oracle database versions 9i through 11g.
name (DSN) and is the preferred method of connection.
Professional installations.
RSBizWare database.
Transaction Manager Professional installations.
Enterprise Connectors
The FactoryTalk Transaction Manager interfaces with the database
via an enterprise connector. An enterprise connector is a Windows
service that receives data from the FactoryTalk Transaction
Manager and logs it to a database.
The following are the types of enterprise connectors that you can
use:
Item Description
ODBC
with virtually any ODBC-compliant database including Microsoft
Oracle OCI
Microsoft OLE DB
Microsoft COM+
FactoryTalk
Metrics
SAP
The Oracle Call Interface (OCI) enterprise database connector allows
you to connect to database objects from an Oracle server. If you are
using Oracle OCI, you need to install locally SQL*NET 2.3x or later,
Net8, or Oracle Net services (all from Oracle). You can then connect
The Microsoft OLE DB enterprise database connector should only be
used for interfacing with Microsoft SQL Server. Microsoft OLE DB
allows you to browse an SQL Server database without a data source
The Microsoft COM+ enterprise application connector allows you to
interface with Microsoft COM+ application components. These
components must be integrated into a Windows 2000 COM+
environment. RSBizWare-only applications do not support this
connector. It is for use only with FactoryTalk Transaction Manager
The FactoryTalk Metrics enterprise application connector is used
only with FactoryTalk Metrics. The connector stores data in the
The SAP enterprise application connector allows you to interface
with SAP R/3 systems modules. RSBizWare-only applications do not
support this connector. It is for use only with FactoryTalk
24 Rockwell Automation Publication HIST-UM001K-EN-E-June 2014
Page 25

Compression".
administrator.
Tutorial
Step 1: Start the Time-Series Data Collection Wizard
Step 2: Select the Source and Destination of the Time-Series Data
Item Description
Collecting FactoryTalk Historian Classic Data Chapter 3
Time-series Data
Compression
This connector stores time-series data in a pre-defined compressed
format in either an Oracle database or a Microsoft SQL Server
database. The compressed data point records contain binary data
that can only be viewed through FactoryTalk Historian Classic. For a
detailed description of data compression and the Compression
connector, see the Administration Guide, section "Data
This tutorial will help you understand how to use the Time-Series
Data Collection Wizard to collect reporting tag data. A reporting
tag is a particular item of collected time-series data—independent of
the method or source of collection—that can be charted in
RSBizWare reports.
For this tutorial, we will be using the Time-Series Data Collection
Wizard to configure FactoryTalk Transaction Manager transactions
that will collect values from the control system and log the values to
a reporting tag in the RSBizWare database.
Rockwell Automation Publication HIST-UM001K-EN-E-June 2014 25
NOTE
To configure time-series data collection, you must be granted a
FactoryTalk Historian Classic Author license by your RSBizWare
From the Configuration Console menu, select Configure >
FactoryTalk Historian Classic >Time-Series Data Collection to
display the Time-Series Data Collection Wizard welcome screen.
Click Next on the Welcome dialog box.
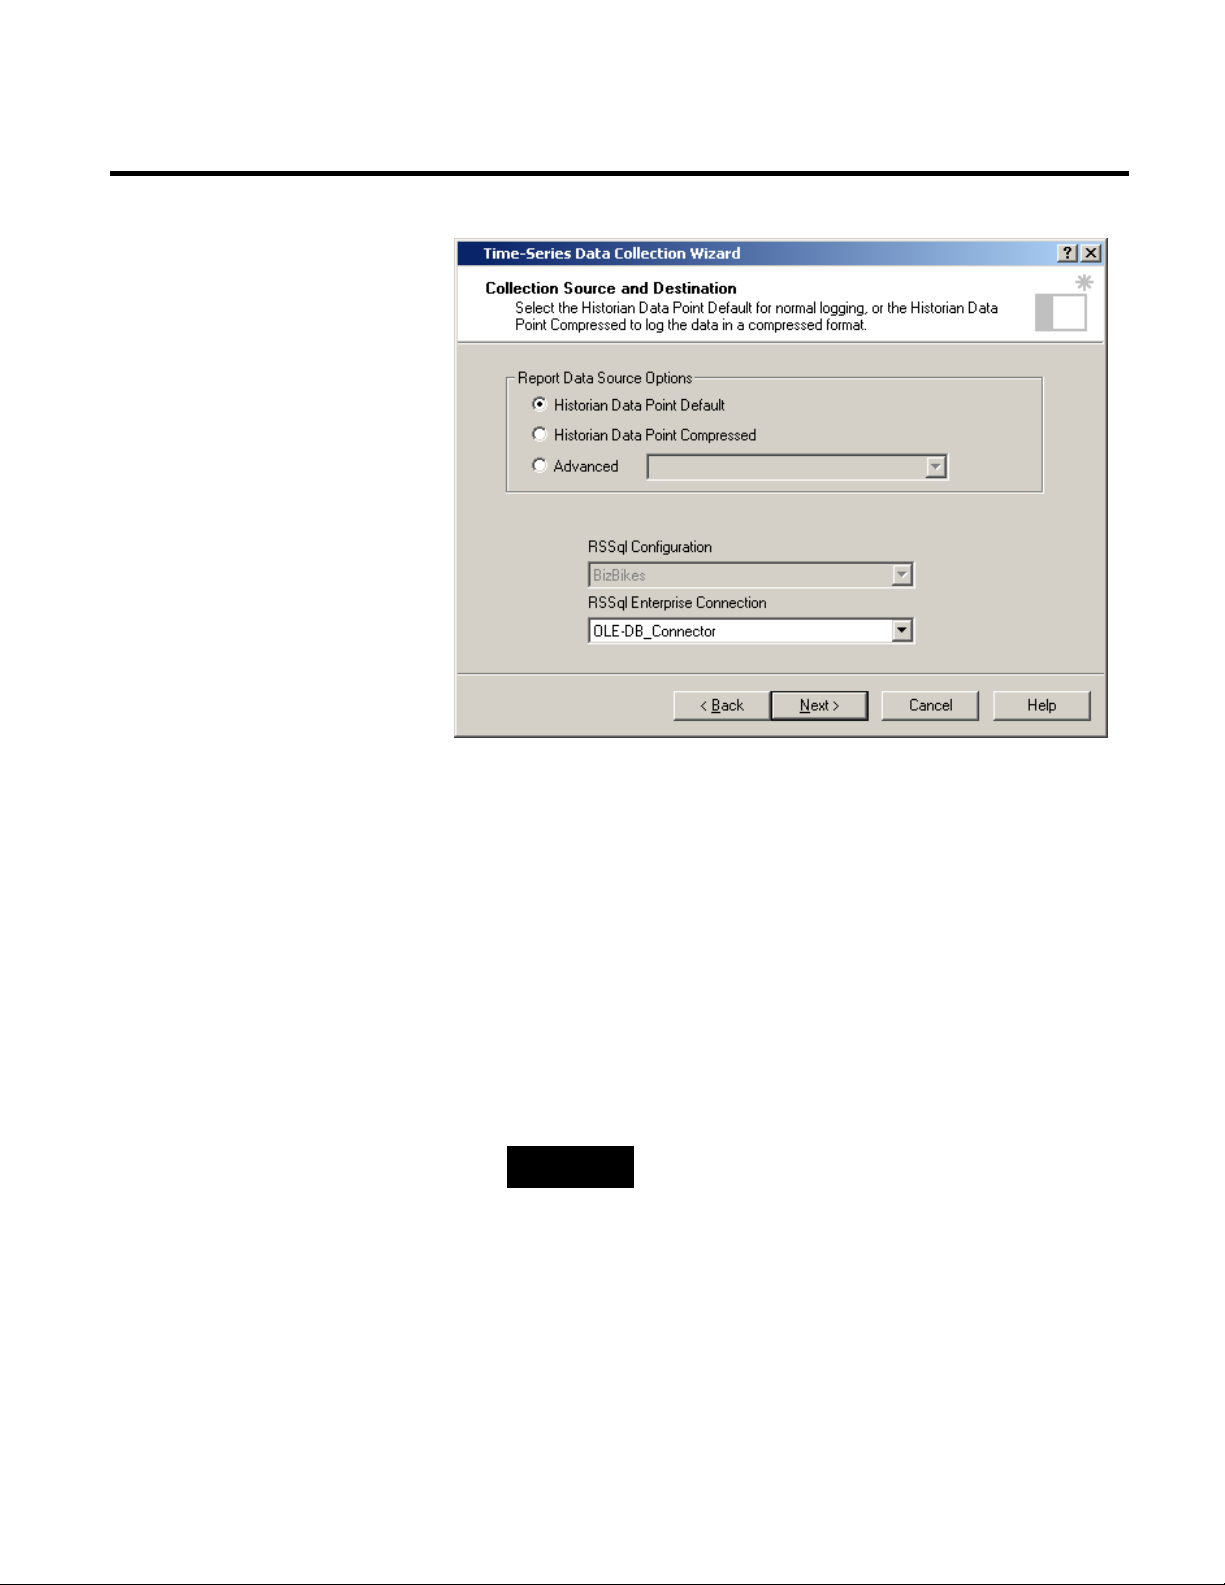
The Collection Source and Destination dialog box, which allows
you to specify where the time-series data will be collected from and
where it will be stored in the RSBizWare database, will display.
Page 26
Chapter 3 Collecting FactoryTalk Historian Classic Data
sources, refer to "Analyzing Non-RSBizWare Data (page 110)".
1. The report data source is the database table or view where the
data will be stored. FactoryTalk Historian Classic is capable of
logging data to the FactoryTalk Historian Classic Data Point
Default report data source (the RSDataPointSample table in
the RSBizWare database), the FactoryTalk Historian Classic
Data Point Compressed report data source (the
RSSQL_CMPCOMPRESS table in the RSBizWare
database), or to any other database table or view that your
organization identifies as supporting the required time-series
data model (Advanced option). For this tutorial, accept the
default Historian Data Point Default option.
TIP
For more information about creating additional report data
2. Now you must specify the FactoryTalk Transaction Manager
configuration that will be used to support data collection. The
FactoryTalk Transaction Manager Configuration list contains
the configurations that have been associated with FactoryTalk
Historian Classic for the server to which you are connected. If
we had selected a compression report data source in the
previous step, only FactoryTalk Transaction Manager
26 Rockwell Automation Publication HIST-UM001K-EN-E-June 2014
Page 27

Collecting FactoryTalk Historian Classic Data Chapter 3
Edits” topic in the online help.
Step 3: Create or Select Data Points
configurations that had Compression Enterprise Connections
would be available here. Since we selected a non-compression
report data source, any FactoryTalk Transaction Manager
configurations that have non-compression (OLE DB, OCI, or
ODBC) enterprise connectors will be available.
3. The Enterprise Connector is the service that will manage the
connection between the FactoryTalk Transaction Manager
configuration and the database. The FactoryTalk Transaction
Manager Enterprise Connection list contains the enterprise
connectors that are available from the configuration that you
selected. From the Enterprise Connection list, select the
OLE-DB_Connector.
4. Click Next to continue.
If the FactoryTalk Transaction Manager configuration is
already running and is enabled for online edits, you can edit
the configuration without stopping it. However, if the
configuration is running and is not enabled for online edits,
the wizard will prompt you to stop the configuration. If you do
not stop the configuration, the Time- Series Data Collection
Wizard cannot make changes to the configuration, and the
wizard will close automatically.
Rockwell Automation Publication HIST-UM001K-EN-E-June 2014 27
NOTE
The FactoryTalk Transaction Manager Live Data Migration Tool
allows you to convert configurations with non-FactoryTalk data
points into FactoryTalk data points. For additional information
about editing a running configuration and using the FactoryTalk
Transaction Manager Live Data Migration Tool, see the “Online
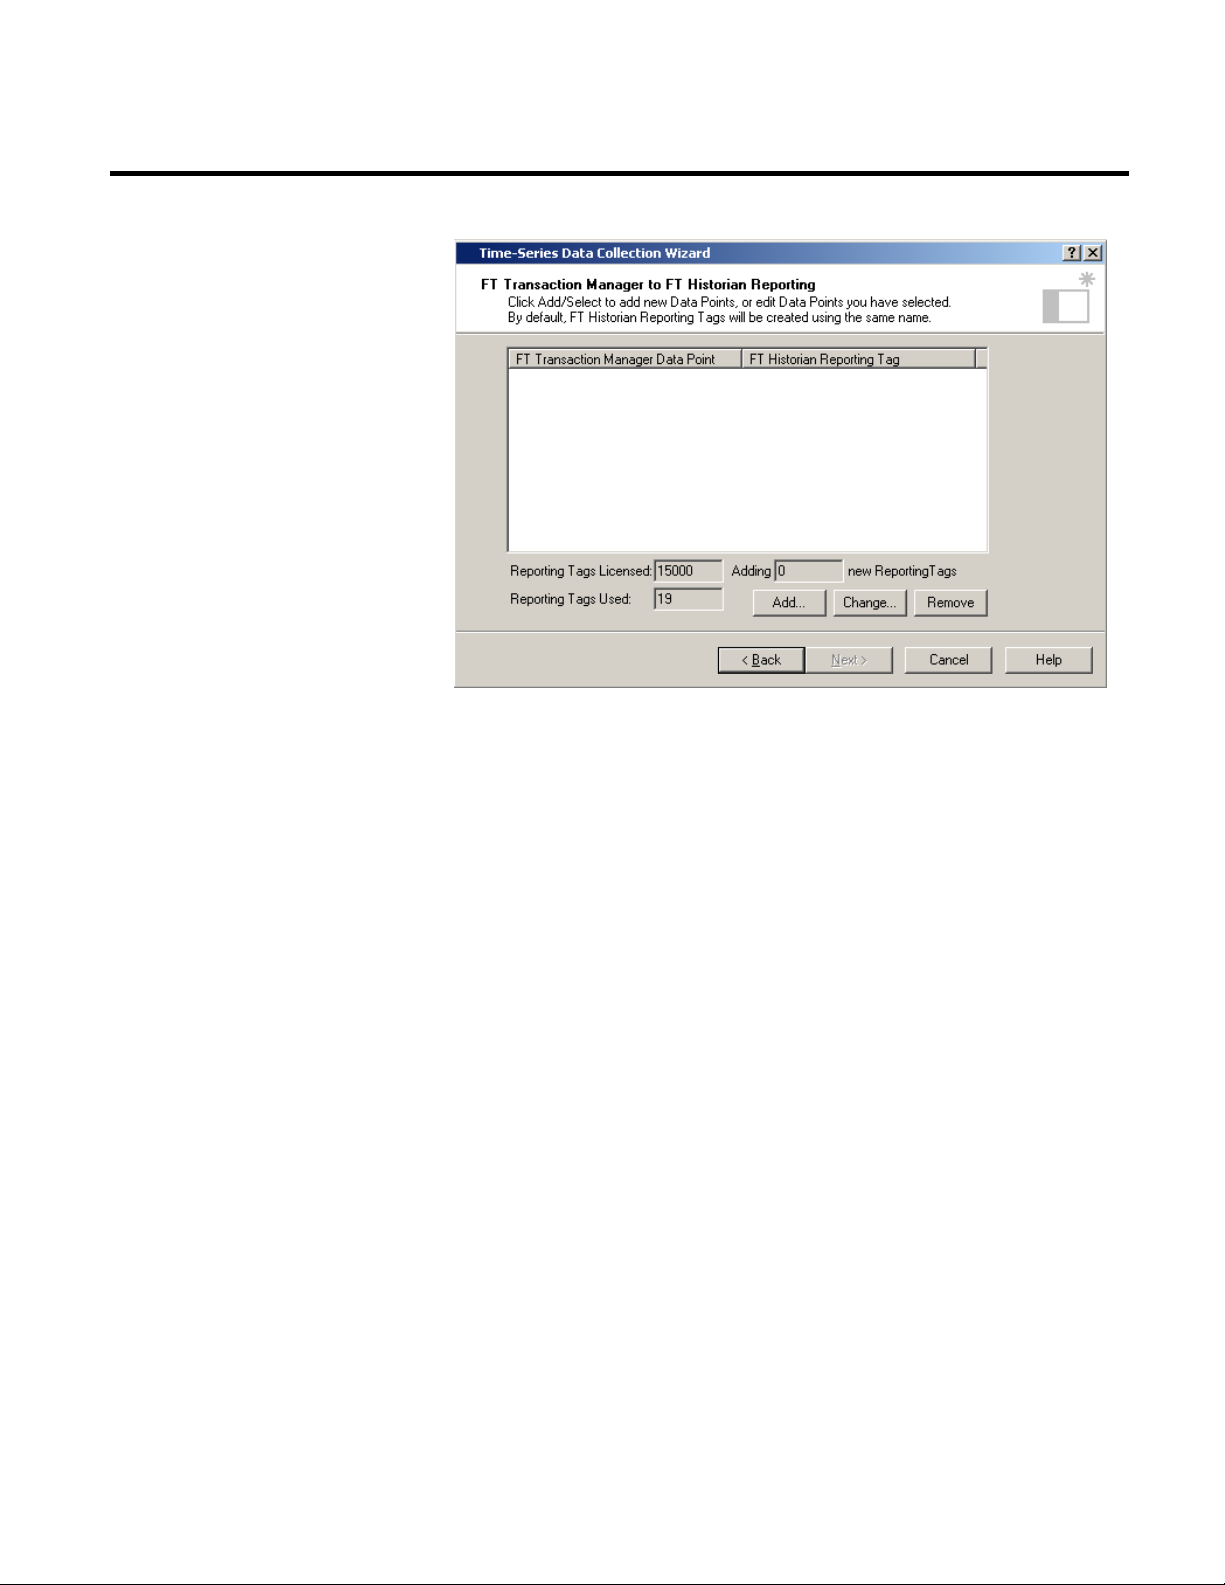
Next you’ll see the FactoryTalk Transaction Manager to
FactoryTalk Historian Classic Reporting dialog. This dialog enables
you to select the FactoryTalk Transaction Manager data points from
which FactoryTalk Historian Classic will be collecting data and
enables you to specify the FactoryTalk Historian Classic reporting
tags to which the data will be logged.
Page 28
Chapter 3 Collecting FactoryTalk Historian Classic Data
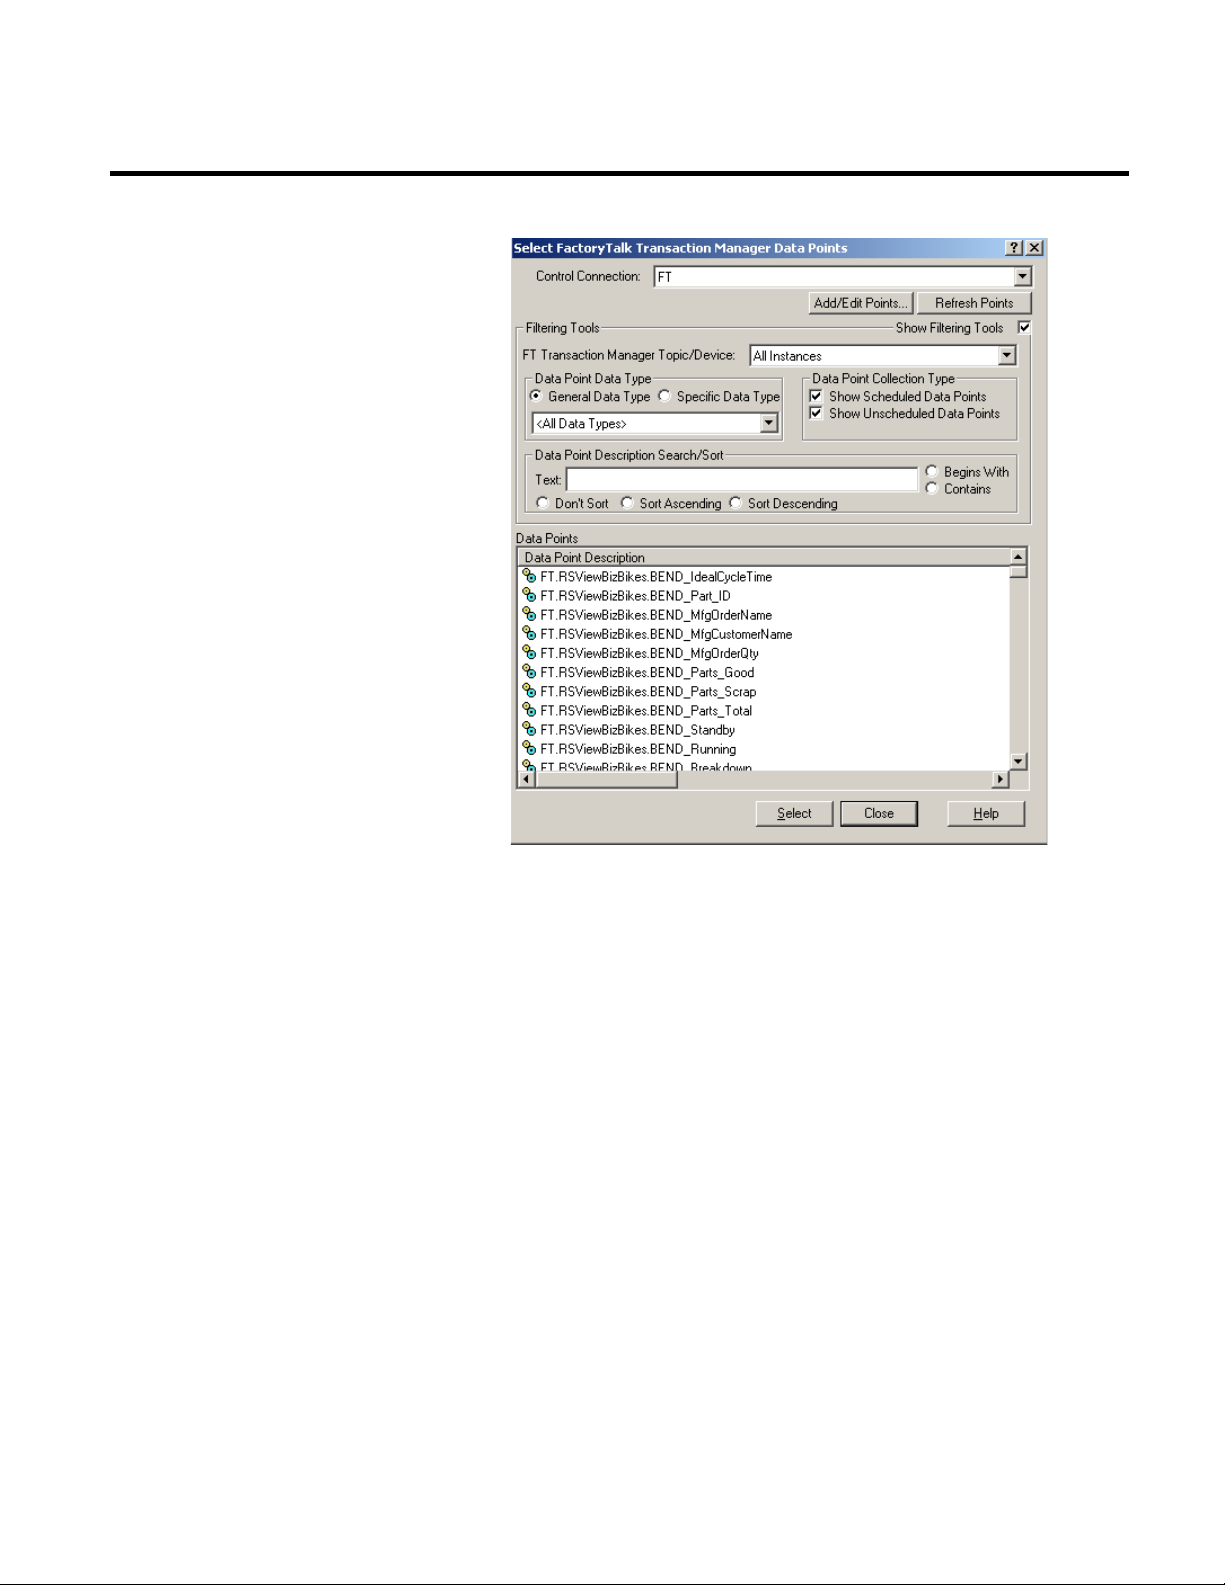
1. To select the data points from which data will be collected,
click the Add button. The Select FactoryTalk Transaction
Manager Data Points dialog that is displayed lists the data
points that exist in the FactoryTalk Transaction Manager
configuration. The top of the dialog is simply a set of tools that
you can use to filter the data point list.
28 Rockwell Automation Publication HIST-UM001K-EN-E-June 2014
Page 29
Collecting FactoryTalk Historian Classic Data Chapter 3
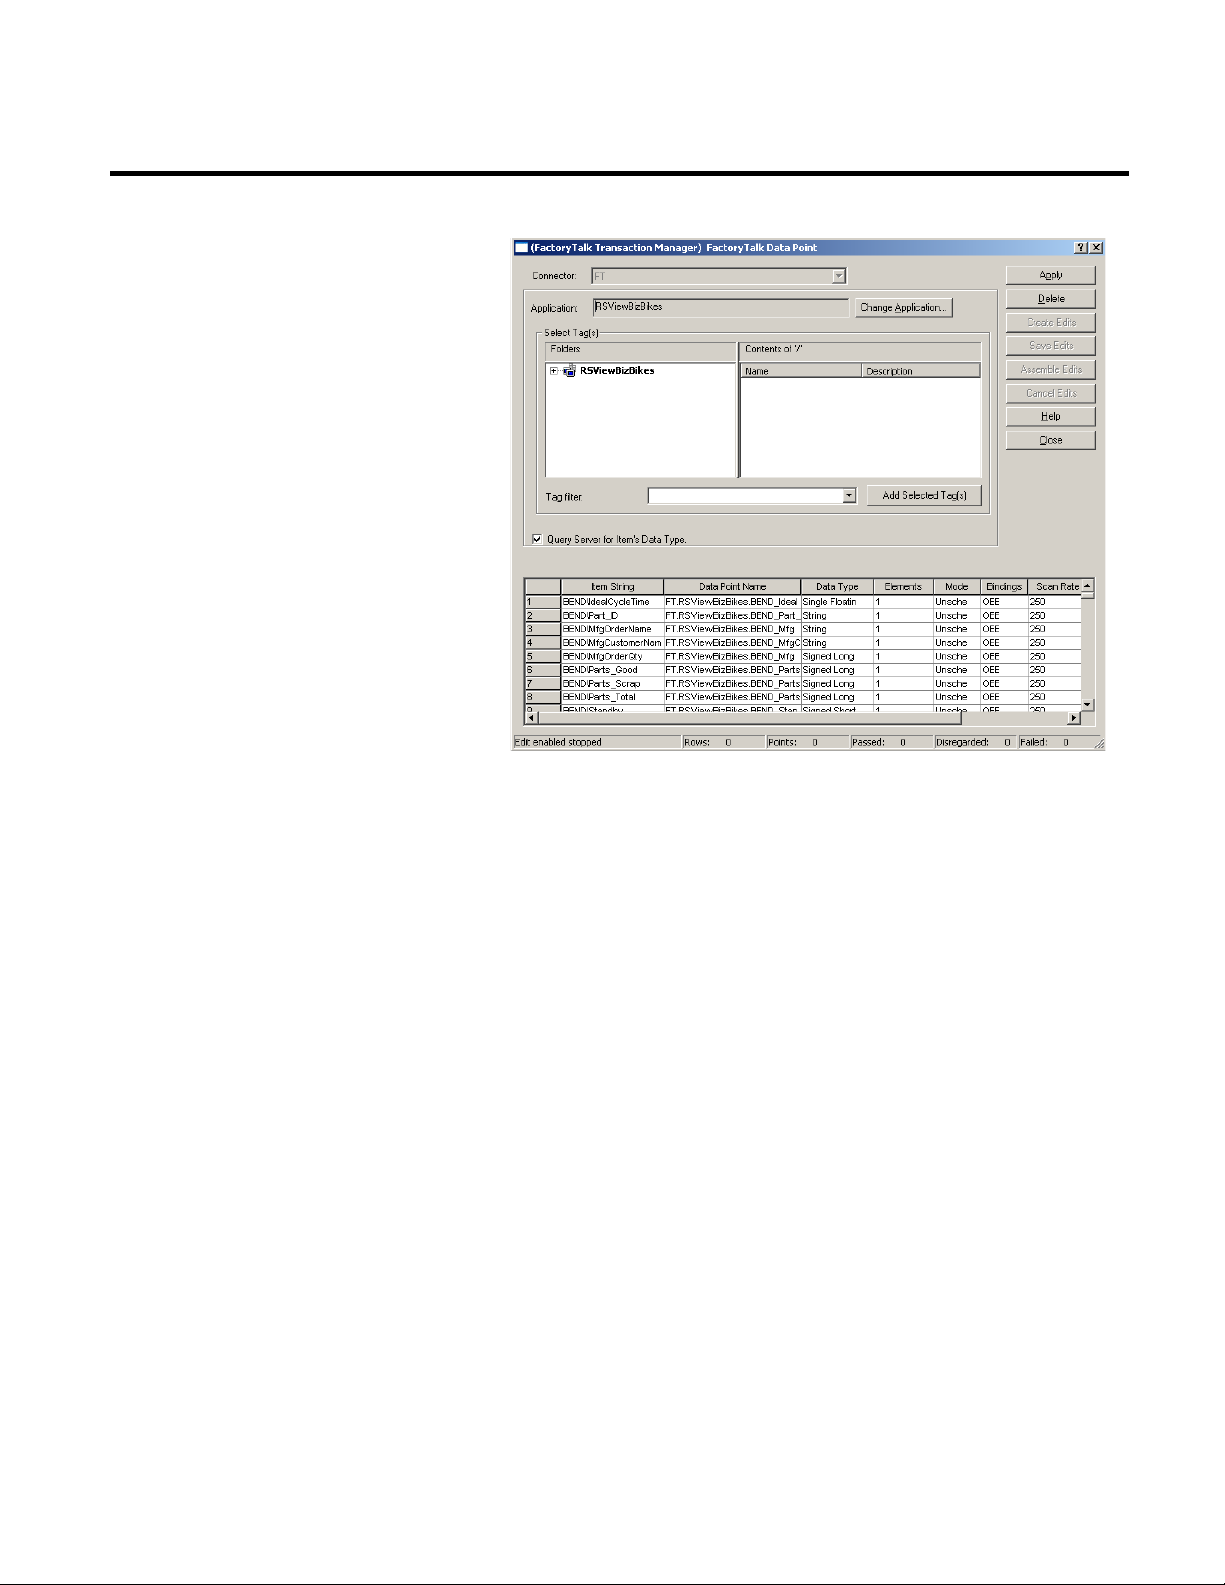
2. To add new data points to the FactoryTalk Transaction
Manager configuration, click the Add/Edit Points button to
display the (FactoryTalk Transaction Manager) FactoryTalk
Data Point dialog box.
Rockwell Automation Publication HIST-UM001K-EN-E-June 2014 29
Page 30
Chapter 3 Collecting FactoryTalk Historian Classic Data
This dialog may look different depending on the type of
control connector that you selected. This dialog allows you to
add data points to the Control Connector and set their
properties.
3. If you were creating new tags from a running FactoryTalk
Transaction Manager configuration, you would select them by
selecting a category of tags from the Folders tree, selecting the
actual tags from the Contents of ‘/” list, clicking the Add
Selected Tag(s) button, and clicking the Apply button. For
now, click Close to exit the dialog and return to the Select
FactoryTalk Transaction Manager Data Points dialog.
4. Highlight the data points for which you want to collect data.
For this tutorial, select the BEND_Breakdown data point
(unscheduled) and the BEND_BreakdownCode data point
(scheduled). Click Select to return to the From FactoryTalk
Transaction Manager to FactoryTalk Historian Classic
Reporting Tags step of the Time-Series Data Collection
Wizard.
30 Rockwell Automation Publication HIST-UM001K-EN-E-June 2014
Page 31

Collecting FactoryTalk Historian Classic Data Chapter 3
Step 4: Configure Collection Parameters
The selected data points have been added to the list of data
points for which you will be creating transactions. Since we are
collecting data from newly selected data points, the
FactoryTalk Historian Classic Reporting Tag column does not
yet contain reporting tag names that will be associated with the
values when they are stored in the database.
5. You can associate each data point with an existing reporting
tag or you can have the application create a new reporting tag
for you. To associate an existing reporting tag with a data
point, you would select the data point from the list and click
the Change button to display the Select FactoryTalk Historian
Classic Reporting Tag dialog. You would then select the
reporting tag with which you want to associate the selected
data point and click OK to close the dialog. This approach is
useful if you have a data point/reporting tag association that
you want to change. For this tutorial, accept the reporting tag
names that the application generates by clicking Next.
The next step in the process is to assign collection parameters to the
selected data points. If you have selected data points that are
configured as scheduled, the FactoryTalk Transaction Manager
Scheduled Transaction dialog box will display. If you have selected
data points that are configured as unscheduled, the FactoryTalk
Rockwell Automation Publication HIST-UM001K-EN-E-June 2014 31
Page 32
Chapter 3 Collecting FactoryTalk Historian Classic Data
Transaction Manager Unscheduled Transaction dialog box will
display. If you have selected both scheduled and unscheduled data
points, the FactoryTalk Transaction Manager Scheduled
Transaction dialog box and the FactoryTalk Transaction Manager
Unscheduled Transaction dialog boxes will both be displayed.
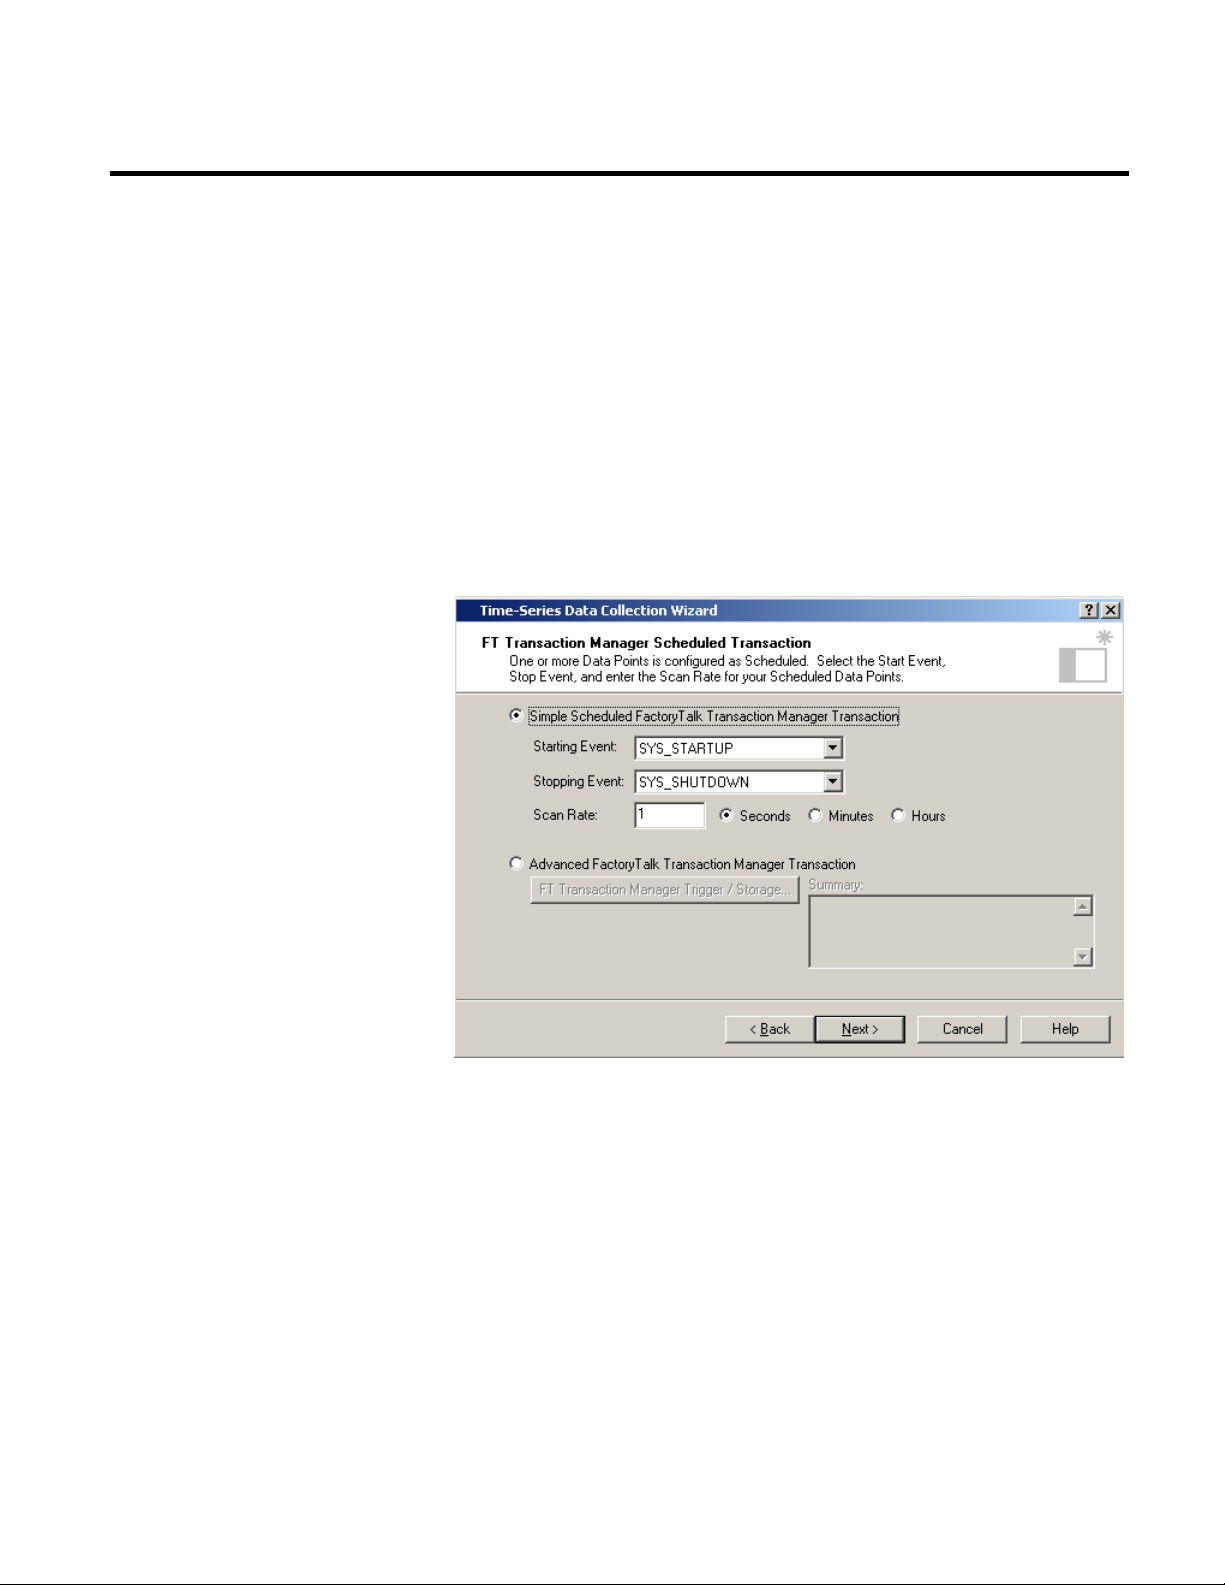
Scheduled transactions. Use the FactoryTalk Transaction Manager
Scheduled Transaction dialog box to indicate how often to poll the
control system and log the data to the RSBizWare database (e.g.,
once every 15 seconds).
1. The Simple Scheduled FactoryTalk Transaction Manager
Transaction option is useful if you want to trigger the
transaction on simple scheduled events such as system start up
or system shut down. If you want to set more sophisticated
triggers for the transaction, select the Advanced FactoryTalk
Transaction Manager Transaction option. For this tutorial,
accept the default Simple Scheduled FactoryTalk Transaction
Manager Transaction option and the default Starting Event
(SYS_STARTUP) and Stopping Event
(SYS_SHUTDOWN).
32 Rockwell Automation Publication HIST-UM001K-EN-E-June 2014
Page 33
Collecting FactoryTalk Historian Classic Data Chapter 3
2. Set the scan rate to 15 seconds. This means we will be
collecting data every 15 seconds between the time the
configuration is started and the time the configuration is
stopped.
3. Click Next to continue.
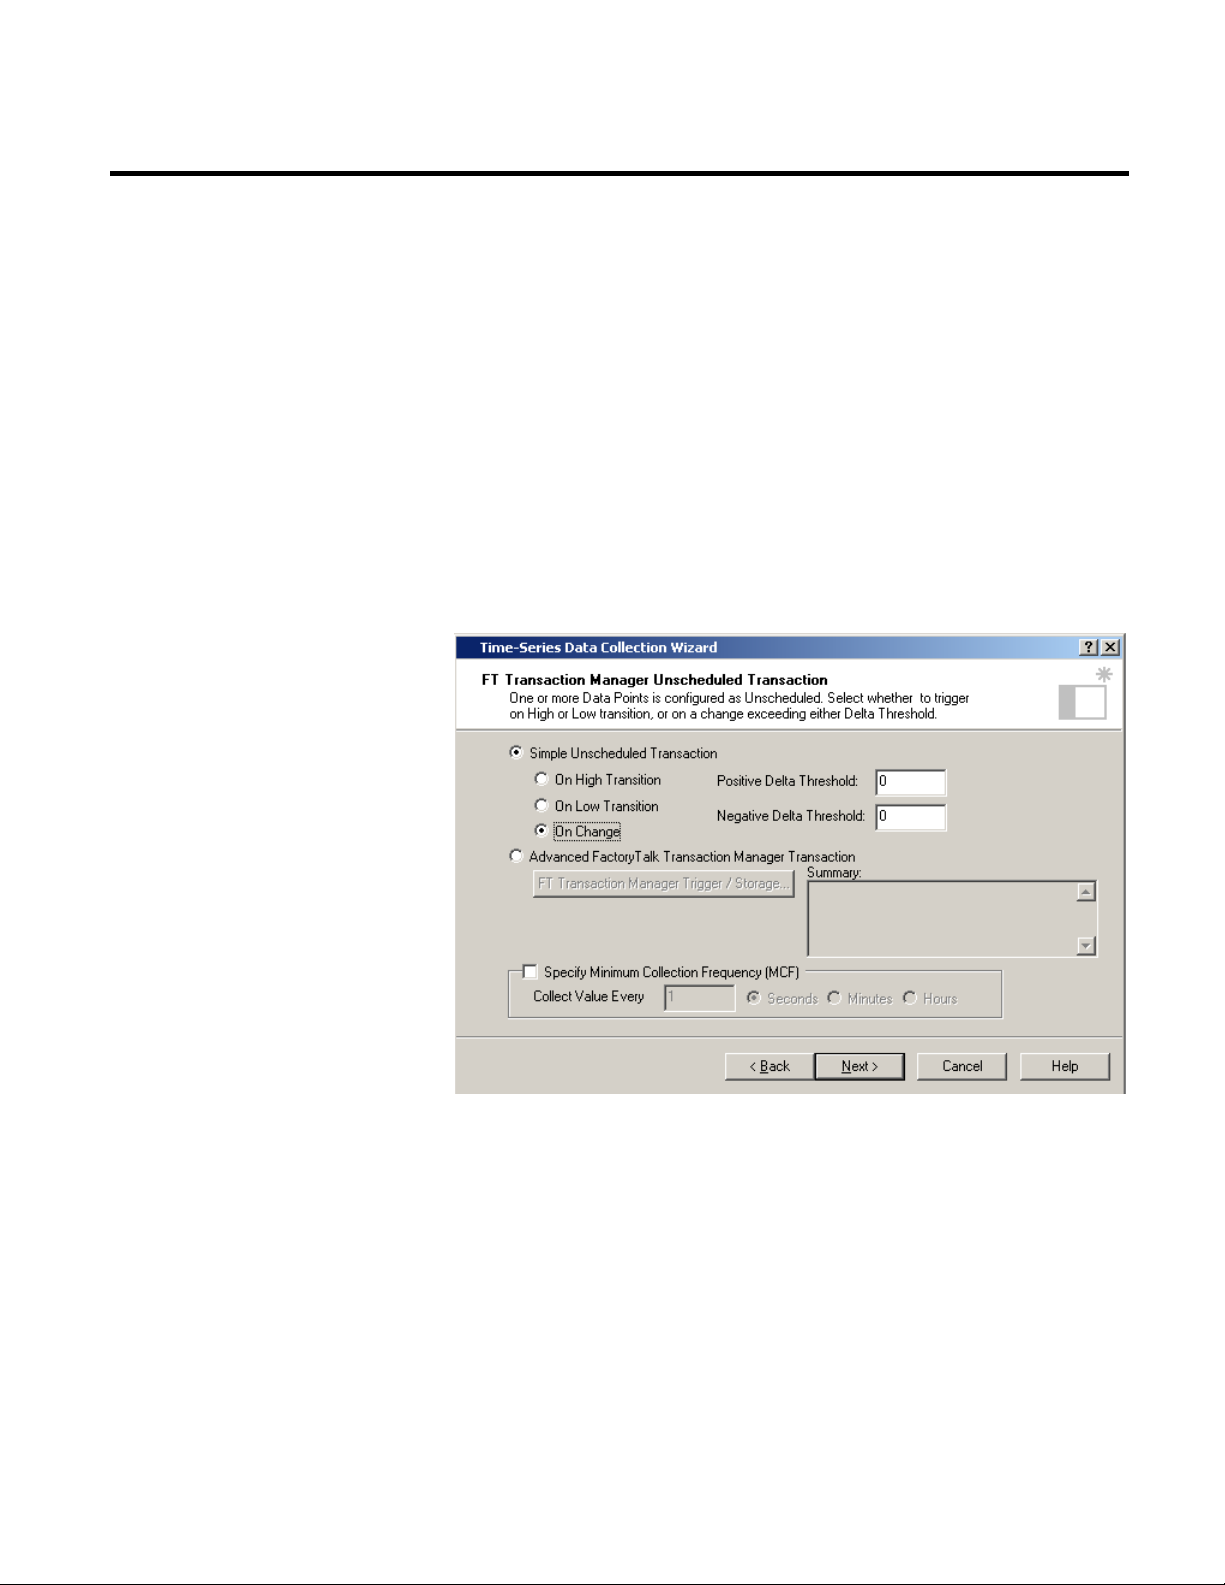
Unscheduled transactions. Unscheduled transactions are triggered
by a change in the value of the data point that is being logged. The
FactoryTalk Transaction Manager Unscheduled Transaction dialog
box allows you to trigger the transaction when the data point value
goes high, low, or on any change in the data point value.
1. For our example, accept the default On Change option. This
option means that any time our data point value changes, a
value will be logged to the database.
2. Select the Specify Minimum Collection Frequency (MCF)
check box to create a scheduled transaction that will be paired
with your unscheduled transaction. The values from both
transactions will be logged to the same field in the database.
The data from the scheduled transaction will create a
“heartbeat” that will allow us to determine that the
Rockwell Automation Publication HIST-UM001K-EN-E-June 2014 33
Page 34
Chapter 3 Collecting FactoryTalk Historian Classic Data
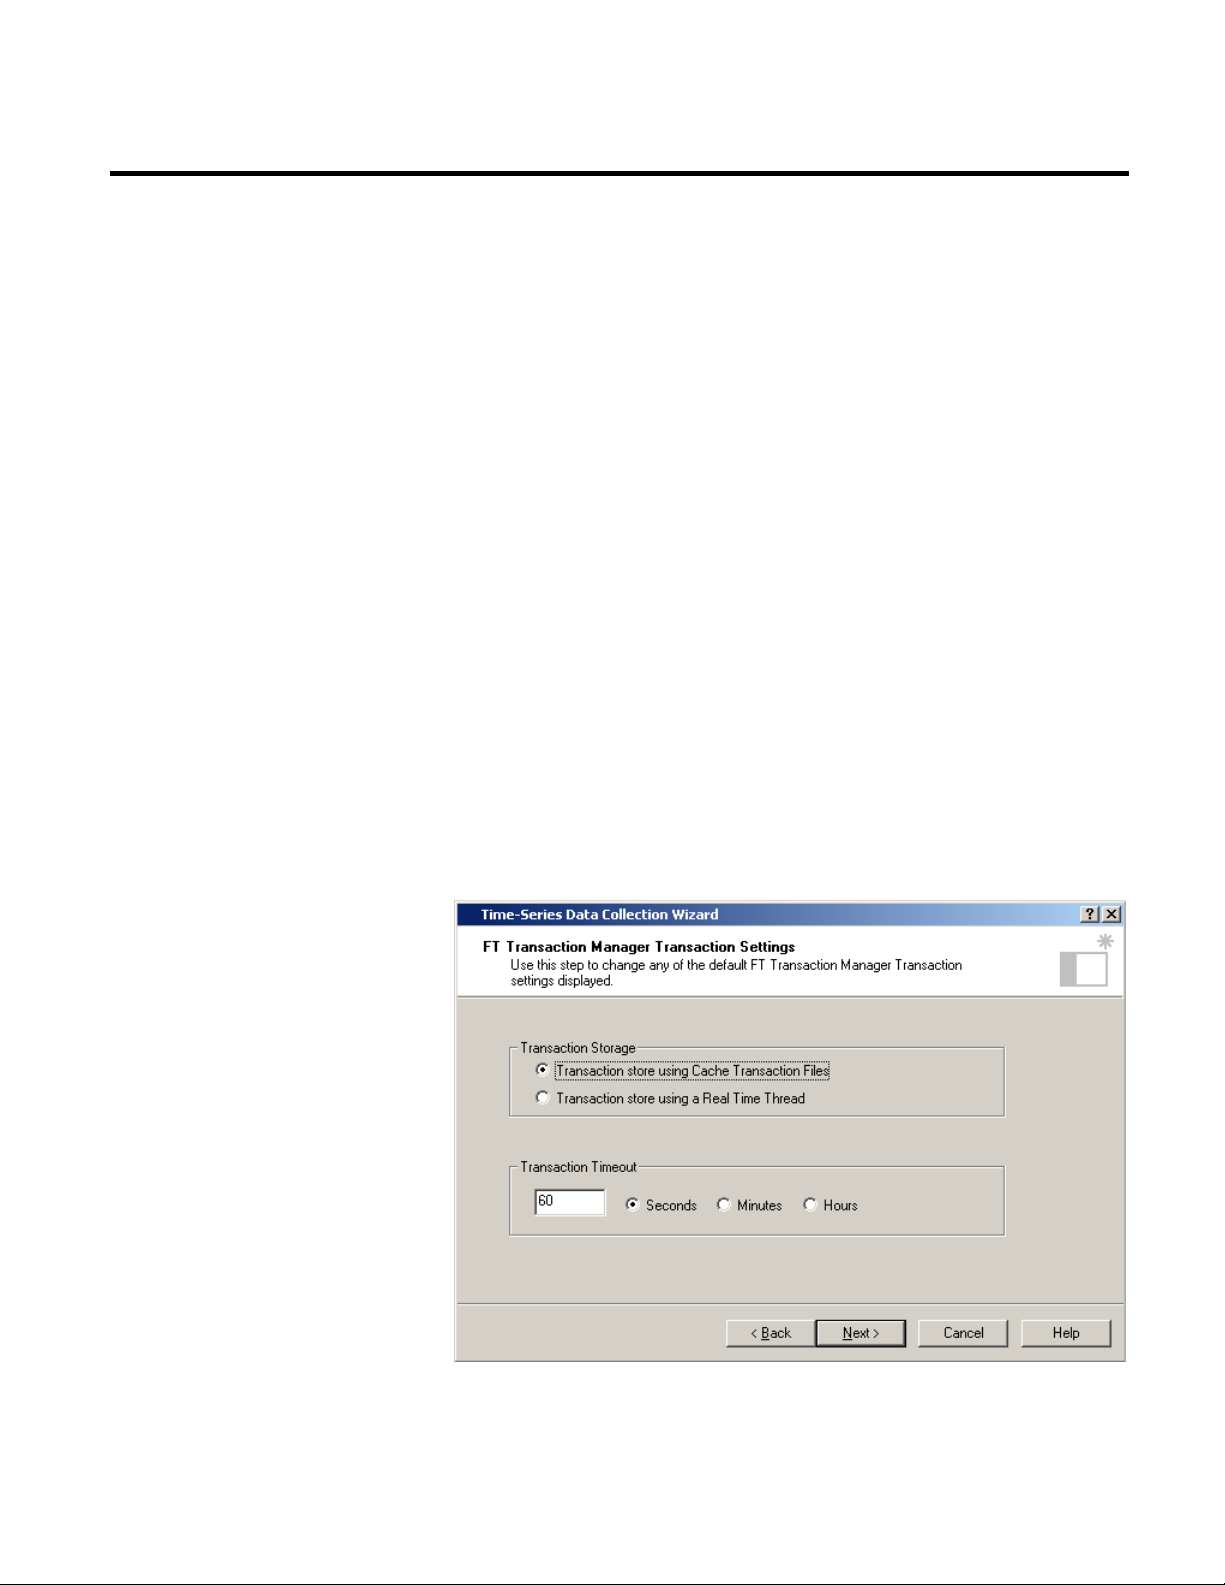
Step 5: Configure Transaction Settings
3. Enter 15 in the Collect Value Every box and accept the default
4. Click Next to continue.
The FactoryTalk Transaction Manager Transaction Settings dialog
box enables you to specify how the transaction data will be stored in
the database and to specify how long FactoryTalk Transaction
Manager will wait for the transaction to complete before logging an
error.
configuration is still running even if our unscheduled
transaction has not been logged for a while. If you do not use a
minimum collection frequency and your unscheduled
transaction has not been logged for a while (this is called a
deadband), it may be difficult to determine if the FactoryTalk
Transaction Manager configuration is still running.
For additional information on setting a minimum collection
frequency, see the “Deadbanding” topic in the online help.
Seconds option. This will cause the application to collect a
“heartbeat” value every 15 seconds.
34 Rockwell Automation Publication HIST-UM001K-EN-E-June 2014
Page 35

Collecting FactoryTalk Historian Classic Data Chapter 3
1. The Transaction Storage options allow you to specify how the
data will be stored to the database.
• Cache Transaction File—The FactoryTalk Transaction
Manager will write data values to a file for a specified period
of time or a specified number of transactions. When the file
reaches the specified limit, the Enterprise Connector reads
and processes the records in the file. The Cache
Transaction File option is most appropriate for transactions
that will be logged very often, such as a Scheduled data
point that will be collected every 10 seconds or less.
• Real Time Thread—The FactoryTalk Transaction
Manager will send a message to the Enterprise Connector
for each transaction as it is processed. The Real Time
• Thread option is most appropriate for transactions that will
not be logged very often; for example, an unscheduled data
point that triggers a transaction when its
• The value changes and where the value of that data point
changes infrequently.
Accept the default Cache Transaction File option.
2. The Transaction Timeout fields allow you to control how long
FactoryTalk Transaction Manager will wait for the transaction
to complete before logging an error. The transaction timeout
should be set slightly higher than the length of time it will take
for the data points to be collected, or be set to the length of
time after which the transaction is no longer valid. For
example, if a transaction should complete in 5 seconds but
might take as long as 7 seconds and still be acceptable, you
should set the transaction timeout to 8 seconds. If the
transaction goes past 8 seconds, the transaction will fail, and an
error will be logged.
Accept the default value of 60 seconds.
• Click Next to continue.
Rockwell Automation Publication HIST-UM001K-EN-E-June 2014 35
Page 36
Chapter 3 Collecting FactoryTalk Historian Classic Data
configuration that you stopped in the first step of the wizard, the
begin to collect data and log it to the RSBizWare database.
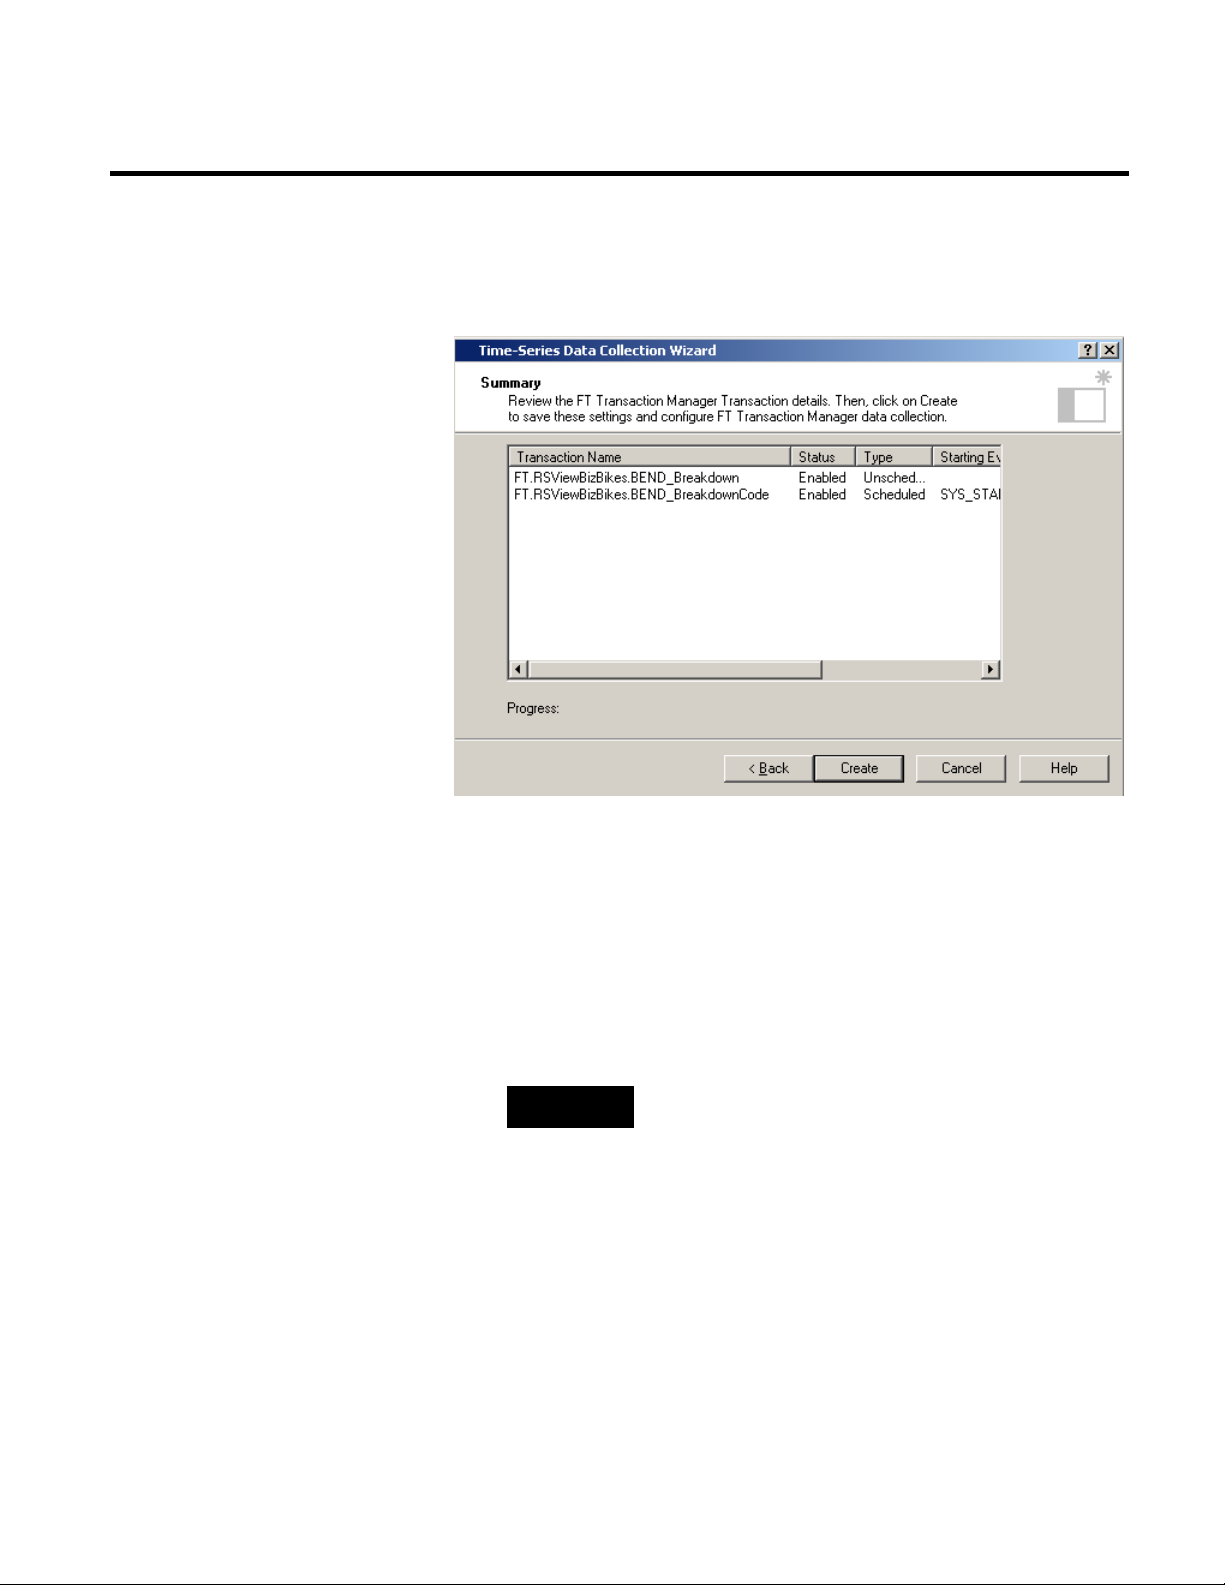
Step 6: Create Transactions
Organize FactoryTalk Historian Classic Reporting Tags
The Summary dialog box gives you a chance to review the
transactions that will be created.
1. If the transactions are correct, click Create.
2. The Results panel displays errors and warnings that occurred
during the generation of FactoryTalk Transaction Manager
transactions, if any. If the creation of transactions results in
errors or warnings, double-click the entries in the summary list
for more information about what went wrong, where the fault
occurred, and the severity of the error.
NOTE
If the configuration that you are working with was a running
wizard will prompt you to restart the configuration. After the
configuration is started, FactoryTalk Transaction Manager will
3. Click Finish to close the wizard.
As you configure FactoryTalk Historian Classic data collection for
your organization, you most likely will have a large number of
reporting tags to which you are collecting data and from which you
36 Rockwell Automation Publication HIST-UM001K-EN-E-June 2014
Page 37
Collecting FactoryTalk Historian Classic Data Chapter 3
will be creating reports; therefore, it is a good idea to organize your
reporting tags.
NOTE
To manage time-series reporting tags, you must be granted the Manage
Reporting Tags privilege by your RSBizWare administrator.
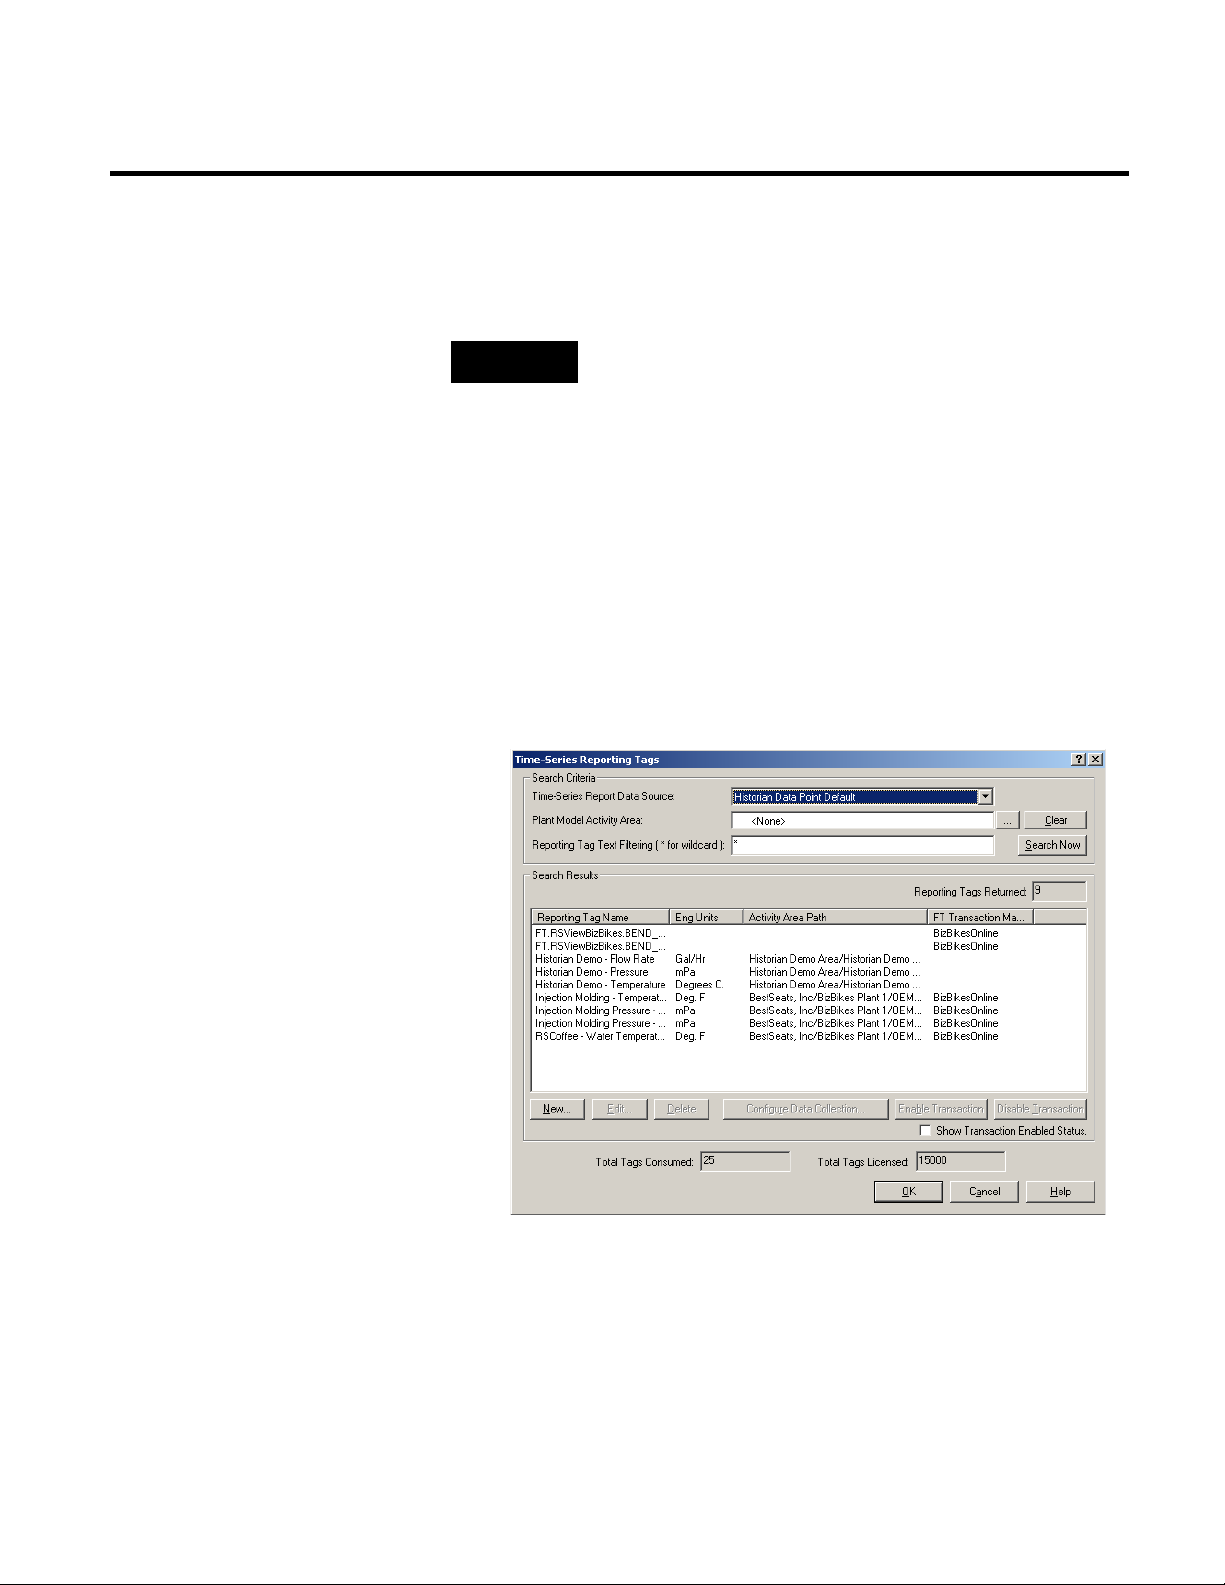
1. From the main menu, select Tools > FactoryTalk Historian
Classic > Manage Time-Series Reporting Tags to display the
Time-Series Reporting Tags dialog. This dialog is the starting
point for administering and managing reporting tags.
2. Select the time-series report data source that contains the
reporting tags that you want to modify or organize. To view
the reporting tags that we just created, select the Historian
Data Point Default report data source. The Search Results list
at the bottom of the dialog is refreshed to show the reporting
tags in the selected report data source.
3. When the Search Results list contains too many entries for you
to easily locate the reporting tags that you want to manage, use
the Plant Model Activity Area control, the Reporting Tag
Text Filtering control, or both to narrow the search results.
Rockwell Automation Publication HIST-UM001K-EN-E-June 2014 37
Page 38

Chapter 3 Collecting FactoryTalk Historian Classic Data
To perform an activity area search, click to the right of
the Plant Model Activity Area box. Use the Plant Model
Browser dialog that is displayed to select the activity area that
you want to search. Click OK to return to the Time-Series
Reporting Tags dialog. The Search Results list is refreshed to
show the reporting tags in the report data source that are
associated with the selected activity area. Our reporting tags
have not yet been associated with an activity area, so a search
by activity area would not return the reporting tags that we
created in the previous tutorial. So click the Clear button if
you selected an area in the Plant Model Browser dialog.
To perform a string search on the names of the reporting tags
in the selected report data source, enter the text that you want
to search for (using an “*” to represent a wild card character)
and click Search Now. Reporting tags that match the search
string are displayed in the list at the bottom of the dialog. For
example, a string search for *BEND* would return the
reporting tags that we created in the previous tutorial.
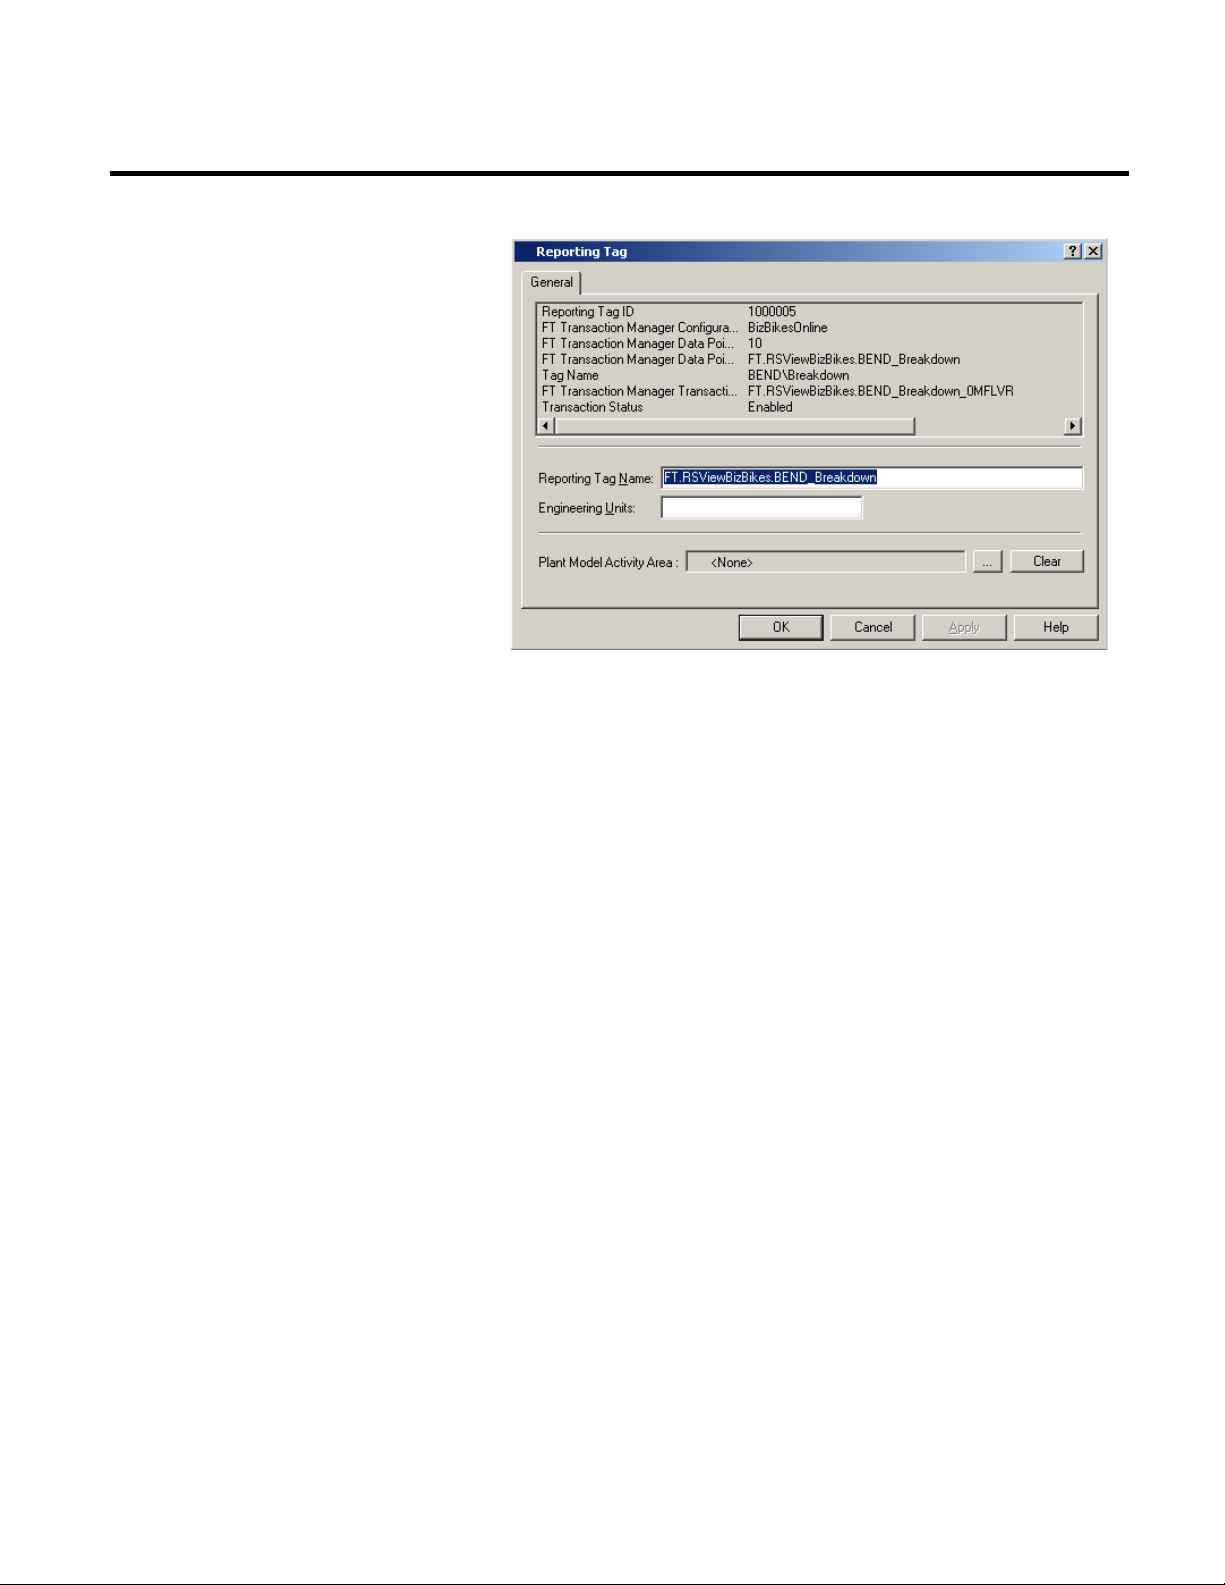
4. Select the BEND_Breakdown reporting tag from the list and
click Edit to display the Reporting Tag dialog box. Use it to
edit the name of the reporting tag, provide the engineering
units, and associate the reporting tag with an activity area in
the plant model.
38 Rockwell Automation Publication HIST-UM001K-EN-E-June 2014
Page 39
Collecting FactoryTalk Historian Classic Data Chapter 3
Start Data Collection
5. Click OK to save your changes and return to the Time-Series
Reporting Tags dialog.
6. Click OK to close the Time-Series Reporting Tags dialog.
After you have finished configuring the performance parameters,
and enabled data collection for the activity areas that use a particular
FactoryTalk Transaction Manager configuration, you need to start
the FactoryTalk Transaction Manager configuration to begin the
data collection.
To start the data collection:
1. On the Tools menu, click FactoryTalk Transaction
Manager > Manage FactoryTalk Transaction Manager
Configurations.
The FactoryTalk Transaction Manager Configurations
dialog box appears.
It lists the FactoryTalk Transaction Manager configurations
that have been imported, and the applications to which they
apply. In the dialog box, you can evaluate the running status of
FactoryTalk Transaction Manager configurations that are
Rockwell Automation Publication HIST-UM001K-EN-E-June 2014 39
Page 40

Chapter 3 Collecting FactoryTalk Historian Classic Data
2. Select a FactoryTalk Transaction Manager configuration, and
collecting data from the control system, as well as start, stop, or
restart the configurations.
then click Start.
The configuration is started. The green traffic light icon (
)
indicates that the configuration is running and collecting data
from the control system.
40 Rockwell Automation Publication HIST-UM001K-EN-E-June 2014
Page 41

Create a New RSBizWare Report
Chapter 4
Analyzing FactoryTalk Historian Classic Data
FactoryTalk Historian Classic provides a graphical environment in
which to analyze manufacturing process data. This chapter will help
report designers understand how to use FactoryTalk Historian
Classic to create and view RSBizWare reports containing time-series
charts; bar, pie, and line charts; and tables. We will discuss the parts
of a report, look at the sample reports that can be installed with the
software, create a report based on the sample data, and discuss the
creation of more complex reports. FactoryTalk Historian Classic
must be set up by the RSBizWare administrator before you can start
to create reports using real data.
In RSBizWare, a report is a complete, formatted document that is
made up of one or more report objects that have been placed in an
HTML document along with text, graphics, and hyperlinks. A
report, saved as an .htm file, is created and edited using the
Configuration Console with a FactoryTalk Metrics Author license.
RSBizWare reports can also be edited using Web-authoring tools
such as Microsoft FrontPage.
An RSBizWare report object shows the data from a database table
or view in a meaningful graphic or tabular presentation. The report
object defines how the data is to be shown to the user. It defines
both the visual representation of the data (e.g., pie chart, bar chart,
table) as well as the data sorting and summarization.
The data for the report object comes from an RSBizWare report
data source. A report data source is a connection to a table or view
within the RSBizWare database or an external database.
Rockwell Automation Publication HIST-UM001K-EN-E-June 2014 41
Page 42

Chapter 4 Analyzing FactoryTalk Historian Classic Data
Insert Text, Pictures, and Hyperlinks
The data in the report object may be restricted by a query (a filter),
made up of one or more search criteria, that determine which
records from the report data source will be shown. The use of a filter
is optional.
To create a new, blank report:
1. Open the Configuration Console.
2. On the File menu, click New Report.
To add a title, a picture, and a hyperlink:
A blank report page appears.
1. Click the report area, and type a title for your report, e.g.,
Company Web Page
.
My
Select the title, and then, on the Report Formatting toolbar,
change the title font to Arial, and the font size to 18.
2. On the Formatting Toolbar, click
to align the text to
the center of the page.
3. Click next to the title (its selection is canceled), and then press
Enter.
4. Right-click the report area, and then click Insert Image.
42 Rockwell Automation Publication HIST-UM001K-EN-E-June 2014
The Picture dialog box appears.
5. Next to the Picture Source box, click Browse to select the
picture that you want to add to the report.
6. In the Alternate Text box, type a description of the image.
Page 43

Analyzing FactoryTalk Historian Classic Data Chapter 4
The alternate text appears as a tooltip when you point to the
image.
7. Under Layout and Spacing, set the display properties of the
picture.
8. Click OK.
The logo appears under the title.
9. Click the image, and then on the Insert menu click
Hyperlink.
The Hyperlink dialog box appears.
10. In the URL box, type the address of the page which will open
when you click the image.
Rockwell Automation Publication HIST-UM001K-EN-E-June 2014 43
Page 44

Chapter 4 Analyzing FactoryTalk Historian Classic Data
. Then, repeat step 10.
report, report objects, and filters that are used on the report.
Save the Report
11. Click OK.
TIP
You can also add a hyperlink to a text. To do so, select the text,
and then, on the Reports Insertable Items toolbar, click
12. On the Report Formatting toolbar, click to see, how
the report will look like as a web page.
When you point to the image, the alternative text will appear.
44 Rockwell Automation Publication HIST-UM001K-EN-E-June 2014
NOTE
To edit the report, report objects, and filters, you need to have
the Author license and the appropriate object permissions for the
13. On the Report Formatting toolbar, click to go back to
editing your report.
RSBizWare reports are saved as HTML documents on the
Information Services Manager computer to which your
Configuration Console is connected. They appear in the Report
Explorer tree.
Page 45

Analyzing FactoryTalk Historian Classic Data Chapter 4
Add a Saved Report Object to Your Report
To save the report:
1. On the File menu, click Save Report As.
The Save Report As dialog box appears.
2. In the Report Name box, type a name for your report file.
In this example, the name is
My Company Report.
3. Click Save.
The report appears in the Report Explorer tree.
The Configuration Console allows you to view report objects that
other users have created and to add them to your report. For this
tutorial, we will add a saved report object that was created when the
sample data was loaded.
1. With the report open in the work area, place your cursor in the
report where you want the report object to appear.
2. On the main menu, select Insert > Existing RSBizWare
Report Object. The following message appears.
Rockwell Automation Publication HIST-UM001K-EN-E-June 2014 45
Each report object on a report can connect to a different
Information Services Manager in your organization.
Therefore, before you continue, you must identify the server to
which this report object will connect.
Page 46

Chapter 4 Analyzing FactoryTalk Historian Classic Data
granted permissions.
the selected report data source
3. Use this dialog box to select the report object that you want to
Click Yes to accept the default user name and server.
Click No to connect to a different server and display the login
dialog box where you provide the credentials and the server
that you want to use to author the report object.
For this tutorial, click Yes to accept the default user name and
server. The RSBizWare Report Object Properties dialog box
appears.
insert in your report.
46 Rockwell Automation Publication HIST-UM001K-EN-E-June 2014
Item Description
Report Data Source The list of report data sources from which the data will be
shown in the report object and to which you have been
Report Object The list of available report objects, grouped by the report
data source from which they get their data. When you
select a report data source, the list of report objects is
refreshed to show only the report objects that are based on
Page 47

Filter
The list of available filtering criteria.
Sources, Report Objects and Filters dialog box.
Select the check box near the toolbar name which you want
been created.
Item Description
Analyzing FactoryTalk Historian Classic Data Chapter 4
Manage Report
The button for displaying the Configure Report Data
Objects
Select Which
Toolbars to Show
options
to display on the report. The check boxes allow you to add
toolbars to the report object. The end users of your report
will use these toolbars to adjust the report object to suit
their needs.
The following toolbars can be selected:
• General
• Time Selection
• Status Bar
• Report Data Source
• Report Object
• Filter
4. From the Report Data Source list, select FactoryTalk
Metrics Workcell History. This is the data that will be shown
in the report object.
5. From the Report Object list, select Workcell History.
Rockwell Automation Publication HIST-UM001K-EN-E-June 2014 47
6. For this example, we will not select a filter, so leave the filter
list blank.
NOTE
Filters are grouped by the report data source for which they have
7. Select the Status Bar check box. This will cause a status bar to
display at the bottom of the report object. Because each report
object on a report can connect to a different server, the status
bar will indicate the user and server to which the report object
is connected at run time.
8. Click OK to add the report object to the report. The report
object is shown as a simple box outline.
9. Double-click inside the box outline to see the table, and click
Refresh. To populate the report object with data, click the
Refresh button. Your report object should look similar to the
following:
Page 48
Chapter 4 Analyzing FactoryTalk Historian Classic Data
Configure the Report Object To Use Global Credentials
At run time, the RSBizWare report objects on your report will
attempt to connect to an Information Services Manager to access the
production data necessary to draw the chart, bar graph, etc. The
connectivity settings for each report object specify how they will
connect to the Information Services Manager. When the report user
attempts to view an RSBizWare report that contains multiple report
objects with different connectivity settings, the report users may be
required to log on multiple times before they can see the report.
To avoid repetitive logons on a report, you can set your report
objects to use Global Credentials. Global Credentials use a session
logon to connect to a report object. With a session logon, the user is
prompted for user name and password once for each server that is
encountered. After the user’s credentials (user, password) have been
specified for a server, those credentials are available to any
subsequent report object that is running on that client computer, is
using the Use Global Credentials option, and is attempting to
connect to the same server. The session logon that is established will
remain active until the user specifically logs off, the credentials
expire, or the client computer is rebooted.
48 Rockwell Automation Publication HIST-UM001K-EN-E-June 2014
Page 49
Analyzing FactoryTalk Historian Classic Data Chapter 4
To enable a report object to make use of a session logon, the report
object must be configured to use Global Credentials.
To configure a report object to use Global Credentials:
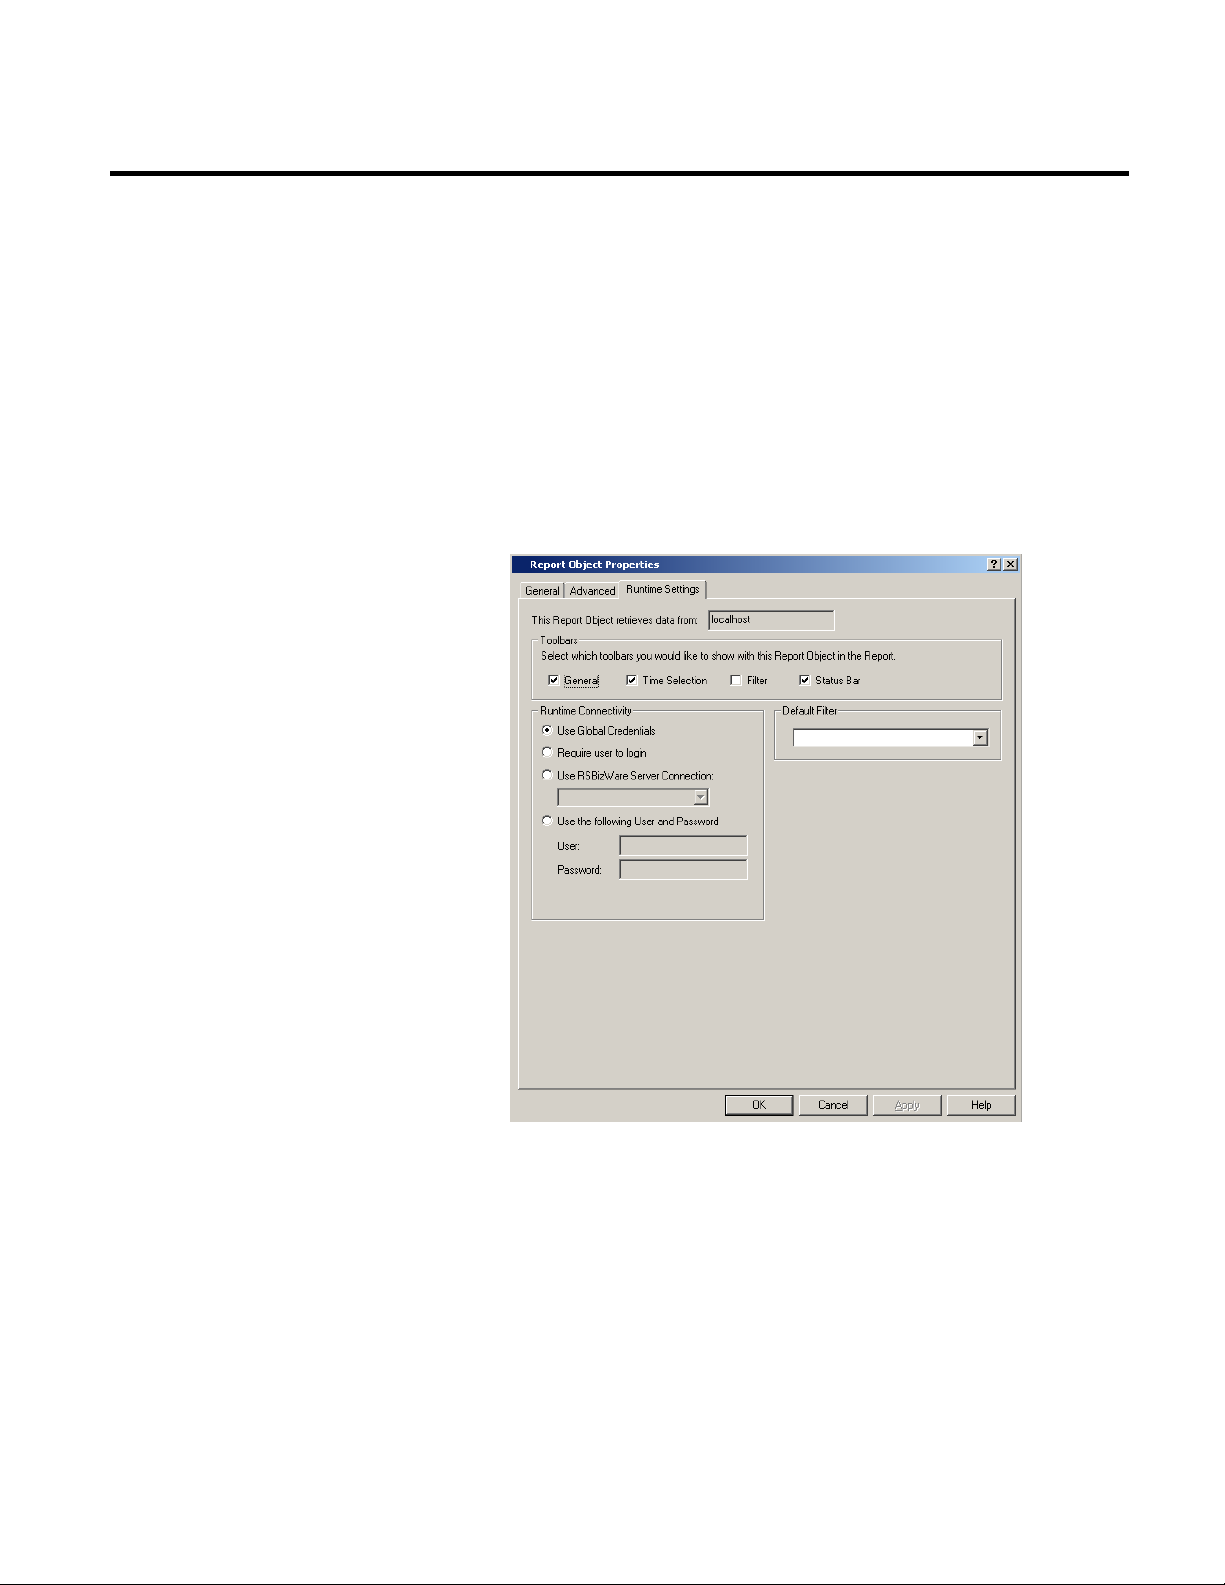
1. Click the FactoryTalk Metrics Workcell History report object,
and on the main menu, select View > Properties. The Report
Object Properties dialog box appears.
2. Click the Runtime Settings tab.
The Runtime Settings tab enables you to specify how the user
will connect to the server that you selected when you inserted
the report object. When you are configuring the server
connection settings for a report object, you have the following
options:
• Use Global Credentials
This is the default option. Select this option if you want to
use a session logon to connect to this report object.
Rockwell Automation Publication HIST-UM001K-EN-E-June 2014 49
Page 50

Chapter 4 Analyzing FactoryTalk Historian Classic Data
and filter or they will not be able to see the report object.
place of RSBizWare Server Connection objects.
• Require user to login
Select this option if you want to require the users to provide
their user name and password to access this report object.
More than one report object on a report with this option
selected will require the user to log on multiple times.
NOTE
Remember that any users who will be viewing the report
must have access to the report data source, report object,
• Use RSBizWare Server Connection
Select this option if you want to specify the RSBizWare
Server Connection that this report object will use when the
user views the report at run time. You will only be able to
select from Server Connection objects that are configured
to use the same RSBizWare server that you selected when
you added this report object to the report.
NOTE
This option is provided for backwards compatibility only.
It is recommended that you use Global Credentials in
• Use the following User and Password
Select this option if you want to specify at design time the
user name and password that the report object will use
when the user attempts to view the report object at run
time. The advantage of choosing this option is that the user
will not have to login to view the data.
50 Rockwell Automation Publication HIST-UM001K-EN-E-June 2014
Page 51

Analyzing FactoryTalk Historian Classic Data Chapter 4
RSAssetSecurity documentation.
Create a New Chart
NOTES
By selecting this option, you are granting the specified
user’s application privileges to the runtime user for this
report object. Because the Save Report Object Contents
to File, Add Time-Series Comment, and Edit/Delete
Time-Series Comment application privileges allow action
on report objects, it is important to consider whether the
specified user has these privileges and whether you want
the runtime user to have these privileges.
If you use this option across many report objects and the
security policy for the user is very strict (that is, the
password must be changed frequently), you will need to
change the password setting separately for each report
object. Consider using a less strict security policy (such as
never requiring the password to be changed) for this
user. For more information on security policy, consult the
For this tutorial, make sure the Use Global Credentials
option is selected.
3. Click OK to close the dialog box and save your changes.
You will be adding more report objects to this report. If you want
the rest of the report objects on this report to use Global
Credentials, you will need to specify this option for each report
object when you insert the report object.
An important feature of the Configuration Console is the ability to
create bar, pie, and line charts from data stored in a report data
source. The purpose of this tutorial is to walk you through the steps
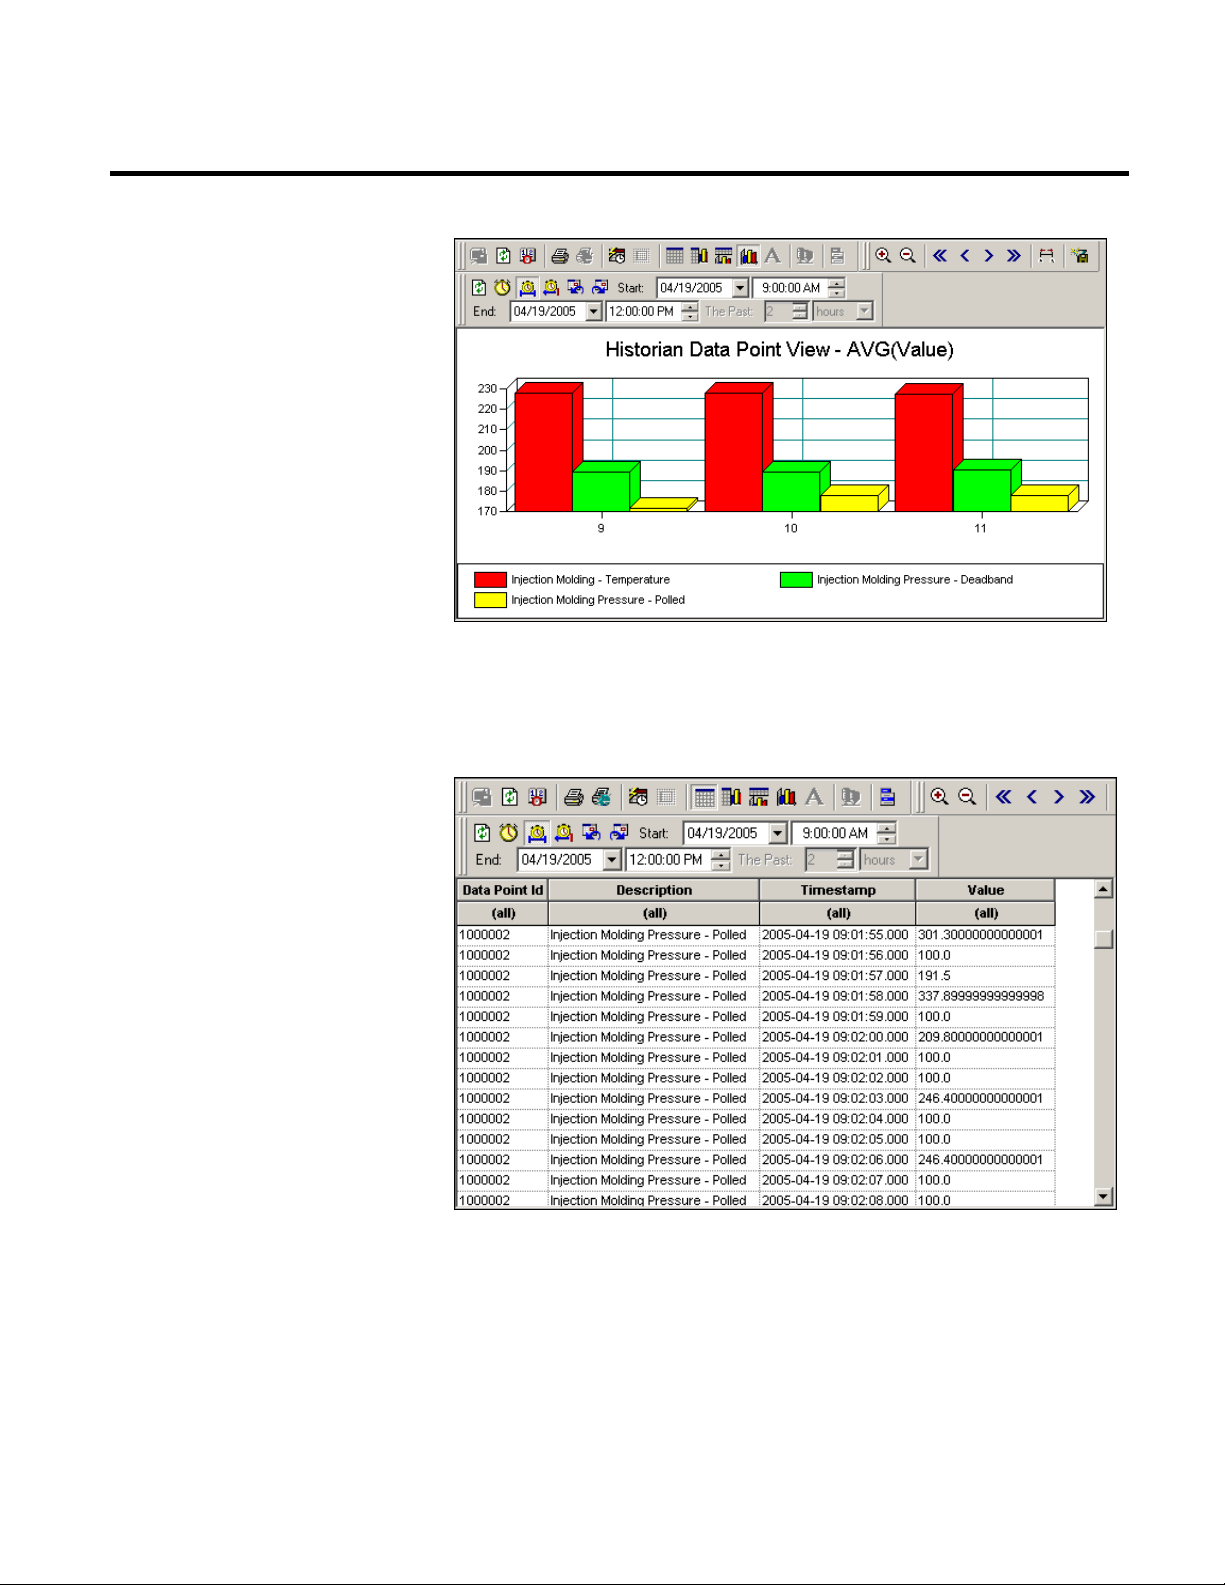
that are necessary to create a chart with the New Chart Wizard. For
this tutorial, you will use the Historian Data Point View report data
source to create a chart showing the average running time per hour
for work cells. This tutorial will also demonstrate how to create a
prompt-at-runtime filter so that the end-user of the report can
choose the work cells that will be charted. Your chart will look
similar to the one shown below.
Rockwell Automation Publication HIST-UM001K-EN-E-June 2014 51
Page 52
Chapter 4 Analyzing FactoryTalk Historian Classic Data
Step 1: Plan the Chart
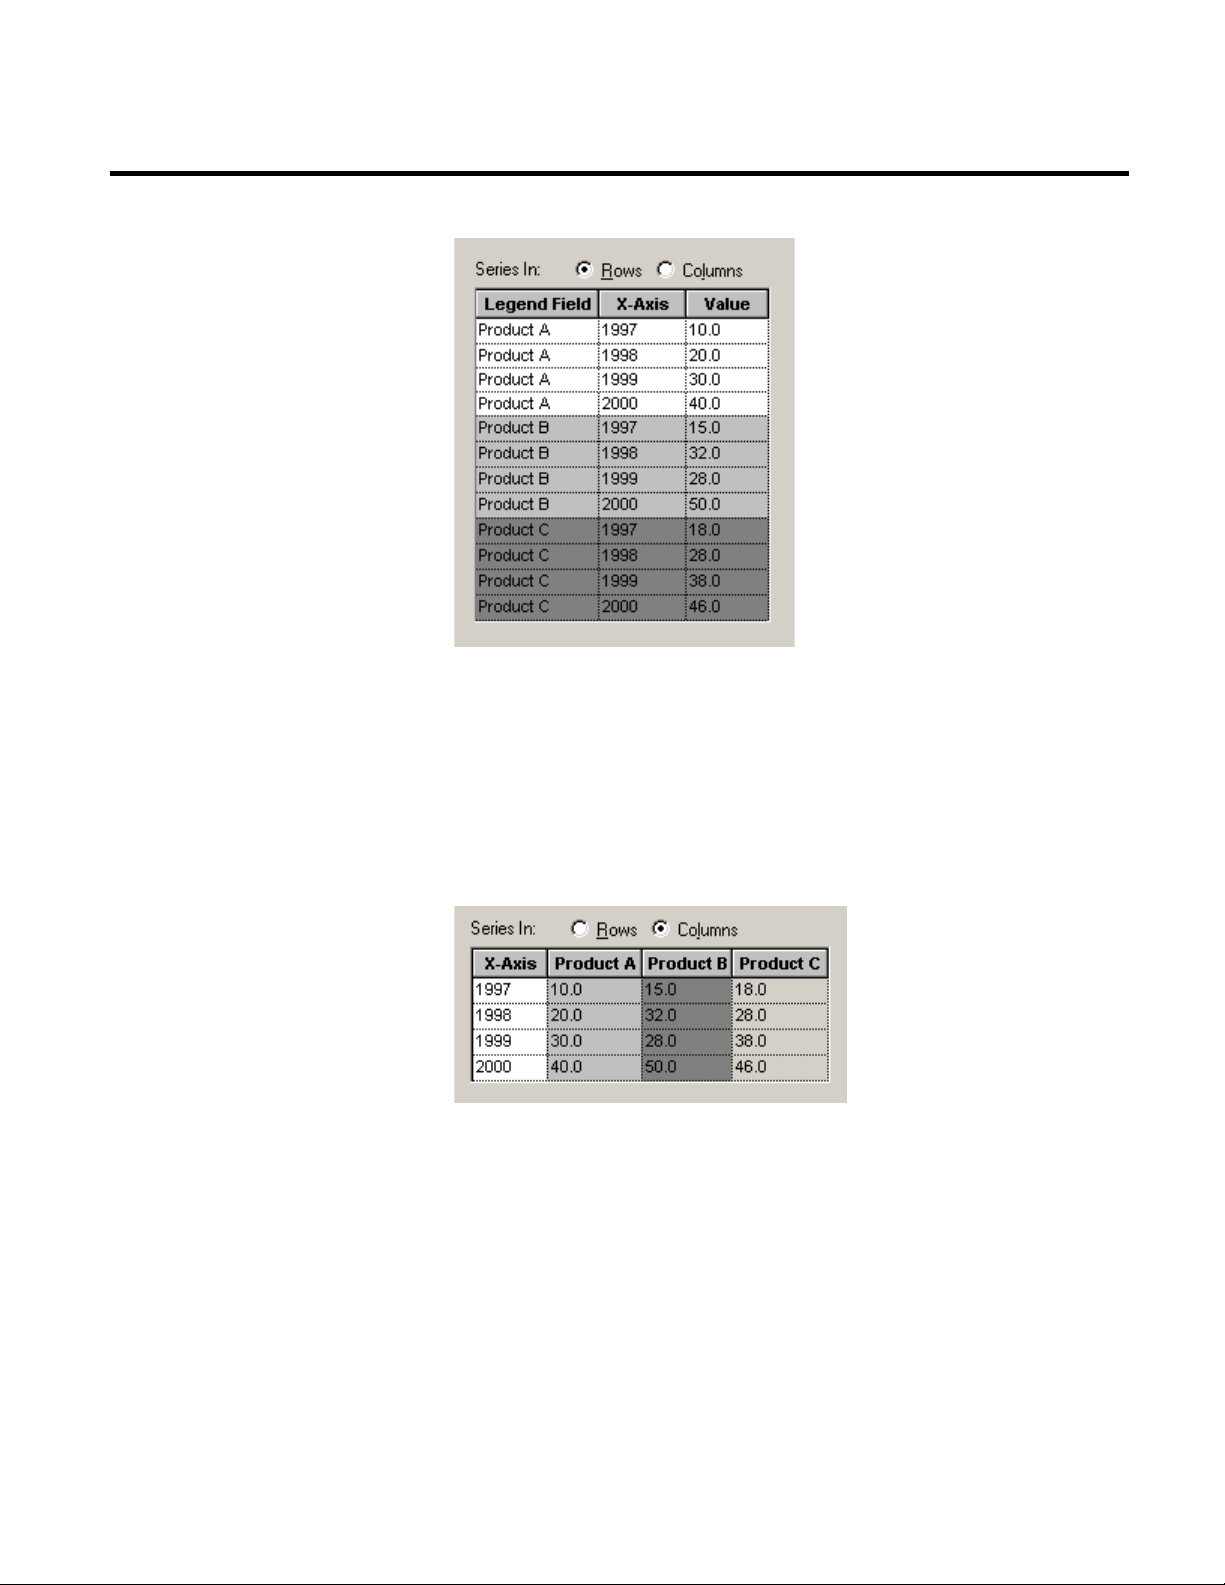
The following table shows a representation of the data we will be
charting.
52 Rockwell Automation Publication HIST-UM001K-EN-E-June 2014
We will be creating a chart with a bar for each data point; therefore,
the Description field is the series. Notice that one column in our
table (Description) contains all of the data point descriptions, and
the data for the data points is organized in rows. Each row contains
the data value (Value) and the time stamp (TimeStamp) for each
Page 53

Analyzing FactoryTalk Historian Classic Data Chapter 4
Step 2: Select the Data On Which To Report
Step 3: Choose a Chart Type
Step 4: Describe the Data
data point. This will be important to remember when we are using
the New Chart Wizard.
Place your cursor where you want the chart to appear in the report
and select Insert >Chart to display the authoring user name and
server prompt. Click Yes to accept the default user name and server.
The New Chart Wizard will display. This wizard will lead you
through the process of creating a new chart for your RSBizWare
report.
The first step in the New Chart Wizard is to select the report data
source containing the data that we want to chart. The Report Data
Source list contains the report data sources for which you have the
appropriate permissions. Select Historian Data Point View from
the list and click Next to continue.
Next, we you need to specify the type of chart that you want to
create. The vertical bar chart is the default. Click Next to accept the
default and continue.
In the data configuration step, you need to describe the data to the
Chart Wizard. Recall that the data table data is organized in rows for
each work cell (series). This corresponds to the example table shown
in the Chart Wizard for the Rows option.
Rockwell Automation Publication HIST-UM001K-EN-E-June 2014 53
Page 54
Chapter 4 Analyzing FactoryTalk Historian Classic Data
Step 5: Select Summary or Detail
If the data points ID or descriptions If the series values (work cell
descriptions) were in the column headers of the table and the
Running Seconds values for each work cell were listed in the column
for that work cell, this would be an example of a table where the
series is in columns. For this type of table, you would select the
Columns option.
54 Rockwell Automation Publication HIST-UM001K-EN-E-June 2014
However, since you have determined that the data is in rows, make
sure the Rows option is selected and click Next to continue.
In this step, you must decide whether you want to chart all of the
values from the table or if you want to apply aggregate functions to
the values. Since you want to summarize a field in the chart (find the
average running time for each hour of the day), accept the default
Summary option and click Next to continue.
Page 55
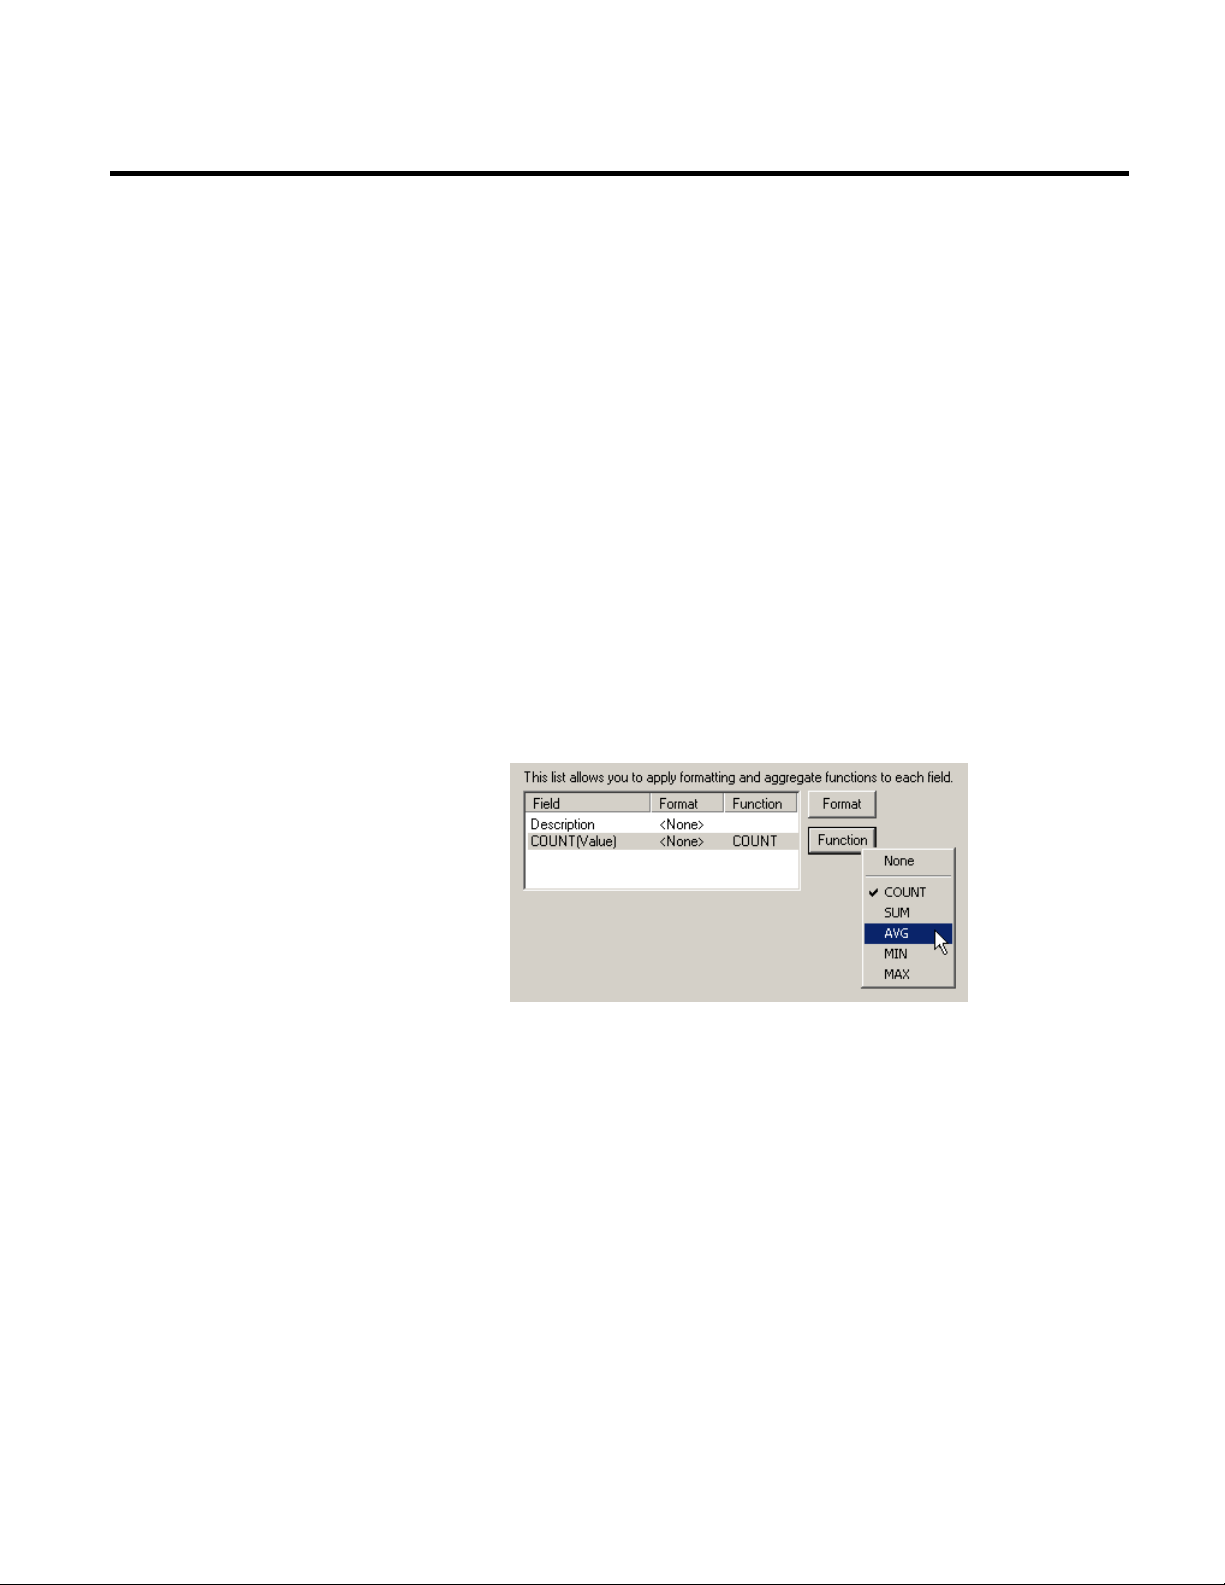
Analyzing FactoryTalk Historian Classic Data Chapter 4
Step 6: Select the Fields To Be Charted
In the Chart Fields step, we select the fields from the report data
source that will be shown in the chart. This dialog box would look
different if we had selected the Columns option in the Data
Configuration step of the wizard.
1. Since we want to have a bar for each workcell and we want the
names of the workcells to appear in the legend, select
Description from the LEGEND list.
2. Select the Value field from the VALUE list. This is the field
that will provide the values for the height of the bars.
3. When you selected the Value field from the VALUE list,
COUNT(Running Seconds) was added to the list at the
bottom of the dialog box. To change the function that is
applied to the field, select the COUNT(Value) field in the
list, click Function, and select AVG from the shortcut menu.
Rockwell Automation Publication HIST-UM001K-EN-E-June 2014 55
This action changes the function from COUNT(Running
Seconds) to AVG(Running Seconds). The AVG(Running
Seconds) function will return the average running time value
for each workcell.
4. Now we will add Hour labels to the X-axis. This will allow us
to group the average running time values for the workcells by
hour. Select TimeStamp from the X-Axis list.
5. When TimeStamp is added to the list at the bottom of the
dialog, it has no formatting applied to it. Since we only want to
see the hour portion of the timestamp in our chart, we must
apply the HOUR format to the timestamp. To change the
Page 56

Chapter 4 Analyzing FactoryTalk Historian Classic Data
Prompt-at-runtime filters cannot be used with report objects that will
be scheduled.
Step 7: Enter the Chart Title
Step 8: Filter the Data
6. Click Next to continue.
The Report Object Name dialog box appears. You must provide a
unique name for the report object. The name you enter here will
appear at the top of your new chart and will also be the name for this
chart when it is saved as a report object for future use.
format to HOUR, select TimeStamp from the list, click
Format, and select HOUR from the shortcut menu.
1. For this tutorial, enter
AVG(Value)
in the Report Object Name box.
Historian Data Point View
2. Click Next to continue.
The Filter dialog box appears. Now you will create a filter that will
specify which records will be charted. Since you only want to chart
the values for certain work cells, you will need to filter out the work
cells that you do not want to chart.
There are two types of filters that you can create:
• The static filter, where you provide all of the filter values when
you create the filter.
• The “prompt-at-runtime” filter which allows the user to select
the filter values every time the filter is used.
For this tutorial, you are going to create a prompt-at-runtime filter
that allows the users to select the work cells that they want to report
on when the report is run.
NOTE
56 Rockwell Automation Publication HIST-UM001K-EN-E-June 2014
Page 57

Analyzing FactoryTalk Historian Classic Data Chapter 4
To create a new filter:
1. Click New Filter. The Configure Filter dialog box appears.
2. Enter the name
Data Point Filter in the Edit Filter Name
box.
3. A filter is made up of one or more search criteria. For this
filter, you will create a single criterion. Click Add Criterion.
The Search Criterion dialog box appears.
4. Select the Description field from the Field tree and select the
= operator from the Operator list.
5. Select the Select from a list of existing values for this field
check box. This creates a list of unique values from which the
user can pick report values.
6. Select the By prompting user when filter is run check box.
This makes this a prompt-at-runtime filter.
7. Select the Allow multiple selection from list check box. This
allows the user to select more than one work cell from the list
of values that is created.
8. Select the Required (Must be supplied when filter is run)
check box. Doing this will require the user to specify a filter
value when the report object is run.
Rockwell Automation Publication HIST-UM001K-EN-E-June 2014 57
Page 58
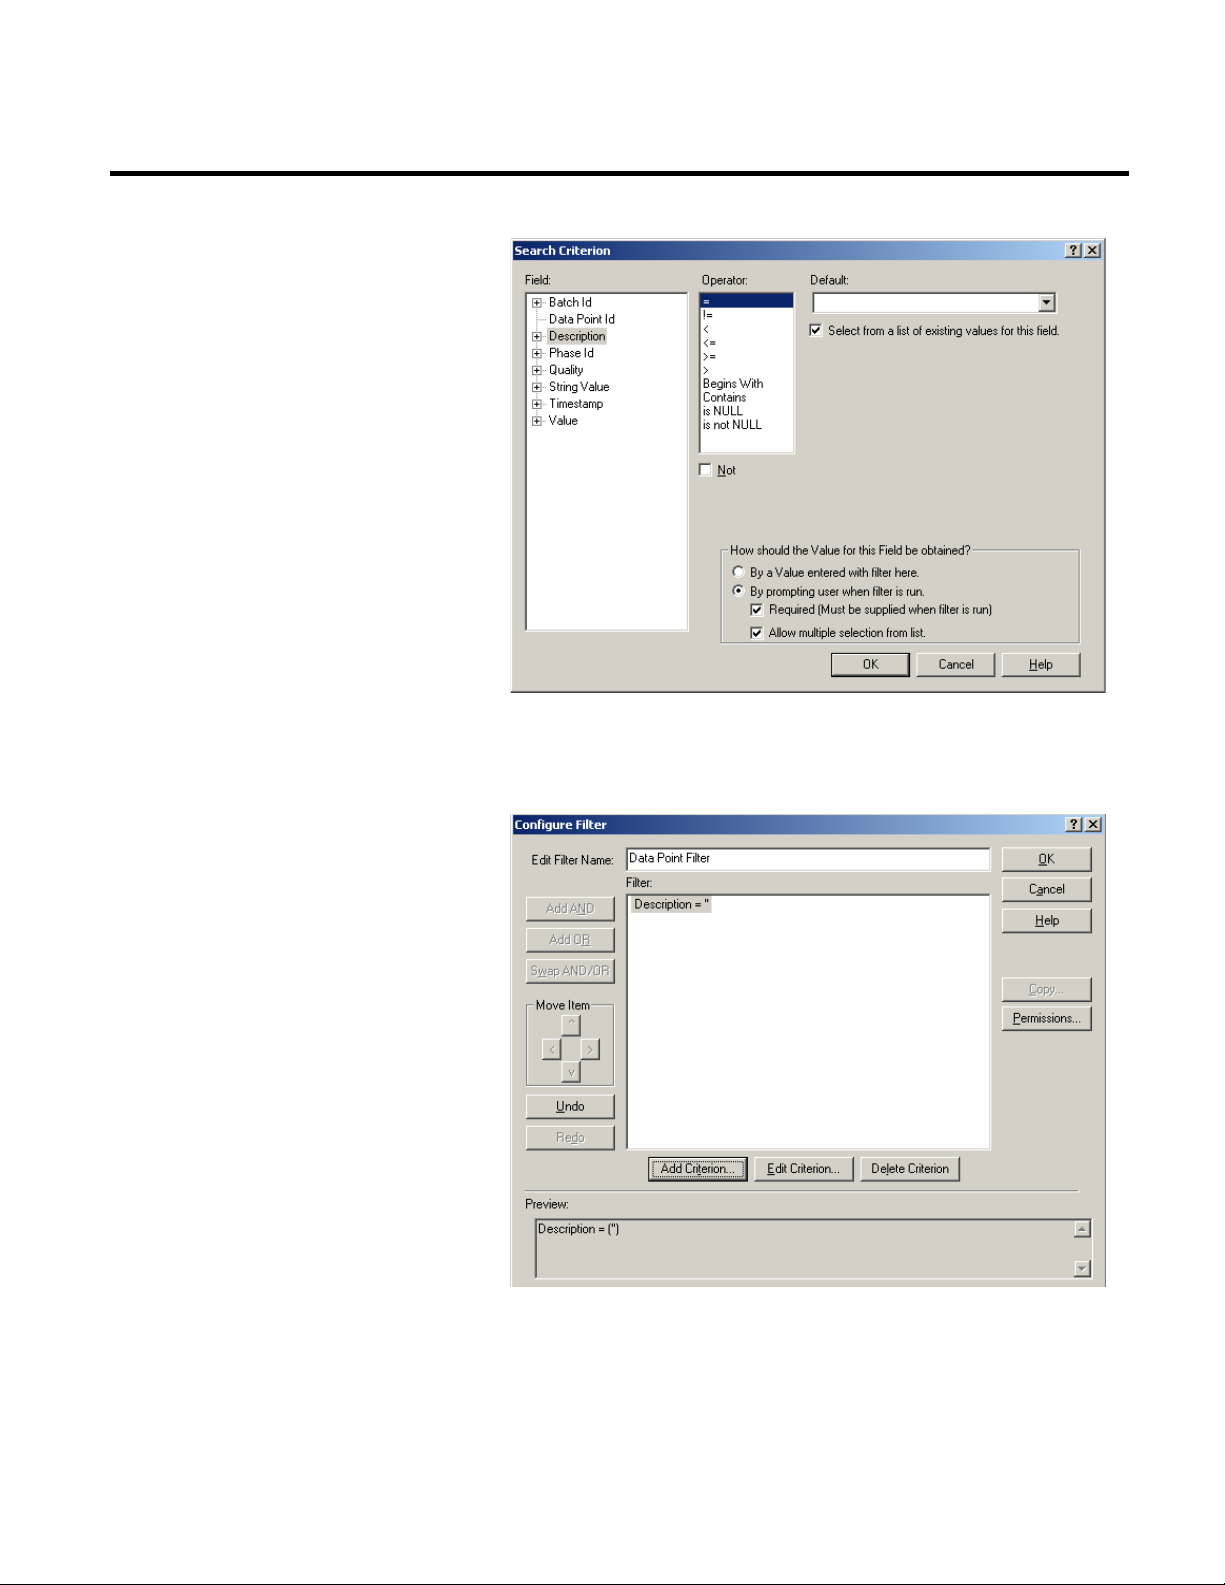
Chapter 4 Analyzing FactoryTalk Historian Classic Data
9. Click OK to return to the Configure Filter dialog box. After
you have completed these steps, the Configure Filter dialog
box should look like the example below.
10. Click OK to return to the New Chart Wizard.
58 Rockwell Automation Publication HIST-UM001K-EN-E-June 2014
Page 59
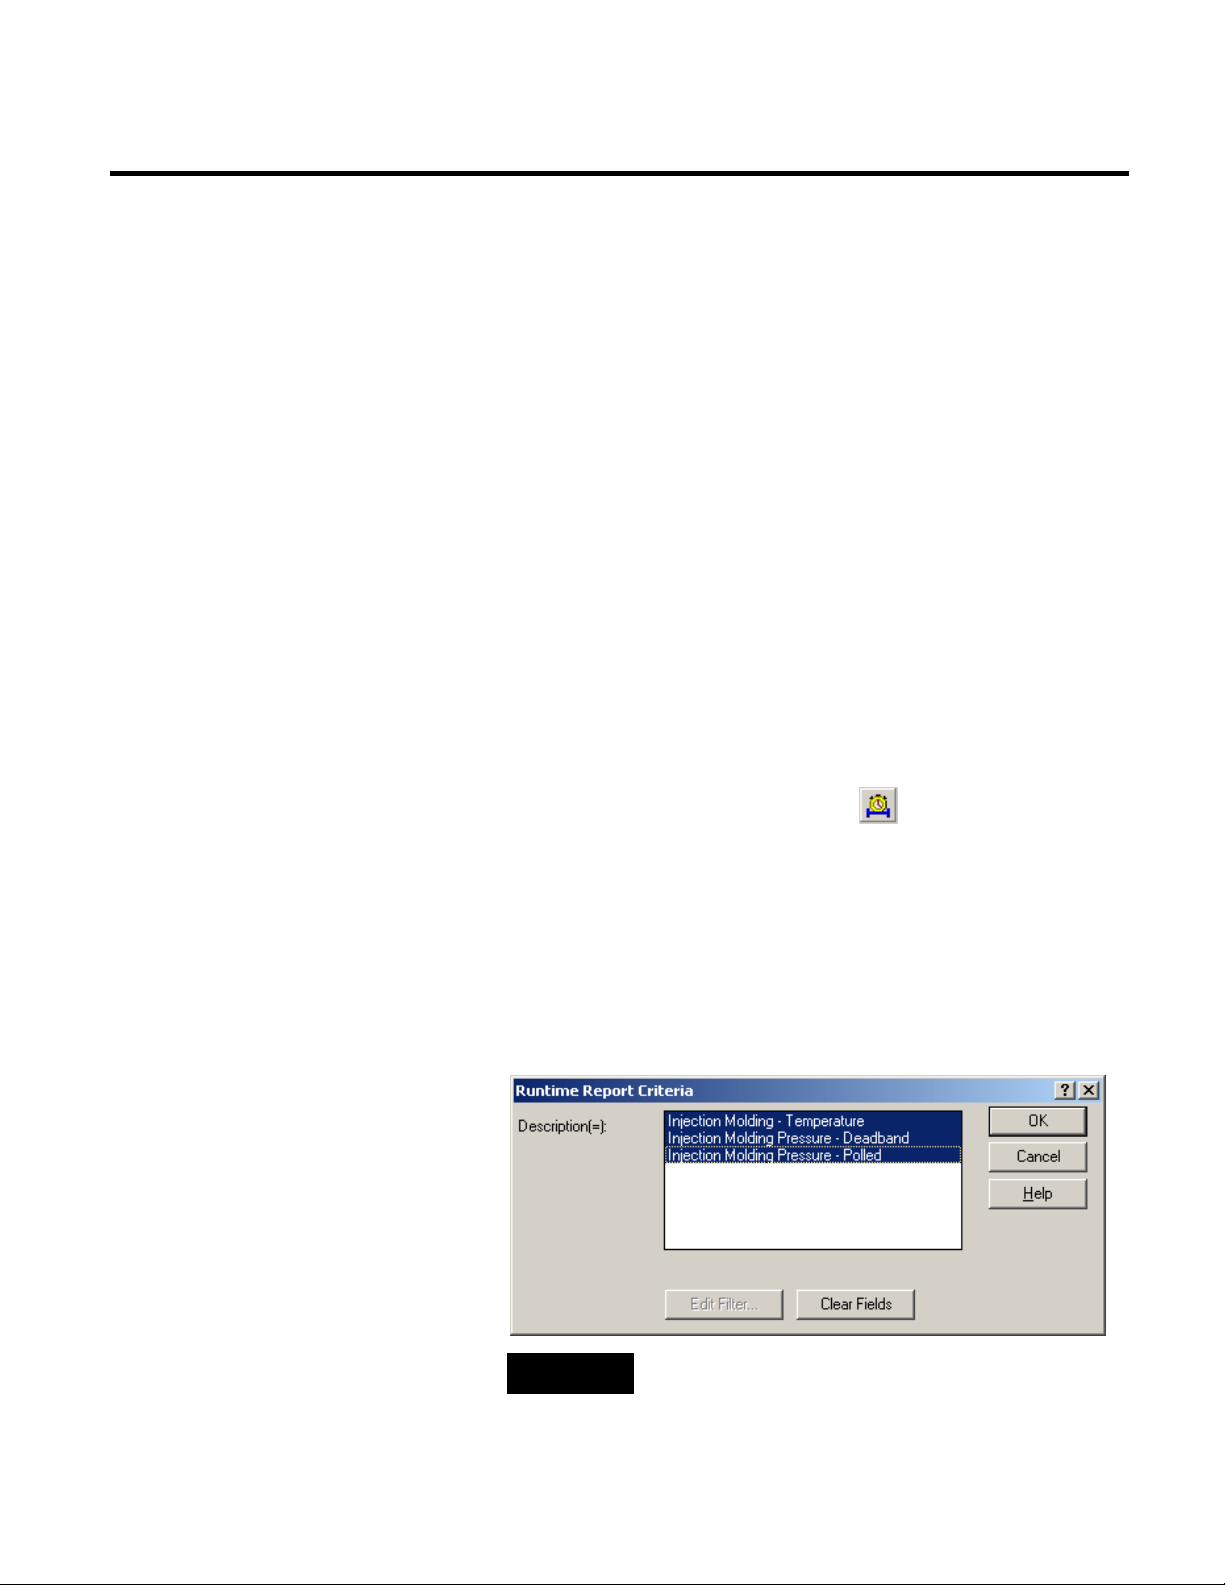
Analyzing FactoryTalk Historian Classic Data Chapter 4
preceding prompt would not appear.
Step 9: Insert Your New Chart Into the Report
Now that you have selected the report data source, created the chart
report object, and created a prompt-at-runtime filter, you are ready
to insert the chart into the report.
To insert the chart into the report:
1. Click Finish to add the chart to the report. The chart is shown
as a simple box outline.
2. To ensure that the filter is properly associated with the report
object, right-click the report object and select Properties.
3. In the Report Object Properties dialog box, select the
Runtime Settings tab and select the Data Point Filter from
the Default Filter list.
4. Click OK to return to the report object.
5. Double-click inside the box outline to see the chart,.
Click the All Time Range button
on the Time Selection
toolbar, set the time range to 4/19/2005 9:00 AM to
4/19/2005 12:00 PM, and click Refresh. When you refresh a
report object that contains a required prompt-at-runtime filter,
the Runtime Report Criteria dialog box will appear. This is
the prompt that was created by the prompt-at-runtime filter.
This dialog box allows the users of your report object to specify
the values that will be displayed in the report object.
Rockwell Automation Publication HIST-UM001K-EN-E-June 2014 59
NOTE
If you did not select the Required check box in Step 8, the
Page 60

Chapter 4 Analyzing FactoryTalk Historian Classic Data
Create a New Text Report Object
6. For this tutorial, hold down the Ctrl key on your keyboard
7. Click OK to display the chart with the data points that you
Refer to "Customizing RSBizWare Charts and Tables (page 87)" for
information on how to further customize your chart by changing the
title or bar/line colors.
The Configuration Console gives you the ability to create a text
report object (or table) on your report that displays the data from a
report data source. The purpose of this tutorial is to walk through
the steps that are necessary to create a table in your report. For this
tutorial, you will use the Historian Data Point View report data
source to create a table showing the average value for data points.
Your table will look similar to the one shown below.
and select all of the Injection Molding data points from the
list.
selected.
60 Rockwell Automation Publication HIST-UM001K-EN-E-June 2014
Page 61

Analyzing FactoryTalk Historian Classic Data Chapter 4
Step 1: Start the Text Report Object Wizard
Step 2: Select the Data On Which To Report
To start the Text Report Object Wizard:
1. In the Configuration Console, place your cursor where you
want the table to appear in the report.
2. On the Insert menu, click Text Report.
3. Click Yes to accept the default user name and server name.
The Report Wizard appears.
4. Click Next.
To select the data that you want to include in the table:
Rockwell Automation Publication HIST-UM001K-EN-E-June 2014 61
1. The Report Data Source list box contains the report data
sources for which you have the appropriate permissions. Select
Historian Data Point View from the list.
2. The Report Data Source Fields list contains the fields that are
available for use in your table. Select the Description,
Page 62

Chapter 4 Analyzing FactoryTalk Historian Classic Data
Step 3: Group the Records
3. Click Next.
The Grouping Levels dialog box allows you to specify how your
table will be grouped.
TimeStamp, and Value fields and then click to add the
selected fields to the Fields in report list.
Each field that you add to the list will be a column in your text
report object.
62 Rockwell Automation Publication HIST-UM001K-EN-E-June 2014
1. The fields that we added to the table are listed in the box on
the left side of the dialog box. We can group by any of these
fields. For this tutorial, let’s group the records by TimeStamp
and data point. Select the TimeStamp and Description fields
and click the right arrow button (>) to add fields to the
Grouped fields list on the right side of the dialog box.
2. We want to force the report to group the records by Part first,
so let’s make sure the TimeStamp field is at the top of the
Grouped fields list. If it is not, select TimeStamp and click
the up arrow Priority button (^) until TimeStamp is at the
top of the list.
Page 63

Analyzing FactoryTalk Historian Classic Data Chapter 4
Step 4: Sort the Records
3. Since we want to group the records by the hour portion of the
timestamp, select TimeStamp in the box on the right and
click the Grouping Interval button. The Format Field dialog
box is displayed. Select the HOUR format and click OK to
return to the Report Wizard.
4. Click Next to continue.
The Sort Order dialog box allows you to specify the order in which
the columns will be sorted and to calculate totals for columns. Since
we chose to group by TimeStamp and Description, those columns
automatically have a sort order applied to them.
Rockwell Automation Publication HIST-UM001K-EN-E-June 2014 63
1. To calculate the average downtime value, select the AVG
check box in the Downtime Seconds row.
Page 64
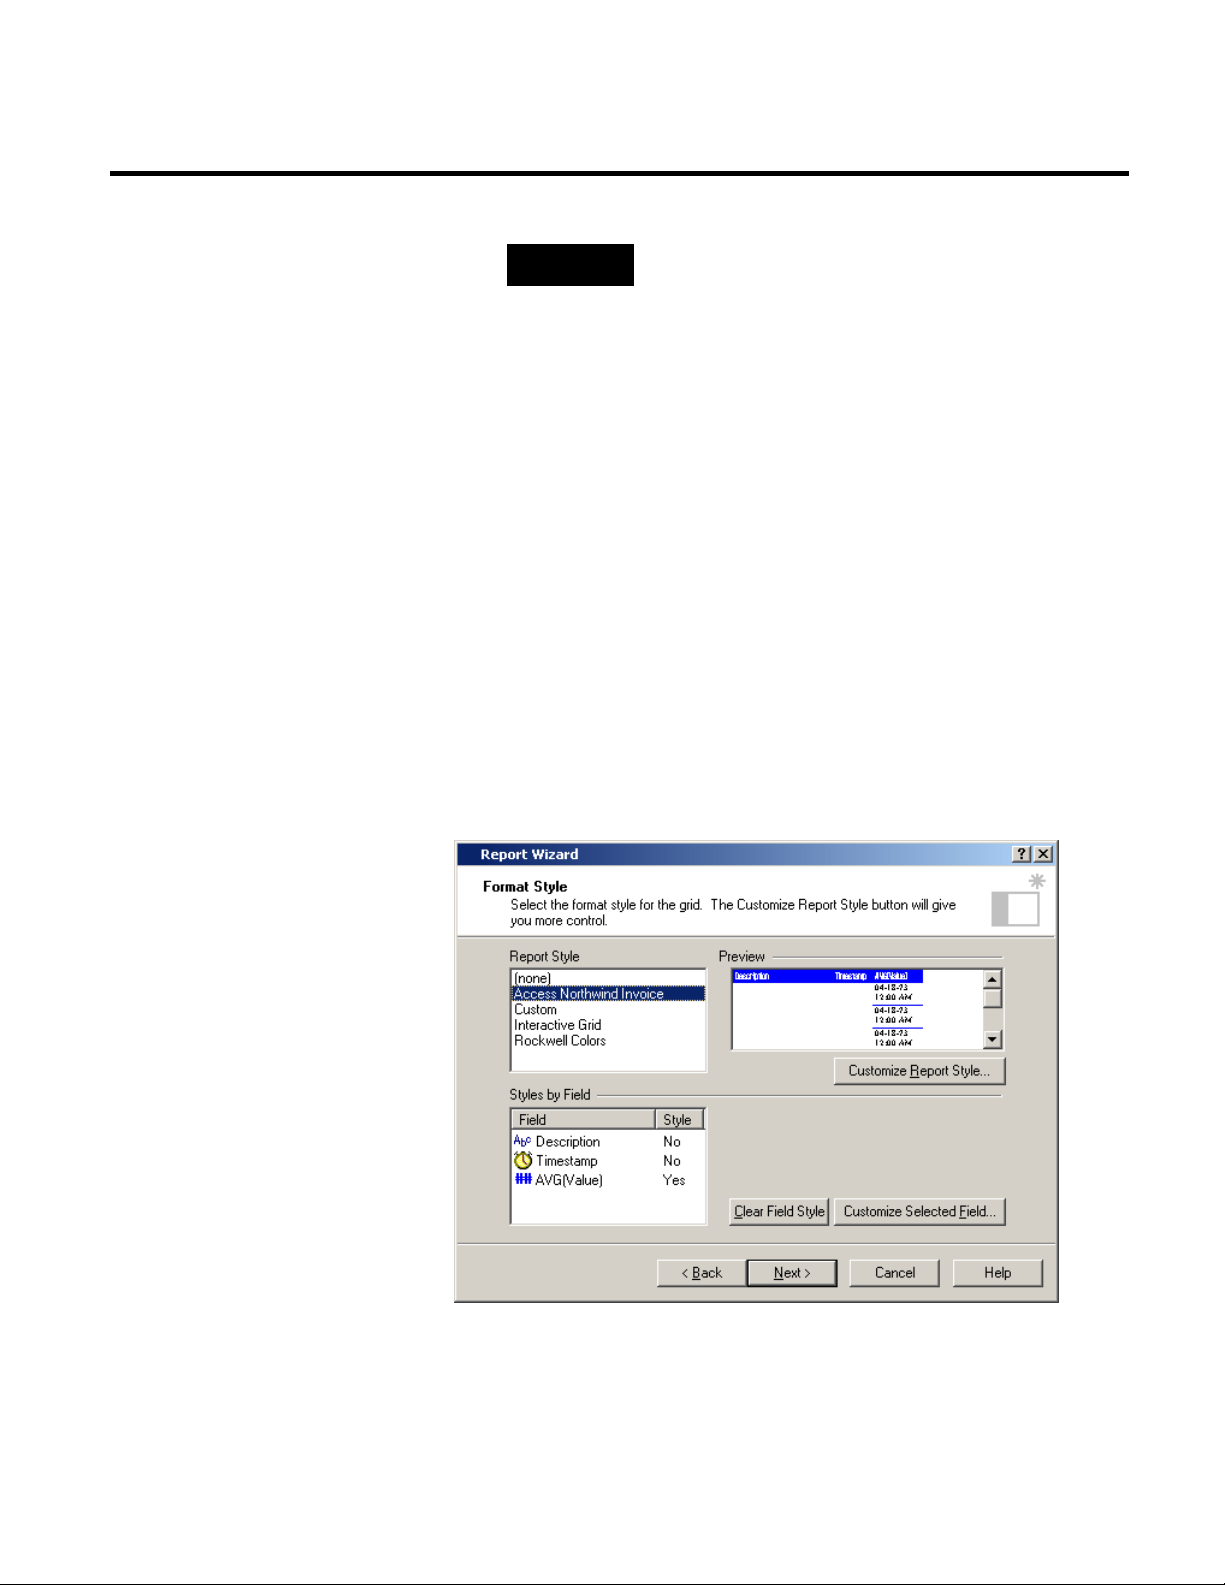
Chapter 4 Analyzing FactoryTalk Historian Classic Data
information.
Step 5: Format the Table
2. For this table, you are not interested in showing the individual
3. Click Next to continue.
NOTE
The weighted average (WAVG) function is an average that takes
into account the proportional relevance of each component
(typically over time), rather than treating each component
equally. Weighted average can be used in any table of
information where the values of a particular column should be
given more or less importance based upon the values of another
column. The weighted average function is ideal for calculating a
time-weighted average OEE value for multiple activity areas. See
the Weighted Average topic in online help for additional
detail records that make up the average downtime; you want to
see only the average downtime per work cell values. Select the
Summary Only option at the bottom of the dialog box.
The Format Style dialog box allows you to control the appearance of
the table.
64 Rockwell Automation Publication HIST-UM001K-EN-E-June 2014
1. The Report Style section of the dialog box lets you choose the
color scheme that will be applied to the table or to create a
custom style. For this tutorial, select the Access Northwind
Page 65

Analyzing FactoryTalk Historian Classic Data Chapter 4
Invoice style from the Report Style list. A sample of the style
is displayed in the preview window to the right of the list.
2. The Styles by Field section of the dialog box allows you to set
display formats for the individual fields. For this example,
specify the time formatting that is applied to the
AVG(Downtime Seconds) field. Select the field from the list
box and click Customize Selected Field. The Customize
Report Styles dialog box appears.
3. Click the Number tab.
4. Click the Apply the following formatting option and ensure
that No. of digits after decimal is set to 2.
5. Click OK to accept the values and return to the Report
Wizard.
6. Click Next to continue.
Rockwell Automation Publication HIST-UM001K-EN-E-June 2014 65
Page 66

Chapter 4 Analyzing FactoryTalk Historian Classic Data
Step 6: Name the Report Object
Step 7: Filter the Data
Step 8: Insert Your New Table Into the Report
On the Report Object Name page, you need to provide a unique
name for the report object.
1. For this tutorial, enter Historian Data Point View Table.
2. Click Next.
On the Filter page, you can use the same filter that you created for
the chart, or you can create a new one. For this tutorial, use the one
created before.
To filter the data:
1. Click Data Point Filter from the Filter list.
2. Click Next.
You have already selected the report data source, created the table
report object, and selected a filter. The Finish page appears.
To insert your new table into the report:
1. Click Finish to insert the report object.
2. To ensure that the filter is properly associated with the report
object, right-click the report object and then select Properties
from the shortcut menu.
3. On the Report Object Properties dialog box, select the
Runtime Settings tab and select the Workcell Description
Filter from the Default Filter list.
4. Click OK to return to the report object.
The table is displayed as a simple box in the report.
5. Double-click the box outline to view the table. As you did with
the chart, click the Time Range button on the Time Selection
toolbar and set the time range to 4/19/2005 9:00 AM to
4/19/2005 12:00 PM. Click Refresh to run the report object
66 Rockwell Automation Publication HIST-UM001K-EN-E-June 2014
Page 67

Analyzing FactoryTalk Historian Classic Data Chapter 4
Create a Time-series Chart
Step 1: Create the Report Object
Refer to "Customizing RSBizWare Charts and Tables (page 87)" for
information on how to further customize your chart by changing the
title or bar/line colors.
One of the primary features of FactoryTalk Historian Classic is the
ability to analyze time-series data. Any data value that is collected
over time is time-series data. A temperature or pressure value that is
collected over time is an example of time-series data. This tutorial
will help you understand how to use FactoryTalk Historian Classic
to analyze time-series process data.
To create a time-series chart on your report, place the cursor in the
report where you want the chart to appear and select Insert >
Time-Series Trend Chart from the main menu. When the
authoring user name and server prompt is displayed, click Yes to
accept the defaults. The Configure Time-Series Report Object
dialog box is the starting point for creating our time-series chart.
Rockwell Automation Publication HIST-UM001K-EN-E-June 2014 67
Page 68
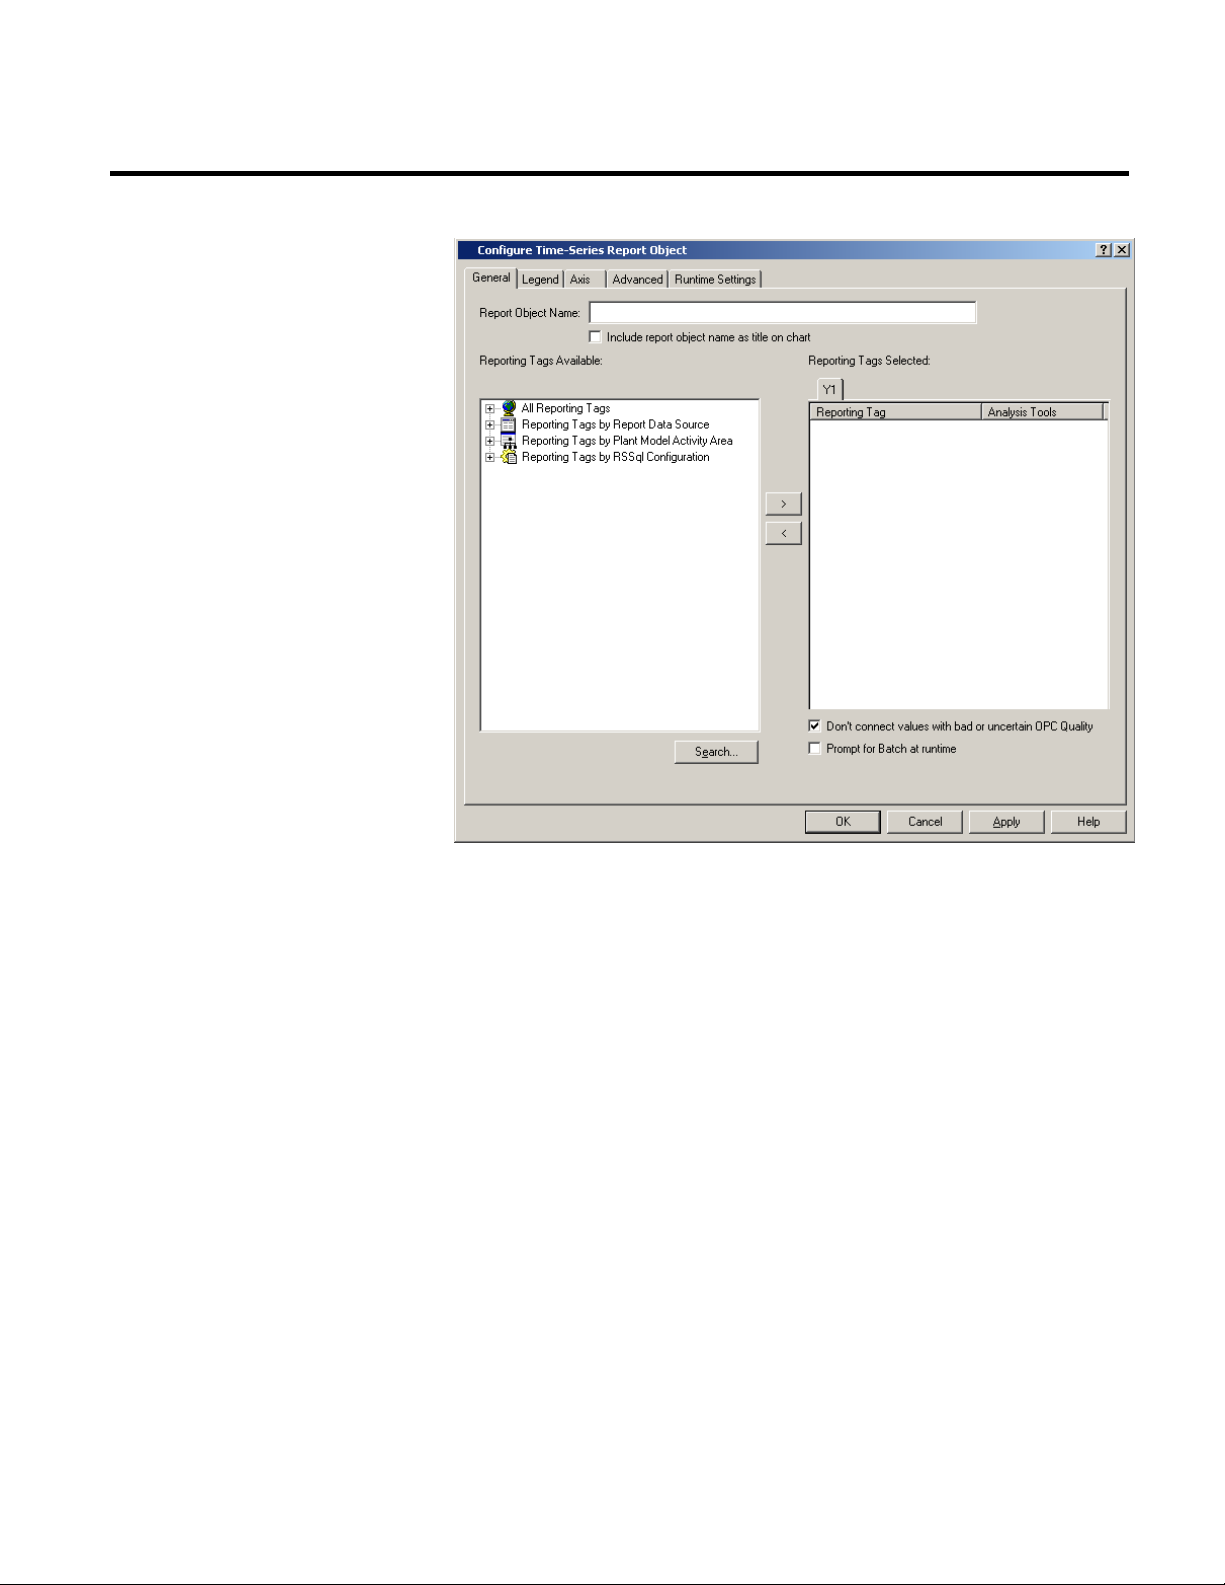
Chapter 4 Analyzing FactoryTalk Historian Classic Data
Step 2: Name the Report Object
Step 3: Add Reporting Tags
We must provide a unique name for our time-series chart. For this
tutorial, type
Time-series Chart in the Report Object Name box
and select the Include report object name as title on chart check
box. This will cause the name to be shown at the top of the
time-series chart. If you clear this check box, the chart title will
default to “Time-Series Analysis.”
Now, we must select the reporting tags that will be trended on our
time-series chart. A reporting tag is a field within a database table or
view that provides the values that will be charted on our time-series
chart.
The Reporting Tags Available list on the left side of the dialog box
contains the tags that can be added to the chart. The Reporting
Tags Selected list on the right side represents the tags that will be
68 Rockwell Automation Publication HIST-UM001K-EN-E-June 2014
Page 69

Analyzing FactoryTalk Historian Classic Data Chapter 4
Step 4: Apply an Analysis Tool
shown on the time-series chart. The tabs at the top of the Selected
list represent the Y-axes that are shown in our chart. For example, if
our chart contains two Y-axes, there will be two tabs at the top of the
Reporting Tags Selected list. Since we have just created this
time-series there is only one tab.
For this tutorial, let’s chart the FactoryTalk Historian Classic Demo
– Flow Rate reporting tag.
1. Expand the Reporting Tags by Report Data Source item in
the Reporting Tags Available list and find and expand the
Historian Data Point Default item. Finally, select the
FactoryTalk Historian Classic Demo – Flow Rate item.
2. Click the > button to add the selected reporting tag to the
Reporting Tags Selected list.
When creating a time-series chart, you may want to find the average
value of a reporting tag or apply some other analysis tool to the tag.
The Analysis Tools column in the Reporting Tags Selected list
shows the analysis tools that have been added to the reporting tags in
the chart.
1. To apply an analysis tool to a reporting tag in the time-series
chart, we will need to add the reporting tag to the list a second
time. Select the reporting tag from the Available list and click
the > button to add the tag to the Selected list again.
2. Now click the <None> text in the Analysis Tools column for
the second instance of the reporting tag. A list containing the
available analysis tools will display. Open the Statistics folder
and select the mean analysis tool from the list.
Rockwell Automation Publication HIST-UM001K-EN-E-June 2014 69
Page 70
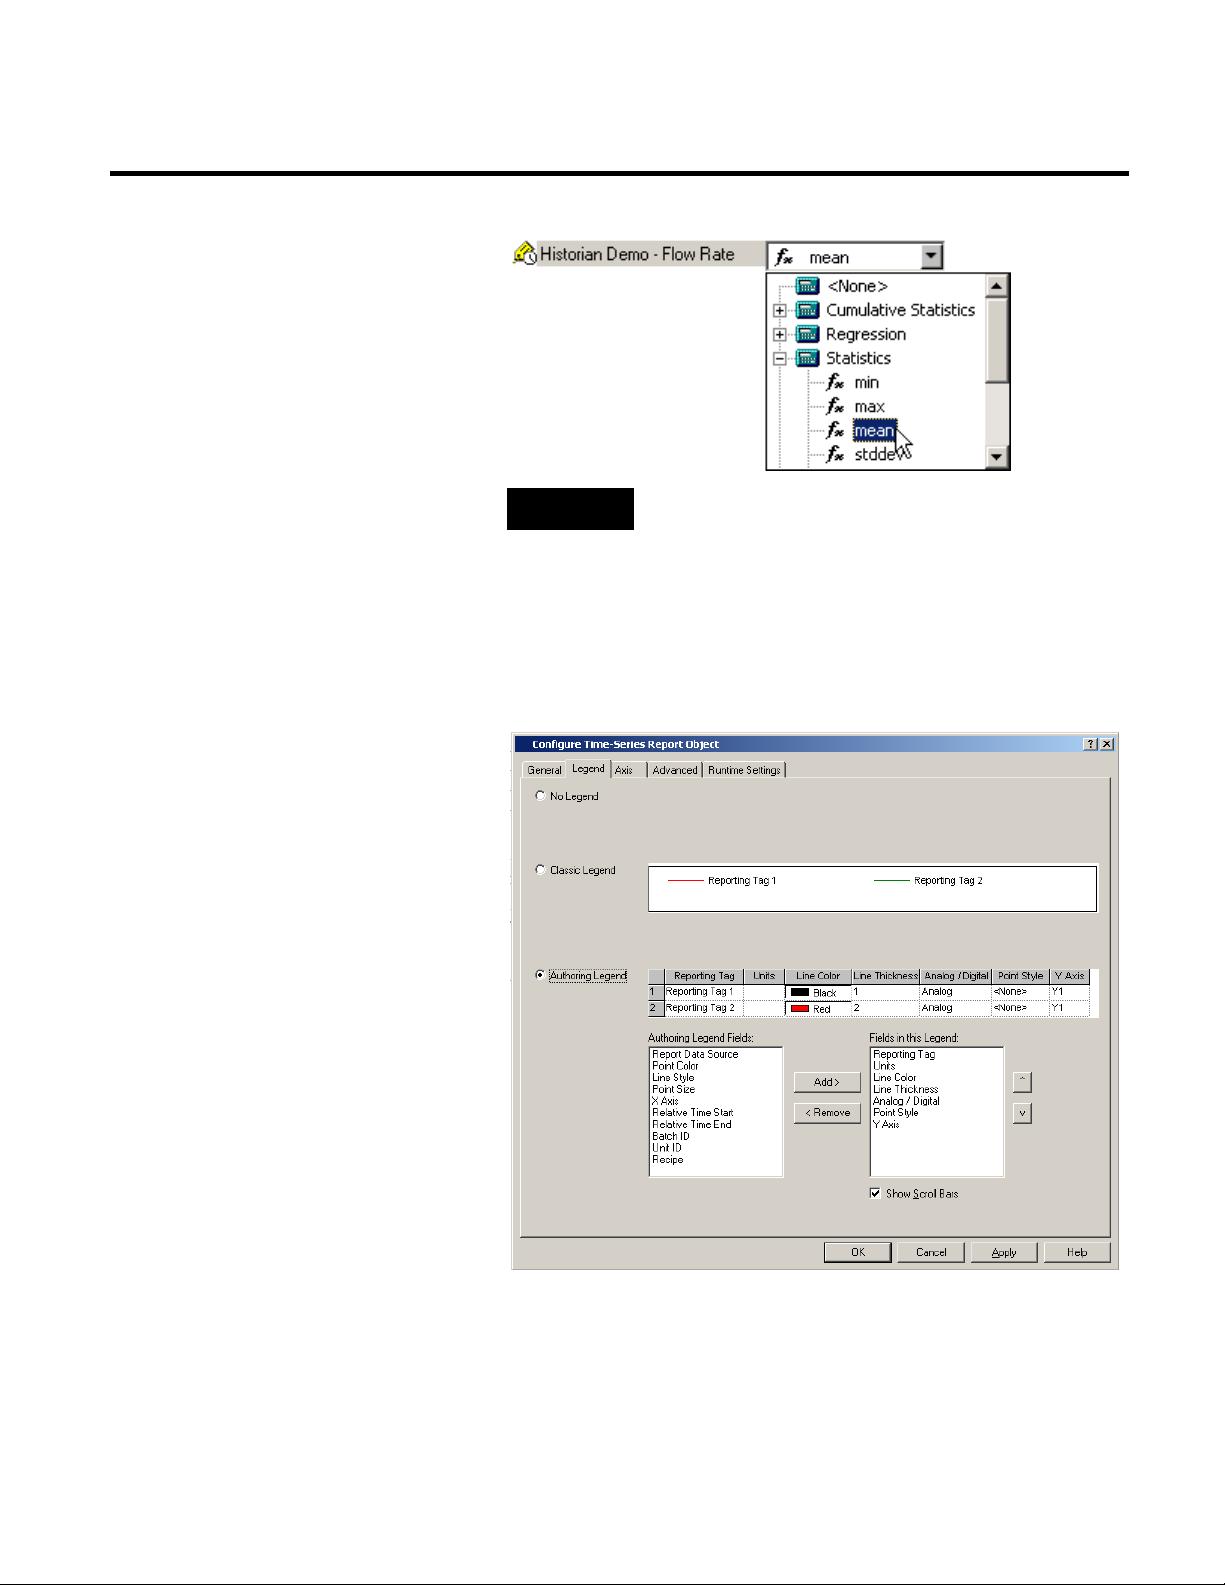
Chapter 4 Analyzing FactoryTalk Historian Classic Data
RSBizWare Charts and Tables (page 87)".
Step 5: Customize the Chart Legend
TIP
If you want to use the Configuration Console to chart a
calculation that is unique to your process, see "Customizing
1. Click the Legend tab. This tab enables you to specify the type
of legend that will be shown on the time-series chart. For this
tutorial, accept the default Authoring Legend option.
70 Rockwell Automation Publication HIST-UM001K-EN-E-June 2014
The Classic Legend is the traditional legend with a color
sample and display name for each reporting tag or analysis tool
that is shown on the chart. If you use the classic legend, report
Page 71

Analyzing FactoryTalk Historian Classic Data Chapter 4
Step 6: Insert Your New Chart Into the Report
Step 7: Adjust the Time Range
users will not be able to change pen colors, line thicknesses, or
other chart styles.
The Authoring Legend is a table that contains the properties
of the chart that you specify here. Users of your report will be
able to customize their view of the chart by changing the values
associated with these properties. This legend provides the
maximum amount of flexibility for your report users.
2. The Fields in this Legend list contains the names of the chart
properties that will be shown on your Authoring Legend. For
this tutorial, accept the defaults.
Click OK to add the time-series report object to the report. The
time-series chart will display in the report, but you will not see any
data in the chart. This is because the default time range for a
time-series chart is “the past 2 hours,” but the sample data was
collected between June 30, 1999 11:01 AM and June 30, 1999 1:31
PM. In the next section of the tutorial, we will learn to control the
time range for the data that will display in the chart.
Rockwell Automation Publication HIST-UM001K-EN-E-June 2014 71
When you create a new chart or table that is based on a time
selection-enabled report data source, the Time Selection toolbar
shown below will automatically appear at the top of the time-based
report object. The Time Selection toolbar acts like a filter on the
timestamp field that was designated for time selection when the
report data source was created.
The default time selection filter is the past 2 hours. Use the Time
Selection toolbar to define time ranges, start and end date/times, or
time increments for your time-based report objects. The Time
Selection toolbar provides the following buttons:
• The Refresh button
re-executes the report object based
upon the selections made in the Time Selection toolbar. When
Page 72
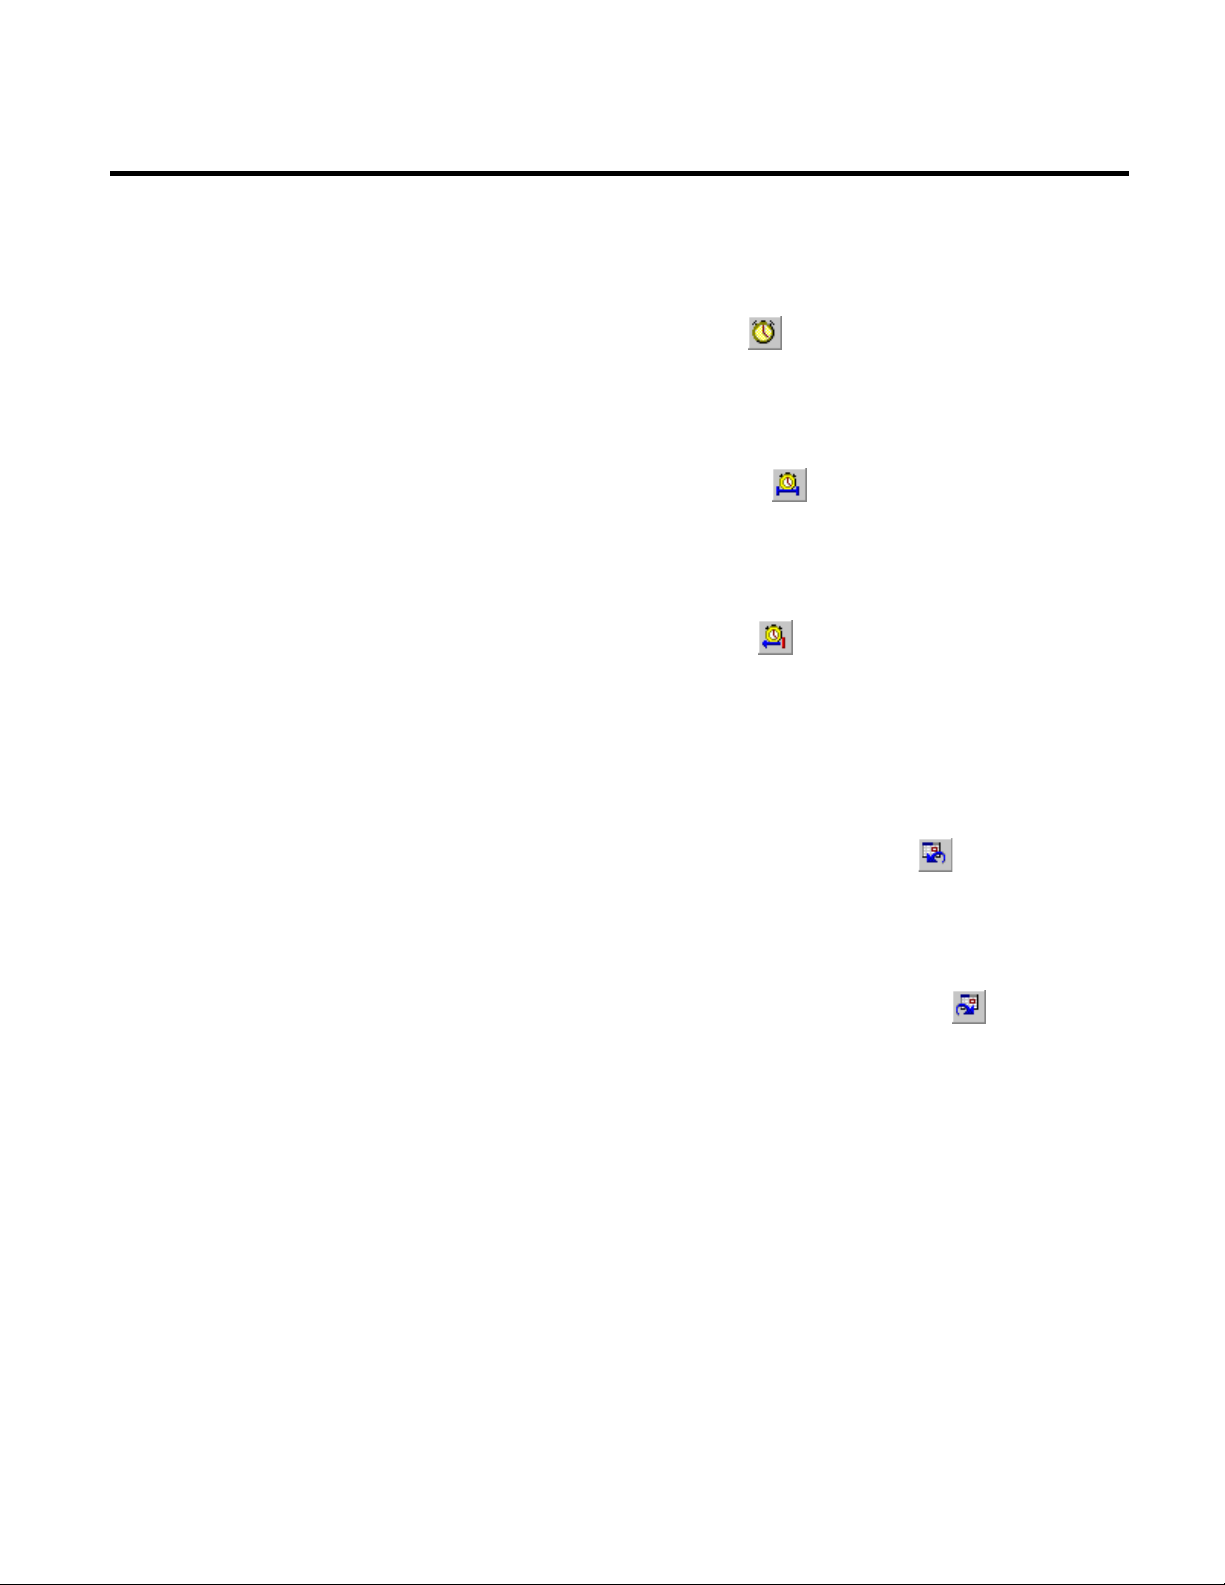
Chapter 4 Analyzing FactoryTalk Historian Classic Data
you make a change to the settings on the Time Selection
toolbar, you must click Refresh to view the change.
• The All Times button
is used to show all data that has
ever been collected, without specifying the start and end times.
This is especially useful if you do not know the start and end
date for which data has been collected.
• The Time Range button
enables you to specify the start
and end times to which the data will be restricted. Use this
button if you want to report only on data between a specific
beginning and ending time.
• The Time Span button
restricts time to the past by a
unit of time. This button is useful if you want to show all data
from the past 24 hours, the past 7 days, or the past year. When
you use this button with an auto-refresh chart and data that is
currently being collected, the chart will continue to refresh
with the current date/time as the end time.
• The Past Time from End Time button
uses a unit of
time before the specified end time. For example, this button is
useful if you want to show all data from the week before
August 2, 2005.
• The Future Time from Start Time button
uses a unit
of time after the specified start time. For example, this button
is useful if you want to show all data from the week after
August 2, 2005.
To change a date or time on the Time Selection toolbar, use the
drop-down arrow to the right of the field or type a value directly in
the field.
For our tutorial example, click All Times and then click Refresh. Your
table should look similar to the following:
72 Rockwell Automation Publication HIST-UM001K-EN-E-June 2014
Page 73
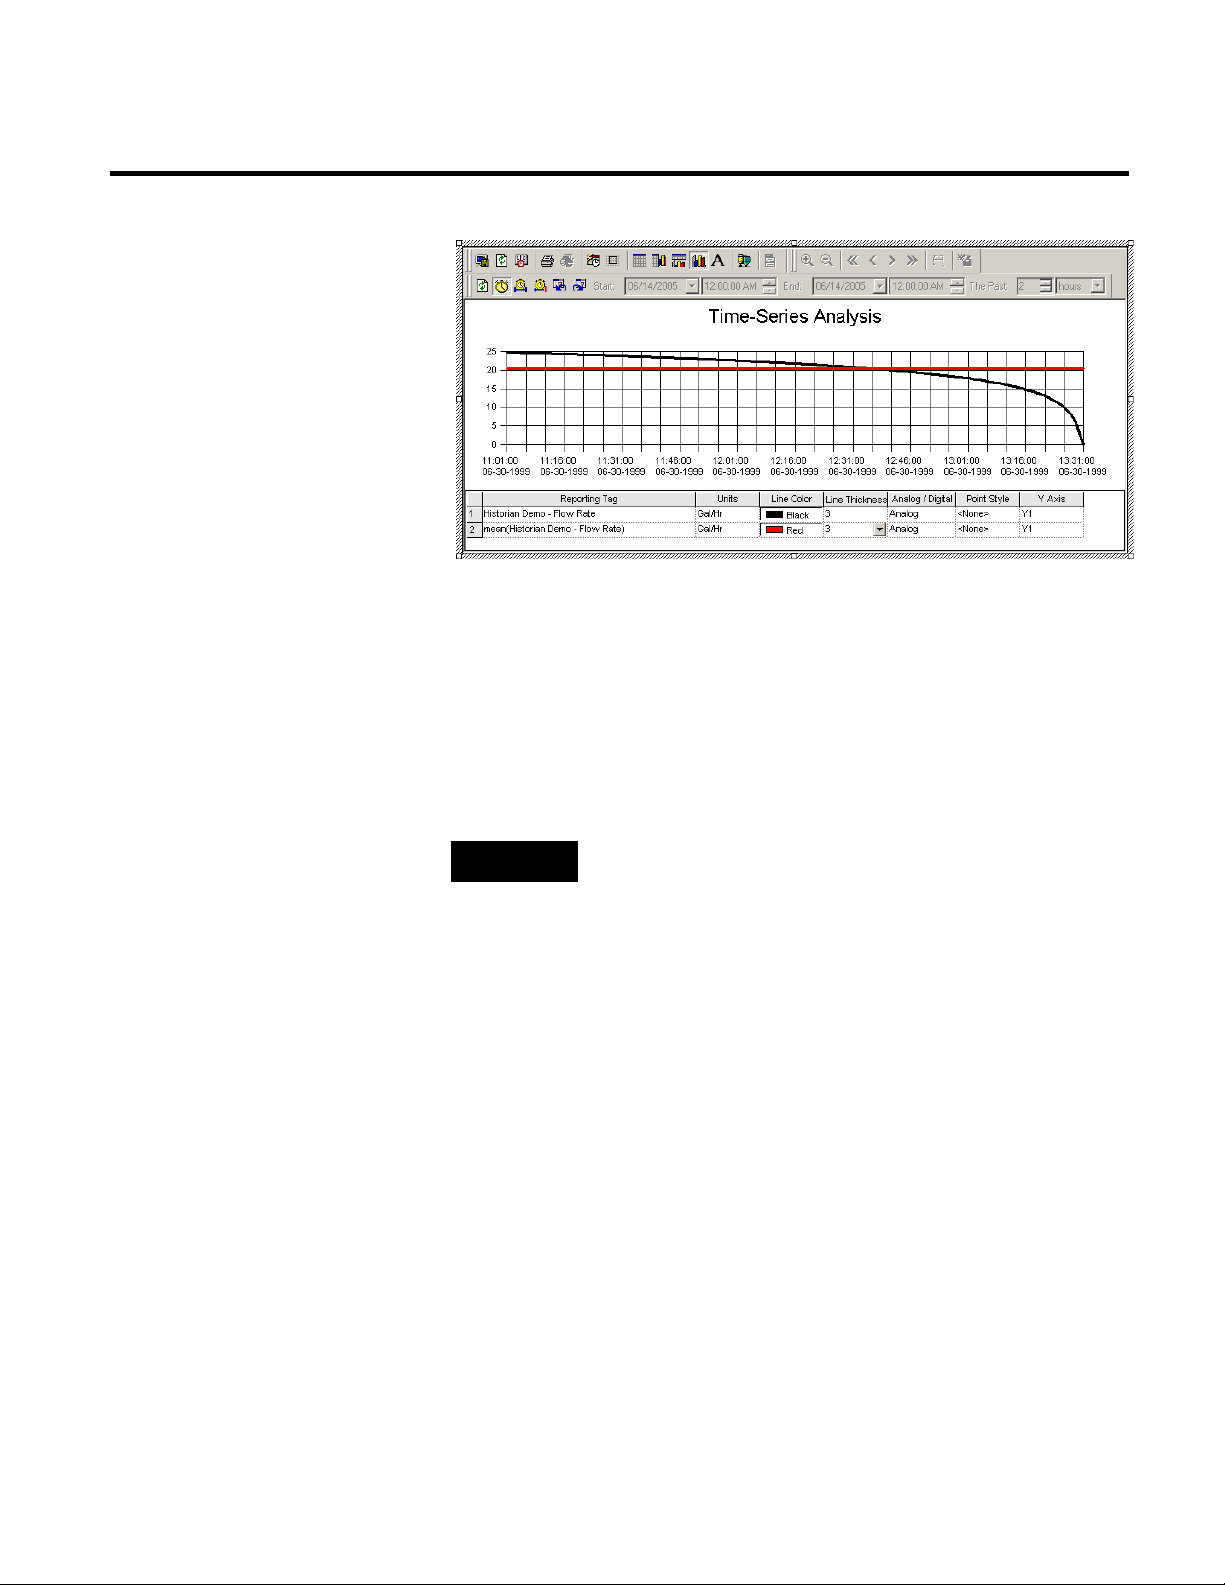
Analyzing FactoryTalk Historian Classic Data Chapter 4
task.
Step 3: Add Reporting Tags
When you save your report, the settings that you specified on the
Time Selection toolbar during report authoring will be saved with
the chart. These become the defaults for runtime users and they are
also used when you schedule the report object to be run at a later
date. Scheduling report objects and reports is discussed in Advanced
Reporting Topics (page 97).
NOTE
Although the Time Selection toolbar settings are used when you
schedule the report object, the scheduled output does not show the
Time Selection toolbar. To show the start and end times that are being
used in scheduled report objects, add start- and end-time dynamic text
fields to your report object. Refer to the Add Dynamic Text Fields To a
Report Object topic in the online help for the instructions to perform this
Now, let’s suppose we want to show the Flow Rate reporting tag and
the SUM(Flow Rate) analysis tool on a single chart. These two
reporting tags have very different value ranges; therefore, if we chart
the two reporting tags on the same Y-axis, the scaling of the graph
for SUM(Flow Rate) may distort the graph line for Flow Rate.
To isolate reporting tags or analysis tools with varying value ranges,
we can display one reporting tag on the original Y-axis, create a
second Y-axis on the same chart, and display the analysis tool on the
second Y-axis.
Rockwell Automation Publication HIST-UM001K-EN-E-June 2014 73
Page 74

Chapter 4 Analyzing FactoryTalk Historian Classic Data
1. Click the chart in the report work area and select View >
2. First, let’s remove the analysis tool that we added before. We
3. Click the Axis tab to display the Time-series Axis dialog box.
Properties from the main menu. The Configure Time-Series
Report Object dialog box will appear again.
will not need it for this example. Select the FactoryTalk
Historian Classic Demo – Flow Rate reporting tag that has the
mean analysis tool added to it and click the < button to
remove it from the Reporting Tags Selected list. You should
still have a single instance of the FactoryTalk Historian Classic
Demo – Flow Rate reporting tag in the Reporting Tags
Selected list.
This dialog box allows you to control the X- and Y-axis for the
time-series chart.
4. At the bottom of the dialog box, click the Add Axis button to
create a second Y-axis for the chart. The second Y-axis (Y2)
will appear as a second row in the Y-axis table at the bottom of
this dialog box.
74 Rockwell Automation Publication HIST-UM001K-EN-E-June 2014
Page 75
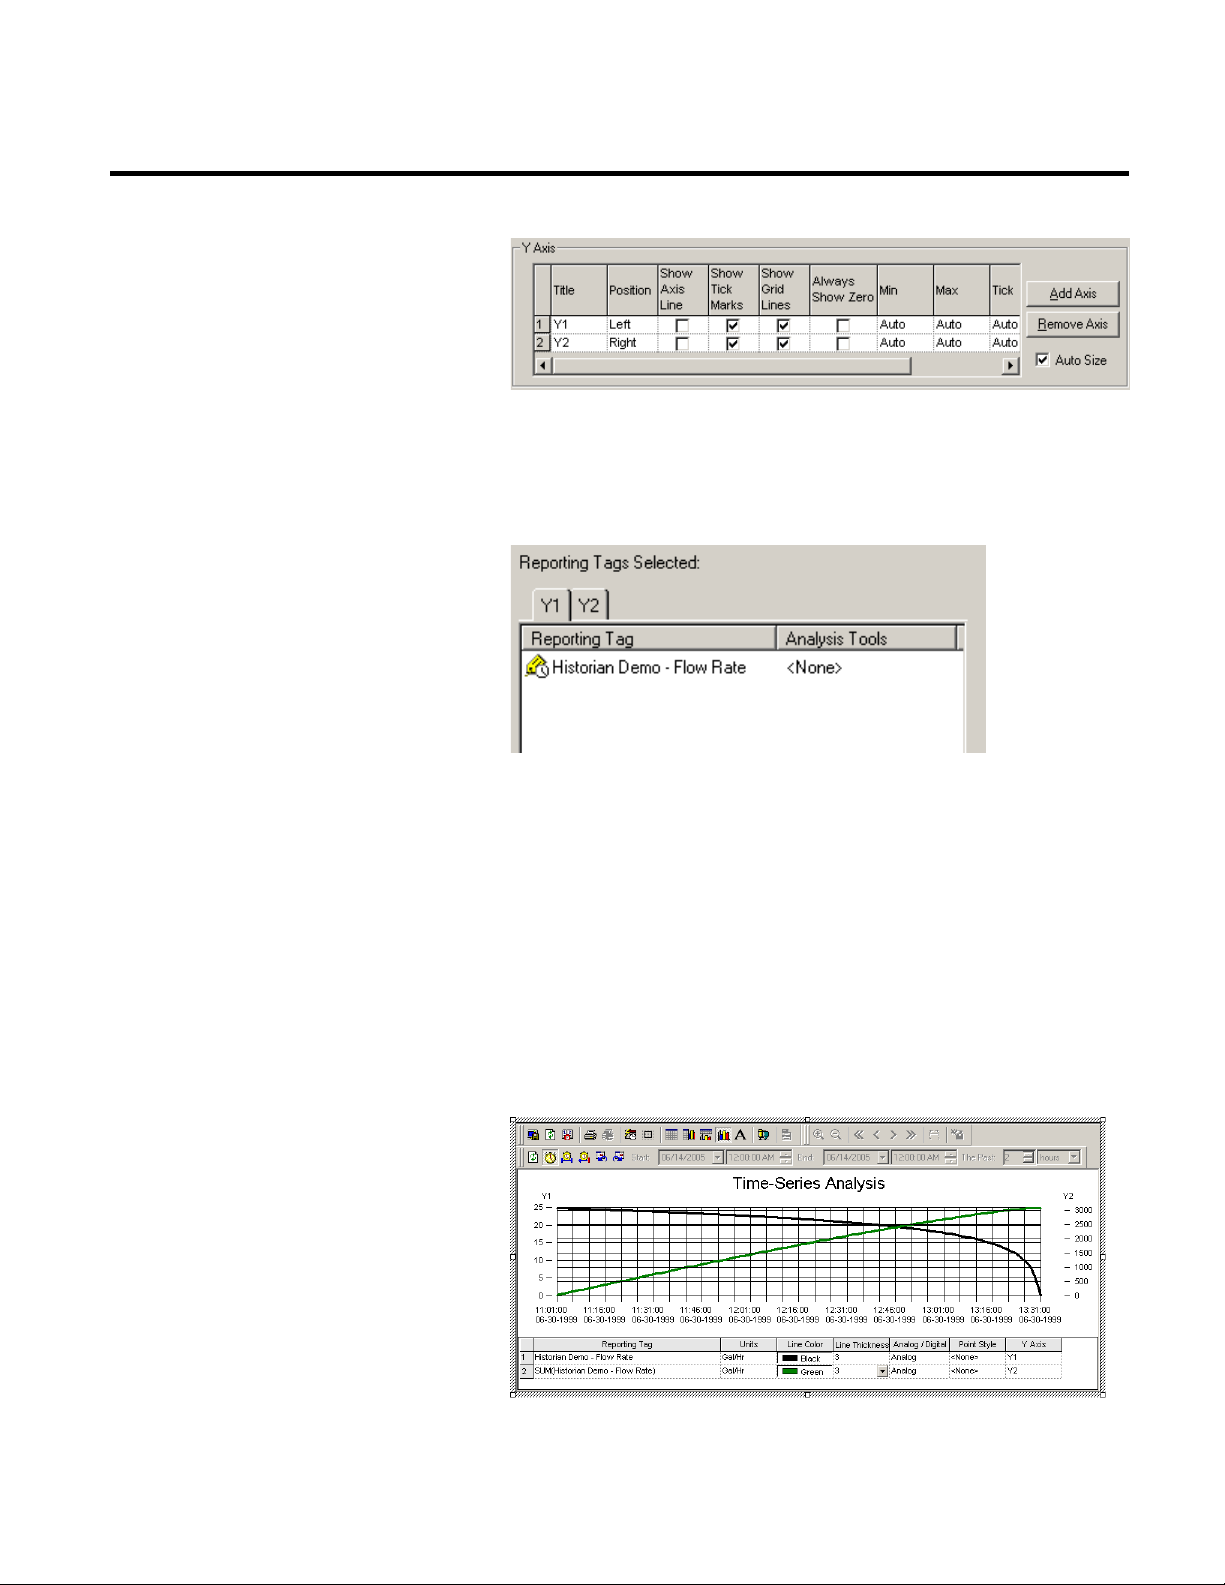
Analyzing FactoryTalk Historian Classic Data Chapter 4
5. Click the General tab. You will notice that there are now two
tabs at the top of the Reporting Tags Selected list. The Y2
tab represents the second Y-axis on the chart. Click the Y2 tab.
6. In the Reporting Tags Available list on the left, locate the
FactoryTalk Historian Classic Demo– Flow Rate reporting
tag and click the > button to add the reporting tag to the Y2
tab. Now add the SUM analysis tool. You will find the tool in
the Cumulative Statistics folder of the analysis tools list.
7. Click OK to close the dialog box and display your chart.
Double-click the report object, click the All Times button,
and click the Refresh button. Change the line color for the Y2
axis to Green. Your chart should look similar to the image
below.
Rockwell Automation Publication HIST-UM001K-EN-E-June 2014 75
Page 76

Chapter 4 Analyzing FactoryTalk Historian Classic Data
Step 9: Remove a Reporting Tag or an Analysis Tool
Create a Simple Batch/Event Chart
You will notice that the Y1 axis is shown to the left of the
chart and the Y2 axis is shown to the right of the chart and
that the value ranges for the two lines are very different. If you
had placed the SUM tool on the same Y-axis with the Flow
Rate, the large range of values for the SUM tool would have
distorted the FactoryTalk Historian Classic Demo – Flow
Rate line, making it appear deceptively flat, as shown below.
To remove a reporting tag or an analysis tool from your time-series
chart without opening the Configure Time-Series Report Object
dialog box, right-click the reporting tag (or analysis tool) in the
Authoring legend and select Remove Reporting Tag from the
shortcut menu that is displayed. The reporting tag or analysis tool is
removed from the chart and the chart is refreshed.
Let’s suppose that we are collecting the water temperature from a
process. The process allows the user to enter a Batch ID, specify the
kettle (or unit) in which to brew the coffee, and select a coffee
recipe. These batch parameters are collected from the control system
with FactoryTalk Transaction Manager transactions and are stored
in the BatchSummary table in the RSBizWare database.
We would like to be able to report on the water temperature from
the process by simply selecting one of these batch parameters, such as
the Batch ID that uniquely identifies the batch, rather than needing
to specify the start time and end time. Additionally, we would like to
be able to specify more than one batch to be displayed on the
76 Rockwell Automation Publication HIST-UM001K-EN-E-June 2014
Page 77

Analyzing FactoryTalk Historian Classic Data Chapter 4
Automation knowledgebase article titled “Simple Batch Reporting using
are recommended.
time-series chart in order to see how the batch performed as
compared to other similar batches or perhaps compared to an ideal
batch.
NOTE
This example is for simple batch reporting only. For more information on
setting up the batch parameter data collection, refer to the Rockwell
RSBizWare Historian 5.0.” For a fully-integrated S88-compliant batch
reporting system, FactoryTalk Batch and FactoryTalk Historian for Batch
1. To create a time-series chart on your report, place the cursor in
the report where you want the time-series chart to appear and
select Insert > Time-Series Trend Chart. The authoring user
name and server prompt is displayed. Click Yes to accept the
default user name and server.
2. The Configure Time-Series Report Object dialog box will
display. On the General tab, name the report object Batch
Analysis and select the Include report object name as title
on the chart check box.
3. Add the Water Temperature reporting tag to the time-series
chart by expanding the Reporting Tags by Report Data
Source item, expanding the Historian Data Point Default
item, selecting the Water Temperature tag, and clicking the >
button.
4. You can configure the time-series chart to prompt
automatically for the batch parameters by selecting the
Prompt for Batch at runtime check box at the bottom of the
dialog box. The user will be prompted automatically each time
this report object is displayed.
5. Now, let's change the Authoring Legend so that it lists the
batch parameters for the batches displayed in the chart. Click
the Legend tab. Make sure the Authoring Legend option is
selected. Select User Field 1, User Field 2, and User Field 3
in the Authoring Legends Field list and click the Add > button
to add the fields to the Fields
Rockwell Automation Publication HIST-UM001K-EN-E-June 2014 77
Page 78

Chapter 4 Analyzing FactoryTalk Historian Classic Data
6. in this Legend list. Select the three User Fields in the Fields in
7. To display the relative time of each batch, repeat the same
8. Click OK to close the dialog box and display your chart.
9. Double-click the report object and make sure the Time
this Legend list and use the arrow buttons to move these fields
up so that they immediately follow the Reporting Tag and
Units fields.
procedure to add the Relative Time Start and Relative Time
End fields to the Authoring Legend. Use the arrow buttons to
position these fields after User Field 3.
Selection toolbar is showing a date range that contains data for
the selected reporting tag. This step is important. If your chart
is not showing data, the Batch Prompt dialog box that will be
displayed in the next step will not show any batch prompt
fields. In this example, we can click the All Times button on
the Time Selection toolbar and then click the Refresh button
to display the line that represents the coffee temperature data.
10. This dialog box allows you to select one or more batches for
which you want to compare data without the need to specify
the start time and end time for each batch.
In the first row of the Batch Prompt grid, select the Water
Temperature reporting tag from the list of reporting tags that
have been added to the chart. Using the subsequent fields,
select the batch parameters to identify the batch you would
like to display. For this tutorial, select XYZ100 from the
78 Rockwell Automation Publication HIST-UM001K-EN-E-June 2014
Page 79

Analyzing FactoryTalk Historian Classic Data Chapter 4
actual batch XYZ100 with the IdealBatch, you should select batch
actual batch was run.
Add a Comment to a Value,
X
Time-series Chart
Batch ID field. If the selected value for a batch parameter field
is enough to identify the batch uniquely—as is the case with
the Batch ID field for the XYZ100 batch—the fields that
follow will be filled in for you.
TIP
The first batch selected will drive the time axis (X-axis) on the
time-series chart. So for example, if you wish to compare an
XYZ100 first so that the X-axis reflects the time range when the
11. In the second row of the Batch Prompt, again select the Water
Temperature reporting tag from the list of reporting tags and
select the batch parameters for the second batch you wish to
compare, in this case, XYZ101.
12. Click OK to return to the chart in your report.
The batch parameters as well as the start and end times for
both batches are displayed in the Authoring Legend. Notice
that the time axis is controlled by the first batch selected. You
will notice that the values along the X-axis are actual clock
times. If you want to see the times that the data values were
collected relative to the start of the batch (for example, where
the data value at 00:00:04 on the X-axis represents data that
was collected 4 seconds after the start of the batch), select the
Elapsed Time option on the Axis tab of the Configure Time
Series Report Object dialog box.
-axis, or Y-axis on a
Rockwell Automation Publication HIST-UM001K-EN-E-June 2014 79
1. Time-Series Reporting Tag Annotation allows you to select a
value in a time-series chart in the Configuration Console or
the Quick Web and associate a comment with that value.
There are three different types of Time-Series Reporting Tag
Annotations: value comment, X-axis comment, and Y-axis
comment.
2. For example, suppose you noticed a spike in the data on the
time-series chart that was caused by an operator who
accidentally kicked out the power cord on the machine from
which the data was being collected. When report users see this
chart, they will want to know what caused the spike. Tag
Page 80
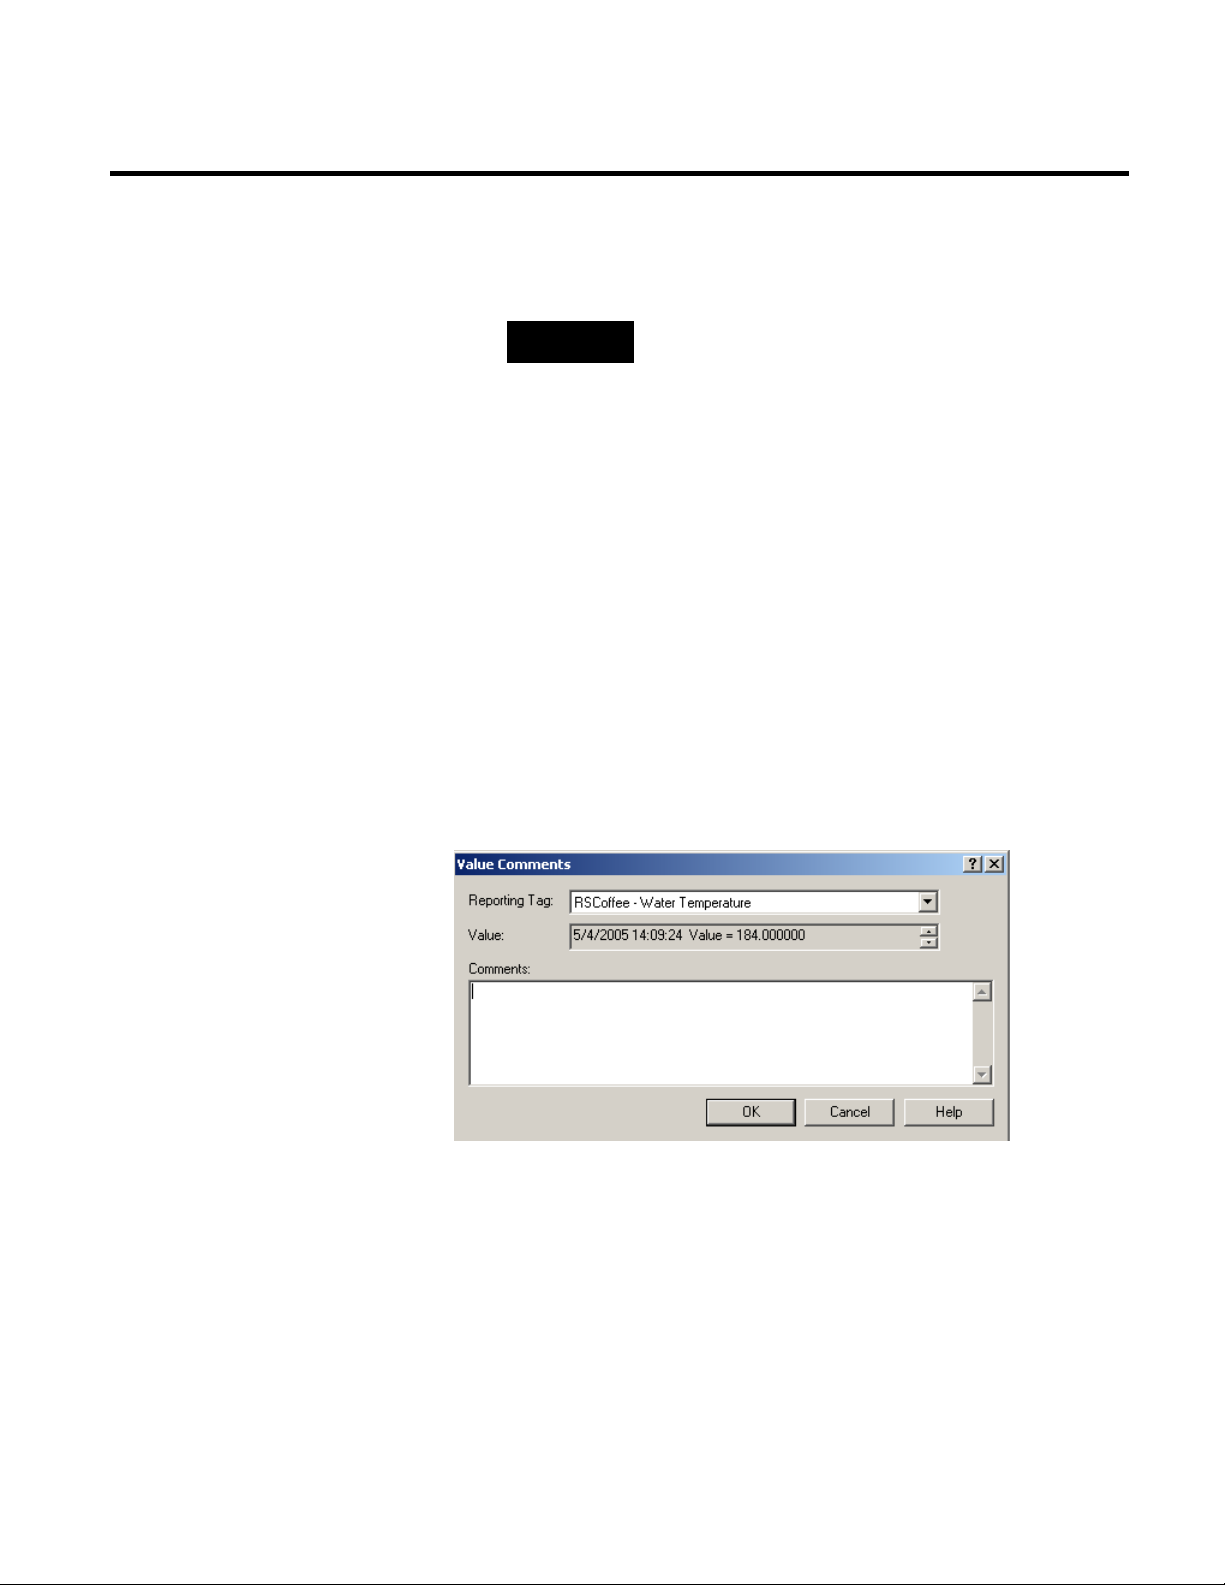
Chapter 4 Analyzing FactoryTalk Historian Classic Data
required.
Value Comments
annotation will enable you to supply information about this
spike to other report users.
NOTE
You must have the Add Time-Series Comment application-level
privilege to perform tag annotation. An Author license is not
A value comment is a comment that is associated with a specific
value within a reporting tag. The value comment provides an
explanation of why the value of a process parameter has deviated
from the norm. For example, a value comment will enable us to
document the spike in our time-series data caused by the power
interruption.
Right-click a point on the Batch Analysis chart from the preceding
section and select Add Comment > Value from the shortcut menu
to display the Value Comments dialog box. It will enable you to
enter a comment for a single value in the time-series chart.
80 Rockwell Automation Publication HIST-UM001K-EN-E-June 2014
1. The Reporting Tag list will default to the reporting tag nearest
to where you right-clicked in the time-series report object.
Select the reporting tag to which you want the comment to be
applied.
2. The Value field will default to the value nearest to where you
right-clicked in the time-series chart. Select the exact value to
which you want the comment to be applied.
Page 81
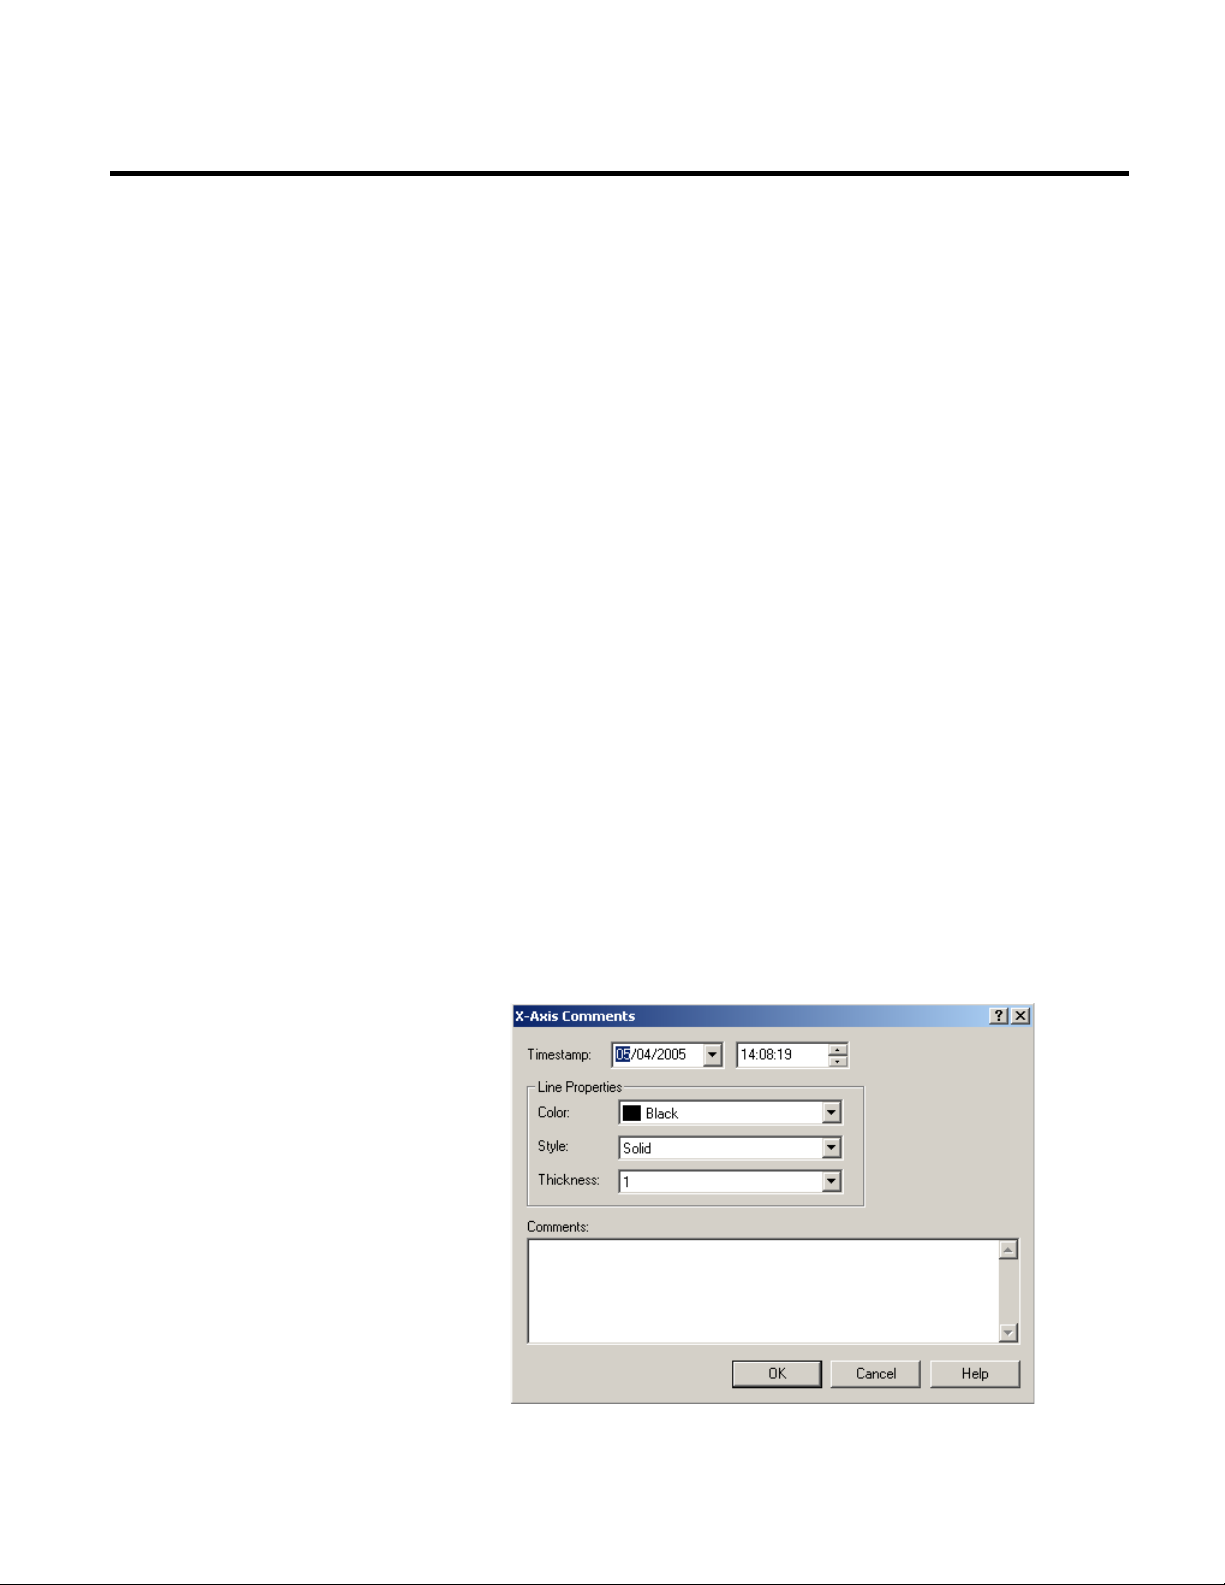
Analyzing FactoryTalk Historian Classic Data Chapter 4
X-axis Comments
3. Enter the text of your comment, which is restricted to 255
characters.
4. Click OK to save your comment and close the dialog. The
comment is saved in the reporting tag along with the
date/time when the comment was added and the ID of the
user who entered the comment.
On future displays of this reporting tag, a numbered yellow marker
will indicate the annotated value. When the report user hovers the
mouse pointer over the annotated value, a tool tip will display the
text of the comment. The value comment will show up in every
report object that displays the selected reporting tag value.
An X-axis comment is a comment associated with a specific
date/time on the chart and is not associated with a reporting tag.
The X-axis comment provides a date/time limit on the time-series
chart. For example, when tracking the flow rate, an X-axis comment
allows you to indicate the start of the batch.
1. Right-click the start time of the batch in the chart and select
Add Comment > X-Axis from shortcut menu to display the
X-Axis Comments dialog box. This dialog box will allow you
to enter an X-axis comment for the time-series chart.
Rockwell Automation Publication HIST-UM001K-EN-E-June 2014 81
Page 82

Chapter 4 Analyzing FactoryTalk Historian Classic Data
Y-axis Comments
2. The Timestamp field will default to a date and time nearest to
3. Use the lists in the Line Properties area to specify the color,
4. Enter the text of your comment, which is restricted to 255
5. Click OK to save your comment and close the dialog box. The
where you right-clicked in the time-series chart. Select the
exact date and time to which you want the X-axis comment to
be applied.
style, and thickness of the line that will be used to indicate
your start of batch.
characters.
comment is saved in the report object along with the
date/time when the comment was added and the ID of the
user who entered the comment.
On future displays of this time-series chart, a vertical line and
numbered yellow marker will indicate the annotated value. When
the report user hovers the mouse pointer over the annotated value, a
tool tip will display the text of the comment. The X-axis comment
will be displayed only on the report object where it was created
A Y-axis comment is a comment that is associated with a specific
value on the chart and is not associated with a reporting tag. The
Y-axis comment provides a value limit on the report object. For
example, when tracking the temperature during a batch process, a
Y-axis comment allows you to indicate the maximum acceptable
temperature for the batch process.
1. Right-click the maximum temperature in the chart and select
Add Comment >Y-Axis from shortcut menu to display the
Y-Axis Comments dialog box. This dialog box will allow you
to enter a Y-axis comment for the time-series chart.
82 Rockwell Automation Publication HIST-UM001K-EN-E-June 2014
Page 83
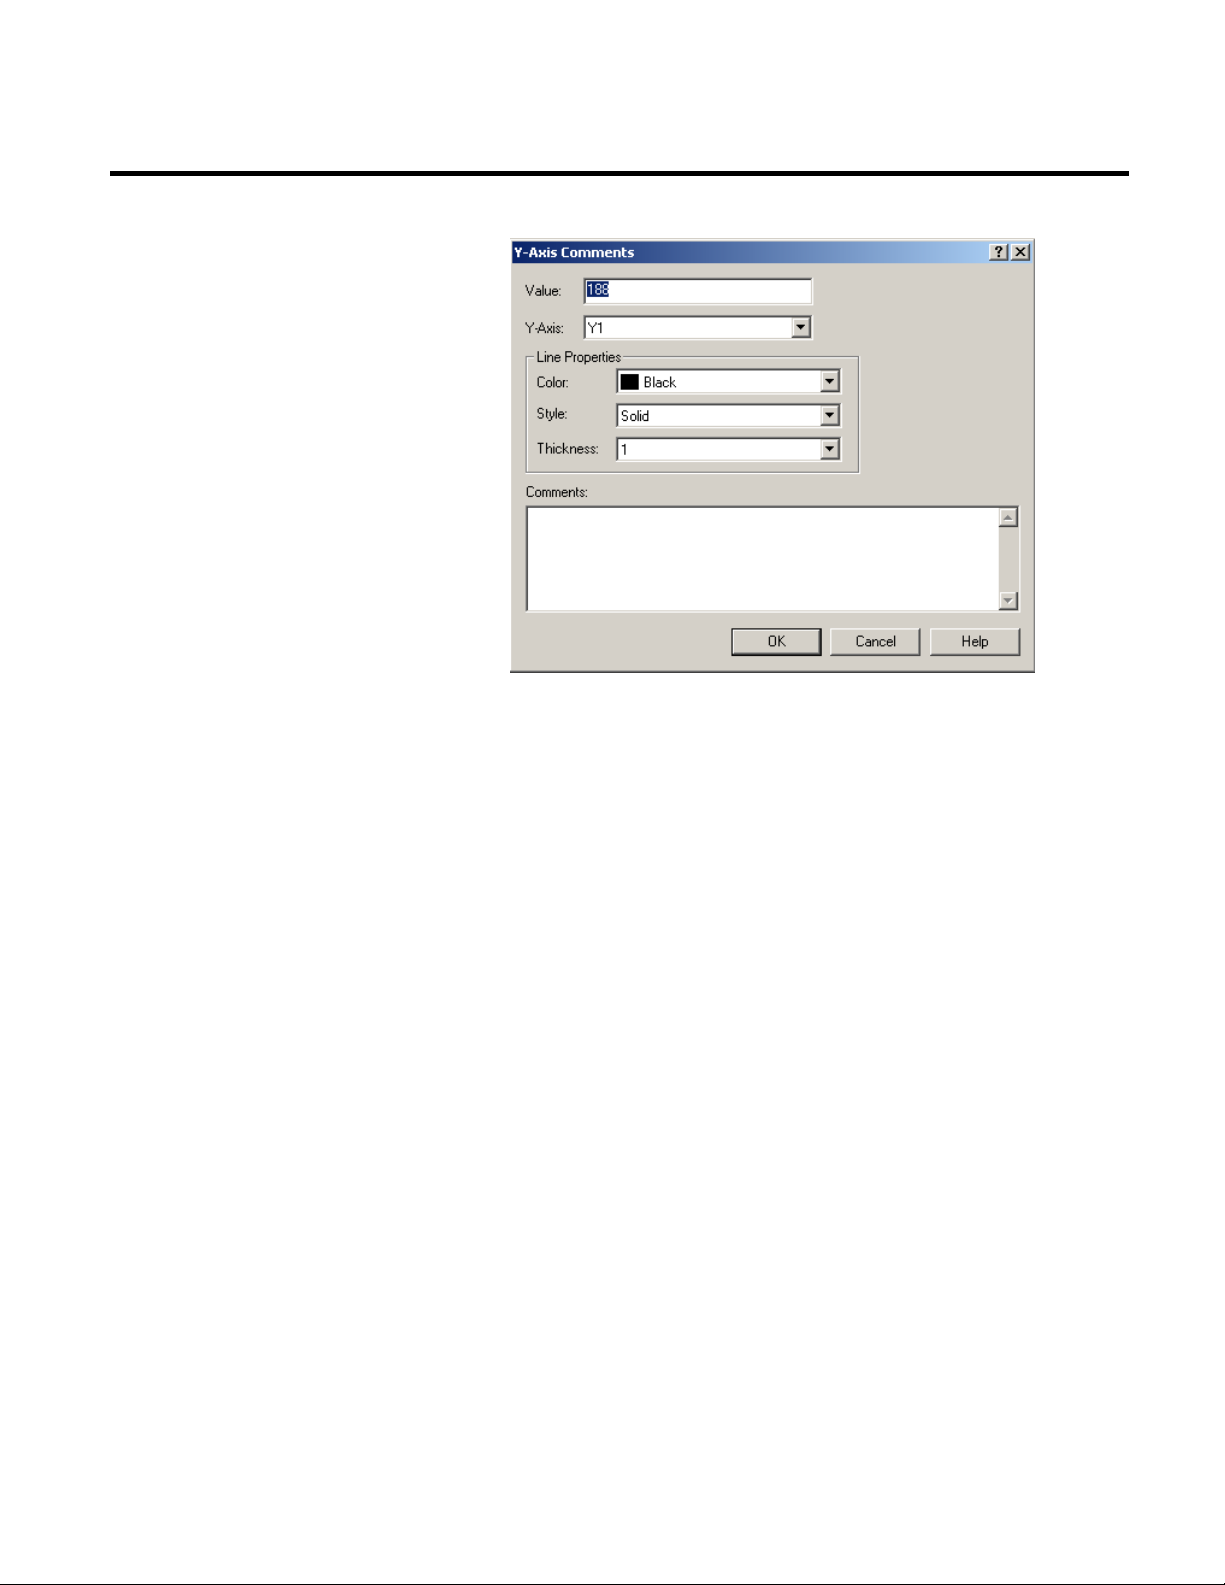
Analyzing FactoryTalk Historian Classic Data Chapter 4
2. The Value field will default to the value nearest to where you
right-clicked in the time-series chart. Select the exact value to
which you want the Y-axis comment to be applied.
3. Because time-series charts can have multiple Y-axes, you will be
able to associate this comment with a specific Y-axis. Select the
Y-axis with which you want to associate your comment.
4. Use the lists in the Line Properties area to specify the color,
style, and thickness of the line that will be used to indicate
your start of batch.
5. Enter the text of your comment, which is restricted to 255
characters.
6. Click OK to save your comment and close the dialog box. The
comment is saved in the report object along with the
date/time when the comment was added and the ID of the
user who entered the comment.
On future displays of this time-series chart, a horizontal line and
numbered yellow marker will indicate the annotated value. When
the report user hovers the mouse pointer over the annotated value, a
tool tip will display the text of the comment. The Y-Axis Comment
will be displayed only on the report object where it was created.
Rockwell Automation Publication HIST-UM001K-EN-E-June 2014 83
Page 84

Chapter 4 Analyzing FactoryTalk Historian Classic Data
Ad Comment As
Export the Report to HTML
While the ability to add comments is restricted by an
application-level privilege, the Add Comment As menu item will be
enabled for all users. The Add Comment As feature allows a second
user to add comments without ending the first user’s Configuration
Console or Quick Web session.
For example, if you are viewing a time-series chart in the
Configuration Console or the Quick Web and you recognize a data
value to which a comment needs to be attached but you have not
been assigned the Add Time-Series Comment privilege, you can ask
a supervisor or another user who has the privilege to add the
required comment.
The second user will simply right-click the value in the chart and
select Add Comment As > Value Comment from the shortcut
menu. The Comment Login dialog box is displayed, prompting the
user to enter his user name and password to create a temporary
connection to the server. After he has obtained a temporary
connection to the server, he can enter the required comment. When
he presses OK to close the comment dialog box and save his changes,
his user ID is stored with the comment text and his temporary
connection to the server is terminated.
84 Rockwell Automation Publication HIST-UM001K-EN-E-June 2014
When you save your RSBizWare report to the Report Explorer, the
report is saved on the Information Services Manager to which you
are connected. If you want to open and edit your report in an
HTML editor or make the page part of a website, you need to export
the report to an .htm file.
To export the report to HTML:
1. On the File menu, click Export To File.
The Save As dialog box appears.
2. Navigate to the location, in which you want to save the report.
3. In the File name box, type a name for the report file.
Page 85
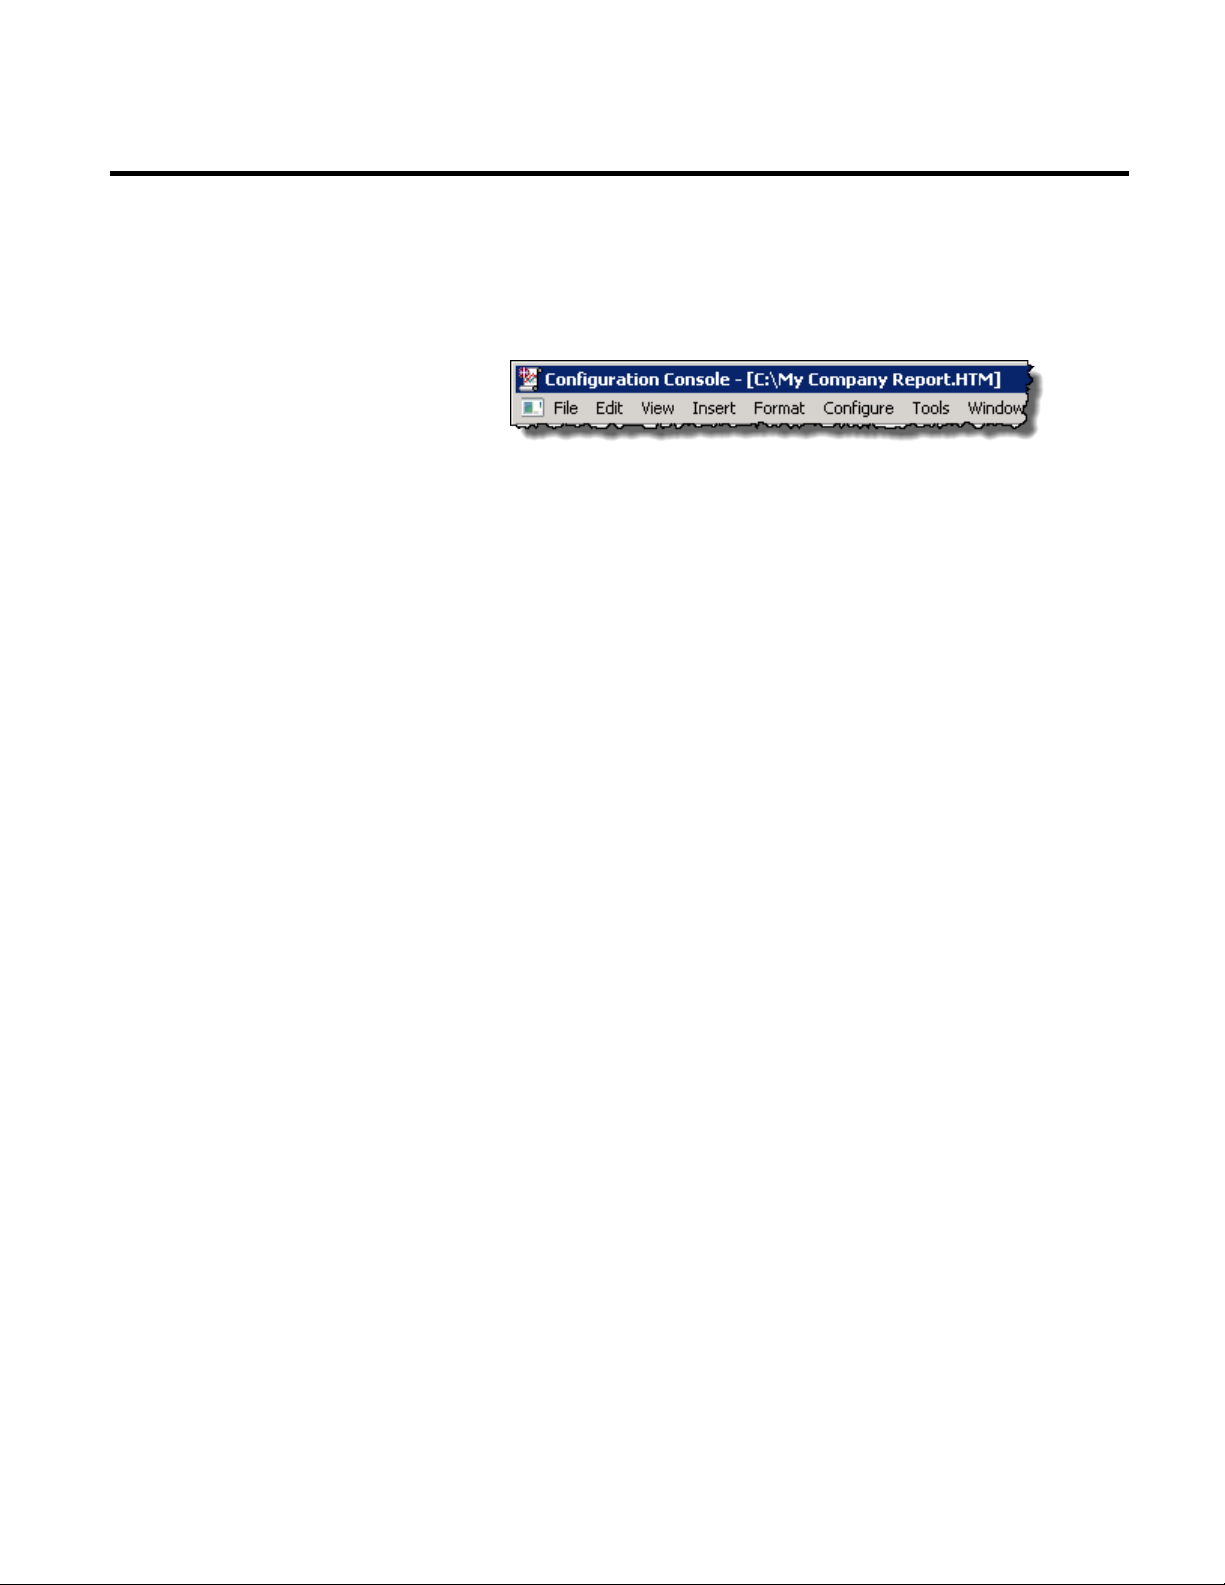
Analyzing FactoryTalk Historian Classic Data Chapter 4
Load the Report From File
In this example, the name is My Company Report.
The name of the file and its location is displayed on the title
bar of the Configuration Console.
You now have two copies of the report: one saved as an .htm
file, and the other stored in the Information Services Manager.
The .htm file contains text and some RSBizWare ActiveX
controls. You can edit it in an HTML editor.
Once you modify your report in an HTML editor, you can import it
to the Configuration Console.
To load the report from an HTML file:
1. On the File menu, click Load from File.
The Open dialog box appears.
2. Find you report file, and then click Open.
The report is displayed in the Configuration Console.
3. Save the file as an RSBizWare report (page 44).
4. The report is now available on the Information Services
Manager computer.
Rockwell Automation Publication HIST-UM001K-EN-E-June 2014 85
Page 86

Chapter 4 Analyzing FactoryTalk Historian Classic Data
86 Rockwell Automation Publication HIST-UM001K-EN-E-June 2014
Page 87

Customizing Charts
Chapter 5
Customizing RSBizWare Charts and Tables
This chapter will help you understand how to customize charts and
tables that have been added to RSBizWare reports. For this example
it is assumed that you have:
• An RSBizWare report containing chart and table report
objects open in the Configuration Console.
A FactoryTalk Historian Classic Author license. Furthermore, it is
assumed that you have Edit Report and Edit Report Object
permissions for the report and the report objects with which you are
working. The examples in this chapter use two of the report objects
that we created in "Analyzing FactoryTalk Historian Classic Data
(page 41)".
You can customize the appearance of the chart in your RSBizWare
report by changing the styles used in the chart, the size of the legend,
the font that is used in the title, the color of the background, and
much more.
Rockwell Automation Publication HIST-UM001K-EN-E-June 2014 87
Page 88
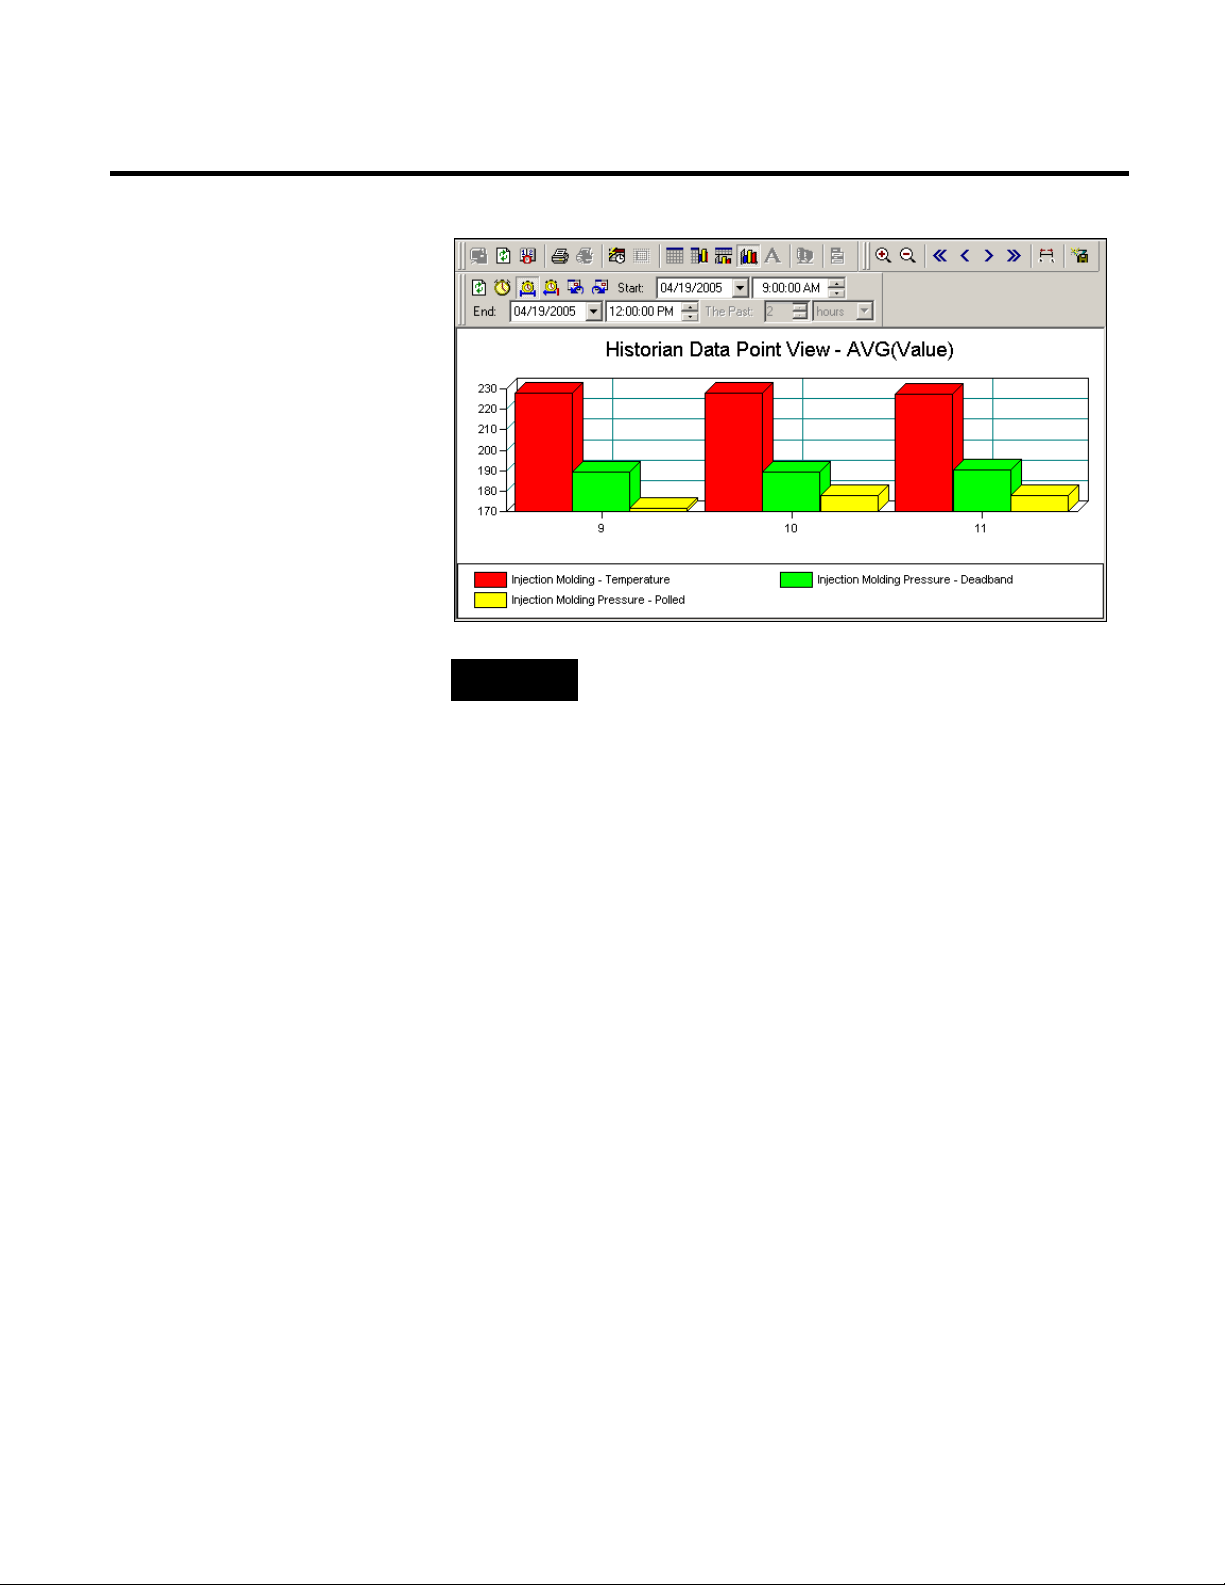
Chapter 5 Customizing RSBizWare Charts and Tables
changes you have made.
Working With the Component Parts of a Chart
NOTE
When you make modifications to a report object, all instances of the
report object (such as those on other RSBizWare reports) will reflect the
Charts typically consist of three components: a title at the top, a
chart in the middle, and a legend at the bottom. The default layout is
fine for most charts, however, you can also change the layout of your
chart if needed. Perhaps the legend would fit better in another place
on the chart, or the legend should be resized because it is too small to
show all of the legend keys.
A chart component must be in edit mode in order to be modified.
To set a chart component in edit mode:
1. Make sure your RSBizWare report is in design mode.
2. Click the chart.
88 Rockwell Automation Publication HIST-UM001K-EN-E-June 2014
The edit mode on the chart is enabled, and the component will
have eight resizing handles and a highlighted border,
indicating that it is ready to be modified.
3. Click the individual chart components and put them in edit
mode.
Page 89

Customizing RSBizWare Charts and Tables Chapter 5
Resizing a Component
Moving a Component
Deleting a Component
Editing the Chart Title or Text Field
When you finish working with the chart component, click
outside the chart to remove the resizing handles and
highlighted border.
To resize a component:
1. Make sure that the sizing handles and highlighted border are
visible around the component.
2. Point to one of the sizing handles, and when the cursor
changes to
, drag the handle until the component is the
desired size.
To move a component:
1. Make sure that the sizing handles and highlighted border are
visible around the component.
2. Point to the highlighted border, and when the cursor changes
to
, drag the component to the new location.
To delete a component:
1. Make sure that the sizing handles and highlighted border are
visible around the component.
2. Right-click the component, and then click Delete or press the
Delete key on your keyboard.
Rockwell Automation Publication HIST-UM001K-EN-E-June 2014 89
To edit a chart title or a text field:
1. Make sure that the sizing handles and highlighted border are
visible around the component.
2. Right-click the chart title or text field, and then click Edit
Text.
The Set Text dialog box appears.
3. Modify the text and then click OK to save your changes.
Page 90

Chapter 5 Customizing RSBizWare Charts and Tables
Changing Chart Component Properties
Working With Chart “Pens”
Customizing Text Report Objects
Examples of standard properties that you can change for chart
components are border style and font style. In addition to the
standard properties, each chart component type has some specific
properties that relate only to its type. For example, the chart legend
has properties that specify how the keys will be displayed within the
legend.
To access the property page for a chart component:
1. Make sure that the sizing handles and highlighted border are
visible around the component.
2. Right-click the chart component and then click Chart Object
Properties.
When you create a chart, the bars, pie slices, or lines of the chart are
drawn with a default style. To make the chart easier to read or more
appealing to users, you can change the color, formatting, and size of
the data series used. For example, you can change the thickness of
the lines in your X-Y chart to make them easier to see.
To customize the chart styles:
1. Make sure that the sizing handles and highlighted border are
visible around the component.
2. Right-click the line, bar, or pie slice that you want to modify,
and then on the shortcut menu click the desired option. The
options available vary depending on what component type
(line, bar, or pie slice) your chart uses. If your chart has an
authoring legend, you can also use the chart property fields
added to the authoring legend to customize colors and styles.
When your RSBizWare report contains a text report object or table,
you can interactively show/hide, resize, and rename the columns,
change the grouping and sorting of the columns, and apply aggregate
functions to them. These are shortcuts to features that are normally
90 Rockwell Automation Publication HIST-UM001K-EN-E-June 2014
Page 91
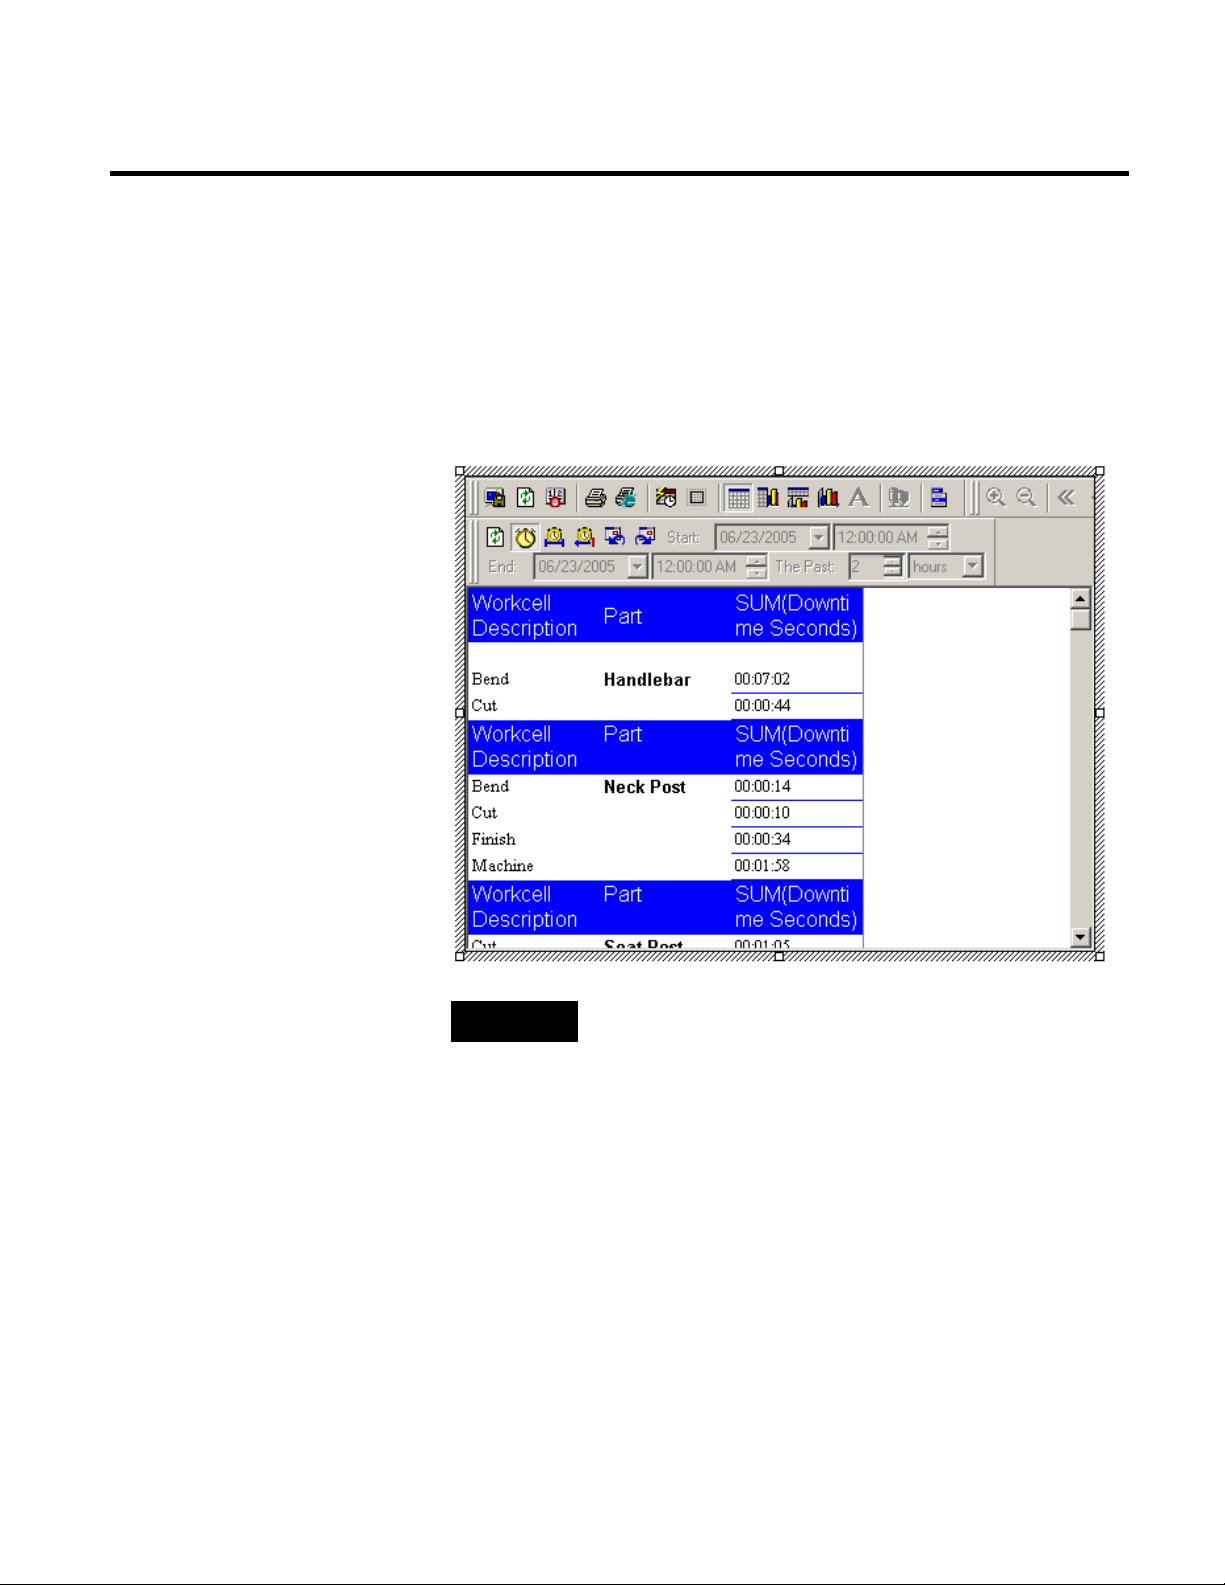
Customizing RSBizWare Charts and Tables Chapter 5
changes you have made.
Show and Hide Columns
available in the properties dialog box of the report object. The
shortcuts have been created to allow you to quickly change the look
and format of the table.
Your RSBizWare report must be in design mode in order to be
modified.
NOTE
When you make modifications to a report object, all instances of the
report object (such as those on other RSBizWare reports) will reflect the
Some report data sources may contain so many columns that they
cannot be shown easily in a table. If you are creating a table for a
report data source with many columns, you can show only the
columns with the information needed by the user.
To hide a column:
• Right-click the column that you want to remove from the
table, and then click Hide Column.
Rockwell Automation Publication HIST-UM001K-EN-E-June 2014 91
Page 92

Chapter 5 Customizing RSBizWare Charts and Tables
Resize Table Columns
Aggregate, Group, Format, Sort, Chart, and Rename Columns
The columns that are removed from the table can be added again
later.
To show a column that is not currently included in the table:
The column will be inserted to the right of the column that is
selected.
When you add a column to a table, it is assigned the default width.
Sometimes, the default width is too large, resulting in excess white
space, or too small, making the values wrap in the cells. The
column-resizing feature allows you to adjust the column size as
needed.
• Right-click the table and then click Insert Column >
<Column name>.
To resize a column:
1. Point to the grid line to the right of the column that you want
to resize.
2. When the cursor changes to
, drag the column to get the
desired size.
If you have selected the Interactive Grid style for your table, you can:
• Interactively add an Aggregate function column to the table.
• Change the grouping of the table records.
• Apply a format to the selected column.
• Change the sort order of the table.
• Rename the selected column heading.
If your table is not using the Interactive Grid style, you need to
change the table style.
92 Rockwell Automation Publication HIST-UM001K-EN-E-June 2014
Page 93

Customizing RSBizWare Charts and Tables Chapter 5
Aggregate
To change the style of the table to the Interactive Grid style:
1. Click the table, and then on the View menu click Properties.
The Report Object Properties dialog box appears.
2. On the Advanced tab click Format.
3. The Global Report Object Formats dialog box appears.
4. On the Styles tab, in the Style drop-down list select
Interactive Grid.
5. Click OK to return to the Report Object Properties dialog
box.
6. Click OK to return to the report design mode.
Your table should resemble the following sample one:
To apply the SUM aggregate function to a column, right-click the
column header, and then click Aggregate > SUM.
The aggregate functions available on the menu vary from column to
column. Only the functions that apply to a particular column are
displayed. For example, it only makes sense to apply the SUM
function to a numeric field.
Rockwell Automation Publication HIST-UM001K-EN-E-June 2014 93
Page 94

Chapter 5 Customizing RSBizWare Charts and Tables
Group
Format
Sort
To remove the aggregate function from a column, right-click the
column header, and then click Aggregate > None.
To group by field, right-click the column header, and then click
Grouping > Group 1.
The table records are grouped by the selected column. Each time you
click Grouping in the shortcut menu for additional columns,
additional group numbers are added to the menu. This allows you to
group by as many columns as displayed in your table.
To remove a grouping, right-click the column header, and then click
Grouping > None.
To apply a format to a column, right-click the column header, and
then click Format > format style.
The format styles available on the menu vary from column to
column. Only the formats that apply to a particular column are
displayed. For example, it only makes sense to apply a month, day,
and year format to a date field.
To remove a format from a column, right-click the column header,
and then click Format > <None>. The column data will use the
default format for the data type displayed in the column.
To apply an ascending (A to Z) order to a column, right-click the
column header, and then click Sorting > Sort 1 > Ascending.
The table records are sorted by the selected column. Each time you
click Sorting in the shortcut menu for additional columns, the
additional sort numbers are added to the menu. This allows you to
sort by as many columns as your table displays.
To remove the sorting order, right-click the column header, and
then click Sorting > None.
94 Rockwell Automation Publication HIST-UM001K-EN-E-June 2014
Page 95

Customizing RSBizWare Charts and Tables Chapter 5
new sorting order will not be saved when you save your table.
Chart
Rename
Quick Filter
NOTE
You can also sort the data by clicking the column header; however, the
To change the axis on which the chart is graphed, right-click the
column header, and then click Chart > X-axis.
To clear the chart axis, right-click the column header, and then click
Chart > None.
To rename a column:
1. Right-click the column header, and then click Rename.
The name in the column header is highlighted to indicate that
it is ready to be changed.
2. Enter the new name for the column, and press the Enter key
on your keyboard.
If you have selected the Interactive Grid style for your table, each
column in the table has a built-in quick filter below the column
heading. The default quick filter for each column is (All).
To create a quick filter:
1. Click the default quick filter to display a list containing all
unique column values.
2. Select the value by which you want to filter.
The table is trimmed using the value as the criterion.
Rockwell Automation Publication HIST-UM001K-EN-E-June 2014 95
Page 96

Chapter 5 Customizing RSBizWare Charts and Tables
96 Rockwell Automation Publication HIST-UM001K-EN-E-June 2014
Page 97
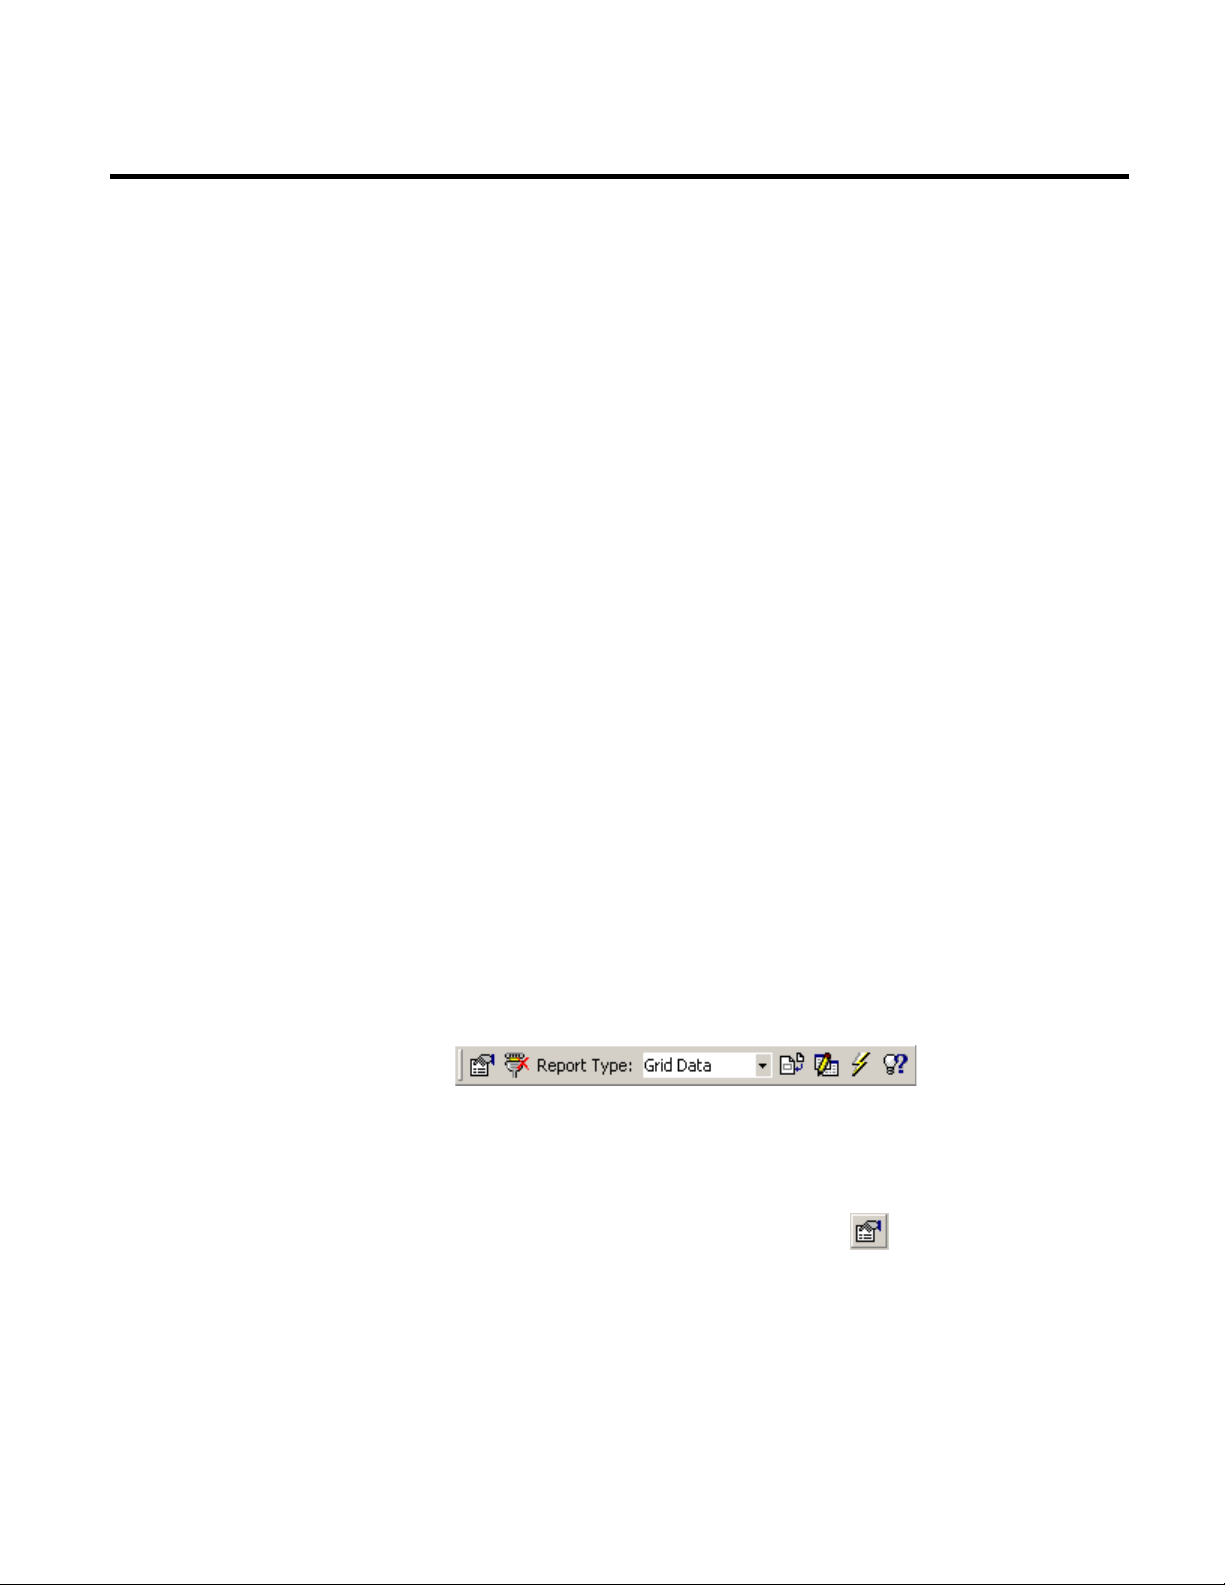
The Excel Add-in
Advanced Reporting Topics
In this chapter you will learn about the following:
• The Excel Add-in 97
• Scheduling Report Objects and Reports 101
Chapter 6
• Analyzing Non-RSBizWare Data 110
The Excel Add-in allows you to retrieve RSBizWare data (general
reporting or grid data, and time-series data) directly in Microsoft
Excel. After the RSBizWare data has been imported into Excel, you
can use any of Excel’s analysis, charting, or scripting features to
further process the data.
When you install the RSBizWare software on a computer, a custom
RSBizWare toolbar is added to Microsoft Excel. The toolbar allows
you to perform the tasks necessary to retrieve the RSBizWare data.
To specify the Excel and Information Services Manager
connectivity settings:
Rockwell Automation Publication HIST-UM001K-EN-E-June 2014 97
1. On the RSBizWare toolbar, click
RSBizWare Connectivity Settings dialog box.
to display the
Page 98
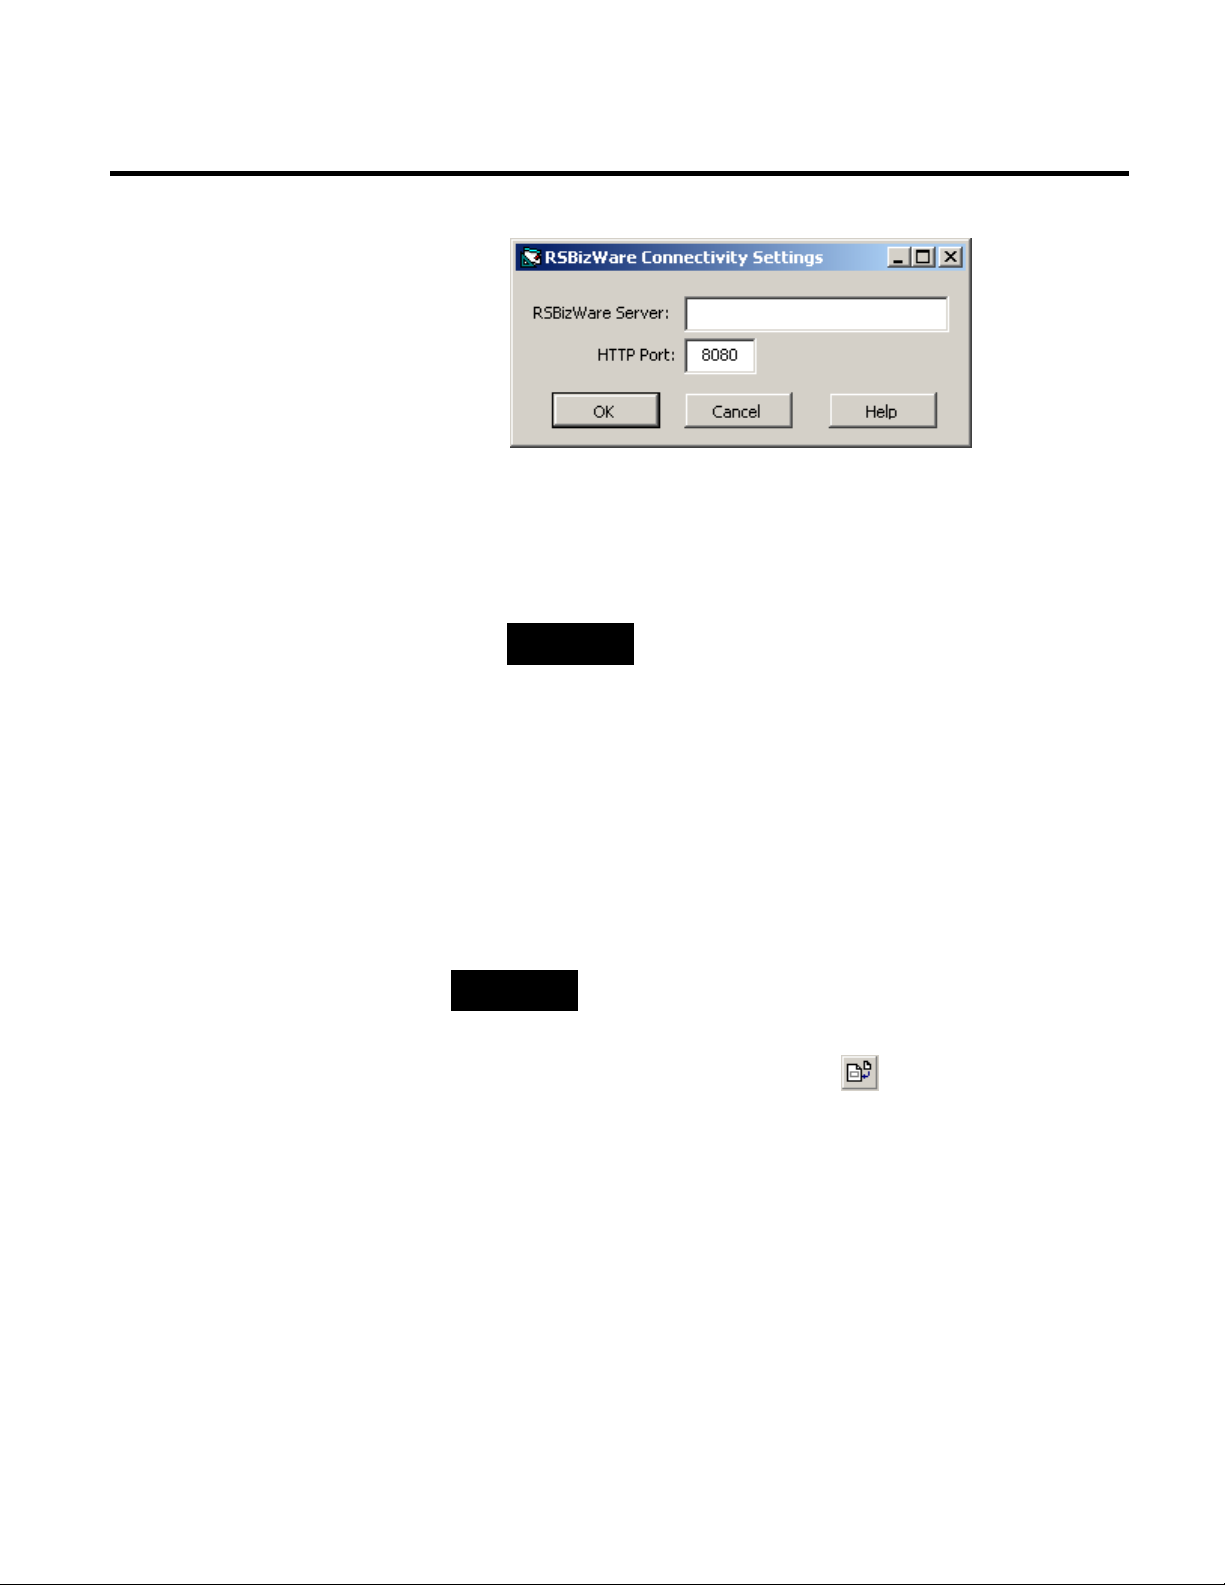
Chapter 6 Advanced Reporting Topics
2. Type the name of the Information Services Manager to which
your Excel workbook will connect.
3. Type the port number that you want to use for RSBizWare
HTTP communications. The default number is 8080.
NOTE
Please contact your RSBizWare administrator for the specific port
number that you should use.
4. Click OK to save your changes and close the dialog box.
A valid connection to the RSBizWare server is made and the
RSBizWareSetup worksheet is created by the Excel Add-in. The
worksheet contains the information required to retrieve data for the
reports that you create in your Excel workbook.
To add and modify reports in your Excel workbook:
NOTE
Each Excel workbook can contain up to 255 RSBizWare reports.
1. To create a new data grid report, select Grid Data in the
Report Type list, and then click
.
The Grid Data Parameters dialog box appears, in which you
can specify the report parameters.
98 Rockwell Automation Publication HIST-UM001K-EN-E-June 2014
Page 99
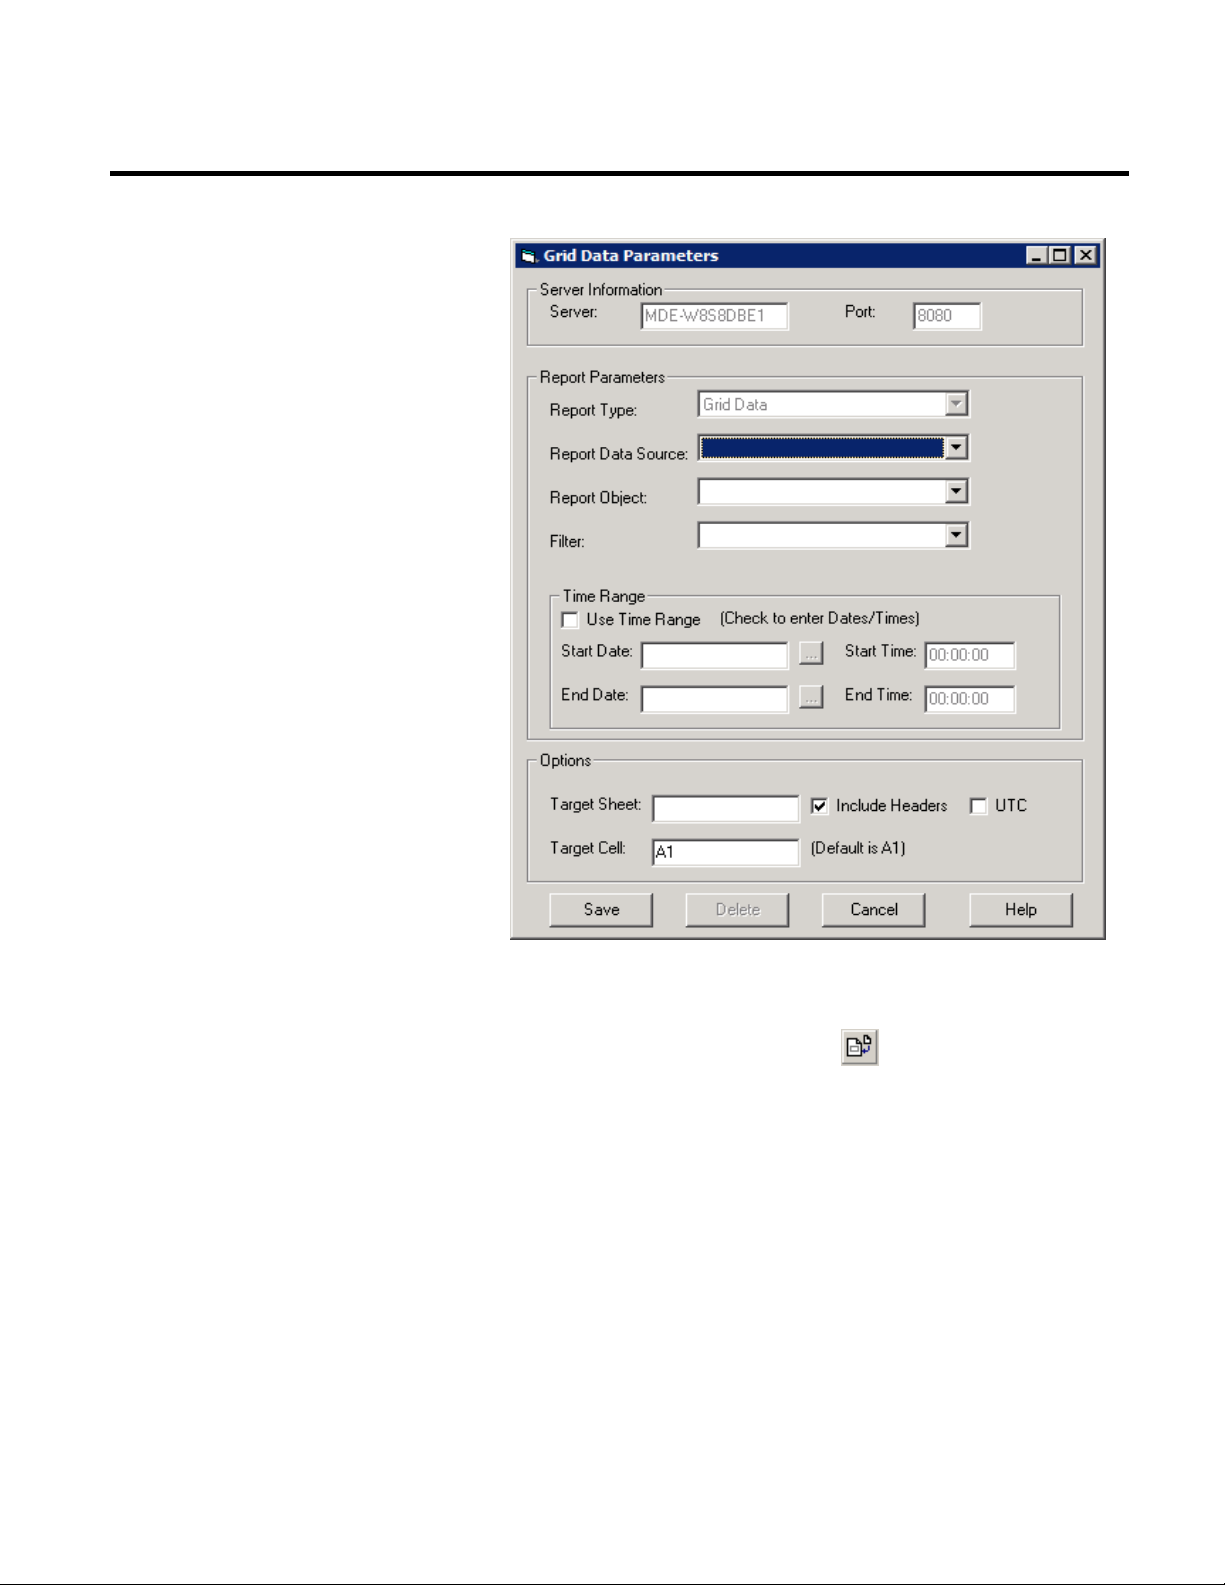
Advanced Reporting Topics Chapter 6
2. Click Save to save your report.
3. To create a new time-series report, select Time-Series in the
Report Type list, and then click
.
The Time Series Parameters dialog box appears, in which you
can specify the report parameters.
Rockwell Automation Publication HIST-UM001K-EN-E-June 2014 99
Page 100
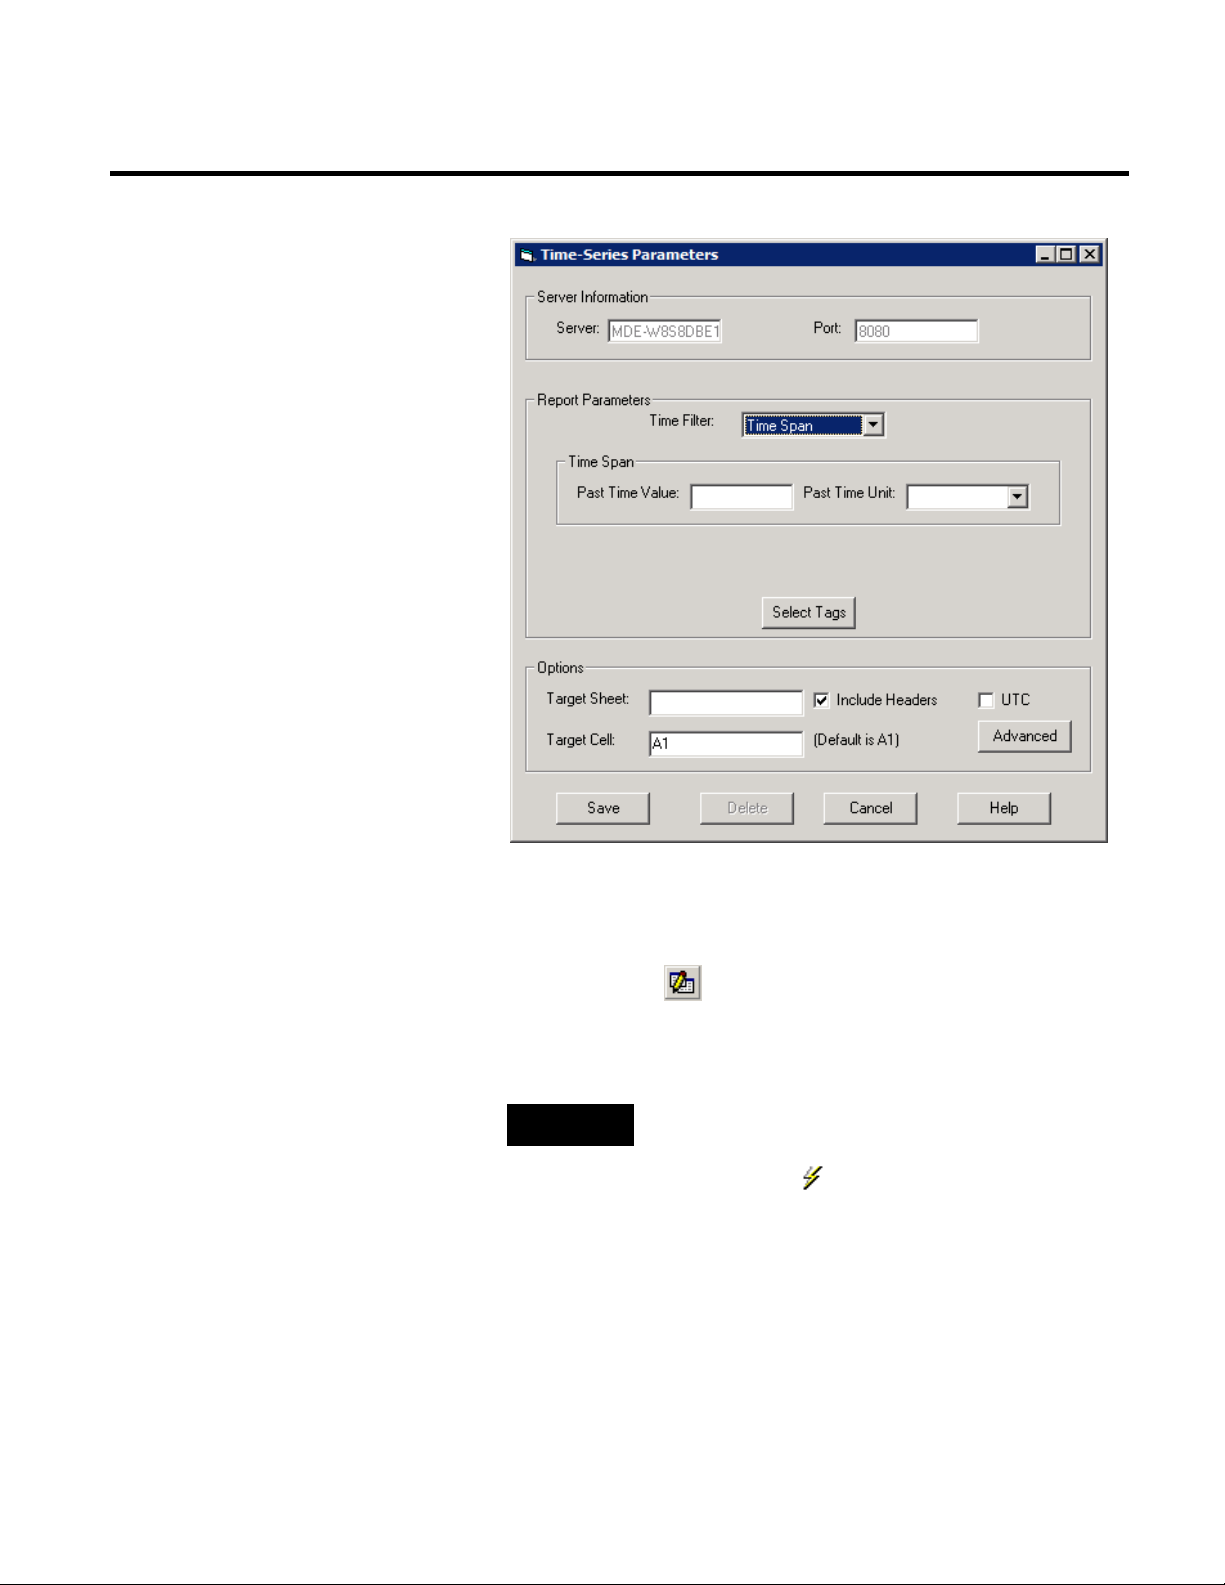
Chapter 6 Advanced Reporting Topics
Delete
bottom of the dialog box.
4. Click Save to save your report.
5. To modify the parameters of a grid or time-series report, click
the column defining the report in the RSBizWareSetup sheet,
and then click
.
6. In the dialog box that appears, modify the desired parameters,
and then click Save.
NOTE
To delete a report from the workbook, click
at the
7. To refresh the reports, click .
100 Rockwell Automation Publication HIST-UM001K-EN-E-June 2014
 Loading...