

Page 1
ControlNet Traffic
Analyzer
9220-WINTA
Reference Manual
Page 2
Important User Information
Because of the variety of uses for the products described in this
publication, those responsible for the application and use of these
products must satisfy themselves that all necessary steps have been
taken to assure that each application and use meets all performance
and safety requirements, including any applicable laws, regulations,
codes and standards. In no event will Rockwell Automation be
responsible or liable for indirect or consequential damage resulting
from the use or application of these products.
Any illustrations, charts, sample programs, and layout examples
shown in this publication are intended solely for purposes of
example. Since there are many variables and requirements associated
with any particular installation, Rockwell Automation does not assume
responsibility or liability (to include intellectual property liability) for
actual use based upon the examples shown in this publication.
Allen-Bradley publication SGI-1.1, Safety Guidelines for the
Application, Installation and Maintenance of Solid-State Control
(available from your local Rockwell Automation office), describes
some important differences between solid-state equipment and
electromechanical devices that should be taken into consideration
when applying products such as those described in this publication.
Reproduction of the contents of this copyrighted publication, in whole
or part, without written permission of Rockwell Automation, is
prohibited.
Throughout this publication, notes may be used to make you aware of
safety considerations. The following annotations and their
accompanying statements help you to identify a potential hazard,
avoid a potential hazard, and recognize the consequences of a
potential hazard:
WARNING
Identifies information about practices or circumstances that can
cause an explosion in a hazardous environment, which may
lead to personal injury or death, property damage, or economic
loss.
!
ATTENTION
Identifies information about practices or circumstances that can
lead to personal injury or death, property damage, or economic
loss.
!
Page 3

IMPORTANT
Identifies information that is critical for successful application
and understanding of the product.
Rockwell Automation Support
Before you contact Rockwell Automation for technical assistance, we
suggest you please review the troubleshooting information contained
in this publication first.
If the problem persists, call your local distributor or contact Rockwell
Automation in one of the following ways:
Phone United
States/Canada
Outside United
States/Canada
Internet
⇒
1.440.646.5800
You can access the phone number for your
country via the Internet:
1. Go to http://www.ab.com
2. Click on
(http://support.automation.rockwell.com)
3. Under
Information
1. Go to http://www.ab.com
2. Click on
(http://support.automation.rockwell.com)
Product Support
Support Centers
Product Support
, click on
Contact
Your Questions or Comments on this Manual
If you find a problem with this manual, please notify us of it on the
enclosed How Are We Doing form.
Rockwell Automation is a trademark of Rockwell Automation
ControlNet is a trademark of ControlNet International.
Microsoft, Windows, Windows 95 and Windows NT are registered trademarks of Microsoft Corporation.
Page 4

Page 5

Summary of Changes
Summary of Changes
This release of the ControlNet Traffic Analyzer Reference Manual
contains new and updated information, specifically about Windows 2000
and Windows XP. You will see change bars, as shown to the left of this
paragraph, throughout this manual to help you quickly identify revisions.
1 Publication 9220-RM052C-EN-P - August 2002
Page 6

Summary of Changes 2
Publication 9220-RM052C-EN-P - August 2002
Page 7

Introduction
Table of Contents
Chapter 1
What This Chapter Contains . . . . . . . . . . . . . . . . . . . . . . . 1-1
Main Structure of ControlNet . . . . . . . . . . . . . . . . . . . . . . . 1-1
Information Exchange on a ControlNet Network Link . . 1-1
ControlNet Messages . . . . . . . . . . . . . . . . . . . . . . . . . . 1-2
ControlNet MAC Frame Structure . . . . . . . . . . . . . . . . . 1-3
Audience . . . . . . . . . . . . . . . . . . . . . . . . . . . . . . . . . . . . . 1-3
Software Package . . . . . . . . . . . . . . . . . . . . . . . . . . . . . . . 1-4
Hardware Recommendations . . . . . . . . . . . . . . . . . . . . . . . 1-4
Install the Traffic Analyzer. . . . . . . . . . . . . . . . . . . . . . . . . 1-5
Uninstall the Previous Version of the Traffic Analyzer . . 1-5
Install the Traffic Analyzer . . . . . . . . . . . . . . . . . . . . . . 1-6
Terminology . . . . . . . . . . . . . . . . . . . . . . . . . . . . . . . . . . . 1-8
Common Techniques Used in This Manual. . . . . . . . . . . . . 1-9
Rockwell Automation Support . . . . . . . . . . . . . . . . . . . . . 1-9
Local Product Support . . . . . . . . . . . . . . . . . . . . . . . . . 1-9
Technical Product Assistance . . . . . . . . . . . . . . . . . . . . 1-9
Your Questions or Comments About This Manual . . . . 1-10
The ControlNet Traffic
Analyzer Tool
Accessories and Menus
Chapter 2
What This Chapter Contains . . . . . . . . . . . . . . . . . . . . . . . 2-1
The User Interface. . . . . . . . . . . . . . . . . . . . . . . . . . . . . . . 2-1
The Control Panel View (the Upper Part) . . . . . . . . . . . 2-2
The Filter/Trigger View (the Middle Part) . . . . . . . . . . . 2-4
The MAC Frame Data View (the Lower Part). . . . . . . . . 2-5
Chapter 3
What This Chapter Contains . . . . . . . . . . . . . . . . . . . . . . . 3-1
Accessories . . . . . . . . . . . . . . . . . . . . . . . . . . . . . . . . . . . . 3-1
The Toolbar. . . . . . . . . . . . . . . . . . . . . . . . . . . . . . . . . 3-1
The Status Bar . . . . . . . . . . . . . . . . . . . . . . . . . . . . . . . 3-2
Menus and Shortcuts . . . . . . . . . . . . . . . . . . . . . . . . . . . . . 3-2
Main Menu . . . . . . . . . . . . . . . . . . . . . . . . . . . . . . . . . 3-2
File Menu . . . . . . . . . . . . . . . . . . . . . . . . . . . . . . . . . . 3-2
Edit Menu . . . . . . . . . . . . . . . . . . . . . . . . . . . . . . . . . . 3-3
Actions Menu . . . . . . . . . . . . . . . . . . . . . . . . . . . . . . . 3-4
View Menu . . . . . . . . . . . . . . . . . . . . . . . . . . . . . . . . . 3-5
Window Menu. . . . . . . . . . . . . . . . . . . . . . . . . . . . . . . 3-6
Help Menu . . . . . . . . . . . . . . . . . . . . . . . . . . . . . . . . . 3-6
Pop-up Menus . . . . . . . . . . . . . . . . . . . . . . . . . . . . . . . 3-6
Stop Trigger List Pop-up Menu . . . . . . . . . . . . . . . . . . . 3-7
Start Trigger List Pop-up Menu . . . . . . . . . . . . . . . . . . . 3-7
Pre-Filter List Pop-up Menu . . . . . . . . . . . . . . . . . . . . . 3-7
Post-Filter List Pop-up Menu. . . . . . . . . . . . . . . . . . . . . 3-8
MAC Frame Data View Pop-up Menu . . . . . . . . . . . . . . 3-8
i Publication 9220-RM052C-EN-P - August 2002
Page 8

Table of Contents ii
Triggers and Filters
Chapter 4
What This Chapter Contains . . . . . . . . . . . . . . . . . . . . . . . 4-1
Triggers . . . . . . . . . . . . . . . . . . . . . . . . . . . . . . . . . . . . . . 4-1
Start Trigger View . . . . . . . . . . . . . . . . . . . . . . . . . . . . 4-1
Stop Trigger View . . . . . . . . . . . . . . . . . . . . . . . . . . . . 4-2
How to Configure a Trigger . . . . . . . . . . . . . . . . . . . . . 4-3
Status of Frames. . . . . . . . . . . . . . . . . . . . . . . . . . . . . . 4-4
Type of Frame . . . . . . . . . . . . . . . . . . . . . . . . . . . . . . . 4-4
How to Configure a Start Trigger on Data . . . . . . . . . . . 4-4
Example 1: Fixed LPacket. . . . . . . . . . . . . . . . . . . . . . . 4-6
Example 2: Generic LPacket . . . . . . . . . . . . . . . . . . . . . 4-7
Example 3: Fixed LPacket Using the UCMM Service List. 4-8
Filters . . . . . . . . . . . . . . . . . . . . . . . . . . . . . . . . . . . . . . . . 4-8
Pre-Filter View. . . . . . . . . . . . . . . . . . . . . . . . . . . . . . . 4-9
Disable Time Stamp . . . . . . . . . . . . . . . . . . . . . . . . . . . 4-9
How to Configure a Pre-Filter. . . . . . . . . . . . . . . . . . . . 4-9
Post-Filter View . . . . . . . . . . . . . . . . . . . . . . . . . . . . . . 4-11
How to Configure a Post-Filter . . . . . . . . . . . . . . . . . . . 4-11
Interpreting Control Bits. . . . . . . . . . . . . . . . . . . . . . . . 4-16
Display Information
Chapter 5
What This Chapter Contains . . . . . . . . . . . . . . . . . . . . . . . 5-1
Display View Options . . . . . . . . . . . . . . . . . . . . . . . . . . . . 5-1
Time Display . . . . . . . . . . . . . . . . . . . . . . . . . . . . . . . . 5-2
Data Format. . . . . . . . . . . . . . . . . . . . . . . . . . . . . . . . . 5-2
MAC Frames . . . . . . . . . . . . . . . . . . . . . . . . . . . . . . . . 5-3
LPackets . . . . . . . . . . . . . . . . . . . . . . . . . . . . . . . . . . . 5-3
Interpreted . . . . . . . . . . . . . . . . . . . . . . . . . . . . . . . . . 5-4
LPacket Header for a Fixed Tag:. . . . . . . . . . . . . . . . . . 5-4
Lpacket Header for a Generic Tag: . . . . . . . . . . . . . . . . 5-5
Other Options . . . . . . . . . . . . . . . . . . . . . . . . . . . . . . . 5-6
Tools to Manage Frames . . . . . . . . . . . . . . . . . . . . . . . . . . 5-6
Bookmarks . . . . . . . . . . . . . . . . . . . . . . . . . . . . . . . . . 5-6
Find Data . . . . . . . . . . . . . . . . . . . . . . . . . . . . . . . . . . 5-7
Simple Find . . . . . . . . . . . . . . . . . . . . . . . . . . . . . . . . . 5-7
Advanced Find . . . . . . . . . . . . . . . . . . . . . . . . . . . . . . 5-7
Select a Range of Frames . . . . . . . . . . . . . . . . . . . . . . . 5-8
Compute Time Difference . . . . . . . . . . . . . . . . . . . . . . 5-9
Copy Data to the Clipboard . . . . . . . . . . . . . . . . . . . . . 5-10
Publication 9220-RM052C-EN-P - August 2002
Page 9

Network Information and
Statistics
Other Commands and Options
Table of Contents iii
Chapter 6
What This Chapter Contains . . . . . . . . . . . . . . . . . . . . . . . 6-1
Network Information. . . . . . . . . . . . . . . . . . . . . . . . . . . . . 6-1
Statistics . . . . . . . . . . . . . . . . . . . . . . . . . . . . . . . . . . . . . . 6-2
Statistical Data: Network Traffic . . . . . . . . . . . . . . . . . . 6-3
Statistical Data: Network Utilization . . . . . . . . . . . . . . . 6-4
Chapter 7
What This Chapter Contains . . . . . . . . . . . . . . . . . . . . . . . 7-1
Save a Document . . . . . . . . . . . . . . . . . . . . . . . . . . . . . . . 7-1
Create a Report. . . . . . . . . . . . . . . . . . . . . . . . . . . . . . . . . 7-2
Go Offline/Online Hardware Settings. . . . . . . . . . . . . . . . . 7-3
Reset the ControlNet Card and Time . . . . . . . . . . . . . . . . . 7-6
Application Options . . . . . . . . . . . . . . . . . . . . . . . . . . . . . 7-6
Save Options . . . . . . . . . . . . . . . . . . . . . . . . . . . . . . . . 7-7
Buffer Size. . . . . . . . . . . . . . . . . . . . . . . . . . . . . . . . . . 7-7
Report Option . . . . . . . . . . . . . . . . . . . . . . . . . . . . . . . 7-8
Default Display View Options . . . . . . . . . . . . . . . . . . . 7-11
Troubleshooting
Chapter 8
What This Chapter Contains . . . . . . . . . . . . . . . . . . . . . . . 8-1
Warning Messages. . . . . . . . . . . . . . . . . . . . . . . . . . . . . . . 8-1
Overflow/Underflow FIFO Error in the ControlNet ASIC . . . 8-1
The PC Is Not Able to Unload All the Received Data . . . . . 8-2
Good Scheduled Data Example . . . . . . . . . . . . . . . . . . 8-3
All Unscheduled Data Starting on Good
Moderator Example . . . . . . . . . . . . . . . . . . . . . . . . . . . 8-3
Overflow Error in the ControlNet Traffic Analyzer
Internal Buffer . . . . . . . . . . . . . . . . . . . . . . . . . . . . . . . . . 8-5
Publication 9220-RM052C-EN-P - August 2002
Page 10

Table of Contents iv
Function and Shortcut Keys
Appendix A
What This Appendix Contains . . . . . . . . . . . . . . . . . . . . . . A-1
Function Keys. . . . . . . . . . . . . . . . . . . . . . . . . . . . . . . . . . A-1
Shortcut Keys . . . . . . . . . . . . . . . . . . . . . . . . . . . . . . . . . . A-2
File Menu Shortcut Keys. . . . . . . . . . . . . . . . . . . . . . . . A-2
Edit Menu Shortcut Keys . . . . . . . . . . . . . . . . . . . . . . . A-2
Actions Menu Shortcut Keys . . . . . . . . . . . . . . . . . . . . . A-3
View Menu Shortcut Keys . . . . . . . . . . . . . . . . . . . . . . A-3
Window Menu Shortcut Keys . . . . . . . . . . . . . . . . . . . . A-3
Help Menu Shortcut Keys. . . . . . . . . . . . . . . . . . . . . . . A-4
Start Trigger Menu Shortcut Keys . . . . . . . . . . . . . . . . . A-4
Stop Trigger Menu Shortcut Keys . . . . . . . . . . . . . . . . . A-4
Pre-Filter Menu Shortcut Keys. . . . . . . . . . . . . . . . . . . . A-5
Post-Filter Menu Shortcut Keys . . . . . . . . . . . . . . . . . . . A-5
MAC Frame Data View Menu Shortcut Keys . . . . . . . . . A-6
Publication 9220-RM052C-EN-P - August 2002
Page 11

Introduction
Chapter
1
What This Chapter Contains
Main Structure of ControlNet
This chapter introduces you to the ControlNet Traffic Analyzer tool.
The following table describes what this chapter contains and where to
find specific information.
For information about See page
the main structure of ControlNet 1-1
the audience for this manual 1-3
the Traffic Analyzer tool’s software package 1-4
hardware recommendations 1-4
installation of the Traffic Analyzer tool 1-5
terminology used in this manual 1-8
common techniques used in this manual 1-9
Rockwell Automation support 1-9
The ControlNet Traffic Analyzer tool is a 32-bit Windows application
running on top of a 32-bit ControlNet Driver. This application is used
to examine, store, and analyze network data on a ControlNet network.
You can view the behavior of frames on the network, test ControlNet
reliability, and make sure that every transmission on the network is
correct.
Information Exchange on a ControlNet Network Link
A ControlNet network link’s most important function is to transport
time-critical control information (i.e., I/O status and control
interlocking). Other information (i.e., non time-critical messages such
as program uploads and downloads) is also transported, but does not
interfere with time-critical messages because of ControlNet’s unique
time-slice algorithm.
On a ControlNet network link, information is transferred between
nodes by establishing connections. Each message sent by a producer
contains a Connection ID (CID). Nodes that have been configured to
recognize the CID consume the message, therefore becoming a
consumer.
1 Publication 9220-052C-EN-P - August 2002
Page 12
1-2 Introduction
See the ControlNet International Specification for more information
about information exchange on a ControlNet network link. The
ControlNet International Specification can be purchased from
ControlNet International.
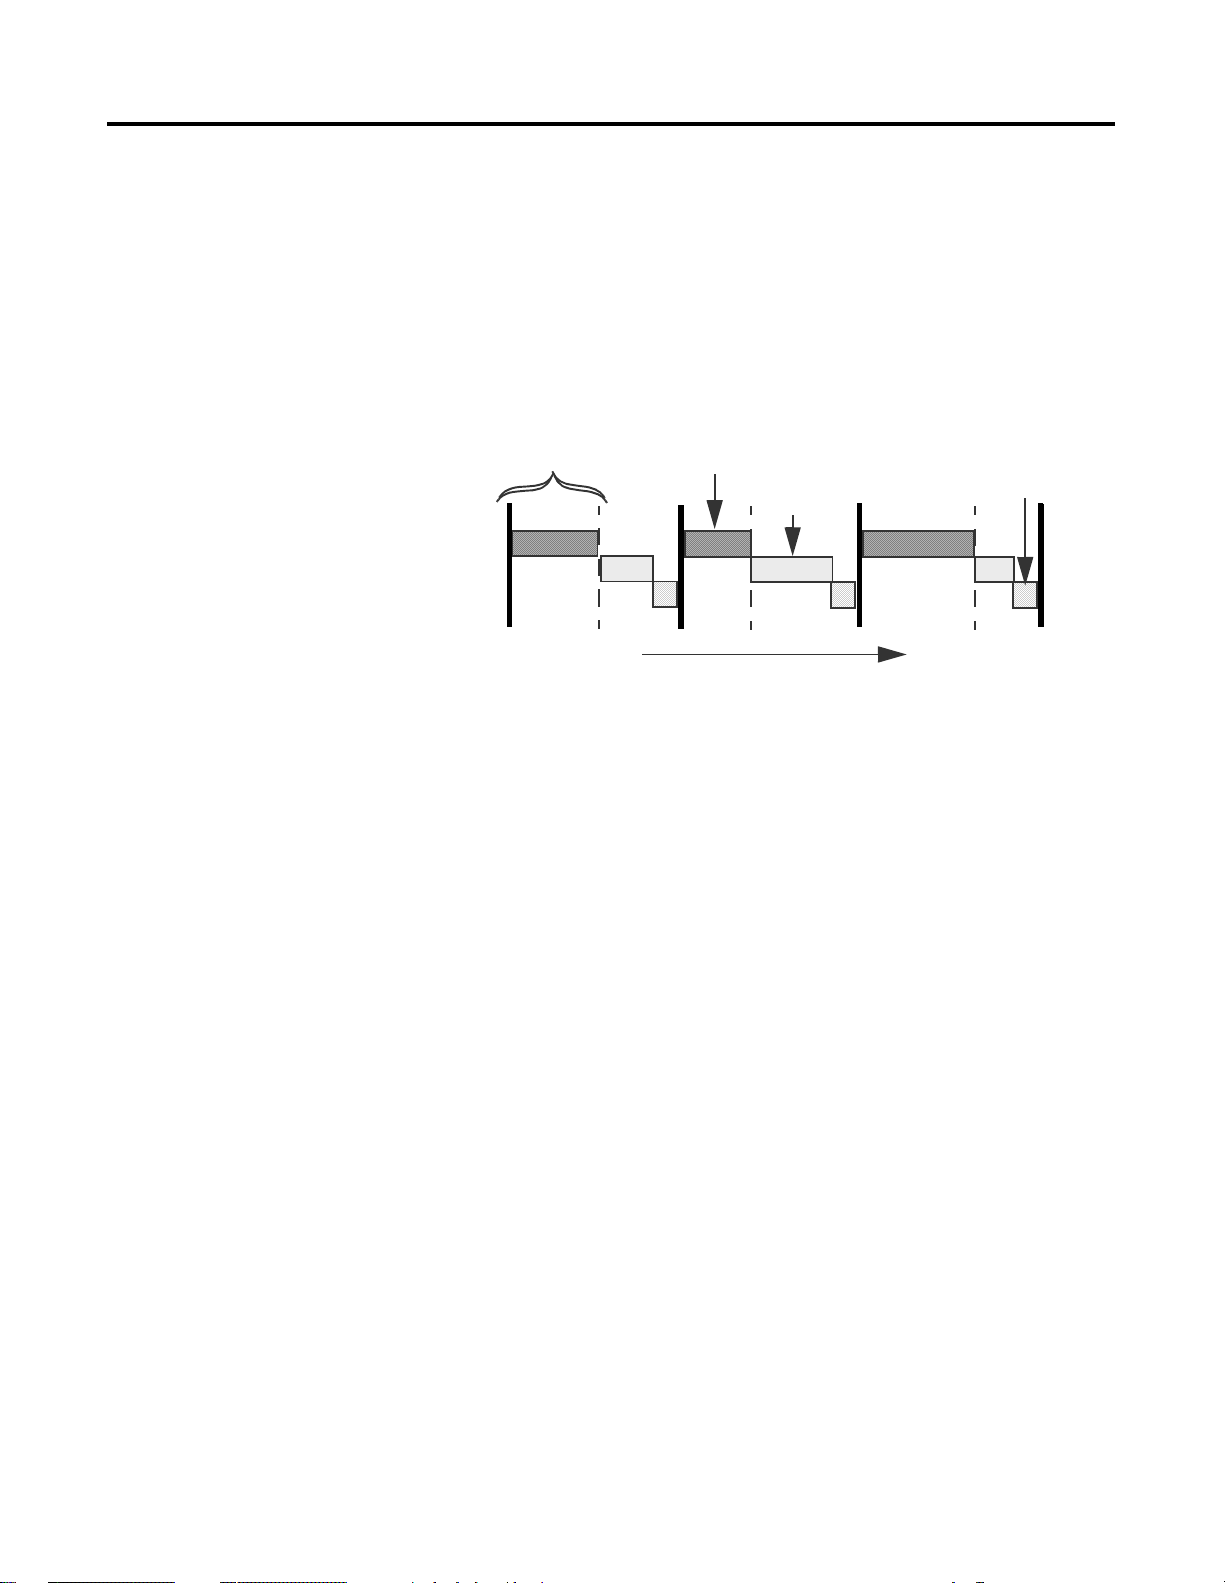
The following illustration describes the ControlNet network’s link
layer services.
Link Layer Services
Network Update Time (NUT)
0 ... SMAX
7
8
9..
Scheduled
Service
0 ... SMAX
Unscheduled
Service
8
9
10..
0 ... SMAX
Network Maintenance
Service the
“Guardband”
9
10..
Time
41561
ControlNet Messages
The repetitive time interval in which data can be sent on a link is
called the Network Update Time (NUT). The NUT is divided into three
parts containing three defined types of Media Access Control (MAC)
frames:
Scheduled
•
Every scheduled node in sequential order is guaranteed one
opportunity to transmit. Information that is time-critical is sent
during the scheduled part of the interval. The bandwidth is
reserved in advance to support real time data transfers. Real time
data transfers include:
• real time control data (I/O updates)
• analog data
• peer to peer interlocking
Publication 9220-052C-EN-P - August 2002
• Unscheduled
All nodes transmit on a rotating basis in sequential order. This
rotation repeats until the time allocated for the unscheduled
portion is used up.
Page 13
Introduction 1-3
The amount of time available for the unscheduled portion is
determined by the traffic load of the scheduled portion.
ControlNet guarantees at least one node will have the
opportunity to transmit unscheduled data every interval. The
starting node for each NUT rotates to guarantee each node will
have an unscheduled transmit time. The remaining bandwidth
supports non time-critical data transfers. Non time-critical data
transfers include:
connection establishment
•
peer to peer messaging
•
programming (uploads and downloads)
•
Moderator
•
The node with the lowest MAC ID (node address) assumes the
moderator role. The moderator frame is transmitted to keep the
other nodes synchronized. This moderator frame is sent in the
guardband.
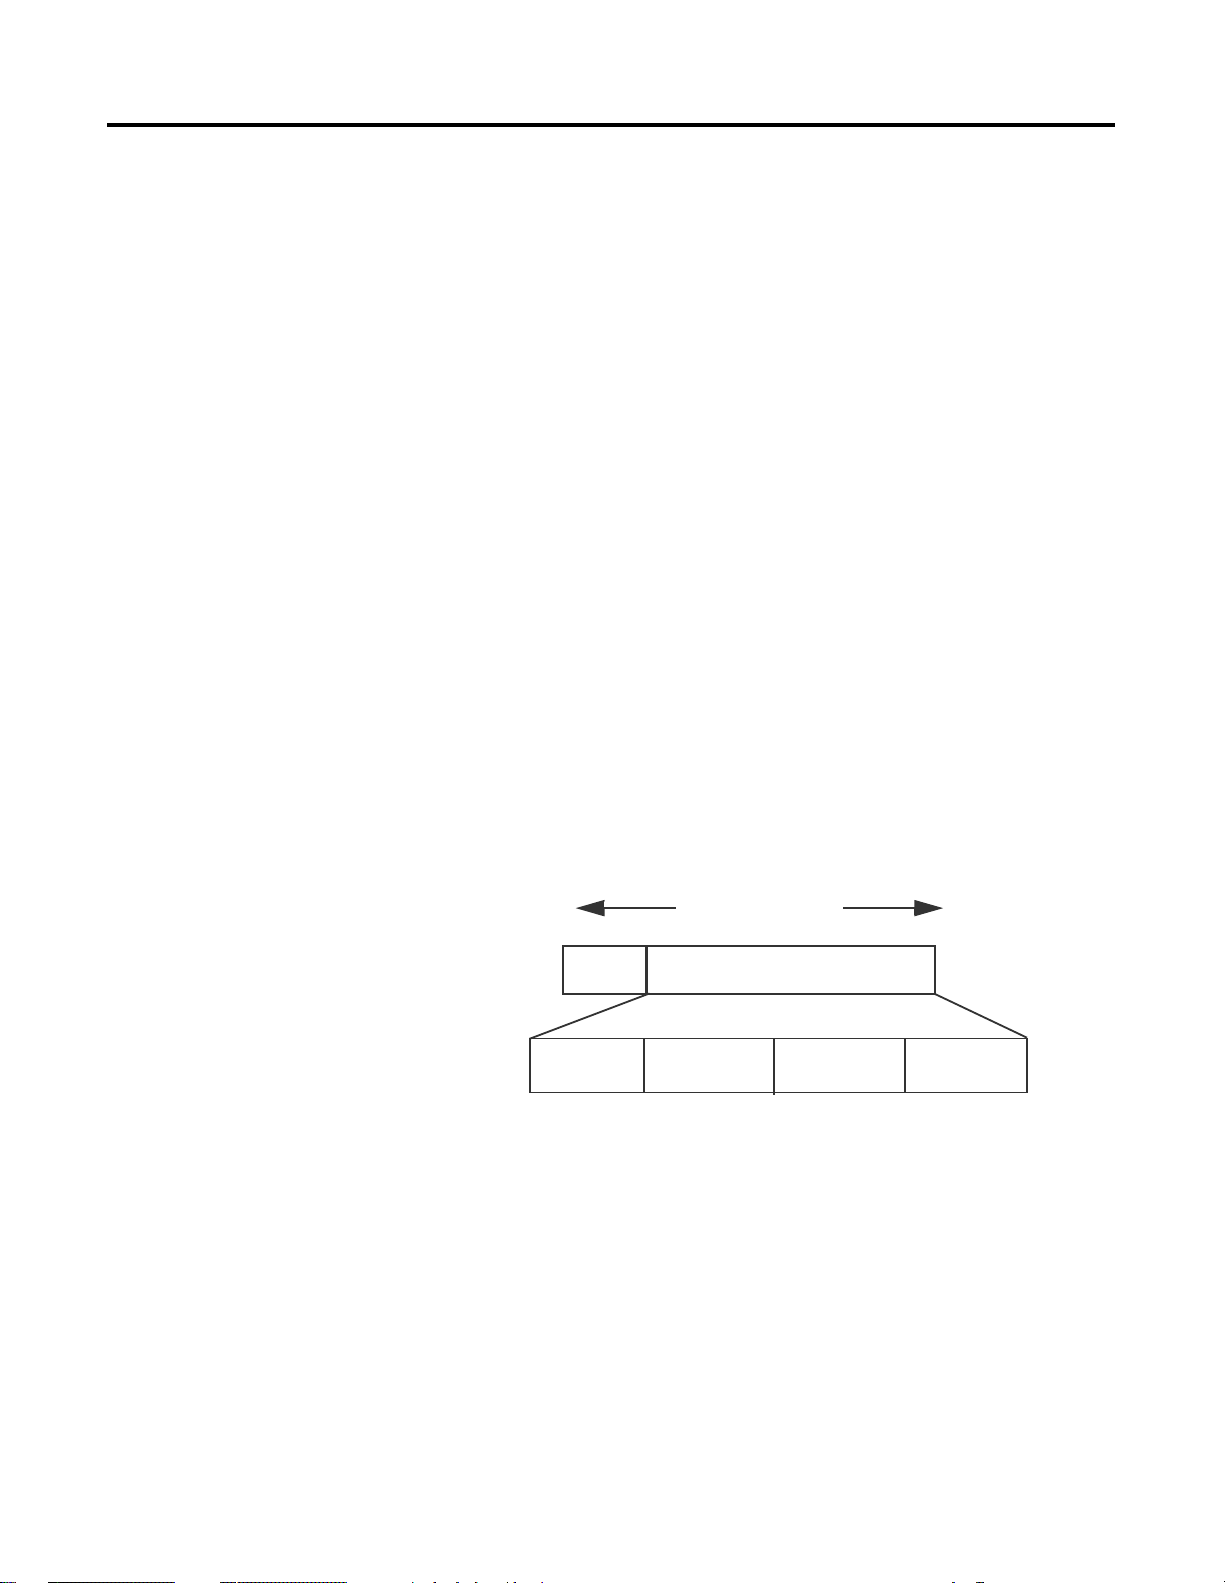
ControlNet MAC Frame Structure
All transfers use the MAC frame format shown in the following
illustration.
MAC Frame
Source
MAC
LPacket
Each node can send only one MAC Frame at each opportunity to
transmit. Each MAC Frame contains one or more LPackets
(Link-Packets). Each LPacket contains one piece of “application
information”.
0 - 510 Bytes Max
LPacket
LPacket.........
41562
Audience
This interface software is written for network specialists. It will assist
network engineers in designing and debugging of ControlNet
products and will help maintenance personnel during installation or
troubleshooting of a ControlNet network.
Publication 9220-052C-EN-P - August 2002
Page 14

1-4 Introduction
Software Package
Hardware Recommendations
The software package is a Windows based product so as to maintain
consistency across all ControlNet software products and to provide a
user-friendly human interface. It is composed of a CD-ROM
installation disk plus the reference manual.
The ControlNet Traffic Analyzer requires a dedicated computer with
the following minimum configuration for:
Microsoft
•
166MHz Pentium-based PC
•
32MB RAM
•
10MB free hard drive space
•
a color monitor with an 800 x 600 minimum resolution (1,024
•
Windows 95
or Windows 98 or Windows Me
x 768 recommended)
Microsoft
•
166MHz Pentium-based PC
•
80MB RAM
•
10MB free hard drive space
•
a color monitor with an 800 x 600 minimum resolution (1,024
•
Windows NT
4.0
x 768 recommended)
Microsoft
•
366MHz Pentium-based PC
•
128MB RAM
•
10MB free hard drive space
•
a color monitor with an 800 x 600 minimum resolution (1,024
•
Windows 2000 or Windows XP
x 768 recommended)
To capture data on a ControlNet network, one of the following
interface cards is required:
• 1784-PCC Series B Allen-Bradley ControlNet Interface Card
(PCMCIA) with:
• installation disk version 1.6 or later (shipped with the
1784-PCC card). If your installation disk is earlier than 1.6, we
recommend that you download the latest version from the
website www.ab.com./support/products/pccards.html.
• Microsoft Windows 95, Windows 98, Windows Me, Windows
NT 4.0, Windows 2000, or Windows XP
Publication 9220-052C-EN-P - August 2002
Page 15

Introduction 1-5
1784-PCC Series A Allen-Bradley ControlNet Interface Card
•
(PCMCIA) with:
installation disk version 1.6 or later (shipped with the
•
1784-PCC card). If your installation disk is earlier than 1.6, we
recommend that you download the latest version from the
website www.ab.com./support/products/pccards.html.
Microsoft Windows 95, Windows 98, Windows Me, Windows
•
2000, or Windows XP
CN-1000 Pyramid Solutions ControlNet Interface Card (ISA)
•
with:
1.4.1F firmware or later
•
1.2 driver or later
•
Microsoft Windows 95, Windows 98, Windows Me, Windows
•
NT 4.0, Windows 2000, or Windows XP
These interface cards contain a ControlNet ASIC that captures all
data on the network. No ControlNet MAC ID is required for the
Traffic Analyzer, since the ASIC is in “listen-only” mode. The
data will be analyzed by the Traffic Analyzer tool after it has
been processed by the ASIC.
Install the Traffic Analyzer
Before you install the 1784-PCC driver and the Traffic Analyzer, you
should uninstall the previous version of the Traffic Analyzer.
Uninstall the Previous Version of the Traffic Analyzer
To uninstall the previous version of the Traffic Analyzer:
1. Click Start>Settings>Control Panel.
2. Double click the
3. Double click ControlNet Traffic Analyzer.
4. Click Yes to uninstall the Traffic Analyzer.
TIP
Add/Remove
If you are prompted to remove unused shared files, select No to
All.
icon.
Publication 9220-052C-EN-P - August 2002
Page 16
1-6 Introduction
Install the Traffic Analyzer
IMPORTANT
We recommend that you exit all Windows programs before
running this Setup program.
TIP
The CD-ROM supports Windows Autorun. If you have Autorun
configured, once the CD is inserted into the CD-ROM drive, the
installation will automatically start at the first setup screen.
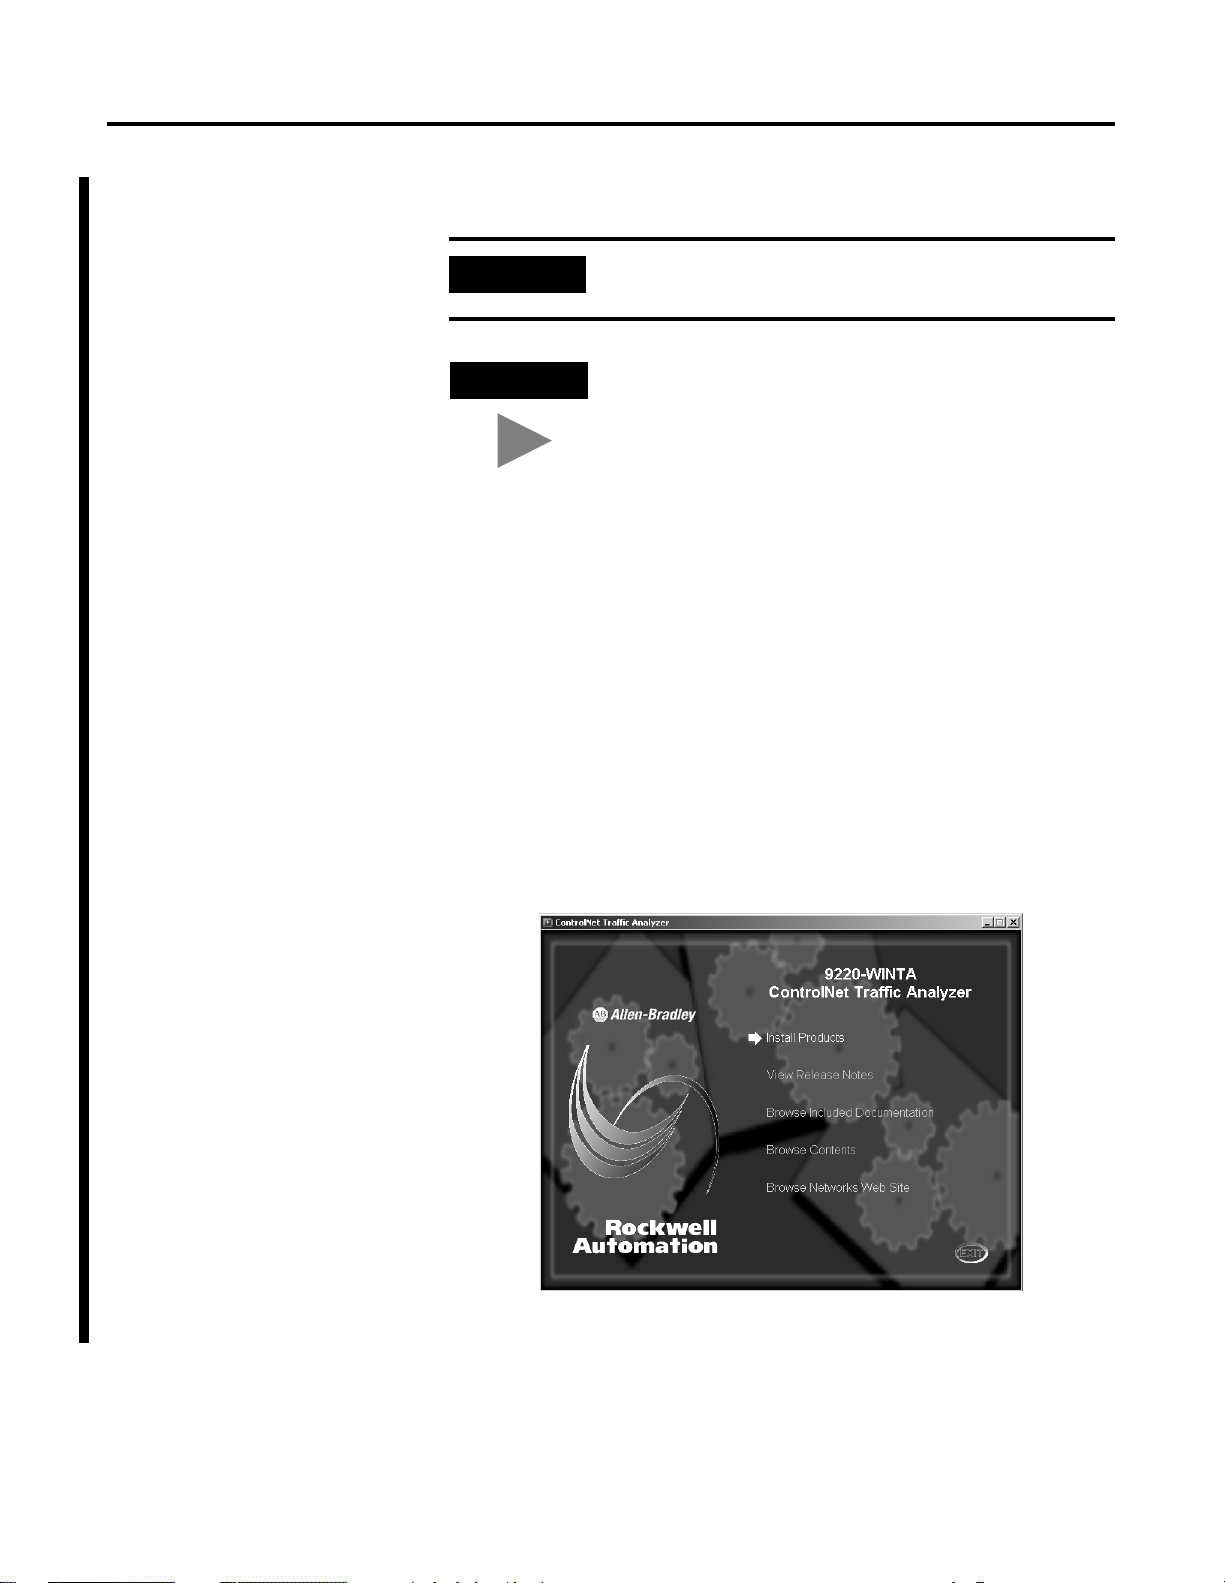
1. Insert the CD-ROM into the computer’s CD-ROM drive. If Auto
Insert Notification (Autorun) is enabled on your CD-ROM drive,
the Setup Utility will start automatically. Go to step 5. Otherwise,
continue with step 2.
2. Select Start>Run.
3. At the Run pop-up window, type x:\setup, where x is the
CD-ROM drive.
4. Click OK.
5. You see this screen:
6. Click on Install Products.
Publication 9220-052C-EN-P - August 2002
Page 17
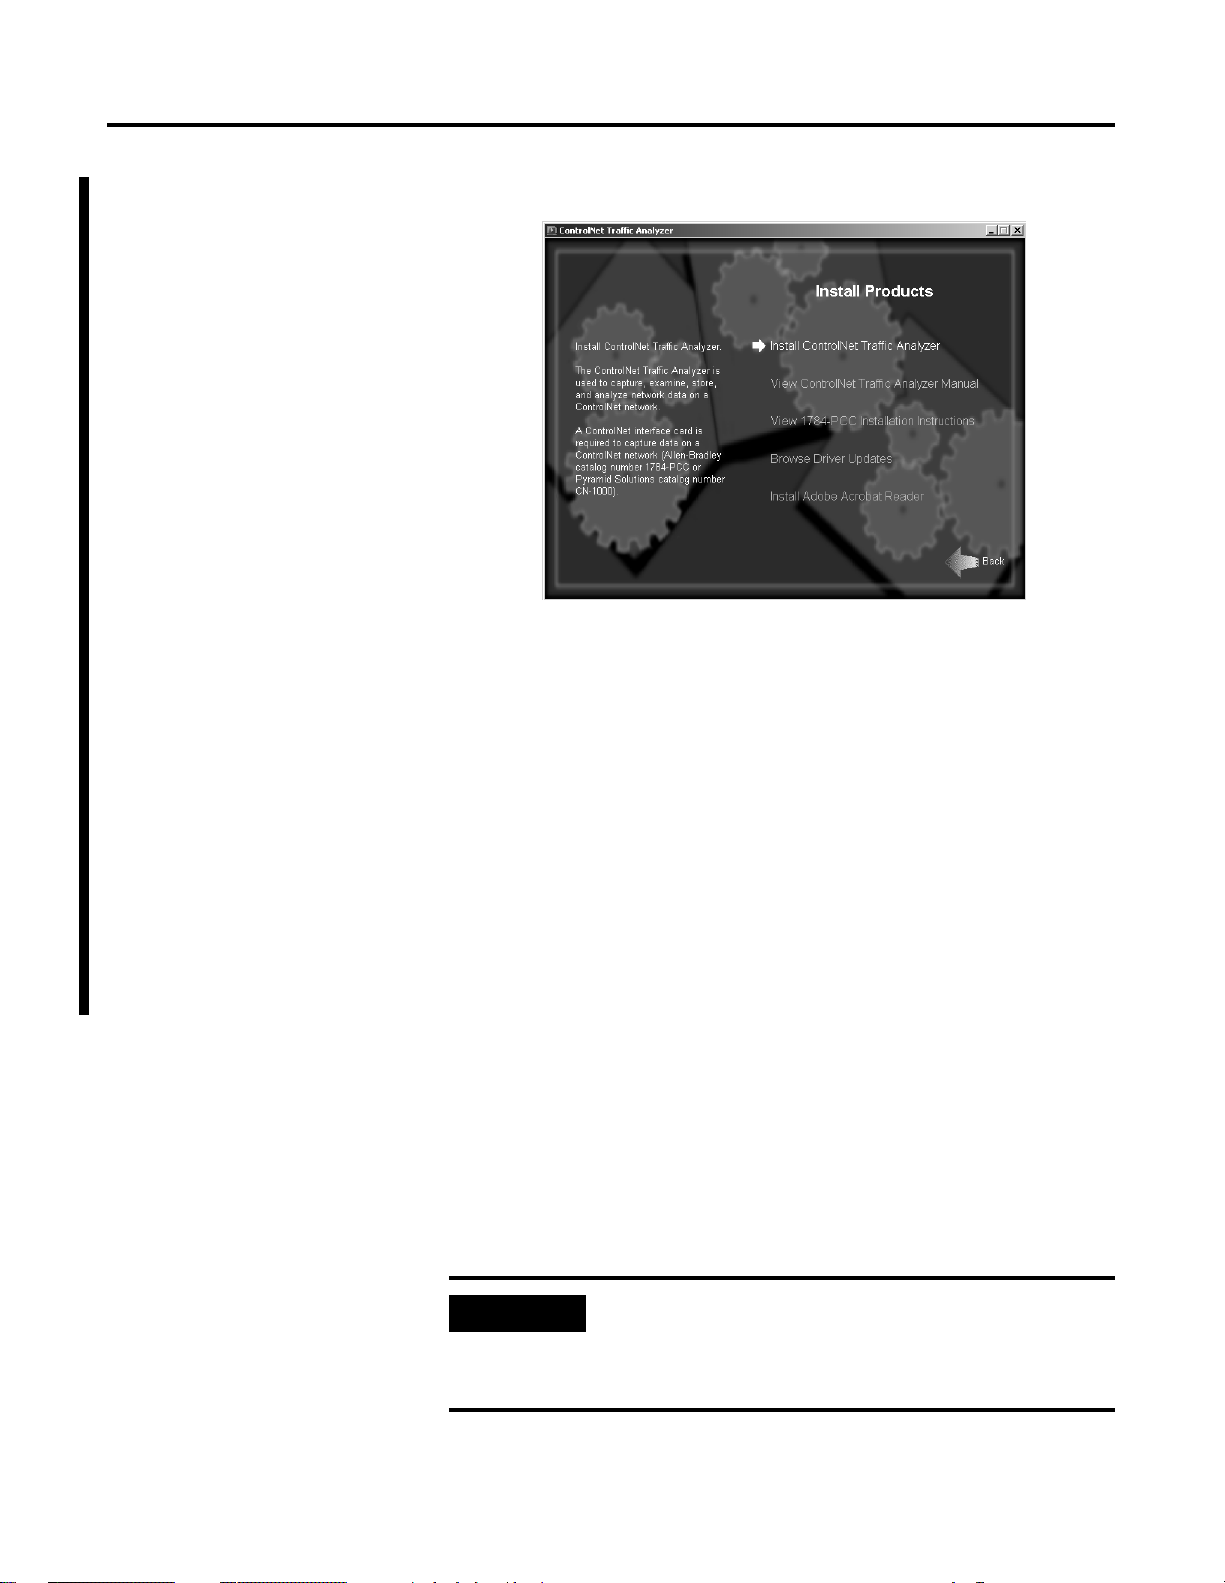
You see this screen:
7. Click on Install ControlNet Traffic Analyzer.
Introduction 1-7
8. Follow the on-screen instructions to install the driver and the
Traffic Analyzer.
You need to have a ControlNet 1784-PCC PC card or a CN-1000
ISA card installed to work on line. If you do not have a card, ask
your local Rockwell Automation representative for a 1784-PCC
card package at:
Telephone: 1.440.646.5800
•
or contact Pyramid Solutions for a CN-1000 card at:
Web: www.pyrasol.com/Expertise_DataCom_Support.htm
•
The ControlNet Traffic Analyzer has to be the single client of the
ControlNet card. You can use the ControlNet 1784-PCC PC card
or the CN-1000 ISA card for applications other than the Traffic
Analyzer, but you cannot run these applications simultaneously
with the same card. If you use another application with the card,
you must go in offline mode or close the Traffic Analyzer tool.
For more information about the online/offline modes, see page
7-3.
IMPORTANT
Some screen savers take all the CPU resources. When the
Traffic Analyzer tool is in data recording mode, it may lose some
data. You must choose the “blank screen” or “none” option in
the display properties of the Screen Saver.
Publication 9220-052C-EN-P - August 2002
Page 18

1-8 Introduction
Terminology
IMPORTANT
IMPORTANT
You may need to disable Power Management if data captures
are missing data.
The ControlNet Traffic Analyzer and RSLinx cannot run
simultaneously via the same network interface card.
Use the following table to become familiar with some terms specific to
the Traffic Analyzer tool.
Term Refers to
CNA10 the ControlNet ASIC containing the Media Access Control interface
circuitry used to send and receive data on a ControlNet network.
Connection ID (CID) an identifier assigned to a transmission that is associated with a
particular connection between producers and consumers that identifies
a specific piece of application information.
Filter a selection used to let frames that meet a specified condition to pass
from the network to the buffer, or from the buffer to the display. For
example, you may set up an input filter that will only allow frames with
a source MAC ID of 10 to pass from the network to the collection buffer.
Fixed Tag a two byte tag that identifies a specific service to be performed by the
node identified in the second byte of the fixed tag. The second byte of
the fixed tag contains the MAC ID of the destination node.
Generic Tag a three byte tag that identifies a specific piece of application
information (same as Connection ID).
LPacket link packet - data packaged and labeled by a node in preparation for
transmission. LPackets contain a header and data.
MAC Frame a collection of MAC symbols transmitted on the medium that contains a
preamble, start delimiter, source MAC ID, LPackets, CRC, and end
delimiter. After the ASIC processing, a MAC frame contains time,
status, type, source MAC ID and LPackets.
MAC Symbol symbols that represent the data bits to be encoded and transmitted by
the Physical Layer.
Trigger a collection that causes data collection to start or stop. You specify the
condition the same way that a filter is specified.
Trigger Point a point within the collection buffer where a trigger occurs. If the trigger
point is at the start of the buffer, data collection will begin when a
trigger condition is detected. If the trigger point is at the end of the
buffer, data collection will stop when a trigger condition is detected.
Unconnected
Message Manager
(UCMM)
the component within a node that transmits and receives unconnected
explicit messages and sends them directly to the Message Router
object.
Publication 9220-052C-EN-P - August 2002
Page 19

Introduction 1-9
Common Techniques Used in This Manual
The following conventions are used throughout this manual:
bulleted lists provide information, not procedural steps
•
numbered lists provide sequential steps
•
text written like this identify screen, menu, and toolbar names
•
information in bold contained within text, identify areas of the
•
screen, such as field names, radio buttons and check boxes
text
written like this
•
a menu item in this format Control Panel>Define Start Trigger
•
identifies the submenu item after the caret (>) accessed from the
menu
pictures of symbols and/or screens represent the actual symbols
•
you see or the screens you use
TIP
This symbol identifies helpful tips
identify icons
Rockwell Automation Support
Rockwell Automation offers support services worldwide, with over 75
sales/support offices, 512 authorized distributors, and 260 authorized
systems integrators located throughout the United States alone, plus
Rockwell Automation representatives in every major country in the
world.
Local Product Support
Contact your local Rockwell Automation representative for:
• sales and order support
• product technical training
• warranty support
• support service agreements
Technical Product Assistance
If you need to contact Rockwell Automation for technical assistance,
call your local Rockwell Automation representative.
Publication 9220-052C-EN-P - August 2002
Page 20

1-10 Introduction
Your Questions or Comments About This Manual
If you find a problem with this manual, please notify us of it on the
enclosed How Are We Doing form (at the back of this manual).
If you have any suggestions about how we can make this manual
more useful to you, please contact us at the following address:
Rockwell Automation, Allen-Bradley Company, Inc.
Control and Information Group
Technical Communication
1 Allen-Bradley Drive
Mayfield Heights, OH 44124-6118
Publication 9220-052C-EN-P - August 2002
Page 21

Chapter
The ControlNet Traffic Analyzer Tool
2
What This Chapter Contains
The User Interface
Read this chapter for a description of the options provided in the
Traffic Analyzer tool. The following table describes what this
chapter contains and where to find specific information.
For information about See page
the user interface 2-1
the Control Panel view 2-2
the Filter/Trigger view 2-4
the MAC Frame Data view 2-5
The User interface of the ControlNet Traffic Analyzer tool was
designed to be easy to use and to give you the maximum
amount of information. When you open a document, you see a
window divided into three parts:
the Control Panel view (upper part)
•
the Filter/Trigger view (middle part)
•
the MAC Frame Data view (lower part)
•
These three parts are separated by horizontal splitters that are
used to resize the views.
Horizontal splitters
Horizontal splitters
Publication 9220-052C-EN-P - August 2002
Page 22
2-2 The ControlNet Traffic Analyzer Tool
The Control Panel View (the Upper Part)
When you launch the Traffic Analyzer tool and open a project, you
see a screen similar to the one shown below.
Publication 9220-052C-EN-P - August 2002
The Control Panel allows you to follow data flow, start and stop
analysis, access trigger and filter definitions, and display view options.
You can also change data storage behavior (Full or Ring Buffer).
TIP
If the
Start
icon in the Control Panel contains a red X ( ),
you can click the
Start
icon to access the Hardware Settings
dialog box. See "Go Offline/Online Hardware Settings", page
7-3, for more information.
Page 23
The ControlNet Traffic Analyzer Tool 2-3
The Control Panel view has two main functions:
control the document during the configuration of the next
•
record. You can:
configure triggers and filters in the Filter/Trigger view (but
•
only one type of filter or trigger at a time). You do this via the
Control Panel by clicking on the
Pre-Filter
or
Post-Filter
icons. You select one topic for the
Start Trigger, Stop Trigger
,
current view. See the Trigger/Filter views in Chapter 4 for
more information.
click on the
•
Full/Ring Buffer
icon to define in which type of
buffer the next record will be configured.
click on the
•
Display
icon to access a dialog box in which you
choose display options for the MAC Frame Data view. See
“Display View Options,” page 5-1, for more information.
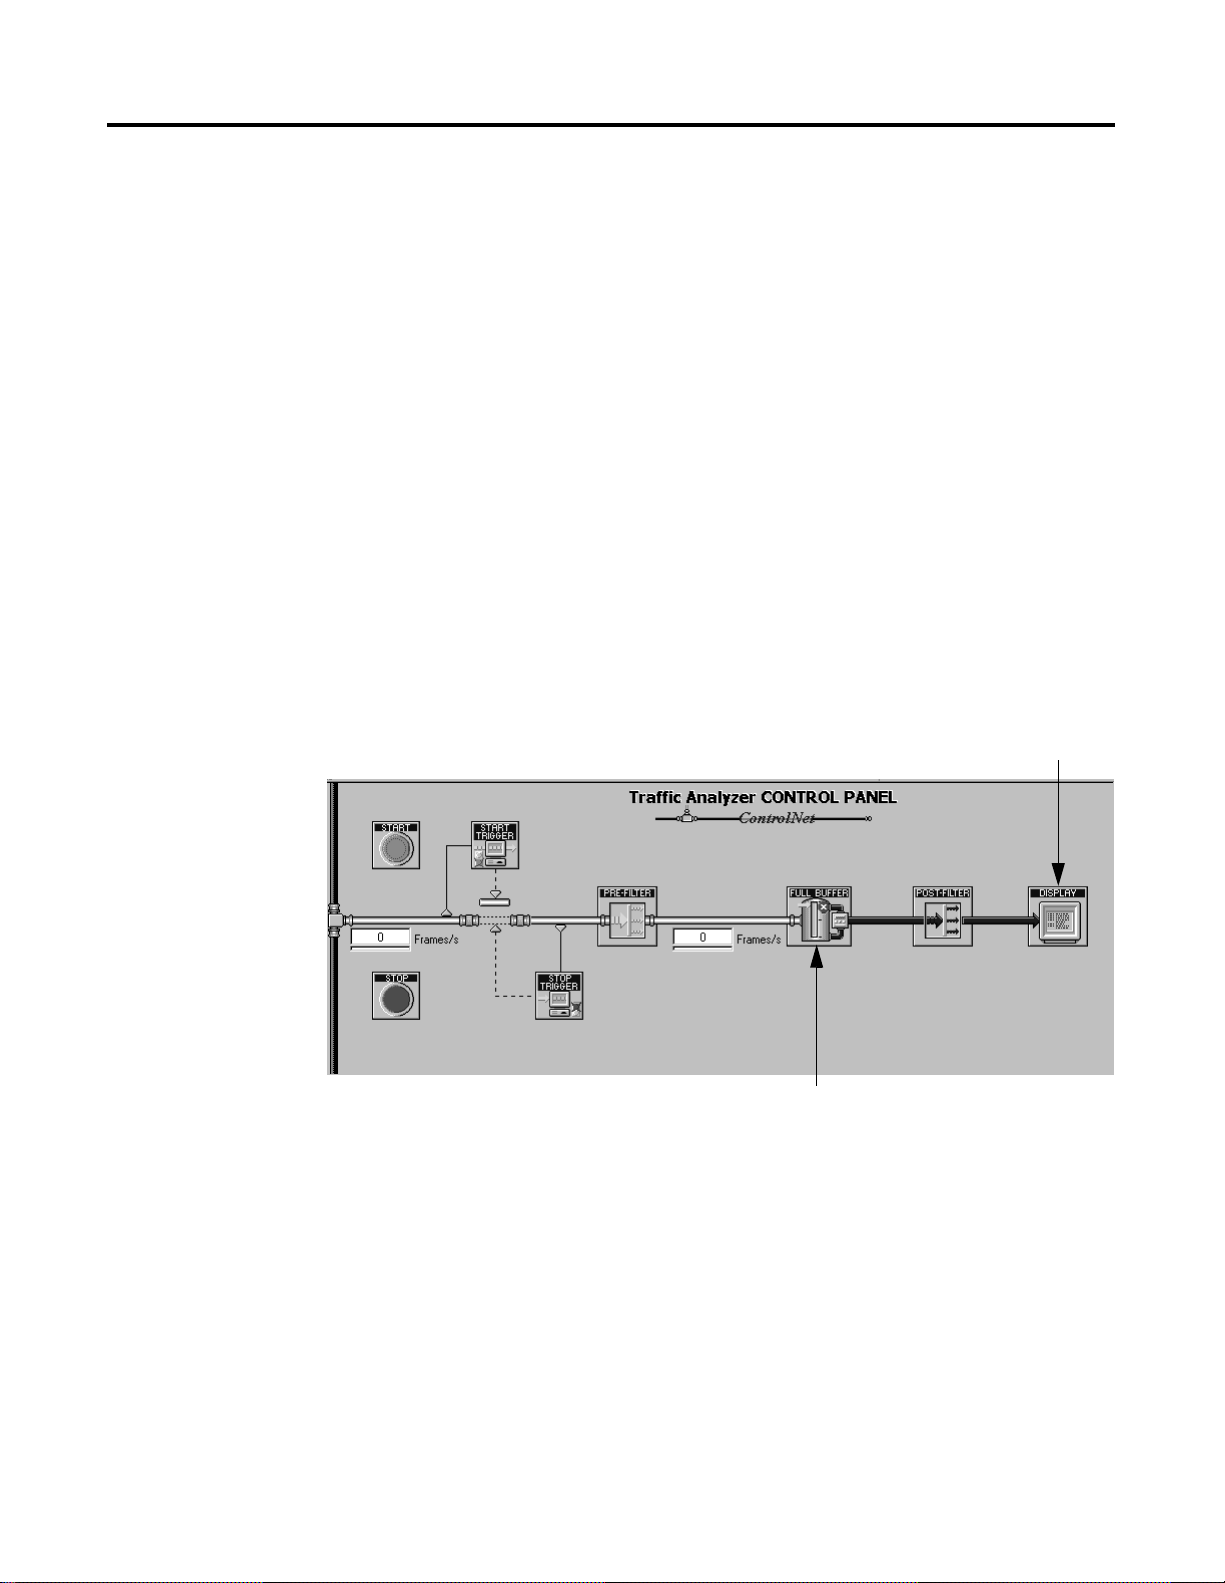
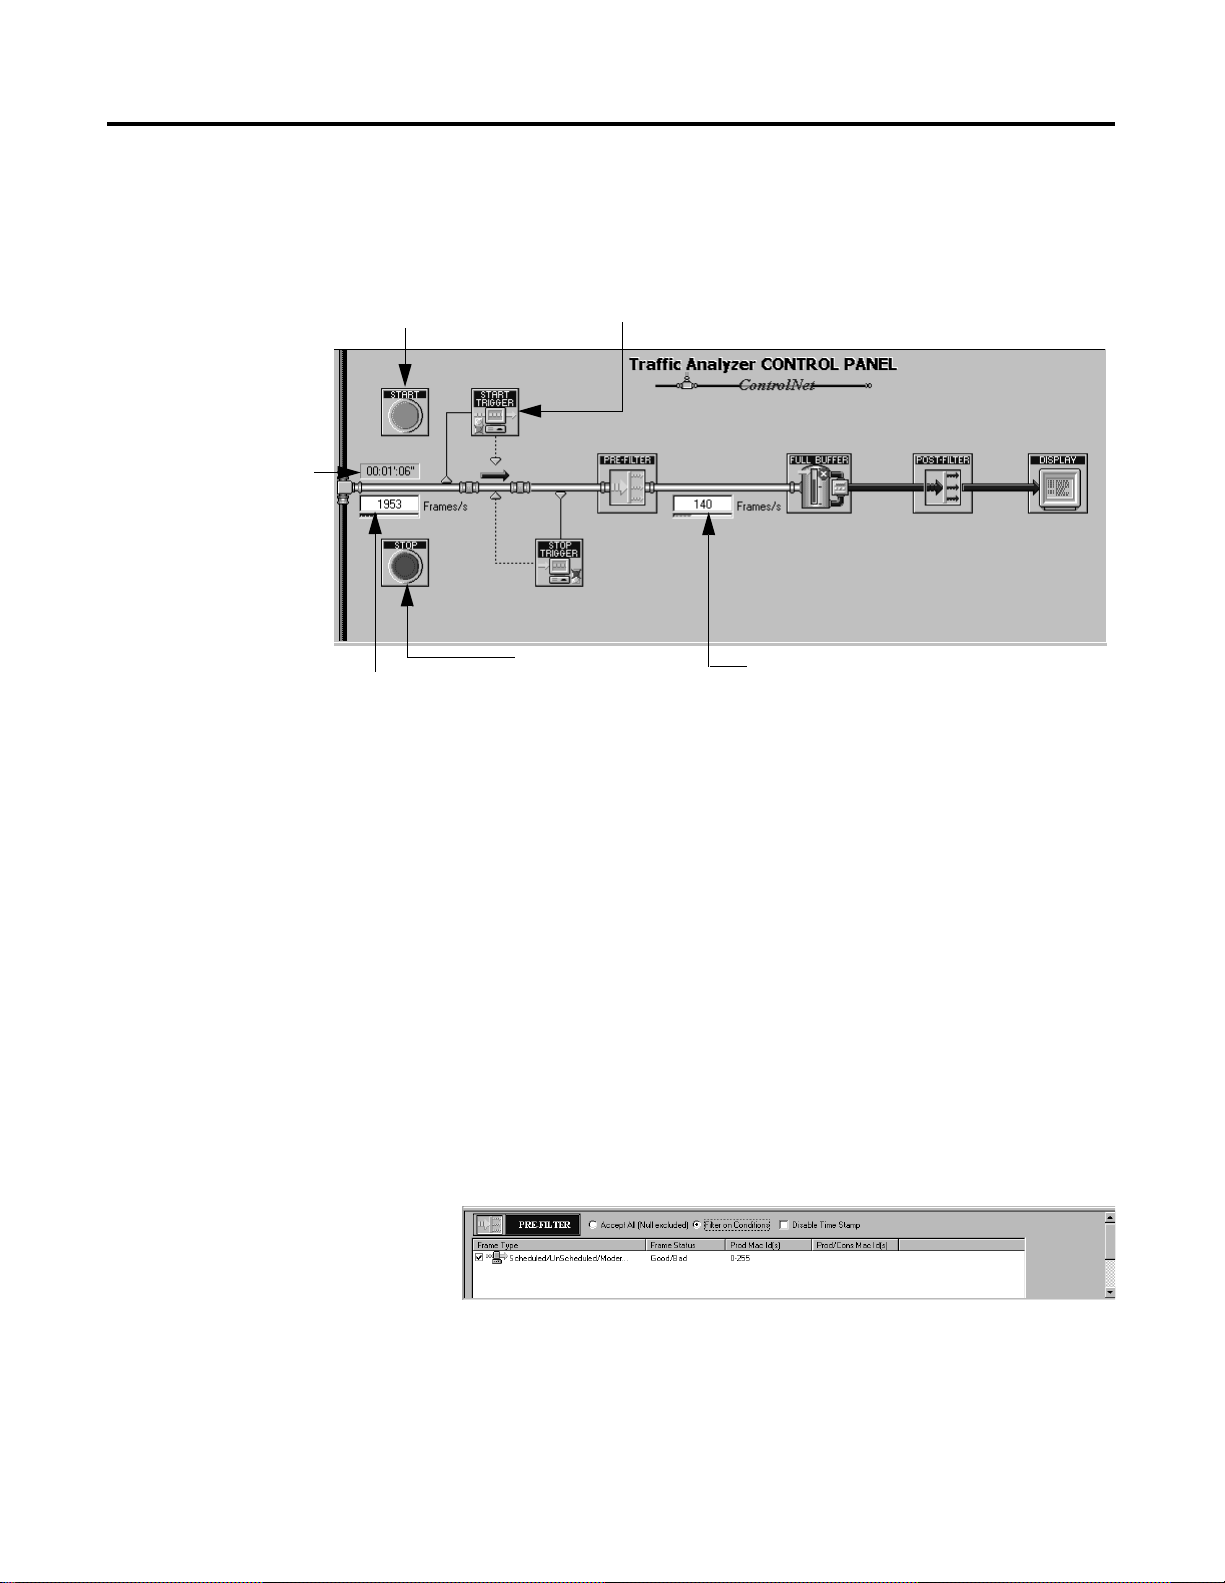
The following illustration shows the function of each element of the
Traffic Analyzer Control Panel when the Traffic Analyzer is not in data
recording mode.
Click on the
icons to view the corresponding parameters in Filter/Trigger view.
Start Trigger, Pre-Filter, Post-Filter,
or
Stop Trigger
Click on this icon to change
the data buffer behavior.
• the second function of the Control Panel is to control the record
itself. You can:
• start and stop the data record by clicking on the
icons. You can also perform these two actions from the
Actions menu or by pressing the F10 and F11 keys
respectively.
• see how long the data record has been Started via a clock.
• know the number of frames filtered per second after the ASIC
and after the pre-filter, respectively via two progress bars
(Frames/s) with small edits above.
Click on this icon to view the
Display View Options dialog box.
Start
or
Stop
Publication 9220-052C-EN-P - August 2002
Page 24
2-4 The ControlNet Traffic Analyzer Tool
The following illustration shows the function of each element of the
Traffic Analyzer Control Panel when the Traffic Analyzer is in data
recording mode.
The time the data
capture has been
running or started.
Click on the Start icon to
start analyzing the frames.
Displays the data traffic
after CNA10 ASIC
filtering of ControlNet.
The Filter/Trigger View (the Middle Part)
Start Trigger
Click on
to process the data.
Click on the
stop analyzing the frames.
Stop
icon to
Displays the data
traffic after pre-filtering.
The Filter/Trigger view is used to configure the triggers or the filters
you need for your analysis. Depending on the selection you made in
the Control Panel (upper part of the document), you see one of the
following four parameters:
Start Trigger
•
Stop Trigger
•
• Pre-filter
• Post-filter
The middle part of the user interface is shown in the following
illustration. The Pre-Filter option has been selected.
See Chapter 4 for a more detailed explanation of the Filter/Trigger
view.
Publication 9220-052C-EN-P - August 2002
Page 25
The ControlNet Traffic Analyzer Tool 2-5
The MAC Frame Data View (the Lower Part)
The MAC Frame Data view is used to show the ControlNet MAC
frames captured during the analysis. You can have it filtered through
the post-filter before the data is displayed.
IMPORTANT
If you filter data through the post-filter, you will see only the
data after a post-filtering and not necessarily all data recorded
in the buffer. By default, when you open a new document,
post-filtering is disabled.
You have the possibility to view the data in different formats using the
display options. Display options are explained in “Display
Information,” Chapter 5.
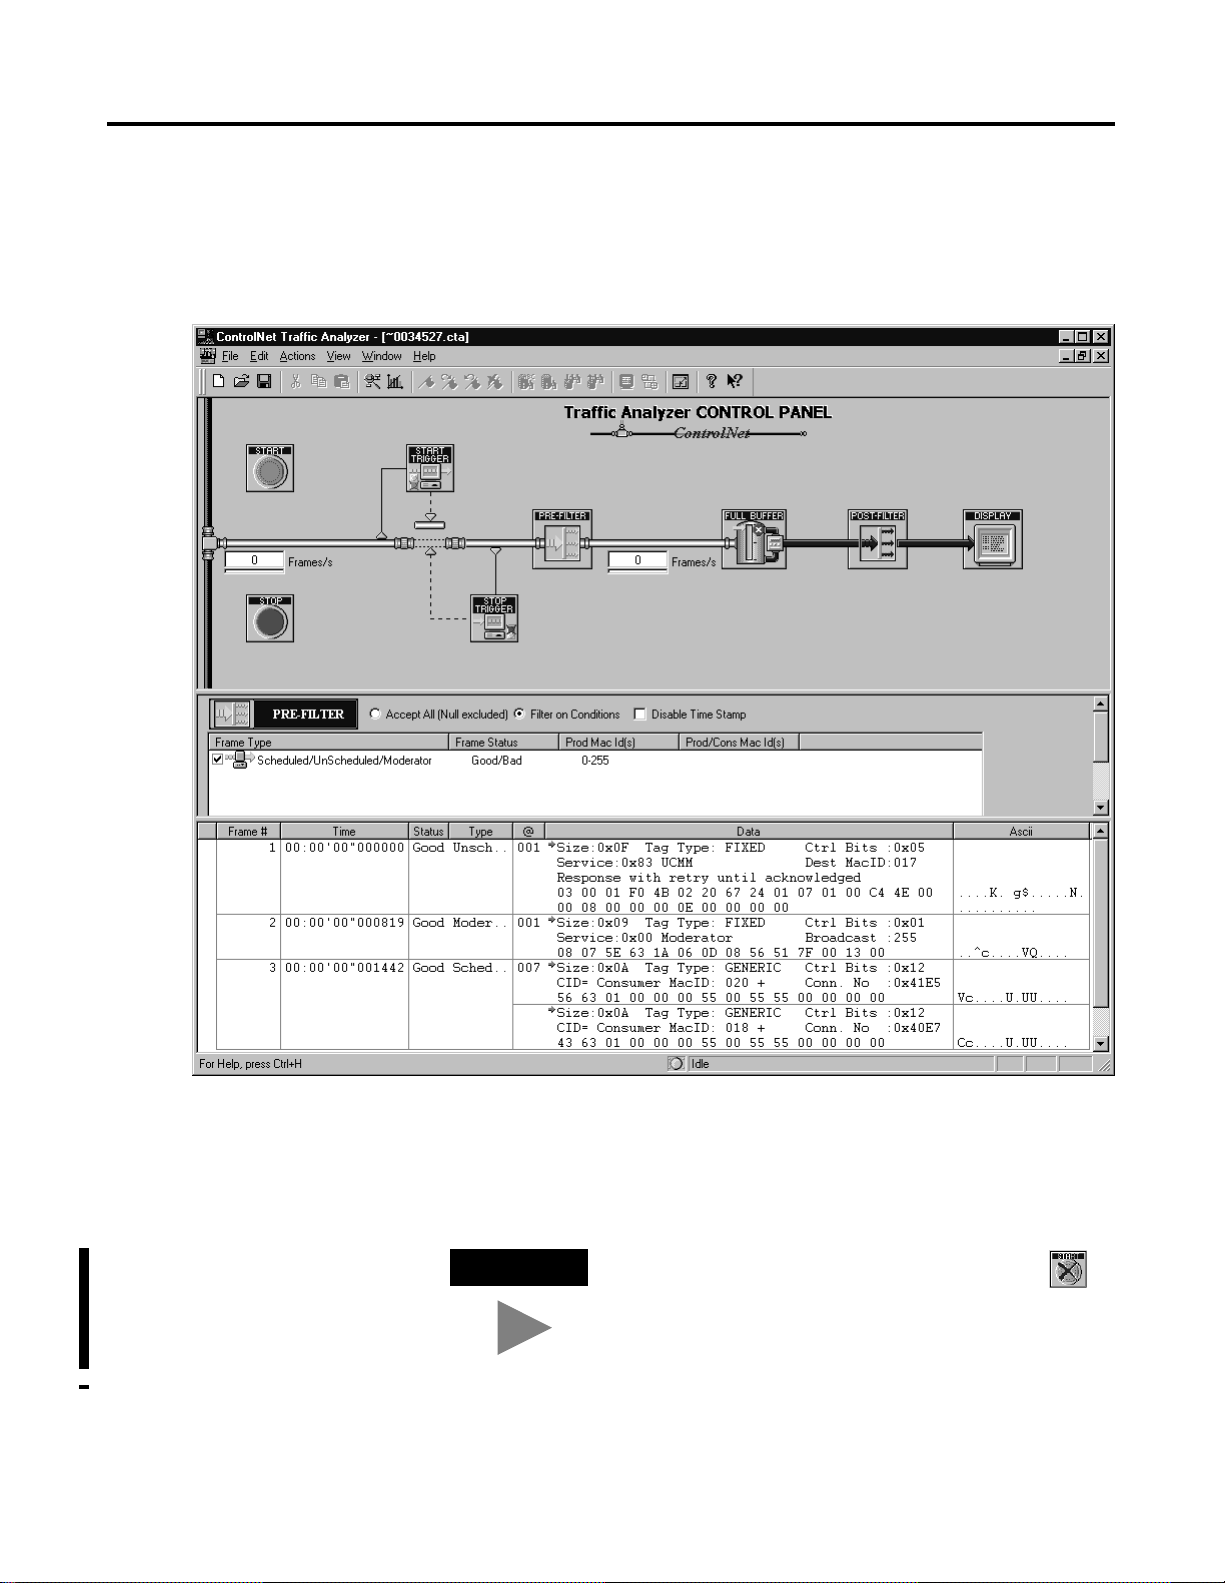
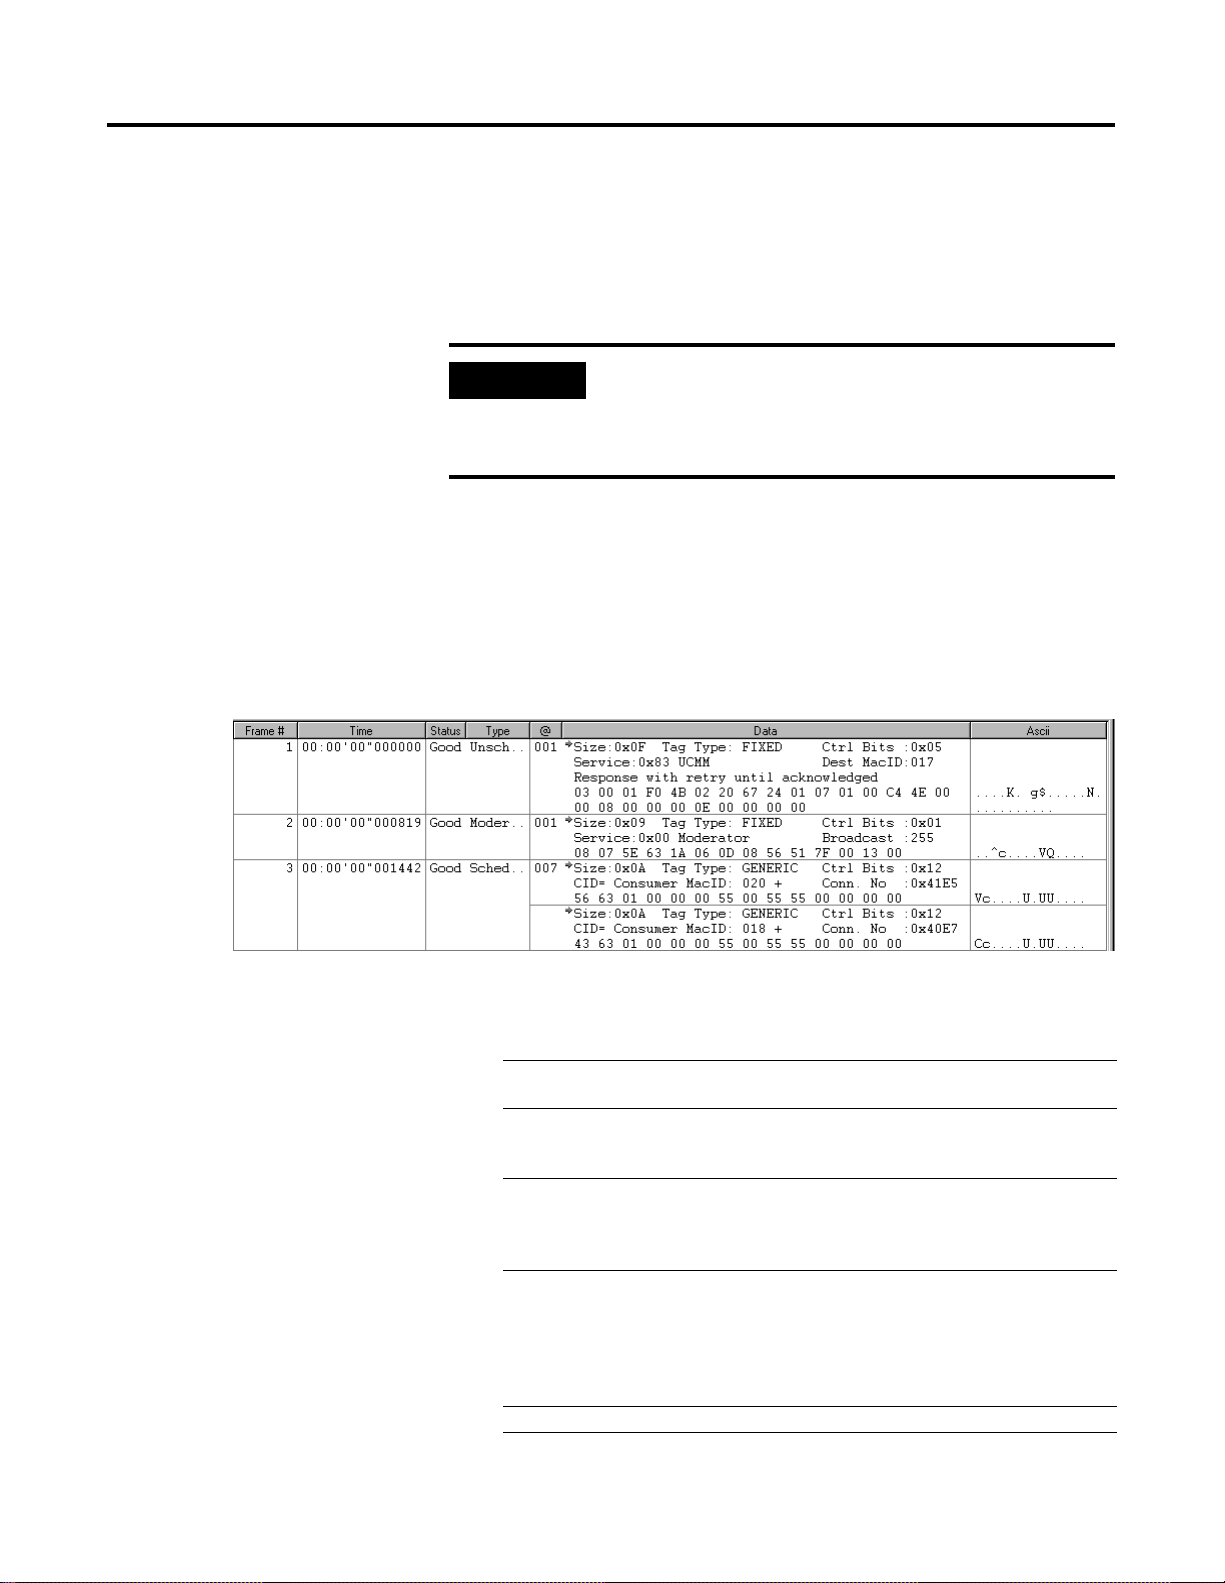
The following graphic shows an example of MAC Frame Data view,
showing three frame records in Interpreted format. See “Data Format,”
page 5-2, for an explanation of the three data formats.
MAC Frame Data view information is interpreted as follows:
Column header name Identifies
Frame # the number of the recorded MAC frame in the collection
buffer.
Time the time formats. The four time formats are days, hours,
minutes, and seconds. See “Time Display,” page 5-2 for
an explanation of each option.
Status the status of frames. The three statuses are Good, Bad,
and Null. See “Status of Frames,” page 4-4 for an
explanation of each status. In short display, only the first
letter (G, B, or N) of each term displays.
Type the displayed types. The four types are Sched..
(scheduled), Unsch.. (unscheduled), Moder.. (moderator),
or Aborted (a special case used only for bad frames). See
“ControlNet Messages,” page 1-2 for an explanation of
each type. In short display, only the first letter (S, U, M, or
A) of each term displays.
@ the source MAC ID.
Publication 9220-052C-EN-P - August 2002
Page 26

2-6 The ControlNet Traffic Analyzer Tool
Column header name Identifies
Data the data formats. The three data formats are MAC Frame,
Lpacket, and Interpreted. See “Data Format,” page 5-2 for
an explanation of the data formats.
ASCII an ASCII interpretation of the frame data.
Publication 9220-052C-EN-P - August 2002
Page 27

Accessories and Menus
Chapter
3
What This Chapter Contains
Accessories
Read this chapter for a description of the menu options and
other accessories provided in the Traffic Analyzer tool. The
following table describes what this chapter contains and where
to find specific information.
For information about See page
accessories 3-1
menus and shortcuts 3-2
The Toolbar
The toolbar contains buttons for commonly used menu items.
Use the toolbar to access these items quickly without opening
the menu. Each button is a graphical representation of a
command.
The toolbar is shown below. Only the buttons specific to the
Traffic Analyzer tool are defined.
Network
Information
Statistics
Add
Bookmark
Next
Bookmark
Previous
Bookmark
Delete All
Bookmarks
Advanced
Find
Simple
Find
Compute
Find
Previous
Find
Next
Publication 9220-052C-EN-P - August 2002
Time
Difference
Display
Range
About
Data view
(Full Screen)
Help
Page 28
3-2 Accessories and Menus
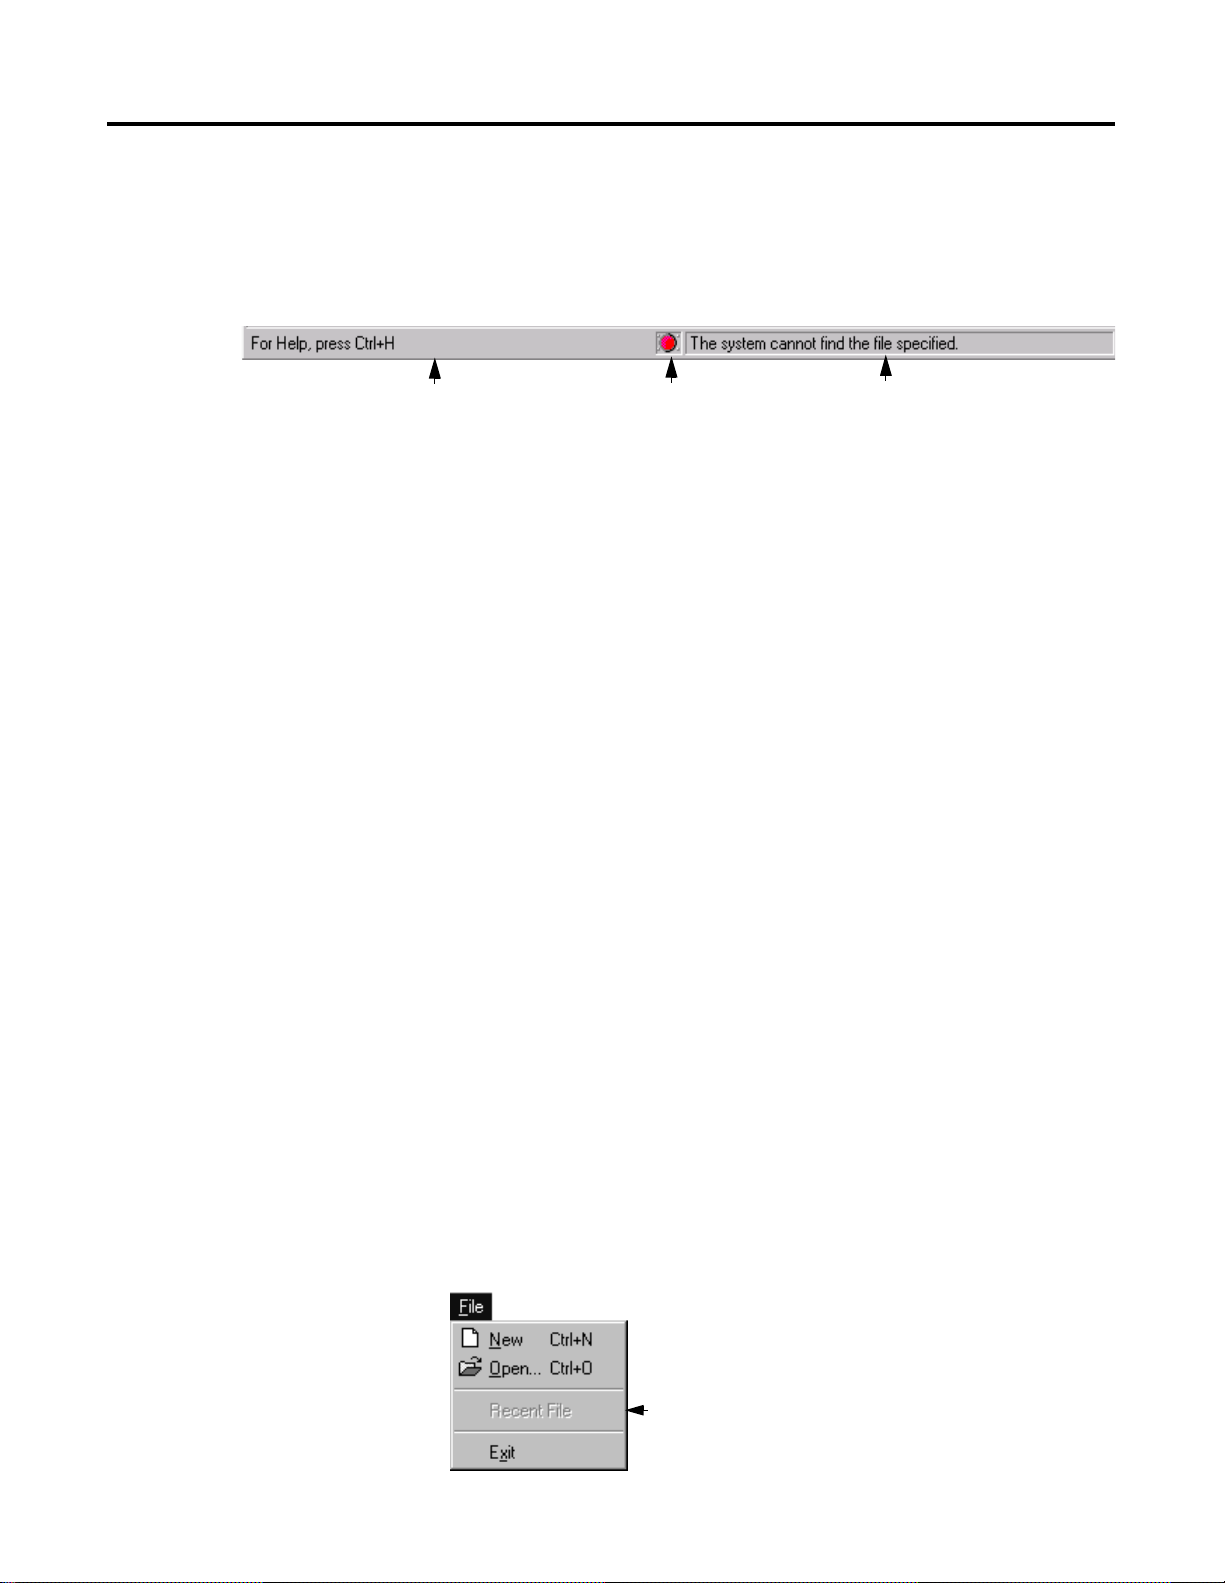
The Status Bar
The Status Bar contains three panes. Each pane’s function is described
in the following illustration.
This pane is used to pass messages. These
messages appear when you select an action
from a menu or from the toolbar. It gives a
brief description of the function.
Menus and Shortcuts
This pane represents an
LED and tells the
ControlNet driver status.
This pane is used to show status messages
from the ControlNet driver. These messages
appear when the driver state has changed
and could indicate a driver error.
Menus are used as entry points to do a specific action within your
application. You will sometimes find shortcuts associated to menu
entries. A shortcut is a simple way to do an action using a key or a
combination of keys. See Appendix A for a list of function and
shortcut keys.
You may use the Traffic Analyzer tool without the mouse interface expect a mouse is required to use the Compute Time Difference dialog
box which makes use of the drag and drop function.
Main Menu
The main menu is the entry point to the main actions you can perform
in the Traffic Analyzer tool. You will find the standard main menu
functions (i.e., New, Open, Save) as well as functions specific to the
Traffic Analyzer tool.
Publication 9220-052C-EN-P - August 2002
The following sections contain a summary of all menu options and the
corresponding shortcuts.
File Menu
The File menu contains the following options, if a project is not open:
The most recently opened
project(s) show in this area.
Up to four can be listed.
Page 29
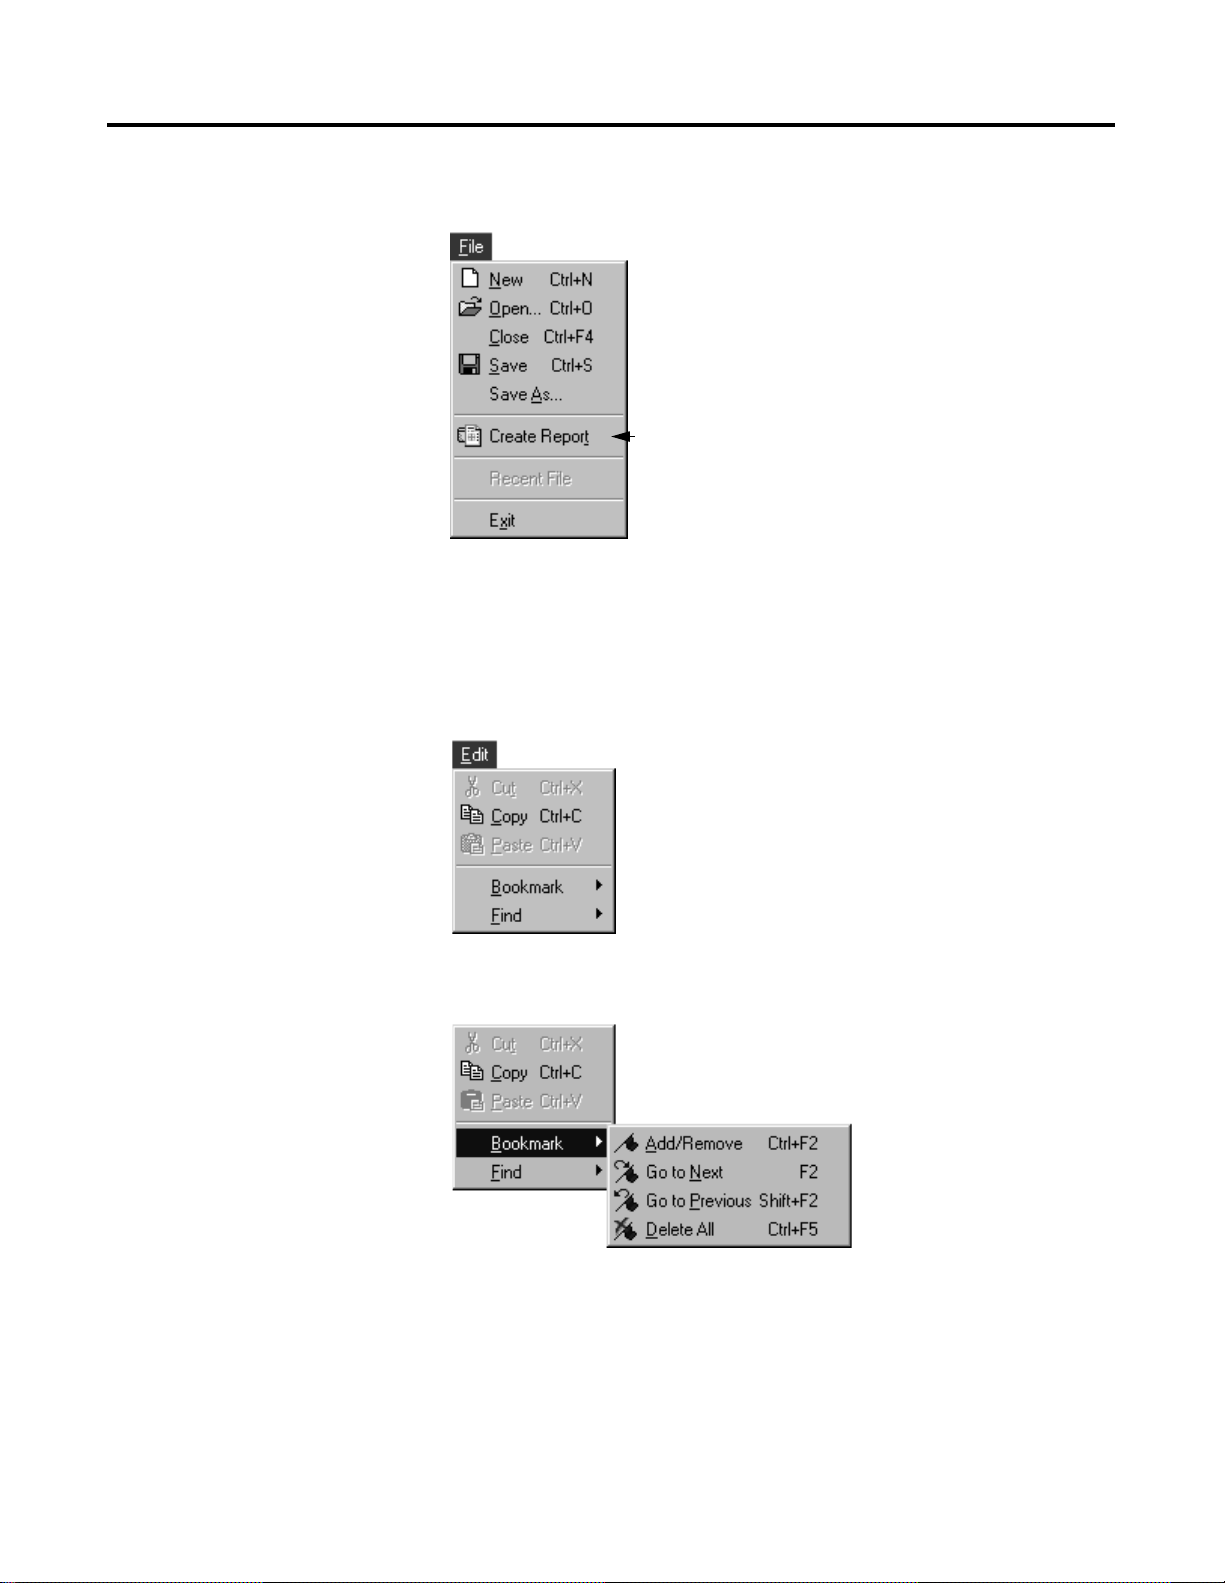
If a project is open, you see the following menu:
Creates a report
in RTF format.
Edit Menu
Accessories and Menus 3-3
When you click on Edit, you see the following menu:
Or, you see the bookmark menu:
Publication 9220-052C-EN-P - August 2002
Page 30

3-4 Accessories and Menus
Or the Find menu:
Once you define a find
criterion, you can find
the next or previous
string that matches the
criterion.
Actions Menu
When you click on Actions, you see the following menu if a project is
not open:
Display the Network Monitoring window. You
must be connected to a ControlNet network.
Display the Statistical Information window. You
must be connected to a ControlNet network.
Switch to online mode or offline mode.
Reset the ControlNet card and ASIC timer.
You see the following menu if a project is open:
Start or stop recording the current project.
Publication 9220-052C-EN-P - August 2002
Only the frames you select will display.
Displays the Compute Time Difference
dialog box.
Page 31

Or, you see the Control Panel menu:
Accessories and Menus 3-5
View Menu
When you click on View, you see the following menu if a project is
not open:
Displays the Options dialog box.
Or, if a project is open, you see the following menu:
Make MAC Frame Data view the full
screen. Click again to return to normal
view.
Publication 9220-052C-EN-P - August 2002
Page 32

3-6 Accessories and Menus
Window Menu
You see the following menu when you click on Window:
Help Menu
You see the following menu when you click on Help:
Pop-up Menus
A pop-up menu is hidden until you perform an action that causes it to
display. In the ControlNet Traffic Analyzer, pop-up menus are
implemented only from Filter/Trigger view or MAC Frame Data view
by clicking the right mouse button.
Publication 9220-052C-EN-P - August 2002
Page 33

Accessories and Menus 3-7
Stop Trigger List Pop-up Menu
You see the following pop-up menu when you click the right mouse
button in the stop trigger list area of Filter/Trigger view:
Displays the Edit Trigger dialog
box so you can add or edit a
trigger condition.
Start Trigger List Pop-up Menu
You see the following pop-up menu when you click the right mouse
button in the start trigger list area of Filter/Trigger view:
Displays the Trigger on data
dialog box so you can add or edit
a trigger on a condition.
Pre-Filter List Pop-up Menu
You see the following pop-up menu when you click the right mouse
button in the pre-filter list area of Filter/Trigger view:
Displays the Edit Filter dialog
box so you can add or edit a
filter condition.
Publication 9220-052C-EN-P - August 2002
Page 34

3-8 Accessories and Menus
Post-Filter List Pop-up Menu
There are two list areas for a post-filter. They are referred to as the top
list and the bottom list. You see the following pop-up menu when you
click the right mouse button in the post-filter top list area:
Displays the Edit Filter dialog
box so you can add or edit a
filter condition.
You see the following pop-up menu when you click the right mouse
button in the post-filter bottom list area:
Displays the Edit LPacket
dialog box so you can add or
edit an LPacket condition.
MAC Frame Data View Pop-up Menu
You see the following pop-up menu when you click the right mouse
button in MAC Frame Data view:
Displays the Display View
Options dialog box so you can
change display options.
Publication 9220-052C-EN-P - August 2002
Page 35

Triggers and Filters
Chapter
4
What This Chapter Contains
Triggers
The following table describes what this chapter contains and
where to find specific information.
For information about See page
triggers 4-1
filters 4-8
A trigger is used to initiate a process or to act as a reaction.
There are two types of triggers: start and stop. A start trigger
initiates the process; a stop trigger stops the process.
Start Trigger View
You see the Start Trigger view when you click the
icon in the Control Panel or from the Actions menu, click on
Control Panel>Define Start Trigger.
A trigger is a prerequisite condition, a passage toward the
pre-filter phase. Once you start a trigger condition, there is
nothing else to do. There are two types of trigger conditions:
one related to the contents of the frames and the other related to
the time elapsed. You can combine the two types of conditions.
Triggering will start provided at least one condition is met.
Start Trigger
Enable/disable
trigger condition.
The Start Trigger view is shown below.
Start without conditions.
Start trigger condition.
Start with conditions.
Define how much time is
needed to start the analysis.
Publication 9220-052C-EN-P - August 2002
Page 36

4-2 Triggers and Filters
You can initiate only one specific Start Trigger: a Start Trigger on Data.
See page 4-4 for more information.
The following illustration shows start trigger conditions with a Start
Trigger on Data added.
Start Trigger on Data.
Stop Trigger View
You see the Stop Trigger view when you click the
the Control Panel or from the Actions menu, click on Control
Panel>Define Stop Trigger. There are two types of trigger conditions:
one related to the contents of the frames and the other related to the
time elapsed. You can combine the two types of conditions.
Triggering will stop provided at least one condition is met.
You can check the Center Trigger in Ring Buffer box to add data
following the first Stop on Conditions and keep the preceding data as
well. Otherwise, when the box is not checked, the data in the buffer is
the data preceding the Stop Trigger.
The Stop Trigger view is shown below.
Stop without conditions.
Stop with conditions.
Define how much time is
needed to stop the
analysis after a Start.
Stop Trigger
Stop the trigger in the center
of the Ring buffer, keeping
data preceding and adding
data following the given
condition.
icon in
Enable/disable
trigger condition.
Publication 9220-052C-EN-P - August 2002
Stop trigger condition.
Page 37

Triggers and Filters 4-3
How to Configure a Trigger
When you choose to start or stop a trigger on a condition, a trigger list
area appears. You can add, edit, or delete conditions in this list area
by clicking the right mouse button. A pop-up menu appears.
TIP
Another way you can add, edit, or delete a trigger condition is
by pressing the Insert, Enter, or Delete key, respectively.
When you add or edit a trigger condition, you see the following box:
Define the Producer MAC ID(s) you want to trigger. You can define:
• a single Producer MAC ID (in a range 0-255).
• a group of IDs. Separate the range by a hyphen (2-88). The range can extended from 0 to 255.
• multiple IDs. Separate the IDs by a semi-colon (2;9;27) a group and multiple IDs (2-7;3;8).
If you do not enter a value in this field, the full range (0-255) becomes the default value.
Define the Producer MAC ID(s) you want to trigger in each LPacket.
• For a Generic LPacket, it is the Producer/Consumer ID.
• For a Fixed LPacket, it is the Destination ID.
• For a Broadcast ID, it is 255.
You can define:
• a single Producer/Consumer MAC ID (in a range 0-255).
• a group of IDs. Separate the range by a hyphen (2-88).
The range can extended from 0 to 255.
• multiple IDs. Separate the IDs by a semi-colon (2;9;27).
• a group and multiple IDs (2-7;3;8).
Publication 9220-052C-EN-P - August 2002
Page 38

4-4 Triggers and Filters
TIP
For a definition of Status, see below.
For a definition of Type, see page 1-2.
Status of Frames
A frame status can be defined in three ways:
Good: a frame correctly received by the Traffic Analyzer tool.
•
Bad: the Traffic Analyzer tool has detected a problem with this
•
frame (e.g. a CRC problem).
Null: a frame without any data.
•
Type of Frame
A frame type can also be defined in three ways:
Scheduled
•
Unscheduled
•
Moderator
•
See page 1-2 for a definition of frame types.
How to Configure a Start Trigger on Data
When you want to add trigger onto data, you add a Start Trigger on
Data condition. This implies that you are looking for a specific
element and that you know its source, the type of frame, and its
destination.
At the LPacket level, the standard trigger only checks for the
Producer/Consumer MAC ID in a Generic LPacket or for the
Destination MAC ID in a Fixed LPacket. Within these limits, you can
create an unlimited list of trigger conditions that will not affect the
processing time during the record.
Publication 9220-052C-EN-P - August 2002
If you want to start after a specific LPacket - for example if there is a
sign of future network troubles - you can create a unique and
elaborate trigger condition on an LPacket.
Page 39

Triggers and Filters 4-5
Each byte in the LPacket Header can be checked; a sequence of a
maximum of 8 bytes will appear in the LPacket data field.
When you choose to start a trigger on a condition, a trigger list area
appears. You can add, edit, or delete a Start Trigger on Data condition
in this list area by clicking the right mouse button. A pop-up menu
appears. Only one Start Trigger on Data can be created at one time.
Once a Start Trigger on Data has been added, it can be edited or
deleted. Also, you can create a Start Trigger on Data only on Good
Scheduled or Good Unscheduled frames.
If you choose to add or edit a Start Trigger on Data, the Trigger on
data dialog box appears. You must enter a value in the Producer MAC
ID and/or Consumer MAC ID, and link data (if an offset is defined)
field(s). Three examples follow showing the different options you can
choose in this dialog box.
Publication 9220-052C-EN-P - August 2002
Page 40

4-6 Triggers and Filters
Example 1: Fixed LPacket
When you want to add a Start Trigger on Data with a fixed Tag, you
see the following dialog box.
Choose the type of LPacket
you want to trigger.
When Fixed Tag is chosen,
enter the Service byte in
hexadecimal.
Enter the size of the LPacket
you want to trigger (enter in
hexadecimal).
Enter the control bits of the
LPacket you want to trigger
(enter in hexadecimal).
The fields reflect the value
entered in the
field above. See “Interpreting
Control Bits,” page 4-16.
Control Bits
Enter the Producer MAC ID
you want to trigger.
Define the frame type.
Enter the destination
MAC ID you want to trigger.
Enter the LPacket Link Data
Offset in hexadecimal. The
LPacket Link Data Offset 0
starts after the LPacket
Header.
Publication 9220-052C-EN-P - August 2002
Enter the Link Data you want
to check. Enter in
hexadecimal, limited to eight
characters.
Select a predefined UCMM service. This value will
automatically set the Offset and Link Data. Use this
as a quick way to find a service without entering it.
This option is disabled if Generic Tag is selected.
Page 41

Triggers and Filters 4-7
Example 2: Generic LPacket
When you choose Generic Tag, two new fields appear to define the
Connection ID. They replace the
fields.
Service
and
Consumer MAC ID
Define the Producer/Consumer
MAC ID you want to trigger.
Set the Connection ID
Number in hexadecimal.
The Predefined UCMM Service is disable when Generic
Tag is chosen.
Publication 9220-052C-EN-P - August 2002
Page 42

4-8 Triggers and Filters
Example 3: Fixed LPacket Using the UCMM Service List
When you want to use a predefined UCMM Service, you see the
following dialog box.
The UCMM Service
number is 0x83.
Filters
The LPacket Data Offset
and Link Data values are
forced to match the
selected UCMM Service.
Filtering refers to a selection used to allow frames that meet a specified
condition to pass from the network to the buffer, or from the buffe r to the
display. For exa mple, you may set u p a n input filte r tha t wil l onl y let frames
with a source MAC ID of 10 to pass from the network to the collection
buffer. There are two filtering levels:
A predefined UCMM Service is selected.
• Pre-filter
: determine which frames you will put into the buffer.
This is a sorting procedure used mainly for adding filters on the
destination of a frame.
• Post-filter
: determine which frames are going to be in the buffer,
i.e., which ones you want to see on the screen. This is the
second level of sorting, more precise and elaborate than the
pre-filter sort.
Publication 9220-052C-EN-P - August 2002
Page 43

Pre-Filter View
Triggers and Filters 4-9
Enable/disable
filter condition.
You see this view when you have selected the
Control Panel.
TIP
You can also access the Pre-Filter view from the Actions
menu: Control Panel>Define Pre-Filter.
The Pre-filter view is shown below.
Click on this radio button
to get all frames from
the network except
the null.
Pre-Filter condition.
Click on this radio
button to filter on
conditions.
Check this box to Disable the
time stamping (the time will
not be included in the data
capture).
Pre-Filter
icon in the
Disable Time Stamp
ASIC provides time indication for each frame. If the network traffic
conditions are extremely heavy and/or the data capture is missing
traffic, then you may need to lighten the task of the ASIC. You can do
this by disabling the Time Stamp. See Chapter 8, “Troubleshooting.”
How to Configure a Pre-Filter
When you choose to filter on conditions, a filter condition list area
appears. You can add, edit, or delete a pre-filter condition in this list
area by clicking the right mouse button. A pop-up menu appears.
TIP
Another way you can add, edit, or delete a filter condition is by
pressing the Insert, Enter, or Delete key, respectively.
Publication 9220-052C-EN-P - August 2002
Page 44

4-10 Triggers and Filters
When you add or edit a pre-filter, you see the following dialog box:
Define the Producer MAC ID(s) you want to filter. You can define:
• a single Producer MAC ID (in a range 0-255).
• a group of IDs. Separate the range by a hyphen (2-88).
The range can extended from 0 to 255.
• multiple IDs. Separate the IDs by a semi-colon (2;9;27).
• a group and multiple IDs (2-7;3;8).
If you do not enter a value in this field, the full range (0-255) becomes the default value.
Define the Producer MAC ID(s) you want to filter in each LPacket.
• For a Generic LPacket, it is the Producer/Consumer ID.
• For a Fixed LPacket, it is the Destination ID.
• For a Broadcast ID, it is 255.
You can define:
• a single Producer/Consumer MAC ID (in a range 0-255).
• a group of IDs. Separate the range by a hypen (2-88).
The range can extended from 0 to 255.
• multiple IDs. Separate the IDs by a semi-colon (2;9;27).
• a group and multiple IDs (2-7;3;8).
TIP
For a definition of Status, see page 4-4.
For a definition of Type, see page 1-2.
Publication 9220-052C-EN-P - August 2002
Page 45

Post-Filter View
Triggers and Filters 4-11
Click on this radio button
to get all stored frames
from the Data Buffer.
You see this view when you have selected the
Control Panel.
TIP
Click on this radio
button to filter on
conditions.
Y ou can also acce ss the Post-Fi lter view from t he Actions
menu: Control Panel>Define Pre-Filter.
Click this button to enable any changes
in post-filtering. This will update the
MAC Frame Data view.
Post-Filter
icon in the
Enable/disable
filter condition.
First Post-Filter condition. The
“Yes” means LPacket filter is enabled.
Second Post-Filter condition.
LPacket filter is enabled.
How to Configure a Post-Filter
Defining a post-filter is a little bit more complex than defining a
pre-filter. Post-filtering provides a more precise way of filtering. When
you choose to post-filter on conditions, two filter condition list areas
appear. These two lists have been designed to show all the
information needed by the post-filter.
• the first list looks like the Pre-Filter list and performs almost the
same function; it will be referred to as the top list.
• the second list is used to filter on some LPacket data and will be
referred to as the bottom list.
Publication 9220-052C-EN-P - August 2002
Page 46

4-12 Triggers and Filters
You can add, edit, or delete a post-filter condition in these two list
areas by clicking the right mouse button. A pop-up menu appears.
TIP
Another way you can add, edit, or delete a post-filter condition
is by pressing the Insert, Enter, or Delete key, respectively.
When you add or edit a post-filter in the top list, you see the
following dialog box:
Define the Producer MAC ID(s) you want to filter. You can define:
• a single Producer MAC ID (in a range 0-255).
• a group of IDs. Separate the range by a hyphen (2-88).
The range can extended from 0 to 255.
• multiple IDs. Separate the IDs by a semi-colon (2;9;27).
• a group and multiple IDs (2-7;3;8).
If you do not enter a value in this field, the full range (0-255) becomes the default value.
Publication 9220-052C-EN-P - August 2002
Enable filter on an LPacket. This enables the
bottom post-filter list. You will see a “Yes” in the
Filter LPacket column in the Filter/Trigger view.
TIP
For a definition of Status, see page 4-4.
For a definition of Type, see page 1-2.
Disable filter on an LPacket. This disables the
bottom post-filter list. You will see a “No” in the
Filter LPacket column in the Filter/Trigger view.
Page 47

When Any Tag is selected, you
cannot base your selection on
Tag values.
Enter the size of the LPacket
header (in hexadecimal).
Triggers and Filters 4-13
When you enable LPacket filtering and you want to add or edit frame
conditions in the bottom list, you see the following dialog box:
Define the Producer/Consumer MAC ID(s) you want to filter in each LPacket.
• for a Generic LPacket, it is the Producer/Consumer ID.
• for a Fixed LPacket, it is the Destination ID.
• for a Broadcast ID, it is 255.
You can define:
• a single Producer/Consumer MAC ID (in a range 0-255).
• a group of IDs. Separate the range by a hypen (2-88).
The range can extended from 0 to 255.
• multiple IDs. Separate the IDs by a semi-colon (2;9;27).
• a group and multiple IDs (2-7;3;8).
• If you do not enter a value in this field, the full range (0-255) becomes the default value.
Enter the control bits of
the LPacket header
(in hexadecimal).
The fields reflect the value
entered in the
field above. See “Interpreting
Control Bits,” page 4-16.
Enter the LPacket Link Data
Offset (in hexadecimal).
Control Bits
Enter the LPacket Link Data
you want to check (in
hexadecimal).
IMPORTANT
In the preceding example, all the fields have been filled in for
illustration purposes but not all of them are required fields.
When Any Tag is checked, only one of the following fields
must be filled in:
• Size
• Ctrl Bits
• Prod/Cons MAC ID
• Link Data and an Offset
Publication 9220-052C-EN-P - August 2002
Page 48

4-14 Triggers and Filters
The UCMM Service number
is forced at 0x83 when a
predefined UCMM Service is
selected.
The values in the Offset and
Link Data fields are forced
when a predefined UCMM
Service is selected.
When you choose the Fixed Tag option, the Service field appears and
you see the following dialog box:
When Fixed Tag is chosen,
the Service field appears.
Select a predefined UCMM Service.
IMPORTANT
When Fixed Tag is chosen, it is not necessary to fill any fields
because the
Fixed Tag option is automatically entered on
several bits in the Control Bits field (see the Acc. Always, Tag
Pad, and Fixed Screen fields above).
If you don’t enter a value in the Ctrl Bits field, “Fixed” appears in
the Control Bits column in the bottom list area of Post-Filter
view. If the Ctrl Bits field is filled in, the interface checks the
consistency with the Fixed Tag option; in the Post-Filter view,
Control Bits field, a hexadecimal value will replace the “Fixed”
string. See “Interpreting Control Bits,” page 4-16.
Publication 9220-052C-EN-P - August 2002
Page 49

Triggers and Filters 4-15
When you choose the Generic Tag option, the Connection field appears
and you see the following dialog box:
When Generic Tag is chosen, the Connection
Number field appears.
Enter the Connection
Number in hexadecimal.
IMPORTANT
When Generic Tag is chosen, it is not necessary to fill any
fields because the
Generic Tag option is automatically entered
on several bits in the Control Bits field.
If you don’t enter a value in the Ctrl Bits field, “Generic” appears
in the Control Bits column in the bottom list area of Post-Filter
view. If the Ctrl Bits field is filled in, the interface checks the
consistency with the Generic Tag option; in the Post-Filter view,
Control Bits field, a hexadecimal value will replace the “Generic”
string. See “Interpreting Control Bits,” on the next page.
Publication 9220-052C-EN-P - August 2002
Page 50

4-16 Triggers and Filters
Interpreting Control Bits
The bits of the control field are numbered 0 through 7 and are described
below.
Bit 0 - Fixed Tag (type of LPacket)
Bit 0 is the least significant bit of the control field. Bit 0 indicates the type of
LPacket. When set (bit 0 = 1), the LPacket is a fixed tag LPacket. Conversely, when
clear (bit 0 = 0), the LPacket is a generic tag LPacket.
Bit 1 - Tag Pad (Odd Tag Size)
Bit 1 of the control field indicates whether the tag field contains an even or odd
number of bytes. When clear (bit 1 = 0), it indicates that the tag contains an even
number of bytes. When set (bit 1 = 1), it indicates that the tag contains an odd
number of bytes. A fixed LPacket has an even tag so bit 1 = 0 and a generic LPacket
has an odd tag so bit 1 = 1.
Bit 2 - Data Pad (Odd Link Data Size)
Bit 2 of the control field indicates whether the link data contains an even or odd
number of bytes. When clear (bit 2 = 0), it indicates that the link data contains an
even number of bytes. When set (bit 2 = 1), it indicates that the link data contains
an odd number of bytes.
Bit 3 - Reserved
Bit 3 of the control field is reserved.
Bit 4 - Generic Tag (Type of LPacket)
Bit 4 of the control field is the inverse of bit 0 (see bit 0 above). If bit 0 is clear, then
bit 4 will be set. If bit 0 is set, then bit 4 will be clear.
Bit 5, 6, 7 - Reserved 7:5
Bits 5, 6, and 7 of the control field are reserved.
Publication 9220-052C-EN-P - August 2002
Page 51

Display Information
Chapter
5
What This Chapter Contains
Display View Options
If you do not change the Traffic Analyzer controls in any way,
the data will display the same way it displayed after the last
post-filter you defined. You have the option of displaying data
differently using the Display View Options dialog box. The
following table describes what this chapter contains and where
you can find specific information.
For information about See page
display view options 5-1
tools to manage frames 5-6
When you are ready to create a new document, you can choose
display options. The Display View Options dialog box enables
you to choose both time display and data format options.
IMPORTANT
You can change the default display view options. They
will apply to every new project you create until you
change the options again. See page 7-11 for more
information.
The Display View Options dialog box is shown below.
Publication 9220-052C-EN-P - August 2002
Page 52

5-2 Display Information
Time Display
The time can be expressed as absolute or relative. You can also
change the time resolution.
The Display View Options dialog box appears when you click on the
Display
area, click right with the mouse button and click Define Display.
The time display options are defined below.
icon on the Control Panel or, in the MAC Frame Data view
Click this button To
No Time remove the Time column from MAC Frame Data view.
Select this option if the time is not significant.
Absolute Time express the time as absolute – from the time when ASIC
was started.
Relative Time express the time as relative to the first pre-filter frame.
Time between Frames express the time between two sequential frames in MAC
Frame Data view.
IMPORTANT
If the last record was configured with the Pre-Filter Disable
Time Stamp option enabled, all Time Display options will be in
shadow (no access to them). The No Time option will be forced.
You can change the type of time information that will show in MAC
Frame Data view.
Click on To show the time the data was collected in
Days days, hours, minutes, and seconds
Hours hours, minutes, and seconds
Minutes minutes and seconds
Seconds seconds
Data Format
The following section describes the three data format options.
Data can be viewed in three ways:
• MAC Frame
• LPacket
• Interpreted
Publication 9220-052C-EN-P - August 2002
Page 53

Display Information 5-3
MAC Frames
MAC Frame data is displayed in hexadecimal, plain information with
no separation between each other. The MAC Frame data format is
shown below.
Between two LPackets, the CNA10 ASIC adds two bytes, which are
shown only in the hexadecimal display. Use the following table of
CNA10 ASIC tag index and description to interpret these two bytes.
CNA10 Tag Index Description
sm, 0xF8 LPacket from the NAP port
sm, 0xF9 Scheduled LPacket from the wire
sm, 0xFA Unscheduled LPacket from the wire
sm, 0xFB Moderator LPacket from the wire
Note: sm = Source MAC ID
Please note that bad MAC Frames are always displayed in the MAC
Frame format. An example is shown below with the LPacket tag index
underlined.
LPackets
Data is displayed in hexadecimal but the different LPackets are
separated from one another. A small arrow on the left side of the text
indicates a new LPacket is starting. The LPacket data format is shown
below.
Publication 9220-052C-EN-P - August 2002
Page 54

5-4 Display Information
Interpreted
Each LPacket Header is interpreted. The first two lines of each LPacket
details the contents of the LPacket Header. The Interpreted data
format is shown below.
The next two sections describe LPacket Header information for fixed
and generic tags.
LPacket Header for a Fixed Tag:
The LPacket Header for a fixed tag is composed of: Size + Control bits
+ Service + Destination MAC ID.
See the following table for fixed tag service numbers and their
description.
Fixed Tag Service Description
0x00 Moderator
0x01 – 0x08 Vendor specific
0x09 Ping request
0x0A – 0x14 Vendor specific
0x15 tMinus
0x16 – 0x28 Vendor specific
0x29 Ping reply
0x2A – 0x3F Vendor specific
0x40 – 0x6F Reserved
0x70 – 0x7F Vendor specific
0x80 I’m alive
0x81 Link parameters
0x82 Reserved
0x83 UCMM
0x84 TUI
0x85 Reserved for IP
0x86 WAMI
Publication 9220-052C-EN-P - August 2002
Page 55

Display Information 5-5
Fixed Tag Service Description
0x87 Reserved
0x88 Keeper UCMM
0x89 – 0x8B Reserved
0x8C – 0x8F Time distribution
0x90 Debug
0x91 – 0xAF Reserved
0xD0 – 0xEF Group addresses
0xF0 – 0xFF Vendor specific
In case of a UCMM Service, a third line is added and interprets the first
byte of the LPacket data, which contains the UCMM command code.
See the Interpreted data format, page 5-4, Frame # 1, for an example.
See the following table for UCMM commands and their descriptions.
Command Description
0 Reserved
0x01 Acknowledge a request
0x02 Request with retry until acknowledged
0x03 Response with retry until acknowledged
0x04 Request with no acknowledge and no response
0x05 Acknowledge a response
0x06 Response which will not retry (no acknowledge)
0x07 Request with retry until response (no acknowledge)
0x08 Request which will not retry and will cause a code 6 response
0x09-0xFF Reserved
Lpacket Header for a Generic Tag:
The LPacket Header for a generic tag is composed of: Size + Control
bits + Connection ID (CID). The CID is composed of a Consumer or
Producer MAC ID plus a Connection Number.
See the ControlNet International Specification for more information on
service numbers and commands. The ControlNet International
Specification can be purchased from ControlNet International.
Publication 9220-052C-EN-P - August 2002
Page 56

5-6 Display Information
Other Options
Three other options appear in the Data Format section of the Display
View Options dialog box:
Show ASCII - if you check this box, the ASCII column displays
•
Short Display - if you check this box, the Status and Typ e
•
columns take on an abbreviated form (only the initials of each
status and type display)
Show Frame # - if you check this box, the Frame # column
•
displays
Tools to Manage Frames
The Traffic Analyzer tool contains several functions to help you
manage the documents you create.
Bookmarks
If you want to mark some data lines, you can set bookmarks on them.
Bookmarks are used to easily jump from one marked line to another.
The Traffic Analyzer tool provides the following Bookmark options:
Add/Remove bookmarks
•
Go to the Next bookmark
•
Go to the Previous bookmark
•
Delete all bookmarks
•
Access these bookmark options from the Edit menu, the MAC Frame
Data view pop-up menu, or use the corresponding Hot keys. See “Edit
Menu,” page 3-3, for more information.
When you add a bookmark on a line, a small flag ( ) displays in the
left margin. Once you have added two or more bookmarks, you can
use the Go to Next or Go to Previous bookmark options to jump from
one bookmark to another.
Publication 9220-052C-EN-P - August 2002
The current bookmark looks like this: . When you want to jump to
the next or the previous bookmark, you always do it from the current
bookmark. Use the Delete All bookmark option to delete all the
bookmarks.
Page 57

Display Information 5-7
Find Data
The Traffic Analyzer tool provides two find options: simple find and
advanced find.
Simple Find
Use the simple find function to search for ASCII or Hexadecimal data
within MAC
You see this dialog box:
Frame Data view
. Access Simple Find from the Edit menu.
The Find function will rest on the first byte found in the data column
of each MAC Frame, in however data format it is displayed.
Advanced Find
Use the advance find function to search directly for coded information
in a MAC Frame. Access the Advanced Find function from the Edit
menu.
Publication 9220-052C-EN-P - August 2002
Page 58

5-8 Display Information
When you access Advanced Find, you see the following dialog box:
The top part of this dialog box is similar to the Edit Filter dialog box in Post-Filter. See
page 4-12 for more information.
Click this box to
show or hide the
bottom part of this
dialog box.
Publication 9220-052C-EN-P - August 2002
The bottom part of this dialog box is similar to the Edit LPacket dialog box in post-filter.
Note the three different LPacket Header tags. Each tag has a slightly different dialog box.
See pages 4-13 through 4-15 for more information.
Enter the type of information you want to search for (Producer MAC
ID, Frame Status/Type, Prod/Cons MAC ID, etc.) then click OK and
the search will start. If the information is found, the corresponding
line comes in view highlighted for easy recognition.
Select a Range of Frames
Use this function to select a range of frames for display. Access the
Select Range of Frames dialog box from the MAC Frame Data view
pop-up menu.
Page 59

Display Information 5-9
You see this dialog box:
Enter the first frame in the range in the Min frame number box and the
last frame in the range in the Max frame number box and click OK. By
default, the range of frames displayed correspond to the minimum &
maximum frame numbers contained in the current document. You can
only reduce the range.
Compute Time Difference
Use this function to compute the time difference between two
ControlNet frames. Access the Compute Time Difference dialog box
from the MAC Frame Data
You see this dialog box:
Click on the pin to
activate the dialog box.
When pinned, the box
is always visible.
The Compare Time
result window
always shows the
positive time
difference between
T1 and T2.
pop-up menu.
view
The frame number of the frame is used
to easily retrieve the corresponding frame.
Enter Time T1 and Time T2 values by clicking on a frame in MAC
Frame Data view and dragging and dropping it into the Time T1 or
Time T2 box.
Publication 9220-052C-EN-P - August 2002
Page 60

5-10 Display Information
After you drop a frame in either the T1 or T2 box, you see a marker
next to the corresponding frame in MAC Frame Data
view
. The
markers are shown below.
Next to the frame you dropped in the T1 box you see this marker
Next to the frame you dropped in the T2 box you see this marker
These markers serve as an easy way to retrieve a frame that is used as
a time comparison value.
To hide this window, click on the pin button so it is in the “not pin”
state. Then click in another window or just click on the X button.
IMPORTANT
T1 and T2 fields will contain absolute values.
Copy Data to the Clipboard
You can copy some frame data in text format and use it as
documentation. Select some lines from MAC Frame Data
choose Copy Data to Clipboard from the MAC Frame Data view
pop-up menu or use the CTRL+C shortcut. To retrieve the data, open
a word processing application and use the paste function.
You can select more than one line at a time. To select lines in a
sequence:
1. Click on a line.
2. Hold the Shift key down.
3. Click on the last line in the range.
view
and
Publication 9220-052C-EN-P - August 2002
To select non-sequential lines hold the Ctrl key down while you click
on the lines you want to select.
The data format will correspond to the one that is displayed in MAC
Frame Data view.
Page 61

Chapter
Network Information and Statistics
6
What This Chapter Contains
Network Information
Network information and statistics cover 1 through 99 nodes.
The following table describes what this chapter contains and
where specific information can be found:
To read about the option See page
network information 6-1
statistics 6-2
The network information corresponds to dynamic data
collection over the ControlNet network. The following
information is contained within the Network Information dialog
box:
Mini-Who - displays the active nodes on the network.
•
some network attributes - the network attribute commands
•
analyze the current moderator frames and display the
following attributes:
Network Update Time (ms)
•
Scheduled Max. Node
•
Unscheduled Max. Node
•
Slot Time (
•
Blanking Time
•
Guard Band Start (
•
µs)
µs)
• Guard Band Center (
• Guard Band Prestart (
• Interval Modulus (NUTs)
• other network information that does not come from the
moderator. This information corresponds to Scheduled and
Unscheduled elements, for which the following
information is provided:
• scheduled information in the Interval Modulus average
bandwidth used and maximum bandwidth used
• average available unscheduled information and average
used unscheduled information in the Interval Modulus,
both expressed in bytes per second
µs)
µs)
Publication 9220-052C-EN-P - August 2002
Page 62

6-2 Network Information and Statistics
Access the Network Monitoring dialog box with the Network Information
button on the toolbar or from the Actions menu. You see this screen:
Mini-Who box.
Scheduled
Average
Bandwidth Used.
Active nodes on the network are highlighted.
Network Information
from the moderator.
Maximum Bandwidth Used.
Statistics
Publication 9220-052C-EN-P - August 2002
Average Available Unscheduled
Information in the Interval Modulus.
Average Used Unscheduled Information
in the Interval Modulus.
IMPORTANT
The bandwidth usage is computed over the Interval Modulus for
Scheduled and Unscheduled Information.
The following two statistic graphs are provided:
• network traffic
• network utilization
Page 63

Network Information and Statistics 6-3
In both cases, the statistical information corresponds to the selected
frames. A filter, similar to the one used for pre-filter, creates the
selection of data that is used for the statistical display. This
information is based off the interval count.
Statistical Data: Network Traffic
The Network Traffic bar graph shows how the traffic is distributed
among the nodes on the network as a function of selected ControlNet
frames.
The X-axis represents the Node addresses and the Y-axis represents
the number of MAC Frames that were received.
The Statistical Information dialog box, with Network Traffic displayed,
is shown below. Access the Statistic Information dialog box with the
Statistic button on the toolbar or from the Actions menu.
Select the Network
Traffic view.
Filter for the selection of data
that is used for statistical
display.
Publication 9220-052C-EN-P - August 2002
Page 64

6-4 Network Information and Statistics
Statistical Data: Network Utilization
The Network Utilization bar graph shows how a group of nodes use
the ControlNet network. The X-axis represents the time and the
Y-axis can represent a number of MAC Frames or a number of bytes.
The Statistical Information dialog box, with Network Utilization
displayed, is shown below. Access the Statistic Information dialog box
with the Statistic button on the toolbar or from the Actions menu.
Publication 9220-052C-EN-P - August 2002
Select the Network
Utilization view.
Filter for the selection of data
that is used for statistical
display.
Page 65

Other Commands and Options
Chapter
7
What This Chapter Contains
Save a Document
The following table describes what this chapter contains and
where to find specific information.
To See page
save a document 7-1
create a report 7-2
go offline/online hardware settings 7-3
reset the ControlNet card and time 7-6
learn about application options 7-6
Use the Save dialog box to select one of three save options. The
document will be saved as a .CTA file. See Appendix A for
shortcut keys.
Access the save options from the File menu.
The save options are:
• All Data and Control Panel Settings - all Control Panel
Settings and all pre-filtered data will be saved.
• Displayed Data and Control Panel Settings - only displayed
data and Control Panel settings will be saved. This option
is useful if you do not need to save all pre-filtered data or
if you want to minimize the size of the document you
save.
Publication 9220-052C-EN-P - August 2002
Page 66

7-2 Other Commands and Options
All data discarded by the post filter or out of the data range will
be lost once the document is closed. If you chose this option,
you see this warning:
Click on “Yes” to continue to save the data. Click on “No” to
cancel the save.
Control Panel Settings Only - If you choose this option, only the
•
Control Panel settings will be saved. Choose this option when
you do not need to save the data but just the way it was
captured. If you choose this option, you see this warning:
Create a Report
Publication 9220-052C-EN-P - August 2002
Click on “Yes” to continue to save the data. Click on “No” to
cancel the save.
IMPORTANT
You can generate a report in RTF format. From the File menu, select
Create Report or use a shortcut key. See Appendix A for File menu
shortcut keys.
You can choose among three different report options that would
include the complete Traffic Analyzer configuration for frame data.
IMPORTANT
If a save or warning box does not appear, that means Automatic
save options have been previously selected. See “Save
Options,” page 7-7.
You can customize your report with a template and keywords.
See page 7-8.
Page 67

Other Commands and Options 7-3
When you choose the Create Report option, you see this dialog box:
The report options are:
Control Panel Settings Only - only the Control Panel settings will
•
be included in the report
All Displayed Data - the Control Panel settings plus all displayed
•
data will be included in the report
Range of Displayed Data - the dialog box expands to display
•
two additional fields as shown below
Go Offline/Online Hardware Settings
Use these two additional fields to define limits for the range of
data that will be included in the report. The report will include
Control Panel settings plus the range of data you enter in the
two fields. Enter the first frame in the range in the Min frame
number box and the last frame in the range in the Max frame
number box and click OK. By default, the values displayed in the
two fields correspond to the minimum and maximum frame
numbers contained in the current document. You can only
reduce the amount of data that will be included in the report.
Use this option to toggle between going off line and on line and to set
up hardware settings to go on line. You can choose to use either the
CN-1000 or the 1784-PCC hardware setting when going on line.
Publication 9220-052C-EN-P - August 2002
Page 68

7-4 Other Commands and Options
Access the Offline/Online Hardware Settings command from the
Actions menu.
TIP
You will see the Hardware Settings menu option only when the
Traffic Analyzer is in offline mode.
A description of the offline and online modes follow.
offline - you cannot execute the commands assessed through
•
the use of the ControlNet card. This lets other applications that
need the card to use this hardware resource.
online - you can execute all commands accessed through the
•
use of the ControlNet card selected in the Hardware Settings
dialog box.
TIP
IMPORTANT
IMPORTANT
Start
When the Traffic Analyzer tool is off line, the
icon in the
Control Panel will contain a red X ( ). You can click the
Start
icon to access the Hardware Settings dialog box.
If the ControlNet card is not plugged in when the computer is
started up under Windows NT 4.0, the Traffic Analyzer tool will
automatically go into offline mode. Do not remove the
ControlNet card until the computer is powered down.
If you remove the ControlNet card while working on line under
Windows 95, the Traffic Analyzer tool will automatically go into
offline mode.
Publication 9220-052C-EN-P - August 2002
Page 69

Other Commands and Options 7-5
The Hardware Settings dialog box is shown below.
Identifies the CN-1000 ISA
card or the 1784-PCC PC card.
Identifies the PC
card slot number
(Windows 95 only).
Accept the selected device
as the online mode default.
Click on a device and then click OK, even if there is only one device
listed. You can choose a card only if it is the correct hardware version
(i.e., CNA20.01.04.18 or higher) and if the card is not locked by
another application.
Identifies the dual-port
memory address.
Identifies the
interrupt number.
“Yes” indicates an application
is using the card and therefore
the card is unavailable to other
applications. “No” indicates
the card is available to use.
Update the hardware settings dialog box after a device has
been added or removed. Important: Use the Refresh button
to see a change in status of an application or hardware
without havi ng to close and open the dialog box.
Identifies the
application under
which the device is
locked.
Identifies the
firmware version
of the device.
The tool will go into online mode and now whenever you launch the
Traffic Analyzer tool, it will launch into online mode using the device
you selected. You can go into offline mode by choosing
Actions>Offline.
Once you have chosen the hardware setting, it becomes the default
setting until you change the setting or remove the card. If you remove
the card, the next time the Traffic Analyzer tool is launched, it will try
to go on line but will not find the hardware.
You will see the following error message:
Publication 9220-052C-EN-P - August 2002
Page 70

7-6 Other Commands and Options
Click OK. Then you see this message:
If you select YES, the Traffic Analyzer tool goes off line and resets the
default hardware setting. Then the next time you launch the Traffic
Analyzer, it will launch off line.
If you select NO, the Traffic Analyzer tool goes off line and keeps the
default hardware setting. Then the next time you launch the Traffic
Analyzer, it will try to go on line by using the default setting.
Reset the ControlNet Card and Time
Application Options
This option performs a hardware reset (an ASIC reset). Access the
Reset Card and Time command from the Actions menu.
This function also resets the ASIC timer. Consequently, the absolute
time will start from zero at the time of reset.
The Options dialog box includes four tabs. Use these tabs to access the
different application options. These options are:
Save
•
Buffer
•
Report
•
Display View Options
•
Publication 9220-052C-EN-P - August 2002
Page 71

Other Commands and Options 7-7
Save Options
Use the save option to define an automatic save configuration. The
Options dialog box is shown below with the Save options displayed.
The dialog box is divided into two independent parts:
upper part - When you enable Automatic save by using the option
•
below, you gain access to the Automatic Save Option radio
buttons. Whichever radio button you select defines the default
automatic saving mode. Consequently, the Save dialog box
described on page 7-1 will not display when an automatic save
option is selected.
• lower part - the first two automatic save options (the two that
include data options) have a warning box attached to them. Use
the Partial Save Warnings box to enable (Partial Save Warnings
box is checked) or disable these warning boxes.
Buffer Size
You can select the maximum amount of data you want to collect into
the buffer via the Buffer Options dialog box. You select the increments
by 256 Kbytes (KB). The default value is 512 KB (the minimum value).
Publication 9220-052C-EN-P - August 2002
Page 72

7-8 Other Commands and Options
The maximum value is 4,096 KB. Click the up or down arrow key to
select the size.
The Buffer Options dialog box is shown below.
IMPORTANT
In the example above, a maximum of 512 KB of data will be
collected into the Buffer.
Report Option
Use the Report Option to access a template to customize an RTF
report you have created. You customize this report by using
keywords. The path to the template and the strings that will replace
the keywords are configured in the following dialog box.
Publication 9220-052C-EN-P - August 2002
Page 73

Checking the Remove
MAC Frame header
option displays the data
without header information
listed for all frames. This
will significantly reduce the
size of the report.
Other Commands and Options 7-9
To create a template, click on the keyword (REF, VERSION, AUTHOR,
etc.) to enable the String field. Type the string in the String field and
click OK to save your personal cover page in RTF format. Put all
keywords you need between pound (#) symbols.
A sample template report called MODEL.RTF is provided as part of the
Traffic Analyzer tool installation. Access this report by clicking on the
folder to the right of the Include RTF File for report box. Clear the field
of the file by clicking on the X. You can customize and reuse this
sample report. There is also an example of this sample on the next
page. A complete list of the keywords you can use are:
REF
•
• VERSION
• AUTHOR
• COMPANY
• DEPARTMENT
• DATE
• PRJ_NAME
The date and project name keywords are not listed in the Options
Report dialog box. The Date is the day the report was created. The
Project Name is the name of the document you are currently working
on in the Traffic Analyzer tool.
Publication 9220-052C-EN-P - August 2002
Page 74

7-10 Other Commands and Options
ControlNet Traffic Analyzer Project
#COMPANY#
#PRJ_NAME#
Project Documentation
Reference #REF#
Version #VERSION#
#DATE#
#COMPANY# / #DEPARTMENT#
Author
#AUTHOR#
Publication 9220-052C-EN-P - August 2002
Page 75

Other Commands and Options 7-11
Default Display View Options
You see the following dialog box when you click on the Default
Display View Options tab in the Options dialog box:
This dialog box corresponds to the Display View Options dialog box
described in Chapter 5. See page 5-1 for information about display
view options.
IMPORTANT
The options you choose will be the default options for the next
new document you create.
Publication 9220-052C-EN-P - August 2002
Page 76

7-12 Other Commands and Options
Notes:
Publication 9220-052C-EN-P - August 2002
Page 77

Troubleshooting
Chapter
8
What This Chapter Contains
Warning Messages
This chapter helps you troubleshoot the Traffic Analyzer tool.
The following table describes what this chapter contains and
where to find specific information.
To troubleshoot the warning condition: See page
overflow/underflow FIFO error in the ControlNet ASIC 8-1
the personal computer is not able to unload all the received data 8-2
overflow error in the ControlNet Traffic Analyzer internal buffer 8-5
You may receive one or two warning boxes called Data Capture
Missing Traffic at the end of a record before frames are displayed
in MAC Frame Data view. If you receive one of these warnings,
it means that one or more times during the record, the Traffic
Analyzer tool was unable to receive all the MAC frames from the
network. The Traffic Analyzer tool may lose MAC frames
because of three situations:
overflow/underflow FIFO error in the ControlNet ASIC
•
the personal computer is unable to unload all the received
•
data
overflow error in the ControlNet Traffic Analyzer internal
•
buffer
Overflow/Underflow FIFO
Error in the ControlNet ASIC
Each of these situations is described below.
You see the following warning when this condition occurs:
Publication 9220-052C-EN-P - August 2002
Page 78

8-2 Troubleshooting
An overflow/underflow FIFO error in the ControlNet ASIC may occur
when there is heavy network traffic. You can prevent this error from
occurring by disable the Time Stamp in pre-filter view. See “Pre-Filter
View,” page 4-9. Disabling the Time Stamp will reduce the amount of
work the ControlNet ASIC must perform.
After you click on Continue in the warning box, the error message
displays in the last frame of MAC Frame Data view.
The PC Is Not Able to Unload All the Received Data
You see the following warning when this condition occurs:
This error occurs when your personal computer cannot keep up with
the ControlNet ASIC traffic. You can use several methods to solve this
error condition:
dedicate your computer to the ControlNet Traffic Analyzer tool
•
(no background tasks running)
remove the Power Management
•
use a faster computer
•
reduce the amount of traffic seen by your computer through
•
defined trigger and pre-filter conditions. Reduce the amount of
traffic by disabling the following MAC frame status or types:
• Null
• Scheduled
• Unscheduled
• Moderator
Publication 9220-052C-EN-P - August 2002
The hardware passes through all traffic as enabled by the start,
stop, and pre-filter conditions in the Traffic Analyzer Control
Panel settings.
When the start trigger is defined as “Start Always” and the stop
trigger is defined as “No Stop Condition,” then the traffic seen by
the software is only defined by the pre-filter.
Page 79

Troubleshooting 8-3
Refer to the following two examples for clarification.
Good Scheduled Data Example
Following the procedure below to define only good scheduled data.
1. Define the start condition as Start Always.
2. Define the stop condition as No Stop Condition.
3. Define the pre-filter condition as Filter on Conditions.
4. Click the right mouse button in Filter/Trigger view and select
Add Filter Condition.
5. Check only the Good status and Scheduled type boxes in the
Edit Filter dialog box.
6. Click OK.
Pre-Filter Filte r/Trigger view sh ould loo k like t he fol lowing i llustra tion.
Only good scheduled data will pass through the hardware and
be seen by the software.
All Unscheduled Data Starting on Good Moderator Example
Following the procedure below to define all unscheduled data starting
on good moderator.
Publication 9220-052C-EN-P - August 2002
Page 80

8-4 Troubleshooting
1. Click the Start on Conditions radio button in Start Trigger
view.
2. Click the right mouse button in Filter/Trigger view and select
Add Trigger Condition.
3. Check the Good status and Moderator type boxes in the Edit
Trigger dialog box.
4. Click OK.
Start Trigger Filter/Trigger view should look like the following
illustration.
5. Click the No Stop Condition radio button in Stop Trigger view.
6. Click the Filter on Conditions radio button in Pre-Filter view.
7. Click the right mouse button in Filter/Trigger view and select
Add Filter Condition.
8. Check only the Good and Bad status boxes and Unscheduled
type box in the Edit Filter dialog box.
9. Click OK.
Pre-Filter Filter /Trigger view sh ould loo k like t he foll owing i llust rati on.
Publication 9220-052C-EN-P - August 2002
Page 81

Troubleshooting 8-5
Only good and bad unscheduled data and good moderator data
will pass through the hardware and be seen by the software.
TIP
You can combine methods to solve this error condition.
After you click on Continue in the warning box, the error message
displays in the last frame of MAC Frame Data view.
Overflow Error in the
ControlNet Traffic Analyzer
IMPORTANT
You see the following warning when this condition occurs:
If both the first and second error condition occur in the same
record, you will be informed of both errors in one warning box:
Internal Buffer
Publication 9220-052C-EN-P - August 2002
Page 82

8-6 Troubleshooting
This error occurs when there is heavy network traffic and the Traffic
Analyzer tool is not fast enough to analyze all the frames for the
triggers and pre-filters. You can use several methods to solve this error
condition:
dedicate your computer to the ControlNet Traffic Analyzer tool
•
(no background tasks running)
use a faster computer
•
reduce the amount of traffic seen by your computer through
•
defined trigger and pre-filter conditions. Reduce the amount of
traffic by disabling the following MAC frame status or types:
Null
•
Scheduled
•
Unscheduled
•
Moderator
•
The hardware passes through all traffic as enabled by the start, stop,
and pre-filter conditions in the Traffic Analyzer Control Panel settings.
When the start trigger is defined as “Start Always” and the stop trigger
is defined as “No Stop Condition,” then the traffic seen by the software
is only defined by the pre-filter.
Refer to the two examples on page 8-3 for clarification.
TIP
You can combine the methods to solve this error condition.
After you click on Continue in the warning box, the error message
displays in the exact frame in which the error occurred. Therefore, this
error message can appear several times in MAC Frame Data view.
TIP
For post-filter conditions, error frames are always displayed in
MAC Frame Data view. To display only error frames, create a
post-filter (click on the Filter on Conditions radio button)
without conditions (the top list must be empty) and apply the
filter.
Publication 9220-052C-EN-P - August 2002
Page 83

Function and Shortcut Keys
Appendix A
What This Appendix Contains
Function Keys
This appendix lists the function and shortcut keys you can use with
the Traffic Analyzer tool.
The following function keys correspond to the menu actions.
Menu Action Function Key
Add/Remove Bookmark Ctrl+F2
Go to Next Bookmark F2
Go to Previous Bookmark Shift+F2
Delete All Bookmarks Ctrl+F5
Simple Find Ctrl+F3
Advanced Find F4
Find Next (find criterion) F3
Find Previous (find criterion) Shift+F3
Start Recording F10
Stop Recording F11
Network Information Ctrl+F10
Statistics Ctrl+F11
Select Range of Frames F8
Compute Time Difference F9
Close (project) Ctrl+F4
Define Display (view options) F7
Data (full screen) F12
1 Publication 9220-RM052C-EN-P - August 2002
Page 84

A-2 Function and Shortcut Keys
Shortcut Keys
The following shortcut keys correspond to menu actions.
File Menu Shortcut Keys
Refer to the following table for File menu shortcut keys.
Menu Action Shortcut Key
New Ctrl+N or Alt+F then N
Open Ctrl+O or Alt+F then O
Close Alt+F then C
Save Ctrl+S or Alt+F then S
Save as Alt+F then A
Create Report Alt+F then T
List of latest files opened Alt+F then 1, or 2 or 3 or 4
Exit (the tool) Alt+F then X
Edit Menu Shortcut Keys
Refer to the following table for Edit menu shortcut keys.
Menu Action Shortcut Key
Cut Ctrl+X or Alt+E then T
Copy Ctrl+C or Alt+E then C
Paste Ctrl+V or Alt+E then P
Add/Remove Bookmark Alt+E+B+A
Go to Next Bookmark Alt+E+B+N
Go to Previous Bookmark Alt+E+B+P
Delete All Bookmarks Alt+E+B+D
Simple Find Alt+E+F+S
Advanced Find Alt+E+F+A
Find Next (find criterion) Alt+E+F+F
Find Previous (find criterion) Alt+E+F+P
Publication 9220-RM052C-EN-P - August 2002
Page 85

Function and Shortcut Keys A-3
Actions Menu Shortcut Keys
Refer to the following table for Actions menu shortcut keys.
Menu Action Shortcut Key
Start Recording Alt+A then N
Stop Recording Alt+A then S
Network Information Alt+A then N
Statistics Alt+A then S
Offline/Online Hardware Settings Alt+A then O
Reset Card and Time Alt+A then R
Define Start Trigger Alt+A+C+D
Define Stop Trigger Alt+A+C+E
Define Pre-Filter Alt+A+C+F
Define Post-Filter Alt+A+C+P
Define Display (view options) Alt+A+C+Y
Select Range of Frames Alt+A+F
Compute Time Difference Alt+A+D
View Menu Shortcut Keys
Refer to the following table for View menu shortcut keys.
Menu Action Shortcut Key
Toolbar Alt+V then T
Status Bar Alt+V then S
Options Alt+V then O
Data (full screen) Alt+V then D
Window Menu Shortcut Keys
Refer to the following table for Window menu shortcut keys.
Menu Action Shortcut Key
Cascade Alt+W then C
Tile Alt+W then T
Arrange Icons Alt+W then A
Display on top Alt+W then 1, 2 ... or n
Publication 9220-RM052C-EN-P - August 2002
Page 86

A-4 Function and Shortcut Keys
Help Menu Shortcut Keys
Refer to the following table for Help menu shortcut keys.
Menu Action Shortcut Key
Help Topics Ctrl+H or Alt+H then H
Readme and Internet Support Alt+H then R
About Firmware version Alt+H then F
About Traffic Analyzer Alt+H then A
Start Trigger Menu Shortcut Keys
Refer to the following table for Start Trigger menu shortcut keys.
Menu Action Shortcut Key
Add Trigger Condition INS
Edit Trigger Condition ENTER
Delete Trigger Condition DEL
Add Trigger on Data N/A
Edit Trigger on Data N/A
Delete Trigger on Data N/A
Cut Ctrl+X
Copy Ctrl+C
Paste Ctrl+V
Publication 9220-RM052C-EN-P - August 2002
Stop Trigger Menu Shortcut Keys
Refer to the following table for Stop Trigger menu shortcut keys.
Menu Action Shortcut Key
Add Trigger Condition INS
Edit Trigger Condition ENTER
Delete Trigger Condition DEL
Cut Ctrl+X
Copy Ctrl+C
Paste Ctrl+V
Page 87

Function and Shortcut Keys A-5
Pre-Filter Menu Shortcut Keys
Refer to the following table for Pre-Filter menu shortcut keys.
Menu Action Shortcut Key
Add Filter Condition INS
Edit Filter Condition ENTER
Delete Filter Condition DEL
Cut Ctrl+X
Copy Ctrl+C
Paste Ctrl+V
Post-Filter Menu Shortcut Keys
Refer to the following table for Pre-Filter menu shortcut keys.
Menu Action Top List Shortcut Key
Add Filter Condition INS
Edit Filter Condition ENTER
Delete Filter Condition DEL
Cut Ctrl+X
Copy Ctrl+C
Paste Ctrl+V
Menu Action Bottom List Shortcut Key
Add LPacket Condition INS
Edit LPacket Condition ENTER
Delete LPacket Condition DEL
Publication 9220-RM052C-EN-P - August 2002
Page 88

A-6 Function and Shortcut Keys
MAC Frame Data View Menu Shortcut Keys
Refer to the following table for MAC Frame Data view menu function
and shortcut keys.
Menu Action Shortcut Key
Add/Remove Bookmark Ctrl+F2
Go to Next Bookmark F2
Go to Previous Bookmark Shift+F2
Delete All Bookmarks Ctrl+F5
Simple Find Ctrl-F3
Advanced Find Ctrl+F4
Find Next (find criterion) F3
Find Previous (find criterion) Shift+F3
Define Display (view options) F7
Select Range of Frames F8
Compute Time Difference F9
Copy Data to Clipboard Ctrl+C
Publication 9220-RM052C-EN-P - August 2002
Page 89

Index
A
accessories
status bar 3-2
toolbar 3-1
actions menu 3-4
shortcut keys A-3
advanced find 5-7
any tag 4-13
application options 7-6
buffer size 7-7
display view options 7-11
report option 7-8
save options 7-7
audience 1-3
B
bookmarks 5-6
buffer size 7-7
C
compute time difference 5-9
configuring
a post-filter
any tag 4-13
fixed tag 4-14
generic tag 4-15
a pre-filter 4-9
a start trigger on data 4-4
a trigger 4-3
control panel view 2-2
ControlNet
frame structure 1-3
information exchange 1-1
main structure 1-1
messages 1-2
copy data to clipboard 5-10
create a report 7-2
D
data format 5-2
interpreted 5-4
Lpacket 5-3
Lpacket header for fixed tag 5-4
Lpacket header for generic tag 5-5
MAC frame 5-3
default display view options 7-11
display view options 5-1
data format 5-2
interpreted 5-4
Lpacket 5-3
Lpacket header for fixed tag 5-4
Lpacket header for generic tag 5-5
MAC Frame 5-3
time display 5-2
E
edit menu 3-3
shortcut keys A-2
F
file menu 3-2
shortcut keys A-2
filter/trigger view 2-4
filters 4-8
post-filter
configuring 4-11
view 4-11
pre-filter
configuring 4-9
view 4-9
find data 5-7
advanced find 5-7
simple find 5-7
fixed tag 4-14
frame data view 2-5
frames
status 4-4
types 1-2
function and shortcut keys A-1
function keys A-1
MAC frame data view menu A-6
shortcut keys A-2
G
generic tag 4-15
go offline/online hardware settings 7-6
H
hardware recommendations 1-4
hardware settings 7-3
help menu 3-6
shortcut keys A-4
I
installation 1-5
Publication 9220-RM052C-EN-P - August 2002
Page 90

2 Index
M
MAC frame 5-3
data view
function and shortcut keys A-6
pop-up menu 3-8
main menu 3-2
actions menu 3-4
edit menu 3-3
file menu 3-2
help menu 3-6
view menu 3-5
window menu 3-6
menus and shortcuts 3-2
main menu 3-2
actions menu 3-4
edit menu 3-3
file menu 3-2
help menu 3-6
view menu 3-5
window menu 3-6
pop-up menus 3-6
frame data view 3-8
post-filter list 3-8
pre-filter list 3-7
start trigger list 3-7
stop trigger list 3-7
N
network information 6-1
Network Monitoring dialog box 6-2
Statistical Information dialog box 6-4
Network Monitoring dialog box 6-2
O
online/offline mode 7-6
P
pop-up menus
frame data view 3-8
post-filter list 3-8
pre-filter list 3-7
start trigger list 3-7
stop trigger list 3-7
post-filter
configuring 4-11
list pop-up menu 3-8
menu shortcut keys A-5
view 4-11
pre-filter
configuring 4-9
list pop-up menu 3-7
menu shortcut keys A-5
view 4-9
R
report option 7-8
reset ControlNet card and time 7-6
Rockwell Automation support 1-9
local product support 1-9
questions or comments about manual
1-10
technical product support 1-10
S
save a document 7-1
save options 7-7
select range of frames 5-8
shortcut keys A-1, A-2
actions menu A-3
edit menu A-2
file menu A-2
help menu A-4
post-filter menu A-5
pre-filter menu A-5
start trigger menu A-4
stop trigger menu A-4
view menu A-3
window menu A-3
simple find 5-7
software package 1-4
start trigger
list pop-up menu 3-7
menu shortcut keys A-4
view 4-1
statistics 6-2
network traffic 6-3
network utilization 6-4
status bar 3-2
status of frames 4-4
stop trigger
list pop-up menu 3-7
menu shortcut keys A-4
view 4-2
support 1-9
local product support 1-9
Publication 9220-RM052C-EN-P - August 2002
Page 91

Index 3
questions or comments about manual
1-10
technical product assistance 1-9
T
techniques used in the manual 1-9
terminology 1-8
time display 5-2
toolbar 3-1
tools to manage frames 5-6
bookmarks 5-6
compute time difference 5-9
copy data to clipboard 5-10
find data 5-7
advanced find 5-7
simple find 5-7
select range of frames 5-8
triggers 4-1
configuring 4-3
a start trigger on data 4-4
fixed Lpacket 4-6
generic Lpacket 4-7
UCMM generic Lpacket 4-8
start trigger view 4-1
stop trigger view 4-2
troubleshooting
overflow error in the ControlNet Traffic
Analyzer internal buffer 8-5
overflow/underflow FIFO error in the
ControlNet ASIC 8-1
the pc is not able to unload all the
received data 8-2
warning messages 8-1
types of frames 1-2
U
user interface 2-1
control panel view 2-2
filter/trigger view 2-4
frame data view 2-5
V
view menu 3-5
shortcut keys A-3
W
warning messages 8-1
overflow error in the ControlNet Traffic
Analyzer internal buffer 8-5
overflow/underflow FIFO error in the
ControlNet ASIC 8-1
the pc is not able to unload all the
received data 8-2
all unscheduled data starting on
good moderator example
8-3
good scheduled data example 8-3
window menu 3-6
shortcut keys A-3
Publication 9220-RM052C-EN-P - August 2002
Page 92

4 Index
Publication 9220-RM052C-EN-P - August 2002
Page 93

Pub. Title/Type ControlNet Traffic Analyzer
How Are We Doing?
Your comments on our technical publications will help us serve you better in the future.
Thank you for taking the time to provide us feedback.
You can complete this form and mail it back to us, visit us online at www.ab.com/manuals, or
email us at RADocumentComments@ra.rockwell.com
Cat. No.
9220--WINTA Pub. No. 9220-RM052C-EN-P Pub. Date August 2002 Part No. 957707-14
Please complete the sections below. Where applicable, rank the feature (1=needs improvement, 2=satisfactory, and 3=outstanding).
Overall Usefulness 1 2 3 How can we make this publication more useful for you?
Completeness
(all necessary information
is provided)
Technical Accuracy
(all provided information
is correct)
1 2 3 Can we add more information to help you?
procedure/step illustration feature
example guideline other
explanation definition
1 2 3 Can we be more accurate?
t ex t i ll u st r at i on
Clarity
(all provided information is
easy to understand)
Other Comments You can add additional comments on the back of this form.
Your Name
Your Title/Function Would you like us to contact you regarding your comments?
Return this form to: Allen-Bradley Marketing Communications, 1 Allen-Bradley Dr., Mayfield Hts., OH 44124-9705
Publication ICCG-5.21- January 2001 PN 955107-82
1 2 3 How can we make things clearer?
Location/Phone
___No, there is no need to contact me
___Yes, please call me
___Yes, please email me at __________________________
___Yes, please contact me via ________________________
Phone: 440-646-3176 Fax: 440-646-3525 Email: RADocumentComments@ra.rockwell.com
Page 94

Other Comments
PLEASE FASTEN HERE (DO NOT STAPLE)
PLEASE FOLD HERE
BUSINESS REPLY MAIL
FIRST-CLASS MAIL PERMIT NO. 18235 CLEVELAND OH
POSTAGE WILL BE PAID BY THE ADDRESSEE
NO POSTAGE
NECESSARY
IF MAILED
IN THE
UNITED STATES
PLEASE REMOVE
1 ALLEN-BRADLEY DR
MAYFIELD HEIGHTS OH 44124-9705
Page 95

Page 96

Publication 9220-RM052C-EN-P - August 2002 15 PN 957707-14
Supersedes Publication 9220-6.5. 2 - August 1999 Copyright © 2002 Rockwell Automation, Inc. All rights reserved. Printed in the U.S.A.
 Loading...