

Page 1
Instruction Sheet
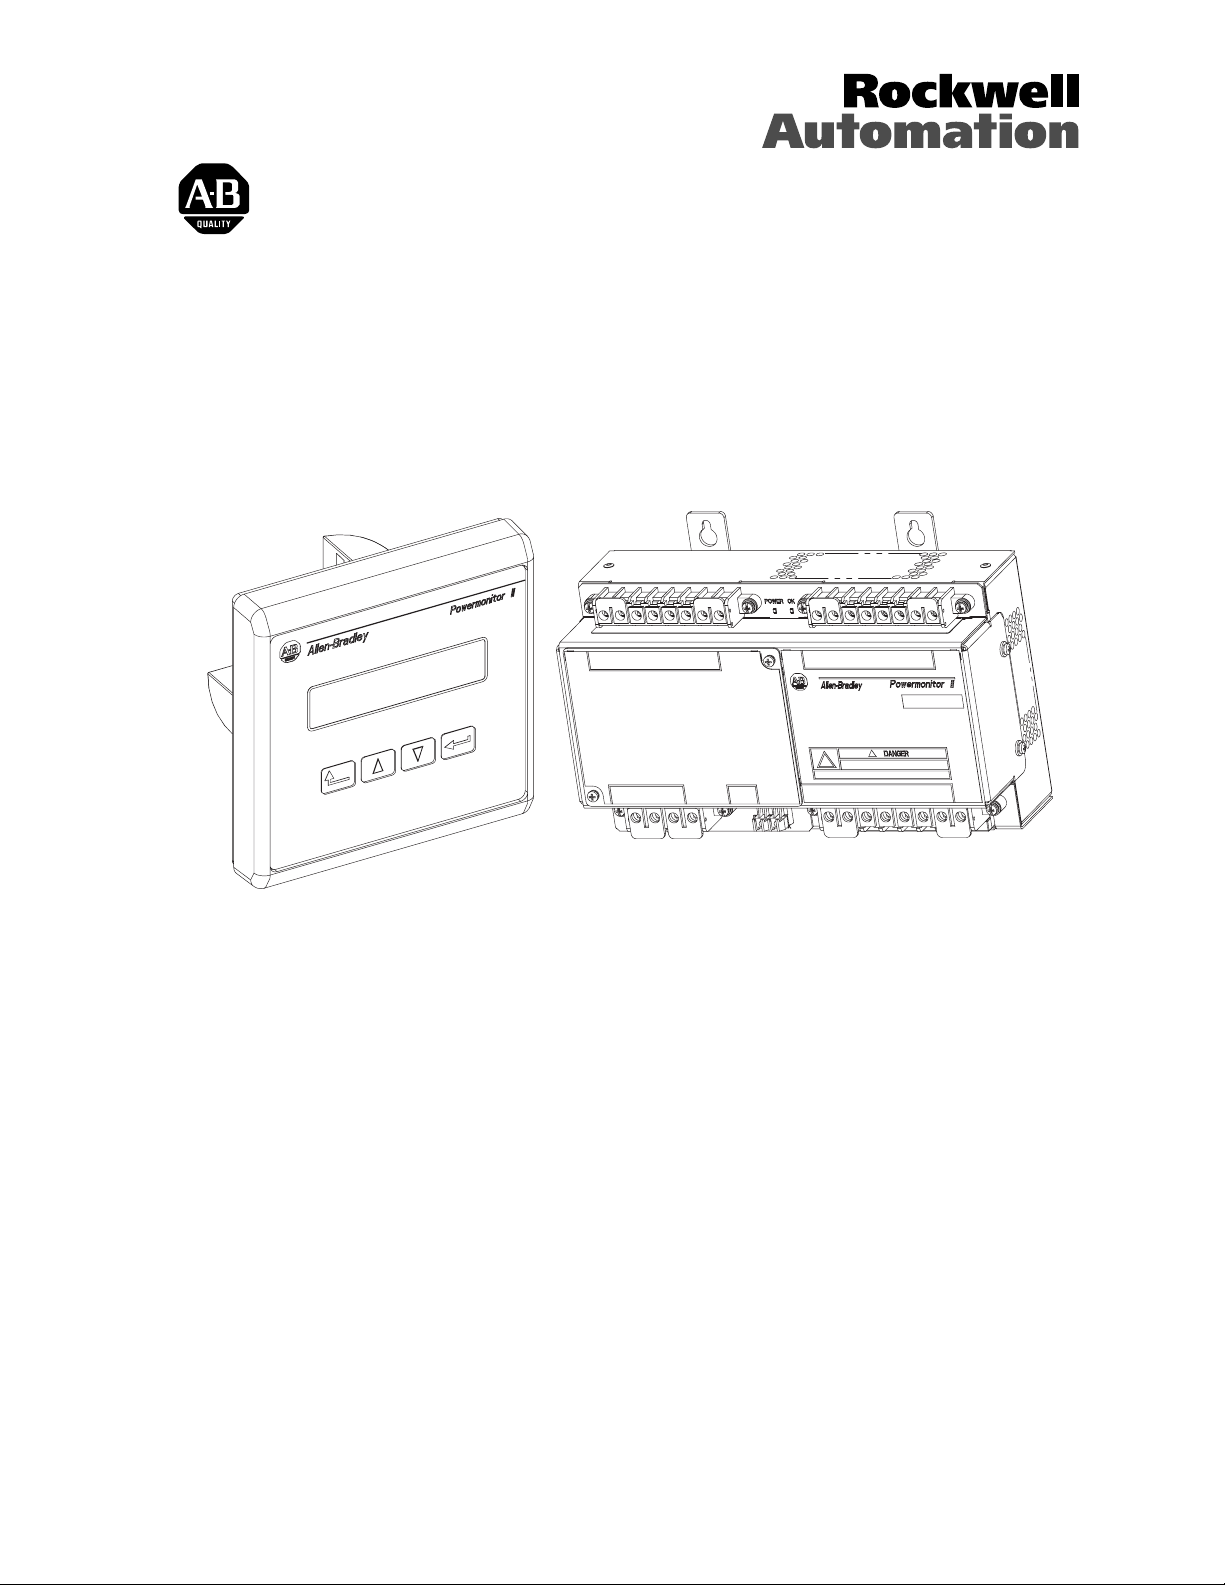
Bulletin 1403 Powermonitor II
(Cat. No. 1403-MM, 1403-LM, 1403-DM)
Cat. No. 1403-DM
Cat. No. 1403-MM, 1403-LM
Publication 1403-IN001A-US-P
Page 2

Important User Information
Solid-state equipment has operational
characteristics differing from those of
electromechanical equipment. Safety Guidelines
for the Application, Installation, and
Maintenance of Solid-state Controllers
(Publication SGI-1.1) describes some important
differences between solid-state equipment and
hard-wired electromechanical devices. Because
of this difference, and also because of the wide
variety of uses for solid-state equipment, all
persons responsible for applying this equipment
must satisfy themselves that each intended
application of this equipment is acceptable.
In no event will Rockwell Automation be
responsible for indirect or consequential
damages resulting from the use or application of
this equipment.
The examples and diagrams in this manual are
included soely for illustrative purposes. Because
of the many variables and requirements
associated with any particular installation, the
Rockwell Automation cannot assume
responsibility or liability for actual use based on
the examples and diagrams.
No patent liability is assumed by the Rockwell
Automation with respect to use o f information,
circuits, equipment, or software descr ibe d i n t his
manual. Reproduction of the contants of this
manual, in whole or in part, without written
permission of Rockwell Automation, is
prohibited.
Throughout this manual we use notes to make
you aware of safety considerations:
ATTENTION: Identifies
information about practices or
!
Attention statements help you to:
• identify a hazard
• avoid the hazard
• recognize the consequences.
Important:Identifies information that is critical
circumstances that can lead ot
personal injury or death, prop er ty
damage or economic loss.
for successful application and
understanding of the product.
Publication 1403-IN001A-US-P
Page 3

Using This Instruction Sheet Preface
What This Instruction Sheet Contains. . . . . . . . . . . . . . . . . . . . . . . . . . . P-1
For More Information on Additional Power Quality Products . . . . . . . . P-1
Terms and Conventions. . . . . . . . . . . . . . . . . . . . . . . . . . . . . . . . . . . . . . P-2
Product Description Chapter 1
Chapter Objectives . . . . . . . . . . . . . . . . . . . . . . . . . . . . . . . . . . . . . . . . . 1-1
Introduction . . . . . . . . . . . . . . . . . . . . . . . . . . . . . . . . . . . . . . . . . . . . . . . 1-1
General Description. . . . . . . . . . . . . . . . . . . . . . . . . . . . . . . . . . . . . . . . . 1-1
Performance Features . . . . . . . . . . . . . . . . . . . . . . . . . . . . . . . . . . . . . . . 1-1
Device Configuration . . . . . . . . . . . . . . . . . . . . . . . . . . . . . . . . . . . . . . . 1-1
Quick Start - Minimum Device Configuration . . . . . . . . . . . . . . . . . . . . 1-2
Measurements . . . . . . . . . . . . . . . . . . . . . . . . . . . . . . . . . . . . . . . . . . . . . 1-2
Displays. . . . . . . . . . . . . . . . . . . . . . . . . . . . . . . . . . . . . . . . . . . . . . . . . . 1-2
Communications . . . . . . . . . . . . . . . . . . . . . . . . . . . . . . . . . . . . . . . . . . . 1-3
Software and System Integration. . . . . . . . . . . . . . . . . . . . . . . . . . . . . . . 1-3
PLC Configuration . . . . . . . . . . . . . . . . . . . . . . . . . . . . . . . . . . . . . . 1-3
Setup/Monitoring Software. . . . . . . . . . . . . . . . . . . . . . . . . . . . . . . . 1-3
Control Relays. . . . . . . . . . . . . . . . . . . . . . . . . . . . . . . . . . . . . . . . . . . . . 1-3
Status Inputs . . . . . . . . . . . . . . . . . . . . . . . . . . . . . . . . . . . . . . . . . . . . . . 1-3
Data Logging. . . . . . . . . . . . . . . . . . . . . . . . . . . . . . . . . . . . . . . . . . . . . . 1-4
Event Log . . . . . . . . . . . . . . . . . . . . . . . . . . . . . . . . . . . . . . . . . . . . . 1-4
Min/Max Log . . . . . . . . . . . . . . . . . . . . . . . . . . . . . . . . . . . . . . . . . . 1-4
Snapshot Log. . . . . . . . . . . . . . . . . . . . . . . . . . . . . . . . . . . . . . . . . . . 1-4
Oscillography (1403-MM only) . . . . . . . . . . . . . . . . . . . . . . . . . . . . . . . 1-4
Operational Characteristics . . . . . . . . . . . . . . . . . . . . . . . . . . . . . . . . . . . 1-4
1403-MM . . . . . . . . . . . . . . . . . . . . . . . . . . . . . . . . . . . . . . . . . . . . . 1-4
1403-LM . . . . . . . . . . . . . . . . . . . . . . . . . . . . . . . . . . . . . . . . . . . . . . 1-4
Table of Contents
Installation Chapter 2
Prevent Electrostatic Discharge. . . . . . . . . . . . . . . . . . . . . . . . . . . . . . . . 2-1
Mounting of Master Module . . . . . . . . . . . . . . . . . . . . . . . . . . . . . . . . . . 2-1
Mounting of Display Module . . . . . . . . . . . . . . . . . . . . . . . . . . . . . . . . . 2-1
Wiring of Master Module . . . . . . . . . . . . . . . . . . . . . . . . . . . . . . . . . . . . 2-2
Control Power. . . . . . . . . . . . . . . . . . . . . . . . . . . . . . . . . . . . . . . . . . 2-2
Voltage and Current Inputs. . . . . . . . . . . . . . . . . . . . . . . . . . . . . . . . 2-2
Status Inputs . . . . . . . . . . . . . . . . . . . . . . . . . . . . . . . . . . . . . . . . . . 2-16
LED Indicators . . . . . . . . . . . . . . . . . . . . . . . . . . . . . . . . . . . . . . . . 2-17
Wiring of Display Module. . . . . . . . . . . . . . . . . . . . . . . . . . . . . . . . . . . 2-18
Communication Connections . . . . . . . . . . . . . . . . . . . . . . . . . . . . . . . . 2-20
1403-IN001A-US-P
Page 4

ii
Maintenance Chapter 3
Battery Installation and Replacement Procedures . . . . . . . . . . . . . . . . . . 3-1
Installation. . . . . . . . . . . . . . . . . . . . . . . . . . . . . . . . . . . . . . . . . . . . . 3-1
Removal. . . . . . . . . . . . . . . . . . . . . . . . . . . . . . . . . . . . . . . . . . . . . . . 3-2
Disposal of Discharged Lithium Batteries. . . . . . . . . . . . . . . . . . . . . 3-3
Calibration . . . . . . . . . . . . . . . . . . . . . . . . . . . . . . . . . . . . . . . . . . . . . . . . 3-3
Cleaning Instructions . . . . . . . . . . . . . . . . . . . . . . . . . . . . . . . . . . . . . . . . 3-3
Field Service Considerations . . . . . . . . . . . . . . . . . . . . . . . . . . . . . . . . . . 3-3
General Operation Chapter 4
General Functionality. . . . . . . . . . . . . . . . . . . . . . . . . . . . . . . . . . . . . . . . 4-1
Key Functions . . . . . . . . . . . . . . . . . . . . . . . . . . . . . . . . . . . . . . . . . . . . . 4-1
Editing a Digital Parameter . . . . . . . . . . . . . . . . . . . . . . . . . . . . . . . . . . . 4-2
Issuing a Command . . . . . . . . . . . . . . . . . . . . . . . . . . . . . . . . . . . . . . . . . 4-3
Configuration Items . . . . . . . . . . . . . . . . . . . . . . . . . . . . . . . . . . . . . . . . . 4-6
General. . . . . . . . . . . . . . . . . . . . . . . . . . . . . . . . . . . . . . . . . . . . . . . . 4-6
Demand . . . . . . . . . . . . . . . . . . . . . . . . . . . . . . . . . . . . . . . . . . . . . . . 4-9
Commands . . . . . . . . . . . . . . . . . . . . . . . . . . . . . . . . . . . . . . . . . . . . . . . 4-10
Metering. . . . . . . . . . . . . . . . . . . . . . . . . . . . . . . . . . . . . . . . . . . . . . . . . 4-11
Voltage/Current . . . . . . . . . . . . . . . . . . . . . . . . . . . . . . . . . . . . . . . . 4-11
Power. . . . . . . . . . . . . . . . . . . . . . . . . . . . . . . . . . . . . . . . . . . . . . . . 4-12
Cumulative Power . . . . . . . . . . . . . . . . . . . . . . . . . . . . . . . . . . . . . . 4-14
Harmonic Analysis . . . . . . . . . . . . . . . . . . . . . . . . . . . . . . . . . . . . . . . . . 4-15
Setpoints. . . . . . . . . . . . . . . . . . . . . . . . . . . . . . . . . . . . . . . . . . . . . . . . . 4-16
Theory of Setpoint Operation . . . . . . . . . . . . . . . . . . . . . . . . . . . . . 4-16
Over Forward Setpoint . . . . . . . . . . . . . . . . . . . . . . . . . . . . . . . . . . 4-16
Over Reverse Setpoint. . . . . . . . . . . . . . . . . . . . . . . . . . . . . . . . . . . 4-17
Under Forward Setpoint . . . . . . . . . . . . . . . . . . . . . . . . . . . . . . . . . 4-18
Under Reverse Setpoint. . . . . . . . . . . . . . . . . . . . . . . . . . . . . . . . . . 4-19
Equal Setpoint . . . . . . . . . . . . . . . . . . . . . . . . . . . . . . . . . . . . . . . . . 4-19
Not Equal Setpoint. . . . . . . . . . . . . . . . . . . . . . . . . . . . . . . . . . . . . . 4-19
Examples of Setpoint Operation . . . . . . . . . . . . . . . . . . . . . . . . . . . . . . 4-22
Setpoint Example 1 - Over kW Forward (+). . . . . . . . . . . . . . . . . . 4-22
Setpoint Example 2 - Under kW Forward (+). . . . . . . . . . . . . . . . . 4-22
Setpoint Example 3 - Over kW Reverse (-). . . . . . . . . . . . . . . . . . . 4-22
Setpoint Example 4 - Under kW Reverse (-). . . . . . . . . . . . . . . . . . 4-22
Relay Operation . . . . . . . . . . . . . . . . . . . . . . . . . . . . . . . . . . . . . . . . . . . 4-22
Data Logging . . . . . . . . . . . . . . . . . . . . . . . . . . . . . . . . . . . . . . . . . . . . . 4-23
Event Log. . . . . . . . . . . . . . . . . . . . . . . . . . . . . . . . . . . . . . . . . . . . . 4-23
Snapshot Log. . . . . . . . . . . . . . . . . . . . . . . . . . . . . . . . . . . . . . . . . . 4-24
Min/Max Log. . . . . . . . . . . . . . . . . . . . . . . . . . . . . . . . . . . . . . . . . . 4-27
Oscillography (1403-MM only). . . . . . . . . . . . . . . . . . . . . . . . . . . . . . . 4-28
Self-test/Diagnostic Information . . . . . . . . . . . . . . . . . . . . . . . . . . . . . . 4-28
Bulletin Number . . . . . . . . . . . . . . . . . . . . . . . . . . . . . . . . . . . . . . . 4-28
Options Bit Field . . . . . . . . . . . . . . . . . . . . . . . . . . . . . . . . . . . . . . . 4-28
Overall Status. . . . . . . . . . . . . . . . . . . . . . . . . . . . . . . . . . . . . . . . . . 4-29
Master Module ROM Status . . . . . . . . . . . . . . . . . . . . . . . . . . . . . . 4-29
Master Module RAM Status . . . . . . . . . . . . . . . . . . . . . . . . . . . . . . 4-29
Master Module NVRAM Status . . . . . . . . . . . . . . . . . . . . . . . . . . . 4-29
Master Module Power Supply Status . . . . . . . . . . . . . . . . . . . . . . . 4-29
1403-IN001A-US-P
Page 5

Master Module Data Acquisition Status. . . . . . . . . . . . . . . . . . . . . 4-29
Master Module Watchdog Timer Status. . . . . . . . . . . . . . . . . . . . . 4-29
Real Time Clock Status. . . . . . . . . . . . . . . . . . . . . . . . . . . . . . . . . . 4-30
Battery Usage Timer Value. . . . . . . . . . . . . . . . . . . . . . . . . . . . . . . 4-30
Smart Communication Card Status. . . . . . . . . . . . . . . . . . . . . . . . . 4-30
Smart Communication Card Type . . . . . . . . . . . . . . . . . . . . . . . . . 4-30
Smart Communication Card Firmware Revision Number . . . . . . . 4-30
Number of Display Modules. . . . . . . . . . . . . . . . . . . . . . . . . . . . . . 4-30
Display Module Status . . . . . . . . . . . . . . . . . . . . . . . . . . . . . . . . . . 4-30
Display Module Self-test Results Word 1. . . . . . . . . . . . . . . . . . . . 4-30
Display Module Self-test Results Word 2. . . . . . . . . . . . . . . . . . . . 4-30
Display Module # 1, #2, #3 Firmware Revision Number. . . . . . . . 4-31
Master Module EEPROM Status . . . . . . . . . . . . . . . . . . . . . . . . . . 4-31
Master Module Device ID. . . . . . . . . . . . . . . . . . . . . . . . . . . . . . . . 4-31
General Purpose Status Bits . . . . . . . . . . . . . . . . . . . . . . . . . . . . . . 4-31
BT Error Status Word 1 . . . . . . . . . . . . . . . . . . . . . . . . . . . . . . . . . 4-31
BT Error Status Word 2 . . . . . . . . . . . . . . . . . . . . . . . . . . . . . . . . . 4-31
Catalog Number Explanation Appendix A
Master Module/Limited Metering Master Module . . . . . . . . . . . . . . . . . A-1
Display Module . . . . . . . . . . . . . . . . . . . . . . . . . . . . . . . . . . . . . . . . . . . . A-1
Communications Cards/Peripherals/Software. . . . . . . . . . . . . . . . . . . . . A-2
Fiber Optic Accessories. . . . . . . . . . . . . . . . . . . . . . . . . . . . . . . . . . . . . . A-2
iii
Mechanical Dimensions Appendix B
Technical Specifications Appendix C
Product Approvals. . . . . . . . . . . . . . . . . . . . . . . . . . . . . . . . . . . . . . . . . . C-1
CE Certification. . . . . . . . . . . . . . . . . . . . . . . . . . . . . . . . . . . . . . . . . . . . C-1
EMC Directive . . . . . . . . . . . . . . . . . . . . . . . . . . . . . . . . . . . . . . . . . C-1
Low Voltage Directive . . . . . . . . . . . . . . . . . . . . . . . . . . . . . . . . . . . C-1
International Standard IEC 529 / NEMA / UL 508 Degree of ProtectionC-1
ANSI/IEEE Tested (1403-MM only) . . . . . . . . . . . . . . . . . . . . . . . . C-1
Measurement Accuracy, Resolution, and Range. . . . . . . . . . . . . . . . . . . C-2
General Input, Output, and Environmental Ratings . . . . . . . . . . . . . . . . C-3
Glossary Appendix D
1403-IN001A-US-P
Page 6

iv
1403-IN001A-US-P
Page 7

Preface
Using This Instruction Sheet
What This Instruction Sheet Contains
Review the table below to familiarize yourself with
the topics contained in this instruction sheet.
For information about: Refer to
chapter:
Product Features and System
Applications
Installing the Master Module
Installing the Display Module
Wiring and Transformer
Selection
Maintenance
Modes of Operation
Display Module
Configuration Information
Configuration Information
Catalog Number Explanation
Mechanical Dimensions
Technical Specifications
Glossary
Index
1
2
2
2
3
4
Appendix A
Appendix B
Appendix C
Appendix D
Index
For More Information on Additional Power Quality Products
For this information: Refer to:
Cat. No. 1403-NSC Smart
Communications Card
Instruction Sheet
Bulletin 1403 Powermonitor II
Tutorial
Cat. No. 1400-PD Installation
and Operation Manual
Cat. No. 1400-SP Installation
and Operation Manual
Cat. No. 1400-DCU Installing
the Communication Card
Instructions
Cat. No. 1400-CC RS-232C
and RS-485 Convertor
Instructions
Cat. No. 6190-PMO
ControlView Software
Cat. No. 1402-LS LSM
Installation and Operation
Manual
Cat. No. 1403-NENET Ethernet
Communications Card
Instruction Sheet
Cat. No. 1403-NDNET DeviceNet
Communications Card Instruction
Sheet
Cat. No. 9307RSE32E
RSEnergy Installation Guide
Cat. No. 9307RSPDEVD
Getting Results with RSPower
Publication
1403-5.1
Publication
1403-1.0.2
Publication
1400-5.2
Publication
1400-801
Publication
1400-5.0
Publication
1400-5.1
Publication
6190-6.5.29
Publication
1402-5.0
Publication
1403-5.3
Publication
1403-5.4
9399ENERGYIG
POWERBW-
07.24.97
If you would like a manual, you can:
• download a free electronic version from the
internet at www.theautomationbookstore.com
• purchase a printed manual by:
– contacting your local distributor or Rockwell
Automation representative
– visting www.theautomationbookstore.com
and placing your order
– calling 1.800.963.9548 (USA/Canada) or
001.330.725.1547 (Outside USA/Canada)
1403-IN001A-US-P
Page 8

P-2 Using This Instruction Sheet
Terms and Conventions
In this manual, the following terms and conventions
are used:
Abbreviation Term
AWG Amer ican Wire Gage
BTR Block Transfer Read
BTW Block Transfer Write
CF Cable Fiber
CSA Canadian Standards Association
CT Current Transformer
DM Display Module
EEPROM Electrically Erasable
Programmable ROM
EMI Electromagnetic Interference
ID Identification
IEC International Electrotechnical
Commission
I/O Inputs and Outputs should be
considered with respect to the
PLC processor
LED Light Emitting Diode
LSM Line Synchronization Module
MM Master Module
NEMA National Electrical Manufacturers
Association
PLC Programmable Logic Controller
PT Potential Transformer
(Also known as VT in some
countries)
RAM Random Access Memory
RFI Radio Frequency Interference
R I/O Remote Input/Output
RMS Root-mean-square
ROM Read-onl y Mem ory
SLC Small Logic Controller
SPDT Single Pole Double Throw
UL Underwriters Laboratories
VA Volt-ampere
VAR Volt-ampere Reactive
Battery: In this manual, the term battery refers to the
lithium cell contained in the Master Module.
1403-IN001A-US-P
Page 9

Chapter
1
Product Description
Chapter Objectives
After completing this chapter, you should be able to
identify the prod uct features and system applications.
Introduction
The Bulletin 1403, Powermonitor II, is uniquely
designed and developed to meet the needs of
producers and consumers of electric power. The
Powermonitor II is a microprocessor based
monitoring and control device well suited for a
variety of applicat ions. Use of voltage, curr ent, status
inputs, and relay connections allows the
Powermonitor II to provide monitoring and control
information . This data is u seful in substation and
distribution centers, electrical control panels, and
many utility, commercial, and industrial applications
including mo tor control centers. The Powermonitor
II is a sophisticated modern alternative to traditional
electro-mechanical metering devices. One
Powermonitor II can replace many individual
transducers and meters within a single package. The
Powermonitor II is operato r friendly and provides the
user with easy to understand, accurate information in
a compact economical package.
A second op tional feature allows for remote
communications through the use of a Smart
Communications Card co-located with the Master
Module. Both the Display Module and the Smart
Communications Card are microprocessor based
providing better resolution, accuracy, and speed to
the Bulletin 1403 Master Module. The bulletin 1403
Powermonitor II and the Communication Cards are
Year 2000 compliant.
Performance Features
The Powermonitor II performance features include:
Vo ltage , cur rent, p ower me asure ments and dis pla y
•
28 ms to 90 ms selectable update rates for
•
metering results (1403-MM only)
90 ms fixed update rate (1403-LM only)
•
Communications
•
Software and system integration
•
PLC-5 compatibility
•
SLC-500 compatibility
•
Output control via control relays or PLC
•
Demo mode for training
•
Input monitoring via status inputs
•
Time stamped data logging of system
•
measurements and events
Harmonic Analysis (1403-MM only)
•
Simultaneou s multi-channel oscillogr aph
•
recordings (1403-MM only)
General Description
The Bulletin 1403 Display Module, an optional
input/ output device, can be used to set up and
configure the Bulletin 1403 Master Module for
operation. This is accomplished through the Display
Module’s front panel which includes four tactile
operator buttons and a liquid crystal display. All
communications between the Display Module and
Master Module are conducte d over a serial fiber optic
link. (The Display Module is easily mounted into a
typical instrument panel analog meter cutout.)
Device Configuration
The Powermonitor II comes from the factory with
default settings but can be configured for local sitespecific requirements. This is accomplished using the
Display Module or one of the Communications Cards
which allow operation and configuration parameters
to be sent to the Master Module.
In conjunction with the Communications Cards, a
personal computer running RSPower™ or
RSEnergy™ software can be sent to the Master
Module.
1403-IN001A-US-P
Page 10

1-2 Product Description
Quick Start - Minimum Device Configuration
At a minimum, the following steps MUST be
followed for proper operation of your Powermonitor
II. Any other device configuration options are only
required fo r operation of additional functions of the
Powermonitor II.
1. Configure the PT and CT ratios to match your
system. Remember, for systems with greater than
120 volts applied to the voltage inputs, the PT
secondary must be configured to greater than 137
volts to switch to high voltage mode. For
example: a 600 V
L-L
(347 V
) direct-connect
L-N
system is configured with a PT ratio of 347:347.
2. Configure the Voltage Mode to match your syste m
wiring. Use the wiring diagrams in Chapter 2,
Figure 2.2 through Figure 2.13 to select the
appropriate mode.
Measurements
Table 1.1 Real Time Metering Measurements
Distortion PF (total, and per phase on 4-wire systems)
Power Consumption in kW Hours (forward, reverse, and net)
Reactive Po wer Consumption in kVAR Hours (forward, rev erse ,
and net)
Demand (Amps, Watts, VAR, and VA)
Instantaneous Demand (Amps, Watts, VAR, and VA)
First Order Projected Demand (Amps, Watts, VAR, and VA)
Second Order Projected Demand (Amps, Watts, VAR, and VA)
Table 1.2 Real Time Harmonic Analysis (V1, V2, V3, I1, I2, I3,
and neutral)
Percent Distortion up to 41st Harmonic (1403-MM only)
IEEE Percent Total Harmonic Distortion
IEC Percent Total Harmonic Distortion (Distortion Index)
(DIN)
IEEE-519 Compliance (1403-MM only)
Telephone Interference Factor (1403-MM only)
Crest Factor (1403-MM only)
K-Factor (1403-MM only)
Note: Update rates and accuracy are listed in
Appendix C, Technical Specifications
The Powermonitor II provides numerous display
measurements and programming charact er is ti cs.
Table 1.1 Real Time Metering Measurements
Current in Amps (per phase and neutral)
Average Current in Amps
Positive Sequence Current in Amps
Negative Sequence Current in Amps
Percent Current Unbalance
Voltage in Volts (per phase L-L, and L-N on 4-wire systems)
Average Voltage in Volts (per phase L-L, and L-N on 4-wire
systems)
VAUX (auxiliary voltage input)
Positive Sequence Volts in Volts
Negative Sequence Volts in Volts
Percent Voltage Unbalance
Frequency in Hz
Phase Rotation (ABC, ACB)
Watts (total, and per phase on 4-wire systems)
VAR (total, and per phase on 4-wire systems)
VA (total, and per phase on 4-wire systems)
True PF (total, and per phase on 4-wire systems)
Displacement PF (total, and per phase on 4-wire systems)
Displays
The Powermonitor II Master Module communicates
to the Display Module over a fiber optic serial
communications link. Up to three Display Modules
can connect to one Master Module.
Figure 1.1 Display Module
1403-IN001A-US-P
Page 11

Product Description 1-3
Communications
Both versions of the Powermonitor II can use the
1403-NSC Smart Communications Card for
communications via Allen-Bradley Remote I/O, RS232 or RS-485, the 1403-NENET card for
communications via Ethernet, or the 1403-NDNET
card for communications via DeviceNet. Refer to
Publication 1403-5.1 Smart Communications Card
Instruction Sheet, Publication 1403-5.3 Ethernet
Communications Card Instruction Sheet, or
Publication 1403-5.4 DeviceNet Communication
Card Instruction Sheet for additional information.
Software and System Integration
An IBM PC, or compatible, host computer may
communicate with the Powermonit or II via RS-232C,
RS-485, R I/O, DeviceNet, or Ethernet using:
RSPower
•
RSView
•
RSEnergy
•
RSLinx
•
User generated software (using open protocol -
•
see Publication 1403-5.1, Smart Communications
Card Instruction Sheet)
User generated software (using open protocol -
•
see Publication 1403-5.3, Ethernet
Communications Card Instruction Sheet)
RS-232C/RS-485 may be used to support up to 124
Powermonitor IIs per sub net, 250 per network.
PLC Configuration
Setup/Monitoring Software
The Windows-based RSPower and RSEnergy
software packages are currently available from
Rockwell Software for configuring, monitoring, and
control of the Powermonitor II units. This software
package is designed t o b e i nte gr ate d wi th RSVi ew or
function as a stand alone package. It is capable of
graphically displaying a system and its components
and providing real time data and graphics on the
same screen. Real time data can be displayed in
digital or analog presentation using preconfigured
gauges. Spectral analysis, oscillograph recordings,
logging, and trending are also easily configured.
When either software is used in conjunction with
RSView, data can be ente red into the tag database
editor. Configuration and real time data can be
downloaded and retrieved from any Bulletin 1400/
1403 Powermonitor on the system.
Note: Spectral analysis and oscillog raph recordings
are only available through the 1403-MM
only.
Control Relays
The Powermonitor II provi de s t wo hi gh s peed SPDT
control relays which may function as:
Alarm relays
•
Setpoint relays
•
Remote control relays operated by command via
•
the communications port or Display Module.
Relays controlled by user-defined conditions
•
• kWH or kVARH pulse outputs
• Relay operations may be logged to a PC printer
output using a software package.
Certain circumstances may require a number of
Powermonitor IIs to provide feedback while
monitoring and control li ng a fa cility. To manage this
effectively, Allen-Bradley PLC processor
communication ports can be integrated to
communicate and respond to the gathered
information.
Status Inputs
The Powermonitor II has four self-powered status
inputs. These inputs c an b e used to sense and control
the state of an external contact. Each of the status
inputs has a counter associated with it. The status of
these inputs can be viewe d from the Powe rmonit or II
Display Module. They may also be viewed and
logged from RSPower or RSEnergy software or user
generated software.
1403-IN001A-US-P
Page 12

1-4 Product Description
Data Logging
The Powermonitor II provides three data logs: the
Event log, the Min/Max log, and the Snapshot log.
Each record of the three logs is date and time
stamped to the nearest hundredth of a second.
Event Log
The Event log consists of the 100 most recent events
that occurred in the Powermonitor II. Such events
consist of power up/ power d own, set point acti vation ,
new configuration data, etc.
Min/Max Log
The Min/Max log records the minimum and
maximum values for 84 parameters for the 1403-MM
and 63 parameters for the 1403-LM. These items
consist of voltage, current, power, total harmonic
distortion, etc. This log can be disabled to increase
real time metering update rate performance.
Both types of oscillography can be triggered
manually or as the result of a setpoint. All channels
are continuously sampled at a 10.8 kHz sample rate.
Operational Characteristics
1403-MM
The Powermonitor II MM module has selectable
accuracy (+/- 0.05% no minal) an d update r ates (28 to
90 ms) by changing various configuration
parameters. If update rates are critical, then a user
can select a modest filtering mode or disable
unnecessary features. However, if maximum
accuracy is a ne cessity fo r a specif ic applicat ion, then
the user can select an additional filtering mode. The
Powermonitor II allows a user to trade update speed
for accuracy.
1403-LM
Snapshot Log
The Snapshot log consis ts of 5 0 r ecords . Each re cord
consists of 46 parameters. These parameters include
voltage, current, power, power factor, etc. This log
can be updated on a periodic basis set by the
configuration data, and/or it can be updated
asynchronously as a result of a setpoint action.
Oscillography (1403-MM only)
The Powermonitor II provides two types of
oscillography:
(1)
• Simultaneous 7-channel 2-cycle
recording
• User configurable simultaneous 2-channel 12-
(2)
cycle
oscillograph rec ording wit h up to 8 cycles
of pretrigger data.
oscillograph
The Powermonitor II LM module has a fixed
accuracy (+/- 0.1 nominal) and a f ixe d upda te r at e of
90 ms.
(1) 2-cycle is specified at 50 Hz (2.4 cycles at 60 Hz). Therefore, more data will
be available at frequencies greater than 50 Hz, while less will be available at
frequencies less than 50 Hz.
1403-IN001A-US-P
(2) 12 cycles is specified at 50 Hz (14.4 cycles at 60 Hz). Therefore, more data
will be available at frequencies greater than 50 Hz, while less will be
available at frequencies less than 50 Hz.
Page 13

Chapter
2
Installation
Prevent Electrostatic D ischarge
A TTENTION: Electrostatic
discharge can damage integrated
!
Mounting of Master Module
circuits or semicondu ctors i f you touch
backplane connector pins . Follow these
guidelines when you handle the
module.
•
Touch a grounded object to discharge static
potential.
•
Wear an approved wrist-strap grounding
device.
•
Do not touch the backplane connector or
connector pins.
•
Do not touch circuit components inside the
module.
•
If available, use a static-safe work station.
•
When not in use, keep the module in its
static-shield box.
free convection cooling of the Master Module’s
internal electronic components.
Important:Do not block ventilation holes of the
Master Module. All wiring and other
obstructions
The mounting hole pattern for the Master Module is
defined by the dimensional drawing in Figure B.2,
Appendix B. The Master Module can be mounted
with either four No. 10 or M5 bolts or screws with
flat washe rs and an internal lock washer or
equivalent.
Mounting of Display Module
Protective Enclos ure A suitable enclosure should be
used to protect the rear surfaces of the Display
Module from atmospheric contaminants such as oil,
moisture, dust and corrosive vapors plus other
harmful airborne substances. The Display Module’s
gasketed front panel interface to the protective
enclosure is rated as an IP65 degree of protection
[National Electrical Manufacturer’s Association
(NEMA)/Underwriters Laboratories (UL) 508, Type
4X (Indoor)] per International Standard IEC 529.
Protective Enclosur e A suitable enclosure should be
used to protect the Master Module from atmospheric
contaminan ts such as oil, mo isture, dust, and
corrosive vapors or other harmful airborne
substance s; if not, a reduced servi ce life can be
expected.
The enclosure should be mounted in a position that
allows the access doors to open fully. This will
provide easy access to the wiring of the Master
Module and related components. A suggested
method for spacing and wiring layout for the Master
Module is shown in Appendix B. Also, see Appendix
B for drilling template.
Installation and Orientation Normal installation
and orientation of the Master Module within its
protective enclosure is defined in Figure B.1,
Appendix B. This orientation will ensure adequate
Installation and Orientation The Display Module
can be oriented in any position. The most typical
orientation is shown in Figure B.1, Appendix B. The
Display Module is designed to fit into the protective
enclosure cutout with a minimum installation depth
of 50.8 mm (2.0 in.) behind the mounting panel as
shown in Figure B.2, Appendi x B. The recommended
Display Module mounting hole pattern and
dimensions are defined in Figure B.3, Appendix B.
Ensure that the gasket provided is not contaminated
with foreign matter and is installed in the Display
Module correctly. Install the Display Module into the
protective enclosure’s front panel using four M4 nut/
lockwasher assemblies as shown in Figure B.4,
Appendix B. Tighten the M4 nut/lockwasher
assemblies to 0.9 to 1.1 Nm (8 to 10 lb-in.)
Note: Eight flat washers are provided for retrofit
applications with larger hole sizes.
1403-IN001A-US-P
Page 14
2-2 Installation
ATTENTION: Failure to comply
with these mounting requirements
!
may cause damage to the Display
Module or compromise the IP65
[NEMA/UL 508, Type 4X (Indoor)]
degree of protection per International
Standard IEC 529.
Wiring of Master Module
Terminal Blocks Wire Sizes and Screw Torques
Observe all wire lug sizes and screw torques. Refer to
Appendix C, Specifications.
Chassis Grounding
Module to the wiring installation via a bonding
terminal. R efer to Technical Specifications,
Appendix C. This protective earthing terminal shall
have no other function per local codes (ground bond
largest measured co nductor size) . All grou nd wires
≥
should be kept as short as possible; 30cm (12 in.) or
less is sugg ested.
Electrically bond the Master
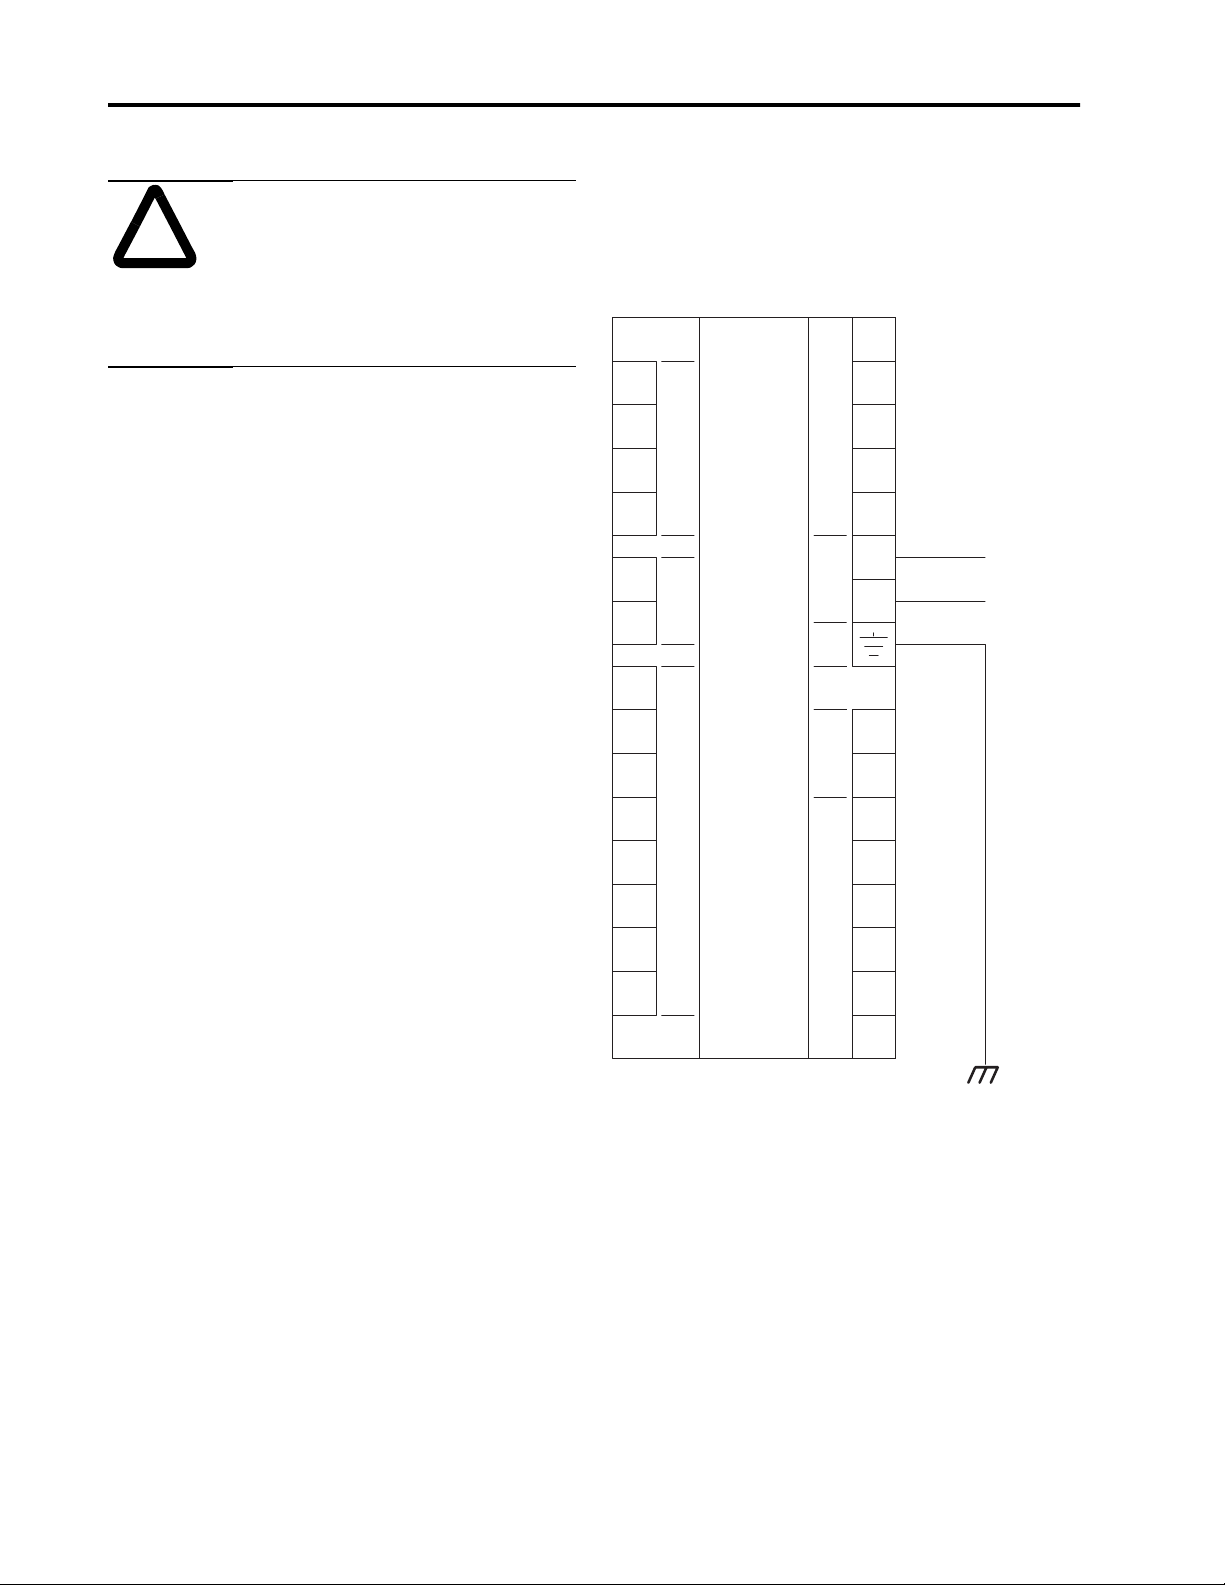
Figure 2.1 Bulletin 1403-XMXX
Cat. No. 1403-xMXXA
120/240 AC 50/60 HZ
125/250 DC
V1
V2
V3
N
Fiber
Rx
Fiber
Tx
I1+
I1-
I2+
Voltage
Inputs
Display
Module
Fiber
GRD
PM-II
Master
Module
Cat. No. 1403-xMXXB
24 AC 50/60 HZ
12/24 DC
S1
S2
Status
Inputs
S3
S4
Scom
L/+
Power
N/-
Ain
Analog
Input
Acom
L1
N/L2
Control Po we r
The power required by the Master Module is less
than 25VA to facilitate retrofit applications, but th e
terminal block connections accept up to #12 AWG
2
(4 mm
powered directly from a local branch circuit. It
should be fused per local code.
) wire with lugs. The Master Module can be
I2-
I3-
I3+
I4+
I4-
Current
Inputs
R14
R11
R12
R24
R21
R22
Relay
Outputs
Local Frame
Ground
Voltage and Current Inputs
Voltage Input and Potential Transformer (PT) Selection
All Bulletin 1403-xM Powermonitor II devices
handle direct connection for line to neutral voltages
of 120, 277, and 347 (line to line voltages of 208,
480, and 600V, respectively).
1403-IN001A-US-P
Page 15

Installation 2-3
Use instrument accura cy PTs when the vol tage level s
being measured exceed the vo ltage in put ratings . The
PT accuracy rating directly affects the system
accuracy. For maximum accuracy, the PT used must
provide linearity across the voltage range and must
introduce a minimal phase angle shift.
Note: Remember, for systes with greater than 120
volts applied to the voltage inputs, the PT
secondary must be confi gured to greate r than
137 volts to switch to high voltage mode.
Example: A 600 V
(347 V
L-L
) direct-
L-N
connect system would be configured with a
PT ratio of 347:347.
Current Inputs and Current Transformer (CT) Selection
The Powermonitor II is available in two models: a 5
Amp or 1 Amp model. Each current input to the
Powermonitor II is internally CT isolated to 5kV.
Each current input may b e connected di rectly into th e
power line as long as t he current s do not e xceed the 5
Amp or 1 Amp ratings.
Customer provided CTs are required where input is
higher than the device rating. The values for the
primary and secondary CT ratings must be
configured into the Powermonitor II in order to
properly scale the displayed readings.
The accuracy of the current input reading is
dependent on the CT class. An Instr ument Clas s 1 or
better is recommended. Ca re shou ld be take n that th e
combined load of wiring and the Powermonitor II
match closely to the VA rating of the CT for
maximum accuracy.
ATTENTION: A CT secondary
circuit must not be opened with
!
primary current applied. Wiring
between the CTs and the
Powermonitor II should include a
terminal block for shorting the CT
secondary circuit. Shorting the
secondary with primary current
present will allow other connections
to be removed if needed. An open CT
secondary with primary current
applied will produce a hazardous
voltage, which can lead to personal
injury, death, property damage or
economic loss.
1403-IN001A-US-P
Page 16
2-4 Installation
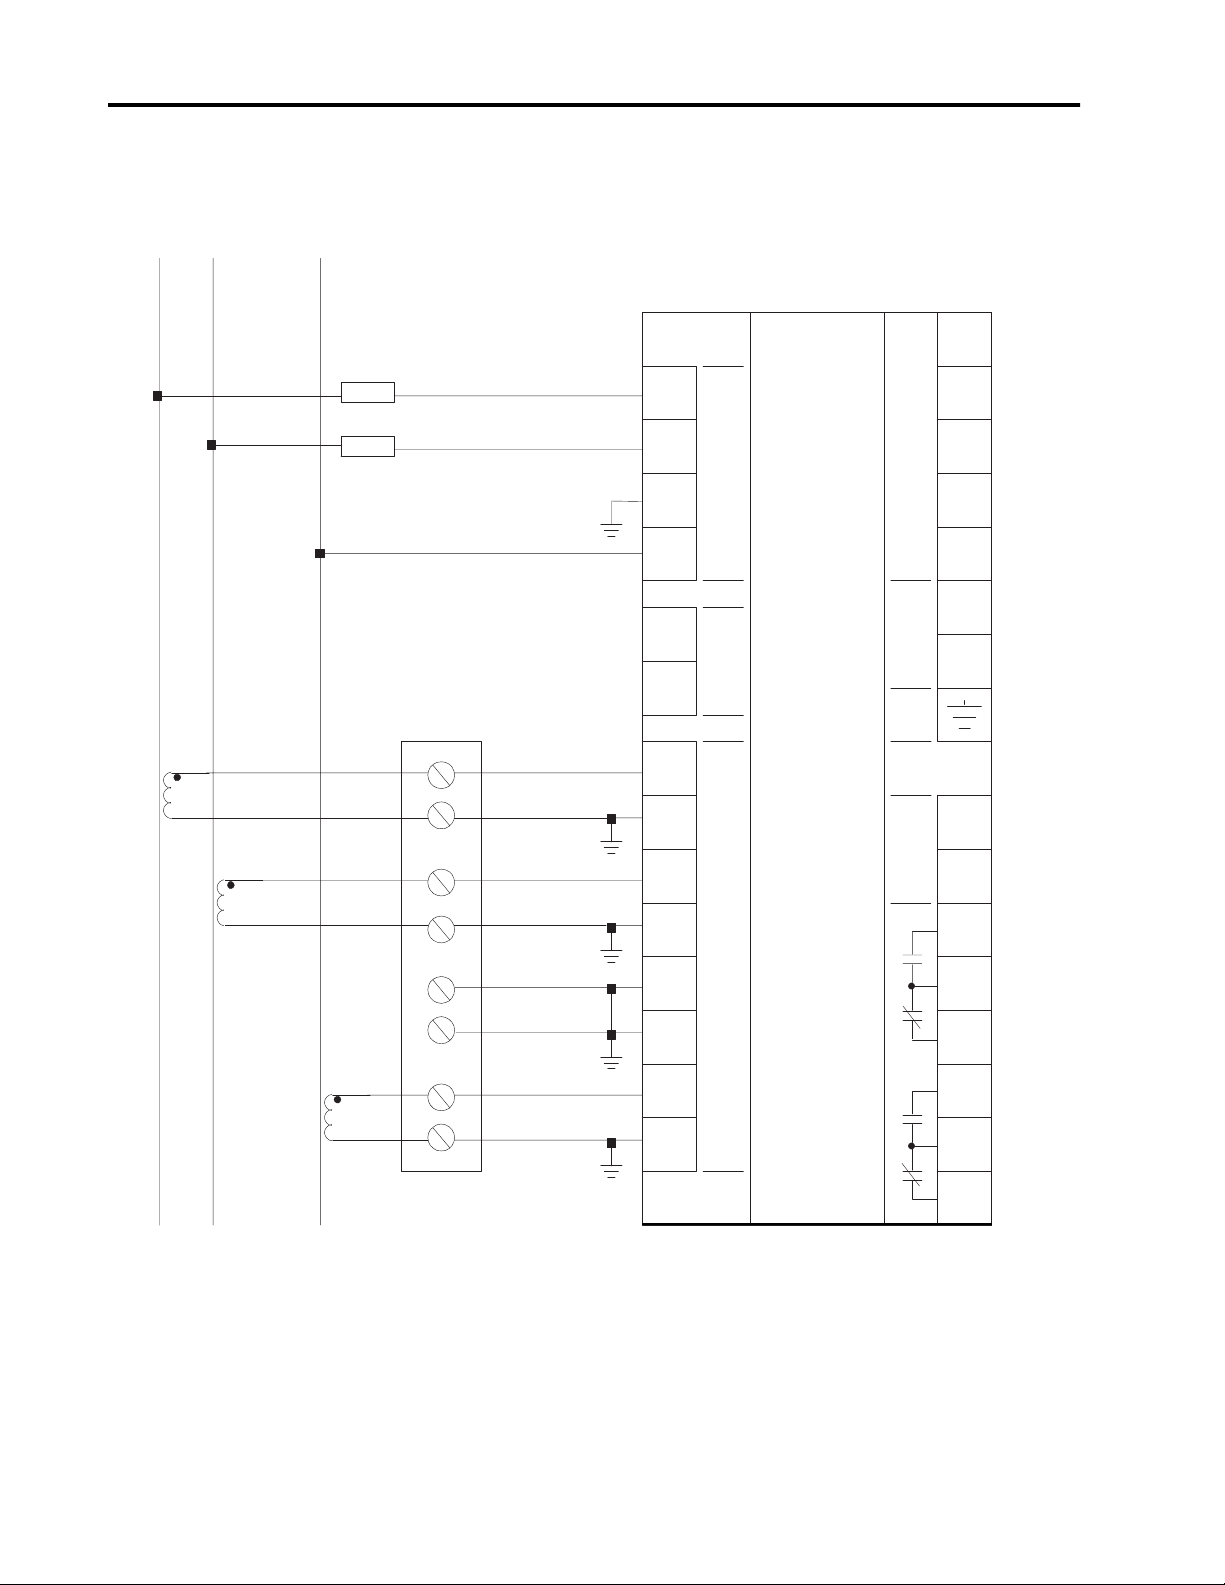
Figure 2.2 Single Phase Direct Connection Wiring Diagram
L1
L2 N
Voltage mode = Single Phase
Fuse
Fuse
Customer Supplied CT
Shorting Switch or Test
Block
V1
V2
V3
N
Fiber
Rx
Fiber
Tx
I1+
Voltage
Inputs
Display
Module
Fiber
Powermonitor II
Master Module
Status
Inputs
Power
GRD
S1
S2
S3
S4
Scom
L/+
N/-
Load
Customer
Chassis
Ground
Note:
I1-
Analog
I2+
Input
I2-
Current
Inputs
I3+
I3-
Relay
Outputs
I4+
I4-
• Careful attention must be paid to correct
phasing and polarity for proper
operation.
• All ground wires should be taken
individually to Customer Chassis
Ground for a single point of grounding.
Ain
Acom
R14
R11
R12
R24
R21
R22
1403-IN001A-US-P
Page 17
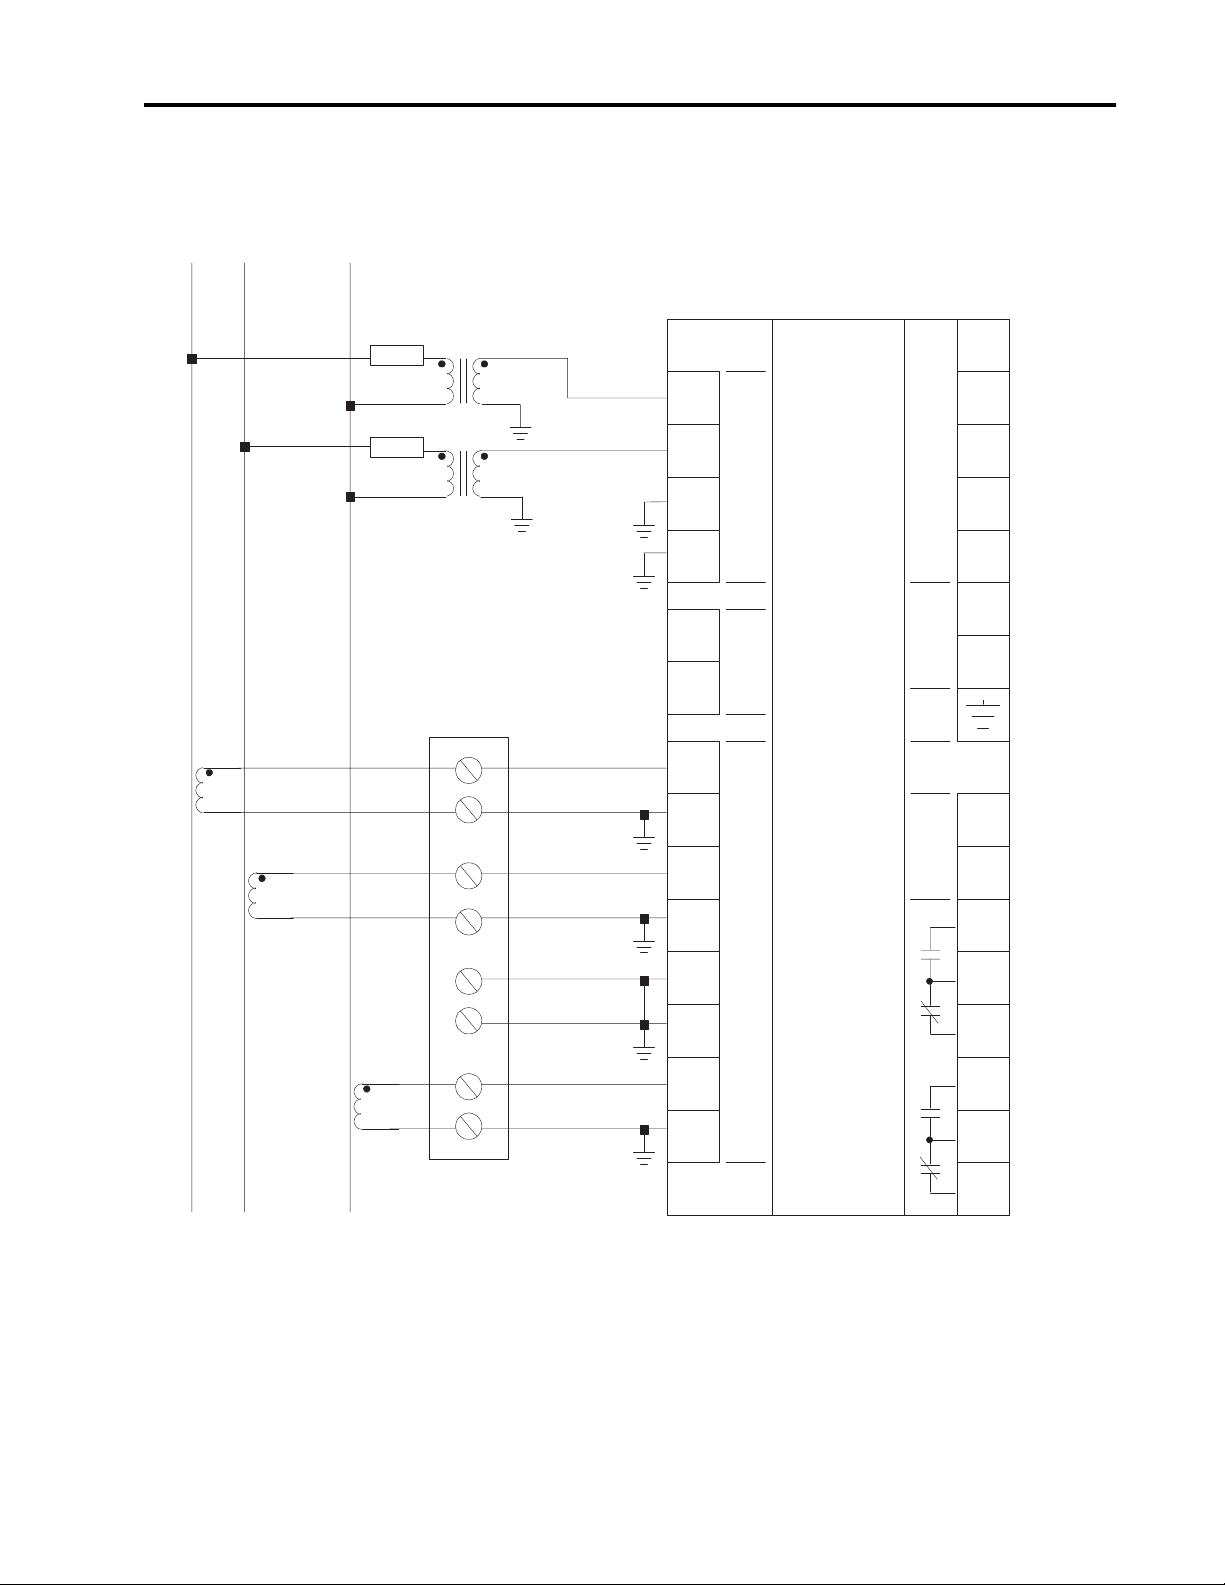
Figure 2.3 Single Phase with PTs Wiring Diagram
Installation 2-5
L1
L2
N
Voltage Mode = Single Phase
Fuse
Fuse
Customer Supplied CT Shortin g
Switch or Test Block
V1
V2
V3
N
Fiber
Rx
Fiber
Tx
I1+
Voltage
Inputs
Display
Module
Powermonitor II
Master Module
Status
Inputs
Power
GRD
S1
S2
S3
S4
Scom
L/+
N/-
Load
Customer
Chassis
Ground
Note:
I1-
Ain
Analog
I2+
I2-
Current
Input
Acom
R14
Inputs
I3+
I3-
R11
R12
Relay
I4+
I4-
Output
R24
R21
R22
• Careful attention must be paid to correct
phasing and polarity for proper operation.
• All ground wires should be taken individually
to Customer Chanssis Ground for a single
point of grounding.
1403-IN001A-US-P
Page 18
2-6 Installation
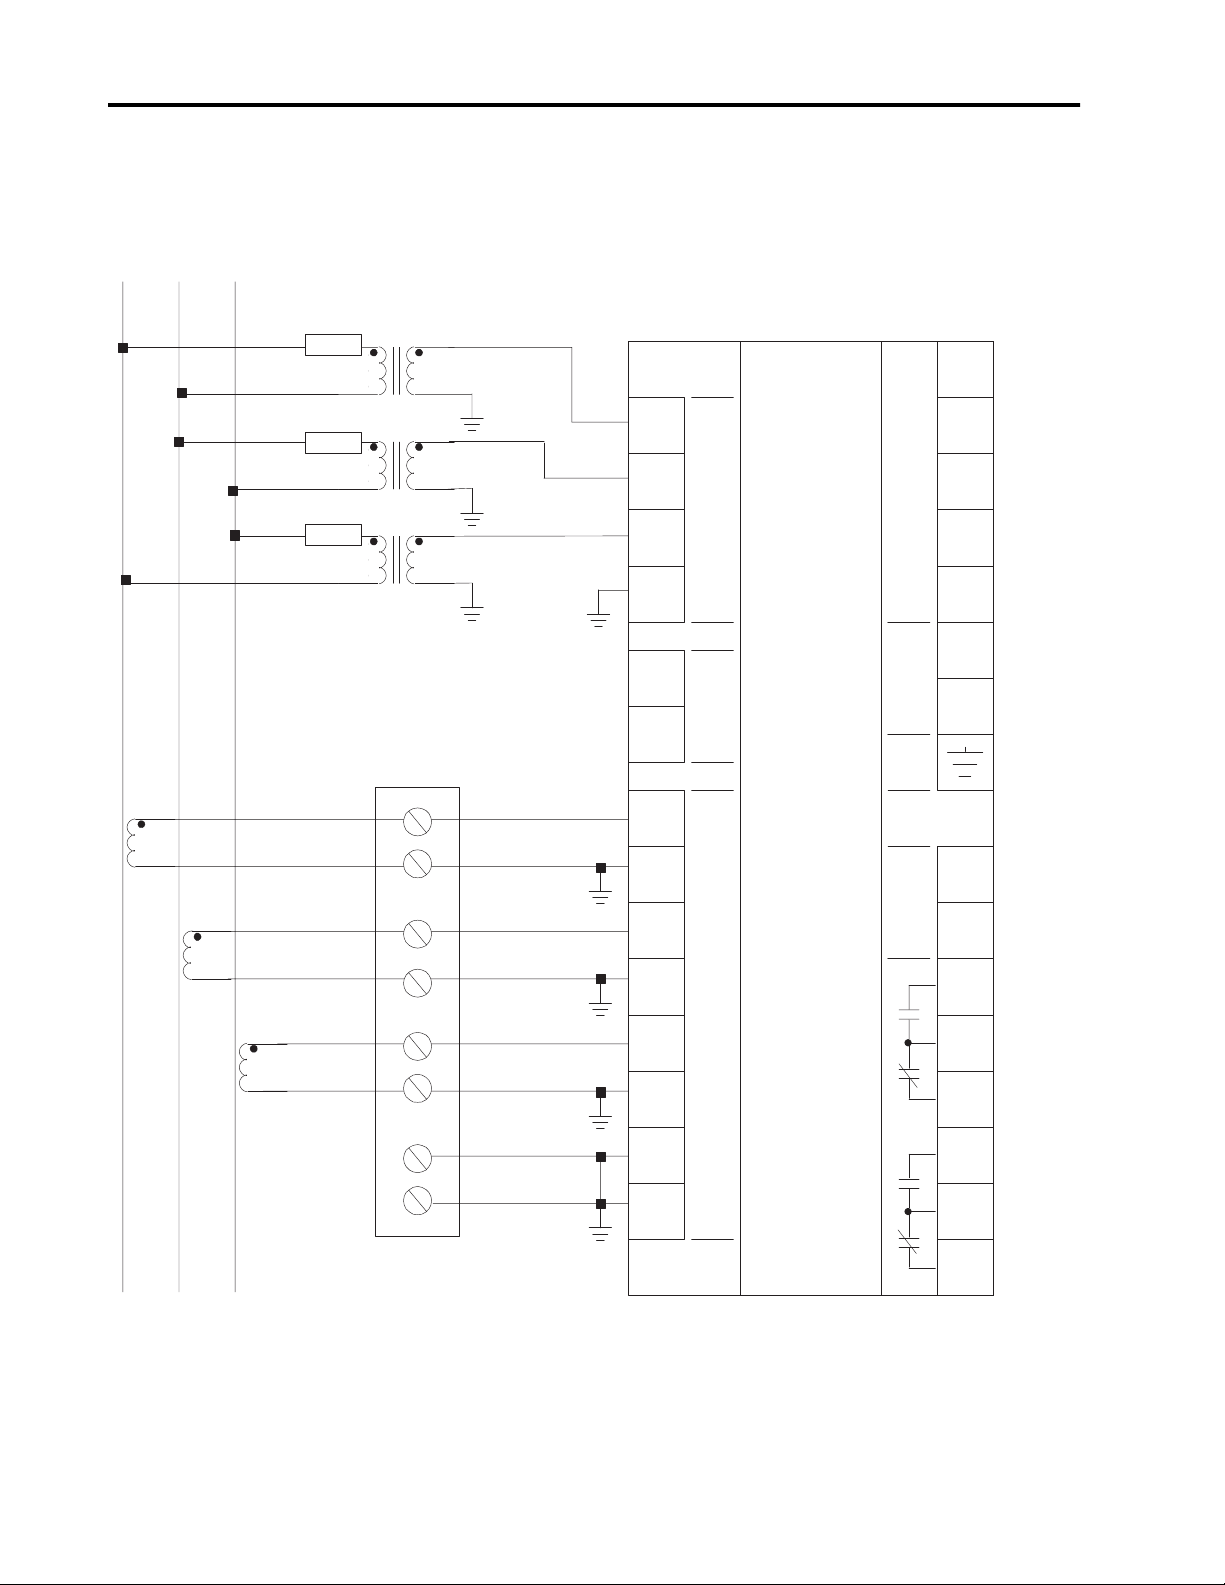
Figure 2.4 3-phase 4-wire Wye Direct Connect Wiring
Diagram
L1
L2
LINE
L3
N
Customer Supplied CT
Shorting Switch or Test
Block
Voltage Mode = Wye
Fuse
Fuse
Fuse
V1
V2
V3
N
Fiber
Rx
Fiber
Tx
I1+
Voltage
Inputs
Display
Module
Fiber
Powermonitor II
Master Module
Status
Inputs
Power
GRD
S1
S2
S3
S4
Scom
L/+
Load
Customer
Chassis
Ground
Note:
I1-
Ain
Analog
I2+
I2-
Current
Input
Acom
R14
Inputs
I3+
I3-
R11
R12
Relay
I4+
I4-
Outputs
R24
R21
R22
• Careful att ention must be paid to correct phasing
and polarity for proper operation.
• All ground wires should be taken individually to
Customer Chassis Ground for a single point of
grounding.
1403-IN001A-US-P
Page 19
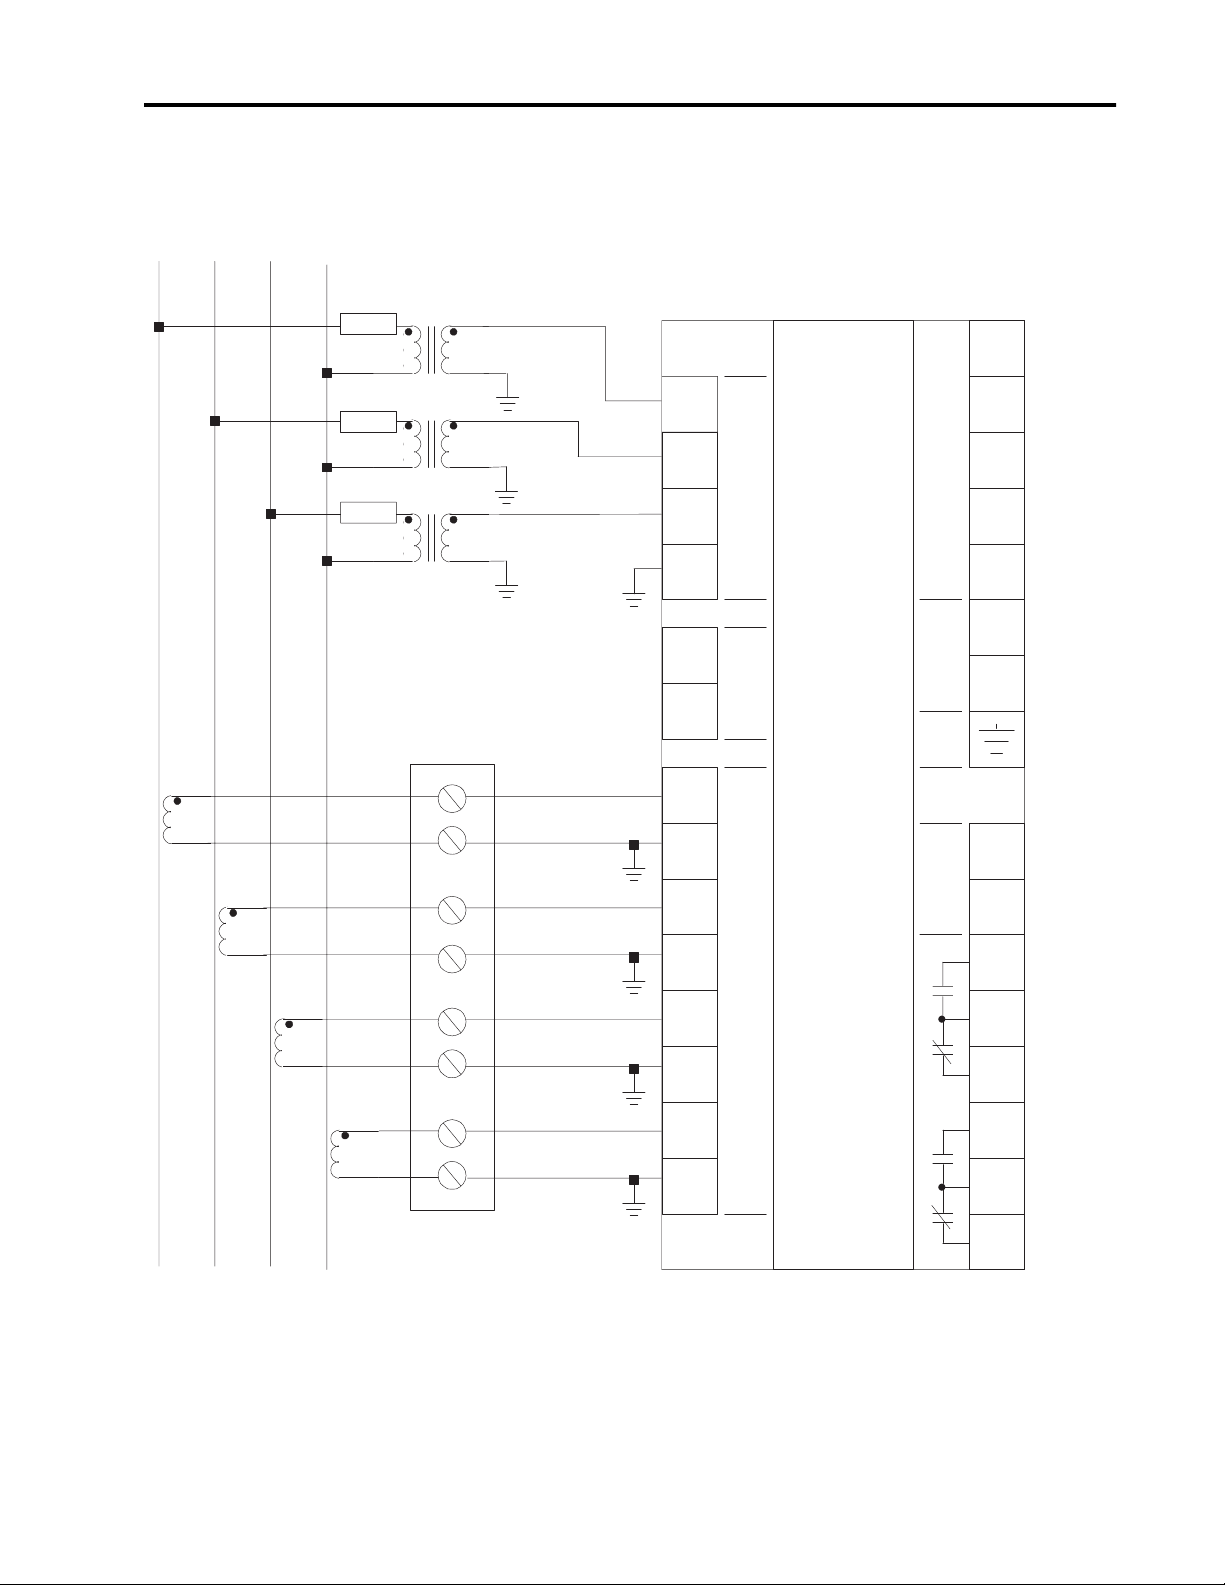
Figure 2.5 3-phase 4-wire with PTs Wiring Diagram
Installation 2-7
L1
L2
LINE
L3
Voltage Mode = Wye
N
Fuse
Fuse
Fuse
Customer Supplied CT
Shorting Switch or Tes t
V1
V2
V3
N
Fiber
Rx
Fiber
Tx
I1+
Voltage
Inputs
Display
Module
Powermonitor II
Master Module
Status
Inputs
GRD
S1
S2
S3
S4
Scom
L/+
N/-
Load
Customer
Chassis
Ground
Note:
I1-
Analog
I2+
I2-
Input
Acom
R14
Current
Inputs
I3+
I3-
R11
R12
Relay
I4+
I4-
Output
R24
R21
R22
• Careful attention must be paid to correct phasing
and polarity for prope r operation.
• All ground wires should be taken individually to
Customer Chassis Ground for a single point of
grounding.
Ain
1403-IN001A-US-P
Page 20
2-8 Installation
Figure 2.6 3-phase 3-wire Grounded Wye Direct Connection
Wiring Diagram
Voltage Mode = WyeLINE
L1
L2
L3
S1
Fuse
Fuse
Fuse
Customer Supplied CT Shorting Switch or Test
Block
V1
V2
V3
N
Fiber
Rx
Fiber
Tx
I1+
I1-
I2+
I2-
I3+
Voltage
Inputs
Display
Module
Fiber
Current
Inputs
Powermonitor II
Master Module
Status
Inputs
Power
GRD
Analog
Input
S2
S3
S4
Scom
L/+
N/-
Ain
Acom
R14
R11
Load
1403-IN001A-US-P
Customer
Chassis
Ground
Note:
I3-
Relay
R12
Output
I4+
I4-
R24
R21
R22
• Careful attention must be paid to correct phasing and
polarity for proper operation.
• All ground wires should be taken individually to
Customer Chassis Ground for a single point of
grounding.
Page 21
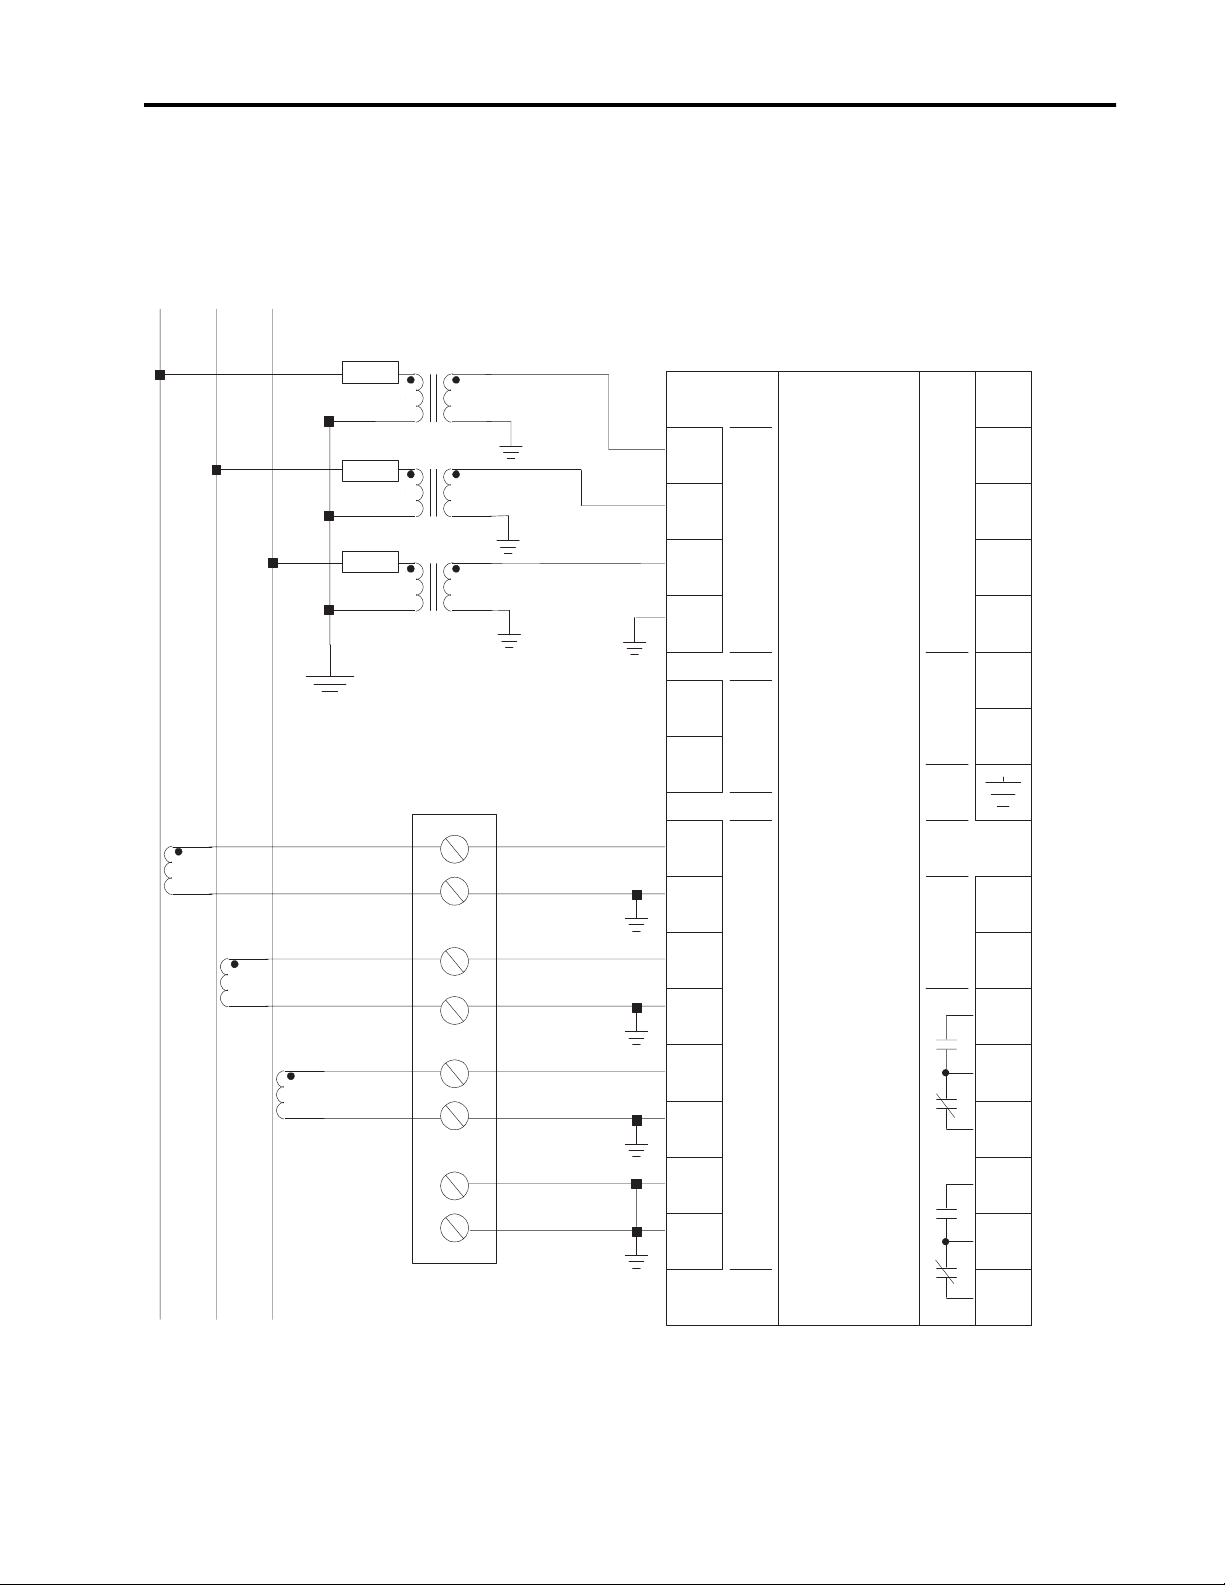
Figure 2.7 3-phase 3-wire Grounded Wye with PTs Wiring
Diagram
Voltage Mode = Wye
LINE
L3
L2
L1
Fuse
Installation 2-9
S1
Fuse
Fuse
Customer Supplied CT Shorting
Switch or Test Block
V1
V2
V3
N
Fiber
Rx
Fiber
Tx
I1+
I1±
I2+
I2±
I3+
Voltage
Inputs
Display
Module
Fiber
Current
Inputs
Powe rmonitor II
Master Module
Status
Inputs
Power
GRD
Analog
Input
S2
S3
S4
Scom
L/+
N/±
Ain
Acom
R14
R11
Load
Customer
Chassis
Ground
Note:
I3±
R12
Relay
I4+
I4±
Output
R24
R21
R22
• Careful attention must be paid to correct phasing and
polarity for proper operation.
• All ground wires should be taken individually to
Customer Chassis Ground for a single point of
grounding.
1403-IN001A-US-P
Page 22
2-10 Installation
Figure 2.8 3-phase 3-wire Delta with Three PTs and Three
CTs Wiring Diagram
L1
L2
LINE
L3
Fuse
Fuse
Fuse
Customer Supplied CT Shorting Switch or
Test Block
Voltage Mode = Delta
V1
V2
V3
N
Fiber
Rx
Fiber
Tx
I1+
Voltage
Inputs
Display
Module
Fiber
Powermonitor II
Master Module
Status
Inputs
Power
GRD
S1
S2
S3
S4
Scom
L/+
N/-
Load
Note:
I1-
Ain
Analog
I2+
I2-
Input
Acom
R14
Current
Inputs
I3+
I3-
R11
R12
Relay
I4+
I4-
Output
R24
R21
Customer
Chassis
R22
Ground
• Careful attention must be paid to correct phasing and polarity for
proper operation.
• All ground wires should be taken individually to Customer
Chassis Ground for a single point of grounding.
• The Two CT wiring diagrams in Figure 2.10 may be used for any
of the delta or open delta wiring or voltage modes shown.
Whether there are two or three CTs in a circuit does NOT affect
the voltage wiring or mode selection.
1403-IN001A-US-P
Page 23
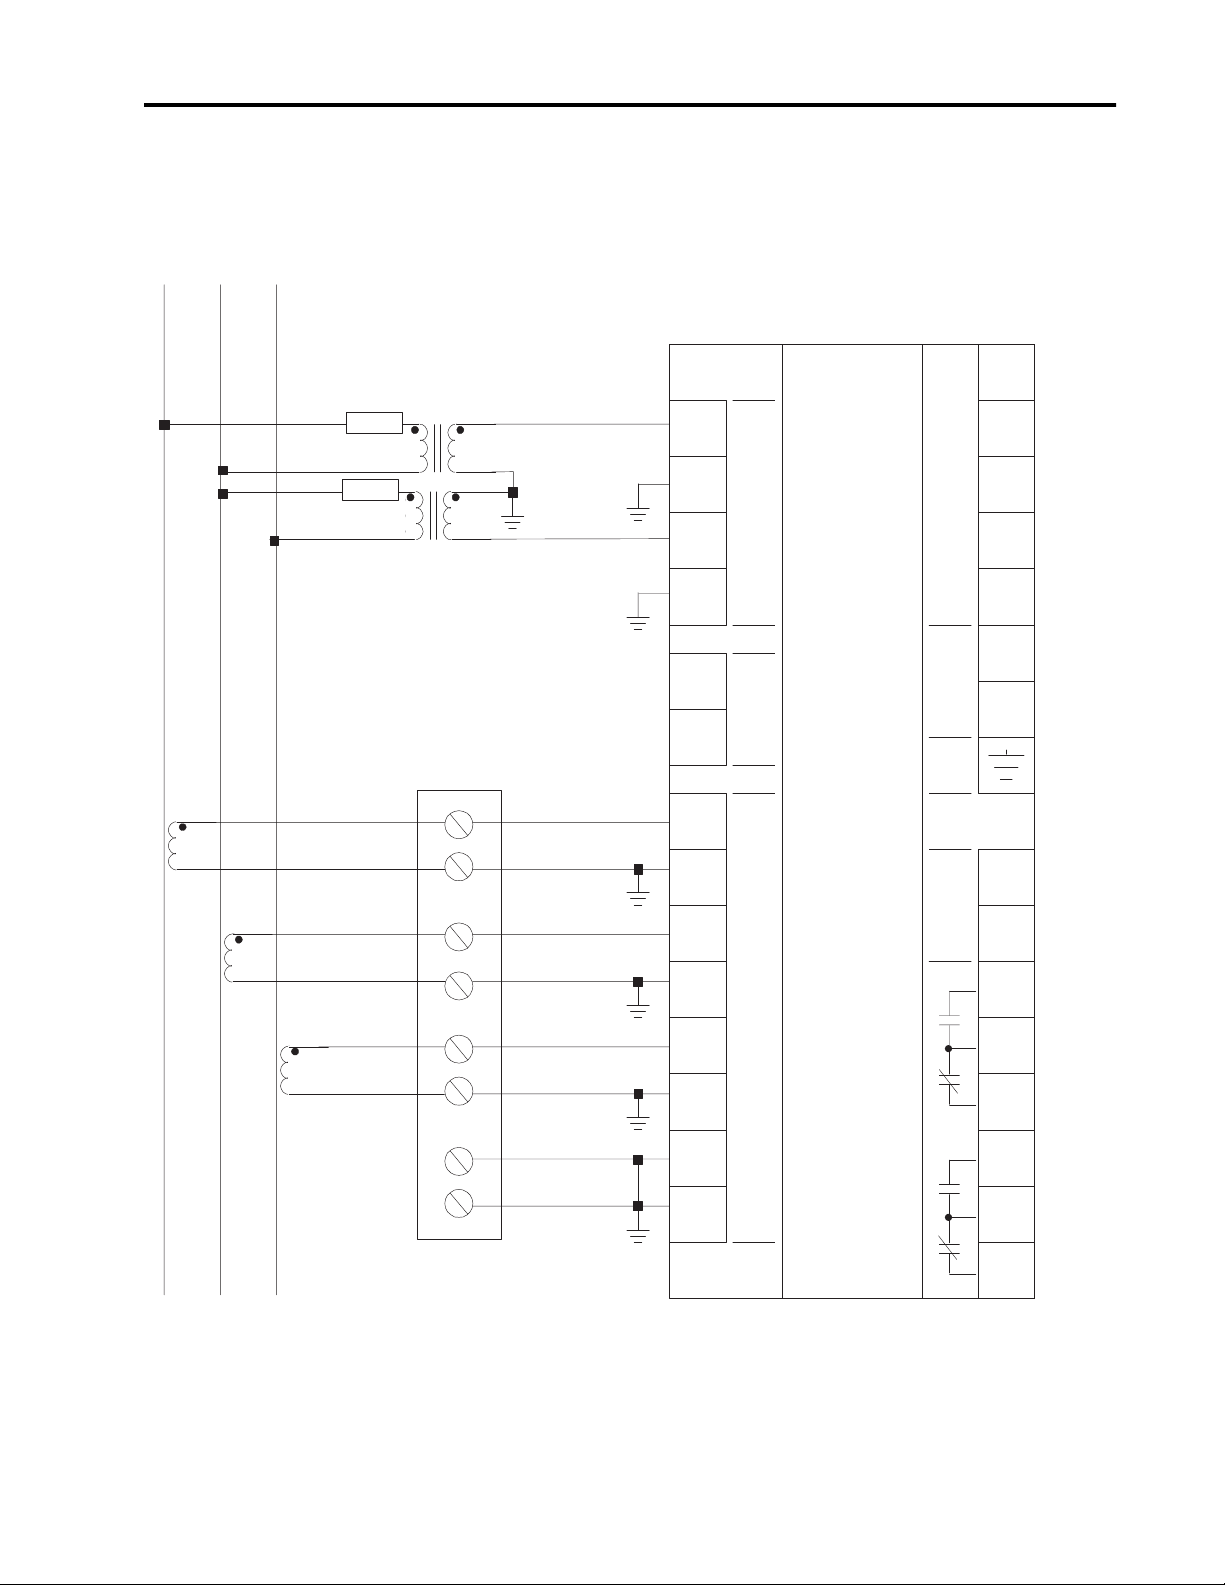
Figure 2.9 3-phase 3-wire Open Delta with Two PTs and
Three CTs Wiring Diagram
Installation 2-11
L1
LINE
L2
L3
Fuse
Fuse
Customer Supplied CT Shorting
Switch or Test Block
Voltage Mode = Open Delta
V1
V2
V3
N
Fiber
Rx
Fiber
Tx
I1+
Voltage
Inputs
Display
Module
Fiber
Powermonitor II
Master Module
Status
Inputs
Power
GRD
S1
S2
S3
S4
Scom
L/+
N/-
Load
I1-
I2+
I2-
Current
Inputs
I3+
I3-
I4+
I4-
Customer
Chassis
Ground
• Careful attention must be paid to correct phasing and polarity for
Note:
proper opera t i o n .
• All ground wires shoul d be taken individually to Customer
Chassis Ground for a single point of grounding.
• The Two CT wiring diagrams in Figure 2.10 may be used for any
of the delta or open d elta wir ing or volta ge mode s shown . Whethe r
there are two or three CTs in a circuit does NOT affect the voltage
wiring or mode selection.
Analog
Input
Relay
Output
Ain
Acom
R14
R11
R12
R24
R21
R22
1403-IN001A-US-P
Page 24
2-12 Installation
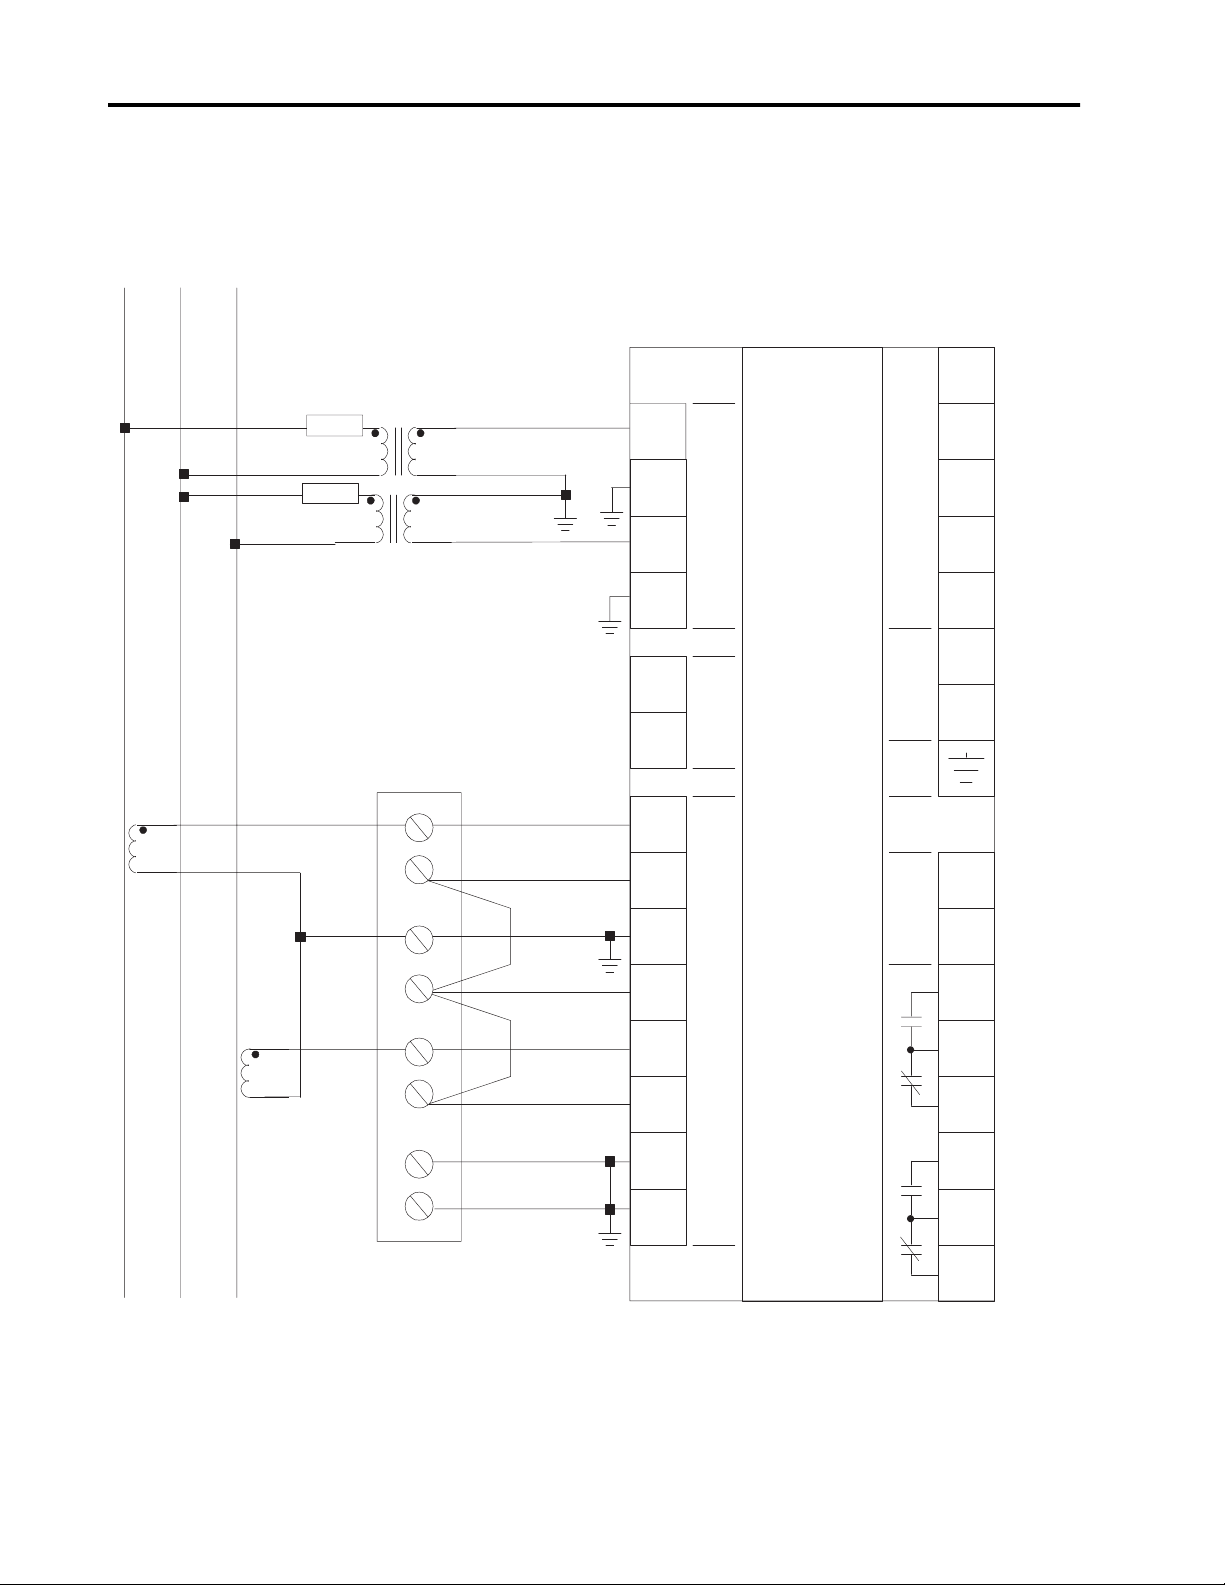
Figure 2.10 3-phase 3-wire Open Delta with Two PTs and
Two CTs Wiring Diagram
LINE
L1
L2
L3
Voltage Mode = Open Delta
S1
Fuse
Fuse
Customer Supplied CT Shorting
Switch or Test Block
V1
V2
V3
N
Fiber
Rx
Fiber
Tx
I1+
I1-
I2+
I2-
Voltage
Inputs
Display
Module
Fiber
Current
Inputs
Powe rmonitor II
Master Module
Status
Inputs
Power
GRD
Analog
Input
S2
S3
S4
Scom
L/+
N/-
Ain
Acom
R14
Load
1403-IN001A-US-P
Note:
I3+
I3-
R11
R12
Relay
Output
R24
R21
Customer
I4+
I4-
Chassis
Ground
R22
• Careful attention must be paid to correct phasing and polarity for
proper operation.
• All ground wires should be taken individually to Customer
Chassis Ground for a single point of grounding.
• The Two CT wiring diagrams in Figure 2.10 may be used for any
of the delta or open delta wiring or voltage modes shown.
Whether there are two or three CTs in a circuit does NOT affect
the voltage wiring or mode selection.
Page 25
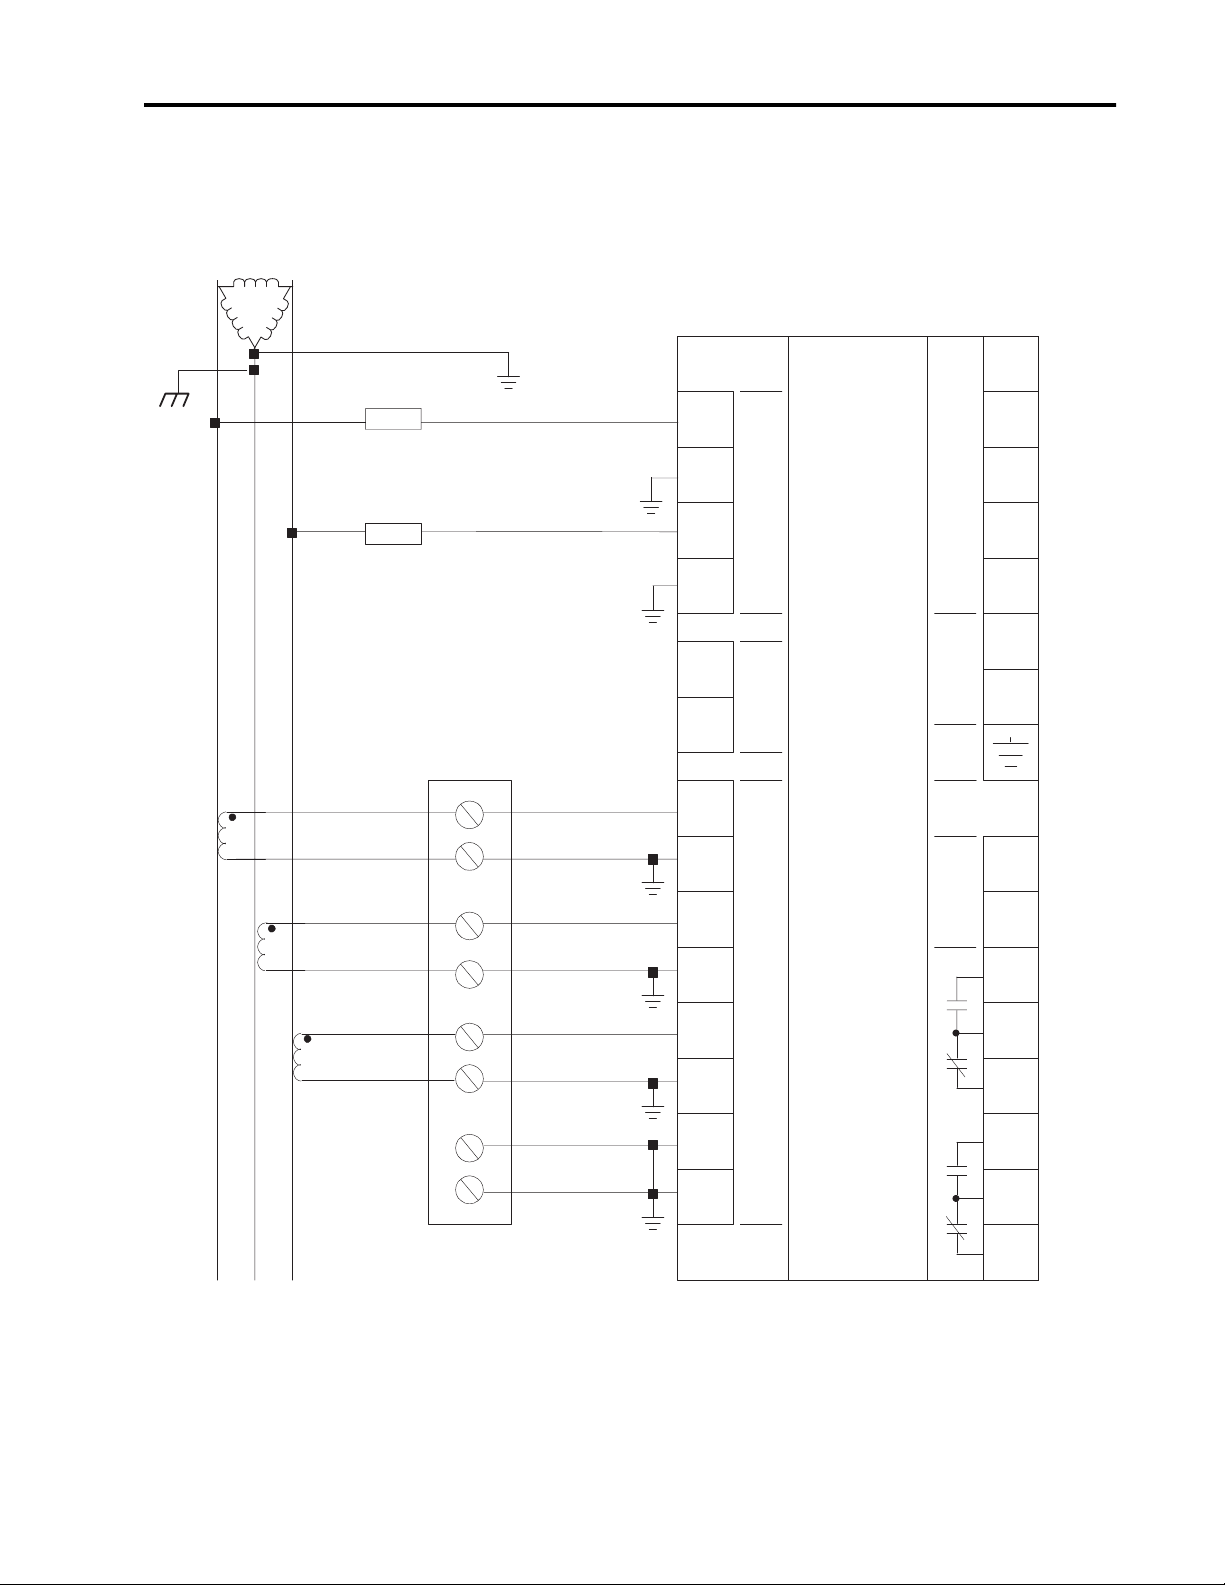
Figure 2.11 3-phase 3-wire Grounded L2(B) Phase Open
Delta Direct Connect with Three CTs Wiring Diagram
Installation 2-13
L1
Distribution
Ground
LINE
L3
Voltage Mode = Open Delta
Fuse
Fuse
Line-to-Line Voltage must not exceed 347V
(otherwise, step down transformers are
required).
Customer Supplied CT Shorting
Switch or Test Block
V1
V2
V3
N
Fiber
Rx
Fiber
Tx
I1+
Voltage
Inputs
Display
Module
Fiber
Powermonitor II
Master Module
Status
Inputs
Power
GRD
S1
S2
S3
S4
Scom
L/+
N/-
L1
L2
Load
L3
I1-
I2+
I2-
Current
Inputs
I3+
I3-
I4+
Customer
I4-
Chassis
Ground
• Careful attention must be paid to correct phasing and polarity for
Note:
proper operation.
• All ground wires should be taken individually to Customer
Chassis Ground for a single point of grounding.
• The Two CT wiring diagrams in Figure 2.10 may be used for any
of the delta or open delta wiring or voltage modes shown.
Whether there are two or three CTs in a circuit does NOT affect
the voltage wiring or mode selection.
Analog
Input
Relay
Output
Ain
Acom
R14
R11
R12
R24
R21
R22
1403-IN001A-US-P
Page 26
2-14 Installation
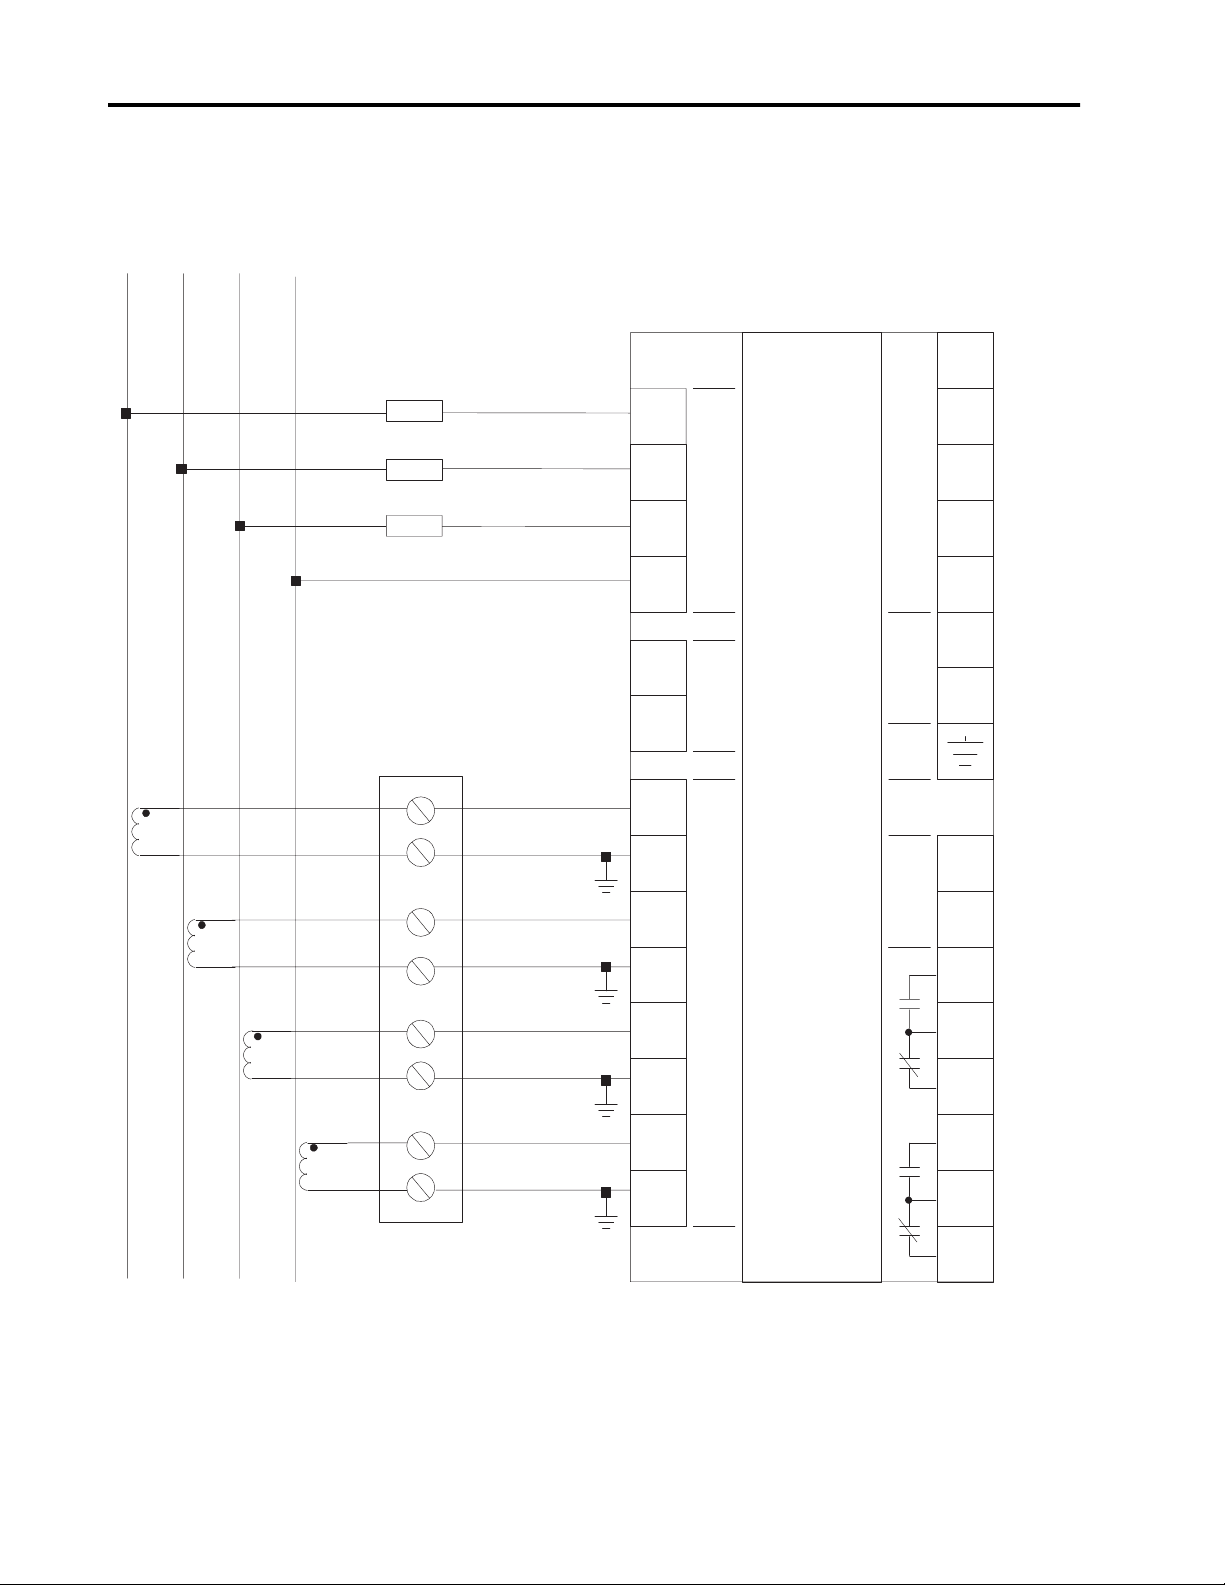
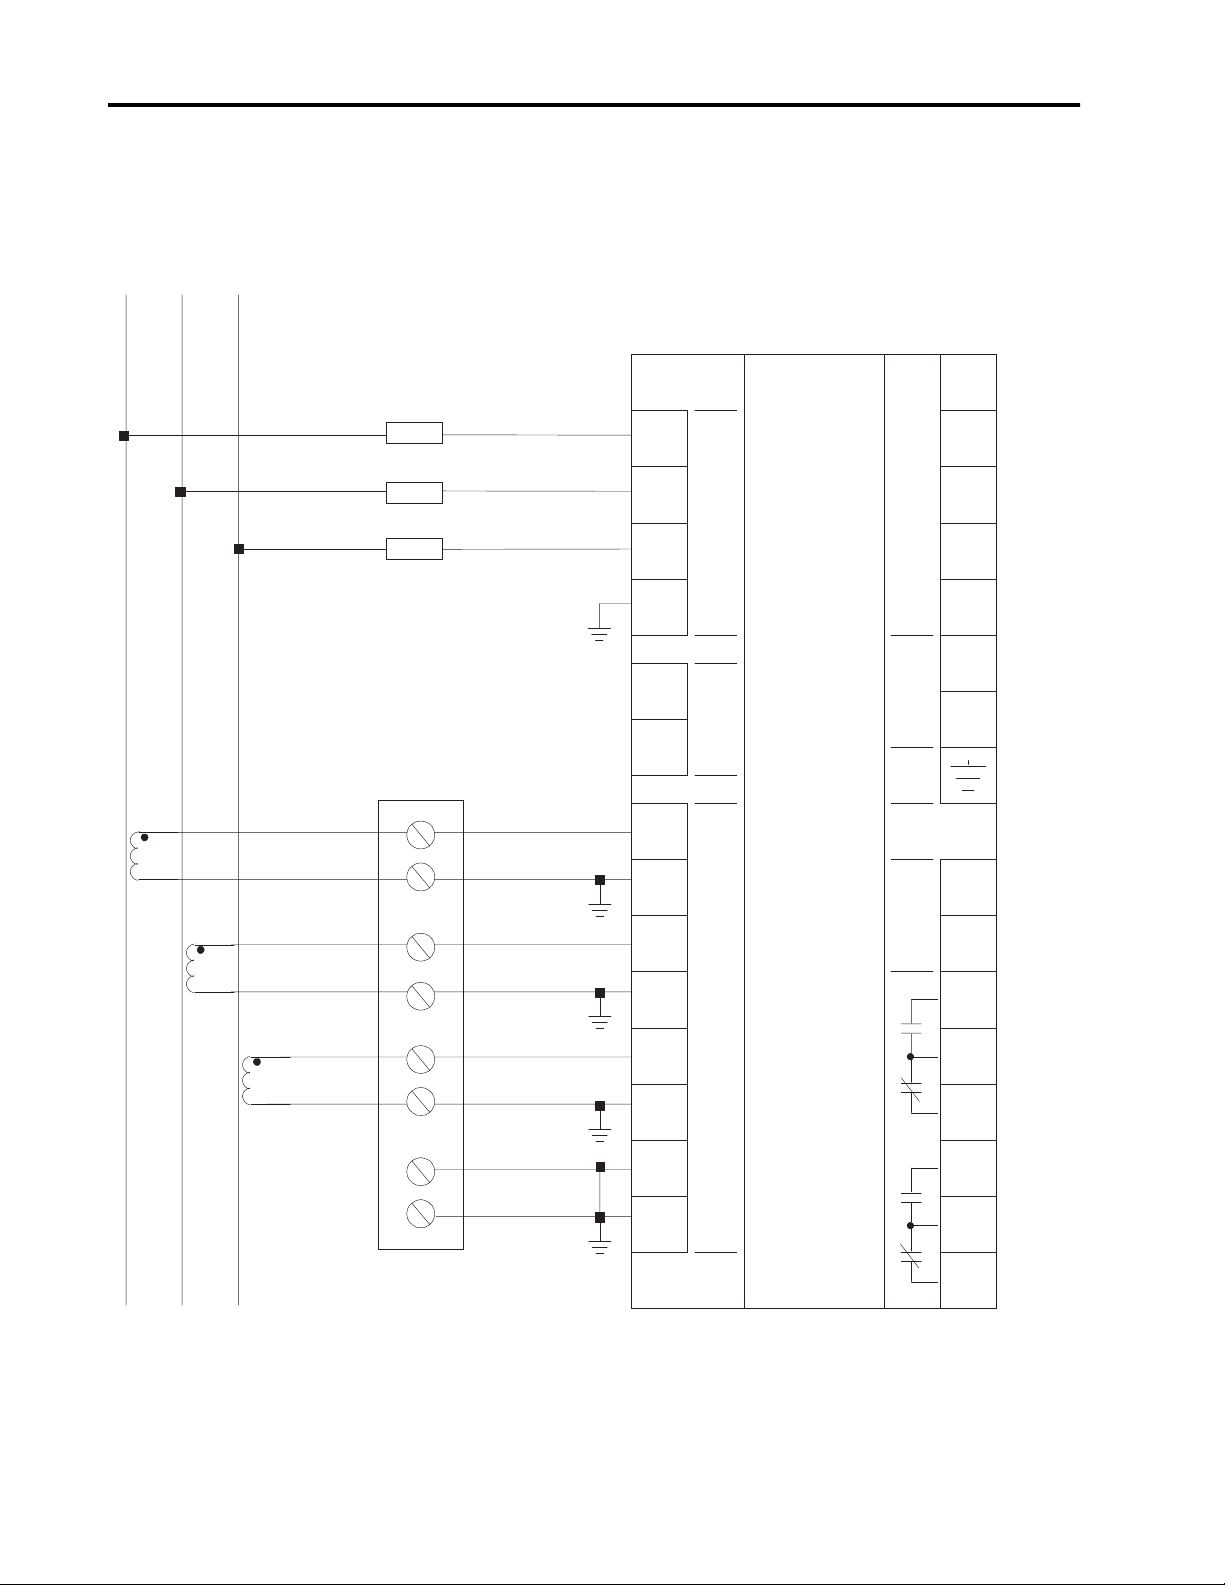
Figure 2.12 3-phase 3-wire Delta Direct Connect with Three
CTs Wiring Diagram
L1
LINE
L2
L3
600 V
Voltage Mode = Direct Connect Delta
Fuse
Fuse
Fuse
L-L
Customer Supplied CT Shorting
Switch or Test Block
V1
V2
V3
N
Fiber
Rx
Fiber
Tx
I1+
Voltage
Inputs
Display
Module
Fiber
Powermonitor II
Master Module
Status
Inputs
Power
GRD
S1
S2
S3
S4
Scom
L/+
N/-
Load
Customer
Chassis
Ground
Note:
I1-
Ain
Analog
I2+
I2-
Input
Acom
R14
Current
Inputs
I3+
I3-
R11
R12
Relay
I4+
I4-
Output
R24
R21
R22
• Careful attention must be paid to correct phasing and
polarity for proper operation.
• All ground wires should be taken individually to
Customer Chassis Ground for a single point of
grounding.
1403-IN001A-US-P
Page 27
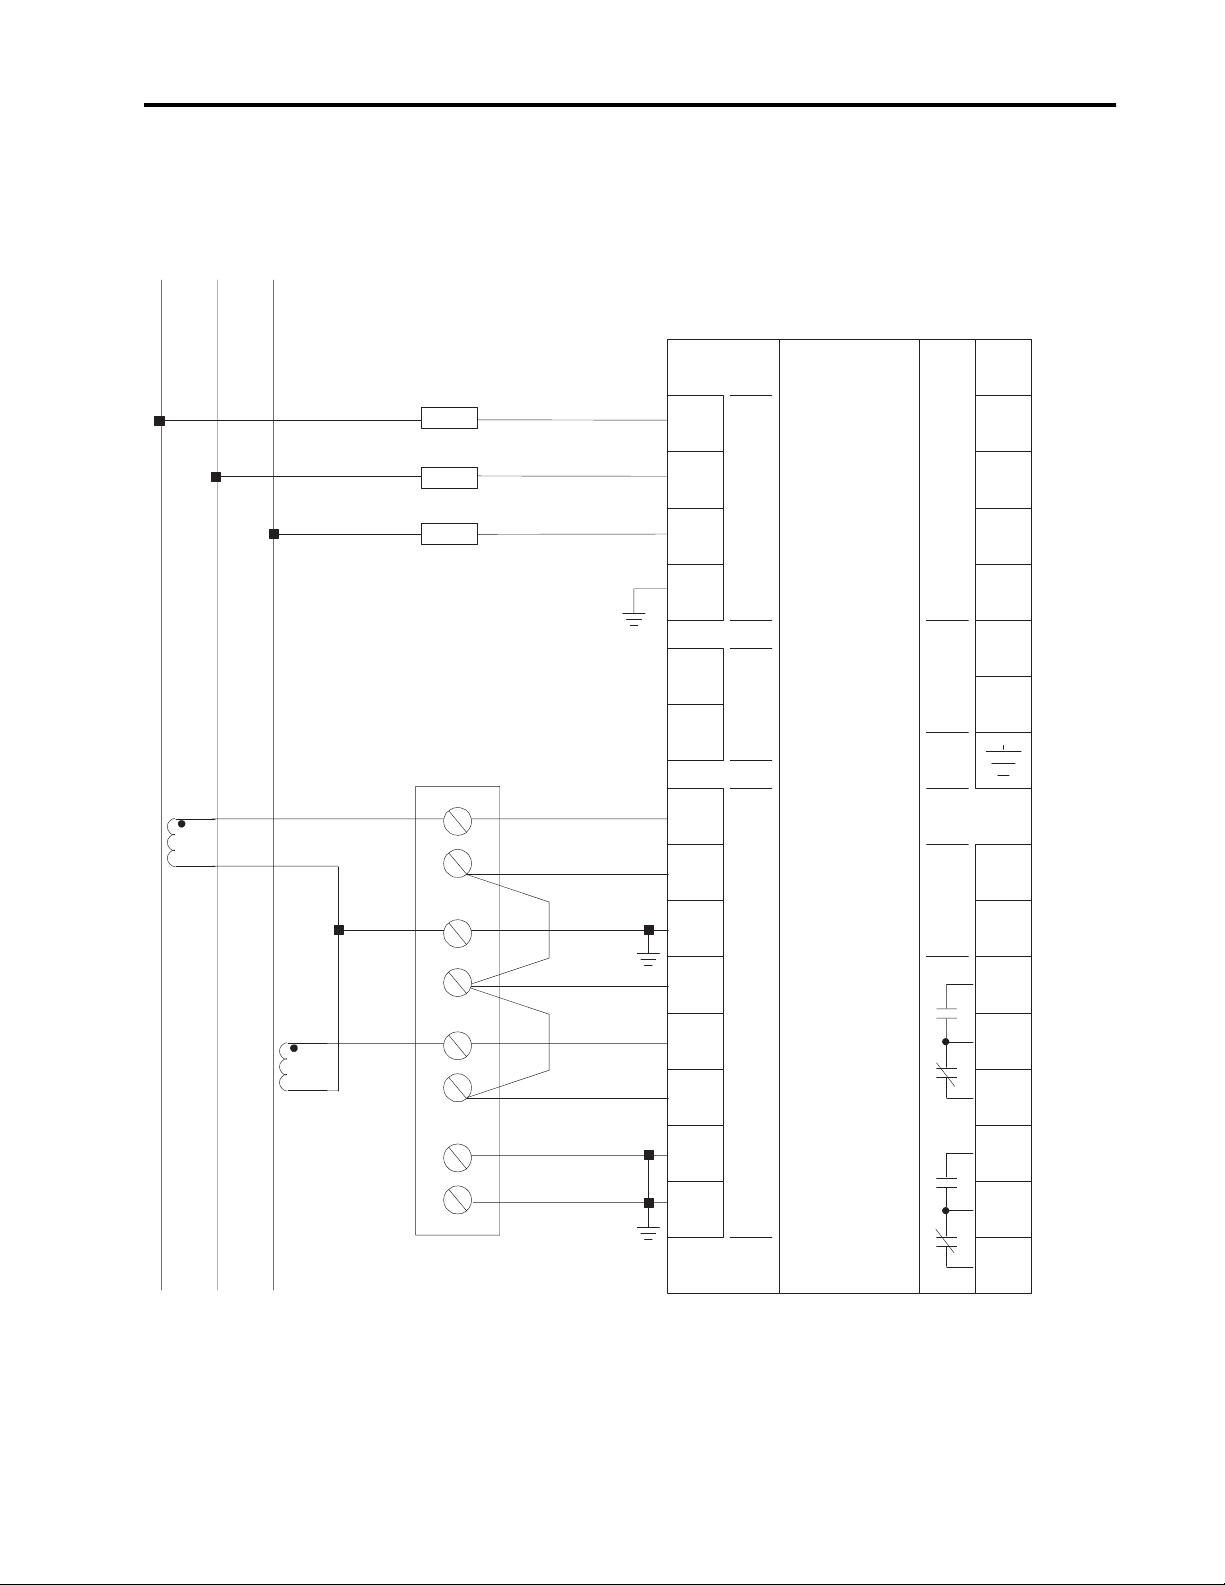
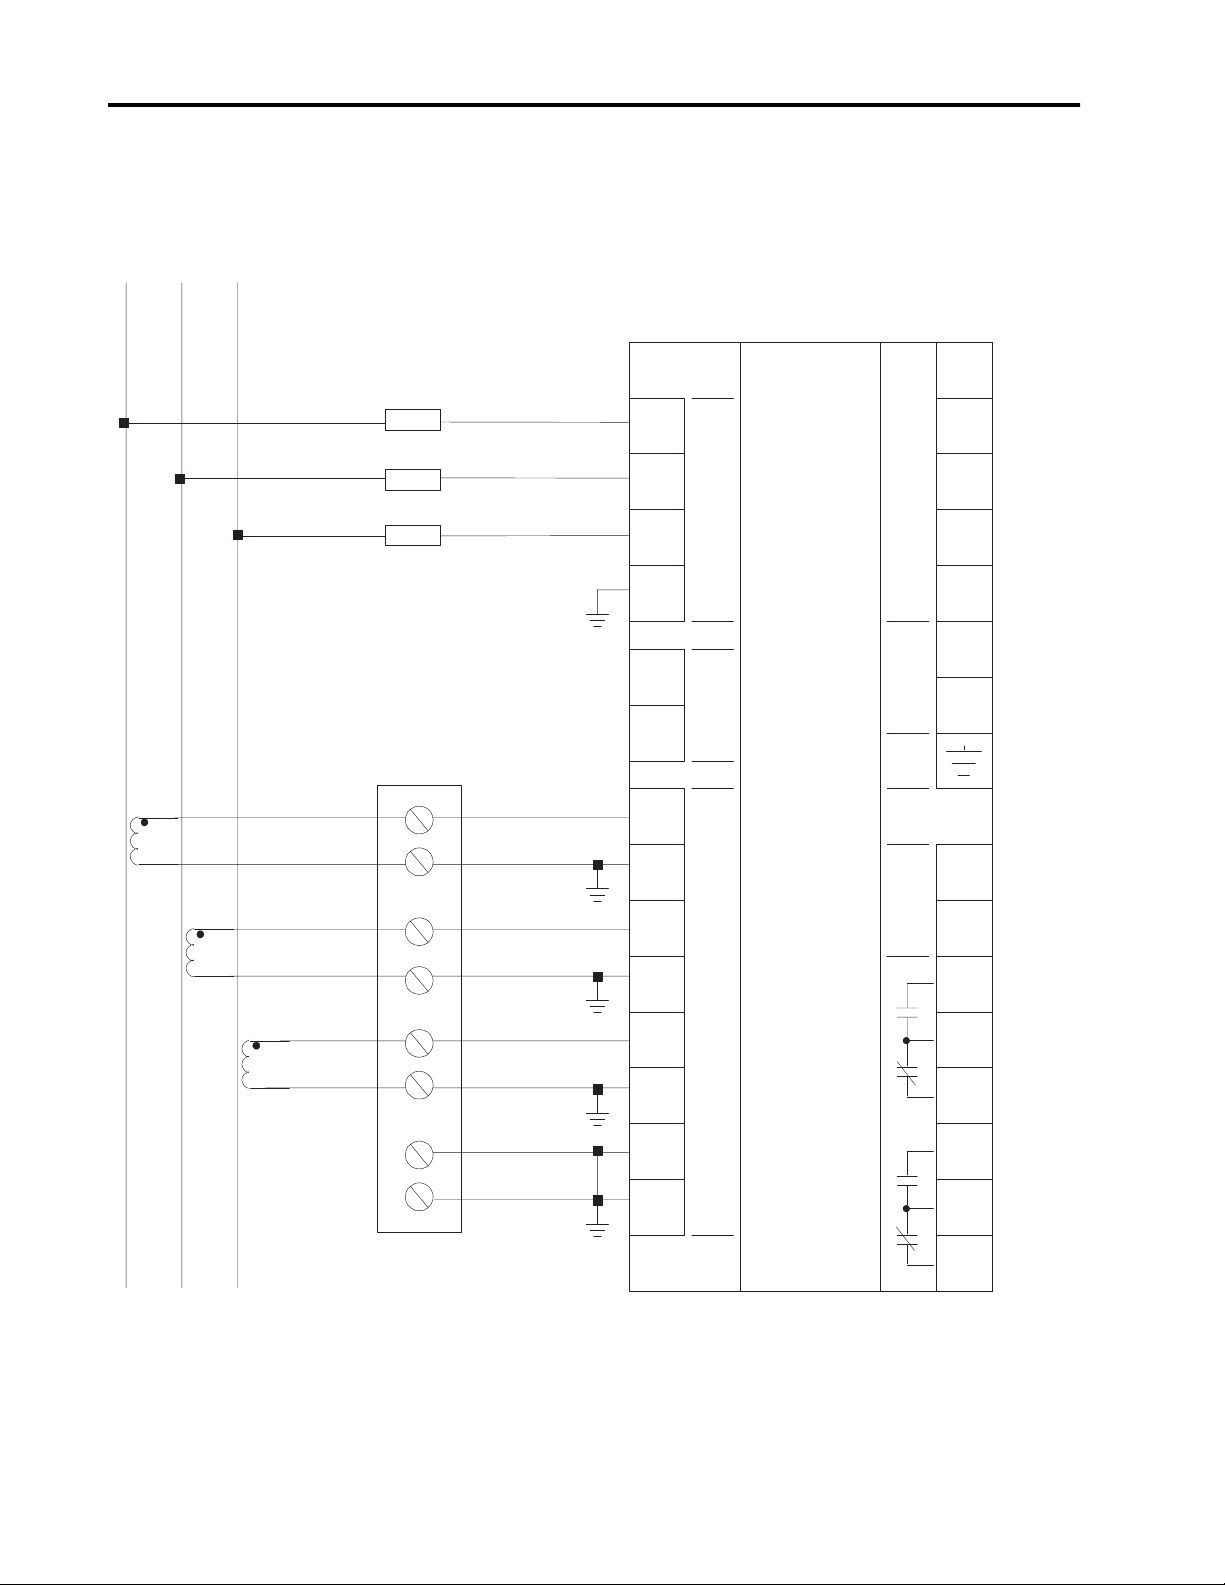
Figure 2.13 3-phase 3-wire Delta Direct Connect with Three
CTs Wiring Diagram
Installation 2-15
L1
LINE
L2
L3
600 V
Voltage Mode = Direct Connect Delta
Fuse
Fuse
Fuse
L-L
Customer Supplied CT Shorting
Switch or Test Block
V1
V2
V3
N
Fiber
Rx
Fiber
Tx
I1+
Voltage
Inputs
Display
Module
Fiber
Powermonitor II
Master Module
Status
Inputs
Power
GRD
S1
S2
S3
S4
Scom
L/+
N/-
Load
Customer
Chassis
Ground
Note:
I1-
Ain
Analog
I2+
I2-
Input
Current
Acom
R14
Inputs
I3+
I3-
R11
R12
Relay
I4+
I4-
Output
R24
R21
R22
• Careful attention must b e paid to correct phasing and
polarity for proper operation.
• All ground wires shoul d be taken individually to
Customer Chassis Ground for a single point of
grounding.
1403-IN001A-US-P
Page 28

2-16 Installation
Analog Input
This input is intended to accept input signals of zero
to one volt AC, 50/60 Hz, rms or plus/minus (±) 1.4
VDC.
Use twisted pair or shielded pair cable to reduce the
level of noise that may be induced on this low level
signal.
Do not use ground as a return path. A Ground
Potential Rise will add to or subtract from the input
signal level and affect the reading.
Relay Outputs
(Isolation Ratings = 2500V)
Table 2.1 Contact Ratings
Rating 50/60 Hz AC rms DC
Maximum Resistive
Load Switching
Minimum Load
Switching
UL 508, CSA 22.2,
IEC Rating Class
Maximum Make
Values Inductive Load
Maximum Break
Values Inductive Load
Maximum Motor Load
Switching
Table 2.2 Relay Life
10A at 250V
(2500VA)
10A at 30V and
0.25A at 250V
10mA at 24V 10mA at 24V
B300 Q300
30A at 120V
15A at 240V
(3600VA)
3A at 120V
1.5A at 240V
(360VA)
0.55A at 125V
0.27A at 250V
(69VA)
0.55A at 125V
0.27A at 250V
(69VA)
1/3 HP at 125V
1/2 HP at 250V
Figure 2.14 Control Relay Connections
S1
V1
V2
Voltage
Inputs
V3
N
Fiber
Rx
Display
Fiber
Module Fiber
Tx
I1+
I1-
I2+
I2-
Current
I3+
Inputs
I3-
I4+
I4-
PM-II
Master
Module
Relay
Outputs
Status
Inputs
GRD
Analog
Input
S2
S3
S4
Scom
L/+
N/-
Ain
Acom
R14
R11
R12
R24
R21
R22
L1
Power
Status Inputs
ATTENTION: Do not apply an
external voltage to a Status Input.
!
These inputs have an internal source
and are intended for dry contact input
only . Applyi ng a voltag e may damage
the associated input or internal power
supply.
10A Fuse
Load
Load
L2
N
Parameter Number of Operations
Mechanical
Electrical
5 X 10
1 X 10
6
5
Figure 2.14 shows one of the internal Form C Relay
contacts along with an exampl e of customer wiring to
a supply voltage and two loads.
1403-IN001A-US-P
All Status Inputs are common to an internal 24VDC
source on the SCOM te rminal. Sta tus in put termin al s
1-4 are positive polarity and SCOM is negative
polarity.
To prevent ground loops, each wire run to a Status
Input should have an accompanying return wire
connected to the SCOM (the common point for all
Status Inputs). (If more than two Status Inputs are
used, an external terminal block is recommended.)
Page 29

Installation 2-17
Table 2.3 Status Input
Parameter Condition 1 Condition 2
Applied resistance
verses status state
3.5K Ohms or less
= ON
5.5K Ohms or
greater = Off
Isolation Voltage 2500V status input to case 2500V
status input to internal digital circuitry
Figure 2.15 Status Inputs
N.O Contact
V1
V2
V3
Fiber
Rx
Fiber
Tx
I1+
I1±
I2+
I2±
I3+
I3±
I4+
I4±
S1
S2
Status
Inputs
Analog
Input
Relay
Outputs
Power
GRD
S3
S4
Scom
L/+
N/±
Ain
Acom
R14
R11
R12
R24
R21
R22
Voltage
Inputs
N
Display
Module
Fiber
PM-II
Master
Module
Current
Inputs
LED Indicators
The Powermonitor II is equipped with two light
emitting diodes (LED) labeled “Power” and “OK.”
The Power LED illuminates when suf ficient power is
applied to the device. The OK LED flashes when the
device is initially powere d; this indicates that the
device is running internal self tests. After the OK
LED flashes and the internal self tests pass, the OK
LED remains illuminated indicating that the device is
in good operating conditi on. If the OK LED does not
remain illuminated, this ind icates that an internal
self-test did not pass and service is needed (refer to
Chapter 3, Field Service Considerations ).
Figure 2.16 LED Indicators
Note: Status Input #4 can be configured for
external demand pulse input. See Table 4.2
on page 4-9, for informtion.
1403-IN001A-US-P
Page 30

2-18 Installation
L1/+
L1/-
Local Frame Ground
Wiring of Display Module
Note: All ground wires should be kept as short as
possible; 30cm (12 in.) or less is suggested.
Power
The Display Module can be operated on eithe r AC or
DC power. Two models have been developed to
operate on various AC/DC voltage ranges as defined
in Table 2.4. A single, three-position connector is
provided for all power connections to the Display
Module.
component of the next unit and repeated for each
additional module until th e ri ng is completed. Figure
2.17 shows a typical layout of the fiber optic cabling
between one Master Module and three Display
Modules. Fiber optic cable assembly specifications
are given in Table 2.5 on page 2-18.
Important:Always maintain furnished rubber plugs
in the transm itter and receiver when
cable end connectors are not in place.
This helps prevent dirt from
contaminating the transm itter or
receiver.
Figure 2.17 Fiber Optic Communications between a Bulletin
1403 Master Module and Three Display Modules
Table 2.4 Display Module Voltage Ratings
Cat. No./
Voltage Range
1403-DMA/High
Voltage
1403-DMB/Low
Voltage
Terminal Block Wire Sizes and Screw Torque
Values
All terminal block wire sizes and terminal block
screw torque values are shown in Appendix C,
Technical Specifications .
Fiber Optics
The Powermonitor II communications architecture
consists of a fiber optic ring between the Bulletin
1403 Master Module and up to three Display
Modules. The black transmitt er component ( TX) of a
unit must be connected to the blue receiver (RX)
AC Voltages/DC Voltages
(+10% to -20%)
120 VAC, 240 VAC / 125 VDC, 250 VDC
12 V A C , 24 VAC / 12 VDC, 24 VDC, 48 VDC
Table 2.5 Fiber Optic Cable Assembly Specifications
Parameter Minimum Maximum
Cable Length:
Distance between
two adjacent devices
Minimum inside bend
radius
25 cm (approx. 10 in.)
shortest Allen-Bradley
standard
25.4mm (1 in.) Any bends
with a shorter inside radius
can permanently damage
the fiber optic cable. Signal
attentuation increases with
decreased inside bend
radii.
500 m
(1650 ft.)
N/A
ATTENTION: Any bend in a fiber
optic cable assembly with an inside
!
radius of less than 25.4 mm (1 in.)
may permanently damage the fiber
optic cable assembly.
1403-IN001A-US-P
Page 31

Installation 2-19
Fiber Optic Cable Assembly Strain Relief
A strain relief feature at the rear of the Display
Module and a wire tie are provided for securing the
fiber optic transmit and receive cable assemblies. Use
the strain relief feature to protect the fiber optic
connections at the rear of the Display Module. Coil
each fiber optic cable into an approximat ely one inc h
diameter loop and secure each loop to the rear of the
Display Module with the wi re tie provi ded per Figur e
2.18, Figure 2.19, and Figure 2.20.
Figure 2.18 Fiber Optics Strain Relief
2. Push the wire tie into the slot and force it out of
the second, adjacent slot.
Figure 2.20 Fiber Optics Strain Relief
3. Install and secure both fiber optic cables. The
cables should be coiled into one inch minimum
diameter loops and secured with the wire tie.
1. Insert the wire tie into the slot on the Display
Module’s rear cover.
Figure 2.19 Fiber Optics Strain Relief
Cat. No. Explanation and Accessories
for the Display Module Cat. No. explanation and a
listing of all fiber optic accessories.
Additional Information
For addition al information regarding the use of the
Display Module to configure the Master Module,
refer to Chap ter 4, General Operation.
1403-IN001A-US-P
Page 32

2-20 Installation
Communication Connections
The Powermonitor II Master Module uses a
communications connector for all Communications
Cards. This Communications Card connector allows
different communication card types to be used to
provide the appropriate protocol for a specific
system. For example, Cat. No. 1403-NSC is used f or
Allen-Bradley DF-1 serial and R I/O
communications. (Refer to Publication 1403-5.1,
Smart Communications Card Instruction Sheet for
specific communicat ion info rmat ion.) Cat. No. 1403NENET is used for Ethernet communica tions. (Refer
to publication 1403-5.3, Ethernet Communications
Card Instruction Sheet for specific communication
information.) Cat. No. 1403-NDNET is used for
DeviceNet communications. (Refer to publication
1403-5.4, DeviceNet Communications Card
Instruction Sheet for specific communic ation
information .)
Figure 2.21 Smart Communications Card
Figure 2.22 Ethernet Communication Card
Figure 2.23 DeviceNet Communication Card
1403-IN001A-US-P
Page 33

Chapter
3
Maintenance
Battery Instal lation and Replacement Procedures
Installation
A TTENTION: This procedure may
be conducted with fu ll elect rical power
!
Note: For proper operation, the device should not
1. Remove the closure plate on the top face of the
Master Module per Figure 3.1. Electric al power is
normally connected to the Master Module.
applied to the Master Module. Use
extreme caution when installing the
lithium battery into your Bul letin 1403
Master Module. Fai lure t o use ex treme
caution can lead to personal injury or
death, property damage, or economic
loss.
be powered for an extended period of time
without a battery installed.
Figure 3.1 Battery Extractor Extended for Battery
Installation
Master Module shown with
closure plate removed.
Lithium battery is ready for
installation and the battery
extractor is extended.
2. Gently pull the retaining tab from its slot, then
unfold the battery extractor to completely expose
the battery holder.
3. Install the lithium battery noting the correct
polarity within the battery holder. Note that the
battery must be installed over top of the battery
extractor flap. Ensure th at the lithium battery is
securely held in place within the battery holder.
Refold the battery ext ractor over top of t he lithium
battery and insert the retaining tab back into the
slot per Figure 3.2.
1403-IN001A-US-P
Page 34

3-2 Maintenance
Figure 3.2 Master Module with Battery Installed
Removal
ATTENTION: When installing or
removing the battery within the
!
1. Remove the closure plate on the top face of the
Master Module with extreme caution per Figure
3.1. Electrical power i s normally connected to the
Master Module.
2. Gently pull the retaining tab of the battery
extractor from its slot, then unfol d and extend the
battery extractor upward or a way fr om the Maste r
Module as shown in Figure 3.3 to completely
expose the battery in its holder.
3. Gently pull upwards on th e battery ex tractor ta b to
remove the battery from its holder per Figure 3.3.
Bulletin 1403 Master Module, take
care not to come into contact with
metallic surfaces if power is applied.
4. Reinstall the access cover plate on the top face of
the Master Module.
5. A command should be issued to reset the real time
clock and clear the battery usage counter via the
Display Module or the Communications Card.
ATTENTION: Risk of fire or bur ns.
Do not recharge, disassemble, heat
!
!
above 212× F, or incinerate. Keep
battery out of reach of chil dren and in
original package until ready to use.
Dispose of used batteries promptly.
Never put batteries in mouth. If
swallowed, contact your physician or
local poison control center.
ATTENTION: Replace battery with
Allen-Bradley Cat. No. 1403-BA
only. Use of another battery may
present risk of fire or explosion.
Figure 3.3 Battery Extractor Extended for Battery Removal
1403-IN001A-US-P
Page 35

ATTENTION: The battery is held
under pressure within its holder and
!
4. Refer to Battery Installation and Replacement
Procedures on page 3-1 for installation of a new
battery.
5. Reinstall the access cover plate on the top face of
the Master Module.
may be forcefully ejected upon
extraction.
Disposal of Discharged Lithium Batteries
In the United States, transportation of depleted
lithium batteries for disposal is controlled by the
Code of Federal Regulations, Title 49. Depleted
lithium batteries are defined by the extent that the
open circuit voltage is less than the lower of:
2.0 volts or
•
Two-thirds of the voltage of a fully charged
•
battery
Maintenance 3-3
1. Turn off all electric al power supp lied to the
Master Module and Display Module.
2. Clean the Master Module with a dry, anti-static,
lint-free cloth. Remove all dust and any
obstructions from the cooling air vents on the
upper, lower, and ends of the module. Ensure that
the nameplate is clean and in good condition.
3. Clean the Display Module with a dry, anti-static,
lint-free cloth. Remove all dust and any foreign
material(s) from the exterior of the module.
Ensure that the graphic front panel overlay and
back nameplate are clean and in good condition.
Field Service Considerations
If the Powermonitor II requires servicing, please
contact your nearest Allen-Bradley Sales Office. To
minimize your inconvenience, the initial installation
should be performed in a manner which makes
removal easy.
Check the Code of Federal Regulations, Title 49 or
local regulations regarding the current methods and
procedures for the disposal of lithium batteries.
Calibration
The calibr ation interval for the Powermonitor II
depends on the user’s accuracy requirements. To
meet general operating requirements, regular
recalibration is not necessary.
Contact your nearest Allen-Bradley Sales Office for
calibration or servi ce inf orma ti on.
Cleaning Instructions
A TTENTION:
•
Disconnect and lock out all power sources
!
and short all current transformer secondaries
before servicing. Failure to comply with these
precautions can lead to personal injury or
death, property damage or economic loss.
•
Please follow appropriate Electrostatic
Sensitive Discharge (ESD) procedures during
cleaning.
1. A CT shorting block should be provided to allow
the Powermonitor II Master Module current
inputs to be disconnected without open circuiting
the user supplied CTs. The shorting block should
be wired to prevent any effect on the external
protective relays.
2. All wiring should be routed to allow easy
maintenance at connections to the Powermonitor
II terminal strips, the Powermonitor II rear cover,
and the Powermonitor II itself.
ATTENTION: A CT circuit must not
be opened with primary curre nt present.
!
Wiring bet ween t he CTs should include
a terminal b lock for shorting the CTs.
Open CT secondaries will produce
hazardous voltages, which can lead to
personal injury or death, property
damage, economic loss, or CT failure.
1403-IN001A-US-P
Page 36

3-4 Maintenance
1403-IN001A-US-P
Page 37

Chapter
4
General Operation
General Functionality
The Display Module acts as a simple terminal that
allows a user to easily view metering parameters or
change configuration items. This is accomplished by
using three modes of operation: Display mode,
Program mode, and Edit mode.
Display mode allows any user to view any of the
measured parameters that the Powermonitor II
provides including metering information, harmonic
analysis (1403-MM only), and logging information.
The user also has the option of selecting default
screens which are displayed at power-up or after 30
minutes of non-activity.
Program mode allows a privileged user to issue
commands or select a parameter to modify. Program
mode provides a basic security system where each
Powermonitor II is pass word pro tecte d, and onl y one
entity can m odify a Powermonitor II; an entity
includes one of the three possible Display Modules
or the Smart Communicatio n Card. When a u ser is i n
Program Mode, a flashing “P” is displayed at the
bottom right-hand corner of the Display Module.
Edit mode allows the privileged user to mo dify the
selected parameters. When a user is in Edit mode, the
parameter being modified flashes, and the flashing
“P” remains solid.
Key Functions
The Display Module has four keys located on its
front bezel: an Escape key, Up Arrow key, Down
Arrow key, and Enter key. These keys maintain their
same functionality for all of the Display M odule’s
modes making the Display Module easy to use. The
functionality of the four keys is shown in Figure 4.1.
Figure 4.1 Display Module Key Functionality
Escape Key Up Arrow Key Down Arrow Key Enter Key
Display Mode Returns to parent menu. Steps back to the previous
parameter/menu in the list.
Program Mode Returns to parent menu. Steps back to the previous
parameter/menu in the list.
Edit Mode Cancels changes to the
parameter, restores the
existing value, and returns
to Program mode.
Increments the parameter/
menu value.
Steps forward to the next
parameter/menu in the list.
Steps forward to the next
parameter/menu in the list.
Decrements the parameter
value.
Steps into a sub-menu or
sets as default screen.
Steps into a sub-menu or
selects the parameter to be
modified and changes to
Edit mode.
Saves the parameter
change to the Master
Module and returns to
Program mode.
1403-IN001A-US-P
Page 38

4-2 General Operation
New Password?
0000 P
New Password?
0000 P
Note: For additional information on measured
parameters listed in Chapter 4, refer to
Publication 1403-1.0.2, Bulleting 1403
Powermonitor II Tutorial.
Editing a Digital Parameter
1. Using the Display Module keys, move into
Program mode and display the parameter to be
modified. Notice the flashing “P” in the lower
right-hand corner.
New Password?
1234 P
4. After the desired parameter value is displayed,
press the Enter key to write the new value to the
Master Module and set the Display Module back
to Program mo de. Notice the “P” in the lowe r
right-hand corner is flashing, and the parameter
being modified is solid.
2. Set the Display Module into Edit mode by
pressing the Enter key. The “P” in the lower righthand corner remains solid, and the parameter
being modified is flashing.
3. Change the value of t he pa rameter by p ressi ng the
Up Arrow and Down Arrow keys until t he desir ed
parameter value is displayed. Notice the “P” in the
lower right-hand corner remains solid, and the
parameter being modified is still flashing.
New Password?
1234 P
5. In the event that an incorrect parameter is being
modified, pressing the Escape key returns the
original parameter value, do es not modify the
Master Module, and returns the Display Module
to Program mo de. Notice the “P” in the lowe r
right-hand corner is flashing, and the parameter
being modified is solid.
New Password?
0000 P
1403-IN001A-US-P
Page 39

Issuing a Command
Force Relay 1
{ or } P
Force Relay 1
{ or } P
1. Using the four Display Module keys, move into
Program mode and display the command to be
issued. Notice the flashing “P” in the lower righthand corner.
2. Set the Display Module into Edit mode by
pressing the Enter key. The “P” in the lower righthand corner remains solid, an d the command
option prompt is flashing.
General Operation 4-3
Force Relay 1
Energize P
4. After the desired parameter value is displayed,
press the Enter key to execute the command. The
selection prompt will reappear and the Display
Module is set back to Program mode. Notice the
“P” in the lower right-hand corner is flashing, and
the option prompt is solid.
3. Choose the option of the command by pressing
the Up Arrow and Down Arrow keys until the
desired option is displayed. Notice the “P” in the
lower right hand corner remains solid, and the
command option being selected is still flashing.
Force Relay 1
{ or } P
5. In the event that a command is to be aborted,
pressing the Escape key returns the Display
Module to Program mode, and the option prompt
is displayed. Notice the “P” in the lower righthand corner is flashing, and the option prompt is
solid.
Force Relay 1
{ or } P
1403-IN001A-US-P
Page 40

4-4 General Operation
Figure 4.2 Menu/Parameter Structure
Chart Key
Default
Screen
Level 1
Level 2
Level 3
Level 4
Select
Level 3
Metering
V / I
Level 4
3-phase L-N V / I
Phase 1 L-N V / I
Phase 2 L-N V / I
Phase 3 L-N V / I
Average L-N V / I
3-phase L-L Voltage
Phase 1-2 L-L V / I
Phase 2-3 L-L V / I
Phase 3-1 L-L V / I
Average L-L V / I
Aux/L4 V /
Freq/Phase Rotation
Pos/Neg Seq L-L Volt
Pos/Neg Seq Current
V / I % Phase Unbal.
Level 2
Metering
Power
3-phase Power W
T otal Power W
3-phase Rea. Pwr VAR
T otal Rea. Pwr VAR
3-phase APP. Pwr VA
T otal App. Pwr VA
3-phase PF
T otal/Dist/Disp PF
Default
Screen
Display
Meter
Metering
Σ
Power
kW Hours Forward
kW Hours Reverse
kW Hours Net
kVAR Hours Forward
kVAR Hours Reverse
kVAR Hours Net
Demand Current Amps/Max
Demand Power W/Max
Demand Rea. Pwr VAR/Max
Demand App. Pwr VA/Max
Program
Password?
0000
Level 1
Program
Display
Display
Harmonics
K-factor V / I
Crest V / I
TIF V / I
IEEE-519 V / I
IEEE %THD V / I
IEC %THD V / I
Harmonic 1/2 V / I
Harmonic 39/40 V / I
Harmonic 41 V / I
③
Harmonics
Phase 1
①
①
①
①
①
①
①
Level 2
Harmonics
Phase 2
K-factor V / I
①
Crest V / I
①
TIF V / I
①
IEEE-519 V / I
IEEE %THD V / I
IEC %THD V / I
Harmonic 1/2 V / I
Harmonic 39/40 V / I
Harmonic 41 V / I
①
Program
Commands
P
Level 4
Force Relay 1
Force Relay 2
Clear Min/Max Log
Clear Snapshot Log
Set WHr Counter
Set VarHr Counter
Clr S1 Counter
Clr S2 Counter
Clr S3 Counter
Clr S4 Counter
Clr Battery Usage
Restore Factory Defaults
①
①
①
P
Harmonics
Phase 3
K-factor V / I
①
Crest V / I
①
TIF V / I
①
IEEE-519 V / I
IEEE %THD V / I
IEC %THD V / I
Harmonic 1/2 V / I
Harmonic 39/40 V / I
Harmonic 41 V / I
①
①
①
①
(1) Available on 1403-MM only
(2) Available on 1403-LM only
(3) Appears only when THD is enabled 1403-LM only.
1403-IN001A-US-P
Page 41

General Operation 4-5
Level 3
Configuration
General
New Password
Voltage Mode
①
Filter Mode
Enable THD
PT & CT Ratio
Vaux & I4 Ratio
Vaux Volt Mode
Snapshot Period
Snapshot Buffer
Log Status Inp
Date Format
Time/Date
Max Isc
Max Dmnd Load 1
Phase Label
Aux Volt Label
Harmonics
I4/Neutral
K-factor V / I
Crest V / I
TIF V / I
①
IEEE-519 V / I
IEEE %THD V / I
IEC %THD V / I
Harmonic 1/2 V / I
Harmonic 39/40 V / I
Harmonic 41 V / I
②
①
①
①
①
①
①
①
Program
Configuration
P P P P
P
P
Configuration
Communication
RIO Rack Address
RIO Group Number
RIO Last Rack
RIO
Baud Rate
Serial Delay
Serial Mode
RS-232/RS-485 Baud Rate
RS-485 Address
P P P
Configuration
Demand
Period Length
No. of Periods
Pulse Output
Pulse Parameter
Pulse Increment
Pulse Width
Program
Setpoints
Setpoint
01. .20
Type
Evaluation
High Limit
Low Limit
Pickup Delay
Dropout Delay
Action Type
Note: Configuration Communication parameters depend on which communication card is
①
Display
Logs
Logs
Event
Event 01
Event 100
being used. The above configuration Communication parameters are specifically for
the 1403-NSC Communication Card.
Logs
Min/Max Log
?
1 I
?
2 I
?
3 I
I4
Ave I
Pos Seq I
Neg Seq I
% Unbal I
?1±?
2 V
?2±?
3 V
?3±?
1 V
Aux V
Ave L±L V
Pos Seq V
Neg Seq V
% Unbal V
?
1±N V
?
2±N V
?
3±N V
Ave l±N V
Ave Freq.
Freq.
?
1 W
?
2 W
?
3 W
?
W
3
?
1 Var
?
2 Var
?
3 Var
?
Var
3
?
1 VA
?
2 VA
?
3 VA
?
VA
3
Configuration
Program Configuration
except Read Only
PF ?1
PF
?
2
?
3
PF
PF Tot
?
Disp. PF
Disp. PF
Disp. PF
Disp. PF
TotDist. PF
Dist. PF
Dist. PF
Dist. PF Tot
Dmnd W
Dmnd VA
Dmnd Var
Dmnd I
V1 IEEE
%THD
V1 IEC %THD
V1 TIF
V1 Crest
V1 K-factor
I1 IEEE %THD
I1 IEC %THD
I1 TIF
I1 Crest
I1 K-factor
V2 IEEE
%THD
V2 IEC %THD
V2 TIF
V2 Crest
V2 K-factor
1
?
2
?
3
?
1
?
2
?
3
①
①
①
①
①
①
①
①
①
Display
Same as
I2 IEEE %THD
I2 IEC %THD
①
I2 TIF
I2 Crest
①
I2 K-factor
V3 IEEE
%THD
V3 IEC %THD
V3 TIF
①
V3 Crest
V3 K-factor
I3 IEEE %THD
I3 IEC %THD
①
I3 TIF
I3 Crest
①
I3 K-factor
I4 IEEE %THD
I4 IEC %THD
①
I4 TIF
I4 Crest
①
I4 K-factor
①
①
①
①
①
Display
Setpoints
Setpoint
01. .20
Type
Evaluation
High Limit
Low Limit
Pickup Delay
Dropout Delay
Action Type
Display
Status
Bulletin No.
Firmware Revision No.
Options Field
Device ID
Overall Status
ROM Status
RAM Status
EEPROM Status
NVRAM Status
Power Supply
Data Acquisition
Watchdog Timer
Clock Status
Battery Usage
Comm Card
No. of DMs/DM Status
Date/Time
Relay States
S1 Status/Counter
S2 Status/Counter
S3 Status/Counter
S4 Status/Counter
Output Word
P
1403-IN001A-US-P
Page 42

4-6 General Operation
Configuration Items
parameters are configured by the Display Module,
the Smart Communication Card, or both.
General
Table 4.1 displays the General Configuration items
for Powermonitor II. The gray scale indicates which
Table 4.1 General Configuration
Parameter Description Range Default User
New Password Used to change the password needed for modifying
parameter values. A (-1) when using the Smart
Communication Card indicates no change to the
password.
Voltage Mode Determines the system wiring configuration. When in
Demo mode, internal values are displayed for training
purposes.
See Chapter 2 for Wiring Diagrams.
Filter Mode
(1)
PT Primary The first value for the PT ratio (xxx: xxx) indicating the
PT Secondary The second value for the PT ratio (xxx: xxx) indicating the
CT Primary The first value for the PT ratio (xxx: xxx) indicating the
CT Secondary The second value for the PT ratio (xxx: xxx) indicating the
Vaux Primary The first value for the Vaux ratio (xxx: xxx) indicating the
Vaux Secondary The second value for the Vaux ratio (xxx: xxx) indicating
I4 Primary The first value for the PT ratio (xxx: xxx) indicating the
I4 Secondary The second value for the PT ratio (xxx: xxx) indicating the
Vaux Volt Mode Determines whether an AC or DC signal is measured by
Snapshot Period Hours The hourly interval in which the snapshot log is updated. 0 to 32766 0
Snapshot Period Minutes The minutely interval in which the snapshot log is updated. 0 to 99 0
Snapshot Period Seconds The secondly interval in which the snapshot log is
Used for setting up the update rate. Set at 1 for fast update
rates (28 msec nominal), and set at 3 for slower update
rates (90 msec nominal) with high accuracy when
harmonics are present.
voltage at the high end of the transformer.
voltage at the low end of the transformer. For systems with
greater than 120 volts applied to the v oltage inputs , the PT
secondary must be configured to greater than 137 volts to
switch to high v oltage mode. Example: A 600 V
direct-connect system would be configured with a PT ratio
of 347:347.
current at the high end of the transformer.
current at the low end of the transformer.
voltage at the high end of the transformer.
the voltage at the low end of the transformer.
current at the high end of the transformer.
current at the low end of the transformer.
Vaux.
updated.
Display Module and Smart Communication Card
Display Module Only
Smart Communication Card Only
-1 to 9999 0000
0 = Demo
4 = Wye
1 = Single Phase
2 = Open Delta
3 = Delta
4 = Wye
1 to 3 2
1 to 10,000,000 120
1 to 999 120
(347 V
L-L
L-N
)
1 to 10,000,000 5
1 to 999 5
1 to 10,000,000 1
1 to 999 1
1 to 10,000,000 5
1 to 999 5
0 = AC
0 = AC
1 = DC
0 to 99 0
Setting
1403-IN001A-US-P
Page 43

General Operation 4-7
Table 4.1 General Configuration
Parameter Description Range Default User
Setting
Snapshot Buffer Type The buffer type used by the snapshot log. Fill and Stop
stops filling the buffer when it is full or until the buffer is
0 = Fill and Stop
1 = Circular
1 = Circular
reset. Circular continuously fills the buffer and overwrites
old data when the buffer is full.
Log Status Inputs Enab les logging to the event log any activity of the 4 status
inputs.
Log Min/Max Values Enables logging to the Min/Max log the minimum and
maximum of specific parameters. By enabling this
0 = No
1 = Yes
0 = No
1 = Yes
0 = No
1 = Yes
function, real time metering update rates increase by 10
msec.
Date Format The format of the date that is displayed on the Display
Module.
MM/DD/YYYY
DD/MM/YYYY
MM/DD/
YYYY
Date: Year The year of the present date. 1998 to 2097 Present
Year
Date: Month The month of the present date. 1 to 12 Present
Month
Date: Day The day of the present date. 0 to 31 Present Day
Time: Hour The hour of the present time. 0 to 23 Pr esent
Hour
Time: Minute The minute of the present time. 0 to 59 Present
Minute
Time: Second The second of the present time. 0 to 59 Present
Second
Time: Hundredth Second The hundredth second of the present time. 0 to 99 Present
Hundredth
Second
Max Isc
1
The maximum short circuit current which is a parameter
0 to 10,000,000 0
necessary for calculating compliance with IEEE-519.
Max Demand Load
1
Current
The maximum demand load current which is a parameter
necessary for calculating compliance with IEEE-519.
0 to 10,000,000 0
Phase Label: 1 Defines what symbol is used to designate input phase 1. ‘(space)‘to ‘z’ ‘A’
Phase Label: 2 Defines what symbol is used to designate input phase 2. ‘(space)‘to ‘z’ ‘B’
Phase Label: 3 Defines what symbol is used to designate input phase 3. ‘(space)‘to ‘z’ ‘C’
Vaux Label: 1 Defines what symbol is used for the first of eight
‘(space)‘to ‘z’ ‘A’
characters describing Vaux.
Vaux Label: 2 Defines what symbol is used for the second of eight
‘(space)‘to ‘z’ ‘U’
characters describing Vaux.
Vaux Label: 3 Defines what symbol is used for the third of eight
‘(space)‘to ‘z’ ‘X’
characters describing Vaux.
Vaux Label: 4 Defines what symbol is used for the fourth of eight
‘(space)‘to ‘z’ ‘(space) ‘
characters describing Vaux.
Vaux Label: 5 Defines what symbol is used for the fifth of eight
‘(space)‘to ‘z’ ‘(space) ‘
characters describing Vaux.
Vaux Label: 6 Defines what symbol is used for the sixth of eight
‘(space)‘to ‘z’ ‘(space) ‘
characters describing Vaux.
Vaux Label: 7 Defines what symbol is used for the seventh of eight
‘(space)‘to ‘z’ ‘V’
characters describing Vaux.
Vaux Label: 8 Defines what symbol is used for the eighth of eight
‘(space)‘to ‘z’ ‘(space) ‘
characters describing Vaux.
1403-IN001A-US-P
Page 44

4-8 General Operation
Table 4.1 General Configuration
Parameter Description Range Default User
Setting
Channel A
12-Cycle Oscillograph
Used to select which of the seven input channels is
¨
captured for channel A when an oscillograph is triggered.
1 = Phase 1
Voltage
1 = Phase 1
Voltage
2 = Phase 1
Current
3 = Phase 2
Voltage
4 = Phase 2
Current
5 = Phase 3
Voltage
6 = Phase 3
Current
7 = Phase 4
Current
Channel B
12-Cycle Oscillograph
Used to select which of the seven input channels is
¨
captured for channel B when an oscillograph is triggered.
1 = Phase 1
Voltage
2 = Phase 1
Current
2 = Phase 1
Current
3 = Phase 2
Voltage
4 = Phase 2
Current
5 = Phase 3
Voltage
6 = Phase 3
Current
7 = Phase 4
Current
Oscillography Type
¨
Determines whether the existing oscillograph is
overwritten or remains buffered until commanded when a
0 = Hold
1 = Overwrite
1 =
Overwrite
new oscillograph is triggered.
Number of Oscillograph
Pretrigger Cycles
¨
Indicates the number of cycles buffered prior to the trigger
of a 12-cycle oscillograph. This function can be disabled
-1 to 8 1
by setting this value to -1 to improve the speed of the real
time metering update rates.
(1) Available on 1403-MM only.
1403-IN001A-US-P
Page 45

General Operation 4-9
Demand
Display Module and Smart Communication Card
Table 4.2 displays the Demand Configuration items
for Powermonitor II. The gray scale indicates which
parameters are configured by the Display Module,
the Smart Communication Card, or both.
Table 4.2 Demand Configuration
Parameter Description Range Default User
Demand Period Length Specifies the desired period for demand measurement.
1 to 99 The internal clock is used to measure the period
(in minutes) for both the actual and projected demand
values.
0 An external pulse connected to Status Input #4 is
required to define the period for the actual demand
values while disabling the projected demand values.
-1 to -99 An external pulse connected to Status Input #4
is required to define the period for the actual demand
values while using the internal clock for the projected
demand values.
Number of Demand
Periods
Pulse Output Determines which relay to be used as a pulsed output
Pulse Parameter Specifies which parameter is used for the pulse output
Pulse Increment Defines how many increments of the specified metering
Pulse Width Defines the duration of the pulse in milliseconds. 40 to 2000 100
Specifies the number of demand periods to average for
demand measurement.
based on a user specified metering parameter.
relay.
parameter must occur before the relay is pulsed.
Defines “kyz style” transitional pulse 0
Display Module Only
Smart Communication Card Only
-99 to 99 1
1 to 15 1
0 = None
1 = Relay 1
2 = Relay 2
0 = kWh Forward
1 = kWh Reverse
2 = kVarh Forward
3 = kVarh Reverse
1 to 32766 1
Setting
0 = None
0 = kWh
Forward
1403-IN001A-US-P
Page 46

4-10 General Operation
Commands
Display Module and Smart Communication Card
Table 4.3 displays the commands for the
Powermonitor II. The gray scale indicates which
commands are available thro ugh the Display Module,
the Smart Communication Card, or both.
Table 4.3 Commands
Parameter Description Range
Force Relay #1 and #2 Forces Relay #1 and #2 to a known state in which the relay
remains at that state until the force is removed.
Clear Min/Max Log Resets the Min/Max log with the current real time metering
information.
Clear Snapshot Log Clears all entries in the Snapshot log buffer. No
Clear kWH Counter Resets the kWH counter to zero. No
Clear kVarH Counter Resets the kVarH counter to zero. No
Set kWH Counter Sets the kWH counter to the user specified value. (0 to clear)
Set kVarH Counter Sets the kVarH counter to the user specified value. (0 to clear)
Clear Status Input #1 to #4
Counter
Clear Battery Usage
Counter
Restore Factory Defaults Restores all of the Powermonitor II configuration parameters with
Clear Hold of Oscillograph
(1)
Data
Trigger an Oscillograph
Set Harmonic Analysis
Channel Request
1
Set Oscillography Channel
Request
1
Select Setpoint Number Specifies the particular setpoint information to be returned through
(1) Available on 1403-MM only.
Resets Status Input #1 to #4 Counter to zero. No
Resets the Battery Usage Counter to zero. No
the factory default values.
Allows the user to enable oscillography when the oscillography
type is set to Hold.
1
Allows the user to manually trigger a simultaneous 7 Channel 2Cycle and 2 Channel 12-Cycle oscillograph.
Specifies the particular input channel for harmonic analysis
information to be returned through the Smart Communication
Card.
Specifies the particular input channel for an oscillogram to be
returned through the Smart Communication Card.
the Smart Communication Card.
Display Module Only
Smart Communication Card Only
1 = Energize
2 = De-energize
4 = No Force (Automatic)
No
Yes
Yes
Yes
Yes
-999.9x10⁹ to 999.9x10
-999.9x10⁹ to 999.9x10
Yes
Yes
No
Yes
No
Yes
No
Yes
1 = Phase 1 Voltage
2 = Phase 1 Current
3 = Phase 2 Voltage
4 = Phase 2 Current
5 = Phase 3 Voltage
6 = Phase 3 Current
7 = Phase 4 Current
1 = 2 Cycle Phase 1 Voltage
2 = 2 Cycle Phase 1 Current
3 = 2 Cycle Phase 2 Voltage
4 = 2 Cycle Phase 2 Current
5 = 2 Cycle Phase 3 Voltage
6 = 2 Cycle Phase 3 Current
7 = 2 Cycle Phase 4 Current
8 = 12 Cycle Channel A
9 = 12 Cycle Channel B
1 to 20
9
9
1403-IN001A-US-P
Page 47

General Operation 4-11
Metering
through the Display Module, the Smart
Communication Card, or both.
Voltage/Current
Display Module and Smart Communication Card
Table 4.4 displays the Voltage and Current Metering
information provided by the Powermonitor II. The
gray scale indicates which parameters are available
Table 4.4 Voltage and Current Metering
Parameter Description Range Units
Phase 1 L-N Voltage RMS line to neutral voltage of phase 1.
Phase 2 L-N Voltage RMS line to neutral voltage of phase 2.
Phase 3 L-N Voltage RMS line to neutral voltage of phase 3.
3-Phase Average L-N Voltage Average RMS line to neutral voltage of phase 1, 2, and 3.
Phase 1 L-L Voltage RMS line to line voltage between phase 1 and 2.
Phase 2 L-L Voltage RMS line to line voltage between phase 2 and 3.
Phase 3 L-L Voltage RMS line to line voltage between phase 3 and 1.
3-Phase L-L Voltage Av er age RMS line to line v oltage between phase 1, 2, and
3.
Auxiliary Voltage
(1)
Phase 1 Current RMS current of phase 1.
Phase 2 Current RMS current of phase 2.
Phase 3 Current RMS current of phase 3.
3-Phase Average Current Average RMS current of phase 1, 2, and 3.
Phase 4 (Neutral) Current RMS current of phase 4, also known as neutral current.
Frequency The frequency of the voltage. 0 to 132 Hertz
Phase Rotation The phase rotation of a 3-phase system None
Voltage Positive Sequence Magnitude of positive sequence voltage in a 3-phase
Voltage Negative Sequence Magnitude of negative sequence voltage in a 3-phase
Current Positive Sequence Magnitude of positive sequence current in a 3-phase
Current Negative Sequence Magnitude of negative sequence current in a 3-phase
Voltage Unbalance The ratio between the negative and positive voltage
Current Unbalance The ratio between the negative and positive current
(1) The frequency of an AC auxillary voltage is returned with the self-test/diagnostic information as described on page 4-31.
AC or DC auxiliary voltage input RMS voltage.
system.
system.
system.
system.
sequence in a 3-phase system.
sequence in a 3-phase system.
Display Module Only
Smart Communication Card Only
0 to 999.9x10
0 to 999.9x10
0 to 999.9x10
0 to 999.9x10
0 to 999.9x10
0 to 999.9x10
0 to 999.9x10
0 to 999.9x10
0 to 999.9x10
0 to 999.9x10
0 to 999.9x10
0 to 999.9x10
0 to 999.9x10
0 to 999.9x10
ABC
ACB
0 to 999.9x10
0 to 999.9x10
0 to 999.9x10
0 to 999.9x10
0 to 100 Percent
0 to 100 Percent
22
22
22
22
22
22
22
22
22
22
22
22
22
22
22
22
22
22
Volts
Volts
Volts
Volts
Volts
Volts
Volts
Volts
Volts
Amps
Amps
Amps
Amps
Amps
N/A
Volts
Volts
Amps
Amps
1403-IN001A-US-P
Page 48

4-12 General Operation
Power
Table 4.5 displays the Power Metering information
provided by the Powermonitor II. The gray scale
indicates which parameters are available through the
Display Module, the Smart Communication Card, or
both.
The power quantities (kW, kWH, kVAR, kVARH,
and power factor) measured by the Powermonitor II
are four-quad rant measureme nts. This allows th e user
to individually determine the magnitude and
direction of b oth th e rea l power f low and the rea ctive
power flow. Figure 4.3 indicates the relationship
between these quantities and the numeric signs used
by the Powermonitor II to convey the information.
Display Module and Smart Communication Card
Display Module Only
Smart Communication Card Only
Table 4.5 Power Metering
Figure 4.3 Power Metering
+kVAR (Import)
kVARHR-F (Forward)
(Power Factor
Leading)
(+)
Pf = 100%
-kW(Export)
kWH-R
(Reverse)
(Power Factor
180°
Lagging)
(-)
II
III
-kVAR (Export)
kVARHR-R(Reverse)
Pf = 1
90°
IV
270°
Pf = 0
I
(Power Factor
Lagging)
(-)
Pf = 100%
+kW (Import)
0°
kWH-F
(Forward)
(P ower Factor
Leading)
(+)
Parameter Description Range Units
22
22
22
22
22
22
22
22
Watts
Watts
Watts
Watts
Vars
Vars
Vars
Vars
Phase 1 Power Power of phase 1 signed to show direction.
Phase 2 Power Power of phase 2 signed to show direction.
Phase 3 Power Power of phase 3 signed to show direction.
3-Phase Total Power Total power of phase 1, 2, and 3 signed to show direction.
Phase 1 Reactive Power Reactive power of phase 1 signed to show direction.
Phase 2 Reactive Power Reactive power of phase 2 signed to show direction.
Phase 3 Reactive Power Reactive power of phase 3 signed to show direction.
3-Phase Total Reactive Power Total reactive power of phase 1, 2, and 3 signed to show
0 to 999.9x10
0 to 999.9x10
0 to 999.9x10
0 to 999.9x10
0 to 999.9x10
0 to 999.9x10
0 to 999.9x10
0 to 999.9x10
direction.
22
22
22
22
VA
VA
VA
VA
Phase 1 Apparent Power Apparent power of phase 1.
Phase 2 Apparent Power Apparent power of phase 2.
Phase 3 Apparent Power Apparent power of phase 3.
3-Phase Total Apparent Power Total apparent power of phase 1, 2, and 3.
Phase 1 True Power Factor The ratio between the power and apparent power for phase
0 to 999.9x10
0 to 999.9x10
0 to 999.9x10
0 to 999.9x10
-100 to 100 Percent
1; this value is signed to show lead (+) or lag (-).
Phase 2 True Power Factor The ratio between the power and apparent power for phase
-100 to 100 Percent
2; this value is signed to show lead (+) or lag (-).
Phase 3 True Power Factor The ratio between the power and apparent power for phase
-100 to 100 Percent
3; this value is signed to show lead (+) or lag (-).
Total True Power Factor The ratio between the power and apparent power for phase
-100 to 100 Percent
1, 2, and 3; this value is signed to show lead (+) or lag (-).
Phase 1 Distortion Power Factor The ratio between the magnitude of the fundamental and the
0 to 100 Percent
sum of the magnitudes for all of the current harmonics for
phase 1.
(1)
1403-IN001A-US-P
Page 49

General Operation 4-13
Table 4.5 Power Metering
Parameter Description Range Units
Phase 2 Distortion Power Factor The ratio between the magnitude of the fundamental and the
0 to 100 Percent
sum of the magnitudes for all of the current harmonics for
phase 2.
Phase 3 Distortion Power Factor The ratio between the magnitude of the fundamental and the
(2)
0 to 100 Percent
sum of the magnitudes for all of the current harmonics for
phase 3.
Total Distortion Power Factor The ratio between the magnitude of the fundamental and the
1
0 to 100 Percent
sum of the magnitudes for all of the current harmonics for
phase 1, 2, and 3.
Phase 1 Displacement Power Factor The cosine of the difference betw een the phase angle of the
1
-100 to 100 Percent
fundamental voltage and current for phase 1; this value is
signed to show lead (+) or lag (-).
Phase 2 Displacement Power Factor The cosine of the difference betw een the phase angle of the
1
-100 to 100 Percent
fundamental voltage and current for phase 2; this value is
signed to show lead (+) or lag (-).
Phase 3 Displacement Power Factor The cosine of the difference betw een the phase angle of the
1
-100 to 100 Percent
fundamental voltage and current for phase 3; this value is
signed to show lead (+) or lag (-).
Total Displacement Power F actor The cosine of the difference between the phase angle of the
1
-100 to 100 Percent
fundamental voltage and current for phase 1, 2, and 3; this
value is signed to show lead (+) or lag (-).
(1) This value has the same update rate as the harmonic analysis.
(2) This value has the same update rate as the harmonic analysis.
1
1403-IN001A-US-P
Page 50

4-14 General Operation
Cumulative Power
Display Module and Smart Communication Card
Table 4.6 displays the Cumulative Power Metering
information provided by the Powermonitor II. The
gray scale indicates which parameters are available
through the Display Module, the Smart
Communication Card, or both.
Table 4.6 Cumulative Power
Parameter Description Range Units
Kilo-Watt Hours Forward The total forward (+) power consumed.
Kilo-Watt Hours Reverse The total reverse (-) power consumed.
Kilo-Watt Hours Net The total forward and reverse power consumed.
Kilo-Var Hours Forward The total forward (+) reactive power consumed.
Kilo-Var Hours Reverse The total reverse (-) reactive power consumed.
Kilo-Var Hours Net The total forward and reverse reactive power consumed.
Current Demand The calculated demand for average current.
Watt Demand The calculated demand for total power.
Var Demand The calculated demand for total reactive power.
VA Demand The calculated demand for total apparent power.
Projected Current Demand #1 The instantaneous demand for average current.
Projected Watt Demand #1 The instantaneous demand for total power.
Projected Var Demand #1 The instantaneous demand for total reactive power.
Projected VA Demand #1 The instantaneous demand for total apparent power.
Projected Current Demand #2 The first order projected demand for average current.
Projected Watt Demand #2 The first order projected demand for total power.
Projected Var Demand #2 The first order projected demand for total reactive power.
Projected VA Demand #2 The first order projected demand for total apparent power.
Projected Current Demand #3 The second order projected demand for average current.
Projected Watt Demand #3 The second order projected demand for total power.
Projected Var Demand #3 The second order projected demand for total reactive
power.
Projected VA Demand #3 The second order projected demand for apparent power.
Demand Elapsed Time The elapsed time into the demand period.
Display Module Only
Smart Communication Card Only
0 to 1.0x10
0 to 1.0x10
0 to 1.0x10
0 to 1.0x10
0 to 1.0x10
0 to 1.0x10
0 to 999.9x10
0 to 999.9x10
0 to 999.9x10
0 to 999.9x10
0 to 999.9x10
0 to 999.9x10
0 to 999.9x10
0 to 999.9x10
0 to 999.9x10
0 to 999.9x10
0 to 999.9x10
0 to 999.9x10
0 to 999.9x10
0 to 999.9x10
0 to 999.9x10
0 to 999.9x10
0 to 999.9x10
12
12
12
12
12
12
22
22
22
22
22
22
22
22
22
22
22
22
22
22
22
22
22
kWh
kWh
kWh
kVarh
kVarh
kVarh
Amps
Watts
Vars
VA
Amps
Watts
Vars
VA
Amps
Watts
Vars
VA
Amps
Watts
Vars
VA
Minutes
1403-IN001A-US-P
Page 51

General Operation 4-15
Harmonic Analysis
Display Module and Smart Communication Card
Table 4.7 displays the Harmonic Analysis
information provided by the Powermonitor II. The
gray scale indicates which parameters are available
through the Display Module, the Smart
Communication Card, or both.
Table 4.7 Harmonic Analysis (V1, V2, V3, V4, I1, I2, I3, I4)
Parameter Description Range Units
(1)
K-factor
Crest Factor
1
TIF
1
IEEE-519 Compliance
IEEE Total Harmonic
Distortion
IEC Total Harmonic
Distortion
Harmonic Distortion
Harmonic Magnitude
1
1
Harmonic Phase Angle
(1) Available on 1403-MM only.
Transfor mer heat ratio.
Ratio of the peak amplitude to the RMS value; also
known as amplitude factor or peak factor.
Telephone influence factor.
1
Pass/fail indication of harmonic content per the IEEE519 specification.
Magnitude of measured harmonics with respect to
the fundamental.
Magnitude of all measured harmonics excluding the
fundamental with respect to all measured harmonics
including the fundamental.
Magnitude of each individual harmonic with respect
to the fundamental up to the 41st harmonic.
Magnitude of each harmonic up to the 41st.
1
Phase angle of each harmonic up to the 41st. 0 - 360 Degrees
Display Module Only
Smart Communication Card Only
0 to 999.9x10
0 to 999.9x10
0 to 999.9x10
OK
Fail
0 - 1000 Percent
0 - 1000 Percent
0 - 1000 Percent
0 to 999.9x10
22
22
22
22
N/A
N/A
N/A
N/A
Volts or Amps
1403-IN001A-US-P
Page 52

4-16 General Operation
Setpoints
Theory of Setpoint Operation
The Powermonitor II is capable of monitoring many
parameters (simultaneously), generating alarms,
controlling relays, and triggering other internal
actions. Setpoints are used to perform this function.
The Powermonitor II supports 20 simultaneous
setpoints. A setpoint consists of eight parameters:
setpoint number, type, evaluation condition, high
limit, low limit, action delay, release delay, and
action type. These parameters are described in Table
4.8.
Setpoints evaluate data based on six different
conditions: over forward, over reverse, under
forward, under reverse, equal, and not equal.
Parameter Value
Over Forward Setpoint
An over forward setpoint becomes active when the
magnitude of the parameter being monitored goes
over the “Setpoint High Limit” in the positive
direction (and stays over the limit) for a period of
time greater than the “Setpoint Action Delay”
parameter. When a se tp oint b ecome s act ive, i t cau ses
an action identified by “Setpoint Action Type” to
occur and log this occurrence in the Event log as a
time-stamped event. If this action is to energize a
relay, or set an alarm bit, that action remains true
until the setpoint becomes inactive. An over forward
setpoint become s ina ctive when t he magnitu de o f the
parameter being monitored falls below the “Setpoint
Low Limit” (and stays below the limit) for a period
of time greater than the “Setpoint Release Delay.”
The change from active to inactive is also logged in
the Event log as a time-stamped event.
Figure 4.4 Over Forward
Setpoint
High Limit
Setpoint
Low Limit
≥
Setpoint Action Delay
Setpoint Activated
<Setpoint
Release Delay
≥
Setpoint
Release Delay
Time (s)
1403-IN001A-US-P
Page 53

General Operation 4-17
Over Reverse Setpoint
An over reverse setpoint is the same as an over
forward setpoint, except the magnitude of the
parameter being monitored must go over the
“Setpoint High Limit” in the negative direction.
When the magnitude of the parameter being
monitored goes over the “Set point Hi gh Limit” in the
negative direction (and stays over the limit) for a
Setpoint Activated
Parameter
Value
Setpoint
Low Limit
≥
Setpoint Action Delay
Setpoint
High Limit
period of time greater than the “Setpoint Action
Delay , ” the setpoin t becomes acti ve. An over re verse
setpoint become s ina ctive when t he magnitu de o f the
parameter being monitored falls below the “Setpoint
Low Limit” in the negative direction (and stays
below the limit) for a period of time greater than the
“Setpoint Release Delay.”
Figure 4.5 Over Reverse
Setpoint Deactivated
Time (s)
≥
<
Setpoint
Release Delay
Setpoint
Release Delay
<
Setpoint Action Delay
1403-IN001A-US-P
Page 54

4-18 General Operation
Under Forward Setpoint
An under forward setpoint is the same as an over
forward setpoint, except the “Setpoint High Limit”
and the “Setpoint Low Limit” are reversed.
When the magnitude of the parameter being
monitored falls below the “Setpoint Low Limit” in
the positive dir ection (and st ays below the l imit) for a
period of time greater than the “Setpoint Action
Parameter
Value
Setpoint
High Limit
≥
Setpoint Action Delay
Setpoint
Low Limit
Delay,” the setpoint becomes active. An under
forward setpoint becomes inactive when the
magnitude of the paramet er being moni tored exc eeds
the “Setpoint High Limit” (and stays over the li mit )
for a period of time greater than the “Setpoint
Release Delay.”
Figure 4.6 Under Forward
≥
Setpoint
Release Delay
<
Setpoint
Release Delay
Setpoint Activated
Time (s)
Setpoint Deactivated
1403-IN001A-US-P
Page 55

General Operation 4-19
Under Reverse Setpoint
An under reverse setpoint is the same as an under
forward setpoint, except the magnitude of the
parameter being monitored must fall below the
“Setpoint Low Limit” in the negative direction.
When the magnitude of the parameter being
monitored falls below the “Setpoint Low Limit” in
the negative direction (and stays below the limit) for
Setpoint Activated
Parameter
Value
Setpoint
High Lim it
≥
Setpoint Action Delay
Setpoint
Low Limit
a period of time greater than the “Setpoint Action
Delay,” the setpoint becomes active. An under
forward setpoint becomes inactive when the
magnitude of the paramet er being moni tored exc eeds
the “Setpoint High Limit” in the negative dir ec ti on
(and stays over the limit) for a period of time greater
than the “Setpoint Release Delay.”
Figure 4.7 Under Reverse
Setpoint Deactivated
Time (s)
Equal Setpoint
An equal setpoint becomes active when the
parameter being monitor ed equals the “Setp oint High
Limit” for a period of time greater than the “Setpoint
Action Delay.” An equal setpoint becomes inactive
when the parameter being monitored does not equal
the “Setpoint High Limit ” for a period of time greater
than the “Setpoint Release Delay.” The “Setpoint
Low Limit” is not used for equal setpoints.
The equal setpoint is most useful for non-numeric
values, such as phase rotation, IEEE-519 status, and
status input states.
<
Setpoint
Release Delay
≥
Setpoint
Release Delay
Not Equal Setpoint
A not equal setpoint becomes active when the
parameter being monitored does not equal the
“Setpoint High Limit” for a period of time greater
than the “Setpoint Action Delay.” An not equal
setpoint becomes inactive when the parameter being
monitored equals the “Setpoint High Limit” for a
period of time greater than the “Setpoint Release
Delay .” The “Se tpoint Low Limit ” is not used for not
equal setpoints.
The not equal s etpoint is most useful for non-n umeric
values, such as phase rotation, IEEE-519 status, and
status input states.
1403-IN001A-US-P
Page 56

4-20 General Operation
Table 4.8 Setpoint Configuration
Parameter Name Parameter Description Range Default
Setpoint Number The number of the setpoint being
1 - 20 N/A
configured.
Setpoint Type The parameter value to be evaluated by the
0 - 54 (see details in Table 4.I) 0
setpoint.
Setpoint Evaluation Condition The operator used to evaluate the parameter
value.
0 = Over forward (+)
1 = Over reverse (-)
0
2 = Under forward (+)
3 = Under reverse (-)
4 = Equal (=)
5 = Not equal (<>)
Setpoint High Limit The value being used as a reference to
0 - 1,000,000 0
activate the setpoint for over comparisons,
or to deactivate the setpoint for under
comparisons.
Note: This parameter is non-numeric when
viewed via the Display Module, and the
Setpoint Type is Phase Rotation, Status
input, or IEEE 519 status.
Setpoint Low Limit The value being used as a reference to
0 - 1,000,000 0
deactivate the setpoint for over
comparisons, or to activate the setpoint for
under comparisons.
Note: This parameter is non-numeric when
viewed via the Display Module, and the
Setpoint Type is Phase Rotation, Status
input, or IEEE 519 status.
Setpoint Action Delay The minimum time in seconds that the
0 - 9999 0
setpoint limit must be exceeded
continuously before the setpoint will trigger.
Note: There could be some additional
delay due to the selected update rate of
metering or harmonic data.
Setpoint Release Delay The minimum time in seconds that the
0 - 9999 0
setpoint limit must not be exceeded
continuously before the setpoint will release.
Note: There could be some additional
delay due to the selected update rate of
metering or harmonic data.
Setpoint Action Type The action that will occur when the setpoint
0 - 20 (see details in Table 4.J) 0
is triggered.
1403-IN001A-US-P
Page 57

Table 4.9 Setpoint Type
Setpoint
Description
Type
0 Not used (inactive)
1 Voltage (any 1 of three phases, L-N in Single
Phase/Wye Modes, L-L in Delta/Open-Delta
Modes)
2 Current (any 1 of three phases)
3 Voltage unbalance
4 Current unbalance
5 Vaux voltage
6 Neutral (I4) current
7 Total kW
8 Total kVAR
9 Total kVA
10 Total true power factor
11 Total displacement power factor
12 Total distortion power factor
13 KW demand
14 KVAR demand
15 KVA demand
16 Current demand
17 Type 1 predictive demand A
18 Type 1 predictive demand W
19 Type 1 predictive demand VAR
20 Type 1 predictive demand VA
21 Type 2 predictive demand A
22 Type 2 predictive demand W
23 Type 2 predictive demand VAR
24 Type 2 predictive demand VA
25 Type 3 predictive demand A
26 Type 3 predictive demand W
27 Type 3 predictive demand VAR
28 Type 3 predictive demand VA
29 Frequency
30 Phase rotation
31
32
33
34
35
36
37
38
39
(1)
(1)
(1)
(1)
(1)
(1)
(1)
(1)
(1)
K-factor: voltage (any 1 of three phases)
K-factor: current (any 1 of three phases)
K-factor: neutral current
Crest factor: voltage (any 1 of three phases)
Crest factor: current (any 1 of three phases)
Crest factor: neutral current
TIF: voltage (any 1 of three phases)
TIF: current (any 1 of three phases)
TIF: neutral current
General Operation 4-21
Table 4.9 Setpoint Type
Setpoint
Description
Type
40 IEEE THD: voltage (any 1 of three phases)
41 IEEE THD: current (any 1 of three phases)
42 IEEE THD: neutral current
43 IEC THD: voltage (any 1 of three phases)
44 IEC THD: current (any 1 of three phases)
45 IEC THD: neutral current
46
47
48
(1)
(1)
(1)
IEEE519: voltage (any 1 of three phases)
IEEE519: current (any 1 of three phases)
IEEE519: neutral current
49 Status input #1
50 Status input #2
51 Status input #3
52 Status input #4
53 Any status input
54 Battery usage timer
(1) Available on 1403-MM only.
Table 4.10 Setpoint Action Type
Setpoint Action
Description
Type
0 No action
1 Energize relay1 and set alarm flag1
2 Energize relay2 and set alarm flag2
3 Set alarm flag3
4 Set alarm flag4
5 Set alarm flag5
6 Set alarm flag6
7 Set alarm flag7
8 Set alarm flag8
9 Set alarm flag9
10 Set alarm flag10
11 Set alarm flag11
12 Set alarm flag12
13 Set alarm flag13
14 Set alarm flag14
15 Set alarm flag15
16 Set alarm flag16
17
1
Initiate oscillograph
18 Perform snapshot
19 Clear kWh power counter
20 Clear kVARh power counter
1403-IN001A-US-P
Page 58

4-22 General Operation
Examples of Setpoint Operation
Setpoint Example 1 - Over kW Forward (+)
If it is desired that setpoint 1 energizes relay 1 when
kW exceeds +100kW for more than one second, and
de-energizes relay 1 when kW falls b elow +90kW for
more than two seconds, the foll owing sett ings should
be used.
Setpoint type kW
Setpoint direction Over Forward (+)
Setpoint high limit 100
Setpoint low limit 90
Setpoint action delay 1 second
Setpoint release delay 2 s e conds
Setpoint action type Energize relay 1
Setpoint Example 2 - Under kW Forward (+)
If it is desired that setpoint 1 energizes relay 1 when
kW is below +100kW for more t ha n one second, and
de-energizes relay 1 when kW exceeds +150kW for
more than two seconds, the foll owing sett ings should
be used.
Setpoint type kW
Setpoint direction Under Forward (+)
Setpoint high limit 150
Setpoint low limit 100
Setpoint action delay 1 second
Setpoint release delay 2 s e conds
Setpoint action type Energize relay 1
Setpoint Example 3 - Over kW Reverse (-)
If it is desired that setpoint 1 energizes relay 1 when
kW exceeds -100kW for more than one second, and
de-energiz es rel ay 1 when kW fa lls b elo w -90kW for
more than two seconds, the foll owing sett ings should
be used.
Setpoint Example 4 - Under kW Reverse (-)
If it is desired that setpo int 1 energizes relay 1 whe n
kW is below -100kW for more than one second, and
de-energizes relay 1 when kW exceeds -150kW for
more than two seconds, t he followin g settings should
be used.
Setpoint type kW
Setpoint direction Under Reverse (-)
Setpoint high limit 150
Setpoint low limit 100
Setpoint action delay 1 second
Setpoint release delay 2 seconds
Setpoint action type Energize relay 1
Relay Operation
The Powermonitor II has two output relays.
Operation of the se relays is control led by on e of three
mechanisms.
Setpoint contr ol - The r elays can be indepe ndently
•
energized or de-energized based on the Setpoint
Configuration. Refer to Setpoints on page 4-16.
Pulsed output contr ol - One of the relays can be
•
configured to provide a pulsed output based on t he
measured value for kilowatt-hours or kilovarhours. Refer to Demand on page 4-9 for
additiona l informatio n on this functionality.
Forced operation control - The output relay state
•
(energized or de-energized) can be forced via
either the Smart Communication Card or the
Display Module. The forced condition is
maintained until it is eith er removed by the user or
device power is cy cled. Once the forced c onditi on
is removed , the Powermonitor II relays revert to
normal operation.
Setpoint type kW
Setpoint direction Over Reverse (-)
Setpoint high limit 100
Setpoint low limit 90
Setpoint action delay 1 second
Setpoint release delay 2 s e conds
Setpoint action type Energize relay 1
1403-IN001A-US-P
Page 59

General Operation 4-23
Data Logging
The Powermonitor II provides three data logs:
Event log
•
Snapshot log
•
Min/Max log
•
Each record of the three logs is date and timestamped to the neares t one hundredt h of a second . All
of the records are stored in battery powered nonvolatile RAM. The data logs remain in memory as
long as power is applie d to the Master Module or the
battery has a usabl e char ge. In the event t hat power i s
removed from the Master Module and the battery is
removed or discharged, all of the data logs will be
automatically cleared.
Event Log
The Event log consists of the 100 most recent events
that occurred in the Powermonitor II. This log is a
circular buffer. When the bu ffer is full, the newest
event overwrites th e old est even t. A list of the even ts
is shown in Table 4.11.
Table 4.11 Event Codes
Event Type Event Type
Displayed by
Display
Module
No Event No Evnt 0 0
Setpoint
Activated
Setpoint
Deactivated
Relay Forced
Energized
Relay Forced
De-energized
Relay Forced
Released
Status Input
Set
Status Input
Cleared
kWh Counter
Set
Set##A 1 Setpoint Number
Set##D 2 Setpoint Number
Rly# F1 3 Relay Number (1-
Rly# F0 4 Relay Number (1-
Rly# NF 5 Relay Number (1-
S# On 6 Status Input
S# Off 7 Status Input
Wh Set 8 1
Event Type
for Smart
Comm.
Card
Event Command
Code for Smart
Comm. Card
(1-20)
(1-20)
2)
2)
2)
Number (1-4)
Number (1-4)
Table 4.11 Event Codes
Event Type Event Type
Displayed by
Display
Module
Kvarh
Counter Set
Snapshot
Log Cleared
Min/Max Log
Cleared
Factory
Defaults
Restored
Status Input
Counter 1
Cleared
Status Input
Counter 2
Cleared
Status Input
Counter 3
Cleared
Status Input
Counter 4
Cleared
Battery
Usage
Counter
Cleared
Power Up Pwr On 9 0
Power Down Pwr Off 10 0
Self-test
Error
Time Set TimeSet 12 0
Device
Reconfigured
Setpoint
Reconfigured
(1) # indicates a numeric digit.
VarhSet 8 2
SnapClr 8 3
↓ / ↑
Car 8 4
FactCfg 8 5
S1 Clr 8 6
S2 Clr 8 7
S3 Clr 8 8
S4 Clr 8 9
BattClr 8 10
ST ####
New Cfg 13 0
Set Cfg 14 0
(1)
Event Type
for Smart
Comm.
Card
11 Hexadecimal Self-
Event Command
Code for Smart
Comm. Card
test Code (Refer
to Table 4.L)
1403-IN001A-US-P
Page 60

4-24 General Operation
Table 4.12 Self-test Error Codes
Bits Hex Description
bit 0 0001h Master Module ROM Status
bit 1 0002h Master Module RAM Status
bit 2 0004h Master Module EEPROM Status
bit 3 0008h Master Module Non-volatile RAM Status
bit 4 0010h Master Module Power Supply Status
bit 5 0020h Master Module Data acquisition Status
bit 6 0040h Master Module Real Time Clock Status
bit 7 0080h Smart Communication Card Status
bit 8 0100h Display Module Status
bit 9 0200h Master Module Watchdog Timer Status
bits 10-
15
Reserved for factory use
Whenever a setpoint event occurs, the setpoint setup
information is also logged. This information is
viewed via the Di splay Modul e b y pres sing the Ent er
key (↵) when the setpoint event is displayed. This
information can also be retrieved via the Smart
Communication Card.
Snapshot Log
The snapshot log consists of 50 records. Each record
consists of 46 parameters. The list of parameters is
shown in Table 4.13 and Table 4.14. This log can be
updated via a setpoint occurrence or a userconfigured schedule. A user -config ured sched ule can
be an interval ranging from one second to three
years. To disable schedul ed updat es, set t he period to
zero.
The Snapshot log has two modes of operation:
Fill and Stop
•
Circular
•
Fill and Stop fil ls the buf fer an d stops when it is f ull.
The buffer resu mes recording information when the
Snapshot log is cleared.
Circular continuously fills the buffer. When the
buffer is full, old data is overwritten.
The Snapshot log information is retrieved through
the Smart Communication Card. All data is logged
together. However, for communication purposes
only, the log is divided into two blocks.
1403-IN001A-US-P
Page 61

General Operation 4-25
Table 4.13 Snapshot Log Parameters for the Voltage and Current Block
Parameter Description Range Default
22
22
22
22
22
22
22
22
Volts
Volts
Volts
Volts
Volts
Volts
Volts
Volts
Phase 1 L-N Voltage RMS line to neutral voltage of phase 1.
Phase 2 L-N Voltage RMS line to neutral voltage of phase 2.
Phase 3 L-N Voltage RMS line to neutral voltage of phase 3.
3-Phase Average L-N Voltage Average RMS voltage of phase 1, 2, and 3.
Phase 1 L-L Voltage RMS line to line voltage between phase 1 and 2.
Phase 2 L-L Voltage RMS line to line voltage between phase 2 and 3.
Phase 3 L-L Voltage RMS line to line voltage between phase 3 and 1.
3-Phase L-L Voltage Average RMS line to line voltage between phase 1, 2, and
0 to 999.9x10
0 to 999.9x10
0 to 999.9x10
0 to 999.9x10
0 to 999.9x10
0 to 999.9x10
0 to 999.9x10
0 to 999.9x10
3.
22
22
22
22
22
22
Volts
Amps
Amps
Amps
Amps
Amps
Auxiliary Voltage AC or DC auxiliary voltage input RMS voltage.
Phase 1 Current RMS current of phase 1.
Phase 1 Current RMS current of phase 2.
Phase 1 Current RMS current of phase 3.
3-Phase Average Current Average RMS current of phase 1, 2, and 3.
Phase 4 (Neutral) Current RMS current of phase 4, also known as neutral current.
0 to 999.9x10
0 to 999.9x10
0 to 999.9x10
0 to 999.9x10
0 to 999.9x10
0 to 999.9x10
Frequency The frequency of the voltage. 0 to 132 Hertz
Phase Rotation The phase rotation of a 3-phase system 0 = None
N/A
1 = ABC
2 = ACB
22
Voltage Positive Sequence Magnitude of positive sequence voltage in a 3-phase
0 to 999.9x10
Volts
system.
22
Voltage Negative Sequence Magnitude of negative sequence voltage in a 3-phase
0 to 999.9x10
Volts
system.
22
Current Positive Sequence Magnitude of positive sequence current in a 3-phase
0 to 999.9x10
Amps
system.
22
Current Negative Sequence Magnitude of negative sequence current in a 3-phase
0 to 999.9x10
Amps
system.
Voltage Unbalance The ratio between the negative and positive sequence
0 to 100 Percent
voltage in a 3-phase system.
Current Unbalance The ratio between the negative and positive sequence
0 to 100 Percent
current in a 3-phase system.
1403-IN001A-US-P
Page 62

4-26 General Operation
Table 4.14 Snapshot Log Parameters for the Power Block
Parameter Description Range Default
22
22
22
22
22
22
22
22
22
22
22
22
Watts
Watts
Watts
Watts
Vars
Vars
Vars
Vars
VA
VA
VA
VA
Phase 1 Power Power of phase 1 signed to show direction.
Phase 2 Power Power of phase 2 signed to show direction.
Phase 3 Power Power of phase 3 signed to show direction.
3-Phase Total Power Total power of phase 1, 2, and 3 signed to show direction.
Phase 1 Reactive Power Reactive power of phase 1 signed to show direction.
Phase 2 Reactive Power Reactive power of phase 2 signed to show direction.
Phase 3 Reactive Power Reactive power of phase 3 signed to show direction.
3-Phase Total Reactive Power Total reactive power of phases 1 to 3 signed to show direction.
Phase 1 Apparent Power Apparent power of phase 1.
Phase 2 Apparent Power Apparent power of phase 2.
Phase 3 Apparent Power Apparent power of phase 3.
3-Phase Total Apparent Power Total apparent power of phase 1, 2, and 3.
Phase 1 True Po wer F actor The ratio between the power and apparent power for phase 1;
0 to 999.9x10
0 to 999.9x10
0 to 999.9x10
0 to 999.9x10
0 to 999.9x10
0 to 999.9x10
0 to 999.9x10
0 to 999.9x10
0 to 999.9x10
0 to 999.9x10
0 to 999.9x10
0 to 999.9x10
-100 to 100 Percent
this value is signed to show lead (+) or lag (-).
Phase 2 True Po wer F actor The ratio between the power and apparent power for phase 2;
-100 to 100 Percent
this value is signed to show lead (+) or lag (-).
Phase 3 True Po wer F actor The ratio between the power and apparent power for phase 3;
-100 to 100 Percent
this value is signed to show lead (+) or lag (-).
Total T rue P ow er F actor The ratio between the power and apparent power for phase 1,
-100 to 100 Percent
2, and 3; this value is signed to show lead (+) or lag (-).
Phase 1 Distortion Power Factor The ratio between the magnitude of the fundamental and the
0 to 100 Percent
sum of the magnitudes for all of the current harmonics for
phase 1.
Phase 2 Distortion Power Factor The ratio between the magnitude of the fundamental and the
(1)
0 to 100 Percent
sum of the magnitudes for all of the current harmonics for
phase 2.
Phase 3 Distortion Power Factor The ratio between the magnitude of the fundamental and the
1
0 to 100 Percent
sum of the magnitudes for all of the current harmonics for
phase 3.
Total Distortion Power Factor The ratio between the magnitude of the fundamental and the
1
0 to 100 Percent
sum of the magnitudes for all of the current harmonics for
phase 1, 2, and 3.
Phase 1 Displacement Power
Factor
The cosine of the difference between the phase angle of the
fundamental voltage and current for phase 1; this value is
signed to show lead (+) or lag (-).
Phase 2 Displacement Power
Factor
The cosine of the difference between the phase angle of the
fundamental voltage and current for phase 2; this value is
signed to show lead (+) or lag (-).
Phase 3 Displacement Power
Factor
The cosine of the difference between the phase angle of the
fundamental voltage and current for phase 3; this value is
signed to show lead (+) or lag (-).
Total Displacement Power Factor The cosine of the difference between the phase angle of the
1
-100 to 100 Percent
1
-100 to 100 Percent
1
-100 to 100 Percent
1
-100 to 100 Percent
fundamental voltage and current for phase 1, 2, and 3; this
value is signed to show lead (+) or lag (-).
(1) This value has the same update rate as the harmonic analysis.
1
1403-IN001A-US-P
Page 63

General Operation 4-27
Min/Max Log
The Min/Max log records the minimum and
maximum values for 84 parameters. These
parameters are listed in Table 4.15. The parameter
values are continuous ly monitored until th e Min/Max
log is cleared or when the log is disabled. The Min/
Max log can be disabled to make the real time
metering update approximately 10 ms faster.
The Min/Max log can be displayed using the Disp lay
Module or via the Smart Communication Card. The
Display Module individually displays the minimum
and maximum values for each of the 84 parameters.
The date and time at which a specific minimum and
maximum value occurs is displayed by pressing
Enter (↵) at the appropriate parameter.
Table 4.15 The Parameter Listing for the Min/Max Log
Parameter Number Parameter Description
1 Phase 1 Current
2 Phase 2 Current
3 Phase 3 Current
4 Phase 4 Current
5 Average Current
6 Positive Sequence Current
7 Negative Sequence Current
8 Current Unbalance
9 Phase 1 L-L Voltage
10 Phase 2 L-L Voltage
11 Phase 3 L-L Voltage
12 Auxiliary Voltage
13 Average L-L Voltage
14 Positive Sequence Voltage
15 Negative Sequence Voltage
16 Voltage Unbalance
17 Phase 1 L-N Voltage
18 Phase 2 L-N Voltage
19 Phase 3 L-N Voltage
20 Average L-N Voltage
21 Frequency
22 Phase 1 Real Power
23 Phase 2 Real Power
24 Phase 3 Real Power
25 Total Real Power
26 Phase 1 Reactive Power
27 Phase 2 Reactive Power
Table 4.15 The Parameter Listing for the Min/Max Log
Parameter Number Parameter Description
28 Phase 3 Reactive Power
29 Total Reactive Power
30 Phase 1 Apparent Power
31 Phase 2 Apparent Power
32 Phase 3 Apparent Power
33 Total Apparent Power
34 Phase 1 True Power Factor
35 Phase 2 True Power Factor
36 Phase 3 True Power Factor
37 Total True Power Factor
38 Phase 1 Displacement Power
Factor
39 Phase 2 Displacement Power
Factor
40 Phase 3 Displacement Power
Factor
41 Total Displacement Power Factor
42 Phase 1 Distortion Power Factor
43 Phase 2 Distortion Power Factor
44 Phase 3 Distortion Power Factor
45 Total Distortion Power Factor
46 Current Demand
47 Real Power Demand
48 Reactive Power Demand
49 Apparent Power Demand
50 Phase 1 Voltage IEEE THD
51 Phase 1 Voltage IEC THD
52
53
54
(1)
(1)
(1)
Phase 1 Voltage TIF
Phase 1 Voltage Crest Factor
Phase 1 Voltage K-factor
55 Phase 1 Current IEEE THD
56 Phase 1 Current IEC THD
57
58
59
(1)
(1)
(1)
Phase 1 Current TIF
Phase 1 Current Crest Factor
Phase 1 Current K-factor
60 Phase 2 Voltage IEEE THD
61 Phase 2 Voltage IEC THD
62
63
64
(1)
(1)
(1)
Phase 2 Voltage TIF
Phase 2 Voltage Crest Factor
Phase 2 Voltage K-factor
65 Phase 2 Current IEEE THD
66 Phase 2 Current IEC THD
67
68
(1)
(1)
Phase 2 Current TIF
Phase 2 Current Crest Factor
1403-IN001A-US-P
Page 64

4-28 General Operation
Table 4.15 The Parameter Listing for the Min/Max Log
Parameter Number Parameter Description
(1)
69
70 Phase 3 Voltage IEEE THD
71 Phase 3 Voltage IEC THD
(1)
72
(1)
73
(1)
74
75 Phase 3 Current IEEE THD
76 Phase 3 Current IEC THD
(1)
77
(1)
78
(1)
79
80 Phase 4 Current IEEE THD
81 Phase 4 Current IEC THD
(1)
82
(1)
83
(1)
84
(1) Available on 1403-MM only.
Phase 2 Current K-factor
Phase 3 Voltage TIF
Phase 3 Voltage Crest Factor
Phase 3 Voltage K-factor
Phase 3 Current TIF
Phase 3 Current Crest Factor
Phase 3 Current K-factor
Phase 4 Current TIF
Phase 4 Current Crest Factor
Phase 4 Current K-factor
The pretrigger data of the 2-channel simultaneous
12-cycle oscillogram is disabled by setting the
number of pretrigger cycles to a -1. This action
makes the real time metering update slightly faster.
Self-test/Diagnostic Information
The Powermonitor II and its accessories have an
extensive array of internal self-tests. Complete selftests are executed at device powerup, and criti ca l
tests are continuously run during operation of the
device. The results of these self-tests are used to
insure the integrity of the informat ion provided by
Powermonito r II and its accessories. Improper selftest results cause the device to cease normal
operation.
Bulletin Number
For the Powermonitor II, this parameter returns 1403.
Oscillography (1403-MM only)
The Powermonitor II provides two types of
oscillography. Both are triggered simultaneously and
sampled at 10.8 kilo-hertz. The types are:
Simultaneous 7-channel 2-cycle oscillogram
•
User configurable simultaneous 2-channel 12-
•
cycle oscillogram with up to eight cycles of
pretrigger data
These oscillograms can be triggered manually or as
the result of a setpoint. Oscillogram configuration
and retrieval can only be accomplished through the
Smart Communication Card.
Oscillography has two modes of operation:
• Hold
• Overwrite
Hold fills a buffer when an o scillograph is triggered ,
and it does not allow another oscillograph to trigger
until the Master Module is commanded to cancel the
hold. Overwrite allows oscillographs to be
overwritten when multiple triggers occur.
Master M odule Firmware R evision Number
This parameter returns the firmware revision number
of the Master Module. This value is re turned throu gh
the Smart Communication Card as an integer such
that 1.00 is represented as 100.
Options Bit Field
Table 4.16 Options Bit Field
Bits Hex Description
bit 0 0001h High voltage power supply (Type A)
bit 1 0002h Low voltage power supply (Type B)
bit 2 0004h 1 Amp Master Module current input (Type 01)
bit 3 0008h 5 Amp Master Module current input (Type 05)
bit 4 0010h Limited metering
bit 5 0020h Reserved for future use
bits 6-15 Reserved for factory use
1403-IN001A-US-P
Page 65

General Operation 4-29
Overall Status
The overall status word is a summary of the
individual self-test summary status bits. This allows
the user to check a single word to determine the
device status.
Note: The overall status word is logge d in the event
log when a self-test is not successful and the
OK LED of the product is not illuminated.
The logged event is shown on the Display
Module using the code ST####, where ####
is a four digit hexadecimal number made up
of a combination of all of the bits set to 1 in
the overall status word.
Bits Hex Description
bit 0 0001h Master Module ROM status
bit 1 0002h Master Module RAM status
bit 2 0004h Master Module EEPROM status
bit 3 0008h Master Module non-volatile RAM
status
bit 4 0010h Master Module power supply status
bit 5 0020h Master Module data acquisition status
bit 6 0040h Master Module real time clock status
bit 7 0080h Smart Communication Card status
bit 8 0100h Display Module status
bit 9 0200h Master Module watchdog timer status
bits 10-
15
Reserved for factory use
Master Module ROM Status
Bits Hex D escription
bit 0 0001h Summary status
bit 1 0002h Checkless status
bits 2-15 Reserved for factory use
Master Module NVRAM Status
Bits Hex Description
bit 0 0001h Summary status
bit 1 0002h Event log checksum status
bit 2 0004h Snapshot log checksum status
bit 3 0008h kW checksum status
bit 4 0010h Master Module log checksum status
bit 5 0020h Power down timestamp checksum
status
bit 6 0040h Status input counter checksum
status
bits 7-15 Reserved for factory use
Master Module Power Supply Status
Bits Hex Description
bit 0 0001h Summary status
bit 1 0002h Plus 12V supply too high
bit 2 0004h Plus 12V supply too low
bit 3 0008h Minus 12V supply too low
bit 4 0010h Minus 12V supply too high
bits 5-15 Reserved for factory use
Master Module Data Acquisition Status
Bits Hex Description
bit 0 0001h Summary status
bit 1 0002h Sample clock generation status
bit 2 0004h Data bus connection status
bit 3 0008h Address test status
bit 4 0010h Internal calibration status
bit 5 0020h FIFO full interrupt status
bit 6 0040h Internal reference status
bit 7 0080h Low voltage status
bits 8-15 Reserved for factory use
Master Module RAM Status
Bits Hex D escription
bit 0 0001h Summary status
bit 1 0002h Read/write status
bits 2-15 Reserved for factory use
Master Module Watchdog Timer Status
Bits Hex Description
bit 0 0001h Summary status
bit 1 0002h Response time status
bit 2 0004h Watchdog fired status
bits 3-15 Reserved for factory use
1403-IN001A-US-P
Page 66

4-30 General Operation
Real Time Clock Status
Bits Hex Description
bit 0 0001h Summary status
bits 1-15 Reserved for factory use
Battery Usage Timer Value
This value indicates the number of days that the
Powermonitor II Master Module has been in Battery
Backup mode. The timer only increments when the
Master Module is wi thout contr ol power . The timer is
not automatically cleared and must be manually
cleared when the battery is changed.
Note: Typical battery replacement is ten calendar
years or 2,000 accumulated days, whichever
comes first.
Smart Communication Card Status
Bits Hex D escription
bit 0 0001h Summary status
bit 1 0002h 16-bit walking ones status
bit 2 0004h 16-bit walking zeros status
bit 3 0008h 16-bit data bus status
bit 4 0010h 8-bit walking ones status
bit 5 0020h 8-bit walking zeros status
bit 6 0040h 8-bit data bus status
bit 7 0080h 16-bit device write status
bit 8 0100h 8-bit device write status
bit 9 0200h NSC EPROM CRC status
bit 10 0400h NSC dual read/write status
bit 11 0800h NSC no read/write status
bit 12 1000h NSC serial communications status
bit 13 2000h NSC serial communications RAM status
bits 14-15 Reserved for factory use
Smart Communication Card Type
Smart Communication Card Firmware Revision
Number
This parameter returns the firmware revision number
of the Smart Communication Card. This value is
returned through the Smart Communication Card as
an integer such that 1.00 is represented as 100.
Number of Display Modules
This paramete r indicates the total number of Dis play
Modules currently connected within the fiber optic
loop.
Display Module Status
Bits Hex Description
bit 0 0001h Summary status
bit 1 0002h Display Module 1 status
bit 2 0004h Display Module 2 status
bit 3 0008h Display Module 3 status
bits 4-15 Reserved for factory use
Display Module Self-test Results Wor d 1
Bits Description
bit 0-7
(Byte 1)
bit 8-15
(Byte 2)
Display Module 1 self-test results
0001h = Unsuccessful ROM self-test
0011h = Unsuccessful RAM self-test
Display Module 2 self-test results
0001h = Unsuccessful ROM self-test
0011h = Unsuccessful RAM self-test
Display Module Self-test Results Wor d 2
Bits Description
bit 0-7
(Byte 1)
bit 8-15
(Byte 2)
Display Module 3 self-test results
0001h = Unsuccessful ROM self-test
0011h = Unsuccessful RAM self-test
Reserved for factory use
Bits Hex D escription
bit 0 0001h R I/O, RS-232/RS-485
bit 1-15 Reserved for future use
1403-IN001A-US-P
Page 67

General Operation 4-31
Display Module # 1, #2, #3 Firmware Revision
Number
This parameter returns the firmware revision number
of the respective Display Module connected to the
fiber loop. It is available only through the Smart
Communication Card. This value is returned as an
integer such that 1.00 is represented as 100.
Master Module Auxiliary Frequency
This paramete r returns the f requency of the AC
signal app l ied to the Auxiliary Voltage input to the
Powermonitor II when the configuration parameter
“Vaux Voltage Mode” is set to AC (or 0). This value
can only be viewed through the Smart
Communication Card.
Master Module Fiber Loop Back Status
To perform a fiber loop back test follow these steps:
1. Remove any fiber optic cable connecting the
Display Modules.
2. Install a single fiber optic cable from the transmit
(Tx) port to the receive (Rx) port on the Master
Module.
3. Initiate a read of the Diagnostic/Status table via
the Smart Communication Card.
4. Examine the Master Module Fiber Loop Back
Status word within the Dia gnostic/Status table.
Master Module EEPROM Status
Bits Hex Description
bit 0 0001h Summary status
bit 1 0002h Invalid configuration data status
bit 2 0004h Calibration block checksum status
bit 3 0008h Factory configuration block checksum
status
bit 4 0010h Configuration block 1 checksum status
bit 5 0020h Configuration block 2 checksum status
bit 6 0040h Read write status
bit 7 0080h Transfer status
bit 8 0100h Block write in progress status
bits 9-15 Reserved for factory use
Master Module Device ID
This parameter returns the factory pre- programmed
value which is us ed as the default serial address if the
optional Cat. No. 1403-NSC Smart Communication
Card is installed. The valu e is within th e range 0- 250
inclusive.
General Purpose Status Bits
Bits Hex Description
(1)
bit 0
bit 1 0002h Snapshot buffer full
bit 2
bits 3-15 Reserved for factory use
(1) Available on 1403-MM only.
0001h Oscillogram triggered and complete
1
0004h Oscillogram triggered by a setpoint action
BT Error Status Word 1
Value
Returned
0 A single fiber optic cable is incorrectly connected.
1 The fiber optic loop back test has passed.
Description
There may be a problem with the Master Module
fiber optic transceivers.
This word returns the Size/ID of the last b lock
written to the Powermonitor II through the Smart
Communication Card if any invalid data was
included in that block.
BT Error Status Word 2
This word returns the parameter number of the
invalid data item included in the last block written.
The last block written is identified by BT Error
Status Word 1.
1403-IN001A-US-P
Page 68

4-32 General Operation
1403-IN001A-US-P
Page 69

Catalog Number Explanation
Master Module/Limited Metering Master Module
1403 - MM 01 A
Appendix
A
Bulletin Number Type of Device
1403 = Power Monitoring,
Protection, and Management
Products
Display Module
Bulletin Number
MM = Master Module
LM = Limited Metering Master
Module
1403 - DM A
Type of Device
Current Inputs Power Supply
01 = 1 Amp
05 = 5 Amps
A = 120V/240V AC 50/60 Hz
or 125V/250V DC
B = 24V AC 50/60 Hz or 24/
48V DC
Power Supply
1403 = Power Monitoring,
Protection, and Management
Products
DM = Display Module
A = 120V/240V AC 50/60 Hz or
125V/250V DC
B = 24V AC 50/60 Hz or 24/48V
DC
1403-IN001A-US-P
Page 70

A-2 Catalog Number Explanation
Communications Cards/Peripherals/Software
1403 - NSC
Bulletin Number
1403 = Power Monitoring,
Protection, and Management
Products
Fiber Optic Accessories
Bulletin Number
1403 = Power Monitoring,
Protection, and Management
Products
Type of Device
NSC = Plug-in Communications Card for Bulletin 1403-MM Devices
(RS-232C/RS-485/Allen-Bradley R I/O Protocols)
NENET = Plug-in Communications Card for Ethernet
NDNET = Plug-in Communications Card for DeviceNet
1403 - CF000
Type of Device
CF000 = 25cm Fiber Optic Cable Assembly Quantity: 2
CF001 = 1 M Fiber Optic Cable Assembly Quantity: 2
CF003 = 3 M Fiber Optic Cable Assembly Quantity: 2
CF005 = 5 M Fiber Optic Cable Assembly Quantity: 2
CF010 = 10 M Fiber Optic Cable Assembly
CF020 = 20 M Fiber Optic Cable Assembly
CF050 = 50 M Fiber Optic Cable Assembly
1403-IN001A-US-P
Page 71

Mechanical Dimensions
Figure B.1 Master Module Dimensions
Appendix
B
1403-IN001A-US-P
Page 72

B-2 Mechanical Dimensions
Figure B.2 Display Module Dimensions
1403-IN001A-US-P
Page 73

Figure B.3 Display Module Mounting
Mechanical Dimensions B-3
Figure B.4 Display Module Cutout Dimensions
1403-IN001A-US-P
Page 74

B-4 Mechanical Dimensions
Figure B.5 Installation of the Display Module into the
Protective Enclosure
Display Module
Flat Washer
Gasket
Protective
Enclosure
Front Panel
(8) Flat Washer
(4) M4 Nut/Lock
Washer Assembly
1403-IN001A-US-P
Page 75

Variable Content
TTL:Chap
Is Linked To HD:Running
±1
Page 76

Variable Content
TTL:Chap
Is Linked To HD:Running
±3
Page 77

Appendix
C
Technical Specifications
Product Approvals
UL 508 listed, File E96956, for Industrial Control
Equipment and CSA C22.2 Certified.
CE Certification
If this product bears the CE marking, it is approved
for installation within the European Union and EEA
regions. It has been designed and to meet the
following d irectives.
EMC Directive
This product is tested to meet Council Directive 89/
336/EEC Electromagnetic Compatibility (EMC) and
the following standards, in whole in part,
documented in a technical construction file:
• EN 50081-2 - Generic Emission Standard, Part
2 - Industrial Environment
• EN 50082-2 - Generic Immunity Standard, Part
2 - Industrial Environment
This product is intended for use in an industrial
environment.
International Standard IEC 529 / NEMA / UL 508 Degree of Protection
The Bulletin 1403 Master Module is rated as IP10
degree of protection per International Standard IEC
529. It is considered an open device per NEMA and
UL 508.
The Bulletin 1403 Display Module is rated as IP65
degree of protection per International Standard IEC
529. It is rated as Type 4X (Indoor) per NEMA and
UL 508.
Follow the recommended installation guidelines to
maintain these ratings.
ANSI/IEEE Tested (1403-MM only)
Meets or exceeds the Surge Withstand Capability
(SWC) C37.90.1 - 1989 for protective relays and
relay systems on all power connection circuit
terminations.
Metering Update Rates (1403-MM only)
Filter
Mode
1 Disabled 0 Disabled 28
1 Enabled 20 1/Second 46
2 Disabled 0 Disabled 52
2 Enabled 20 1/Second 67
3 Disabled 0 Disabled 69
3 Enabled 20 1/Second 87
Min/Max Log
Functionality
Number of
Configured
Setpoints
Snapshot
Log
Interval
Real Time
Metering
Update
Rate (mS)
Low Voltage Directive
This product is tested to meet Council Directive 73/
23/EEC Low Voltage, by applying the safety
requirements of IEC 1010-1.
This equipment is classified as open equipment and
must be installed (mounted) in an enclosure during
operation as a means of providing safety protection.
1403-IN001A-US-P
Page 78

C-2 Techn ical Specifications
Measurement Accuracy, Resolution, and Range
See table bel ow for the rating of each para meter.
Parameter Accuracy in Percent
of Full Scale
@ 25
°
C 50/60 Hz
(1) (2)
Volts: V1, V2, V3 1403-MM 1403-LM 10 to 115% of nominal 120V
±
0.05%
±
0.1% 0.025% 0.05%
Current I1, I2, I3, I4 ±0.05% ±0.1% 1 to 140% of nominal
Frequency:
Power Functions:
kVA, kVAR
Demand Functions:
kVA
Energy Functions:
kVAH
Power Factor
Harmonic Data
(2nd through 41st)
Analog Input
(1) Accuracy is specificed at terminals of Powermoniter II. User supplied transformers may affect accuracy.
(2) For detailed performance curves, refer to Publication 1403-2.2, Powermoniter II Specification Sheet.
(3) Actual full scale is determined by multiplying by user transformer ratio.
(4) The low end of frequency range is 40 Hz for the 1403-LM and 1403-MM in filter mode 1.
(5) Product Cat. No. identifies unit as a 1A or a 5A device.
kW,
kW,
kWH,
±
0.005 Hz±0.005 Hz
±
0.05 Hz±0.05 Hz 75 - 120 Hz —
±
0.1%
±
0.1%
±
5% (of
±
0.2% V
±
0.2%
THD Only ————
fundamental)
±
1%
±
1% 0 to 100% of nominal±1.4V DC / 1.0V AC 0.4% 0.4%
Range
(3)
Nominal Value
(Scale)
& 347VL-N/600VL-L
(5)
1A
0.2 to 140% of nominal
20 - 75 Hz
Range X IRange
±
0 to 100% 100% 0.1% 0.2%
(4)
5
5A
—0.825
V
Nominal X INominal
/208VL-L
L-N
(3)
Internal
Resolution
1403-MM 1403-LM
0.025% 0.05%
µ
S
0.025% 0.05%
1403-IN001A-US-P
Page 79

Technical Specifications C-3
General Input, Output, and Environmental Ratings
Input and Output Ratings
Control Power 1403-xMxxA 120V/240V AC 50/60 Hz or
125V/250V DC
(0.2 Amp maximum loading)
1403-xMxxB 24V AC 50/60 Hz or
24V/48V DC
(1 Amp maximum loading)
1403-DMA 120V/240V AC 50/60 Hz or
125V/250V DC
(0.05 Amp maximum loading)
1403-DMB 12V/24V AC 50/60 Hz or
12V/24V/48V DC
(0.15 Amp maximum loading)
Voltage Inputs Nominal Full Scale Input: 120V to 347V L-N
(208V to 600V L-L)
Input Impedance: 1 Meg-Ohm minimum
Current Inputs Nominal Full Scale Input:
0 to 1 Amp (1403-xM01x)
0 to 5 Amps (1403-xM05x)
Overload Withstand:
15 Amps Continuous,
300 Amps for one second
Burden: 0.05 VA
Impedance: 0.002 Ohms
Status Inputs Contact Closure (Internal 24V DC)
±
Analog Input Nominal Input: 1.0V AC/
Overload Withstand: 120V for one minute
Control Relay
Rating 50/60 Hz AC rms DC
Maximum Resistive
Load Switching
Minimum Load
10A at 250V
(2500VA)
10mA at 24V 10mA at 24V
Switching
UL 508, CSA 22.2,
B300 Q300
IEC Rating Class
Maximum Make
Values (Inductive
Load)
Maximum Break
Values (Inductive
Load)
Maximum Motor Load
Switching
30A at 120V
15A at 240V
(3600VA)
3A at 120V
1.5A at 240V
(360VA)
1/3 HP at 125V
1/2 HP at 250V
Relay Life
1.4V DC
10A at 30V and
0.25A at 250V
0.55A at 125V
0.27A at 250V
(69VA)
0.55A at 125V
0.27A at 250V
(69VA)
General Specifications
Dielectric
Withstand
Control Power 1600 Volts (Cat. No.
1403-MMxxA, -DMA)
500 Volts (Cat. No. 1403-
MMxxB, -DMB)
Voltage Inputs 2200 Volts
Current Inputs 4160 Volts
Status Inputs 1000 Volts
Control Relays 1600 Volts
T erminal Block
°
C Cu
(+75
wire only)
1403-xM Voltage
and Current
Terminals
1403-xM Power,
Status, Analog,
10 AWG (6 mm
16 lb-in (1.81 Nm) Torque
12 AWG (4 mm
(8 lb-in (0.90 Nm) Torque
2
) max.,
2
) max.,
Relay, and Ground
Terminals
1403-NSC
Terminals
14 AWG (2.5 mm
max.,5 lb-in (0.56 Nm)
2
)
Torque
1403-DM Terminals
14 AWG (2.5 mm
2
)
max.,5 lb-in (0.56 Nm)
Torque
°
Operating
Temperature
C to +60°C (-40°F to +140°F)
-40
Cat. No. 1403-MM, -NSC
°
C to +60°C (-4°F to +140°F)
-20
Cat. No. 1403-DM
°
Storage
C to +85°C (-40°F to +185°F)
-40
Temperature
Humidity 5% to 95%, Non-condensing
±
Vibration 10 to 500 Hz: 1G Operational (
2.5G Non-operational (
±
0.006 in.) and
0.015 in.)
Shock 1/2 Sine Pulse, 11 ms duration: 15G
Operational and 30G Non-operational
Fiber Optic Cable Assembly Specifications
Parameter Minimum Maximum
Cable Length:
Distance
25 cm (approx. 10 in.) shortest
Allen-Bradley standard
500 m
(1650 ft.)
between two
adjacent
devices
Minimum
inside bend
radius
25.4mm (1 in.) Any bends with a
N/A
shorter inside radius can
permanently damage the fiber
optic cable. Signal attentuation
increases with decreased inside
bend radii.
Parameter Number of Operations
Mechanical
Electrical
5 X 10
1 X 10
6
5
1403-IN001A-US-P
Page 80

C-4 Techn ical Specifications
1403-IN001A-US-P
Page 81

Appendix
D
Glossary
A
ampere
A unit of electrical current or rate of flow of
electrons. One volt across one ohm of resistance
causes a current flow of one ampere. A flow of one
coulomb per second equals one
apparent power
The product of voltage magnitude and current
magnitude in a circuit. Units are VA, or some
multiple thereof.
B
balanced load
An alternating, current power system consisting of
more than two current carrying conductors in which
these current carrying conductors all carry the same
current.
billing demand
The demand level that a utility uses to calculate the
demand charges on the current month’s bill. Various
methods may be used to determin e the val ue, such as
minimum demand, peak demand or a ratchet clause.
It can be based on Watt Demand, VA Demand, VAR
Demand or some combination of these. A rate at
which a transmission occurs, where one baud equals
one bit per second.
burden
The electrical load placed on source of VA or the
load an instrument or meter places on a current or
potential transformer. All current and potential
transformers have a rate d burden which should not be
exceeded or else transformer transformation
accuracy will deteriorate.
C
capacitor
A device consisting essentially of two conducting
surfaces separated by an insulating material or
dielectric. A cap acitor stor es electri cal ener gy, blocks
the flow of direct current, and permits the flow of
alternating current to a degree dependent upon the
capacitance and frequ ency. They may also be used to
adjust the power factor in a system.
connected load
The total load which a customer can impose on the
electrical system if everything was connected at one
time. Connected loads can be measured in
horsepower, watts or volt-amperes. Some rate
schedules establish a minimum demand charge by
imposing a fee per unit of connected load.
current transformer (CT)
A transformer, intended for measuring or control
purposes, designed to have its primary winding
connected in series with a conductor carrying the
current to be measured or cont rolled. CT’s step down
high currents to lower values which can be used by
measuring instruments.
current transformer ratio
The ratio of primary amperes divided by secondary
amperes.
D
demand hours
The equivalent number of hours in a month during
which the pe ak demand is fully utilized. In other
words, if energy consumption for the current month
is X kwhr and the peak demand is Y Kw, then the
demand hours is equal to X/Y hours. The higher the
number of demand hours the better the demand
leveling situatio n and t he more e f fect ively demand i s
being used.
1403-IN001A-US-P
Page 82

D-2 Glossary
demand interval
Demand charges are based on peak demand over a
utility specified time interval, not on the
instantaneous demand (or connected load) at any
given moment. Typical demand intervals are 15, 20
and 30 minutes.
F
frequency
The number of recurrences of a periodic
phenomenon in a unit of time. In electrical terms,
frequency is specified as so many Hertz (Hz) where
one Hz equals one cycle per second.
H
horsepower (hp)
A unit of power , or the capacity of a mecha nism to do
work. It is equivalent to raising 33,000 pounds one
foot in one minute. One horsepower equals 746
watts.
initiator pulses
Electrical impulses generated by pulse-initiator
mechanisms installed in utility revenue meters. Each
pulse indicates t he cons umption of a spe cific n umber
of watts. These pulses can be used to measu re ener gy
consumption and demand.
L
lagging current
The current flowing in an AC circui t which is mos tly
inductive. If a circuit contains only inductance the
current lags the applied voltage by 90 degrees.
Lagging current means lagging power.
leading current
The current flowing in a circuit which is mostly
capacitive. If a circuit contains only capacitance the
current leads the applied voltage by 90 degrees.
Leading current means leading power factor.
load
I
impedance
The total opposition (i.e., resistance and reactance) a
circuit offers to the flow of alternating current at a
given frequency. It is measured in ohms.
induction motor
An alternating current motor in w hich the primary
winding (usually the sta tor) is connected to the power
source and induces a current into a secondary
(usually the rotor).
inductor
A device consisting of one or more windings with or
without a magnetic core. Motors are largely
inductive.
Any device or circuit consuming power in an
electrical system.
load shedding
The removal o f load from the line to limit load and
control demand level.
load restoring
The energization of loads that were previously
removed from the line to limi t load and control
demand level.
N
neutral
The conductor chosen as the return path for the
current from the load to the source. It is also a
voltage reference point in a power system.
1403-IN001A-US-P
Page 83

Glossary D-3
O
ohm
The unit of electrical resistance. One ohm is the
value of resistance through which a potential
difference of one volt will maintain a curren t fl ow of
one ampere.
P
peak demand
The highest aver age lo ad over a util ity speci fied time
interval during a billing period. If there is no ratchet
clause in the rate schedule then the peak demand is
also the billing demand.
polyphase
Having or utilizing several phases. A polyphase
power circuit has several, typically three, phases of
alternating current with a fixed phase angle between
phases.
potential transformer (PT)
An transformer with the primary winding connected
in parallel with the circuit whose voltage is to be
measured or controlled. PT’s are normally used to
step down high voltage potentials to lower levels
acceptable to measuring instruments. Also known as
voltage transformer (VT)
power factor correction
Steps taken to raise the power factor by closely
aligning the current to be in phase with the applied
voltage. Most frequently this consists of added
capacitance to increase the lagging power factor of
inductive circuits.
power factor penalty
The charge utilities impose for operating at power
factor below some rate sc hedule -specifi ed level . This
level ranges from a lagging power factor of 0.80 to
unity. There are innumerable ways by which utilities
calculate power factor penalties.
R
ratchet clause
A rate schedule clause which states that billing
demand may be based on current month peak
demand or on historical peak demand, depending on
relative magnitude. Usually the historical period is
the past eleven mont hs, although it c an be f or the life
of the contract. Billing demand is either the current
month peak demand or some percentage (75 percent
is typical) of the highest historical peak demand.
Depending on which is largest. It is designed to
compensate the electric utility for maintaining
equipment not fully utilized.
reactance
potential tr ansformer ratio
The ratio of primary voltage divided by secondary
voltage.
power factor
The ratio of real power in watts of an alternating
current circuit to the apparent power in volt- amperes.
Also expressed as the cosine of the phase angle
between the fundamental voltage applied to a load
and the current passing through it.
The opposit ion to the flow of alternating current.
Capacitive reactance is the opposition offered by
capacitors and inductive reactance is the opposition
offered by an inductive load. Both reactances are
measured in ohms.
real power
The component of apparent power that represents
real work in a n alternating current circuit. It is
expressed in watts and is equal to the apparent power
times the power factor.
1403-IN001A-US-P
Page 84

D-4 Glossary
resistance
The property of a substance which impedes current
flow and results in the dissipation of power in the
form of heat. The unit of resistance is the ohm. One
ohm is the resistance through which a difference of
potential of one volt will produce a current of one
ampere.
revenue meter
A meter used b y a utility to generate billing
information . Many types of meters fall in this
category depending on the rate structure.
root mean squ are (RMS)
The effective value of alternating current or voltage.
The RMS values of voltage and current can be used
for the accurate computation of power in watts. The
RMS value is the same value as if continuous direct
current were applied to a pure resistance.
S
sliding demand interval
A method of calculating average demand by
averaging the average demand over several
successive short time intervals, advancing one short
time interval each time. Updati ng averag e demand at
short time intervals gives the utility a mu ch better
measure of true demand and makes it d if fic ult f or th e
customer to obscure high short-term loads.
U
volt-ampere demand
Where peak average demand is measured in voltamperes rather than watts. The average VA during a
predefined interval. The highest average, i.e. Peak
VA demand, is sometimes used for billing.
voltage (V)
The force which causes current to flow through a
conductor. One volt equals the force required to
produce a current flow of one ampere through a
resistance of one ohm.
W
watt (W)
A measure of real power. The unit of electrical power
required to do work at the rate of one joule per
second. It is the powe r expended when o ne ampere of
direct current flo ws th rough a resistance of one ohm.
Equal to apparent power VA times the power factor.
watt demand
Power during a predetermined interval. The highest
average, i.e. Peak demand is commonly used for
billing.
watt hour (Whr)
The number of watts used in one hour. Since the
power usage varies, it is necessary to integrate this
parameter over time. Power flow can be either
forward or reverse.
unbalanced load
A situation existing in a three phase alternating
current system using more than two current carrying
conductors where the current is not due to uneven
loading of the phases.
V
volt-ampere (VA)
The unit of apparent power. It equals volts times
amperes regardless of power factor.
1403-IN001A-US-P
wattmeter
An instrument for measuring the real power in an
electric circuit. It s scale is usu ally graduate d in watts,
kilowatts or megawatts.
volt ampere reactive hours (VARH)
The number of VARs used in one hour. Since the
value of this parameter varies, it is neces sary to
integrate it over time. VARs can be either forward or
reverse.
Page 85

Index
B
battery replacement 3-1
disposal 3-3
installation 3-1
removal 3-2
C
calibration 3-3
catalog number explanation A-1
cleaning instructions 3-3
commands 4-10
communication connections 2-20
communications 1-3
configuration items 4-6
demand 4-9
general 4-6
control power 2-2
D
data logging 4-23
event log 4-23
min/max log 4-27
snapshot log 4-24
description 1-1
device configuration 1-1
dimensions B-1
display module B-2
display module cutout B-3
display module into the protective
enclosure B-4
display module mounting B-3
master module B-1
display module 2-18
fiber optics 2-18
key functions 4-1
terminal block wire sizes and
screw torque values 2-18
voltage ratings 2-18
displays 1-2
E
electrostatic discharge 2-1
F
features 1-1
fiber optics 2-18
field service considerations 3-3
G
glossary D-1
H
harmonic analysis 4-15
L
LED indicators 2-17
M
maintenance 3-1
master module
chassis grounding 2-2
terminal blocks wire sizes and
screw torques 2-2
wiring 2-2
measurements 1-2
menu parameter structure 4-4
metering 4-11
cumulative power 4-14
voltage/current 4-11
Minimum Configuration 1-2
mounting 2-1
display module 2-1
master module 2-1
O
operation 4-1
editing a digital parameter 4-2
issuing a command 4-3
operational characteristics 1-4
oscillography 1-4, 4-28
R
relay operation 4-22
S
selftest/diagnostic information 4-28
battery usage timer value 4-30
BT error status word 1 4-31
BT error status word 2 4-31
bulletin number 4-28
display module #1, #2, #3
firmware revision number
4-30
display module selftest results
word 1 4-30
display module selftest results
word 2 4-30
display module status 4-30
1403-IN001A-US-P
Page 86

I-2
general purpose status bits 4-31
master module auxiliary
frequency 4-31
master module data acquisition
status 4-29
master module device ID 4-31
master module EEPROM status
4-31
master module fiber loop back
status 4-31
master module firmware revision
number 4-28
master module NVRAM status
4-29
master module power supply
status 4-29
master module RAM status 4-29
master module ROM status 4-29
master module watchdog timer
status 4-29
number of display modules 4-30
options bit field 4-28
overall status 4-28
real time clock status 4-29
smart communication card
firmware revision number
4-30
smart communication card status
4-30
smart communication card type
4-30
setpoints 4-16
configuration 4-20
equal 4-19
not equal 4-19
over forward 4-16
over reverse 4-17
setpoint action type 4-21
setpoint type 4-21
theory 4-16
under forward 4-18
under reverse 4-19
software and system integration 1-3
PLC configuration 1-3
setup/monitoring software 1-3
specifications C-1
control relay C-3
fiber optic assembly C-3
general specifications C-3
input and output ratings C-3
measurement accuracy,
resolution, and range C-2
relay life C-3
status inputs 2-16
V
voltage and current inputs 2-2
voltage ratings 2-18
W
wiring
chassis grounding 2-2
display module 2-18
master module 2-2
terminal blocks wire sizes and
screw torques 2-2
wiring diagram
3phase 3wire delta direct connect
with three CTs 2-15
3phase 3wire delta with three PTs
and three CTs 2-11
3phase 3wire grounded L2 (B)
phase open delta direct
connect with three CTs
2-14
3phase 3wire grounding wye
direct connection 2-9
3phase 3wire grounding wye with
PTs 2-10
3phase 3wire open delta with
three PTs and three CTs
2-12
3phase 3wire open delta with two
PTs and two CTs 2-13
3phase 4wire direct connect 2-6
single phase direct connection 2-4
single phase with PTs 2-5
1403-IN001A-US-P
Page 87

I-3
1403-IN001A-US-P
Page 88

Back Cover
Publication 1403-IN001A-US-P - August 1999 PN 40055-161-02(B)
Supersedes Publication 1403-5.0 November 1997 and Publication 1403-5.0-DU3 August 1998 © (1999) Rockwell International Corporation. Printed in the U.S.A.
 Loading...