

Page 1
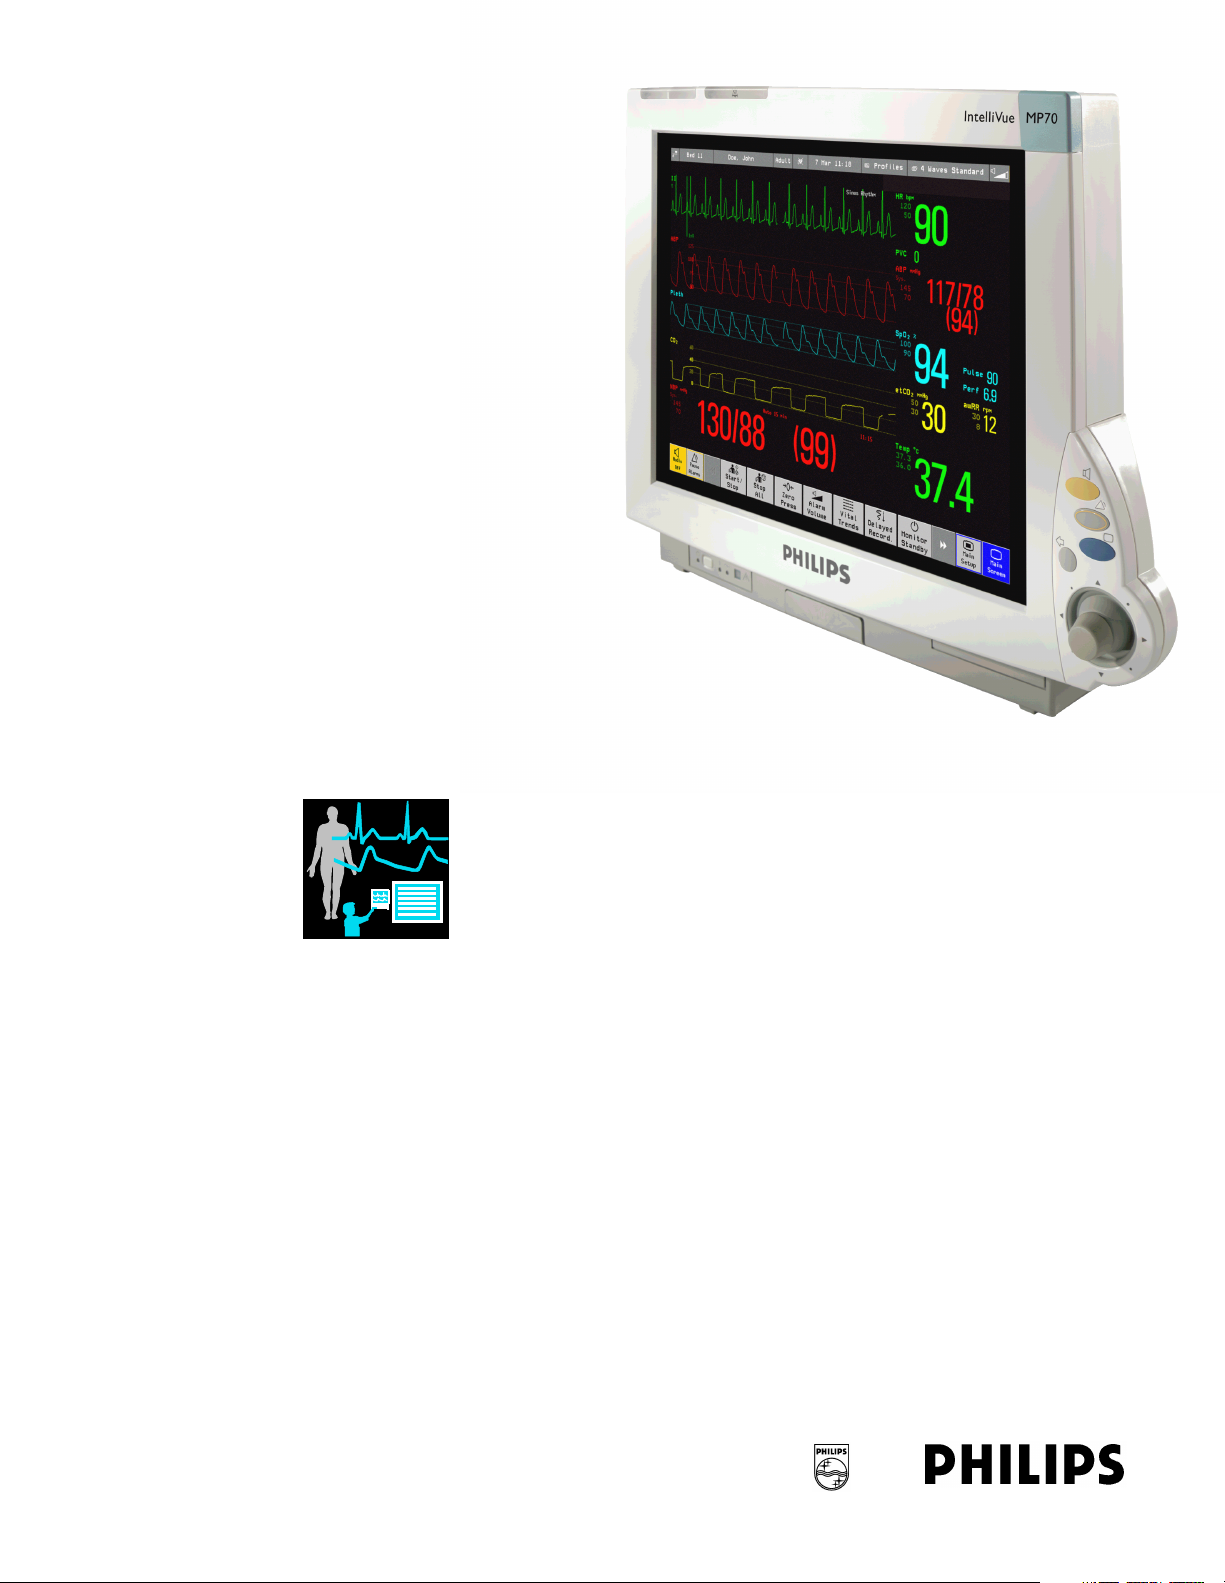
IntelliVue MP60/70
Service Guide
IntelliVue Patient Monitor
MP60/70
Patient Monitoring
Page 2

Part Number M8000-9301A
'%(&'
Page 3

1Table of Contents
1 Introduction 13
Who Should Use This Guide 13
How to Use This Guide 13
Abbreviations 13
Responsibility of the Manufacturer 14
Passwords 14
2 Theory of Operation 15
Integrated Monitor Theory of Operation 15
System Boundaries 15
Hardware Building Blocks 17
IntelliVue MP60 17
IntelliVue MP70 18
Optional Hardware 19
Compatible Devices 19
Power Supply 20
CPU Boards 20
I/O Boards 22
Data Flow 23
Data Acquisition 23
Data Provider System Service 23
Persistent Data Storage System Service 24
Display and User Interface Service 24
Data Output 24
Monitor Applications 24
Internal LAN (Measurement Server Link) 24
Philips Clinical Network 26
How does the Support Tool Work with the Monitor 26
Monitor Software Block Diagram 27
Block Diagram Legend 28
32
3 Testing and Maintenance 33
Concepts 33
Test Reporting 33
Recommended Frequency 34
Tests Recommended When Performing... 35
Installation 35
Repair 35
3
Page 4

Preventive Maintenance 35
Performance Verifications 35
Upgrades 35
Te s t s 36
Visual Test 36
Power On Test 36
NBP Tests 36
NBP Accuracy Test 36
NBP Leakage Test 37
NBP Linearity Test 37
Valve Tes t 38
Sidestream CO2 Per formance Test 38
Barometric Pressure Check and Calibration 39
Leakage Check 39
Pump Check 40
Flow Rate Check and Calibration 40
Noise Check 41
Gas Measurement Calibration Check 41
CO
2
Calibration Verification 42
Reset Time Counters 42
Temperature Accuracy 43
ECG/Resp Performance Test 43
ECG Performance 43
Respiration Performance 43
Invasive Pressure Performance Test 44
SpO2 Performance Test 44
Cardiac Output Performance Test 44
Service Tool Procedure, Version 1 44
Service Tool Procedure, Version 2 45
BIS Performance Test 45
PIC/DSC Test 45
Nurse Call Relay Performance Test 45
Phone Jack Type Connector Test 45
Multi-Port Nurse Call Connector Test 46
ECG Sync Performance Test 47
VueLink Tests using VueLink Test Module 47
Tes t Pr o c e d u r e 4 7
Safety Testing 48
Warnings, Cautions, and Safety Precautions 48
Safety Test Procedures 49
Touchscreen Calibration 52
4 Troubleshooting 53
Introduction 53
How To Use This Section 53
Who Should Perform Repairs 53
4
Page 5

Replacement Level Supported 53
Software Revision Check 54
Obtaining Replacement Parts 54
Troubleshooting Guide 54
Checks for Obvious Problems 54
Checks Before Opening the Instrument 55
Checks with the Instrument switched Off 55
Checks with the Instrument Switched On, AC connected 55
Initial Instrument Boot Phase 56
Troubleshooting Tables 58
How to use the Troubleshooting tables 58
Boot Phase Failures 59
Integrated Display is blank 61
Integrated Touch Display not functioning 62
External Display is blank 63
External Touch Display not functioning 64
General Monitor INOP Messages 65
Remote Alarm Device 66
Remote Extension Device 66
Speed Point 67
Keyboard/Mouse not functioning 67
Network related problems 69
Wireless Network 70
Multi-Measurement Server 71
MSL-related problems 72
Alarm Issues 74
Alarm Lamps 74
Alarm Tones 74
Alarm Behavior 74
Individual Parameter INOPS 75
Flexible Module Server 76
Integrated Module Slots 76
Printer 77
Recorder 78
MIB / RS232 80
Flexible Nurse Call Relay 81
Troubleshooting the ECG OUT 81
Data Flow Marker In and ECG Wave 82
Status Log 83
Troubleshooting with the Support Tool 83
Troubleshooting the Individual Measurements or Applications 85
5 Repair and Disassembly 87
Tools Required 87
Minimal Monitor Disassembly 87
Disconnecting the SpeedPoint 87
5
Page 6

Removing the I/O Boards 89
Removing the ECG Out board if no SRL2 board is plugged 90
Removing the Integrated Module Slot, the Measurement Server Mount or blank covers 91
Separating the front and back half of the monitor 92
Removing Power Switch board 94
Removing the Backlights 95
Further Disassembly 95
Exchanging the Touchscreen 95
Exchanging the LCD Assembly 96
Removing Power Supply 98
Removing the Speaker 99
Removing the ECG Out Board with an SRL2 Board plugged 100
Removing the Video Board 101
Removing the Main Board 101
Flexible Module Server (FMS) Disassembly 103
Removing the Handle and the Measurement Server Mount 103
Plug-in Modules 107
Plug-In Module Disassembly 107
tcpO2/tcpCO2 Calibration Chamber Kit 108
Recorder Module Paper 109
Disassembly Procedures for the Measurement Server Extension 109
Removing the Front Cover 110
Removing the Extension Bottom Cover 110
Removing the CO2 Scrubber 111
Removing the Pump 112
Refit Procedures for the Measurement Server Extension 113
Refitting the CO2 Scrubber 113
Refitting the Pump 113
Refitting the Extension Bottom Cover 114
Refitting the Front Cover 114
General Reassembly/Refitting Comments 114
Following Reassembly 114
6 Parts 115
MP60/MP70 Parts 116
Exchange Parts 116
Replacement Parts 117
Flexible Module Server Parts 118
Exchange and Replacement Parts 118
Multi-Measurement Server Parts 119
Measurement Server Extension Parts (M3015A and M3016A) 120
Exchange Parts List 122
Plug-in Modules Part Numbers 124
Part Number Table 124
Exchange Modules, Table 1 124
Exchange Modules, Table 2 125
6
Page 7

Plug-In Modules Replaceable Parts 127
Single-Width Plug-In Module 127
Double-Width Plug-In Module 127
Plug-in Module Replaceable Parts 128
Plug-In Module Language Specific Front Housings, Table 1 128
Plug-In Module Language Specific Front Housings, Table 2 129
Plug-In Module Specific Bezels 130
BIS Module Replaceable Parts 130
BIS Module Components 131
tcpO2/tcpCO2 Module Accessories 132
External Display Part Numbers 132
Remote Input Devices Part Numbers 133
Remote Alarm Device Part Numbers 134
Remote Extension Device Part Numbers 134
134
7 Installation Instructions 135
Unpacking the Equipment 135
Initial Inspection 136
Mechanical Inspection 136
Electrical Inspection 136
Claims For Damage and Repackaging 136
Claims for Damage 136
Repackaging for Shipment or Storage 136
Installing the Monitor (M8005A or M8007A) 136
Mounting Instructions 137
Assembling Mounts 137
Connections 138
Installing Interface Boards 139
Installing Remote Devices 139
Mounting the Remote Display (M8031A) 139
Connections 140
Flexible Module Server and/or Multi-Measurement Server 140
Attaching the MMS to a Mount 140
Detaching the Measurement Server from a Mount 140
Positioning the Measurement Server on a Clamp Mount 140
Mounting the MMS Mount to the FMS (M8048A) 141
Mounting the Remote Extension Device to the FMS 142
Mounting the BIS Module to the FMS 142
Mounting the FMS 143
Connections 143
MSL Cable Termination 144
Remote Alarm Devices 146
Mounting 146
Connections 146
Remote Extension Device 147
7
Page 8

Mounting 147
Connections 148
Cabling 148
Philips Clinical Network 149
Flexible Nurse Call Relay 149
Connections 149
ECG Out Functionality 149
Connections 149
Configuration Tasks 151
Setting Altitude, Line Frequency and Barometric Pressure 151
Configuring the Equipment Label 151
8 Site Preparation 153
Introduction 153
Site Planning 153
Roles & Responsibilities 153
Site Preparation Responsibilities 153
Procedures for Local Staff 154
Procedures for Philips Personnel 156
Monitor M8005A and M8007A Site Requirements 156
Space Requirements 156
Environmental Requirements 156
Te m p e r at u r e 15 6
Humidity 157
Altitude 157
Electrical and Safety Requirements (Customer or Philips) 157
Safety Requirements 157
Electrical Requirements 157
Remote Device Site Requirements 157
Multi-Measurement Server M3001A or Flexible Module Server M8048A 159
Space Requirements Multi-Measurement Server M3001A 159
Space Requirements Flexible Module Server M8048A 159
Environmental Requirements Multi-Measurement Server M3001A 159
Environmental Requirements Flexible Module Server M8048A 159
Cabling Options and Conduit Size Requirements 160
Remote Displays (M8031A) 161
Space Requirements 161
Environmental Requirements 161
Electrical and Safety Requirements 161
Cabling Options and Conduit Size Requirements 161
Remote Alarm Devices 163
Space Requirements 163
Cabling Options and Conduit Size Requirements 163
Remote Extension Device 163
Space Requirements 163
8
Page 9

Cabling Options and Conduit Size Requirements 163
Input Devices 164
Local Printer 164
Philips Medical LAN 164
MIB Interface 165
Flexible Nurse Call Relay Interface 165
ECG Out Interface 166
9 Anesthetic Gas Module 167
Introduction 167
Description 167
Product Structure 167
Physical Specifications 167
Environmental Specifications 168
Performance Specifications 168
CO2 Measurement 169
AWRR derived from CO2 Waveform 169
N2O Measurement 169
O2 Measurement 169
Alarm Delay: 170
Apnea Alarm: 170
INOP Alarms 170
General Measurement Principles 171
Theory of Operation 171
Main PC Board 172
Power Supply 172
Pneumatic System 172
Pump 173
Wate rt rap 174
Sample Flow Through the Pneumatic Path 174
Agent Identification Assembly 175
Measurement Principle 175
O2 Sensor 176
Specifications 176
Measurement Principle 176
Infrared Measurement Assembly 176
Installation and Patient Safety 178
Physical Installation 178
Environment 178
Label Sheet 179
Making Connections to the AGM 180
Sample Gas Connections to the Gas Exhaust 180
Returning the Gas Sample 180
Setting Up the Gas Return 181
Removing the Gas Sample 182
Setup and Configuration Procedures 182
9
Page 10

Altitude Configuration 182
Connect Sample Input Tubing 182
Preventive Maintenance (PM) Tasks 182
Post-Installation Checks 183
Safety Requirements Compliance and Considerations 183
Explanation of Symbols Used 183
Power Supply Requirements 184
Grounding the System 184
Equipotential Grounding 184
Combining Equipment 185
Checking and Calibrating the Anesthetic Gas Module 186
Access Service Functions of the M1026A Anesthetic Gas Module 186
When and how to check the Philips M1026A Anesthetic Gas Module 187
Equipment required for checking 188
Checks and adjustments 188
Performance Leakage Check 188
Performance Diagnostic Check 189
Performance Flowrate Check 189
Total Flowrate Check and Adjustment in Purge Mode 190
Measurement Path Flowrate Check and Adjustment 190
Total Flowrate Check in Normal Mode 192
Zero Calibration 192
Barometric Pressure Check and Calibration 193
Span Calibration Check 194
Disposal of Empty Calibration Gas Cylinder 197
Maintaining the Anesthetic Gas Module 198
Preventive Maintenance (PM) Tasks 198
Cleaning 198
Replace PM Parts 199
Internal Nafion Tubing with Bacterial Filters and manifold Seals 199
Room-Air Filter 200
Pump Filter 201
Performance Checks 202
Other factors to maximize uptime or reduce cost of ownership: 202
Troubleshooting the Anesthetic Gas Module 203
Compatibility Criteria for the AGM and the IntelliVue Monitors 203
Flow Charts for Communication and Measurement Type Problems 203
Hardware Related Troubleshooting Strategy 209
INOPs 210
Calibration Checks 213
Calibration Checks Troubleshooting Table 213
Diagnostic Checks 215
Problem Solving Hierarchy 215
Pneumatic System Diagnostic Checks 216
O2 Assembly Diagnostic Checks 217
Optical Path Disgnostic Checks 219
10
Page 11

IR Measurement Assembly Diagnostic Checks 220
Agent ID Assmebly Diagnostic Checks 221
Power Supply Diagnostic Checks 222
Operating Temperature Diagnostic Checks 223
Test Points, Connectors and Jumpers 223
Tes t Poi n t s 2 2 3
Connectors 224
Jumpers 225
Repairing the Anesthetic Gas Module 227
Introduction 227
The Top Cover 230
Removal 230
Replacement 230
Lifting the IR Measurement Mounting Bracket 233
Removal 233
Replacement 233
Infrared Measurement Assembly Head 235
Transferring NVRAM Data to a Replacement Head 235
Sample Cell 239
Removal 239
Replacement 239
Solenoid Valve #1 242
Removal 242
Replacement 242
Power Supply Unit 244
Removal 244
Replacement 244
Main PC Board 245
Removal 245
Replacement 246
O2 Sensor 247
Removal 247
Replacement 248
Agent Identification Head 251
Removal 251
Replacement 251
Pump 252
Removal 252
Replacement 252
Fan 253
Removal 253
Replacement 254
Solenoid Valve #2 256
Removal 256
Replacement 256
11
Page 12

Top C ov e r PC B o a rd 258
Removal 258
Replacement 258
Watertrap Manifold and Protector 259
Removal 259
Replacement 259
Power Fuses 260
Removal 260
Replacement 260
Test and Inspection Matrix 262
When to Perform Test Blocks 266
Safety Test Appendix 267
Parts List 270
Calibration Equipment 274
12
Page 13

This Service Guide contains technical details for the IntelliVue MP60 and MP70 Patient Monitor, the
Multi- Measurement Server (MMS), the Flexible Module Server (FMS) and the Measurement Server
Extensions.
This guide provides a technical foundation to support effective troubleshooting and repair. It is not a
comprehensive, in-depth explanation of the product architecture or technical implementation. It offers
enough information on the functions and operations of the monitoring systems so that engineers who
repair them are better able to understand how they work.
It covers the physiological measurements that the products provide, the Measurement Server that
acquires those measurements, and the monitoring system that displays them.
Who Should Use This Guide
1
1Introduction
This guide is for biomedical engineers or technicians responsible for troubleshooting, repairing, and
maintaining Philips’ patient monitoring systems.
How to Use This Guide
This guide is divided into eight sections. Navigate through the table of contents at the left of the screen
to select the desired topic. Links to other relevant sections are also provided within the individual
topics. In addition, scrolling through the topics with the page up and page down keys is also possible.
Abbreviations
Abbreviations used throughout this guide are:
Name Abbreviation
IntelliVue MP60/MP70 Patient Monitor the monitor
Flexible Module Server FMS
Multi-Measurement Server MMS
13
Page 14

1 Introduction Responsibility of the Manufacturer
Responsibility of the Manufacturer
Philips only considers itself responsible for any effects on safety, reliability and performance of the
equipment if:
• assembly operations, extensions, re-adjustments, modifications or repairs are carried out by persons
authorized by Philips, and
• the electrical installation of the relevant room complies with national standards, and
• the instrument is used in accordance with the instructions for use.
To ensure safety, use only those Philips parts and accessories specified for use with the monitor. If nonPhilips parts are used, Philips is not liable for any damage that these parts may cause to the equipment.
This document contains proprietary information which is protected by copyright. All Rights Reserved.
Reproduction, adaptation, or translation without prior written permission is prohibited, except as
allowed under the copyright laws.
Philips Medizinsysteme Böblingen GmbH
Hewlett-Packard Str. 2
71034 Böblingen, Germany
The information contained in this document is subject to change without notice.
Philips makes no warranty of any kind with regard to this material, including, but not limited to, the
implied warranties or merchantability and fitness for a particular purpose.
Philips shall not be liable for errors contained herein or for incidental or consequential damages in
connection with the furnishing, performance, or use of this material.
Passwords
In order to access different modes within the monitor a password may be required. The passwords are
listed below.
Monitoring Mode: No password required
Configuration Mode: 71034
Demo Mode: 14432
Service Mode: 1345
Consult the configuration guide before making any changes to the monitor configuration.
14
Page 15
2Theory of Operation
Integrated Monitor Theory of Operation
The IntelliVue Patient Monitor:
• displays real-time data
• controlls the attached measurement servers
• alarms in the case of patient or equipment problems
• offers limited data storage and retrieval (trending)
• interfaces to the Philips Clinical Network and other equipment
A monitor with just a single integrated measurement server can be connected to additional building
blocks to form a monitoring system with a large number of measurements, additional interface
capabilities and multiple slave displays. These elements cooperate as one single integrated real-time
measurement system.
2
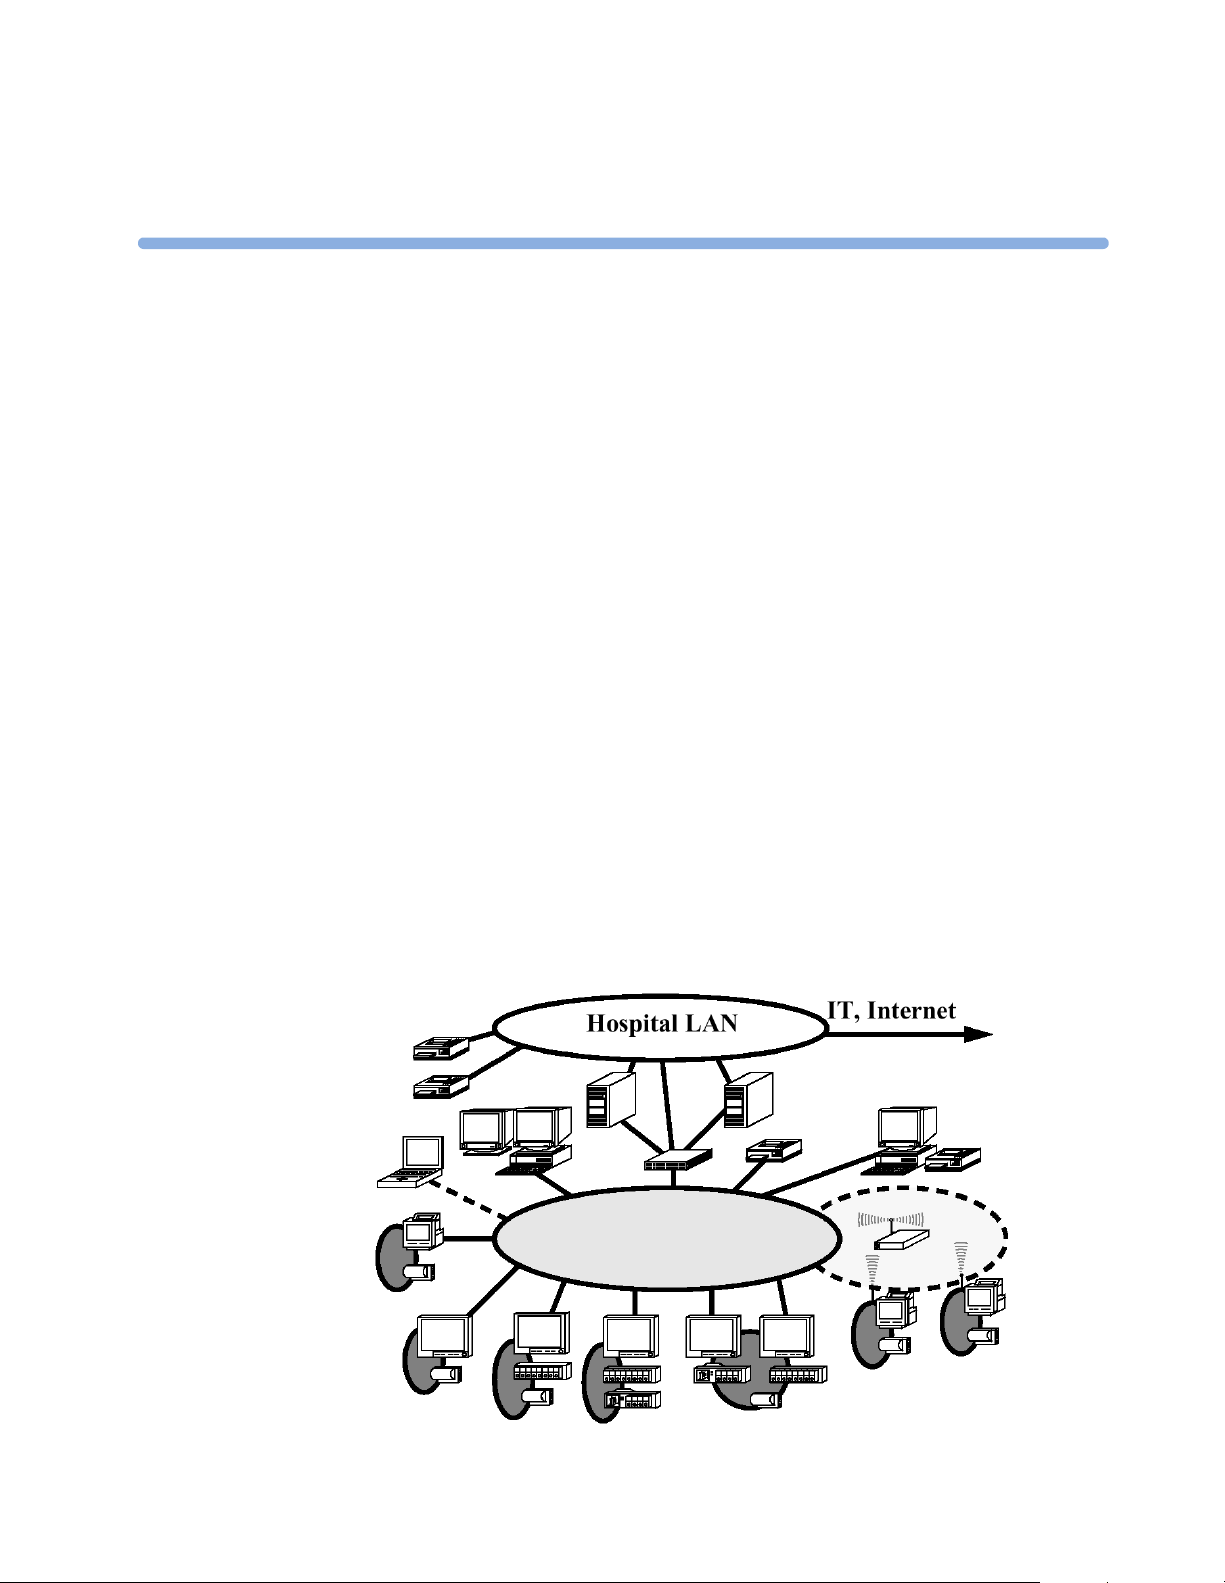
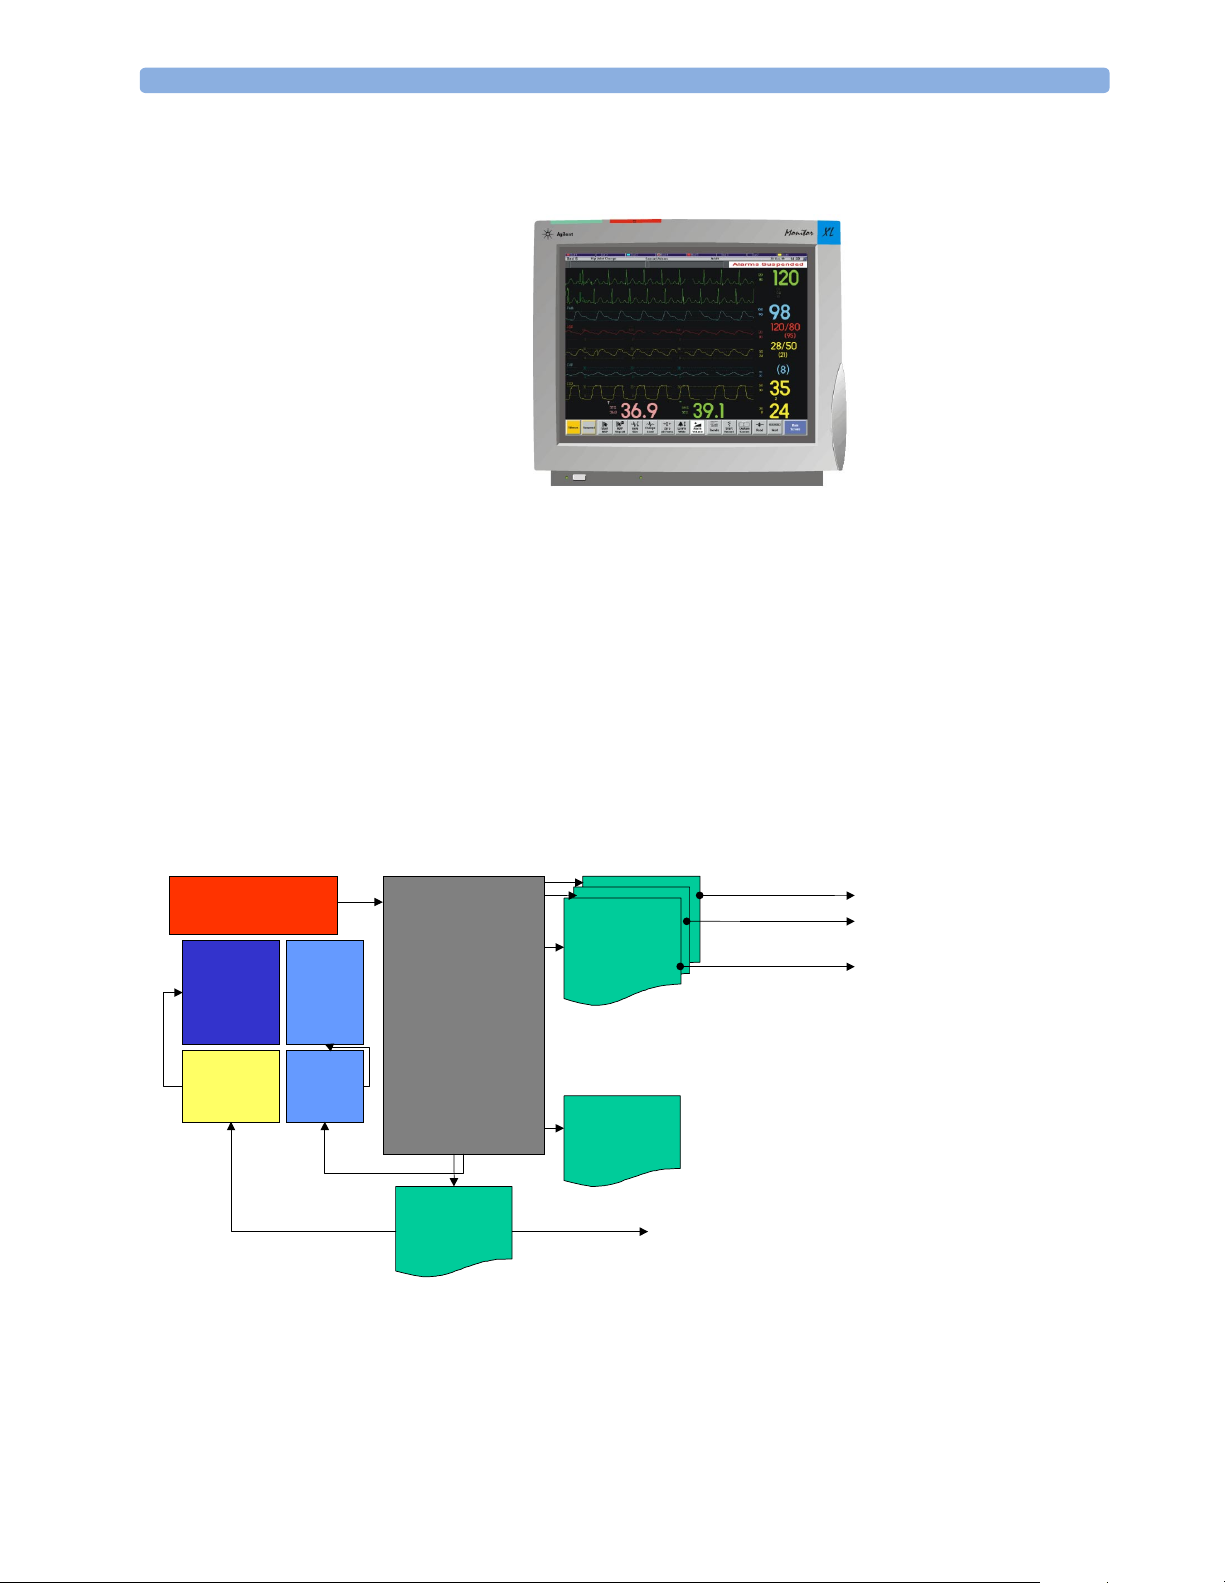
System Boundaries
The following diagram discusses specific boundaries within the overall system with respect to their
openness and real-time requirements:
Philips Clinical Network
15
Page 16
2 Theory of Operation Integrated Monitor Theory of Operation
Measurement LAN
combines components of one patient monitor;
real time requirements across all interconnected
elements
Philips Clinical Network (wired LAN)
connects multiple patient monitors,
information centers, application servers; closed
system, only Philips qualified products (tested
and with regulatory approval) are connected,
Philips is responsible for guaranteed real-time
functionality and performance
Philips Clinical Network (wireless)
like Philips Clinical Network (wired) LAN,
however due to current wireless technologies
available it has reduced bandwidth, longer
latencies, reduced functionality
Hospital LAN, Internet
Standard Network, not under Philips control,
no guaranteed service, no real-time
requirements
16
Page 17
Integrated Monitor Theory of Operation 2 Theory of Operation
Hardware Building Blocks
The following hardware building blocks make up the monitoring system:
IntelliVue MP60
The MP60 monitor:
• integrates the display and processing unit into a single package
• uses a 15” TFT XGA Color display
• uses the Philips SpeedPoint as primary input device; computer devices such as mice, trackball, and
keyboard can be added optionally
• has an optional recorder
• supports the Flexible Module Server (FMS)
Building Blocks:
Power Supply
LCD
Assembly
LCD
Adapter
Main Board
I/F
Boards
MSL
I/F
|| I/F To Local Printer
PS/2 To SpeedPoint
MIB To AGM
Video I/F
Board
To Ext. Display
ECG Out
17
Page 18
2 Theory of Operation Integrated Monitor Theory of Operation
IntelliVue MP70
The MP70 monitor:
• integrates the display and processing unit into a single package,
• uses a 15” TFT XGA Color display
• uses the Philips Touchscreen as primary input device, whereas the Philips SpeedPoint and computer
devices such as mice, trackball, and keyboard can be added optionally
• has an optional recorder
• supports the Flexible Module Server (FMS)
Building Blocks:
Power Supply
LCD
Assembly
LCD
Adapter
Touch
Panel
Touch
Controller
Main Board
Video I/F
Board
I/F
Boards
MSL
I/F
To Ext. Display
|| I/F To Local Printer
PS/2 To External input devices
MIB To AGM
18
Page 19
Integrated Monitor Theory of Operation 2 Theory of Operation
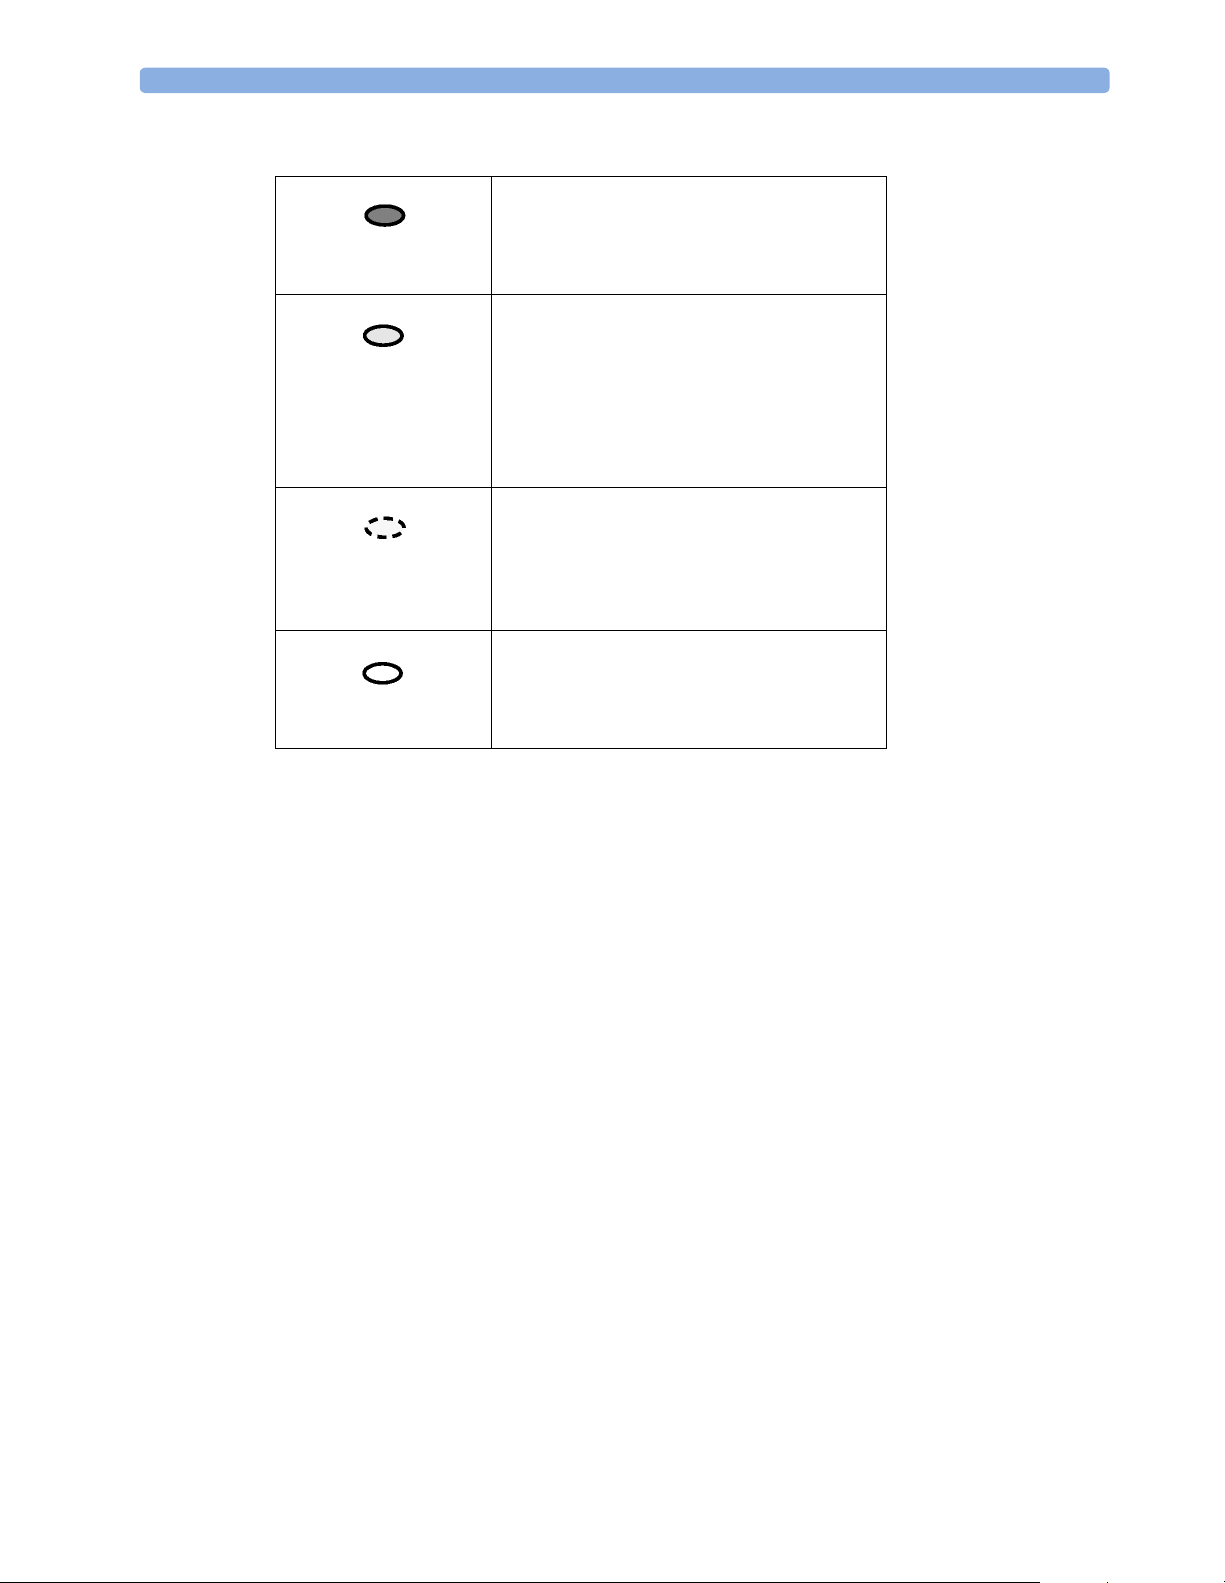
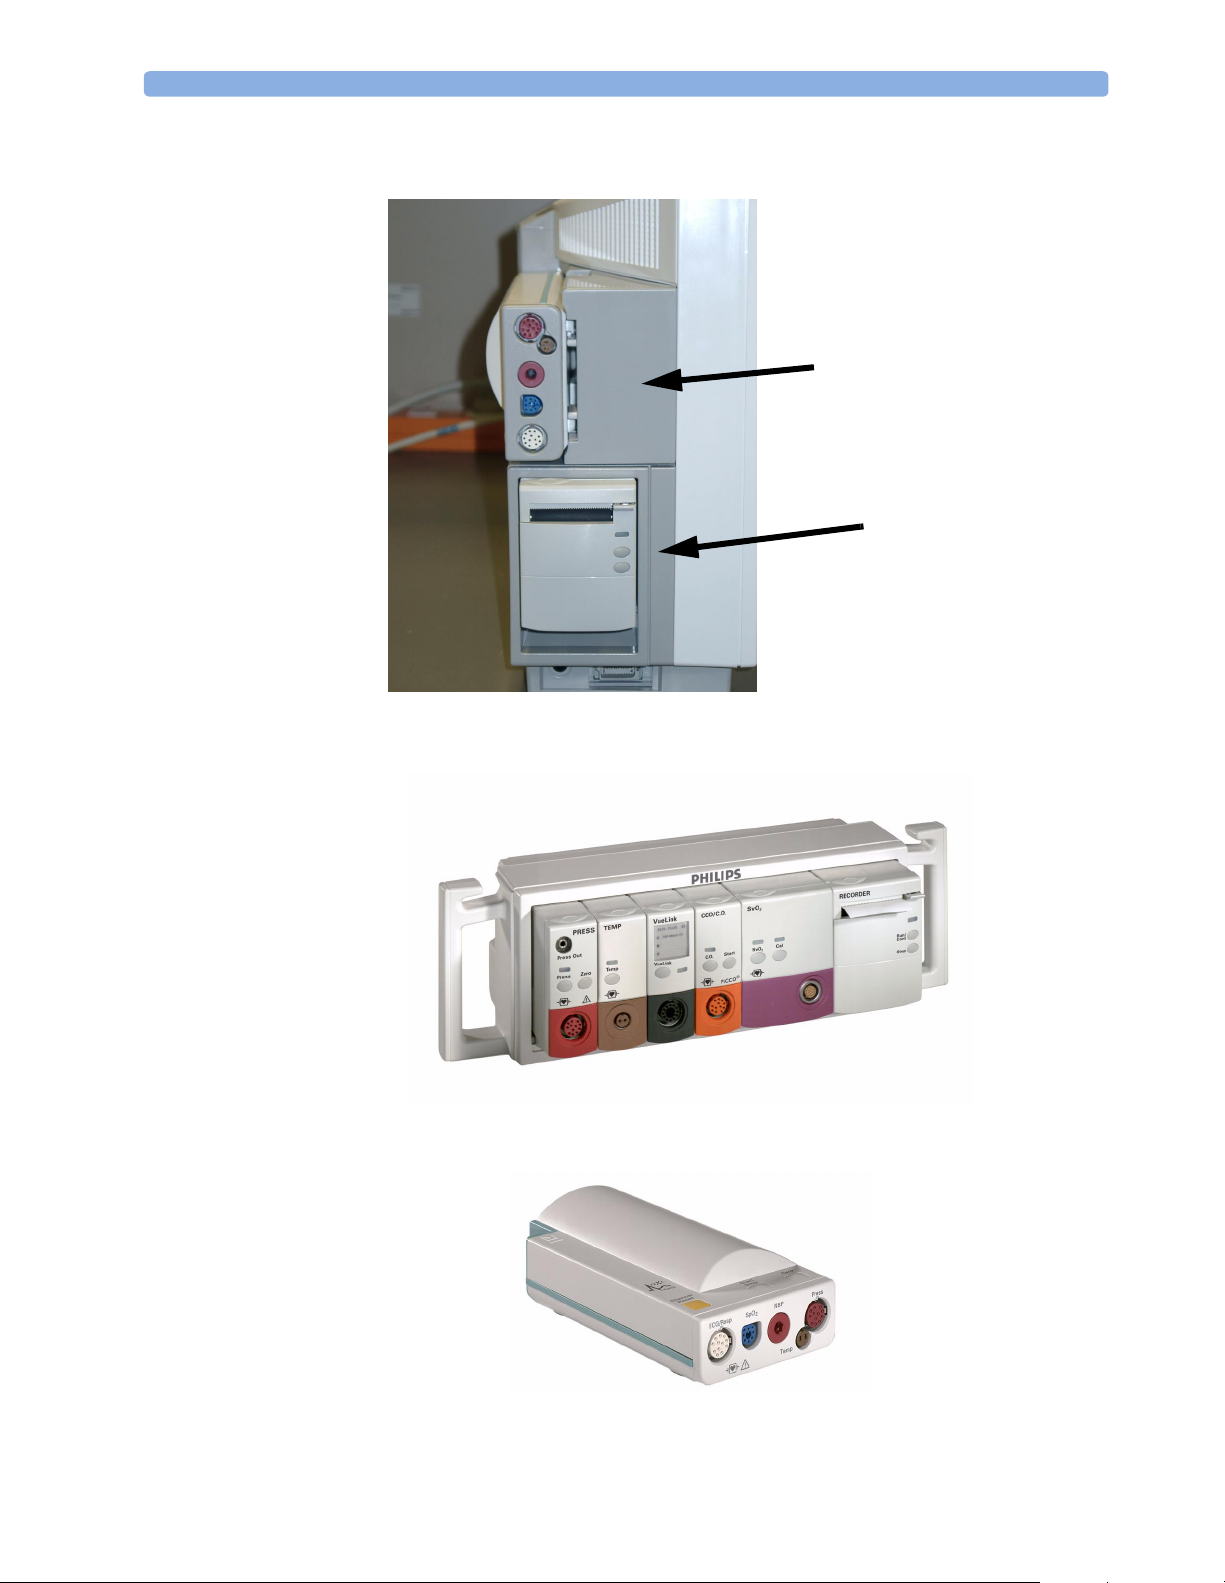
Optional Hardware
A measurement server mount and /or an integrated module slot can be ordered optionally.
Measurement Server
Mount
Integrated
Module Slot
Compatible Devices
Figure 1 M8048A Flexible Module Server (FMS)
Figure 2 M3001A Multi-Measurement Server (MMS)
19
Page 20
2 Theory of Operation Integrated Monitor Theory of Operation
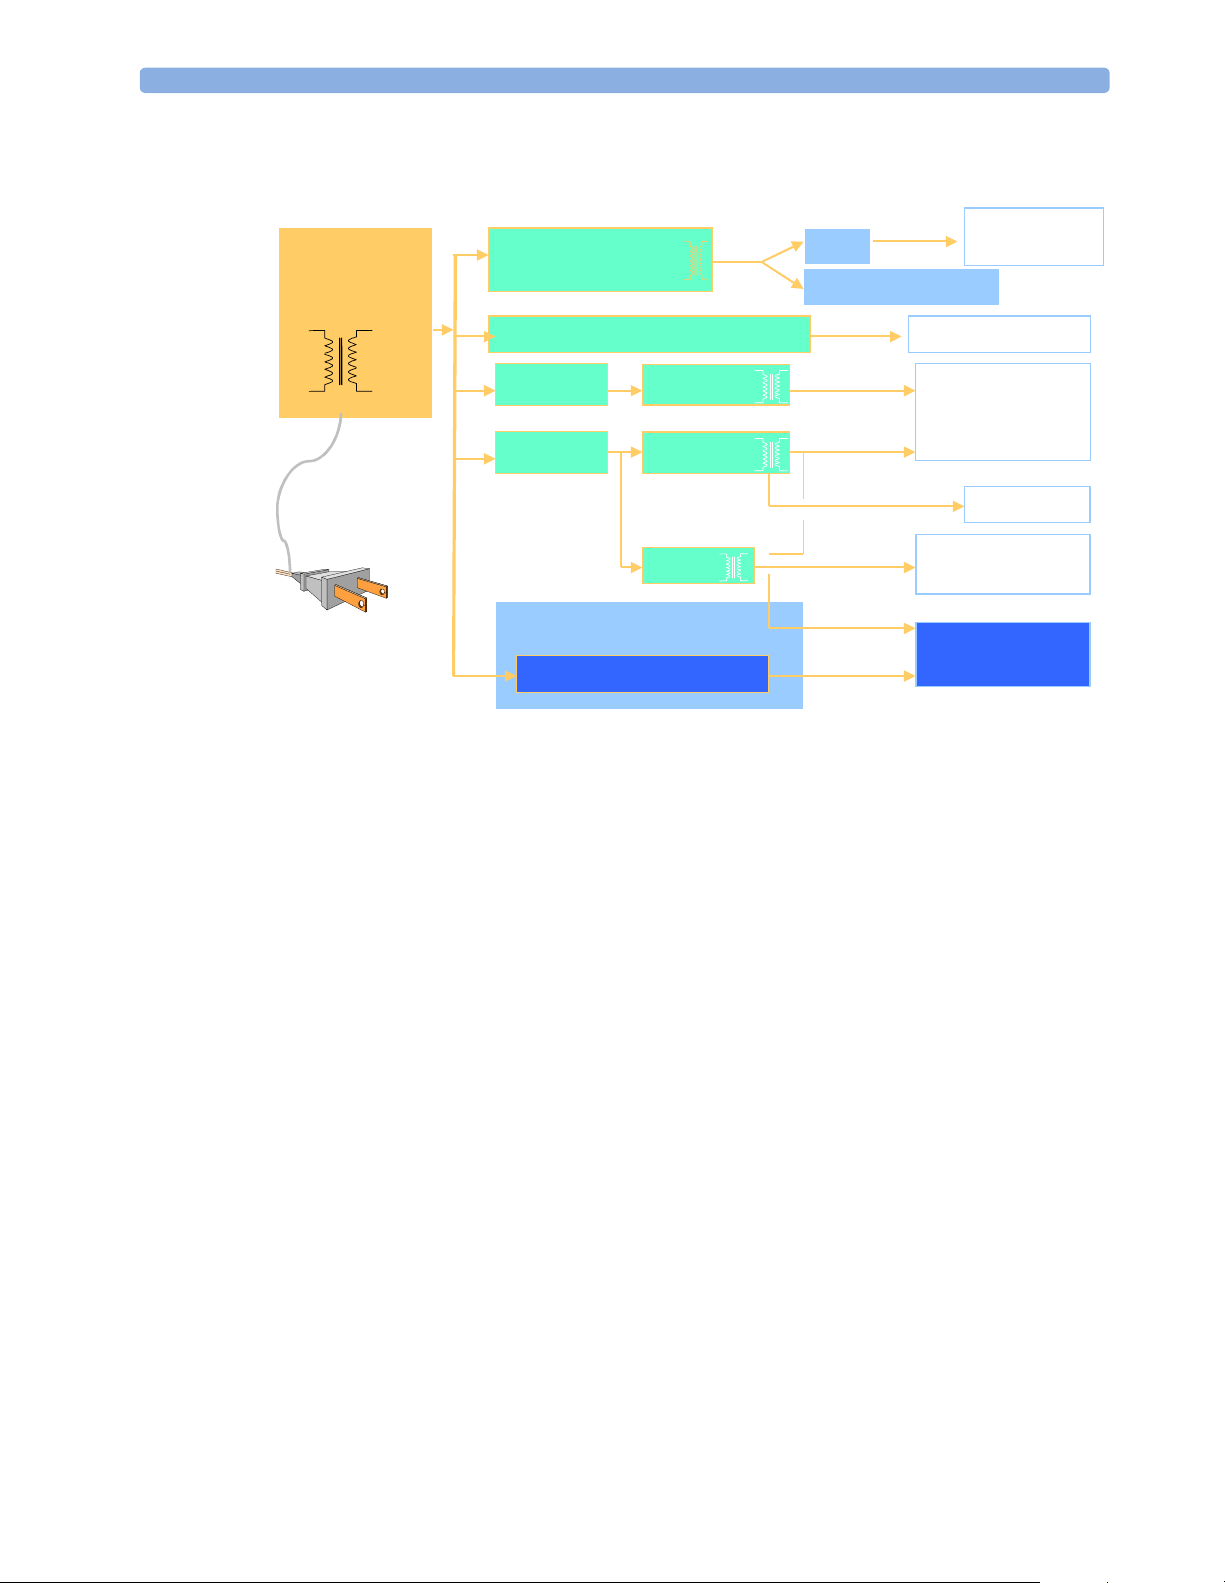
Power Supply
Front End
Modules
Backlight
AC/DC
48V /120W
Isolating DC/DC
56 V
Converter
Backlight DC/DC Converter
DC/DC
DC/DC
5 V,
FMS
60V
MMS, MMS-EXT
12 V
3.3 V
CPU
5 V
DC/DC
DC Bus
Integrated Module Rack
DC/DC Converter
Figure 3 Power Supply Architecture
The AC/DC converter transforms the AC power coming from the power plug into 48 V/120W DC
source and isolates the monitoring system from the AC power mains.The 48V is distributed via power
bus and supplies power to all the components of the system: The 56 V DC power needed for the FMS,
MMS and measurement server extension is created by an isolating DC/DC converter. The power
needed for the backlights is converted to 12V DC by the backlight DC/DC converter. The CPU is
supplied with 3.3 V and 5 V DC power. The transformation is performed in two steps: The first DC/
DC converter is a power regulator which reduces the variations caused by load changes on the 48V
power bus. The second DC/DC converter converts the power to the needed voltage. Interface boards
require a power of 10V DC. The HIF board and the LEDs are supplied with 12V DC unregulated
power. The integrated module slot requires a 5 V supply for the modules slots and uses the 48V and
another DC/DC converter to create 60 V in order to supply power for the modules.
DC/DC
DC/DC
10 V AC
)
12 V
)
unreg
I/F boards
HIF, LED’s,
wireless
5 V
Front End
60 V
Modules
CPU Boards
20
The CPU boards have an MPC860 50 MHz processor that provides a number of on-chip,
configurable interfaces. An array of 12 fast UARTS with configurable protocol options are
implemented in an ASIC (along with other system functions such as independent watchdogs etc.),
providing interfacing capabilities to measurement modules and I/O boards. The serial interfaces can
easily be electrically isolated. The main board contains additional video hardware.
Page 21

Integrated Monitor Theory of Operation 2 Theory of Operation
Flexible Module Server
&38
%DQNRI,2V
0RGXOHV
The CPUs provide two LAN interfaces to interconnect CPUs (via the Internal LAN) or to connect to
the Philips Clinical Network.
The CPU capabilities are identical. Different loading options are coded on serial EEPROMs to support
the automatic configuration of the operating system at boot time.
IntelliVue Patient Monitor Multi-Measurement Server
&38 9LGHR
%DQNRI,2V
&38
%DQNRI,2V
0HDVXUHPHQW
,QWHUIDFHV
$FTXLVLWLRQ
21
Page 22

2 Theory of Operation Integrated Monitor Theory of Operation
I/O Boards
Interfaces to the monitor are implemented via I/O boards. The location of these boards is restricted by
general rules. The I/O slot designations diagram and the I/O matrix which outline the I/O board
placement rules can be found in the Installation Instructions section.
The following is a list of Interface (I/O) boards which may be present in your monitor, depending on
your purchased configuration:
• MSL
• Video (analog)
• Philips Clinical Network (LAN)
• PS/2
• MIB/RS232
• Flexible Nurse Call
• Parallel printer
• Remote devices (Remote Alarm Device, Remote Extension Device)
The specifications for the above listed interfaces can be found in the technical data sheet for the
monitor and in the Specifications chapter of the Instructions for Use.
22
Page 23

Integrated Monitor Theory of Operation 2 Theory of Operation
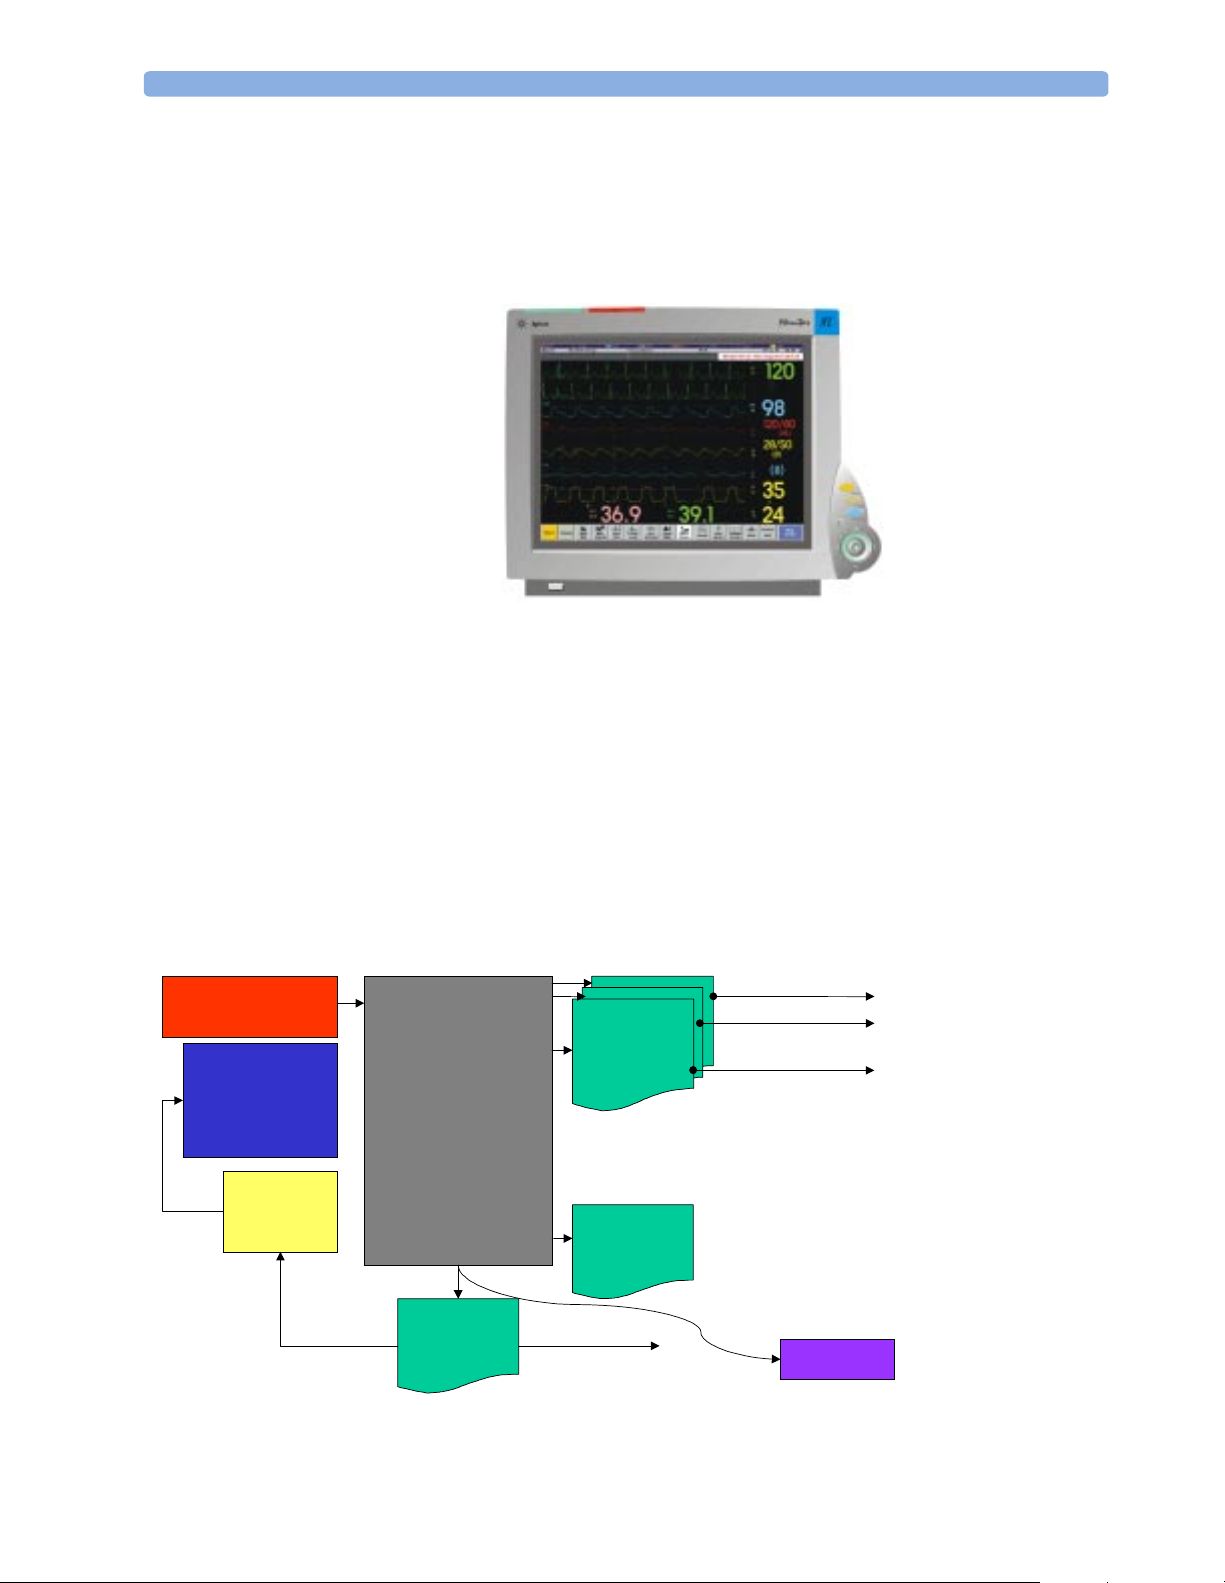
Data Flow
The following diagram shows how data is passed through the monitoring system. The individual stages
of data flow are explained below.
Display
and User
Interface
Data
Acquisition
Data
Provider
Service
Applications
Data Acquisition
Monitoring data (for example patient measurement data in the form of waves, numerics and alerts) is
acquired from a variety of sources:
• Measurement Servers
The Measurement Servers connected to the internal LAN convert patient signals to digital data and
apply measurement algorithms to analyze the signals.
• External measurement devices
Data can be also acquired from devices connected to interface boards of the monitor. Software
modules dedicated to such specific devices convert the data received from an external device to the
format used internally. This applies to parameter modules and the Anesthetic Gas Module
• Server systems on the Philips Clinical Network
To enable networked applications such as the other bed overview, data can be acquired from server
systems attached to the Philips Clinical Network, for example a Philips Information Center
Persistent
Data
Storage
Data
Output
Data Provider System Service
All data that is acquired from measurement servers or external measurement devices is temporarily
stored by a dedicated data provider system service. All monitor applications use this central service to
access the data in a consistent and synchronized way rather than talking to the interfaces directly.
This service makes the applications independent of the actual type of data acquisition device.
23
Page 24

2 Theory of Operation Integrated Monitor Theory of Operation
The amount of data stored in the data provider system service varies for the different data types. for
example several seconds of wave forms and the full set of current numerical values are temorarily stored
in RAM.
Persistent Data Storage System Service
Some applications require storage of data over longer periods of time. They can use the persistent data
storage system service. Dependent on the application requirements, this service can store data either in
battery backed-up (buffered) memory or in flash memory. The buffered memory will lose its contents
if the monitor is without power (not connected to mains) for an extended period of time. The flash
memory does not lose its contents.
The trend application for example stores vital signs data in a combination of flash memory and
buffered memory, while the system configuration information (profiles) is kept purely in flash
memory.
Display and User Interface Service
Applications can use high level commands to display monitoring data or status and command windows
on the internal LCD panel. These commands are interpreted by the display manager application. This
application controls the dedicated video hardware which includes video memory and a special ASIC.
User input is acquired from a variety of input devices, for example the SpeedPoint, the touchscreen or
other standard input devices (keyboard, mouse) which may be attached to I/O boards. The system
software makes sure that the user input is directed to the application which has the operating focus.
Data Output
The monitoring system is very flexible and customizable regarding its data output devices. Built-in
devices (for example LAN, alarm lamps, speaker, video) provide the basic output capabilities.
These capabilities can be enhanced by adding additional I/O boards, as required in the specific enduser setup. The additional I/O boards typically provide data to externally attached devices, for example
to printers, RS232 based data collection devices, nurse call systems etc.
The monitor can identify I/O boards by means of a serial EEPROM device that stores type and version
information. The operating system detects the cards and automatically connects the I/O board with the
associated (interface driver) application. For some multi- purpose cards it is necessary to configure the
card for a particular purpose first (for example the dual MIB/RS232 card can support external touch
display, data import, data export).
Monitor Applications
The monitor applications provide additional system functionality over the basic measurement and
monitoring capabilities. This includes for example trending, report generating, event storage or derived
measurements.
In general, the monitor applications use the data provider system service to access the measurement
data. Application interfaces to the other system services allow the application to visualize data, to store
data over extended periods of time or to output data to other devices.
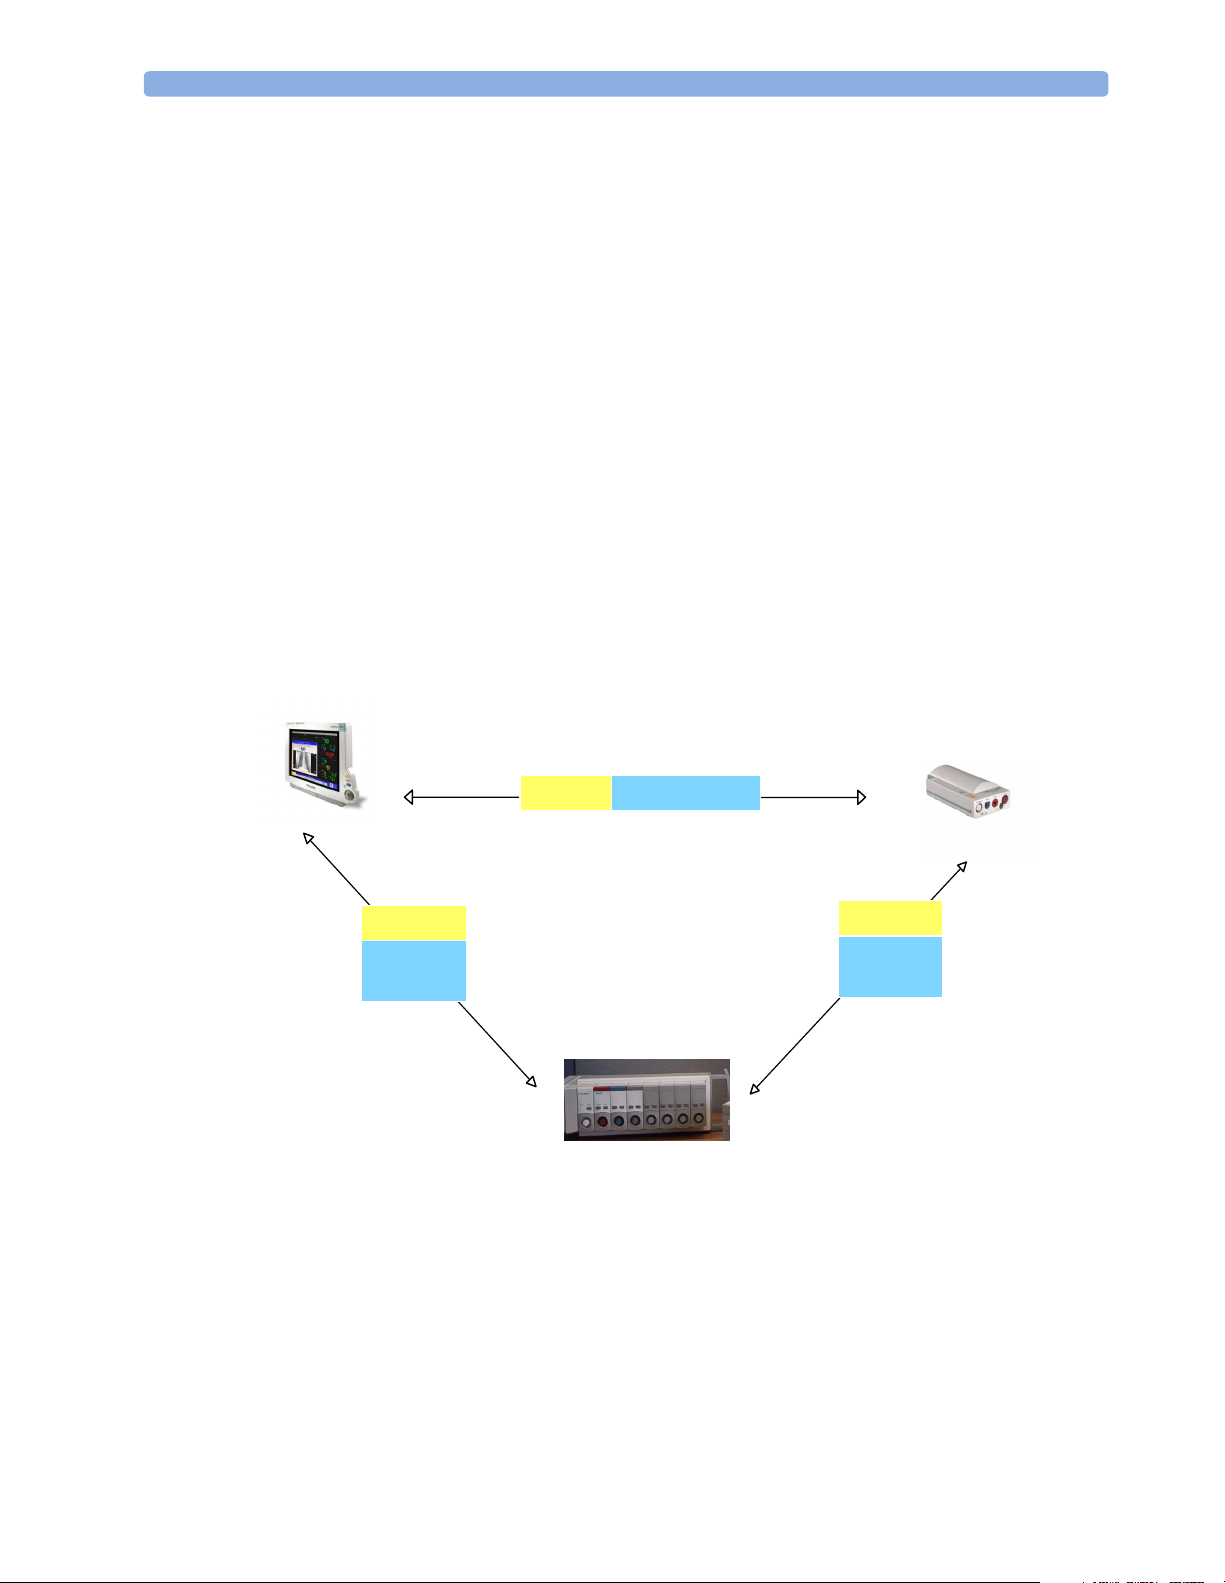
Internal LAN (Measurement Server Link)
All components of the monitoring system (including measurement servers and CPUs in the monitor)
communicate using an IEEE802.3/ Ethernet LAN in the Measurement Server Link (MSL). This
network is used to distribute data between the components, for example:
24
Page 25
Integrated Monitor Theory of Operation 2 Theory of Operation
• Digitized patient signals including wave data, numerical data and status information (typically from
the measurement server to a display unit)
• Control data representing user interactions (typically from the display unit to a measurement server)
• Shared data structures, for example representing patient demographical data and global
configuration items
The internal LAN allows plug and play configuration of the monitoring system. The system
automatically detects plugging or unplugging of measurement servers and configures the system
accordingly.
The components on the internal LAN are time- synchronized to keep signal data consistent in the
system. Dedicated hardware support for synchronization eliminates any latency of the network driver
software.
The integrated LAN provides deterministic bandwidth allocation/ reservation mechanisms so that the
real-time characteristic of signal data and control data exchange is guaranteed. This applies to the data
flow from the measurement server to the monitor (for example measurement signal data) and the data
flow from the monitor to a measurement server (for example to feed data to a recorder module).
Integrated communication hubs in the monitor and the FMS allow flexible cabling options (star
topology, daisy chaining of servers).
MDSE
Internal
LAN
MDSE Internal LAN
MDSE
Internal
LAN
25
Page 26

2 Theory of Operation Integrated Monitor Theory of Operation
Philips Clinical Network
The monitoring system may be connected to the Philips Clinical Network, for example to provide
central monitoring capabilities or other network services. This connection may be through a normal
wired connection or through a wireless connection.
The monitor supports the connection of an external off-the-shelf wireless adapter. This allows a simple
field upgrade as well as a technology upgrade in the future. Switching between wired and wireless
networks is automatically triggered by the plugging or unplugging of the network cable.
The Philips Clinical Network protocols function very similarly to the protocols used on the internal
LAN.
After configuration, the monitoring system sends the digitized patient signals including wave data,
numerical data and status information onto the network. Control data representing user interactions
can be exchanged between the monitoring system and a central station bi-directionally.
Additional protocols are supported for networked applications, for example for the other bed overview
function, which allows viewing of monitoring data from other patients on the network.
For plug and play operation, the monitoring system uses the standard BootP protocol to automatically
acquire a network address.
How does the Support Tool Work with the Monitor
The support tool is an NT application typically installed on the laptop of a customer engineer or a
biomedical engineer working in the customer’s own service department.
The purpose of the support tool is to upgrade, configure and diagnose all monitoring components
(modules, measurement servers, and monitors) in the system over the network. The monitors route
network traffic between the Philips Clinical Network to the internal LAN.
The service protocol developed for this purpose uses a raw access to the devices without the need for IP
addresses etc. over a standard customer network installation, so that even defective devices can be
upgraded as long as the few kBytes of initial boot code are working. The boot code itself can also be
upgraded using the same protocol.
The tool allows access to internal service information and to serial numbers. It can be remotecontrolled, for example via a dial-up connection from a response center, provided the proper
infrastructure is in place.
For details see the Instructions for Use for the Support Tool.
26
Page 27
Integrated Monitor Theory of Operation 2 Theory of Operation
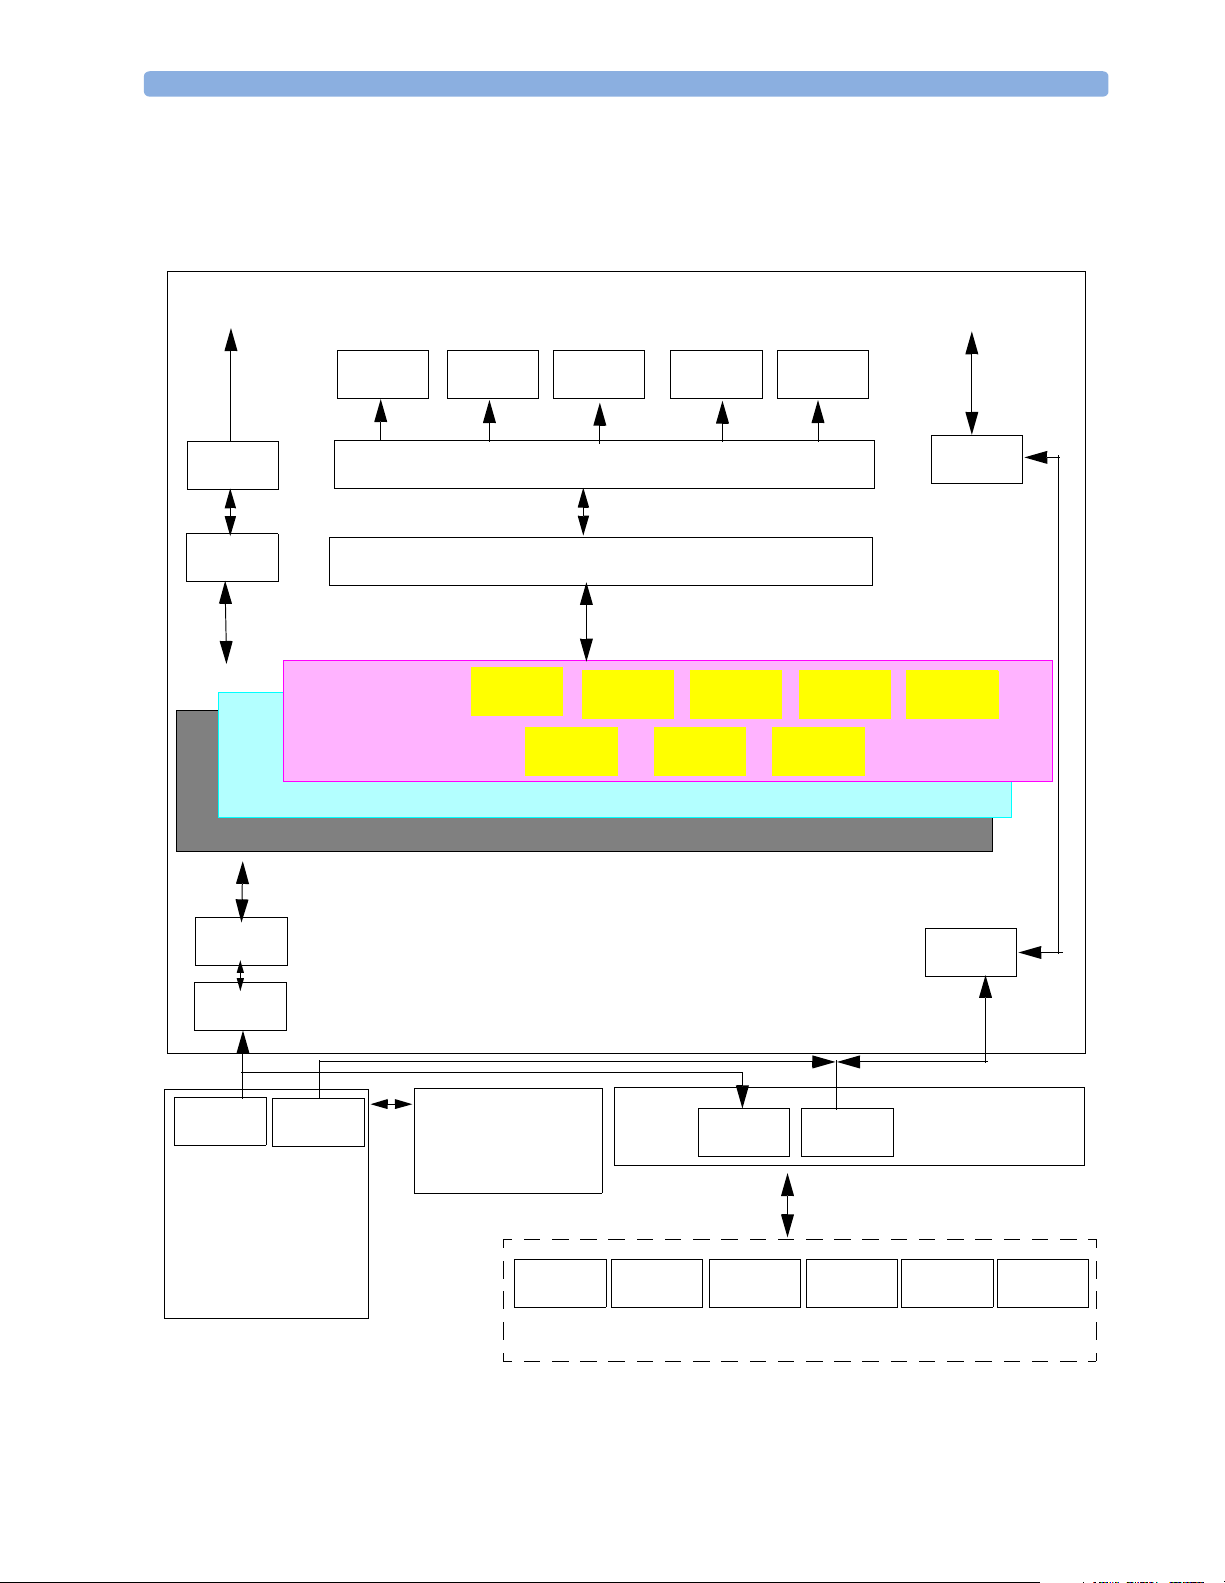
Monitor Software Block Diagram
Figure 4 shows the functional block diagram for the monitoring system. A legend explaining terms and
diagram elements follows. The information below varies depending on the purchased monitor options.
Philips Clinical
Network
LAN
MDSE
Video Out
Indicators
Color LCD
Display
Applications
System Services
Real Time Operating System
Visual
LEDs
Audio
Indicators
Loudspeaker Touch
Input Devices
(including PS/2)
Trim Knob
Interfaces
Interface Managers
Record Alarm Trend HiRes ADT
Reports
Calc Param
Events
ECG-Out
Marker-In
ECG-Out
Marker-In
MDSE
LAN
LAN
RS-422
M3001A MultiMeasurement Server
12-lead ECG/Resp, NBP, SpO2,
Press/Temp
Figure 4 IntelliVue Patient Monitoring System Functional Block Diagram
M3015/16A
Measurement Server
Extension
CO2, Press/Temp
M1006B
Press
Plug-In Modules
M1012A
C.O.
LAN RS-422
M1018A
tcPO2/CO2
M1029A
Temp
RS-422
Flexible
Module
Server
M1032A
VueLink
M1116B
Recorder
27
Page 28

2 Theory of Operation Integrated Monitor Theory of Operation
Block Diagram Legend
Functional Block Description
Services
Operating System The Operating System (OS) provides a layer of isolation between
the specific hardware implementation and the application
software. The OS performs system checks and allocates resources
to ensure safe operation when the system is first started. This
includes internal self-tests on several hardware modules and
configuration checks for validity of configuration with the
operating software. During normal operation, the OS continues
to run checks on system integrity. If error conditions are detected
the OS will halt monitoring operations and inform the operator
about the error condition.
System Services The System Services provide generic common system services.
In particular:
It uses a real-time clock component to track time. It synchronizes
to network time sources and verifies the accuracy of the system
time information. It is also responsible for managing persistent
user configuration data for all Measurement Servers, Flexible
Module Servers and IntelliVue Patient Monitoring System
software modules. User configuration data is stored in a nonvolatile read/write storage device
Applications
Reports The Reports Service retrieves current and stored physiological
data and status data to format reports for printing paper
documentation. The following reports are supported:
• Vital Signs Report
• Graphical Trend Report
• Event Review Report
• Event Episode Report
• ECG Report (12 Lead/Multi-Lead)
• Cardiac Output Report
• Calculations Report (Hemodynamic/Oxygenation/
Ventilation)
• Calculations Review Report
• Wedge R eport
• Tes t Re p or t
• Other reports (e.g. Loops, Review Applications, Drug
report)
The Reports service generates report data which can be printed
on a local or a central printer.
28
Page 29

Integrated Monitor Theory of Operation 2 Theory of Operation
Functional Block Description
Record The Record Service retrieves current and stored physiological
data and status data to format a continuous strip recording. A
recording can be triggered manually by the operator or
automatically by an alarm condition. The Record Service uses the
services of the Recorder Interface to control an M1116B
Recorder in the FMS. The Record Service can also send data to a
central recorder.
Alarm The Alarm Service contains logic that prioritizes alarm conditions
that are generated either by the Measurement Servers, Flexible
Module Server, or by IntelliVue Patient Monitoring System
software modules. Visual alarm signals (messages) are displayed at
the top of the IntelliVue Patient Monitoring System display and
alarm sounds are generated by a loudspeaker. Alarm conditions
may be generated when a physiological parameter exceeds
preselected alarm limits or when a physiological parameter or any
other software module reports an inoperative status (technical
alarm, for example, the ECG leads may have fallen off the
patient). The Alarm service manages the alarm inactivation states,
for example suspension of alarms, silencing of alarms, and alarm
reminder. Alarm signals may also be configured as latching
(alarm signals are issued until they are acknowledged by the
operator, even when the alarm condition is no longer true). The
Alarm service controls the visual alarm signals (alarm lamps).
Trend The Trend service stores the sample values of physiological data
and status data with a resolution of 12 seconds, 1 minute or 5
minutes for a period of up to 48 hours. The data is kept in
battery buffered read/write storage and flash memory devices to
be preserved across power failures. The stored data is protected
via consistency checks and checksums. When a new patient is
admitted, the trend database erases all data of the previous
patient.
HiRes The OxyCRG (Oxygen CardioRespiroGram) service derives a
high-resolution trend graph from the Beat-to-Beat Heart Rate,
or tcpO2, and Respiration physiological data. The
SpO
2
OxyCRG is specialized for neonatal applications, allowing the
opeartor to identify sudden drops in Heart Rate (Bradycardia)
and SpO
or tcpO2 (Desaturations), and supporting the operator
2
in visualizing Apnea situations.
ADT The ADT (Admit/Discharge/Transmit) service maintains the
patient demographics information. The operator may admit a
new patient, discharge the old patient and enter or modify the
patient demographics. The ADT service also supports the
transport of a patient (trend database) with the M3001A MultiMeasurement Server. The ADT service controls the deletion of
old patient data, the upload of trend data from the M3001A and
the switching back of all settings to user defaults. It also
synchronizes patient information with a central station on the
network.
29
Page 30

2 Theory of Operation Integrated Monitor Theory of Operation
Functional Block Description
Calc Param The Calc Param (Calculated Parameters) service accesses current,
stored and manually entered physiological data as input to
calculation formulas. With these formulas, derived
hemodynamic, oxygenation and ventilation variables are
computed. The calculation results, including the input
parameters, are stored for later review using the Trend service.
Interface Managers
MDSE The MDSE (Medical Data Service Element) Interface Manager is
responsible for the exchange of real-time data between the
IntelliVue Patient Monitoring System display unit and the
Measurement Servers and Flexible Module Server as well as
between the IntelliVue Patient Monitoring System display unit
and other devices attached to the network. MDSE establishes and
maintains a data communication link between the devices. It
provides configuration information about the remote device to
applications in the local device and it allows the exchange of
measurement data and status information between the devices.
Printer The Printer Interface Manager provides a high level interface to a
printer. It provides means to:
• establish a connection to the printer
• transfer data to the printer
• get status of the printer
• close connection to the printer
The Printer Interface Manager also supervises the connection to
the printer and whether the printer accepts data (for example
paper out). The Printer Interface Manager notifies the operator
in such cases.
30
Page 31

Integrated Monitor Theory of Operation 2 Theory of Operation
Functional Block Description
Display & Operator Interface The Display and Operator Interface Manager performs the
following tasks:
• Screen presentation of real-time and stored physiological
measurement data, alarm condition data and status
information received from the MDSE interface manager,
the Alarm service or other IntelliVue Patient Monitoring
System modules
• Screen presentation of operating controls (control
windows)
• Processing of operating control commands received from
HIF Control interface. The module verifies and interprets
the received commands and forwards them to other
software modules of the IntelliVue Patient Monitoring
System display unit, Measurement Servers or Flexible
Module Server
• Sound generation (issues audible alarm signals and
generates audible information signals, for example QRS
and SpO
Interfaces
LAN The LAN interface implements the physical layer of IEEE 802.3.
The LAN interface performs Manchester encoding/decoding,
receive clock recovery, transmit pulse shaping, jabber, link
integrity testing, reverse polarity detection/correction, electrical
isolation, and ESD protection. Electronically separated interfaces
are used for communication to the Measurement Servers or
Flexible Module Server and to the network.
Centronics The Centronics interface implements the standard signaling
method for bi-directional parallel peripheral devices according to
IEEE 1284-I. The interface is used as a parallel interface to a
standard printer with electrical isolation and ESD protection.
Display Controller The Display Controller Interface consists of a video controller
chip, video RAM and the controlling software. The Display
Controller interface processes the high level display commands
(character and graphic generation, wave drawing) and translates
them into pixels, which are written into the video RAM where
the video controller chip generates the video synchronization
signals and the pixel stream for the Color LCD Display.
HIF Control The HIF (Human Interface Control) interface scans the Human
Interface devices for operator controls (Touch Screen, Trim
Knob, and PS/2 devices), formats the collected data and sends it
to the display and Operating Interface.
tones, operator audible feedback)
2
31
Page 32

2 Theory of Operation Integrated Monitor Theory of Operation
Functional Block Description
ECG-Out Marker-In The ECG Out/Marker In interface receives the ECG waveform
directly from the ECG/Resp Arrhythmia ST-Segment
physiological algorithm via an RS-422 serial interface and
converts the digital ECG signal to an analog ECG signal. In
addition, the ECG Out controller receives from a connected
device the marker information and forwards this data to the
ECG/Resp Arrhythmia ST-Segment physiological algorithm.
The converted analog signal is used to synchronize a connected
device to the patient’s ECG
RS-422 The serial link RS-422 interface communicates the ECG signal
to the ECG Output/Marker In of the IntelliVue Patient
Monitoring System display unit. The interface is a serial,
differential, full-duplex link. The interface is ESD protected.
PS/2 The PS/2 interface supports the serial protocol of standard PS/2
devices (mouse). The PS/2 serial protocol is interpreted by the
HIF Control interface.
32
Page 33

3Testing and Maintenance
Concepts
This chapter provides a checklist of the testing and maintenance procedures for the monitor, the MMS
the Measurement Server Extensions and the FMS associated modules.
Preventive Maintenance refers specifically to the series of tests required to make sure the Instrument
measurement results are accurate. The measurements requiring these reported tests are NBP and
sidestream CO
readings are in question or as specified.
. The accuracy and performance procedures are designed to be completed when
2
Test Reporting
Authorized Philips personnel report test results back to Philips to add to the product development
database. Hospital personnel, however, do not need to report results. This table shows you what to
record on the service record after completing the tests in this chapter.
3
Test What to record
Visual V:P or V:F
Power On PO:P or PO:F
P NIBP PN:P/X1/X2/X3/X4 or
PN:F/X1/X2/X3/X4
P CO
2
Safety S(1):P/x1/x2 or
Where P = Pass, F = Fail and X/x are the measured values as defined in the tests described in this
chapter.
PCO2:P/X1/X2/X3/X4/X5/X6/X7/X8 or
PCO2:F/X1/X2/X3/X4/X5/X6/X7/X8
S(1):F/x1/x2
S(2): P/x1 or
S(2): F/x1
S(3): P/x1 or
S(3): F/x1
33
Page 34

3 Testing and Maintenance Recommended Frequency
Recommended Frequency
The testing checklist appears in the next section of this chapter. Perform the procedures as indicated in
the suggested testing timetable. These timetable recommendations do not supersede local
requirements.
Suggested Testing Timetable Frequency
Preventive Maintenance Tests
• NBP Calibration
• Sidestream CO
• CO
pump / CO2 scrubber replacement
2
Calibration
2
Performance and Safety Tests
• Temperature Accuracy
• ECG/Resp Performance
• Invasive Pressure Performance
• SpO
• Mainstream CO
Per formance
2
Per formance
2
• EEG Performance
• C.O. Performance
• BIS Performance
• SvO2 Performance
Required
• Once a year, or as specified by local laws.
• Once a year or after 4,000 hours continuous
use and following any instrument repairs or
the replacement of any instrument parts.
• Once every three years or after 15 000
operating hours
Recommended: Once every two years, or if
you suspect the measurement is incorrect
34
• tcGas Performance
• VueL ink Perfo rman c e
• Nurse Call Relay Performance*
• ECG Sync Performance*
*Only when in use as part of hospital protocols
Safety Checks (in accordance with IEC 60601-
1)
• System Enclosure Leakage Current
• Protective Earth
• Patient Leakage Current
Recommended: Once every two years and after
repairs where the power supply is replaced or
the monitor has been damaged by impact.
Page 35

Tests Recommended When Performing... 3 Testing and Maintenance
Tests Recommended When Performing...
Installation
Repair
Service Event
(When performing...
Installation of monitor with no display connected
to the VGA output
Installation of monitor with a display connected
to the VGA output
Service Event
(When performing...
Repairs of M3015A Perform Power On and M3015A tests
Repairs where the monitor has been damaged by
impact
Repairs where the power supply is replaced Perform Safety (2) Test Block
All other IntelliVue Monitoring System repairs Perform Power On Test Block
Tes t Bl o c k s R e q ui r ed
...Complete these tests)
Perform Visual and Power On Test Blocks
Perform Visual, Power On a nd Sa fety (1) Test
Blocks
Tes t Bl o c k s R e q ui r ed
...Complete these tests)
Perform Power On and Safety (2) and (3) Test
Blocks
Preventive Maintenance
Perform preventive maintenance tests:
• NBP calibration
• Sidestream CO
• Pump and scrubber replacement.
calibration
2
Performance Verifications
Perform all safety, accuracy and performance test procedures listed in the following sections. If a
particular measurement is in question, perform the measurement performance test only.
Upgrades
Service Event
(When performing...
Hardware and software upgrades Perform Power On Test Block unless otherwise
Tes t Bl o c k s R e q ui r ed
...Complete these tests)
specified in the Upgrade Installation Notes shipped
with the upgrade.
35
Page 36

3 Testing and Maintenance Tests
Tests
Some of the following testprocedures must be performed in service mode. To enter service mode select
Operating Modes in the main menu. Then select Service Mode and enter the password.
If required, open the screen menu in the monitor info line at the top of the screen and select
Service to access the service screen. This is required particularly for Anesthetic Gas Module testing
procedures.
Visual Test
Inspect the system for obvious signs of damage. Also check external leads and accessories.
The expected test result is pass: the system has no obvious signs of damage.
Power On Test
1 Switch on the monitor and connect the MMS.
2 Observe whether the system boots up successfully and if an ECG wave appears on the screen.
The expected test result is pass: the monitor boots up and displays an ECG wave. The wave might be a
flat line if no simulator is attached.
NBP Tests
This section describes NBP test procedures.The monitor must be in service mode to perform these
tests.
NBP Accuracy Test
This test checks the performance of the non-invasive blood pressure measurement. Connect the
equipment as shown:
Tools required:
• Reference manometer (includes hand pump and valve), accuracy 0.2% of reading.
• Expansion chamber (volume 250 ml +/- 10%)
Expansion Chamber
To NBP Input
Tubing
Manometer
36
• Appropriate tubing.
In service mode, the systolic and diastolic readings indicate the noise of NBP channels 1 and 2
respectively. When static pressure is applied, the reading in NBP channel 1 should be below 50. The
value in parentheses indicates the actual pressure applied to the system.
Page 37

Tests 3 Testing and Maintenance
Connect the manometer and the pump with tubing to the NBP connector on the MMS and to the
1
expansion chamber.
2 In service mode, select the Setup NBP menu.
3 Select Close Valves: On
4 Raise the pressure to 280 mmHg with the manometer pump.
5 Wait 10 seconds for the measurement to stabilize.
6 Compare the manometer values with the displayed values.
7 Document the value displayed by the monitor (x1).
8 If the difference between the manometer and displayed values is greater than 3 mmHg, calibrate
the MMS. If not, proceed to the leakage test.
9 To calibrate the MMS, select Clos e Valves off then Cali brate NBP and wait for the
instrument to pump up the expansion chamber.Wait a few seconds after pumping stops until
EnterPrVal is highlighted and then move the cursor to the value shown on the manometer. If
one of the following prompt messages appears during this step, check whether there is leakage in
the setup:
– NBP unable to calibrate–cannot adjust pressure
– NBP unable to calibrate–unstable signal
10 Press Confirm.
If the INOP NBP Equipment Malfunction message occurs in monitoring mode, go back to service
mode and repeat the calibration procedure.
NBP Leakage Test
The NBP leakage test checks the integrity of the system and of the valve. It is required once per year
and when you repair the monitor or replace parts.
1 If you have calibrated, repeat steps 2 to 6 from the accuracy test procedure so that you have 280
mmHg pressure on the expansion chamber.
2 Watch the pressure value for 60 seconds.
3 Calculate and document the leakage test value (x2).
x2 = P1 - P2
where P1 is the pressure at the beginning of the leakage test and P2 is the pressure displayed after
60 seconds.
The leakage test value should be less than 6 mmHg.
NBP Linearity Test
1 Reduce the manometer pressure to 150 mmHg.
2 Wait 10 seconds for the measurement to stabilize.
3 After these 10 seconds, compare the manometer value with the displayed value.
4 Document the value displayed by the monitor (x3)
5 If the difference is greater than 3 mmHg, calibrate the MMS (see steps 9 to 10 in the accuracy test
procedure).
37
Page 38

3 Testing and Maintenance Tests
Valve Test
1 Raise the pressure again to 280 mmHg.
2 Select Close valves: Off.
3 Wait five seconds and then document the value displayed. The value should be less than 10
mmHg.
4 Document the value displayed by the monitor (x4).
Test Expected test results
Accuracy test x1 = value displayed by monitor
Leakage test x2 = leakage test value
Linearity test x3 = value displayed by monitor
Valve Test x4 = value < 10 mmHg
Sidestream CO2 Performance Test
Allow five seconds between individual service procedures to ensure stable equipment conditions. When
certain monitor procedures are running, service procedures are not possible and trying to start them
will result in a message
the monitor completes the current operation, then restart the service procedure.
This test checks the performance of the CO
performance test is required once per year and when the instrument is repaired or when parts are
replaced.
This test uses calibration equipment that you can order (see the Parts section for the part number). The
procedure is summarized in the following steps. Refer to the documentation accompanying the
equipment for detailed instructions.
Tools Required:
Service Operation Failed in the monitor’s status line. Wait until
Difference
x2 < 6 mmHg
Difference
measurement for the sidestream extension. The CO2
2
≤ 3mmHg
≤ 3mmHg
38
• Standard tools, such as screwdriver, tweezers
• Electronic flowmeter, M1026-60144.
• Gas calibration equipment:
• Cal 1 gas 15210-64010 (5% CO
• Cal 2 gas 15210-64020 (10% CO
)
2
)
2
• Cal gas flow regulator M2267A
• Cal tube 13907A
You also need a local barometric pressure rating received from a reliable local source (airport, regional
weather station or hospital weather station) which is located at the same altitude as the hospital.
The CO
calibration for the sidestream extension consists of the following steps:
2
• Barometric pressure check and calibration, if required.
Page 39

Tests 3 Testing and Maintenance
• Leakage check
• Pump check
• Flow check and calibration, if required.
• Noise check
• CO
• CO
Cal check and calibration, if required.
2
Cal verification using 2nd cal gas
2
Perform all checks in the same session.
Barometric Pressure Check and Calibration
Check the barometric pressure value in the sidestream CO2 extension as follows:
1 Go into service mode and select Setup CO
2 Connect a FilterLine to the sidestream CO
Extension.
3 The status line at the bottom of the screen displays “CO2 pressure reading (ambient/cell) xxx/yyy”
where xxx is the ambient pressure and yyy is the measured cell pressure. Check whether the
ambient pressure value (x1) matches (within the acceptable tolerance of ±12mm Hg) the reference
value you have received. If so, proceed to the leakage check. If the value is not correct, calibrate as
follows.
a. Select
b. Select the value in the table which matches the reference value received from a reliable local
CO
then select Barom.Press to activate a table of values.
2
source (airport, regional weather station or hospital weather station). (The values are displayed
with a resolution of 2 mmHg up to 500 mmHg and a resolution of 1 mmHg from 500 mmHg
to 825 mmHg.) Note: the selected value must be within ±10% of the current measured ambient
pressure, otherwise an error message will occur at restarting the monitor.
menu.
2
input. This activates the pump in the sidestream CO2
2
Leakage Check
The leakage check consists of checking the tubing between:
• the pump outlet and the measurement server extension outlet and
• the pump inlet and FilterLine inlet.
Check the user’s guide of the flowmeter for details on how to make a correct flow reading.
Part 1
1 Go into service mode and select Setup CO
2 Connect a FilterLine to the sidestream CO
3 Check the ambient pressure and the cell pressure shown in the monitor’s status line. The cell
4 Connect the flowmeter outlet to the FilterLine inlet using a flexible connecting tube.
c. Confirm the barometric pressure setting.
d. Check that the ambient pressure displayed in the status line at the bottom of the screen is the
same as the value which you selected from the list in step b.
menu.
2
input to start the pump running.
2
pressure should be approximately 20 mmHg lower than ambient pressure.
39
Page 40

3 Testing and Maintenance Tests
Block the measurement server extension outlet using your fingertip and observe the flowmeter
5
display. The value on the flowmeter (x2) should decrease to between 0 and 4 ml/min,
accompanied by an audible increase in pump noise. If the value is within the tolerance limits,
continue with part 2 of the leakage check.
6 If the value is outside the tolerance limits, there is a leakage between the pump outlet and the
measurement server extension gas outlet.
7 Open the measurement server extension and check the tubing connections at the pump outlet and
the extension gas outlet. If the connections are good, then there is a leakage in the tubing and you
must exchange the measurement server extension.
Part 2
1 Disconnect the flowmeter from the Part 1 setup and connect the flowmeter inlet to the M3015A
gas outlet.
2 Leave the Filterline connected to the M3015A inlet.
3 Block the inlet of the FilterLine using your fingertip and observe the flowmeter display. The value
on the flowmeter (x3) should decrease to between 0 and 4 ml/min, accompanied by an audible
increase in pump noise. Do not block the inlet for longer than 25 seconds as this will lead to an
“Occlusion” INOP. If the value is within the tolerance limits, there are no leakages and the leakage
check is completed; proceed to the pump check.
4 If the value is not within the tolerance limits, there is a leakage between the FilterLine inlet and the
pump inlet.
5 Check the FilterLine connections and open the M3015A to check the tubing connections at the
pump inlet and the M3015A gas inlet. If the connections are good, try replacing the FilterLine and
repeating the leakage check. If the situation remains, there is a leakage in the tubing and the
M3015A must be exchanged.
Pump Check
1 Connect the flowmeter inlet to the M3015A gas outlet.
2 Connect the FilterLine to the M3015A inlet.
3 Block the inlet of the FilterLine using your fingertip and observe the cell pressure on the M3046A
display. The cell pressure (x4) should be more than 120 mmHg below the ambient pressure
shown. If the pressure difference is less than 120 mmHg, the pump is not strong enough and you
should replace it, irrespective of the Pump OpTime.
Flow Rate Check and Calibration
Check the flow rate in the sidestream CO2 extension as follows:
1 Connect the flowmeter to the CO
2 Check on the flowmeter the flow that the sidestream CO
50 ml/min ± 7.5 ml/min. If the value is within tolerance, proceed to the CO
check. If the value is not within tolerance, calibrate as follows.
FilterLine.
2
extension pump draws (x5). It should be
2
Gas calibration
2
40
3 Adjust the flow in the instrument by selecting Increase Flow or Decrease Flow until it
is as close as possible to 50 ml per minute as indicated on the flowmeter gauge.
Page 41

Tests 3 Testing and Maintenance
When you are satisfied that the flow is set as close as possible to 50 ml per minute, select Store
4
and confirm the setting. If you do not store the adjusted flow within 60 seconds of the
Flow
adjustment, the old flow setting is restored.
5 If you cannot adjust the flow to within tolerance, replace the pump. If you still cannot make the
flow adjustment, this indicates a fault in the measurement extension, which must be replaced.
Noise Check
1 With the monitor in service mode, select Setup CO
2 Disconnect the flowmeter and connect the 5% calibration gas and flow regulator in its place.
3 Open the valve to apply the 5% calibration gas and wait until the value is stable.
menu.
2
4 Check the noise index (x6) displayed next to the CO
of noise on the CO
wave). If the value exceeds 3 mmHg, replace the measurement extension.
2
CO2 Gas Measurement Calibration Check
After switching the measurement extension on, wait at least 20 minutes before checking the
calibration. Check the calibration of the CO
1 Check that the 5% calibration gas and flow regulator are connected.
2 Calculate the expected measurement value in mmHg as follows:
0.05 x (ambient pressure) = value mmHg
for example 0.05 x 736 = 36.8 mmHg (with an ambient pressure of 736 mmHg)
3 Open the valve on the flow regulator to allow 5% CO
value to stabilize.
4 Check that the value on the instrument (measurement value on the main screen, x7)) matches the
calculated mmHg value ± 2.6 mmHg. If the value is outside the tolerance, calibrate as described in
step 9 in this procedure onwards.
5 Disconnect the 5% calibration gas and connect the 10% calibration gas.
6 Calculate the expected measurement value and tolerance in mmHg as follows:
0.1 x (ambient pressure) = value mmHg
±0.07 x (value mmHg) = tolerance
for example 0.1 x 737 mmHg = 73.7 mmHg (with an ambient pressure of 737 mmHg)
±0.07 x 73.7 mmHg = ±5.16 mmHg tolerance
value on the display (this indicates the level
2
gas measurement as follows:
2
gas to flow into the extension. Allow the
2
7 Open the valve on the flow regulator to allow 10% CO
gas to flow into the extension. Allow the
2
value to stabilize.
8 Check that the value on the instrument (x8) matches the calculated mmHg value within the
calculated tolerance. If so, the measurement extension is correctly calibrated. If the value is outside
the tolerance, calibrate as follows.
9 If not already connected, connect the 5% calibration gas.
10 Select Cal. CO
11 Select the value for the calibration gas. (The default value is 5.0%.)
.
2
41
Page 42

3 Testing and Maintenance Tests
Open the valve on the calibration gas to allow CO2 gas to flow into the extension. Allow the value
12
to stabilize before the start of the calibration. Leave the valve open until the instrument gives a
prompt that gas can be removed.
13 The extension calibrates and prompts when calibration is successful.
Calibration Verification
1 Reopen the 5% gas valve and allow the value to stabilize.
2 Check that the value displayed on the monitor is correct within the tolerance (see step 2 above).
3 Disconnect the 5% calibration gas and connect the 10% calibration gas.
4 Open the valve on the flow regulator to allow 10% CO
value to stabilize.
5 Check that the value displayed on the monitor is correct within the tolerance (see step 6 above).
If one or both values are not within tolerances, you must exchange the measurement server extension.
Reset Time Counters
You must check the time counters on the sidestream CO2 extension before calibrating the instrument.
As well, when parts are replaced, the appropriate counters must be reset to zero.
The counters for CO
updated when entering the
Observe the following guidelines:
• When calibrating the CO
Reset PumpOpTi me and Reset IRSourceTime selections to make sure that they are
within suggested guidelines for use (15, 000 hours of continuous use). If the counter time is greater
than 15, 000 hours, replace the appropriate part. See Repair and Disassembly for details.
• When calibrating the CO
the
Reset PumpOpTime and Reset IRSourceTime selections. See Repair and Disassembly
for details.
Resetting the PumpOpTime generates the INOP: “CO
must perform a flow check and store the flow in service mode (select
gas to flow into the extension. Allow the
2
pump, IR Src and Last Cal are displayed in the status line. The values are
2
Setup CO
extension, if no parts have been replaced, check the displayed values of
2
extension, if parts have been replaced, reset the appropriate values using
2
menu.
2
OCCLUSION”. To clear this INOP you
2
Store Flow).
42
Table 1 Documenting CO
Test Expected Test Results
Barometric Pressure
Check
Leakage Check parts
1 and 2
x1 = difference between the reference pressure and the
measured ambient pressure displayed on the monitor
(x1<12 mmHg)
x2 = value of part 1 leakage check on flowmeter
(x2< 4.0 ml/min)
x3 = value of part 2 leakage check on flowmeter
(x3< 4.0 ml/min)
Test Results
2
Page 43

Tests 3 Testing and Maintenance
Table 1 Documenting CO2 Test Results
Test Expected Test Results
Pump Check x4 = difference in pressure between cell pressure and ambient
pressure displayed on the monitor during occlusion (x4 >120
mmHg)
Flow Check x5 = difference between measured value and 50.0 ml/min
(x5<7.5 ml/min)
Noise Check x6 = noise index displayed on monitor (x6<3.0)
CO
Gas
2
Calibration Check
CO
Cal
2
Ve ri f ic a ti on
x7 = difference between measured CO2 value and calculated
value, based on 5% CO
x8 = difference between measured CO2 value and calculated
value, based on 10% CO
(x8 < ± {0.07 x value calculated})
cal. gas. (x7 < 2.6 mmHg)
2
cal. gas.
2
Temperature Accuracy
This test checks the performance of the temperature measurement.
Tools required: Patient simulator (with 0.1
o
C or 0.2oF).
1 Connect the patient simulator to the temperature connector on the MMS or measurement server
extension.
2 Configure the patient simulator to 40
3 The value should be 40
o
C ± 0.2 oC or 100 oF ± 0.4 oF.
ECG/Resp Performance Test
This test checks the performance of the ECG and respiration measurements.
Tools required: Patient simulator.
ECG Performance
1 Connect the patient simulator to the ECG/Resp connector on the measurement server.
2 Configure the patient simulator as follows:
– ECG sinus rhythm.
– HR = 100 bpm.
3 Check the displayed ECG wave and HR value against the simulator configuration.
4 The value should be 100bpm +/- 2bpm.
Respiration Performance
1 Change the Patient Simulator configuration to:
– Base impedance line 1500 Ohm.
– Delta impedance 0.5 Ohm.
– Respiration rate 40 rpm.
o
C or 100 oF.
43
Page 44

3 Testing and Maintenance Tests
The value should be 40 rpm +/- 2 rpm.
2
Invasive Pressure Performance Test
This test checks the performance of the invasive pressure measurement.
Tools required: Patient simulator.
1 Connect the patient simulator to the pressure connector on the MMS or the measurement server
extension.
2 Set the patient simulator to 0 pressure.
3 Make a zero calibration.
4 Configure the patient simulator as P(static) = 200 mmHg.
5 Wait f or t he d isp l ay.
6 The value should be 200 mmHg ± 5 mmHg. If the value is outside these tolerances, calibrate the
MMS or measurement server extension. If the MMS was calibrated with a dedicated reusable
catheter, check the calibration together with this catheter.
SpO2 Performance Test
This test checks the performance of the SpO2 measurement.
Tools required: none
1 Connect an adult SpO
2 Measure the SpO
3 The value should be between 95% and 100%.
transducer to the SpO2 connector on the MMS.
2
value on your finger (this assumes that you are healthy).
2
Cardiac Output Performance Test
These tests check the performance of the cardiac output measurement.
1 Connect the patient simulator to the C.O. module using the patient cable.
2 Configure the patient simulator as follows:
Injection temperature: 2 °C
Computation Const: 0.542
(Edward's Catheter)
Flow: 5 l/min
3 Check displayed value against the simulator configuration.
4 Expected test result: C.O. = 5 +/– 1 l/min.
Service Tool Procedure, Version 1
This procedure applies for Service Tool M1012-61601 and/or C.O. modules without option C10.
44
1 In monitoring mode, connect the C.O. interface cable to the module.
2 Connect one side of the service tool to the injectate receptacle of C.O. interface cable and the other
side to catheter cable receptacle.
3 Enter the C.O. Procedure window and check the results. The expected test result is:
– Tblood = 37.0
o
C +/- 0.1oC
Page 45

Tests 3 Testing and Maintenance
Service Tool Procedure, Version 2
This procedure applies only for Service Tool M1012-61601 in combination with C.O. modules with
option C10.
1 In monitoring mode, connect the C.O. interface cable to the module.
2 Connect one side of the service tool to the injectate receptacle of the C.O. interface cable and the
other side to the catheter cable receptacle.
3 Enter Setup C.O. menu and check results for:
– Method of measurement
– Catheter constant
– Tblood
4 Enter C.O. Procedure window and check results. The expected results are
– Tr a n s p ul m o n a r y 34 1
– Tblood = 37.0
o
C +/- 0.1oC
BIS Performance Test
These tests check the performance of the BIS measurement.
PIC/DSC Test
1 In monitoring mode connect the sensor simulator (for maximum usage please refer to the
documentation delivered with the sensor simulator) to the patient interface cable.
2 Enter the BIS menu and select Open Window.
3 Start impedance check by pressing StartCyclicCheck. Check the displayed results. Expected
results are:
– Electrode 1 (+): 4-6 k
– Electrode 2 (Ref): 8-12 kΩ
– Electrode 3 (1-): 1-3 kΩ
– Electrode 4 (2-): 1-3 kΩ
Ω
Nurse Call Relay Performance Test
The nurse call relay performance test can be performed either at the phone jack type connector (this
only tests one relay) or at the multi-port nurse call connector (to test all three relays).
Phone Jack Type Connector Test
This test checks the operation of the Nurse Call Relay. The Nurse Call Relay test is recommended for
customer sites where the nurse call is in use. The Nurse Call relay functions as follows:
• Standard Operation—Relay open.
• Alarm Condition—Relay closed.
Tools required: Ohmmeter.
1 Plug a phono connector into the Nurse Call Relay connector.
2 Connect the ohmmeter.
3 If no alarm occurs, the relay contacts are open. When an alarm occurs, the relay contacts close.
45
Page 46

3 Testing and Maintenance Tests
Multi-Port Nurse Call Connector Test
This test checks the operation of the Flexible Nurse Call Relay. The Nurse Call Relay test is
recommended for customer sites where the nurse call is in use. The following diagram and table show
the pins and relay identifiers of the connector:
Pin Cable Color Coding Relay
1black R2-closure
2brown R2-middle
3red R2-opener
4orange R3-closure
5yellow R3-middle
6 green R3-opener
7blue n/a
8purple n/a
9gray n/a
10 white n/a
11 pink R1-closure
12 light green R1-middle
13 black/white R1-opener
14 brown/white n/a
15 red/white n/a
16 orange/white n/a
17 blue/white R_failure_closure
18 purple/white R_failure_middle
19 green/white R_failure_opener
20 red/black n/a
46
The Nurse Call relay functions as follows:
• During standard operation R1,R2,R3 _opener are closed; R1,R2,R3_closure are open.
• During alarm condition—R1,R2,R3_opener are closed; R1,R2,R3_closure are open.
Page 47

Tests 3 Testing and Maintenance
Tools required: Ohmmeter.
1 Plug an M8087-61001 cable into the Nurse Call Relay connector.
2 Connect the ohmmeter and measure the pins as indicated in the diagram and table.
3 The relay contacts should behave as described above. The behavior may vary depending on
configuration choices. See the Configuration Guide for details on Alarm Relay settings.
ECG Sync Performance Test
This test checks the performance of ECG synchronization between the monitor and a defibrillator. It
only needs to be performed when this feature is in use as a protocol at the customer site.
Tools required:
• Defibrillator with ECG Sync and Marker Output.
• Patient simulator.
1 Connect the patient simulator to the ECG connector on the Measurement server and the
defibrillator to the ECG Sync Output on the monitoring.
2 Set the patient simulator to the following configuration:
– HR = 100 bpm.
– ECG sinus rhythm.
3 Switch the defibrillator to simulation mode.
4 Check that the marker pulse is displayed before the T-wave begins.
VueLink Tests using VueLink Test Module
Use the VueLink plug-in test module ( M1186-60510) to test M1032A VueLink modules.
Test Procedure
You must preselect the test module to ON in Configuration Mode. Therefore, the test module must be
one of the devices made available for selection during configuration of the VueLink module.
Carry out the test itself in monitoring mode. For information concerning the configuration of
VueLink modules see the M1032A VueLink Module Handbook.
1 Plug the VueLink module into the FMS.
2 Press the Setup key on the front of the VueLink module.
3 In the Setup Vu eL in k menu select Device, then select Test Module.
4 Select Confirm to store the selection and wait for the message “Switched to new device”.
5 Plug in the test module.
6 Connect the modules by plugging one end of the cable (part number M1032-61661) into the
connector on the front of the VueLink Module, and the other end into the connector on the front
of the Test Module.
7 Select the wave segment on the screen, where you want the waves to appear. In the wave menu,
select
Change Wave, then select WAVE.
8 Select the VueLink SmartKey, then select the TEST Plug-In pop-up key
47
Page 48

3 Testing and Maintenance Tests
The test module acts in the same way as an external device would, and sends signals to the VueLink
module in both analog and digital form. The computer module checks these signals for validity, and
then displays “passed” or “failed” on the screen.
The wave segment displays two waveforms, a triangular one and a rectangular one. These are displayed
alternately and for a period of ten seconds each. The expected curve type is indicated below the wave.
There are two pairs of gridlines that indicate the permitted range for the max/min values of these
waves. If all the data received by the test module is correct, the waves will lie within the specified
ranges. If either limit of either wave falls outside the respective gridlines, then the module being tested
is faulty regardless of the passed/failed messages.
When the test is complete:
1 Disconnect the cable that joins the test module to the VueLink module.
2 In configuration mode, ensure that the test module is not selected, and the preselected devices are
the same ones as before the test. Also, verify the settings for these devices.
3 Return to monitoring mode.
4 Press the Setup key on the front of the VueLink module and select the required device by selecting
Device in the Setup VueLink menu.
NOTE It is important to ensure that the preselected device drivers are configured exactly the same as they were
before the test, including their default settings.
Safety Testing
You are recommended to file the results of safety tests. This may help to identify a problem early
particularly if the test results deteriorate over a period of time.
Warnings, Cautions, and Safety Precautions
• These tests are a proven means of detecting abnormalities that, if undetected, could prove dangerous
to either the patient or the operator.
• You can perform all tests using commercially available Safety Analyzer test equipment. You can
perform basic measurements with widely available multifunction instruments such as the HP 3469A
multimeter or equivalent.
• The consistent use of a Safety Analyzer as a routine step in closing a repair or upgrade is emphasized
as a mandatory step to maintain approval agency status. You can also use the Safety Analyzer as a
troubleshooting tool to detect abnormalities of line voltage and grounding plus total current loads.
• For Europe and Asia/Pacific according to:
IEC60601-1:1988 + A1:1991 + A2:1995 = EN60601-1:1990 +A1:1991 + A2:1995
For USA according to:
UL2601-1
• Additional tests may be required according to local regulations.
• Normally, a Safety Analyzer is used to perform these procedures. Popular testers include the
DEMPSEY 232D, or for use in Europe, testers like the Rigel, Metron or Gerb. Follow the
instructions of the Instrument manufacturer. If the Dempsey is used for an extended length of time,
it could be damaged by the high amp current draw of the system.
48
Page 49

Tests 3 Testing and Maintenance
Safety Test Procedures
Use the test procedures outlined here only for verifying safe installation or service of the product. The
setups used for these tests and the acceptable ranges of values are derived from local and international
standards but may not be equivalent. These tests are not a substitute for local safety testing where it is
required for an installation or a service event. If using the Metron Safety tester, perform the tests in
accordance with your local regulations, for example in Europe use IEC60601-1/IEC60601-1-1 and in
the US use UL2601-1. The Metron Report should print results with the names listed below, together
with other data.
S(1) Part 1: System Enclosure Leakage Current - NC (normal condition)
Medical electrical system
Instrument under test
L (N)
Signal parts
in- and/or
output
Signal parts
(**)
in- and/or
output
Other
Instrument
N (L)
S1
S4
(*)
S2
PE
MD
(*) Not present in Class 2.
(**) Can be multiple different connections to different equipment at same time.
Applied part
Expected test results:
♦ Normal condition maximum leakage current x1 ≤ 100µA
This measures leakage current of exposed metal parts of Instrument under Test (IUT) and between
parts of the system within the patient environment; normal and reversed polarity using S2.
Safety test according IEC 60601-1 / UL2601-1
49
Page 50

3 Testing and Maintenance Tests
S(1) Part 2: System Enclosure Leakage current - Single Fault (open earth)
Medical electrical system
Instrument under test
L (N)
Signal parts
in- and/or
output
Signal parts
(**)
in- and/or
output
Other
Ins tru m en t
N (L)
S1
S4
MD
S2
PE
(**) Can be multiple different connections to different equipment at same time.
Applied part
Expected test results:
♦ Single Fault maximum leakage current x2 ≤ 500µA (IEC 60601-1)
≤ 300µA (UL2601-1)
This measures leakage current of exposed metal parts of Instrument under Test (IUT) with Protective
Earth (PE) open circuit (S4 = open) and between parts of the system within the patient environment;
normal and reversed polarity using S2.
50
Page 51

Tests 3 Testing and Maintenance
S(2) Protective Earth Continuity
Instrument under test
L (N)
Ri
Ohm
6V
50 Hz 25 A or 1.5 Ir
N (L)
PE
(*)
Insulating pad
(*) If equipotential connection present : measure also
with yellow/green E.P. conductor connected.
Applied part
Expected test results:
♦ With mains cable, maximum impedance x = 100 mOhms (IEC 60601-1 and UL2601-1)
This measures impedance of Protective Earth (PE) terminal to all exposed metal parts of Instrument
under Test (IUT), which are for safety reasons connected to the Protective Earth (PE). Test current 25
Amp applied for 5 to 10 seconds.
S(3) Patient Leakage current - Single Fault Condition (S.F.C.) mains on applied part
(*) Not present in Class 2
L (N)
N (L)
L (N)
N (L)
S1
S4
S2
(*)
PE
S6
Instrument under test
Insulating pad
S5
Applied part
Signal part
in- and/or
output
R
MD
Expected test results:
♦ Maximum leakage current, x = 50µA @ 250V (IEC60601-1 and UL2601-1)
Measures patient leakage current from applied Part to earth caused by external main voltage on applied
Part with switch S5 open and closed. Each polarity combination possible is tested using S2 and S6.
This test is applicable for every measurement input .
51
Page 52

3 Testing and Maintenance Touchscreen Calibration
Touchscreen Calibration
To access the touchscreen calibration screen:
1 Enter service mode
2 Select Main Setup
3 Select Hardware
4 Select Touch Calibration
Please touch slow ly each target as it app ea rs on sc reen.
Do not power off the mo ni tor until this cal ib ra ti on has
completed.
Figure 5 Touchscreen Calibration Screen
Make sure you complete the calibration procedure without powering off the monitor mid-way. If the
monitor is powered off after the first point is touched, the touch panel will be deactivated until the
touch calibration is performed again.
If the touchscreen is accidentally mis-calibrated by selecting the wrong spot, you must use another
input device to re-enter calibration mode. If you have the support tool, you can select
Calibration to Default
the calibration menu again via the touchscreen.
and it will create a rough calibration which will allow you to access
Reset Touch
52
Page 53

4Troubleshooting
Introduction
This section explains how to troubleshoot the monitor if problems arise. Links to tables that list
possible monitor difficulties are supplied, along with probable causes, and recommended actions to
correct the difficulty.
How To Use This Section
Use this section in conjunction with the sections Testing and Maintenance and Parts. To remove and
replace a part you suspect is defective, follow the instructions in the section Repair and Disassembly.
The Theory of Operation section offers information on how the monitor functions.
4
Who Should Perform Repairs
Only qualified service personnel should open the monitor housing, remove and replace components, or
make adjustments. If your medical facility does not have qualified service personnel, contact Philips’
Response Center or your local Philips representative.
WARNING High Voltage - Voltages dangerous to life are present in the instrument when it is connected to the
mains power supply. Do not perform any disassembly procedures (other than server and extension
removal) with power applied to the instrument. Failure to adhere to this warning could cause serious
injury or death.
Replacement Level Supported
The replacement level supported for this product is to the printed circuit board (PCB) and major
subassembly level. Once you isolate a suspected PCB, follow the procedures in the Repair and
Disassembly section, to replace the PCB with a known good PCB. Check to see if the symptom
disappears and that the monitor passes all performance tests. If the symptom persists, swap back the
replacement PCB with the suspected malfunctioning PCB (the original PCB that was installed when
you started troubleshooting) and continue troubleshooting as directed in this section.
53
Page 54

4 Troubleshooting Software Revision Check
Software Revision Check
Some troubleshooting tasks may require that you identify the Software Revision of your monitor. You
can find the software revision along with other information, such as the system serial number, in the
monitor revision screen.To access the monitor revision screen:
1 Enter the Main Setup menu and select Revision
2 Select the pop-up key Software
NOTE The system serial number can also be found on the lower right corner on the front of the monitor.
Obtaining Replacement Parts
See Parts section for details on part replacements.
Troubleshooting Guide
Problems with the monitor are separated into the categories indicated in the following sections and
tables. Check for obvious problems first. If further troubleshooting instructions are required refer to
the Troubleshooting Tables.
Taking the recommended actions discussed in this section will correct the majority of problems you
may encounter. However, problems not covered here can be resolved by calling Philips Response
Center or your local representative.
Checks for Obvious Problems
When first troubleshooting the instrument, check for obvious problems by answering basic questions
such as the following:
1 Is the power switch turned on?
2 Is the AC power cord connected to the instrument and plugged into an AC outlet?
3 Are the MMS and, if present, the measurement server extension inserted correctly?
4 Are the cables connected properly to the FMS?
5 Are the parameter modules plugged into the FMS correctly?
54
Page 55

Troubleshooting Guide 4 Troubleshooting
Checks Before Opening the Instrument
You can isolate many problems by observing indicators on the instrument before it is necessary to open
the instrument.
NOTE It takes several seconds for the AC Power LED to switch on / off after the mains power cord has been
connected / disconnected.
Checks with the Instrument switched Off
• AC connected:
– AC Power LED is on (green).
• No AC connected:
– All LEDs are off.
Checks with the Instrument Switched On, AC connected
When the monitor is first switched on, all the front-panel LEDs and keys light up momentarily. The
location of the front-panel LEDs is shown in the following photograph:
Power On LED
(Green)
Error LED
(Red)
AC Power LED
(Green)
55
Page 56

4 Troubleshooting Troubleshooting Guide
Initial Instrument Boot Phase
The following tables describe the regular initial boot phase of the monitor and its components. If the
boot phase does not proceed as described below go to Boot Phase Failures for Troubleshooting
information.
Monitor Boot Phase:
For these steps it is assumed that the Monitor is powered correctly and the +5V System Board supply
voltage is okay. This is indicated by the green Power On LED.
Time (sec.)
Event
after Power
On
0 When the Power On/Off button is pressed, the green Power On LED and the red error
LED switch on immediately.
1 The alarm LEDs are switched on with low intensity. Colors: Left LED:cyan; Middle
LED:red; Alarm Suspend LED (right): red
3 Red Error LED is switched off.
4 Boot Screen with the Philips Logo appears on the display. Test Sound is issued.
5 All Alarm LEDs are switched off.
6 Alarm LEDs are tested in the following sequence:
Cyan on-off (left LED only)
Yellow on-off (left & middle LED)
red on-off (all LEDs)
8 Fixed screen elements (for example smart keys, alarm fields) appear on the screen.
Boot Screen with the Philips Logo disappears
15-30 First measurement information appears on the screen,user input devices (for example
Mouse, Touch, Speed Point) are functional
56
Page 57

Troubleshooting Guide 4 Troubleshooting
Flexible Module Server Boot Phase
For these steps it is assumed that the Flexible Module Server is connected via SRL-cable to the monitor
Time
Event
(sec.) after
Monitor
Power On
0 Red Error LED switches on immediately
1 Green “Ready” LED switches on
3 Red Error LED is switched off
5 Module Power is switched on
5-8 Module Status LEDs blink once or twice (Module dependent)
57
Page 58

4 Troubleshooting Troubleshooting Guide
Troubleshooting Tables
The following tables list troubleshooting activities sorted according to symptoms. Click on the links
below to view a particular table.
How to use the Troubleshooting tables
The possible causes of failure and the remedies listed in the troubleshooting tables should be checked
and performed in the order they appear in the tables. Always move on to the next symptom until the
problem is solved.
Boot Phase Failures
Integrated Display is blank
Integrated Touch Display not functioning
External Display is blank
External Touch Display not functioning
Remote Alarm Device
Remote Extension Device
Speed Point
Keyboard/Mouse not functioning
Network related problems
Wireless Network
Multi-Measurement Server
MSL-related problems
Alarm Lamps
Alarm Tones
Individual Parameter INOPS
Flexible Module Server
Integrated Module Slots
Printer
MIB / RS232
Flexible Nurse Call Relay
58
Page 59

Troubleshooting Guide 4 Troubleshooting
Boot Phase Failures
Symptoms Possible Causes of Failure Failure Isolation and Remedy
AC LED does
not light up
Green Power On
LED and Red
Error LED
remain off after
pressing power
on button:
AC Connection not ok Check that the AC-Mains are powered and
the power cord is ok and connected
LED defective
Power Switch board not connected to the
main board
Power supply defective
Integrated Module Slot defective
Flat Panel adapter Board defective
Video Board defective
Main Board defective
Remote Devices
Power Switch Micro Controller hung
Power switch board not connected to the
main board
Power Switch Board defective
I/O Board defective
Touch controller defective
Flat Panel Adapter Board defective
ECG-Out Board defective
SRL-2 Board defective
Measurement Server Mount defective
Integrated Module Slot defective
Video Board defective
Main Board defective
Try to switch on the monitor. If it operates
normally , the LED is defective => exchange
Power Switch board.
Check if power switch board is connected
correctly to the Main Board
Remove power supply and check if output
voltage is within the specifications (47V 49V). Measure on multi-colored wired
connection between red and black wires
Exchange power supply if defective
Disconnect Integrated Module Slot
Connector and check again
Disconnect cable of the Flat Panel Adapter
Board and check again
Remove Video Board and check again
Exchange Main Board
Disconnect all connections to the remote
devices and try to switch on the monitor
again
Unplug AC Mains and replug after 10
seconds. Try to switch on the monitor again.
Check if power switch board is connected
correctly to the main board.
Exchange Power Switch BOard and try to
switch the monitor on again.
Remove all I/O boards and try to switch the
monitor on again
Disconnect all cables accessible at the
bottomof the monitor (except Power Switch
cable):
- touch
- video
- ECG-Out
- SRL-2
then try to switch the monitor on again
Disconnect Measurement Server Mount and
try again
Disconnect Integrated Module Slot and try
again
Remove video board and try again
Exchange main board. Add boards in reverse
order and try again with each board.
59
Page 60

4 Troubleshooting Troubleshooting Guide
Symptoms Possible Causes of Failure Failure Isolation and Remedy
Green On/
Standby LED or
Red Error LED
remain off after
pressing Power
on button:
Red Error LED
stays on
continuously
Red Error LED
blinks
(indicating cyclic
reboots)
Alarm LEDs
remain off:
No Test Sound
issued
Power Switch Board not connected to the
main board
Power Switch board defective
Main board defective
External connected device defective disconnect all external cables (except AC)
I/O Board defective Remove all I/O boards and switch the
Touch controller defective
Flat Panel Adapter board defective
ECG-Out board defective
SRL-2 board defective
Measurement Server Mount defective Disconnect Measurement Server Mount and
Integrated Module Slot defective Disconnect integrated module slot and
Video Board defective Remove video board and switch on again
Main board defective Exchange Main board
Hardware Failure
Software Fault
Hardware Failure
Alarm LED board is defective
Main board defective
Speaker defective
Main board defective
check if power switch board is connected
correctly to the main board
exchange Power switch board
exchange main board
and switch the monitor on again
monitor on again.
disconnect all cables accessible at the bottom
of the monitor (except Power Switch cable):
- touch
- video
- ECG-Out
- SRL-2
switch on again
switch on again
connect Support Tool directly to monitor
with crossover cable and start “search for
defective devices”
If no device is detected, proceed as described
above in section “Red error LED stays on
continuously”
If the Support Tool can detect the device and
it indicates the Operating Mode is ‘Boot’,
download and store the status log. Reload
software and re-clone the monitor. If this
fixes the problem e-mail the status log to
your local response center
If this does not rectify the problem follow
instructions under “Red Error LED stays on
continuously”.
Check for INOPS and follow instructions
Exchange Alarm LED board
Exchange Main board
check for INOPs and follow instructions
exchange speaker
exchange main board
60
Page 61

Troubleshooting Guide 4 Troubleshooting
Integrated Display is blank
Symptoms Possible Causes of Failure Failure Isolation and Remedy
Integrated display is
blank or brightness is
reduced
(The information listed
in this table is only valid
if the boot phase has
completed without error.
See Boot Phase Failures
table for a description of
the Boot phase.)
Display brightness is reduced
when room temperature, or
instruments placed near patient
monitor, causes the monitor
display to overheat.
Flat Panel Adapter cable not
connected
Backlight Inverter Cable not
connected
Backlight tubes defective
Backlight Inverter board
defective
Panel Adapter board defective
LCD Flat panel defective
Video board defective Replace video board
Main board defective
Instrument should be placed in an
environment that does not exceed 40
degrees C or below 5 degrees C.
If you have an external XGA display,
connect it to the video port. If the
external display works, you can
eliminate the Video I/F board and the
main board as the cause of failure.
Check cable connection of Flat Panel
Adapter Board to Video Board
Check cable connection of Flat Panel
AdapterBoard to Backlight Inverter
Board
Replace backlight tubes
If backlight tubes have already been
replaced, replace backlight inverter
board.
Replace panel adapter board
Replace LCD Flat panel
Replace main board
61
Page 62

4 Troubleshooting Troubleshooting Guide
Integrated Touch Display not functioning
Symptoms Possible Causes of Failure Failure Isolation and Remedy
Touch Screen not
functioning
Touch Position invalid Touch not calibrated Perform touch calibration:
Touch controller cable not
connected
Touch panel cable not connected
Touch controller board defective
To u c h S e n s o r de f e c t i v e
Main board defective
Check connection from the touch
controller board to the main
board
Check connection from touch
controller board to touch panel
Replace touch controller board
Note: Linearization data must be
loaded and recalibrated after
replacing the touch controller
board
Replace Touch Sensor
Replace main board
1. Enter the Main Setup Menu
2. Select Monitor
3. Select Hardware
4. Select Touch Driver Settings
5. Select Calibrate
62
Page 63

Troubleshooting Guide 4 Troubleshooting
External Display is blank
Symptoms Possible Causes of Failure Failure Isolation and Remedy
External Display is blank If integrated display is also blank proceed
as described under “Integrated Display is
blank”
Video cable to external display
not connected
External display has no power
External display is defective
Video board defective
Main board defective Replace main board
Check video cable connection to external
display
Check electricity supply of external
display
Check external display and video cable
on another monitor or PC
Replace video baord
63
Page 64

4 Troubleshooting Troubleshooting Guide
External Touch Display not functioning
Symptoms Possible Causes of Failure Failure Isolation and Remedy
Touch Screen not
functioning
Touch position invalid Touch not calibrated Perform touch calibration:
External Tocuh cable not connected Check cable connection from
external touch to MIB board
External Touch driver configuration
MIB Board defective
External touch defective
Main board defective
Check RS232/MIB
configuration:
1. Enter Main Setup menu
2. Select Monitor
3. Select Hardware
4. Reconfigure RS232/MIB
drivers
5. if problem persists, proceed to
the next step
Replace MIB board
Replace external touch
Replace Main board
1. Enter Main Setup menu
2. Select Monitor
3. Select Hardware
4. Select Touch Driver
5. Select Calibrate
64
Page 65

Troubleshooting Guide 4 Troubleshooting
General Monitor INOP Messages
INOP Message Possible Causes of Failure Failure Isolation and Remedy
CHECKINTERNVOLTAGEProblem with the voltages (5V, 12V) in
the monitor
CHECK MENU LABELS
This message indicates that
the monitor has performed a
cold start and attempted to
reset the menu labels to
defaults. If the defaults are
present, the recovery was
successful. Default settings
should be recorder as part of
your documented
configuration setup. If the
menu labels do not match the
configuration file settings or
the INOP persists, perform
the troubleshooting tasks
listed in this table.
CHECK MONITOR TEMP The temperature inside the monitor is
CHECK SETTINGS
This message indicates that
the monitor has performed a
cold start and attempted to
reset the menu labels to
defaults. If the defaults are
present, the recovery was
successful. Default settings
should be recorded as part of
your documented
configuration setup. If the
menu labels do not match the
configuration file settings or
the INOP persists, perform
the troubleshooting tasks
listed in this table.
Memory space in which the menu labels
are stored has been corrupted
Main Board defective
too high
Monitor ventilation obstructed
Main Board defective
Memory space in which the settings are
stored has been corrupted
Main board defective
Remove all I/O boards and put them
back in one at a time to isolate any
defective board. If this does not
resolve the problem, replace the main
board
Reclone configuration file. This will
reload the memory space
Replace Main Board
Check the environment for possible
causes
Clean the monitor ventilation
internally and then cool monitor
down for 8 hours
replace Main Board
Reclone configuration file. This will
reload the memory space.
Replace Main board
65
Page 66

4 Troubleshooting Troubleshooting Guide
INOP Message Possible Causes of Failure Failure Isolation and Remedy
INTERNAL COMM.MALF. Problem with the I2C Bus
communication in the monitor
Video board defective
Main board defective
Remote Alarm Device
Symptoms Possible Causes of Failure Failure Isolation and Remedy
Alarm LEDs illuminate,
but no alarm sound is
issued
Alarm occurs on screen, but
no LED or alarm sound on
the alarm device
Alarm sound is isued, but
no LEDs light up
wrong I/O slot check I/O matrix in the Theory
speaker defective
remote device I/F defective
cabling not connected check cabling
cabling defetive
I/O board defective
Remote Alarm Device defective
LED failure Replace Alarm Device
Disconnect the external display and
try another one
Replace Video board
Replace Main board
of Operation section of this
manual
replace remote alarm device
replace I/O board
replace cable
replace I/O board
replace Remote Alarm Device
Remote Extension Device
Symptoms Possible Causes of Failure Failure Isolation and Remedy
Remote input device (for
example mouse/keyboard)
attached to the Remote
Extension Device does not
function
Buttons on the Remote
Extension Device do not
function but input device
attached is functioning
See tables Speed Point or Keyboard/
Mouse not functioning
Remote Extension Device defective
See tables Speed Point or
Keyboard/Mouse not functioning
replace Remote Extension Device
66
Page 67

Troubleshooting Guide 4 Troubleshooting
Speed Point
Symptoms Possible Causes of Failure Failure Isolation and Remedy
Speed Point attached
directly to the monitor not
functioning
Speed Point attached to
Remote Extension Box not
functioning
Speed Point Knob
Rotation, Joystick Control
or Selection control not
functioning
INOP Message CHECK
INPUT DEVICES is
issued
Speed Point not connected properly Check cabling
PS/2 I/O board in wrong slot
PS/2 I/O Board defective
SpeedPoint defective
Remote Extension Device is not
connected to the monitor.
SpeedPoint not connected properly
SpeedPoint defective
Remote Extension Device defective
Remote Device I/O board in the
wrong slot
Remote Device I/O board defective
Speed Point defective
SpeedPoint or other input device
defective
Check I/O Matrix in Theory of
Operation
replace I/O board
Replace SpeedPoint
Check cabling and connections
Check cabling to SpeedPoint in
the Remote Extension Device
Replace SpeedPoint
Replace Remote Extension
Device
Check I/O Matrix in Theory of
Operation
Replace I/O board
Replace Speed Point
Perform a visual and functional
check of all the monitor input
devices. Replace input devices if
necessary.
Keyboard/Mouse not functioning
Symptoms Possible Causes of Failure Failure Isolation and Remedy
Keyboard/Mouse attached
directly to the monitor not
functioning
Keyboard/Mouse not connected
properly
Keyboard/Mouse defective
PS/2 I/O board in wrong slot
PS/2 I/O Board defective
Check cabling
Replace Keyboard/Mouse
Check I/O Matrix in “Theory of
Operation”
replace I/O board
67
Page 68

4 Troubleshooting Troubleshooting Guide
Symptoms Possible Causes of Failure Failure Isolation and Remedy
Keyboard/Mouse attached
to Remote Extension Box
not functioning
Remote Extension Box is not
connected to the monitor or Input
Device is not connected to Remote
Extension Box
Keyboard/Mouse defective
Remote Extension Device defective
Remote Device I/O board in wrong
slot
Remote Device I/O board defective
Check cabling and connections
Replace Keyboard/Mouse
Replace Remote Extension
Device
Check I/O Matrix in Theory of
Operation
Replace I/O board
68
Page 69

Troubleshooting Guide 4 Troubleshooting
Network related problems
Symptoms Possible Causes of Failure Failure Isolation and Remedy
Prompt Message “no
central assigned to this bed”
is issued
INOP “Unsupported
LAN” is issued.
No connectivity to PIC, no
prompt or error message on
monitor
Other Bed Overview not
available
“Other Bed” Alarms are not
appearing
The monitor label is not set in the
monitor (if the beds are “monitor
labeled” in the Philips Information
Center)
Problem with the Philips
Information Center to Switch
communication (if the beds are
“port mapped” in the Philips
Information center
Network failure Check if switches, Philips
Monitor connected to wrong
network
IP address conflict after
infrastructure re-installation
Hardware Defect Check LAN cable connection
Configuration problem Check switch configuration and
Configuration Problem Check configuration in PIC
This function is not available for
wireless beds
Configuration problem Verify configuration in PIC, in
Set Monitor Label in Config
Mode
Check PIC to Switch
communication, Switch
configuration and Firmware
status
Information Center and Database
Server are all running and
connected to the network
Check if monitor has been
connected for example to a
different hospital network instead
of the Philips Clinical Network
Reboot Database Server and
Philips Information Center
Check NGN Connector board in
Monitor
Check Switch
firmware revision
regarding other bed overview
(care group assignment)
Verify configuration of switch
(setting of multicast filters)
Switch to a wired configuration
Monitor (Config Mode) and
check that the feature is not
temporarily disabled by the user
(Bed Info Window)
69
Page 70

4 Troubleshooting Troubleshooting Guide
Wireless Network
Symptoms Possible Causes of Failure Failure Isolation and Remedy
No central monitoring
possible (see also Network
related problems)
No connectivity (coverage
area consists of multiple
access points and in some
parts of the area there is no
connectivity)
Frequent dropouts and
network disconnects
Overview, Printing does
not work
Monitor is out of range of the access
point (in this case the yellow sync
LED on the wireless adapter on the
bottom of the device next to the
power connector is not on steady)
Wireless Adapter has no power
(LEDs on adapter are all off)
(Only after first install) Firmware
revision in adapter is wrong
Wireless adapter defective (the red
status LED on the adapter’s top
panel is on)
Wrong configuration in wireless
adapter or in access point
Configuration problem
Excessive interference by other radio
equipment or by microwave ovens
System capacity exceeded in
coverage area
Configuration problem
Some functions are not available on
a wireless network
Move monitor back into coverage
area
Verify size of coverage with the
site survey tool
Check splitter cable and replace if
necessary
Check network adapter board in
monitor and replace if necessary
Check adapter itself. Replace if
necessary
Update adapter frimware with
wireless support tool
Replace wireless adapter
Check configuration with wireless
support tool
Verify the channel, domain and
security ID settings of the access
points in the coverage area
Check statistics that can be read
from the wireless adapter via
RS232 or via logging application
in the PIC. Remove interfering
equipment.
Check configuration guidelines
for number of monitors per access
point.
Check access point configuration
with wireless support tool, in
particular the multicast filters
Connect to cabled network
70
Page 71

Troubleshooting Guide 4 Troubleshooting
Multi-Measurement Server
Symptoms Possible Causes of Failure Failure Isolation and Remedy
Prompt message
“Measurement Server
Configuration not
supported” is issued
INOP Message “MsmtSrv
not Supp” is issued
Prompt message
“Measurement Server not
supported, unplug device,
switch monitor off/on” and
INOP “Bad Measurement
Server are issued
An unsupported Measurement
Server Extension has been connected
Measurement Server Extension is
defective
Measurement Server defective
Wrong So f tware Re v i son Upgrade monitor and/or
Too many measurement servers
connected
Unsupported type of measurement
server (for example M3000A on a
M800xA monitor) connected.
M3000A Measurement Server
Revision A is plugged. This
Measurement Server is not
compatible with the IntelliVue
patient monitors
Disconnect the measurement
server extension
Replace Measurement Server
Extension
Replace Measurement Server
measurement server to a
matching software version
Disconnect unsupported
measurement servers for proper
operation
Disconnect the unsupported
measurement server
Disconnect the measurement
server and cycle power.
71
Page 72

4 Troubleshooting Troubleshooting Guide
MSL-related problems
Symptoms Possible Causes of Failure Failure Isolation and Remedy
Measurement Server does
not start up (no LEDs
active), no INOP or
prompt displayed
Measurement Server does
not start but LEDs are
normal
MSL Power High INOP is
issued
Note: if this condition
persists for longer than 15
minutes, the INOP MSL
Power Off will appear (see
below)
MSL Power Off INOP is
issued
No Power
Communication lines in MSL cable
or MSL connector broken
MSL connector board defective
Attached devices drawing too much
power from the monitor. Too many
FMS and MMS connected to the
monitor
Attached devices drawing too much
power from the monitor. Too many
FMS and MMS connected to the
monitor
Check MSL cable and replace if
necessary
Check MSL connector board and
replace if necessary
Check MSL cable and MSL
connectors
Check MSL connector board and
replace if necessary
Reduce to a limit of 1 FMS and 1
MMS connected to the monitor
Disconnect all FMS and MMS
from the monitor
Cycle power to restore power to
the MSL devices.
If the message disappears,
reconnect FMS and MMS one at
a time, waiting 15 minutes
between each device to see if
message reoccurs. If yes, the
respective MMS or FMS is faulty.
See Multi-Measurement Server or
Flexible Module Server for
troubleshooting tasks. If no, add
front-end modules one at a time,
waiting 15 minutes between each
module to see if message
reappears, Replace module if
faulty.
72
MSL Power Overload
INOP is issued
Note: If an individual defective
device is connected the MSL
Power High or MSL Power
Overload INOPs will appear
initially. The MSL Power Off
INOP will not occur for at least
15 minutes.
Short Circuit within MSL system Disconnect all MSL connections
including Measurement Server
Mount, 2nd MSL interface, 1st
MSL interface. Reconnect devices
one at a time. If message persists,
replace main board.
Page 73

Troubleshooting Guide 4 Troubleshooting
Symptoms Possible Causes of Failure Failure Isolation and Remedy
INOP BAD SERVER
LINK is issued
INOP Message
SERVERLINK MALF is
displayed, audible
indicator: a beep every two
seconds
A measurement supported
by a server does not come
up on the monitor
Prompt message “To o
many <label> modules
connected” is issued
The ECG Out/ Marker In
function does not funcion
Unexpected data detected on MSL Check cable and power cycle the
monitor
An FMS or MMS with an
incompatible software revision is
connected to the monitor.
Communication between the
components not functioning
The hardware for communicating
with the Multi-Measurement Server
is faulty.
Label conflict A parameter label from this
There are more modules of the type
<label> connected than supported
by the software
Hardware problem Check MSL cable
Connect FMS or MMS with
compatible software revsion
Check software versions and
model number of devices for
compatibility
Check MSL cable, replace if
necessary.
Check MSL I/O board. Replace if
necessary
Check FMS or MMS connector
board. Replace if necessary.
measurement is already in use in
the monitor. Check the conflict
window to select the
measurement.
Remove the unsupported module
or use the lebel manager
application in the monitor to
disable the module.
Check ECG Out Hardware in
the monitor
Check the MSL connector in the
measurement server
73
Page 74

4 Troubleshooting Troubleshooting Guide
Alarm Issues
Alarm Lamps
Symptoms Possible Causes of Failure Failure Isolation and Remedy
Alarm Tones
INOP Message Check
Alarm Lamps is issued
Alarm occurs, but no LED
lights up
Alarm LED board cable
disconnected
Alarm LED board defective
Main board defective replace Main board
Environmental Lighting too bright Place monitor in a darker
Light pipes broken off
Alarm LED board cable
disconnected
Alarm LED board defective
Main Board defective
reconnect cable
replace Alarm LED board
environment
replace light pipes
reconnect cable
Replace Alarm LED board
Main board
Symptoms Possible Causes of Failure Failure Isolation and Remedy
INOP Message SPEAKER
MALFUNCTION is
displayed
Alarm occurs but no alarm
sound is issued
Alarm occurs on device
connected to VueLink but
no alarm sound is issued on
the monitor
Speaker cable disconnected Reconnect speaker cable
Speaker defective
Sound amplifier on main board
defective
Audible alarm indicators have been
switched off
Volume set to 0
Speaker defective
Sound amplifier on main board
defective
Configuration of VueLink is
incorrect
Replace speaker
Replace main board
Switch audible alarm indicators
back on
Increase volume
Replace speaker
Replace main board
Check VueLink configuration
Alarm Behavior
If your monitor did not alarm in the way in which the end user expected, please consult the
Instructions for Use for possible setup issues or configuration settings which could affect alarm
behavior.
74
Page 75

Troubleshooting Guide 4 Troubleshooting
Individual Parameter INOPS
If any of the following parameter INOP messages are issued try the respective parameter in another
device. If the INOP message persists replace the parameter module, the MMS or other indicated
device.
•CO2 EQUIP MALF
• ECG EQUIP MALF
• NBP EQUIP MALF
• P1 EQUIP MALF
• RESP EQUIP MALF
•SpO
•SpO
•SvO
•tcpO
• T1 EQUIP MALF
• VueLnk EQU. MALFI
EQUIP MALF
2
TRANSDUC MALF
2
EQUIP MALF
2
(or tcpCO2) EQUIP MALF
2
75
Page 76

4 Troubleshooting Troubleshooting Guide
Flexible Module Server
Symptoms Cause of Failure Failure Isolation and Remedy
Prompt Message
“Unrecognized
Measurement Module in
slot s” is issued
Prompt message
“Measurement Module in
slot n is currently ignored”
is issued
Red Error LED stays on Unrecoverable hardware selftest
Red Error LED flashes Hardware selftest error If system comes up, check status
Flexible Module Server
LEDs ok, Front End
Measurement Module not
recognized (no prompt or
INOP)
An unsupported module has been
plugged into the Flexible Module
Server
Too many modules of the same kind
have been plugged into the Flexible
Module Server
error:
MSL cable defective
Flex connector from main board to
MSL defective
CPU module defective
Measurement Module or
Measurement Module Connector
defective
No Front-End power because MSL
voltage from the monitor is too high
or too low
Mother board or connector on
Mother Board defective
Unplug the unsupported module
Unplug module in slot n
Try to attach the MMS directly
to the MSL cable. If the
measurements show up on the
screen, the fault is in the FMS
If the measurements do not show
up when the MMS is connected
directly to the MSL cable, then
replace MSL cable
Replace connector
Replace CPU module
log. Otherwise see above
Replace Measurement Module
Try a new MSL cable. Replace if
failure is rectified.
Replace mother board
If the voltage is in range, or there
is obvious damage to a connector,
replace mother board
Integrated Module Slots
Symptoms Cause of Failure Failure Isolation and Remedy
Prompt Message
“Unrecognized
Measurement Module in
slot m” is issued
Prompt message
“Measurement Module in
slot n is currently ignored”
is issued
76
An unsupported module has been
plugged into the Integrated Module
Slot
Too many modules of the same kind
have been plugged into the
Integrated Module Slot
Unplug the unsupported module.
Unplug module in slot n
Page 77

Troubleshooting Guide 4 Troubleshooting
Symptoms Cause of Failure Failure Isolation and Remedy
Printer
Inserted Module LEDs
behave normally but
Modules not recognized by
monitor
Inserted Module does not
function
The monitor software version does
not support measurement modules
Label conflict
Connector damaged Replace integrated module slot
internal ribbon cable not connected
or defective
Check software version and
options
See MSL-related problems
reconnect or replace cable
Symptoms Cause of Failure Failure Isolation and Remedy
Prompt message “Print job
could not be queued” is
issued. No print device is
found.
Status message “Print
device Local 1 (Local 2)
unavailable” is issued.
Printer job is stalled.
Status message “Print
device Remote 1 (Remote
2, Remote 3) unavailable”
is issued. Printer job is
stalled
Printer is disabled in the Setup
Printers menu
Paper size of printer does not match
paper size of report
Printer not switched on
Printer paper tray empty
Cabling not connected correctly
I/O board defect
Print error on Philips Information
Center
Network Connection to Philips
Information Center not functioning
Enable the correct printer in the
Setup Printers menu
Change paper size of the printer
in the Setup Printers menu or
change paper size of the report in
the Setup Reports menu.
Switch on printer power
fill printer paper tray
Check cabling
replace I/O board
Print a test report on the Philips
Information center. If this fails,
refer to Philips Information
Center documentation
Check that the network
connection between the monitor
and the Philips Information
Center is working
77
Page 78

4 Troubleshooting Troubleshooting Guide
Symptoms Cause of Failure Failure Isolation and Remedy
Recorder
Status message “Printing on
device Remote 1... (Remote
2, Remote 3)” is issued but
no report is printed
Printouts are not as
expected
Print queue on Philips Information
Center is full. Reasons for this may
be:
- Printer is not switched on
- Printer paper tray is empty
Printer paper size is not correctly
configured
Printer resolution is not correctly
configured
Printer color support is configured
to “On” although the printer does
not support color
Printer not compatible
Switch on printer power
Fill printer paper tray
Configure the paper size
according to the inserted print
media
Configure the printer resolution
according to the printer
capabilities
Configure the printer color
support to “Off ”
Check specifications
Symptom Possible C ause Corrective Action
System thinks that door is
open when it is not.
System thinks that the
recorder is out of paper
when it is not.
Recorder not
communicating with
System.
Recorder won't run. Recorder interface not
Poor print quality. Printhead dirty. Clean the Printhead as described in
Defective door switch. Replace door switch. Exchange module.
Paper-out sensor dirty. Clean paper-out sensor.
Poor connection to the
front-end FMS.
Only one recorder module
may be used with each
monitor.
System not configured
properly.
Too many modules
connected.
working correctly.
Printhead failure.
Unplug the module. Plug it back in and
try it again in a few seconds. (Watch for
the LED to flash.)
Remove one of the recorder modules.
Check the configuration of the connected
monitor.
Check and remove the extra modules.
Unplug the module. Plug it back in and
try it again in a few seconds. (Watch for
the LED to flash.)
“Cleaning the Recorder Module” on
page 2-24 of this manual.
Exchange the module.
78
Page 79

Troubleshooting Guide 4 Troubleshooting
Symptom Possible C ause Corrective Action
Paper not feeding
properly.
Module does not lock
into FMS.
Paper roll off center. Center paper roll on roller guides.
Dirty roller.
Locking plates defective. Remove and exchange the locking plates.
Clean roller.
79
Page 80

4 Troubleshooting Troubleshooting Guide
MIB / RS232
Symptoms Cause of Failure Failure Isolation and Remedy
AGM connected to an
RS232 port not
functioning
External device not
receiving data
Detailed Protocol Problem Consult the Data Export Protocol
The MIB/RS232 port is not
configured for AGM
The cable between AGM and
monitor is not connected correctly
or defective
The MIB/RS232 board is in a
wrong slot (slot has been changed
after software configuration or an
additional board has been plugged
in)
The MIB/RS232 board is defective
The MIB/RS232 port is not
configured for data export
The wrong data export protocol
driver is configured in the monitor
The cable between the external
device and the monitor is not
connected correctly or defective
The external device does not support
the version of the data export
protocol used in the monitor
A terminal concentrator is used in
between the device and the monitor
and a protocol with dynamic speed
negotiation is used
The MIB/RS232 board is in a
wrong slot (slot has been changed
after software configuration or an
additional board has been plugged
in)
The MIB/RS232 board is defective
Check configuration of the MIB/
RS232 ports in configuration
mode
Check cable connection, replace
cable if necessary
Verify correct placement of the I/
O boards
Check board and replace if
necessary
Check configuration of the MIB/
RS232 ports in configuration
mode
Check the export protocol
required by the attached device
and configure the monitor
accordingly
Check cable and replace if
necessary
Check if the device supports the
version of the data export
protocol. Upgrade device or
monitor if necessary (if matching
versions exist).
Some terminal concentrators do
not support changing the
transmission speed (baud rate)
dynamically. Check if the
connection works without the
concentrator
Verify correct placement of the I/
O boards
Check board and replace if
necessary
document.
80
Page 81

Troubleshooting Guide 4 Troubleshooting
Flexible Nurse Call Relay
Symptoms Cause of Failure Failure Isolation and Remedy
INOP message CHECK
NURSE CALL RELAY is
issued
Monitor alarmed, Nurse
Call did not activate
Troubleshooting the ECG OUT
Symptoms Cause of Failure Failure Isolation and Remedy
No marker pulse is
displayed on the Monitor
or no ECG- OUT signal to
the Defib
Nurse Call Relay board defective Replace Nurse Call Relay I/O
board.
Incorrect configuration (Relay
latency, Relay trigger)
Connection of cable to monitor or
nurse call system not correct
Nurse Call Relay board is in the
wrong slot.
The Nurse Call Relay bosrd is
defective
Check monitor configuration (see
configuration guide)
Check cable connections
Verify correct placement of the
I/O boards
Replace Nurse Call Relay board
Disconnect the MMS and Defib
cable.
Switch the Monitor off then on again.
Observe the red LED in the ECG
OUT section. (Note that the LED can
only be observed if the housing
bottom is removed).
If the red LED does not switch on for
about 1 second at power on:
Cabling not connected
ECG OUT board defective Replace ECG OUT board
ECG OUT Board defective
Main Board defective Replace Main Board
ECG OUT board defective
Main Board defective Replace main board
Check cabling
If the red LED switches on and
remains on for more than 20 seconds:
Replace ECG OUT Board
Connect Known good Defib, Defib
cable MMS and MMS cable. Check
Marker pulse and ECG OUT signal at
defib again. If there is still no signal:
Replace ECG OUT board
81
Page 82

4 Troubleshooting Troubleshooting Guide
Data Flow Marker In and ECG Wave
The following illustration of the data flow for Marker In and ECG Wave may assist in troubleshooting.
Defib
Cable
ECG W a ve
Marker
DEFIB
Marker In
Data Path
ECG Wave
Data Path
Conn.
Monitor System Board
MEASUREMENT
SERVER
Isolat.
RS485
ECG_OUT
Board
CPU,Communication
System and Video
MSL
Connector
Server
Application
Software
LAN
Display
Assembly
Marker merged to
ECG Wave here
82
Page 83

Troubleshooting Guide 4 Troubleshooting
Status Log
Many events that occur during start-up or regular monitoring are logged in the Status Log. The Status
Log can be printed and cleared. Not all entries in the Status Log are errors.
Monitor
H 1720 20050 1 4 Apr 02 16:37
C 1721 21050 1 4 Apr 02 15:37
The window title is either
log is currently displayed.
The Status Log window shows logged events which caused a reboot of the system component (monitor
or measurement server).
The first column in the log identifies the event class (“C”: caused a cold start, “H”: caused a hot start,
“N”: no retstart, for information only). Column 3 and 4 identify the event source and event code.
Column 4 counts the number of occurrences of the event. The last column shows the time and date of
the last occurrence of the event.
The following pop-up keys overlay the SmartKeys:
Clear
StatLog
Clear StatLog
This key clears the currently displayed Status Log
Revision
This key switches to the Revision Screen of the currently displayed system component
M8005
This key switches to the Monitor Revision Window
Revision M8005 M8048 M3001
Monitor or MeasServ, dependent on which system component’s status
M8048
This key switches to the Flexible Module Server (FMS) Revision Window
M3001
This key switches to the Multi Measurement Server (MMS) Revision Window
If an event occurs repeatedly, contact your Philips Service Representative.
NOTE It is possible, using the support tool, to download the status log and send it to your Philips Service
Representative as a file (for example via e-mail).
Troubleshooting with the Support Tool
Using the support tool you can:
• access the full status log which can be saved as a file
• reload software
83
Page 84

4 Troubleshooting Troubleshooting Guide
• identify defective devices
• reset touch screen calibration
For details on how to perform these tasks see the Support Tool User Manual.
84
Page 85

Troubleshooting Guide 4 Troubleshooting
Troubleshooting the Individual Measurements or Applications
For problems isolated to an individual parameter or application such as event review, please consult the
Instructions for Use and configuration information.
If the instructions for use did not resolve an individual parameter problem, then another module or
measurement server should be tried.
If you are getting questionable readings for individual measurements you may want to do the
Performance Verification tests in the Testing and Maintenance section.
The performance of the individual applications (event review, arrhythmia, trending) are affected by the
configuration of the monitor. When contacting Philips support you may be asked about the
configuration of the monitor to aid in troubleshooting.
85
Page 86

4 Troubleshooting Troubleshooting Guide
86
Page 87

5Repair and Disassembly
The following section describes the disassembly and reassembly procedures for the monitor and its
components
Tools Required
• Torx screwdrivers (sizes 6,10,20)
• 5/16" (5mm) Allen Wrench
• 2 Small flat head screwdrivers
• Needle Nose Pliars
• ESD mat and wrist strap
5
• 1 small Pozi or Philips head screwdriver
Minimal Monitor Disassembly
Disconnecting the SpeedPoint
1 Remove the cable management cover by sliding the upper pin down and the lower pin up with a
screwdriver.
87
Page 88

5 Repair and Disassembly Tools Required
Remove the two large screws with a T20 screwdriver.
2
3 Disconnect the SpeedPoint cable and pull off the SpeedPoint.
88
Page 89

Tools Required 5 Repair and Disassembly
Removing the I/O Boards
1 Remove the cable management cover as described in Disconnecting the SpeedPoint.
2 Remove the four small screws with a T10 screwdriver and take off the white plastic cover.
3 Use the board removal tool located inside the white cover to pull out the I/O boards.
Reassembly Note: You must place the MSL/LAN board in the bottom slot. For correct placement of
the boards, see I/O Boards in the Theory of Operation section.
89
Page 90

5 Repair and Disassembly Tools Required
Removing the ECG Out board if no SRL2 board is plugged
For instructions on removing the ECG Out board when an SRL2 board is plugged see Removing the
ECG Out Board with an SRL2 Board plugged.
1 Remove the mounting plate from the monitor if attached.
2 Remove the four screws with a T20 screwdriver and pull off the bottom cover.
3 Unscrew the screws on the ECG Out board and pull on the tab to remove the cable.
90
Page 91

Tools Required 5 Repair and Disassembly
Removing the Integrated Module Slot, the Measurement Server Mount or blank covers
1 Remove the bottom cover as described in Removing the ECG Out board if no SRL2 board is plugged.
2 Pull out the two pins (one on each side of the monitor) using a flat screwdriver.
Reassembly Note: When reassembling the monitor, the bottom end of the pins should snap into the
plastic holders.
3 Lift off the integrated module slot and the measurement server mount (if installed) and unplug
their cables from the main board. If no integrated module slot or measurement server mount is
installed, remove the blank covers.
Reassembly Note: Reattach the cables first before putting the integrated modules slot or measurement
server mount in place.
91
Page 92

5 Repair and Disassembly Tools Required
Separating the front and back half of the monitor
1 Remove the bottom cover as described in Removing the ECG Out board if no SRL2 board is plugged.
2 Remove integrated module slot and measurement server mount as described in Removing the
Integrated Module Slot, the Measurement Server Mount or blank covers.
3 Unplug the video cable by pulling downwards and the touch controller cable by pulling outwards
on the tab.
4 Place the monitor in an upright position and pull off the display assembly.
92
Page 93

Tools Required 5 Repair and Disassembly
Reassembly Note: When reassembling the monitor, make sure you insert the cables into the slots at the
bottom of the assembly and to slide the display assembly into its hooks.
93
Page 94

5 Repair and Disassembly Tools Required
Removing Power Switch board
1 Separate the two halves of the monitor as decribed in Separating the front and back half of the
monitor.
2 Pull out the power switch connector on the tab.
3 Remove the power switch board including its cover by pressing the plastic spring to the right using
a flat screwdriver.
94
Page 95

Tools Required 5 Repair and Disassembly
Removing the Backlights
1 Remove the two screws that hold the backlight assemblies in place.
2 Remove the cables from the backlight inverter board and slide the backlight assemblies gently out
of the side.
Backlight Inverter Board
Backlight Inverter Board
Backlight Locations
Further Disassembly
Exchanging the Touchscreen
CAUTION This procedure must be performed in a dust free environment.
1 Separate the two monitor halves as described in Separating the front and back half of the monitor.
2 Unplug the cable from the touch controller board to the touch panel and remove the six screws
that hold the plastic bezel with a T10 screwdriver.
Slide in this direction
95
Page 96

5 Repair and Disassembly Tools Required
Release the snaps on the side and pull off the display assembly from the panel.
3
Reassembly Notes:
• You must replace the touch panel and touch controller board together. The monitor will not operate
if they do not match.
• Orient the touch panel assembly to the LCD assembly and feed the ribbon connector upwards when
reassembling.
Exchanging the LCD Assembly
1 Pull off the LCD panel display adapter.
96
Ribbon Connector
Page 97

Tools Required 5 Repair and Disassembly
CAUTION Do not touch the LCD Panel.
2 Remove the backlight tube cables.
3 Remove LCD panel by unscrewing the two special screws on the top and the two regular screws on
the bottom with T10 screwdriver.
97
Page 98

5 Repair and Disassembly Tools Required
Removing Power Supply
1 Remove the cable management cover and the white plastic cover as described in Removing the I/O
Boards.
2 Remove the top cover on the back of the monitor. It snaps off in two pieces, the middle one first.
1
2
3 Lay the monitor face down, with the top facing towards you.
4 Unplug the multicolored power supply cable.
5 Remove the two screws (one on the top, one on the bottom) using a T20 screwdriver.
98
Page 99

Tools Required 5 Repair and Disassembly
Shift the power supply towards the top of the monitor and lift it off.
6
Reassembly Note: When reassembling, you must shift the power supply into place towards the bottom
of the monitor (reverse motion to step 6 above).
Removing the Speaker
1 Unplug the speaker cable.
2 Loosen the black plastic screws, rotate the speaker and pull it out.
99
Page 100

5 Repair and Disassembly Tools Required
Removing the ECG Out Board with an SRL2 Board plugged
1 Remove the screws on the SRL2 board and unplug the cable to the main board and remove the
board. You cannot unplug and remove the SRL2 cable completely from the main board until you
remove the ECG Out board.
ECG OUT
SRL2
2 Unscrew the two screws on ECG Out board and pull on the tab to remove the board
100
3 Pull the SRL2 cable out of the main board and remove it completely.
Reassembly Note: The component side faces the ECG Out board. The board sits outside the sheet
metal. Plug in the cable first.
 Loading...