

Page 1
Measurements and Monitoring
SERVICE GUIDE
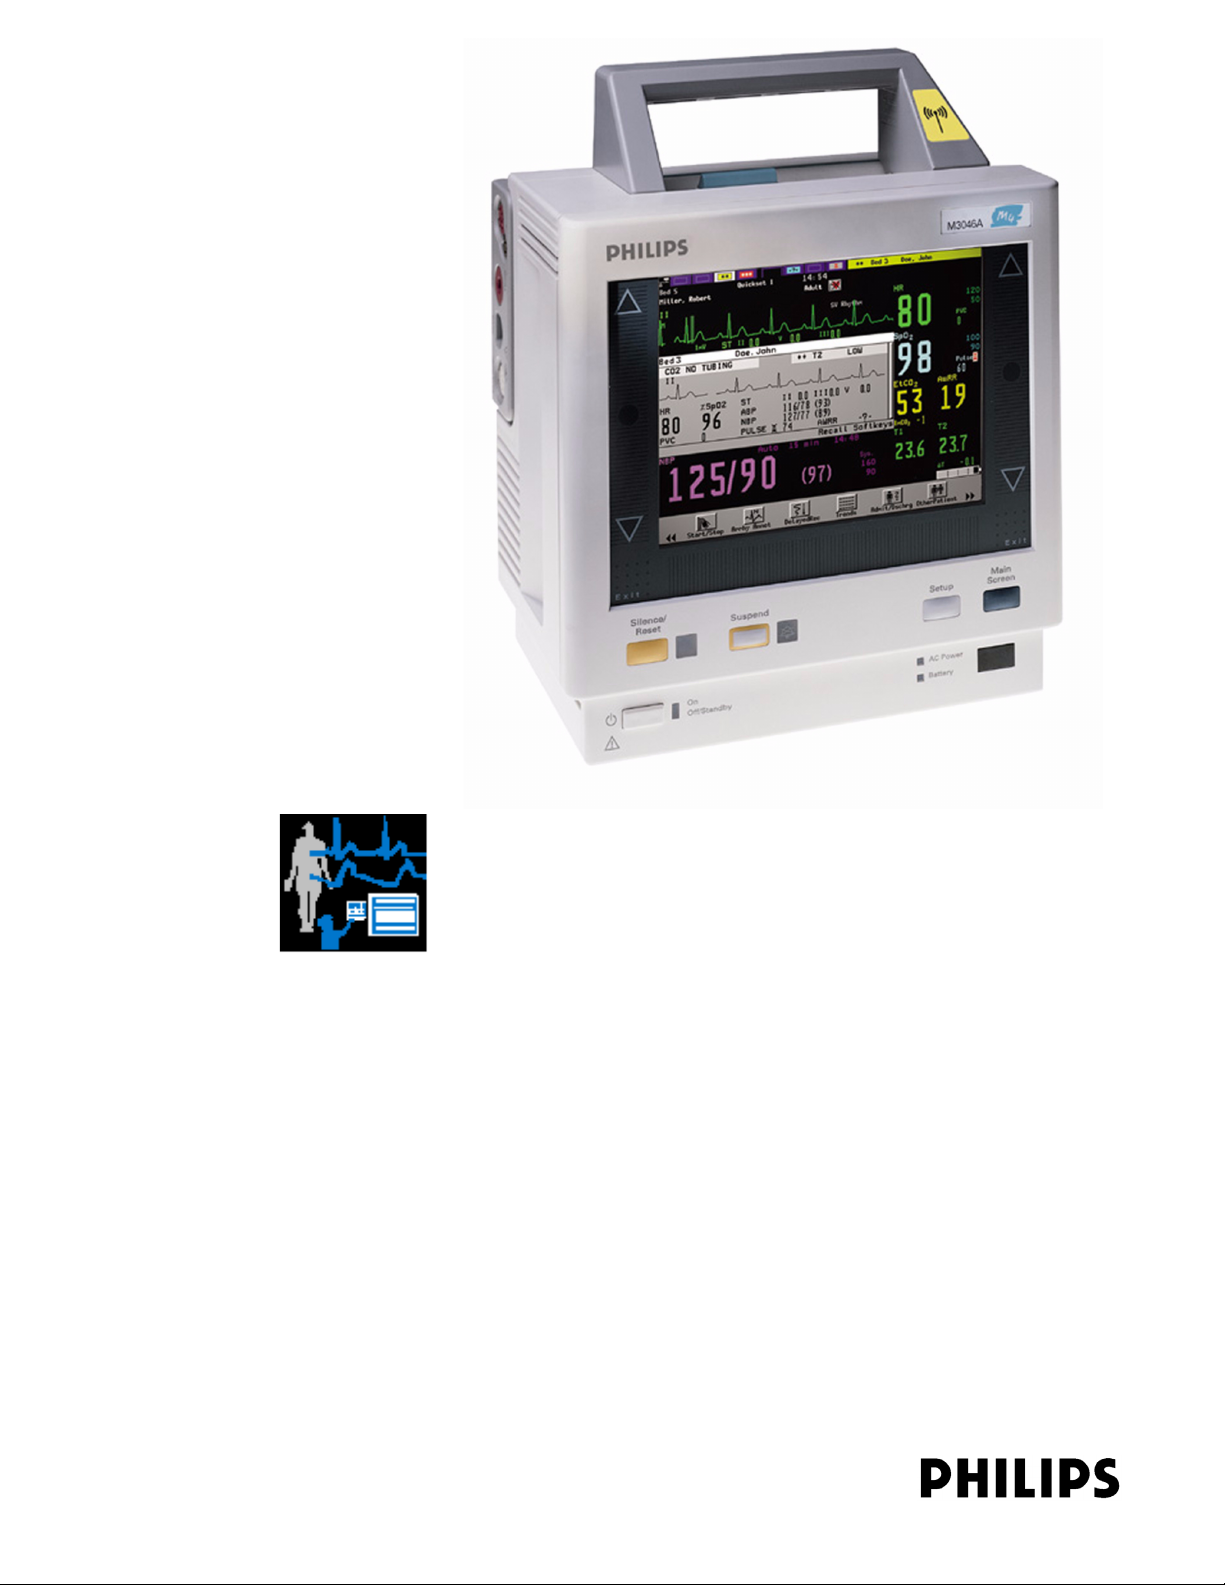
M3/M4 Monitors
(M3046A)
Measurement Server
(M3001A and M3000A)
Measurement Server Extensions
(M3015A and M3016A)
PATIENT MONITORING
Page 2

Printed in Germany 03/05
Sixth Edition
*M3046-9300F*
Part Number M3046-9300F
4512 610 07711
S
Page 3

M3046A M2/M3/M4 Monitors
M3000A/M3001A Measurement
Servers
M3015A/M3016A Extensions to the
Measurement Servers
Service Guide
Reordering Number: 4512 610 07711
Printed in Germany. March 2005
M3046-9300F
Seventh Edition
Page 4

Notice
This document contains proprietary information which is protected by copyright. All Rights
Reserved. Reproduction, adaptation, or translation without prior written permission is
prohibited, except as allowed under the copyright laws.
Philips Medizin Systeme Böblingen GmbH
Cardiac and Monitoring Systems
Hewlett-Packard Str. 2
71034 Böblingen
Germany
Printed in Germany
Warranty
The information contained in this document is subject to change without notice.
Philips Medical Systems makes no warranty of any kind with regard to this material,
including, but not limited to, the implied warranties or merchantability and fitness for a
particular purpos e.
Philips Medical Systems shall not be liable for errors contained herein or for incidental or
consequential damages in connection with the furnishing, performance, or use of this
material.
© 1995-2005 Koninklijke Philips Electronics N.V.
All Rights Reserved. Reproduction in whole or in part is prohibited without the prior written
consent of the copyright holder.
Philips Electronics North America Corporation reserves the right to make changes in
specifications or to discontinu e any pro du ct at any t ime witho ut noti ce or ob lig atio n and wi ll
not be liable for any consequences resulting from the use of this publication.
Microsoft, Windows NT and Windows 2000 are trademarks of Microsoft Corporation in the
USA and other countries.
ii
Page 5

Printing History
New editions of this document will incorporate all material updated since the previous
edition. Update packages may be issued between editions and contain replacement and
additional pages to be merged by a revision date at the bottom of the page. Note that pages
which are rearranged due to changes on a previous page are not considered revised.
The documentation printing date and part number indicate its current edition. The printing
date changes when a new edition is printed. (Minor corrections and updates which are
incorporated at reprint do not cause the date to change.) The document part number changes
when extensive technical changes are incorporated.
First Edition ................................ ...... ..July 1997
Second Edition....................................February 1999
Third Edition.......................................June 2000
Fourth Edition.....................................April 2001
Fifth Edition........................................February 2002
Sixth Edition .......................................June 2003
Seventh Edition...................................March 2005
iii
Page 6

v
Responsibility of the Manufacturer
Philips Medical Systems only considers itself responsible for any effects on safety, reliability
and performance of the equipment if:
• assembly operations, extens ions, re-adjus tments, modificat ions or repairs are carr ied out by
persons authorized by Philips, and
• the electrical installation of the relevant room complies with national standards, and
• the instrument is used in accordance with the instructions for use.
To ensure safety, use only those Philips parts and accessories specified for use with the
Monitor. If non-Philips parts are used, Philips Medical Systems is not liable for any damage
that these parts may cause to the equipment.
i
Page 7

v
In this Book
This Service Guide contains technical details on the Monitor, Measurement Server and
Measurement Server Extensions.
The purpose of this book is to provide a technical foundation for the monitoring system in
order to support effective troubleshooting and repair. The book is not intended to be a
comprehensive, in-depth explanation of the product architecture or technical implementation.
Rather, it is developed to offer enough information on the functions and operations of the
monitoring systems so that engineers who rep air them are b etter able to understand how they
work.
It covers the physiological measurements that the products are designed to provide, the
Measurement Server that acquires those measurements, and the monitoring system that
displays them.
Who Should Use this Book
If you are a biomedical engineer or a technician responsible for troubleshooting, repairing,
and maintaining Philips’s patient monitoring systems, this book is designed for you. If you
are new to Philips’s pr odu ct li ne or monitoring systems, you may find t his b oo k h e lpfu l as an
orientation to the equipment. If you have already worked on the systems and now want
further details on how they work, you are likely to find much of the information you need
here.
Conventions Used in this Book
WARNING A warning alerts you to a potential serious outcome, adverse event or safety hazard.
Failure to observe a warning may result in death or serious i njury to the user or patient.
CAUTION A caution alerts you to circumstances where special care is necessary for the safe and
effective use of the product. Failure to observe a caution may result in minor or moderate
personal injury, damage to the product or other property, and possibly in a remote risk of
more serious injury.
Page 8

vi
Page 9

Contents
1 Introduction to the Instrument . . . . . . . . . . . . . . . . . . . . . . . . . . . . . . . 1
Objectives. . . . . . . . . . . . . . . . . . . . . . . . . . . . . . . . . . . . . . . . . . . . . . . . . . . . . . . . . . . . . . . . . 1
Concepts. . . . . . . . . . . . . . . . . . . . . . . . . . . . . . . . . . . . . . . . . . . . . . . . . . . . . . . . . . . . . . . . . . 1
Introducing the Instrument Components . . . . . . . . . . . . . . . . . . . . . . . . . . . . . . . . . . . . . . . . . 2
Instrument Components. . . . . . . . . . . . . . . . . . . . . . . . . . . . . . . . . . . . . . . . . . . . . . . . . . . . . . 4
A Quick Description of the Monitor. . . . . . . . . . . . . . . . . . . . . . . . . . . . . . . . . . . . . . . . . . . . 5
Front Panel Keys . . . . . . . . . . . . . . . . . . . . . . . . . . . . . . . . . . . . . . . . . . . . . . . . . . . . . . . . 5
Front of Monitor . . . . . . . . . . . . . . . . . . . . . . . . . . . . . . . . . . . . . . . . . . . . . . . . . . . . . . . . 5
Back of Monitor: . . . . . . . . . . . . . . . . . . . . . . . . . . . . . . . . . . . . . . . . . . . . . . . . . . . . . . . . 6
A Quick Description of the Measurement Server . . . . . . . . . . . . . . . . . . . . . . . . . . . . . . . . . . 7
Overview of the Measurement Server . . . . . . . . . . . . . . . . . . . . . . . . . . . . . . . . . . . . . . . 7
Measurement Connectors for the M3000A #C06, M3001A #C06
and #C18 Measurement Servers . . . . . . . . . . . . . . . . . . . . . . . . . . . . . . . . . . . . . . . . . 7
Measurement Connectors for the Standard M3000A and M3001A Measurement Server 7
A Quick Description of the Measurement Server Extension. . . . . . . . . . . . . . . . . . . . . . . . . . 9
Overview of the Measurement Server Extensions M3015A & M3016A . . . . . . . . . . . . . 9
Measurement Connectors for the M3015A Measurement Server Extension . . . . . . . . . . 9
Measurement Connectors for the M3016A Measurement Server Extension . . . . . . . . . 10
A Quick Description of the Main Screen. . . . . . . . . . . . . . . . . . . . . . . . . . . . . . . . . . . . . . . . 10
Theories of Operation and Functional Descriptions . . . . . . . . . . . . . . . . . . . . . . . . . . . . . . . 11
Section 1 - Monitor Description. . . . . . . . . . . . . . . . . . . . . . . . . . . . . . . . . . . . . . . . . . . . . . . 11
Monitor Theory of Operation. . . . . . . . . . . . . . . . . . . . . . . . . . . . . . . . . . . . . . . . . . . . . . . . . 12
Display and User Interface Software Module . . . . . . . . . . . . . . . . . . . . . . . . . . . . . . . . . 13
Alarm Manager Software Module . . . . . . . . . . . . . . . . . . . . . . . . . . . . . . . . . . . . . . . . . 13
Admit / Discharge / Transfer (ADT) Software Module . . . . . . . . . . . . . . . . . . . . . . . . . 13
Trend Software Module . . . . . . . . . . . . . . . . . . . . . . . . . . . . . . . . . . . . . . . . . . . . . . . . . 13
Events Software Module . . . . . . . . . . . . . . . . . . . . . . . . . . . . . . . . . . . . . . . . . . . . . . . . . 13
Printer Manager . . . . . . . . . . . . . . . . . . . . . . . . . . . . . . . . . . . . . . . . . . . . . . . . . . . . . . . . 14
Recorder Manager . . . . . . . . . . . . . . . . . . . . . . . . . . . . . . . . . . . . . . . . . . . . . . . . . . . . . . 14
IrDA/Serial Communication Manager . . . . . . . . . . . . . . . . . . . . . . . . . . . . . . . . . . . . . . 15
Communication Software Module . . . . . . . . . . . . . . . . . . . . . . . . . . . . . . . . . . . . . . . . . 15
Support Services . . . . . . . . . . . . . . . . . . . . . . . . . . . . . . . . . . . . . . . . . . . . . . . . . . . . . . . 15
Functional Description of the Monitor Hardware . . . . . . . . . . . . . . . . . . . . . . . . . . . . . . . . . 16
Display Video Controller . . . . . . . . . . . . . . . . . . . . . . . . . . . . . . . . . . . . . . . . . . . . . . . . 17
Human Interface Controller . . . . . . . . . . . . . . . . . . . . . . . . . . . . . . . . . . . . . . . . . . . . . . 18
Battery Controller . . . . . . . . . . . . . . . . . . . . . . . . . . . . . . . . . . . . . . . . . . . . . . . . . . . . . . 18
ECG Out/Marker In Controller . . . . . . . . . . . . . . . . . . . . . . . . . . . . . . . . . . . . . . . . . . . . 18
Infrared (IrDA) Interface . . . . . . . . . . . . . . . . . . . . . . . . . . . . . . . . . . . . . . . . . . . . . . . . 19
Serial Interface . . . . . . . . . . . . . . . . . . . . . . . . . . . . . . . . . . . . . . . . . . . . . . . . . . . . . . . . 19
Wireless LAN Interface . . . . . . . . . . . . . . . . . . . . . . . . . . . . . . . . . . . . . . . . . . . . . . . . . 19
Section 2 - Measurement Server Description and Features . . . . . . . . . . . . . . . . . . . . . . . . . . 19
M3001A Measurement Server Standard Package . . . . . . . . . . . . . . . . . . . . . . . . . . . . . 19
M3001A Measurement Server Extended Measurements Packages . . . . . . . . . . . . . . . . 20
Contents vii
Page 10

M3000A Measurement Server Standard Package . . . . . . . . . . . . . . . . . . . . . . . . . . . . . 20
M3000A #C06 Measurement Server Extended Measurements Package . . . . . . . . . . . . 20
Features . . . . . . . . . . . . . . . . . . . . . . . . . . . . . . . . . . . . . . . . . . . . . . . . . . . . . . . . . . . . . . 20
Measurement Server Theory of Operation . . . . . . . . . . . . . . . . . . . . . . . . . . . . . . . . . . . . . . 21
Functional Description of the Measurement Server Hardware . . . . . . . . . . . . . . . . . . . . . . 22
Electrocardiogram/Respiration (ECG/Resp) Measurement . . . . . . . . . . . . . . . . . . . . . . . . . 23
Description . . . . . . . . . . . . . . . . . . . . . . . . . . . . . . . . . . . . . . . . . . . . . . . . . . . . . . . . . . . 23
Measurements . . . . . . . . . . . . . . . . . . . . . . . . . . . . . . . . . . . . . . . . . . . . . . . . . . . . . . . . . 23
ECG/Resp Features . . . . . . . . . . . . . . . . . . . . . . . . . . . . . . . . . . . . . . . . . . . . . . . . . . . . . 24
Block Diagram of the ECG/Resp . . . . . . . . . . . . . . . . . . . . . . . . . . . . . . . . . . . . . . . . . . 25
Theory of Operation . . . . . . . . . . . . . . . . . . . . . . . . . . . . . . . . . . . . . . . . . . . . . . . . . . . . 25
Non-invasive Blood Pressure (NBP) Measurement . . . . . . . . . . . . . . . . . . . . . . . . . . . . . . . 29
Description . . . . . . . . . . . . . . . . . . . . . . . . . . . . . . . . . . . . . . . . . . . . . . . . . . . . . . . . . . . 29
Measurements . . . . . . . . . . . . . . . . . . . . . . . . . . . . . . . . . . . . . . . . . . . . . . . . . . . . . . . . . 29
NBP Features . . . . . . . . . . . . . . . . . . . . . . . . . . . . . . . . . . . . . . . . . . . . . . . . . . . . . . . . . 29
Block Diagram for NBP . . . . . . . . . . . . . . . . . . . . . . . . . . . . . . . . . . . . . . . . . . . . . . . . 31
Components . . . . . . . . . . . . . . . . . . . . . . . . . . . . . . . . . . . . . . . . . . . . . . . . . . . . . . . . . . 31
NBP Measurement Characteristic . . . . . . . . . . . . . . . . . . . . . . . . . . . . . . . . . . . . . . . . . . 32
Theory of Operation . . . . . . . . . . . . . . . . . . . . . . . . . . . . . . . . . . . . . . . . . . . . . . . . . . . . 32
Arterial Oxygen Saturation and Pleth (SpO2/PLETH) Measurement. . . . . . . . . . . . . . . . . . 33
Description . . . . . . . . . . . . . . . . . . . . . . . . . . . . . . . . . . . . . . . . . . . . . . . . . . . . . . . . . . . 33
Measurements . . . . . . . . . . . . . . . . . . . . . . . . . . . . . . . . . . . . . . . . . . . . . . . . . . . . . . . . . 33
SpO2/PLETH Features . . . . . . . . . . . . . . . . . . . . . . . . . . . . . . . . . . . . . . . . . . . . . . . . . 33
Block Diagram of the SpO2/PLETH Circuit . . . . . . . . . . . . . . . . . . . . . . . . . . . . . . . . . 34
Theory of Operation . . . . . . . . . . . . . . . . . . . . . . . . . . . . . . . . . . . . . . . . . . . . . . . . . . . . 34
Temperature and Invasive Blood Pressure (Temp/Press) measurement . . . . . . . . . . . . . . . . 37
Description . . . . . . . . . . . . . . . . . . . . . . . . . . . . . . . . . . . . . . . . . . . . . . . . . . . . . . . . . . . 37
Measurements . . . . . . . . . . . . . . . . . . . . . . . . . . . . . . . . . . . . . . . . . . . . . . . . . . . . . . . . . 37
Temp/Press Features . . . . . . . . . . . . . . . . . . . . . . . . . . . . . . . . . . . . . . . . . . . . . . . . . . . . 37
Block Diagram . . . . . . . . . . . . . . . . . . . . . . . . . . . . . . . . . . . . . . . . . . . . . . . . . . . . . . . . 38
Theory of Operation . . . . . . . . . . . . . . . . . . . . . . . . . . . . . . . . . . . . . . . . . . . . . . . . . . . . 38
Temperature and Invasive Pressure Software . . . . . . . . . . . . . . . . . . . . . . . . . . . . . . . . . 39
Block Diagram of the Temp/Press Software . . . . . . . . . . . . . . . . . . . . . . . . . . . . . . . . . 40
Invasive Pressure Software Module . . . . . . . . . . . . . . . . . . . . . . . . . . . . . . . . . . . . . . . . 41
Temperature Software Module . . . . . . . . . . . . . . . . . . . . . . . . . . . . . . . . . . . . . . . . . . . . 42
Section 3 - Measurement Server Extensions Description and Features . . . . . . . . . . . . . . . . 44
Features . . . . . . . . . . . . . . . . . . . . . . . . . . . . . . . . . . . . . . . . . . . . . . . . . . . . . . . . . . . . . . 44
M3015A Measurement Server Extension Theory of Operation . . . . . . . . . . . . . . . . . . . . . . 45
Functional Description of the M3015A Measurement Server Extension Hardware. . . . . . . 46
Hardware Block Diagram . . . . . . . . . . . . . . . . . . . . . . . . . . . . . . . . . . . . . . . . . . . . . . . . 47
Sidestream CO2 Measurement. . . . . . . . . . . . . . . . . . . . . . . . . . . . . . . . . . . . . . . . . . . . . . . . 48
Description . . . . . . . . . . . . . . . . . . . . . . . . . . . . . . . . . . . . . . . . . . . . . . . . . . . . . . . . . . . 48
Measurements . . . . . . . . . . . . . . . . . . . . . . . . . . . . . . . . . . . . . . . . . . . . . . . . . . . . . . . . . 48
viii Contents
Page 11

x
Sidestream CO2 Features . . . . . . . . . . . . . . . . . . . . . . . . . . . . . . . . . . . . . . . . . . . . . . . . 49
Block Diagram of the Sidestream CO2 measurement . . . . . . . . . . . . . . . . . . . . . . . . . . . 51
Theory of Operation for M3015A Sidestream CO
2 . . . . . . . . . . . . . . . . . . . . . . . . . . . . . . . . . . . . 51
M3016A Measurement Server Extension Theory of Operation . . . . . . . . . . . . . . . . . . . . . . 53
Functional Description of the M3016A Measurement Server Extension Hardware . . . . . . . 54
Hardware Block Diagram . . . . . . . . . . . . . . . . . . . . . . . . . . . . . . . . . . . . . . . . . . . . . . . . 55
Mainstream CO2 Measurement . . . . . . . . . . . . . . . . . . . . . . . . . . . . . . . . . . . . . . . . . . . . . . . 56
Description . . . . . . . . . . . . . . . . . . . . . . . . . . . . . . . . . . . . . . . . . . . . . . . . . . . . . . . . . . . 56
Measurements . . . . . . . . . . . . . . . . . . . . . . . . . . . . . . . . . . . . . . . . . . . . . . . . . . . . . . . . . 56
Mainstream CO2 Features . . . . . . . . . . . . . . . . . . . . . . . . . . . . . . . . . . . . . . . . . . . . . . . . 57
Block Diagram of the Mainstream CO2 measurement . . . . . . . . . . . . . . . . . . . . . . . . . . 59
Theory of Operation for the M3016A Mainstream CO
2 . . . . . . . . . . . . . . . . . . . . . . . . . . . . . . . 60
Tutorial for the Introduction to the Instrument . . . . . . . . . . . . . . . . . . . . . . . . . . . . . . . . . . . 61
Answers to the Tutorial for the Introduction to the Instrument. . . . . . . . . . . . . . . . . . . . . . . 62
2 Installing the Instrument. . . . . . . . . . . . . . . . . . . . . . . . . . . . . . . . . . . . 63
Objectives. . . . . . . . . . . . . . . . . . . . . . . . . . . . . . . . . . . . . . . . . . . . . . . . . . . . . . . . . . . . . . . . 63
Concepts. . . . . . . . . . . . . . . . . . . . . . . . . . . . . . . . . . . . . . . . . . . . . . . . . . . . . . . . . . . . . . . . . 63
Safety . . . . . . . . . . . . . . . . . . . . . . . . . . . . . . . . . . . . . . . . . . . . . . . . . . . . . . . . . . . . . . . . . . . 64
Patient Safety . . . . . . . . . . . . . . . . . . . . . . . . . . . . . . . . . . . . . . . . . . . . . . . . . . . . . . . . . 64
Patient Leakage Current . . . . . . . . . . . . . . . . . . . . . . . . . . . . . . . . . . . . . . . . . . . . . . . . . 64
Preparing to Install the Monitor. . . . . . . . . . . . . . . . . . . . . . . . . . . . . . . . . . . . . . . . . . . . . . . 64
Power Source Requirements . . . . . . . . . . . . . . . . . . . . . . . . . . . . . . . . . . . . . . . . . . . . . . 64
Protecting against Electric Shock . . . . . . . . . . . . . . . . . . . . . . . . . . . . . . . . . . . . . . . . . . 64
. . . . . . . . . . . . . . . . . . . . . . . . . . . . . . . . . . . . . . . . . . . . . . . . . . . . . . . . . . . . . . . . . . . . . 65
Equipotential Grounding . . . . . . . . . . . . . . . . . . . . . . . . . . . . . . . . . . . . . . . . . . . . . . . . . 65
Combining Equipment . . . . . . . . . . . . . . . . . . . . . . . . . . . . . . . . . . . . . . . . . . . . . . . . . . 65
Environment . . . . . . . . . . . . . . . . . . . . . . . . . . . . . . . . . . . . . . . . . . . . . . . . . . . . . . . . . . 66
Explanation of symbols used: . . . . . . . . . . . . . . . . . . . . . . . . . . . . . . . . . . . . . . . . . . . . . 67
Unpacking the Monitor . . . . . . . . . . . . . . . . . . . . . . . . . . . . . . . . . . . . . . . . . . . . . . . . . . . . . 70
Installing the Monitor. . . . . . . . . . . . . . . . . . . . . . . . . . . . . . . . . . . . . . . . . . . . . . . . . . . . . . . 70
Connecting the Measurement Server... . . . . . . . . . . . . . . . . . . . . . . . . . . . . . . . . . . . . . . . . . 71
...with the Measurement Server directly on the Monitor . . . . . . . . . . . . . . . . . . . . . . . . 71
...with the Measurement Server Separate from the Monitor . . . . . . . . . . . . . . . . . . . . . . 73
...with the Measurement Server Attached to an M3015A/M3016A Measurement Server Ex-
tension . . . . . . . . . . . . . . . . . . . . . . . . . . . . . . . . . . . . . . . . . . . . . . . . . . . . . . . . . . . . 74
Attaching the Monitor to a Mount . . . . . . . . . . . . . . . . . . . . . . . . . . . . . . . . . . . . . . . . . . . . . 74
Detaching the Monitor from a Mount . . . . . . . . . . . . . . . . . . . . . . . . . . . . . . . . . . . . . . . . . . 74
Attaching the Measurement Server to a Mount . . . . . . . . . . . . . . . . . . . . . . . . . . . . . . . . . . . 75
Detaching the Measurement Server from a Mount . . . . . . . . . . . . . . . . . . . . . . . . . . . . . . . . 75
Positioning the Measurement Server on a Clamp Mount . . . . . . . . . . . . . . . . . . . . . . . . . . . 75
Connecting to the Nurse Call Relay. . . . . . . . . . . . . . . . . . . . . . . . . . . . . . . . . . . . . . . . . . . . 76
Modification for Nurse Call Alarm Relays . . . . . . . . . . . . . . . . . . . . . . . . . . . . . . . . . . . . . . 76
Verification Procedure . . . . . . . . . . . . . . . . . . . . . . . . . . . . . . . . . . . . . . . . . . . . . . . . . . 78
Contents i
Page 12

Installation of Wireless Infrastructure . . . . . . . . . . . . . . . . . . . . . . . . . . . . . . . . . . . . . . . . . . 78
Configuring the Radio Frequency of the M3/M4 Monitor . . . . . . . . . . . . . . . . . . . . . . . 78
Connecting to the ECG Output or Marker Input . . . . . . . . . . . . . . . . . . . . . . . . . . . . . . . . . . 87
Configuring the Monitor . . . . . . . . . . . . . . . . . . . . . . . . . . . . . . . . . . . . . . . . . . . . . . . . . . . . 87
Selecting NBP Measurement Characteristic . . . . . . . . . . . . . . . . . . . . . . . . . . . . . . . . . . 87
Installing an Additional Display . . . . . . . . . . . . . . . . . . . . . . . . . . . . . . . . . . . . . . . . . . . . . . 90
Displays . . . . . . . . . . . . . . . . . . . . . . . . . . . . . . . . . . . . . . . . . . . . . . . . . . . . . . . . . . . . . 90
Safety Specification . . . . . . . . . . . . . . . . . . . . . . . . . . . . . . . . . . . . . . . . . . . . . . . . . . . . 92
Installation . . . . . . . . . . . . . . . . . . . . . . . . . . . . . . . . . . . . . . . . . . . . . . . . . . . . . . . . . . . 92
Installing the 12V Adapter. . . . . . . . . . . . . . . . . . . . . . . . . . . . . . . . . . . . . . . . . . . . . . . . . . . 93
Using the Battery Charger and Conditioner . . . . . . . . . . . . . . . . . . . . . . . . . . . . . . . . . . . . . 93
Connecting a Printer . . . . . . . . . . . . . . . . . . . . . . . . . . . . . . . . . . . . . . . . . . . . . . . . . . . . . . . 93
Selecting a Printer . . . . . . . . . . . . . . . . . . . . . . . . . . . . . . . . . . . . . . . . . . . . . . . . . . . . . . 93
Installing the Wireless Infrared Printer Connector (M3080A #H05) . . . . . . . . . . . . . . . . . . 94
Connecting a Local Printer . . . . . . . . . . . . . . . . . . . . . . . . . . . . . . . . . . . . . . . . . . . . . . . . . . 95
Connecting a Remote Printer. . . . . . . . . . . . . . . . . . . . . . . . . . . . . . . . . . . . . . . . . . . . . . . . . 96
Connecting a Local Recorder . . . . . . . . . . . . . . . . . . . . . . . . . . . . . . . . . . . . . . . . . . . . . . . . 96
Site Preparation Guidelines . . . . . . . . . . . . . . . . . . . . . . . . . . . . . . . . . . . . . . . . . . . . . . . . . . 97
Mounting Solutions . . . . . . . . . . . . . . . . . . . . . . . . . . . . . . . . . . . . . . . . . . . . . . . . . . . . . . . . 98
Installing the Table Mount (M3080A #A10). . . . . . . . . . . . . . . . . . . . . . . . . . . . . . . . . . . . . 98
Installing the Universal Bed Hanger (M3080A #A11) . . . . . . . . . . . . . . . . . . . . . . . . . . . . . 99
Warnings, Cautions, and Safety Precautions Relating to Wall Mount Installation. . . . . . . 100
Installing the Wall Rail (M3080A #A13) . . . . . . . . . . . . . . . . . . . . . . . . . . . . . . . . . . . . . . 101
Installing the Tilt/Swivel Mount (M3080A #A14) . . . . . . . . . . . . . . . . . . . . . . . . . . . . . . . 101
Screwed Directly to a Wall . . . . . . . . . . . . . . . . . . . . . . . . . . . . . . . . . . . . . . . . . . . . . . 102
Mounted to the GCX Wall Channel (M3080A #A15) . . . . . . . . . . . . . . . . . . . . . . . . . 103
Attached to a Universal Pole Clamp . . . . . . . . . . . . . . . . . . . . . . . . . . . . . . . . . . . . . . . 104
Attached to the Monitor . . . . . . . . . . . . . . . . . . . . . . . . . . . . . . . . . . . . . . . . . . . . . . . . 105
Installing the GCX Wall Channel (M3080A #A15) . . . . . . . . . . . . . . . . . . . . . . . . . . . . . . 106
Installing the Universal Pole Clamp (M3080A #C05) . . . . . . . . . . . . . . . . . . . . . . . . . . . . 107
Installing the Measurement Server Mounting Options . . . . . . . . . . . . . . . . . . . . . . . . . . . . 108
Server Mounting Plate (M3080A #A01) . . . . . . . . . . . . . . . . . . . . . . . . . . . . . . . . . . . 108
Server Mounting Plate (M3080A #A02) . . . . . . . . . . . . . . . . . . . . . . . . . . . . . . . . . . . 111
Mounting Options for the Local Recorder. . . . . . . . . . . . . . . . . . . . . . . . . . . . . . . . . . . . . . 111
MSL Cable Termination . . . . . . . . . . . . . . . . . . . . . . . . . . . . . . . . . . . . . . . . . . . . . . . . . . . 112
Disposing of the Monitor, Measurement Server and Measurement Server Extensions . . . 115
Tutorial for Installing the Instrument . . . . . . . . . . . . . . . . . . . . . . . . . . . . . . . . . . . . . . . . . 116
Answers to the Tutorial for Installing the Instrument . . . . . . . . . . . . . . . . . . . . . . . . . . . . . 117
3 Maintaining the Instrument. . . . . . . . . . . . . . . . . . . . . . . . . . . . . . . . 119
Objectives . . . . . . . . . . . . . . . . . . . . . . . . . . . . . . . . . . . . . . . . . . . . . . . . . . . . . . . . . . . . . . 119
Concepts . . . . . . . . . . . . . . . . . . . . . . . . . . . . . . . . . . . . . . . . . . . . . . . . . . . . . . . . . . . . . . . 119
Recommendations for Maintenance Frequency . . . . . . . . . . . . . . . . . . . . . . . . . . . . . . . . . 120
Maintenance Checklist. . . . . . . . . . . . . . . . . . . . . . . . . . . . . . . . . . . . . . . . . . . . . . . . . . . . . 121
x Contents
Page 13

x
Inspecting the Instrument. . . . . . . . . . . . . . . . . . . . . . . . . . . . . . . . . . . . . . . . . . . . . . . . . . . 122
Inspect Cables and Cords . . . . . . . . . . . . . . . . . . . . . . . . . . . . . . . . . . . . . . . . . . . . . . . 122
Preventive Maintenance Tasks. . . . . . . . . . . . . . . . . . . . . . . . . . . . . . . . . . . . . . . . . . . . . . . 123
M3046A . . . . . . . . . . . . . . . . . . . . . . . . . . . . . . . . . . . . . . . . . . . . . . . . . . . . . . . . . . . . 123
M3000A / M3001A . . . . . . . . . . . . . . . . . . . . . . . . . . . . . . . . . . . . . . . . . . . . . . . . . . . . 123
Replacement of the Pump and CO2 Scrubber . . . . . . . . . . . . . . . . . . . . . . . . . . . . . . . . 125
Replacement of the Infrared Lamp . . . . . . . . . . . . . . . . . . . . . . . . . . . . . . . . . . . . . . . . 125
General Cleaning of the Instrument. . . . . . . . . . . . . . . . . . . . . . . . . . . . . . . . . . . . . . . . . . . 125
Cleaning Guidelines . . . . . . . . . . . . . . . . . . . . . . . . . . . . . . . . . . . . . . . . . . . . . . . . . . . 125
Cleaning Agents . . . . . . . . . . . . . . . . . . . . . . . . . . . . . . . . . . . . . . . . . . . . . . . . . . . . . . 126
Battery Handling, Maintenance and Good Practices . . . . . . . . . . . . . . . . . . . . . . . . . . . . . . 127
About the Battery . . . . . . . . . . . . . . . . . . . . . . . . . . . . . . . . . . . . . . . . . . . . . . . . . . . . . 127
Checking the Battery Status . . . . . . . . . . . . . . . . . . . . . . . . . . . . . . . . . . . . . . . . . . . . . 127
Charging the Battery . . . . . . . . . . . . . . . . . . . . . . . . . . . . . . . . . . . . . . . . . . . . . . . . . . . 129
Conditioning a Battery . . . . . . . . . . . . . . . . . . . . . . . . . . . . . . . . . . . . . . . . . . . . . . . . . 130
Accessing the Battery Status Window . . . . . . . . . . . . . . . . . . . . . . . . . . . . . . . . . . . . . 132
Battery INOP Messages . . . . . . . . . . . . . . . . . . . . . . . . . . . . . . . . . . . . . . . . . . . . . . . . 134
Tutorial for Maintaining the Instrument . . . . . . . . . . . . . . . . . . . . . . . . . . . . . . . . . . . . . . . 135
Answers to the Tutorial for Maintaining the Instrument . . . . . . . . . . . . . . . . . . . . . . . . . . . 136
4 Testing the Instrument . . . . . . . . . . . . . . . . . . . . . . . . . . . . . . . . . . . 137
Objectives. . . . . . . . . . . . . . . . . . . . . . . . . . . . . . . . . . . . . . . . . . . . . . . . . . . . . . . . . . . . . . . 137
Concepts. . . . . . . . . . . . . . . . . . . . . . . . . . . . . . . . . . . . . . . . . . . . . . . . . . . . . . . . . . . . . . . . 137
Test Reporting . . . . . . . . . . . . . . . . . . . . . . . . . . . . . . . . . . . . . . . . . . . . . . . . . . . . . . . . . . . 138
Recommendations for Test Frequency. . . . . . . . . . . . . . . . . . . . . . . . . . . . . . . . . . . . . . . . . 139
Test Map. . . . . . . . . . . . . . . . . . . . . . . . . . . . . . . . . . . . . . . . . . . . . . . . . . . . . . . . . . . . . . . . 140
Testing Checklist . . . . . . . . . . . . . . . . . . . . . . . . . . . . . . . . . . . . . . . . . . . . . . . . . . . . . . . . . 141
Serial Numbers. . . . . . . . . . . . . . . . . . . . . . . . . . . . . . . . . . . . . . . . . . . . . . . . . . . . . . . . . . . 142
Passwords. . . . . . . . . . . . . . . . . . . . . . . . . . . . . . . . . . . . . . . . . . . . . . . . . . . . . . . . . . . . . . . 142
Visual Test . . . . . . . . . . . . . . . . . . . . . . . . . . . . . . . . . . . . . . . . . . . . . . . . . . . . . . . . . . . . . . 142
Power On Test . . . . . . . . . . . . . . . . . . . . . . . . . . . . . . . . . . . . . . . . . . . . . . . . . . . . . . . . . . . 142
Functionality Assurance Tests . . . . . . . . . . . . . . . . . . . . . . . . . . . . . . . . . . . . . . . . . . . . . . . 143
Performance Assurance Test . . . . . . . . . . . . . . . . . . . . . . . . . . . . . . . . . . . . . . . . . . . . . 143
Quick System Check . . . . . . . . . . . . . . . . . . . . . . . . . . . . . . . . . . . . . . . . . . . . . . . . . . . 143
System Self-Test . . . . . . . . . . . . . . . . . . . . . . . . . . . . . . . . . . . . . . . . . . . . . . . . . . . . . . 144
System Self-Test Values . . . . . . . . . . . . . . . . . . . . . . . . . . . . . . . . . . . . . . . . . . . . . . . . 145
Preventive Maintenance Tests . . . . . . . . . . . . . . . . . . . . . . . . . . . . . . . . . . . . . . . . . . . . . . . 146
NBP Accuracy, Leakage, Linearity and Valve Test . . . . . . . . . . . . . . . . . . . . . . . . . . . 146
Sidestream CO2 Performance Test . . . . . . . . . . . . . . . . . . . . . . . . . . . . . . . . . . . . . . . . 148
Checking and Resetting Time Counters . . . . . . . . . . . . . . . . . . . . . . . . . . . . . . . . . . . . 153
Documenting CO2 Test Results . . . . . . . . . . . . . . . . . . . . . . . . . . . . . . . . . . . . . . . . . . 154
Accuracy and Performance Procedures . . . . . . . . . . . . . . . . . . . . . . . . . . . . . . . . . . . . . . . . 155
Temperature Accuracy . . . . . . . . . . . . . . . . . . . . . . . . . . . . . . . . . . . . . . . . . . . . . . . . . 155
ECG/Resp Performance . . . . . . . . . . . . . . . . . . . . . . . . . . . . . . . . . . . . . . . . . . . . . . . . 155
Contents
i
Page 14

Invasive Pressure Performance Test . . . . . . . . . . . . . . . . . . . . . . . . . . . . . . . . . . . . . . . 156
SpO2 Performance Test . . . . . . . . . . . . . . . . . . . . . . . . . . . . . . . . . . . . . . . . . . . . . . . . 157
Mainstream CO2 Performance Test . . . . . . . . . . . . . . . . . . . . . . . . . . . . . . . . . . . . . . . 157
Nurse Call Relay Performance Test . . . . . . . . . . . . . . . . . . . . . . . . . . . . . . . . . . . . . . . 157
ECG Sync Performance Test . . . . . . . . . . . . . . . . . . . . . . . . . . . . . . . . . . . . . . . . . . . . 158
Patient Safety Checks . . . . . . . . . . . . . . . . . . . . . . . . . . . . . . . . . . . . . . . . . . . . . . . . . . . . . 159
Warnings, Cautions, and Safety Precautions . . . . . . . . . . . . . . . . . . . . . . . . . . . . . . . . 159
Safety Test Procedures . . . . . . . . . . . . . . . . . . . . . . . . . . . . . . . . . . . . . . . . . . . . . . . . . 159
Tutorial for Testing the Instrument . . . . . . . . . . . . . . . . . . . . . . . . . . . . . . . . . . . . . . . . . . . 163
Answers to the Tutorial for Testing the Instrument. . . . . . . . . . . . . . . . . . . . . . . . . . . . . . . 164
5 Troubleshooting the Instrument . . . . . . . . . . . . . . . . . . . . . . . . . . . 165
Objectives . . . . . . . . . . . . . . . . . . . . . . . . . . . . . . . . . . . . . . . . . . . . . . . . . . . . . . . . . . . . . . 165
Concepts . . . . . . . . . . . . . . . . . . . . . . . . . . . . . . . . . . . . . . . . . . . . . . . . . . . . . . . . . . . . . . . 165
Part 1 Troubleshooting Checklists. . . . . . . . . . . . . . . . . . . . . . . . . . . . . . . . . . . . . . . . . . . . 166
Checks for Obvious Problems . . . . . . . . . . . . . . . . . . . . . . . . . . . . . . . . . . . . . . . . . . . 166
Checks Before Opening the Instrument . . . . . . . . . . . . . . . . . . . . . . . . . . . . . . . . . . . . 166
First Steps . . . . . . . . . . . . . . . . . . . . . . . . . . . . . . . . . . . . . . . . . . . . . . . . . . . . . . . . . . . 173
Initial Instrument Boot Phase . . . . . . . . . . . . . . . . . . . . . . . . . . . . . . . . . . . . . . . . . . . . 173
Isolating Problems to the Correct Subassembly . . . . . . . . . . . . . . . . . . . . . . . . . . . . . . 175
Part 2 Isolating and Solving Instrument Problems . . . . . . . . . . . . . . . . . . . . . . . . . . . . . . . 177
INOP Messages . . . . . . . . . . . . . . . . . . . . . . . . . . . . . . . . . . . . . . . . . . . . . . . . . . . . . . 177
Isolating the Defective Component . . . . . . . . . . . . . . . . . . . . . . . . . . . . . . . . . . . . . . . 183
Part 3 Using Support Functions. . . . . . . . . . . . . . . . . . . . . . . . . . . . . . . . . . . . . . . . . . . . . . 197
The Status Log and Error Codes . . . . . . . . . . . . . . . . . . . . . . . . . . . . . . . . . . . . . . . . . . 197
List of Error Codes . . . . . . . . . . . . . . . . . . . . . . . . . . . . . . . . . . . . . . . . . . . . . . . . . . . . 199
Testing Wireless Network Connectivity . . . . . . . . . . . . . . . . . . . . . . . . . . . . . . . . . . . . . . . 204
Antenna Check . . . . . . . . . . . . . . . . . . . . . . . . . . . . . . . . . . . . . . . . . . . . . . . . . . . . . . . 204
Using Service Mode . . . . . . . . . . . . . . . . . . . . . . . . . . . . . . . . . . . . . . . . . . . . . . . . . . . . . . 206
Service Mode Hardware Tests . . . . . . . . . . . . . . . . . . . . . . . . . . . . . . . . . . . . . . . . . . . 206
How To Access the Monitor and Server Revision Screen . . . . . . . . . . . . . . . . . . . . . . 209
Troubleshooting the Installed Instrument . . . . . . . . . . . . . . . . . . . . . . . . . . . . . . . . . . . . . . 210
Troubleshooting with Self-Test Alarm Messages
(When You Switch the Monitor On) . . . . . . . . . . . . . . . . . . . . . . . . . . . . . . . . . . . 210
Troubleshooting When There is No Message on the Screen . . . . . . . . . . . . . . . . . . . . 213
Troubleshooting During/After a Software Upgrade . . . . . . . . . . . . . . . . . . . . . . . . . . . . . . 214
Troubleshooting the Printer Connection . . . . . . . . . . . . . . . . . . . . . . . . . . . . . . . . . . . . . . . 214
Troubleshooting the Recorder Connection . . . . . . . . . . . . . . . . . . . . . . . . . . . . . . . . . . . . . 215
Tutorial for Troubleshooting the Instrument. . . . . . . . . . . . . . . . . . . . . . . . . . . . . . . . . . . . 217
Answers to the Tutorial for Troubleshooting the Instrument . . . . . . . . . . . . . . . . . . . . . . . 218
6 Repairing the Instrument . . . . . . . . . . . . . . . . . . . . . . . . . . . . . . . . . 219
Objectives . . . . . . . . . . . . . . . . . . . . . . . . . . . . . . . . . . . . . . . . . . . . . . . . . . . . . . . . . . . . . . 219
Concepts . . . . . . . . . . . . . . . . . . . . . . . . . . . . . . . . . . . . . . . . . . . . . . . . . . . . . . . . . . . . . . . 219
xii Contents
Page 15

x
Warnings, Cautions and Safety Precautions . . . . . . . . . . . . . . . . . . . . . . . . . . . . . . . . . . . . 220
General Reassembly/Refitting Comments. . . . . . . . . . . . . . . . . . . . . . . . . . . . . . . . . . . . . . 220
Disassembly for the Monitor . . . . . . . . . . . . . . . . . . . . . . . . . . . . . . . . . . . . . . . . . . . . . . . . 221
Removing the Battery . . . . . . . . . . . . . . . . . . . . . . . . . . . . . . . . . . . . . . . . . . . . . . . . . . 221
Removing the Power Supply . . . . . . . . . . . . . . . . . . . . . . . . . . . . . . . . . . . . . . . . . . . . . 221
Removing the Chassis . . . . . . . . . . . . . . . . . . . . . . . . . . . . . . . . . . . . . . . . . . . . . . . . . . 222
Removing the System Board . . . . . . . . . . . . . . . . . . . . . . . . . . . . . . . . . . . . . . . . . . . . . 224
Removing the Wireless Assembly (for Monitors with Wireless LAN Interface only) 226
Removing the LCD Assembly and Backlight Tubes . . . . . . . . . . . . . . . . . . . . . . . . . . 226
Removing the Connector Board . . . . . . . . . . . . . . . . . . . . . . . . . . . . . . . . . . . . . . . . . . 228
Removing the Speaker . . . . . . . . . . . . . . . . . . . . . . . . . . . . . . . . . . . . . . . . . . . . . . . . . 229
Refit Procedures for the Monitor . . . . . . . . . . . . . . . . . . . . . . . . . . . . . . . . . . . . . . . . . . . . . 230
Refitting the System Board . . . . . . . . . . . . . . . . . . . . . . . . . . . . . . . . . . . . . . . . . . . . . . 230
Refitting the LCD Assembly and Backlight Tubes . . . . . . . . . . . . . . . . . . . . . . . . . . . 230
Refitting the Connector Board . . . . . . . . . . . . . . . . . . . . . . . . . . . . . . . . . . . . . . . . . . . 230
Refitting the Speaker . . . . . . . . . . . . . . . . . . . . . . . . . . . . . . . . . . . . . . . . . . . . . . . . . . . 230
Refitting the Power Supply . . . . . . . . . . . . . . . . . . . . . . . . . . . . . . . . . . . . . . . . . . . . . . 230
Refitting the Wireless Assembly . . . . . . . . . . . . . . . . . . . . . . . . . . . . . . . . . . . . . . . . . . 231
Refitting the Chassis . . . . . . . . . . . . . . . . . . . . . . . . . . . . . . . . . . . . . . . . . . . . . . . . . . . 231
Refitting the Battery . . . . . . . . . . . . . . . . . . . . . . . . . . . . . . . . . . . . . . . . . . . . . . . . . . . 231
Disassembly Procedures for the M3015A Measurement Server Extension . . . . . . . . . . . . 232
Removing the Front Cover . . . . . . . . . . . . . . . . . . . . . . . . . . . . . . . . . . . . . . . . . . . . . . 232
Removing the Extension Bottom Cover . . . . . . . . . . . . . . . . . . . . . . . . . . . . . . . . . . . . 233
Removing the CO2 Scrubber . . . . . . . . . . . . . . . . . . . . . . . . . . . . . . . . . . . . . . . . . . . . . 235
Removing the Pump . . . . . . . . . . . . . . . . . . . . . . . . . . . . . . . . . . . . . . . . . . . . . . . . . . . 236
Refit Procedures for the M3015A Measurement Server Extension. . . . . . . . . . . . . . . . . . . 237
Refitting the CO2 Scrubber . . . . . . . . . . . . . . . . . . . . . . . . . . . . . . . . . . . . . . . . . . . . . . 237
Refitting the Pump . . . . . . . . . . . . . . . . . . . . . . . . . . . . . . . . . . . . . . . . . . . . . . . . . . . . 238
Refitting the Extension Bottom Cover . . . . . . . . . . . . . . . . . . . . . . . . . . . . . . . . . . . . . 238
Refitting the Front Cover . . . . . . . . . . . . . . . . . . . . . . . . . . . . . . . . . . . . . . . . . . . . . . . 238
Disassembly Procedures for the M8043A Battery Charger and Conditioner . . . . . . . . . . . 239
Opening the Housing . . . . . . . . . . . . . . . . . . . . . . . . . . . . . . . . . . . . . . . . . . . . . . . . . . 239
Removing the Cooling Fans . . . . . . . . . . . . . . . . . . . . . . . . . . . . . . . . . . . . . . . . . . . . . 240
Removing the Air Filters . . . . . . . . . . . . . . . . . . . . . . . . . . . . . . . . . . . . . . . . . . . . . . . . 242
Reassembling the Battery Charger and Conditioner . . . . . . . . . . . . . . . . . . . . . . . . . . . . . . 242
Following Reassembly. . . . . . . . . . . . . . . . . . . . . . . . . . . . . . . . . . . . . . . . . . . . . . . . . . . . . 242
Tutorial for Repairing the Instrument . . . . . . . . . . . . . . . . . . . . . . . . . . . . . . . . . . . . . . . . . 243
Answers to Tutorial for Repairing the Instrument. . . . . . . . . . . . . . . . . . . . . . . . . . . . . . . . 244
7 Replacement Parts . . . . . . . . . . . . . . . . . . . . . . . . . . . . . . . . . . . . . . . 245
Objectives. . . . . . . . . . . . . . . . . . . . . . . . . . . . . . . . . . . . . . . . . . . . . . . . . . . . . . . . . . . . . . . 245
Compatibility Matrix - Release A to Release B. . . . . . . . . . . . . . . . . . . . . . . . . . . . . . . . . . 245
List of Replacement and Exchange Parts. . . . . . . . . . . . . . . . . . . . . . . . . . . . . . . . . . . . . . . 247
Monitor Parts . . . . . . . . . . . . . . . . . . . . . . . . . . . . . . . . . . . . . . . . . . . . . . . . . . . . . . . . . . . . 248
Contents
iii
Page 16

v
Bezel Parts . . . . . . . . . . . . . . . . . . . . . . . . . . . . . . . . . . . . . . . . . . . . . . . . . . . . . . . . . . 248
Other Monitor Parts . . . . . . . . . . . . . . . . . . . . . . . . . . . . . . . . . . . . . . . . . . . . . . . . . . . 250
Monitor Exchange Parts . . . . . . . . . . . . . . . . . . . . . . . . . . . . . . . . . . . . . . . . . . . . . . . . 251
Small Parts Kit . . . . . . . . . . . . . . . . . . . . . . . . . . . . . . . . . . . . . . . . . . . . . . . . . . . . . . . 253
Multi-Measurement Server Parts. . . . . . . . . . . . . . . . . . . . . . . . . . . . . . . . . . . . . . . . . . . . . 254
M3001A Part Numbers - Front Bezel . . . . . . . . . . . . . . . . . . . . . . . . . . . . . . . . . . . . . . 254
M3001A MMS Part Numbers - IntelliVue Software Revision A.05.xx and Lower . . 256
M3001A MMS Part Numbers - IntelliVue Software Revision A.10.xx and Higher . . 259
M3015A Measurement Server Extension Parts. . . . . . . . . . . . . . . . . . . . . . . . . . . . . . . . . . 266
M3015A Parts . . . . . . . . . . . . . . . . . . . . . . . . . . . . . . . . . . . . . . . . . . . . . . . . . . . . . . . . 266
M3015A Exchange Parts . . . . . . . . . . . . . . . . . . . . . . . . . . . . . . . . . . . . . . . . . . . . . . . 268
M3016A Measurement Server Extension Parts. . . . . . . . . . . . . . . . . . . . . . . . . . . . . . . . . . 270
M3016A Parts . . . . . . . . . . . . . . . . . . . . . . . . . . . . . . . . . . . . . . . . . . . . . . . . . . . . . . . . 270
M3016A Measurement Server Extension Exchange Parts . . . . . . . . . . . . . . . . . . . . . . 271
Support-Related Parts . . . . . . . . . . . . . . . . . . . . . . . . . . . . . . . . . . . . . . . . . . . . . . . . . . . . . 272
Cables and MSL Through Wall Installation Parts. . . . . . . . . . . . . . . . . . . . . . . . . . . . . . . . 272
MMS Measurement Server Link (MSL) Cable Clamp Kit . . . . . . . . . . . . . . . . . . . . . . . . . 273
Wireless Assembly Exchange Parts. . . . . . . . . . . . . . . . . . . . . . . . . . . . . . . . . . . . . . . . . . . 273
Battery and Battery-Related Parts . . . . . . . . . . . . . . . . . . . . . . . . . . . . . . . . . . . . . . . . . . . . 274
Battery Parts . . . . . . . . . . . . . . . . . . . . . . . . . . . . . . . . . . . . . . . . . . . . . . . . . . . . . . . . . 274
Battery Exchange Parts . . . . . . . . . . . . . . . . . . . . . . . . . . . . . . . . . . . . . . . . . . . . . . . . . 274
Battery Charger and Conditioner Parts . . . . . . . . . . . . . . . . . . . . . . . . . . . . . . . . . . . . . 274
XE-50p Recorder Exchange Parts . . . . . . . . . . . . . . . . . . . . . . . . . . . . . . . . . . . . . . . . . . . 274
xi
Contents
Page 17

1 Introduction to the Instrument
Objectives
In order to meet this chapter’s goals, you should become familiar with the Monitor,
Measurement Server and the Measurement Server Extensions, and be able to identify their
component parts in some detail. As well, you shou ld be able to explain how the Measurement
Server and Measurement Server Extensions acqui re and process phy siological measur ements
and how the Monitor displays the data.
The following topics are covered in this chapter:
• Introducing the Instrument Components
• Section 1 - Monitor Description
• Functional Description of the Monitor Hardware
• Section 2 - Measurement Server Description and Feat ur es
• Measurement Server Theory of Operation
• Functional Description of the Measurement Server Hardware
• Electrocardiogram/Respiration (ECG/Resp) Measurement
• Non-invasive Blood Pressure (NBP) Measurement
• Arterial Oxygen Saturation and Pleth (SpO2/PLETH) Measurement
• T emp erature and Inv a sive Bloo d Pressure (Temp/Pr ess) measur ement
• Section 3 - Measurement Server Extensions Description and Features
• M3015A Measurement Server Extension Theory of Operation
• Functional Description of the M3015A Measurement Server Extension Hardware
• Sidestream CO2 Measurement
• M3016A Measurement Server Extension Theory of Operation
• Functional Description of the M3016A Measurement Server Extension Hardware
• Mainstream CO2 Measurement
Concepts
The following section contains information that you need to understand in order to
competently maintain and repair an M2, M3 or M4 Monitor and Measurement Server with or
without a Measurement Server Extension.
Theory of
Operation
The theory of operation for a component describes the processing of signals
within the component.
Introduction to the Instrument 1
Page 18

Introducing the Instrument Components
Functional
Description
The functional description of a component uses a diagram of the cir cuitry
followed by short, written explanations of the component circuitry.
Introducing the Instrument Components
The M3046A Compact Portable Patient Monitor together with the Multi-Measurement
Server (M3000A or M3001A) and the M3015A and M3016A Measurement Server
Extensions forms a flexible, portable, battery or line powered patient monitor. The combined
devices are referred to as the Instrument in this manual.
The M3000A Multi-Measurement Server can be used with M3046A patient monitors up to
and including Release D, but is incompatible with Release E monitors. All equipment from
Release C and D (M3046A monitors and the Release C M3000A Measurement Server) mu st
be used in monitoring configurations where only Release B, C or D software equipment is
included. None of these parts are compatible with Release A software.
The M3001A Multi-Measurement Server is compatible only with the Release E M3046A
monitors, and is incompatible with any earlier releases.
The Hemodynamic
Server M3001A. This combination supports the transfer of patient data between IntelliVue
(M80xxA) and M3/M4 (M3046A, Revision E) monitors. The M3012A’s Pressure/
Temperature channel works in the same way as that of the M3001A, with which the M3012A
shares all specifications, as documented in the M3/M4 Instructions for Use, except for the
weight, which is 450g (0.99lb). See the table below for supported parameters. The M3012A
is not further covered in this Service Guide.
Extension M3012A is for use together with the Multi-Measurement
Measurement
Server/Server
Extension
withOption
M3000A
M3000A #C06
M3001A
T o check whi ch softwa re revis i ons are on your equipment, enter Setup and select
Revisions.
The Multi-Measurement Server and Server Extensions acquire the following physiological
signals:
Measurements Compatible with
which M3046A
Release?
D and
lower
!
!
a
2
3-Channel ECG
EASI derived
12-Lead ECG
Respiration
Non-Invasive
Blood Pressure
Oxygen Saturation
SpO
!
!
"
"
!!!
!!!!!
!!!!!
2
Invasive
Blood Pressure
Temperature
Mainstream CO2Sidestream CO
""""
""
"""" "
E
"
"
!
2
Introduction to the Instrument
Page 19

Measurement
Server/Server
Extension
withOption
Introducing the Instrument Components
Measurements Compatible with
which M3046A
a
2
3-Channel ECG
EASI derived
12-Lead ECG
Respiration
Non-Invasive
Blood Pressure
Invasive
Blood Pressure
Oxygen Saturation
SpO
Temperature
2
Mainstream CO2Sidestream CO
Release?
D and
lower
E
M3001A #C06
M3001A #C12
M3001A #C18
M3012A
M3015A
M3015A #C06
M3016A #A01
M3016A #A02
Key: ! = supported " = not supported
b
c
a. Using a standard 5-electrode lead set. You can connect a 10-electrode lead set (for example, if a patient is
transferred from an IntelliVue monitor), but only the standard five electrodes (RA, LA, RL, LL, and V) are
used for monitoring. The rest are automatically ignored.
b. Only Pressure/Temperature supported in M4 monitors.
c. Support for the CO
M4 with software revision E and D (later than D.11). Compatible with M4 only with software revision B to
D.11. No support for CO
!!!!!!!
!!!!!
"""" "
!!!!!!!
"""""!!"
""""""""
c
"""""
c
"""""
c
"""""
measurement depends on the mon itor op tion a nd softwa re revision. C ompatible with M3/
2
for earlier monitors with software revision A.
2
!!
!!!
!!
"" "
"" "
""
!! !
"
!! !
"
""
!!
!!
!
!
!
!
The signals are converted into digital data, and processed before being communicated to the
Monitor. The server device is referred to as the Measurement Server or simply the Server in
this manual. All versions of the M3000 A and M300 1A Measurement Servers are covered by
this manual.
When using the M3015A and M3016A, all the signals are converted into digital data, and
processed before being communicated to the Monitor. Server extension devices are referred
to as the Measurement Server Extensions or simply Extensions in this manual.
The M3046A Compact Portable Patient Monitor receives the processed data from the
Measurement Server and the Measurement Server Extension, examines it for alarm
conditions, and displays it. The Monitor also provides operating controls for the user, and
interfaces to other devices. This monitoring device is referred to as the Monitor in this
manual.
The M3080A #C32 12V adapter al l ows use of a vehicle power supply for t h e in strument and
the M8043A Battery Charger and Conditioner allows the recharging and conditioning of
batteries of the instrument.
Introduction to the Instrument
3
Page 20
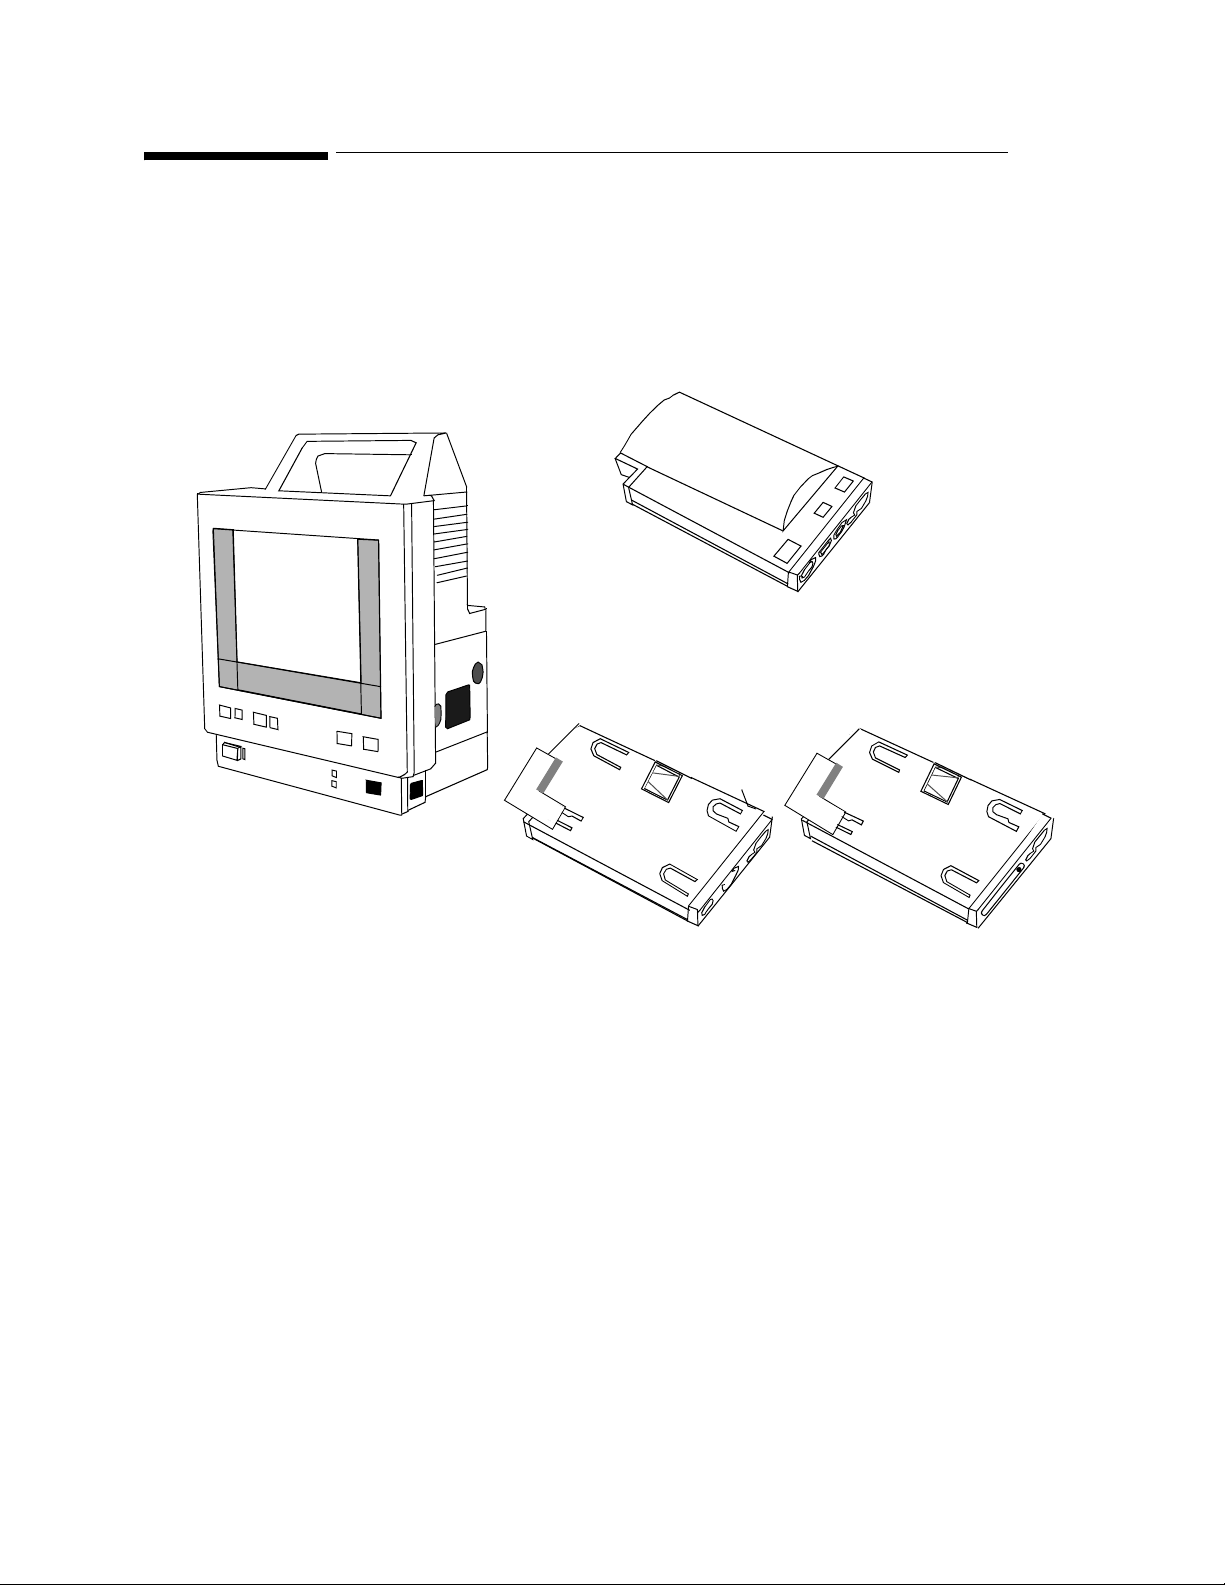
Instrument Components
Instrument Components
The Monitor, the Measurement Server, and Measurement Server Extensions are shown in the
following diagram:
Measurement Server (M3000A and M3001A)
M3000A has a
gray bezel.
M3001A has a
white bezel.
Measurement Server
Extensions
Monitor (M3046A)
Functional descriptions of these components are to be found later in this chapter.
M3016A
M3015A
4
Introduction to the Instrument
Page 21
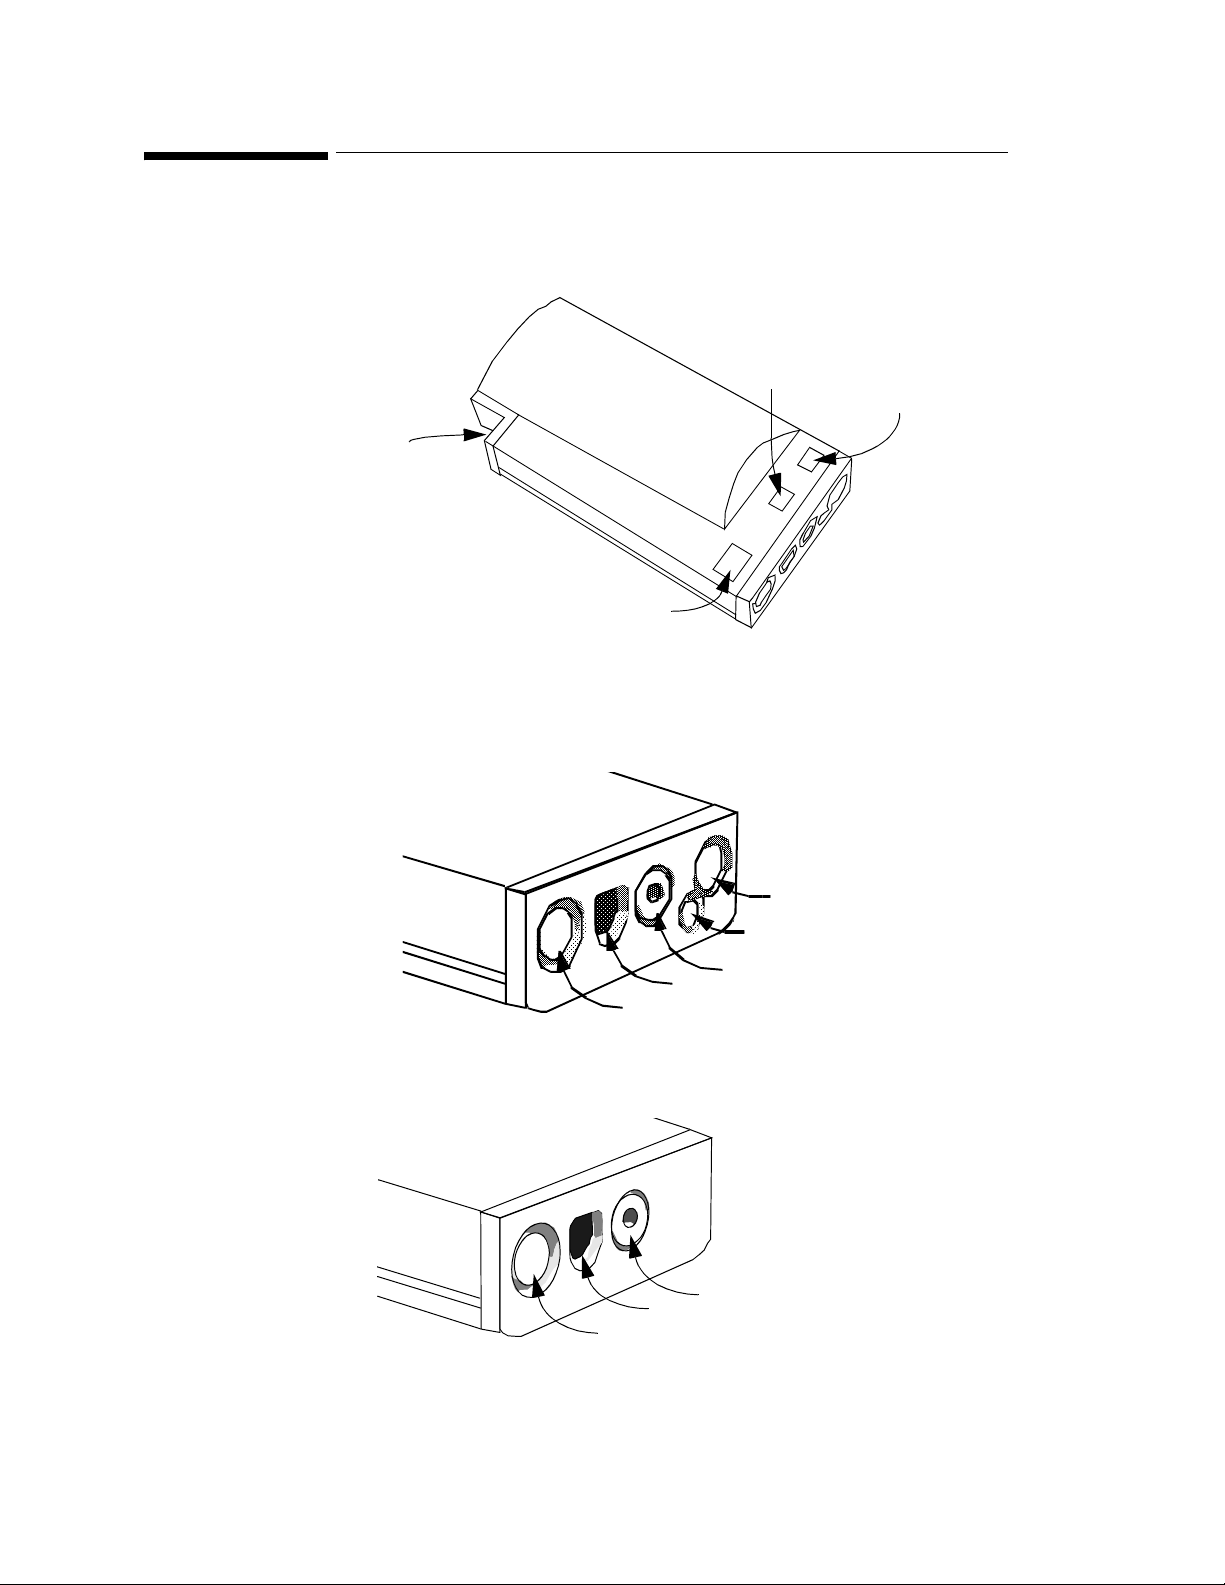
A Quick Description of the Monitor
c
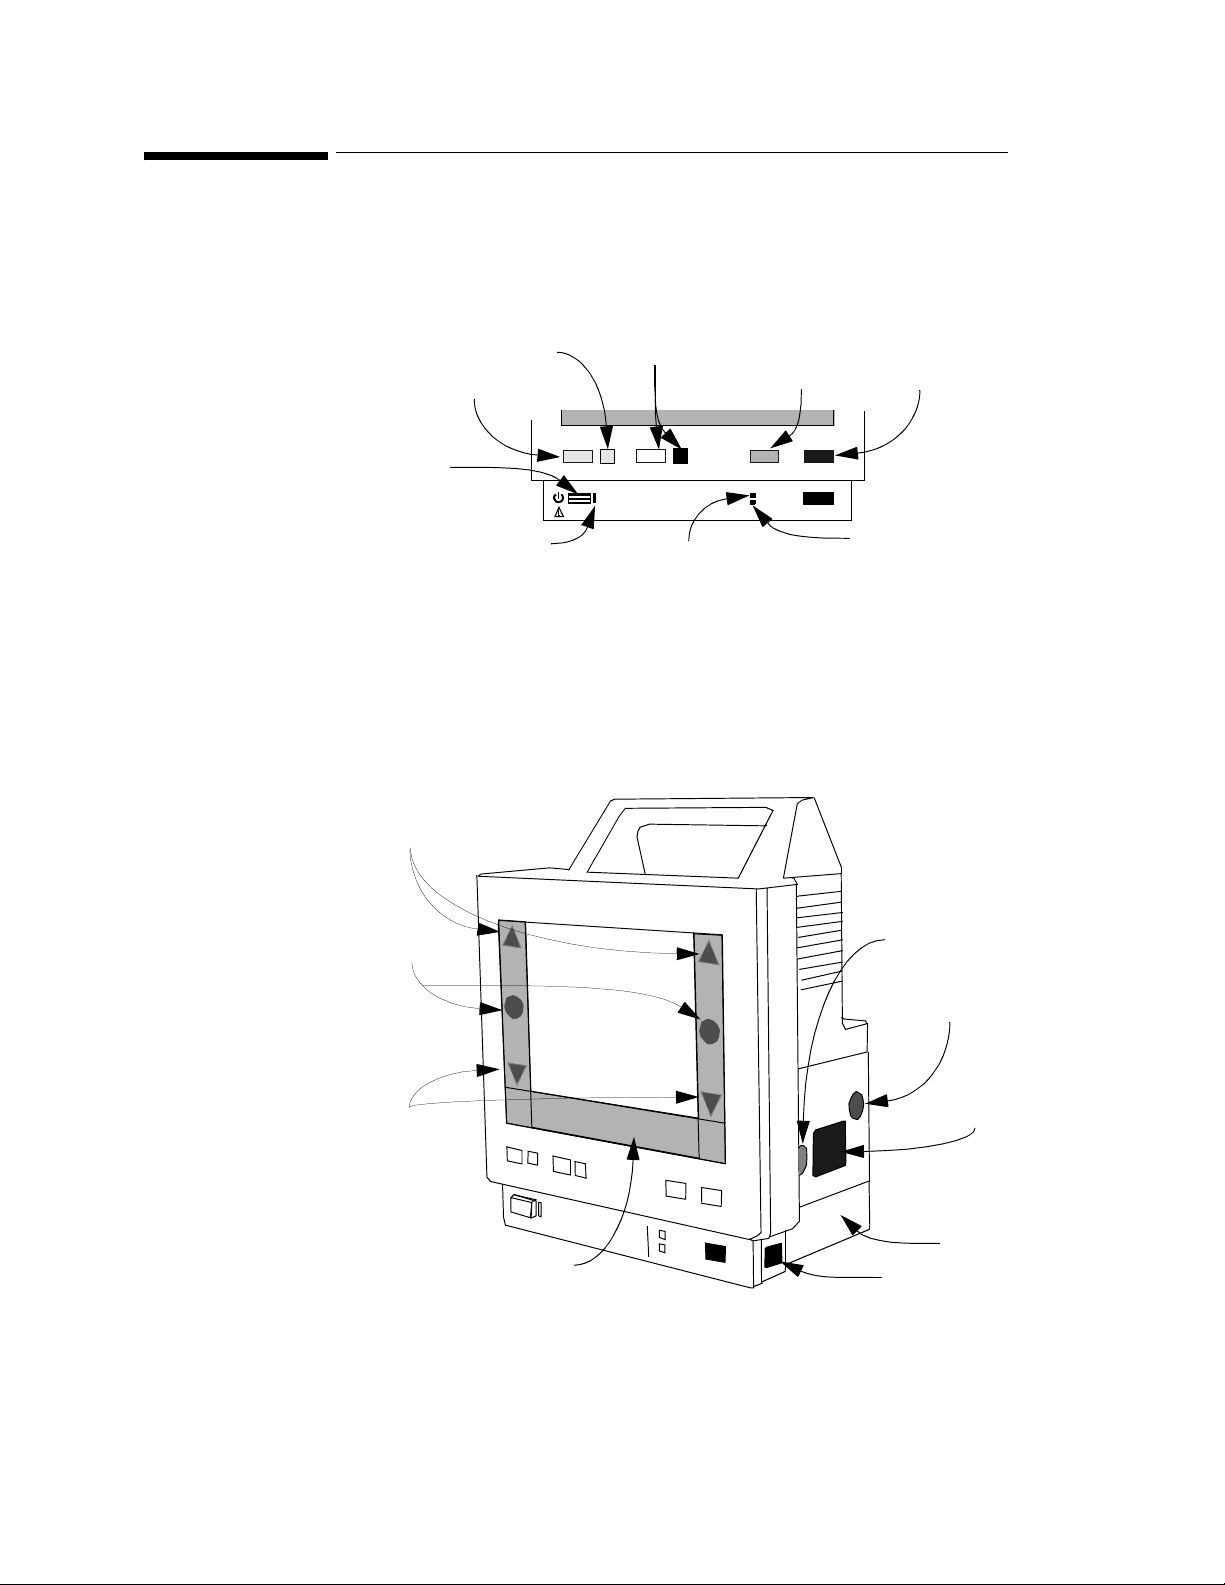
A Quick Description of the Monitor
Front Panel Keys
Alarm
Indicator
Alarm
Silence/Reset Key
On Off/Standby
On Off/Standby LED
Green when Monitor is on
Front of Monitor
Menu Highlight
Up Key
Alarm Suspend
Key & Indicator
Silence
Reset
Suspend Setup
On
Off/Standby
AC Power LED
Green when AC Power
is Connected
AC Power
Battery
Setup
Key
Main
Screen
Main Screen
Key
Battery LED
Green
- Battery full (>95%)
- Battery charging
Yellow
Blinking Red
- Battery empty
Menu Enter
Key
Menu
Highlight
Down Key
Introduction to the Instrument
TouchStrips
ECG Out/
Marker In (≤12V)
Equipotential
Grounding Post
AC Power
Connector
(100 to 240Va
50/60Hz)
Battery
Compartment
Infrared Printer Port
or
Serial connector for
local recorder
(depending on option)
5
Page 22
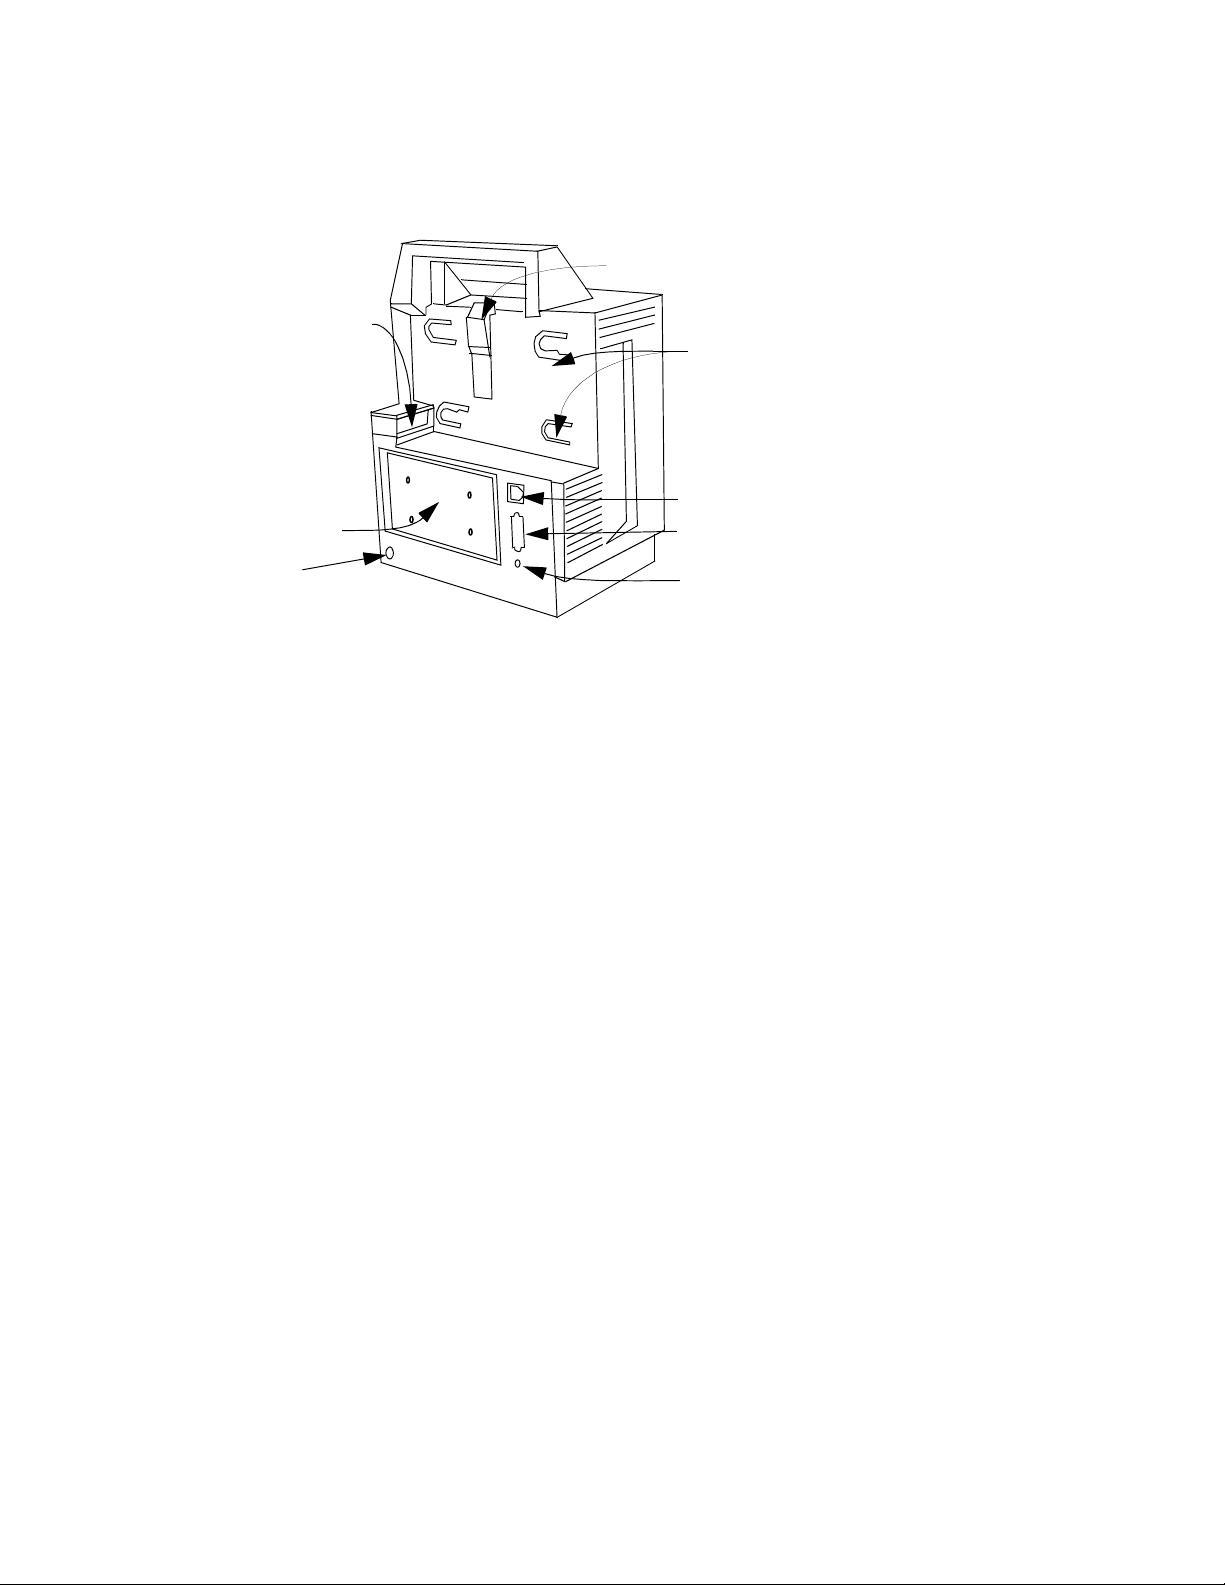
A Quick Description of the Monitor
P
c
f
Back of Monitor:
Connector to
the Measurement
Server (≤48V)
Mounting Plate
rotective earth
onnector point
or additional display
Locking Mechanism for
the Measurement Server
Catches for
attaching the
Measurement
Server
LAN/Software Update
Connector (≤5V)
Connector for an additional
display (VGA Interface) (≤3.3V)
Nurse Call Relay
Connector (≤36V)
6
Introduction to the Instrument
Page 23
A Quick Description of the Measurement Server
e.
A Quick Description of the Measurement Server
Overview of the Measurement Server
6
7
9
8
Measurement Connectors for the M3000A #C06, M3001A #C06
and #C18 Measurement Servers
5
4
3
2
Note:
Press and Temp cannot
be used at the same tim
1
Measurement Connectors for the Standard M3000A and M3001A Measurement Server
3
2
1
Introduction to the Instrument
7
Page 24

A Quick Description of the Measurement Server
M3001A Connectors and Keys
1 White ECG/Resp connector. 6
NBP Start/Stop key - starts or stops NBP
measurements.
2 Blue SpO2 connector 7
Either:
NBP STAT key - starts NBP STAT series of
measurements.
or
Zero key -
connected pressure transducer when pressed and held
for a second.
3 Red NBP connector 8 Alarm Silence/Reset
4 & 5Combined pressure (red) and temperature (brown)
connector - connect either invasive pressure
transducer or temperature probe (M3000A #C06;
M3001A #C06 and #C18 only).
Press and temp cannot be used at the same time.
You might have a version of the Measurement Server
that does not have this connector.
9
MSL cable connector to the monitor.
initiates a zero procedure for the
8
Introduction to the Instrument
Page 25
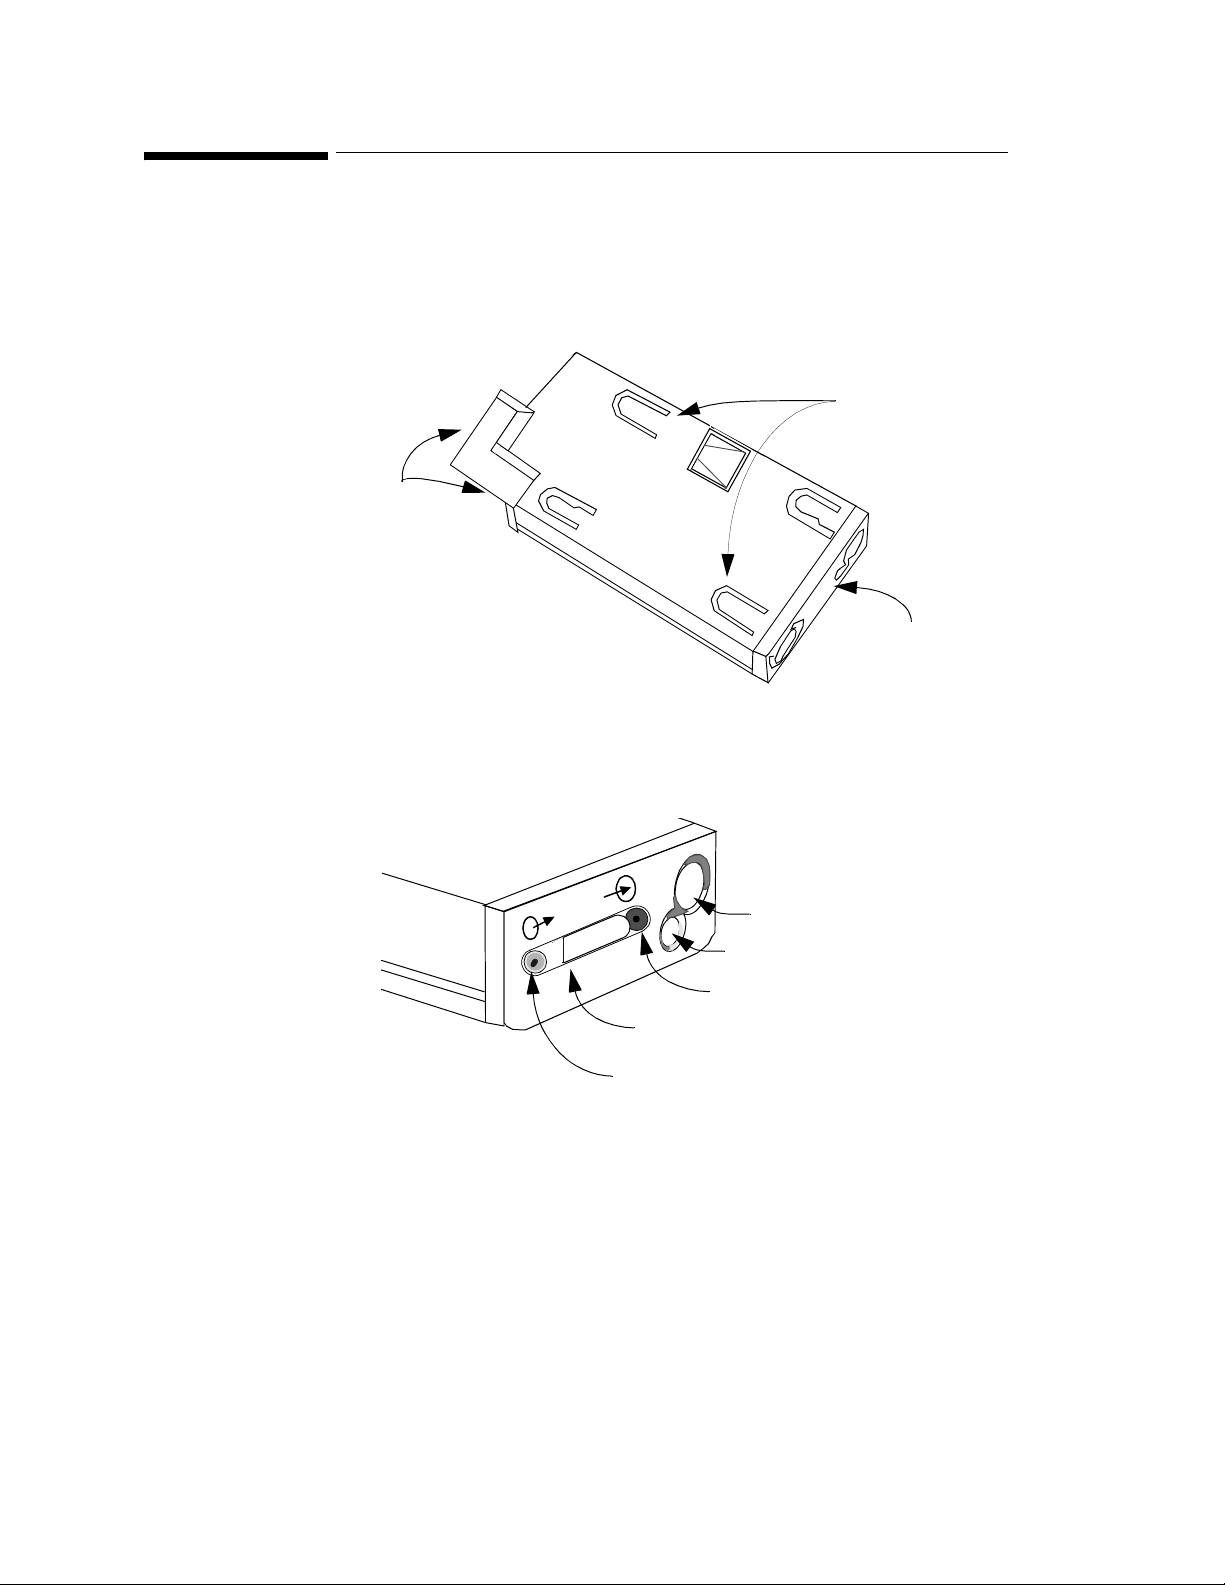
A Quick Description of the Measurement Server Extension
)
A Quick Description of the Measurement Server
Extension
Overview of the Measurement Server Extensions M3015A & M3016A
Catches for
attaching the
Measurement
Server
Connectors
to Monitor &
Measurement
Server
Measurement
Connectors
Measurement Connectors for the M3015A Measurement Server Extension
Press
Temp
gas inlet
SIDESTREAM CO
gas outlet (exhaust)
Note:
Press and Temp (M3015A #C06 only
cannot be used at the s am e time on
the same Extension.
2
Introduction to the Instrument
9
Page 26
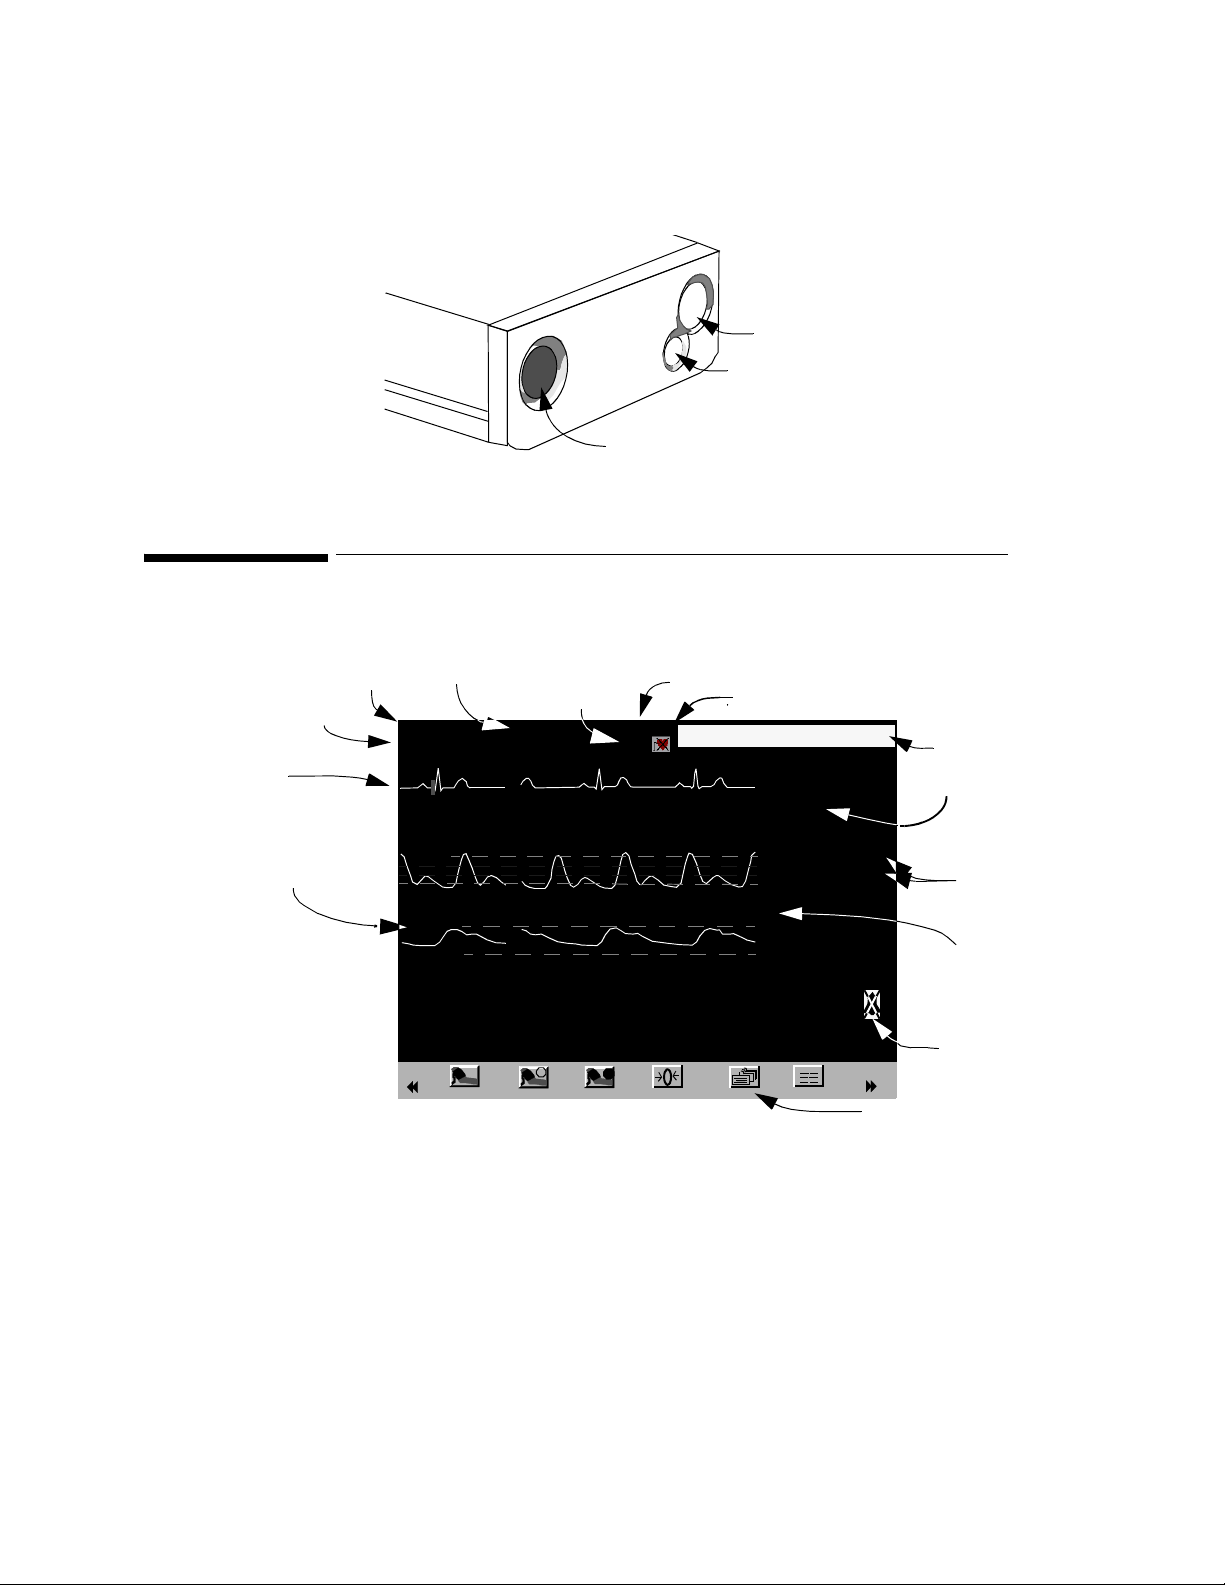
A Quick Description of the Main Screen
Measurement Connectors for the M3016A Measurement Server Extension
A Quick Description of the Main Screen
Monitor Label
Patient Name
Wave
Wave Label
QuickSet
SCHLACK, ANDREAS
II
1 mV
Pleth
ABP
120
0
NBP
135
Start/Stop
Patient Siz e
QuickSet 1
/
101
NBP STAT
Auto
MAINSTREAM CO
Time
23:11
Adult
Sinus Rhythm
60min
(120)
STOP
Stop All
Alarms Suspended
17:15
mean
120
90
Zero
Press
Temp
Note:
Press and Temp cannot
be used at the same time
on the same Extension.
(Option #A01 only)
2
Non-Paced Symbol
HR
70
SpO
2
97
ABP
120
70
/
(91)
Resp
12
Store Screen
Trends
Alarm Message
90
65
PVC
5
100
sys.
150
100
Numeric
90
Alarm
Limits
Numeric
Label
Alarm Off
Symbol
(measurement)
SmartKey Label/Icon
You can return to the display with the waves and the numerics at any time by pressing the
blue Main Screen key.
10
Introduction to the Instrument
Page 27

Theories of Operation and Functional Descriptions
Theories of Operation and Functional Descriptions
The theories of operation and functional descriptions are presented in three sections:
Section 1 Monitor Description
• M3046A Monitor The ory of Operation
• Functional Description of the Monitor Hardware
Section 2 M3001A/M3000A Measurement Server Description and Features
• Measurement Server Theory of Operation
• Functional Description of the Measurement Server Hardware
• Electrocardiogram/Respiration (ECG/Resp) Measurement
• Non-invasive Blood Pressure (NBP) Measurement
• Arterial Oxygen Saturation and Pleth (SpO2/PLETH) Measurement
• Temperature and Invasive Blood Pressure (Temp/Press) measurement
Section 3 Measurement Server Extensions Description and Features
• M3015A Measurement Server Extension Theory of Operation
• Functional Description of the M3015A Measurement Server Extension
Hardware
• Sidestream CO2 Measurement
• M3016A Measurement Server Extension Theory of Operation
• Functional Description of the M3016A Measurement Server Extension
Hardware
• Mainstream CO2 Measurement
Section 1 - Monitor Description
The M3046A Patient Monitor is a small size, lightweight monitor with a TouchBar human
interface. The monitor has a color display with a wide viewing angle, and excellent visibility
from a distance, so that data can easily be recognized. For appl ications where a lar ger display
is required, an additional display can be connected to the monitor via the standard VGA
output.
Trend data, and manual and automatic ev ent storage, together with a ran ge of report styles are
available for tracking and documenting the patient’s progress.
The Monitor receives the processed data from the Measu rement Server and the Meas urement
Server Extension, examines it for alarm conditions, and displays it. The Monitor also
provides operating controls for the user, and interfaces to other devices.
Introduction to the Instrument
11
Page 28
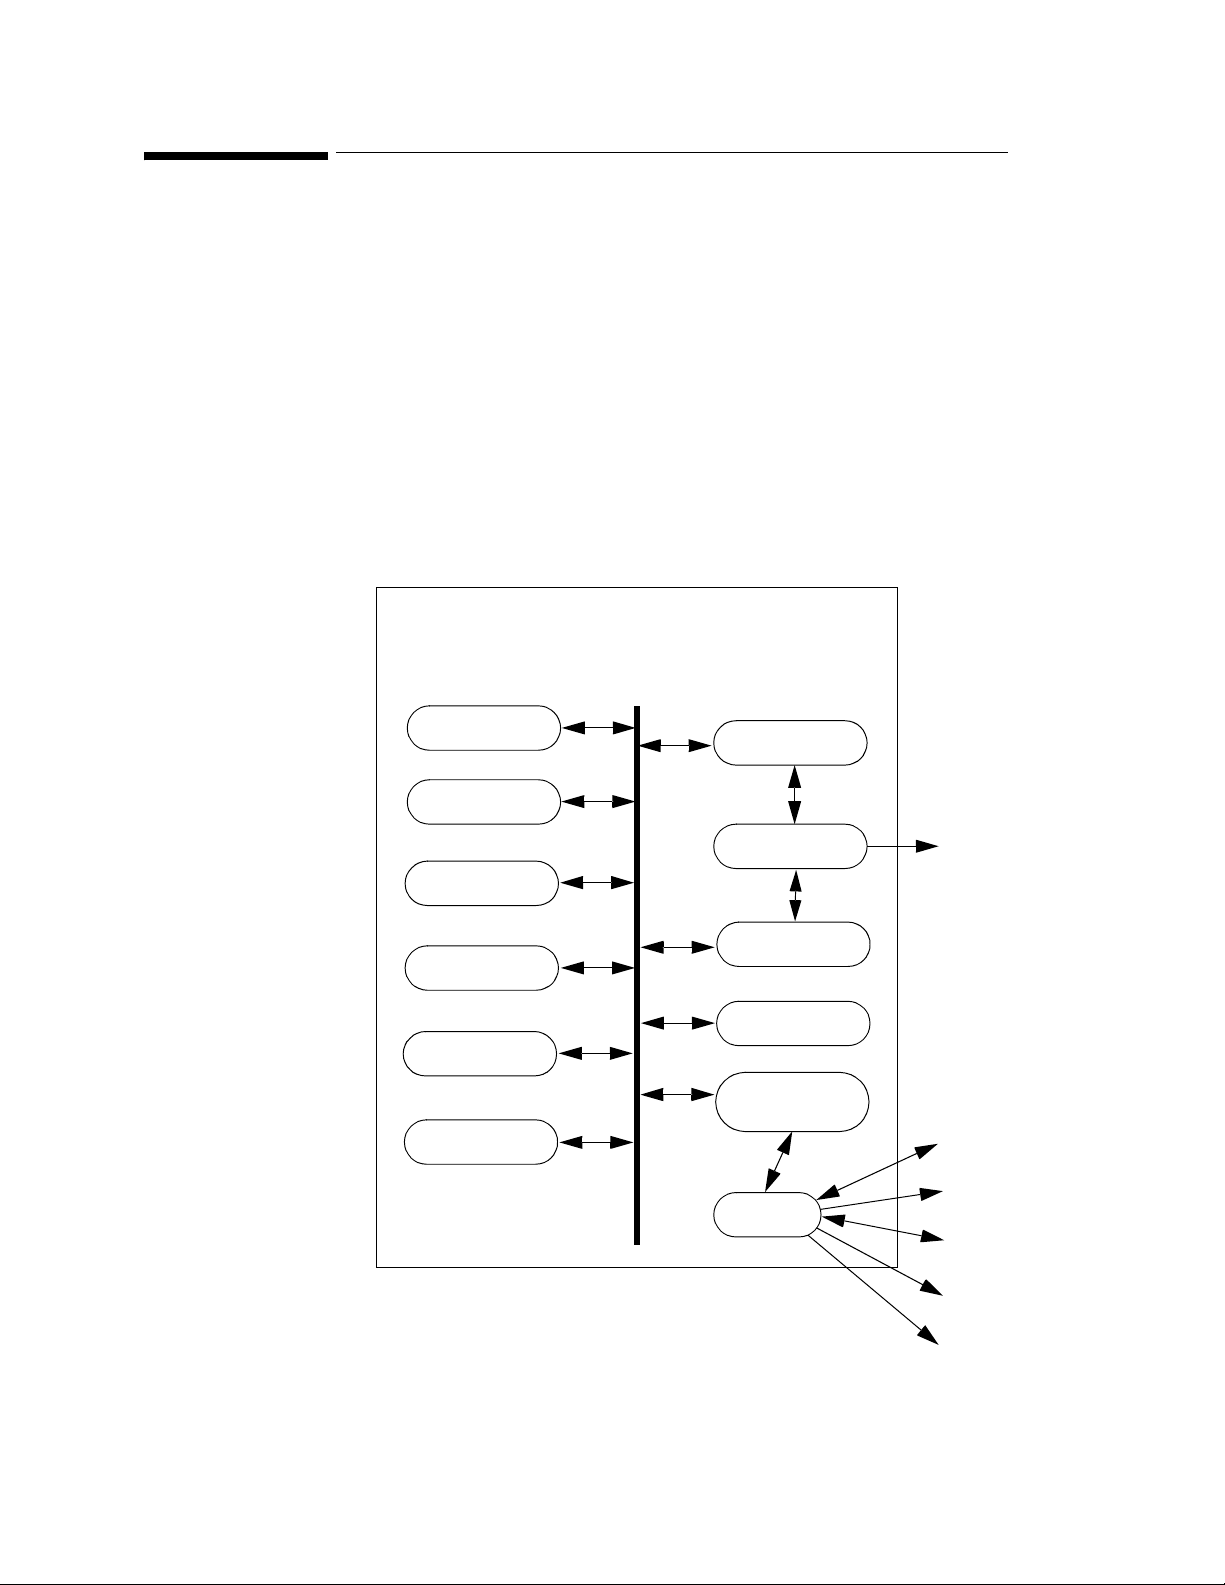
Monitor Theory of Operation
Monitor Theory of Operation
The Monitor receives data passed from the patient through the Measurement Server and,
where present, the Measurement Server Extension. The Monitor displays the data in
numerics and waves on the screen.
The Monitor is prepared with a number of software modules, which communicate with each
other as sho wn in the diag ram below. The Monitor software communicates with the
Measurement Server and, where present, the Measurement Server Extension via a normal
local area network (LAN) link. Data from the Monitor can be output to a printer via an
infrared serial link or via the LAN connector to a central print server. The Monitor can
communicate with an Philips Information Center via the LAN Connector (wired network) or
via the Wireless LAN Assembly (wireless networ k) when the appropriate options are p resent.
M3046 CPU System
Inter-process
Communications
Communication
Module
Trend
Module
Events
Module
ADT Module
Support
Services
Alarm
Manager
Printer
Manager
IrDA/Serial
Communication
Recorder
Manager
Display
Controller
Display and
Operator
Interface
HIF
Controller
IrDA/Serial
Interface
Operating
controls
LEDs
Battery
controller
Alarm
Relay
Loudspeaker
Each of these modules is described in the following sections.
12
Introduction to the Instrument
Page 29

Monitor Theory of Operation
Display and User Interface Software Module
The Display and User Interface Software displays measurement data and status information
on the color LCD display, and processes the operator inputs from the HIF Controller. The
interface consists of the following sub-modules:
• Screen Configuration.
• Numerics and Wave Presentation.
• Key and To uchStrip Processing.
• Alarm and Status Presentation.
Alarm Manager Software Module
The visual and audible alarms generated by the Measurement Server, the Measurement
Server Extension or by the Monitor software modules are assigned priorities by the Alarm
Manager. The Alarm Manager also:
• Monitors the “alarm suspended”, “alarm silence” and “alarm reminder” functionality.
• Manages alarm latching (alarms remain in effect until reset or turned off by the user).
• Triggers the Nurse Call Relay.
• Generates alarm event triggers for any user-defined trigger conditions.
Admit / Discharge / Transfer (ADT) Software Module
This module maintains the patient’s demographics and controls the upload of trend data from
the Measurement Server and the Measurement Server Extension. It allows the user to:
• Admit a new patient.
• Transfer a patient to another Monitor.
• Discharge a patient.
Trend Software Module
This module manages a trend database. It stores physiological values from the Measurement
Server and from the Measurement Server Extension in two separate databases, a short-term
and a long-term database. The content s of thes e data base s is bat te ry-b uffered, so that no data
is lost in the event of a power failure.
Events Software Module
The events software module allows the user to take snapshots of the Monitor state and store
them for later viewing or printing.This can be done automatically, triggered by alarms, if the
monitor is configured appropriately. The types of data that can be captured are as follows:
• All physiological values.
• All current alarms.
• The last 20 seconds of wave data.
Introduction to the Instrument
13
Page 30

Monitor Theory of Operation
Printer Manager
The printer manager formats and prints the following reports on either a locally attached
printer or a remote printer connected to the Instrument via the M3 Print Server:
• Tabular Trend Report—The printer manager takes raw data from the trend module and
generates a formatted report. The user can sp ecify w hether to pri n t shor t -te rm or lon g-term
trend data, and the period for which the data should be printed.
• Event Report—The printer manager take s raw data from the event module and generat es a
formatted event report. The user can specify a manual event, an alarm event, or a print
screen report.
• Event List Report—The printer manager takes the raw event list data from the events
module and generates a formatted event list report.
A number of drawing functions support the printer manager and provide it with graphics
capabilities. The output from the printer manager is in PCL (Printer Command Language)
format, and is fed to the locally attached prin ter, which is connected via an infr ared data link ,
or to a remote printer. If the link to the printer is interrupted for a certain time, the printer
manager displays a prompt of the color LCD display, notifying the user.
Recorder Manager
The recorder manager formats and records the following on a local recorder:
• Real-time or Delayed Recording—The user can select between a real-time local
recording or a delayed recording.
A real-time recording is started by pressing the Local Record SmartKey. When a r ecording
is running, you can stop it by pressing the key again.
A delayed recording can be started by pressing the Local Delayed SmartKey. Pressing the
key again will extend the recording.
• Tabular Trend Report—The recorder manager takes raw data from the trend module and
generates a formatted report. The user can specify whether to record short-term or longterm trend data, and the period for which the data should be recorded.
• Event Report—The recorder manager takes raw data f rom t he event m odule and generat es
a formatted event report, and this is recorded on the local recorder.
• Alarm Recording—If a local recorder is connected to the monitor via the optional serial
interface, you can make local alarm recordings. In configuration mode, you can select the
local recorder or the Information Center, or both, to record alarms . If one of the configu red
alarms occurs, a recording for that alarm is started automatically at the local recorder (and/
or requested form the Information Center).
See Chapter 2, Installing the Instrument for more details on connecting to a recorder.
A number of drawing functions support the recorder manager and provide it with graphics
capabilities. The output from the recorder manager suports the GSI Lumonics XE-50pspecific serial protocol, and output is fed to the local recorder, which is connected via a
dedicated serial cable. The recorder manager displays prompt and status messages on the
monitor’s color LCD display.
14
Introduction to the Instrument
Page 31

Monitor Theory of Operation
IrDA/Serial Communication Manager
The IrDA/Serial Communication manager is responsible for sending raw data to the local
recorder (serial protocol) or printer (in a format that complies with the IrDA (Infrared Data
Association) standard). The IrDA/Serial Communication manager provides a general printer
or recorder device interface to the printer or recorder manager, and maps the general printer/
recorder services to the device protocol. The general printer services are as follows:
• Establishing and terminating the printer/recorder connection.
• Transferring data to the printer/recorder.
• Retrieving the printer/recorder status.
The IrDA/Serial Communication manager feeds the printer/recorder status (time out, paper
out, and so on) back to the printer or recorder manager, which in turn notifies the user of any
errors in the print/record process.
Communication Software Module
The communication module maintains a data link between the Monitor, the Measurement
Server and the Measurement Server Extension, and controls the exchange of data between
them. This data includes the following:
• Measurement data.
• status in f ormation.
• Control information.
• Configuration data.
Support Services
The support services software module contains miscellaneous functions that both the
Monitor, the Measurement Server and the Measurement Server Extension require. These
functions are as follows:
• Date and Time.
• Settings Handler.
• Status Revision and Display.
• Heart Rate Selector.
Introduction to the Instrument
15
Page 32

Functional Description of the Monitor Hardware
t
Functional Description of the Monitor Hardware
The Monitor receives data from the Measurement Server and Measurement Serv er Extension
via the Server-to-Monitor link bar and presents this data on the color LCD display. The
following block diagram shows the main functional areas.
AC
AC
Power Supply
System Board
DC/DC Converter
48V current limiter
Battery charger
Processor (Battery
Controller)
48Vlim +5V Vbuf
HIF(83C552)
(TouchStrip,Keys,Sound,
LEDs, Alarm Relay,
Battery)
48V,
AC present
6 Pin
Connector
Vbat 48V
AC
present
I2C
I2C
Rx,Tx
Alarm
Relay
Connector
Board
LAN
VGA
(Network)
CPU System(360)
(Flash,SRAM,DRAM)
Display
Video
Controller
Vbat,
5 Pin
Connector
48 Pin
Connector
uP bus
I2C
SRL
LAN
Serial Link
ECG Out/
Marker In
Controller
Optional
Smart Battery
Optional
Wireless LAN
140 Pin
Connector
Ventilator
Fan
SRL to
Measuremen
Server
(M3000A)
ECG
Out
34 Wire
Flat Cable
Bezel Assembly
Keys
PIC LEDs,Standby
Alarm LEDs
TouchStrip
Display Assembly
Video
40 Wire
Flat Cable
Keyboard
16
Standby On/Off (PIC)
4 hardkeys(HIF)
TouchStrips
LEDs:
On/Off(+5V)
AC Power(PIC)
Battery(PIC)
X Bell(HIF)
red alarm(HIF)
yellow alarm(HIF)
IrDA
(Infrared)
or
Serial
Interface
Display Adapter
Board
6 Pin
cable
Inverter Board
31 Pin
Flex
2x2 Pin
cable
LCD
Display
Backlight
Introduction to the Instrument
Page 33

Functional Description of the Monitor Hardware
The main functional areas are summarized in the following:
• System Board—Comprising a 68360 Controller, the Memory System, the Video System,
LAN (network) connector link to Server, ECG-Out, Human Interface and DC/DC
Converter.
• Connector Board—Connecting the System Board to the AC Power Supply and battery.
The LAN (network) filter and connector, the VGA connector and the Alarm Relay Output
(Nurse Call) are located on the Connector Board. The Connector Board has a 48-pin
connector to the System Board.
• Display Assembly—Comprising a 6.5 inch TFT color LCD display (including 2 backlight
tubes), the Display Adapter Board and the associated backlight inverter board (generates
the high voltage for the tubes). These parts are packed into a soft, rubber-based holder
(sometimes referred to as the cushion). The LCD display uses thin-film-technology and is
sometimes referred to as a TFT display.
The Display Assembly connects to the System Board via a 40-wire flat ribbon cable.
• Bezel Assembly—Comprising the U-shaped TouchStrip, the Keyboard (which includes
operating keys, alarm LEDs, On/Off switch and AC and battery indicator LEDs), and the
IrDA Board (infrared printer interface) / recorder interface board..
The Bezel Assembly connects to the System Board via a 34-wire flat ribbon cable.
• Speaker—Connected to the System Board with a 2-wire cable. The loudspeaker provides
the audible output for alarms, and audible feedback when the user presses a manual control.
• AC Power Supply—Connected to the Connector Board to power the Instrument and/or
charge the battery depending on the operating mode.
• Smart Battery—As an option, a standard, intelligent battery with an I2C interface to the
DC/DC controller.
• Wireless LAN Assembly — Comprising the Wireless LAN CPU Board and the radio
frequency (RF) Board. The Wireless LAN Assembly connects to the System Board via a
140-pin extension connector. The RF Board connects to the antenna, which is built into the
monitor handle via a coax cable.
• V entilator Fan — Connected to the System Board with a 2 -wire cable. The fan controls the
temperature inside the Monitor when the Wireless LAN option is installed.
Detailed descriptions are given in the following sections.
Display Video Controller
The Display Video Controller runs the software that controls the display. This software
processes the high level display command to gener ate and format the screen characters,
graphics, and wave plots, and also generates the video control signals for the LCD display.
The software continuously checks the functionality of the hardware in the Display Controller,
and issues an error indication in the event of a hardware malfunction.
Introduction to the Instrument
17
Page 34

Functional Description of the Monitor Hardware
Human Interface Controller
The Human Interface Controller (HIF) is the interface between the operator and the Monitor
itself. It monitors the operator controls and the Battery Controller, formats the data, and
routes it to the Display & Operator Controls Manager from which it receives commands and
status also. As well, the HIF controls the features listed below.
Visual Indicators
The Instrument is fitted with the following front panel indicators:
• Yellow LED—This flashes in addition to the visual indication on the LCD display when a
yellow-alarm situation occurs (medium severity alarm).
• Red LED—This flashes in addition to the visual indication on the LCD display and the
audible tone from the loudspeaker when a red-alarm situation occurs (high severity alarm).
• Crossed Bell LED—This is illuminated when all alarms have been suspended.
Alarm Relay
In addition to the audible and visual alarms, an alarm relay is provided, which energizes
when an alarm condition occurs. This enables a remote alarm indicator (such as a Nurse Call)
to be connected to the device.
Battery Controller
The battery controller is the interface to the Smart battery. Signals fro m the battery inform the
battery controller of the most effective charging current with which to load the battery. Two
LEDs are mounted on the Battery Controller:
• Battery LED—This is illuminated green if the battery is fully charged and yellow if the
battery is charging. If the remaining battery-operating time is only 5 minutes, the LED
flashes red at a repetition rate of 1.5 flashes per second.
• AC LED—This is illuminated green when the power cord is connected and AC power is
available. Otherwise it is extinguished. The AC LED is fed directly from the AC power
supply.
For a detailed description of the battery, see chapter 3, “Maintaining the Instrument”.
ECG Out/Marker In Controller
The ECG Out/Marker In Controller is the interf ace between the Monitor and any d efibrillator
that might be connected. It converts a digital waveform signal received from the
Measurement Server ECG/Respiration module into an analog ECG signal, which it feeds to
the defibrillator in order to synchronize it. The ECG Out controller also processes the marker
information from the defibrillator and feeds the data back to the Measurement Server ECG/
Respiration measurement module.
18
Introduction to the Instrument
Page 35

Section 2 - Measurement Server Description and Features
Infrared (IrDA) Interface
The IrDA interface provides a wireless interface to an external printer. This interface
functions in the same way as a normal serial interface except that a modulated infrared beam
is used to exchange data and status information instead of a wire connection. Both the
Monitor and some printers are equipped with infrared transmitter/receiver units.
When using a printer without a built-in infrared interface, an infrared to parallel converter
(Jet-Eye, orderable under M3080A Option #H05) is needed. See the Instructions for Use,
Installation chapter, for details on how to connect the printer using this converter.
Serial Interface
The serial interface allows a local recorder to be connected to the Monitor using a serial cable
that supports the GSI Lumonics XE-50p Chart Recorder-specific protocol.
Wireless LAN Interface
The Wireless LAN interface pro vides a wireless connection to the Philips LAN. The W ireless
LAN CPU connects to the wired LAN inside the Monitor and provides the software drivers
for the RF Board. The RF Board transforms wired LAN signals into 2.4 GHz signals for
transmission. The modulation technique FHSS, frequency hopping spread spectrum, ensures
optimum transmission performance.
The 2.4 GHz band is available worldwide fo r in d ustrial, s cientific and med ica l pur pos es , and
is called the ISM-band.
Section 2 - Measurement Server Description and
Features
The Measurement Server is a highly flexible patient measurement unit, which is the base for
a variety of systems that enable easy customization to a hospital’s requirements. It provides a
subset of the most important patient measurements in a convenient, single part.
The Measurement Server is designed to monitor patients in most critical and acute patient
care areas of the hospital. Used at the bedside, it is most commonly mounted to a Monitor. It
can also be mounted separately on a bed or a roller stand.
There are two different Measurement servers that are used with the M3046A. Compatibility
depends on t h e software revision of the Monitor (see page 2) .
M3001A Measurement Server Standard Package
The Measurement Server (M3001A) standard package includes:
• Measurements of ECG (including derived EASI)/Resp, NBP, and SpO
• Signal and alarm processing.
Introduction to the Instrument
.
2
19
Page 36

Section 2 - Measurement Server Description and Features
M3001A Measurement Server Extended Measurements Packages
All versions of the M3001A Measurement Server offer EASI lead placement using an EASI
5-electrode cable set. The conventional 12-lead ECG capability of M3001A #C12 and #C18
only works with the IntelliVue family of monitors. You can connect a 10-electrode lead set
(for example, if a patient i s transferred from an Inte lliVue monitor ), but only the standard fi ve
electrodes (RA, LA, RL, LL, and V) are used for monitoring. The rest are automatically
ignored.
M3001A #C06:
• Standard package plus Press and Temp.
M3001A #C12:
• As standard package for M3/M4. Conventional 12-Lead ECG when used with IntelliVue.
M3001A #C18:
• As standard package plus Press, Temp for M3/M4. Conventional 12-Lead ECG when used
with IntelliVue.
M3000A Measurement Server Standard Package
The Measurement Server (M3000A) standard package includes:
• Measurements of ECG/Resp, NBP, and SpO
• Signal and alarm processing.
2,
M3000A #C06 Measurement Server Extended Measurements Package
The Measurement Server (M3000A #C06) optional package includes:
• Measurements of ECG/Resp, NBP, SpO
• Signal and alarm processing.
, Press, and Temp,
2
Features
The Measurement Server has the following general features:
Data Management
The Measurement Server features Patient Data Management. This consists of continuous 4hour storage of patient-related measurement information. This allows you to do the
following:
• Manage patient information,
• View patient data in tabular form via the Monitor,
• Print patient information reports via the Monitor,
20
Introduction to the Instrument
Page 37

Measurement Server Theory of Operation
• Transfer data between Monitors. The M3001A supports data transfer to and from the IntelliVue family of patient monitors.
Settings Transfer
The Measurement Server can be transported from one Monitor to another and still keep its
measurement settings. The settings (such as alarm limits) are stored inside the server. This
behaviour permits fast and easy transport.
Alarms Reset
The Silence/Reset key on the Measurement Server allows you to silence alarm tones, while
retaining visual alarm messages (depending on your Monitor’s configuration).
Server-to-Monitor Link Bar
A single connector (sometimes referred to as the Server-to-Monitor connector or link bar)
allows quick and easy connection to a Monitor. This allows the Monitor to show waves and
alarms from the Measurement Server.
The interface subsystem consists of the physical interface to the Moni tor or the Measur ement
Server Extension and controlling software.
Digitized patient information transmitted over the link bar may be waves (for ECG, pressure,
respiration, pleth); numeric information (for heart rate/pulse, pressure values , SpO
and
2
respiration rate); or alert information (for alarms and assorted status information).
For Service Procedures there is a special Service Link Bar, which is used in place of the
standard Link Bar.
Measurement Server Theory of Operation
The Measurement Server is prepared with software divided into four major conceptual layers.
The Measurement Server software communicates with the Monitor via a normal local area
network (LAN) link. The four conceptual layers of the Server software are divided as
follows:
• The First Layer—This consists of the operating system which passes messages between
the various major sections of the software. As well, the operating system performs system
initialization, background error checking, and checking while the software is running.
• The Second Layer—This consists of the monitoring management system. This layer
includes the following software:
• Alarm software.
• Record software.
• Trend database software.
Introduction to the Instrument
21
Page 38

Functional Description of the Measurement Server Hardware
• Heart rate software.
• The Third Layer—This consists of the interface management and interface controllers.
This layer contains the date/time, and Server-to-Monitor link managers.
• The Fourth Layer—This consists of the monitoring algorithms and software to acquire the
physiological signals.
Functional Description of the Measurement Server
Hardware
The Server receives information signals (such as ECG, etc.) from the patient, performs some
data processing, then transmits the data to the Monitor via the Server-to-Monitor link bar.
The followi ng block diagram shows the main functional components of the Measurement
Server.
From
Patient
From
Patient
Front End Board
ECG/Resp Front End
SpO2 Front End
Press/Temp Front End
NBP
Pneumatic
Assembly
-12V
+12V
6Vac
6Vac
-6Vac
12V
DC/DC
Converter
Board
Pneumatic
Power Switches
Floating /
Non-Floating
Isolation
14Vac
3.3V
+12V
-12V
3.3V (Buffd.)
48V
78kHz
5V
CPU Board
CPU System
(CPU, Flash-ROM
SRAM, DRAM,
ASIC, RTC,...)
Link Bar
Serial Link
NBP
A/D
Converters
48V
78kHz
To/From
Monitor
The main functional areas are summarized below:
•CPU Board—Consisting of a 68360 Controller, the Memory System (Flash ROM, SRAM,
DRAM, ASIC, RTC, etc.), the NBP A/D Converters, and a connector link to a Monitor or
an Extension.
22
Introduction to the Instrument
Page 39

Electrocardiogram/Respiration (ECG/Resp) Measurement
• Front End Board—Consisting of the ECG/Resp Front End, the SpO
Temp Front End and the Floating/Non-Floating Isolation area all feeding signals to the
CPU Board.
• NBP Pneumatic Assembly—Connecting to the DC/DC Converter Board, the Pneumatic
Power Switches housed in the DC/DC Converter Board and to the NBP A/D Converters.
• DC/DC Converter Board—Connecting to the Floating/Non-Floating Isolation area on the
Front End Board, to the NBP Pneumatic Assembly and to the CPU Syst em.
Front End, the Press/
2
Electrocardiogram/Respiration (ECG/Resp)
Measurement
Description
The Measurement Server has a three-channel electrocardiogram and respiration
measurement. It is designed to be used with adult, neonatal, or pediatric patients in ICU and
OR environments.
Measurements
The ECG/Resp measurement produces continuous real-time waves for both cardiac and
pulmonary activity. It also generates numerics for the average heart rate (HR), derived from
the ECG, and for the respiration rate (RR).
You can use either standard or EASI lead placements with the M3046A Release E together
with the M3001A. Using a standard 5-electrode set in EASI lead placement you can monitor
three out of 12 standard ECG leads simultaneously and continuously at the bedside. EASIderived 12-lead ECGs and their measurements are approximations to conventional 12-lead
ECGs. As the 12-lead ECG derived with EASI is not exactly identical to the 12-lead
conventional ECG obtained from an electrocardiograph, it should not be used for diagnostic
interpretations.
Respiratory monitoring is also possible with the EASI placement; respiration is measured
between the I and A electrodes.
Introduction to the Instrument
23
Page 40

Electrocardiogram/Respiration (ECG/Resp) Measurement
ECG/Resp Features
This illustration shows the user controls and connectors for the ECG/Resp .
This standard 12-pin
connector will accept
either a 3-lead or a 5-lead
ECG cable.
Features of the ECG/Resp measurements are described in the following paragraphs.
ECG Modes
The QRS complexes are detected automatically.
In non-paced mode, no pace pulses are expected and no pace pulse rejection occurs. In paced
mode, pace pulses of channel 1 and 2 are annotated with a small dash on the screen.
Resp Modes
In auto mode, the Monitor measures respiration and adjusts the detection level automatically.
In manual mode, the user sets the detection level for measuring respiration.
24
Introduction to the Instrument
Page 41

Electrocardiogram/Respiration (ECG/Resp) Measurement
U
Safety
To ensure the safety of the patient, the patient-applied parts are isolated from ground by
optical isolators and a transformer. The circuit is also encapsulated in plastic.
Block Diagram of the ECG/Resp
C
RA
LA
LL
Input Protection Network
ECG ASIC
CPU
ROM/RAM
To/From
RL
System CP
ECG
Electrodes
From
Patient
Bridge &
Demodulator
Amplifier
Respiration
Excitation
Current
Source
Theory of Operation
As ECG and Resp signals pass from the patient to the Monitor, they progress through stages
corresponding to the logical sections of the circuit, as shown in the block diagram. Circuitrelated faults can generally be isolated to one of the stages.
Transducer
Signals are received through patient electrodes and lead cables via the input connector.
Input Protection Network
The Input Protection Network and ESU filter eliminate extraneous signals. This protects the
rest of the circuitry from defibrillator voltages, high frequency interference signals, and
electrostatic discharges.
ECG ASIC
The signals are processed by the ECG Application-Specific Integrated Circuit (ECG ASIC)
which has an input amplifier with a fixed gain fo r each of the four electrodes. They are then
passed to a digital-to-analog converter (D/A Converter) for offset compensation and then to
an analog-to-digital converter (A/D Converter). The input/output logic (which is controlled
Introduction to the Instrument
25
Page 42

Electrocardiogram/Respiration (ECG/Resp) Measurement
from the CPU) controls the analog-to-digital conversion and reads out the digitized ECG
data. The CPU communicates with the ECG ASIC via a built-in serial link.
To prevent interference from the 50/60Hz power line, the common mode signal is used to
drive the right leg (RL) drive amplifier. The output from the amplifier is then returned to the
patient via the RL electrode.
Excitation Current Source
The excitation current source feeds a small current into the right arm and left leg electrodes.
This results in a voltage drop between the right arm and left leg which is proportional to the
thorax impedance.
Bridge & Amplifier
The bridge subtracts an offset from the voltage between right arm and left leg. The amplifier
amplifies the remaining signal.
The Central Processing Unit (CPU)
ECG ASIC
Controller
Data
Acquisition
The CPU performs the following functions:
• Controls the ECG ASIC, and stores ASIC specific calibration and error log data. This
initializes the intended ASIC configurations such as gain, A/D sampling rate , and DA C
operation.
• Acquires the digitized ECG and Resp signals. Digitized ECG signals are used to
calculate 3 ECG leads which are then passed on to the Pace Pulse detecting software, and
the wave processing and filtering software.
• Performs ECG wave filtering. The waves are digitally filtered and scaled then passed to
the software that communicates with the system CPU.
• Performs pace pulse detection. A digital high-pass filter acts as a slope detector for the
received ECG waves. The output of the slope detector is fed into two comparators
comparing the signal to a positive and negative threshold. The output of the comparators
indicate the absence or presence of a pace pulse. The threshold of the comparators is
moving and adapts itself to the amount of noise present in the ECG wave. Detected pace
pulses are communicated to the wave processing and filtering software.
Pace Pulse
Detection
Wave Processing
& Filtering
System CPU
Communication
System
CPU
• Communicates with the system CPU. Communication is via a serial, bi-directional data
link. The ECG/Resp CPU sends the following data to the system CPU:
• 3 ECG waves,
26
Introduction to the Instrument
Page 43

Electrocardiogram/Respiration (ECG/Resp) Measurement
• A respiration wave,
• Pace pulse data,
• INOP messages, and
• status messages.
The ECG/Resp CPU receives control messages from the system CPU.
ECG Software on the System CPU
Display Filter
ECG Wave
& Scaling
Heart Rate
Cardiotach
ECG Alarming
HR Limit
Alarm
ECG Controls
From
ECG User
Controls
ECG/Resp
CPU
Resp Artifact
Suppression
Resp Wave
Resp Rate
Breath
Detector
Resp Controls
Resp Alarming
Resp
Alarm
Resp User
Controls
via Operating System to the Display Unit
• Display Filter and Scaling
This software receives the raw ECG wave with pace pulse information from the ECG/Resp
CPU. The pace pulse spikes are removed from the ECG before filtering, and re-inserted
after filtering with their original shape (the filtering would distort them otherwis e).
Software filters remove line frequency (50/60Hz), high frequency noise, artifacts and
baseline w ander.
The waves are scaled automatically or manually as set by the user.
The defibrillator marker is superimposed on the ECG wave to be displayed.
ECG waves are communicated to the display unit via the operating system.
• Cardiotach
This software derives the averaged value of the heart rate. Pace pulses and undershoots are
removed from the signal. The multi-channel QRS detector generates beat identification tags
for the cardiotach. The detection algorithm weights no isy ECG ch ann els less than ch annels
with clear signals. The cardiotach measures the time between two detected QRS complexes
and calculates a beat to beat and averaged heart rate. The heart rate is communicated to the
ECG Alarming software, and to the display unit via the operating system.
Introduction to the Instrument
27
Page 44

Electrocardiogram/Respiration (ECG/Resp) Measurement
• ECG Alarming
This software receives the averaged heart rate from the cardiotach software and derives
alarms by comparing this rate against the limits and the asystole condition. Heart rate
alarms are communicated to the display unit via the operating system.
• ECG Controls
This software handles:
• selection of ECG leads
• setting of heart rate alarm limits
• selection of ECG display filter characteristics
• Respiration Artifact Suppression
This software receives the respiration and ECG waves from the ECG/Resp CPU. A
software filter removes any potential ECG overlay from the respiration wave. The filtered
respiration waveform is communicated to the display unit via the operating sy stem .
• Breath Detector
This software detects the respiration rate using a trigger threshold that is dynami cally
adjusted according to the amplitude of the wav e. The time between breaths is measured and
the respiration rate is calculated. This is communicated directly to the Resp alarming, and
via the operating system to the display unit.
• Resp Alarming
This software receives the respiration rate from the breath detector and derives alarms by
comparing this rate against the limits and the apnea condition. Respiration rate alarms are
communicated to the display unit via the operating system.
• Respiration Controls
This software handles:
• setting of respiration rate alarm limits
• scaling of the display wave for the best fit for the display channel.
28
Introduction to the Instrument
Page 45

Non-invasive Blood Pressure (NBP) Measurement
Non-invasive Blood Pressure (NBP) Measurement
Description
The Measurement Server has a non-invasive blood pressure measurement for the Monitor
monitoring device. It is designed to be used with adult, paediatric, or neonatal patients, in
ICU and OR environments.
Measurements
The measurement produces numerics for the systolic, diastolic, and mean blood pressure
values. No wave is associated with this measurement.
Three different methods can be used to obtain the measurements, as follows:
• Manual—For each request, one measurement of systolic, diastolic, and mean pressures is
taken.
• Auto—Repeated measurements of the three values are taken at timed intervals specified by
the user.
• Stat—Measurements of the three values are taken immediately and repeatedly over a
period of five minutes. This method uses a faster measurement procedure but produces a
less accurate reading.
NBP Features
This illustration shows the user controls and connector for the measurements. The parts are
described in the paragraphs following the illustration.
Start/Stop /Stat Key:
A single-press key, used to start
or stop a manual measurement,
or start an automatic measurement cycle.
A standard NBP connector
connects to the cuff.
Introduction to the Instrument
29
Page 46

Non-invasive Blood Pressure (NBP) Measurement
NBP Modes
The measurement offers adult, pediatric, and neonatal modes.
The following table lists the cuff inflation limits for each mode:
Mode First Inflation
Adult 165 25 15
Pediatric 130 20 15
Neonatal 100 15 15
Subsequent Inflations,
Above Systolic Pressure
Stat Mode
The following table lists the measurement ranges for each mode:
Mode Systolic Diastolic Mean
Adult 30 - 270 10 - 245 20 - 255
Pediatric 30 - 180 10 - 150 20 - 160
Neonatal 30 - 130 10 - 100 20 - 120
Safety
The following table lists the maximum limits that ensure patient safety:
Mode
Maximum
Measurement Time
Maximum Time/
Pressure
Over-pressure
Maximum
Adult 180 seconds 180 seconds for
pressure > 15
mmHg
Pediatric 180 sec onds 180 seconds for
pressure > 15
mmHg
Neonatal 90 seconds 90 seconds for pres-
sure > 5 mmHg
300 mmHg for > 2
seconds
300 mmHg for > 2
seconds
150 mmHg for > 2
seconds
If any one of these safety limits is violated, an INOP is generated and the valve opens.
30
Introduction to the Instrument
Page 47

Block Diagram for NBP
ASIC
Non-invasive Blood Pressure (NBP) Measurement
Microcontroller
PUMP
PRESSURE
D
A
PRE AMP
SENSOR
PRESSURE
CUFF
D
A
PRE AMP
SENSOR
PRESSURE
DEFLATION
SYSTEM
Components
The following components carry out the major signal processing functions within the
Introduction to the Instrument
31
Page 48

Non-invasive Blood Pressure (NBP) Measurement
measurement.
Pressure Pump—Inflates the cuff to preset limits, once or repeatedly, depending on the
measurement method used.
Pressure Sensor—Measures cuff pressure using solid-state technology.
Overpressure Safety System—Triggers alerts at given pressures and time limits, and
deflates the cuff.
Bandpass Filter—Extracts arterial pressure oscillations from the cuff pressure.
Deflation System—Automatically deflates the cuff at steps of a given magnitude.
NBP Measurement Characteristic
See “Selecting NBP Measurement Characteristic” on page 87.
Theory of Operation
As NBP signals pass fr om the patient to the Monitor, they progress through stages
corresponding to logical sections of the circuit, as shown in the block diagram. Circuitrelated faults can generally be isolated to one of the stages.
1Acquisition—Signals from the patient are received by the pressure sensor through the
cuff, which is connected to the circuit by a single tube. The cuff is inflated, deflated, and
monitored by a pump, deflation system, and safety system controlled by a microprocessor.
a.Cuff Inflation—During the initial cuff inflation, the cuff is inflated by the
pressure pump to a set pressure which is determined by the patient size.
Thereafter the cuff is inflated by the pressure pump to a cuff pressure above the
patient’ s systoli c pressure. Depend ing on the measur ement method used, infl ation
occurs once or repeatedly. When the cuff pressure is greater than the systolic
pressure, the artery is occluded; the pressure sensor then detects only the cuff
pressure.
b.Cuff Deflation—Cuff pressure is automatically released by the deflation system
in steps until the artery is only partially occluded. At that point, measurement and
processing of arterial pressure oscillations begin and continue as the cuff pressure
is progressively released.
2 Detection—The arterial pressure oscillations are superimposed on the cuff pressure.
They are extracted from the cuff pressure by a digital bandpass filte r in the microcontroller.
3Measurement—As the cuff is deflated, the magnitude of the os cillations as a function o f
cuff pressure increases until the mean arterial pressure is reached. When cuff pressure
falls below the mean arterial pressure, oscillation magnitude begins to decrease.
The systolic and diastolic blood pressure values are deduced from the oscillometric signal by extrapolation. Differences in the results with the standard stethoscope method can
be expected. The NBP accuracy complies with AAMI SP-10.
32
Introduction to the Instrument
Page 49

Arterial Oxygen Saturation and Pleth (SpO2/PLETH) Measurement
Arterial Oxygen Saturation and Pleth (SpO2/PLETH)
Measurement
Description
The Measurement Server has a pulse, arterial oxygen saturation, and plethysmogram
measurement.
Measurements
The measurement produces numerics for the arterial oxygen saturation value and the pulse
rate, along with a real-time wave for the plethysmogram.
SpO2/PLETH Features
This illustration shows the user controls and connector for the SpO2/PLETH. The parts are
described following the illustration below.
This is a standard 8-pin
connector for use with an
/PLETH transducer.
SpO
2
Safety
To ensure the safety of the patient, the patient-applied part is isolated from ground by optocouplers and a transformer. The circuit is also encapsulated in plastic.
PLETH Wave
The circuit automatically and continuously adjusts the size of the wave, which repres ents the
quality of the SpO
possible. If the signal quality becomes weak, the wave becomes progressively smaller. If the
signal degrades below an acceptable level, the wave becomes flat and an INOP alarm results.
A poor signal may be caused by poor perfusion at the transducer site, or by the transducer; it
is not related to low oxygen saturation.
measurement signals. Manual wave adjustments in this mode are not
2
Introduction to the Instrument
33
Page 50

Arterial Oxygen Saturation and Pleth (SpO2/PLETH) Measurement
This illustration contains an example of a typical wave in SpO
Pleth
Block Diagram of the SpO2/PLETH Circuit
Self-Test Signal
Generator
Clipping Detector
photo
current
Rtype/
Rlambda
To & From SpO2 Transducer
Amplifier
LED
current
Photo
LED Current Source
RCode
Measurement
Bandpass
Variab le
Gain
ADC
Digital
Signal
Processor
.
2
CPU
ROM/RAM
ASIC
To & From System CPU
Theory of Operation
The signals progress t hrough the circuit as foll ows:
LED Current Source
This generates the LED current from a constant voltage provided by the power supply. A
bridge consisting of four tran sis tors swi tches t he LED curr ent fo r driv ing th e red and infrare d
LEDs. These switching transistors are controlled by the SpO
Photo Amplifier
The photo amplifier is an active input current to voltage converter. The input signal is filtered
by a low pass filter to eliminate higher frequencies generated, for example, by electro-surgery
units. Then the input current from the photo diode of the sensor is converted to a voltage.
Clipping Detector
A comparator detects clipping of the photo-amplifier signal caused by, for example, ambient
light. The clipping detection is connected directly to the SpO
necessary.
CPU.
2
CPU to generate an INOP if
2
34
Introduction to the Instrument
Page 51

Arterial Oxygen Saturation and Pleth (SpO2/PLETH) Measurement
Bandpass
The bandpass stage contains a bandpass filter for the modulated signals coming in from the
photo-amplifier. This filters out noise outside a passband centred on the modulation
frequency.
Variable Gain
This section amplifies the incoming signals. The gain is set by a digital to analog converter
(DAC) which allows 512 gain settings.
Analog to Digital Converter (ADC)
This is a 12-bit converter. Oversampling is used to get the required resolution. To optimize
the ADC input voltage, the variable gain adapts accordingly to the signal quality.
Digital Signal Processor (DSP)
The DSP demodulates and filters the signal from the ADC, and passes it on to the SpO2
ASIC.
Self-Test Signal Generator
This generates a wave that is similar to a patient signal. It is processed through the complete
circuitry starting at the photo amplifier stage. Just before the processing of the patient signal
begins, the test signal is switched on to check correct functioning of the circuitry.
RCode Measurement Circuit
This circuit measures the coding resistor of the transducer, digitizes it, and sends it to the
SpO
CPU.
2
Each transducer has coding resistors in the connector, so that it can be identified by this
measurement.
CPU, ROM/RAM and ASIC
The ASIC is the interface between the digital signal processor and the SpO2 CPU.
The ASIC also acts as an interface to the ADC and contains all the frequency generators for
the ADC clock, the sampling frequency and the modulation frequencyTh e m ain clo c k for t he
ASIC is provided by a Pierce oscillator circuit external to the chip.
The CPU gets the processed SpO
signal from the ASIC, and controls the LED current
2
source, the RCode measurement, the variable gain stage, the clipping detection, the power
supply, and the Self-Test circuit. The CPU also detects INOP and error information and
handles communication with the system CPU.
Introduction to the Instrument
35
Page 52

Arterial Oxygen Saturation and Pleth (SpO2/PLETH) Measurement
S
C
SpO2 Algorithm Software on the System CPU
Pleth, Wave
pO
PU
2
SpO
2
Algorithm
SpO
2
Control
Average
Calculation
SpO
2
Alarming
SpO
Value
2
Pulse Rate
Alarms
SpO
2
SpO
Controls
2
The SpO2 Algorithm receives the demodulated and filtered red and infrared signals, and the
transducer coding information from the SpO
measurement frontend. The red and infra-red
2
wave is transformed in to t he frequ ency domain. An adaptive signal analysis of the frequency
information eliminates artifact and noise from the patient signal that is then used to calculate
the SpO
and Pulse numeric values.
2
The SpO
algorithm also detects non-pulsatile or noisy signals, and generates the appropriate
2
INOPs.
The wave is communicated to the Monitor (via the operating system), the SpO
and pulse
2
rate are communicated to the average calculation software, and INOPs are communicated to
the alarming software.
•The Av erage Calculation software receives the SpO
value for each beat from the SpO2
2
algorithm, and calculates the average over the time interval configured by the user. This
value is communicated to the Monitor via the operating system, and to the Alarming
software.
•The SpO
Alarming software gets the average SpO2 value from the average calculation
2
software and compares it against the limits set by the user.
This software also gets INOP messages from the SpO
algorithm software.
2
Alarms are communicated to the Monitor via the operating software.
•The SpO
information, the INOP and error messages and the status information from the SpO
Controller software receives the red and infrared signals, the transducer coding
2
CPU.
2
It receives the operating controls and the user settings from the Monitor. The user settings
are stored in non-volatile memory.
36
Introduction to the Instrument
Page 53

Temperature and Invasive Blood Pressure (Temp/Press) measurement
Temperature and Invasive Blood Pressure (Temp/Press)
measurement
Description
The Measurement Server has a measurement channel which can measure invasive pressure
or temperature.
Measurements
The measurement produces a numeric fo r temperatur e; or a real-time pressure wave, together
with the pulse rate and numeric readings for the systolic, diastolic, and mean blood pressure
values.
Temp/Press Features
This illustration shows the user controls and connector for the Temp/Press.
Connectors for use with a
T emp or a Press
transducer.
Press Wave
Blood pressure is depicted as a pressure wave with the numerics for systolic, diastolic, and
mean pressure values. The blood pressu re shows the cycles of contraction and release within
the heart and the resultant pressure that is generated to move the blood through th e vess els.
This illustration is an example of a typical invasive pressure wave.
100
Introduction to the Instrument
37
Page 54

Temperature and Invasive Blood Pressure (Temp/Press) measurement
U
Temp Mode
Measurement Range: -1 to 45oC (30 to 113oF)
Safety
To ensure the safety of the patient, the patient-applied part is isolated from ground by optocouplers and a transformer. The circuit is also encapsulated in plastic.
Block Diagram
This illustration shows the block diagram of the Temp/Press circuit.
Excitation Voltage
Transducer
Detection
To and from
pressure transducer
Input Protection Network
A/D
Converter
To and from
System CP
CPU
ROM/RAM
Resistor
To and from
Temperature
Sensor
Array
Current
Source
Theory of Operation
The signals progress t hrough the circuit as foll ows:
Excitation Voltage
This supplies 5VDC to a connected transducer. If a short circuit is detected by this circuit, the
CPU switches the voltage source off (to reduce power consumption).
Input Protection Network
This provides protection for the rest of the circuit against defibrillator voltage, electrostatic
discharge, and any electromagnetic interference. The signal is passed on to the analog to
digital converter, and to the transducer detection circuit.
38
Introduction to the Instrument
Page 55

Temperature and Invasive Blood Pressure (Temp/Press) measurement
Transducer Detection
The transducer being used can be determined by recognising the coding in the connector.
This is done by the transducer detection circuitry. A window comparator checks the input
voltages provided by the transducer against specified limits.
Current Source
The current source generates a constant current for the resistor array that is used to measure
the temperature.
Resistor Array
The constant current is fed through four resistors in series: A test resistor, the externally
connected temperature probe, a gain calibration resistor, and an offset resistor. The voltage
drop across each resistor is sequentially measured and digitized. The CPU controls the
measurement of the different voltage drops and the ADC.
Analog to Digital Converter (ADC)
The ADC receives the pressure signal from the Input Pro tection Network and the temperature
signal from the Resistor Array. The ADC amplifies, filters, and digitizes the received
pressure or temperature signal. The CPU controls the A/D conversion and accesses the
digitized data for further processing.
Central Processing Unit (CPU)
The CPU controls the ADC and receives the digitized pressure or temperature data from the
ADC. The CPU calculates the temperature values and scales the raw pressure waveform
using stored pressure calibration data. The CPU stores pressure calibration data and user
settings into a non-volatile read/write storage device. The scaled pressure waveform and
temperature data are communicated to the System CPU via a serial interface. The CPU
receives calibration data and user settings from the System CPU.
Temperature and Invasive Pressure Software
The CPU contains software that performs:
• communication with the System CPU
• data acquisition of the invasive pressure signal or temperature
• control of the A/D converter
• pressure wave and temperature numeric filtering
• switching between temperature and pressure measurement depending on the connected
transducer
• INOP and error detection and self-tests
The CPU receives control information from the System CPU and transmits the pressure wave
or a temperature numeric, INOPs and error and status messages to the System CPU.
The CPU software function ality is structur ed into the fo llowing mo dules (s ee block diagra m):
Introduction to the Instrument
39
Page 56

Temperature and Invasive Blood Pressure (Temp/Press) measurement
• System CPU communication
• ADC controller and data acquisition
• Wave/numeric processing and filtering
• Pressure/temperature mode detection
Block Diagram of the Temp/Press Software
Pressure / Temperature
Mode Detector
From transducer
detection circuit
ADC
Controller &
To and from
pressure
CPU
Data Acquisition
Wave Processing
&
Filtering
System CPU Communication
Software Module
To and from
Pressure and Temperature
System CPU Communication
The pressure/temperature measurement section of the CPU contains a serial bi-directional
data communication link to the pressure/temperature modules of the system CPU.
The following data is transmitted to the system CPU:
•Pressure wave
• T emp erat ure num eric
• INOP and error messages
• Status messages
The following data is received from the CPU:
• Control messages
All messages in both directions are secured by checksums.
ADC Controller and Data Acquisition
The data exchange between the A/D converter and the CPU is based on a serial
communication link. The calibration information is periodically refreshed to ensure proper
operation of the converter. The converter generates an interrupt each time new data is
40
Introduction to the Instrument
Page 57

Temperature and Invasive Blood Pressure (Temp/Press) measurement
)
available. This forces the CPU to retrieve the data and to calculate the scaled pressure
waveform of temperature value.
Wave Processing and Filtering
Pressure measurement: Data from the A/D converter is sent to a single-pole digital filter
which generates the specified frequency response. Additionally, the transducer zero value is
subtracted from the signal.
Temperature measurement: This is referenced against a high-precision calibration resistor.
Each temperature value consists of 16 averaged samples and the test resistor verifies the
linearity of the measurement. With an offset resistor all offsets are eliminated.
Pressure & Temperature Mode Detector
The CPU switches between two different A/D converter controls and wave processing
algorithms depending on the connected transducer: Pressure or Temperature. To recognize
the presence of a pressure transducer , a coding within the transducer is checked. T o recognize
the presence of a temperature transducer , the tran sducer’ s resis tance is measured an d must be
within specified limits. This is only done when no pressure transducer is present.
To & From Invasive Pressure &
Invasive Pressure Software Module
The Invasive Blood Pressure Module derives three numerical pressure values (systolic,
diastolic, and mean), a blood pressure waveform and a pulse rate. The module is designed to
be used with DC pressure transducers (5 µV/V/mmHg) only. Alarm limits can be set for
pressure and pulse values. Alarm messages are issued if the calculated values are outside the
set range or outside the measurement range.
Block diagram of the Invasive Pressure Software Module
Wave
Processing
Beat
Detector
Acquisition
Control
Temperature Front End
Pressure
Controls
Average
Calculation
Pressure
Alarming
Pressure Waveform
Pulse Rate
Pressure Values
(systolic, diastolic, mean
Pressure Alarms
Pressure/Pulse
User Controls
Signal Acquisition
This module is responsible for the A/D conversion of the analog signal from the pressure
transducer. The Signal Acquisition module provides a raw pressure waveform to the Wave
Processing module. A special test mode and a zero procedure can be enabled and preformed
on request. The module also performs various self-tests and consistency checks to ensure
proper operation and reports errors and failures to the Acquisition Module.
Introduction to the Instrument
41
Page 58

Temperature and Invasive Blood Pressure (Temp/Press) measurement
Acquisition Control
This component receives the hardware-related information from the signal acquisition
component. This includes status data and error/failure reports.
Wave Processing
The raw waveform from the Signal Acquisition module is filtered. Gain and offset values of
the raw waveform are corrected so that the wave sample-values represent absolute values
according to the selected scale.
Beat Detector
The Beat Detector determines the position of a beat in the pulsatile pressure waveform. This
information is used to calculate systolic, diastolic, and mean beat pressure values and to
calculate pulse rate.
Average Calculation
The calculated beat pressure and pulse v alues ar e averaged and converted to the use r-selected
measurement unit (mmHg or kPa).
Pressure Alarming
This component generates the appropriate alarm when the averaged pressure or pulse values
exceed the user-selected alarm limits. Technical alarms are generated when the Acquisition
Control component detects errors or failures.
Pressure/Pulse User Controls
This component controls the user-selected settings:
• Change the pressure units (mmHg/kPa)
• Change the pressure and pulse-rate alarm limits
• Select the input filter
• Start zero and calibration procedures
• Select the scale of the displayed wave
• Select the displayed pressure label
Temperature Software Module
The Temperature module derives a temperature value from a YSI series 400 thermistor
temperature probe. The temperature label is selectable and temperature-related alarm limits
can be set. An alarm message is displayed when the measured temperature is outside the set
range or outside the measurement range.
42
Introduction to the Instrument
Page 59

Temperature and Invasive Blood Pressure (Temp/Press) measurement
tro
Block diagram of the Temperature Software Module
Average Calculation
Pressure Waveform
Temp. Value
Temperature Alarming
Temperature software
Temperature
Controls
To & From Invasive Pressure &
Temp. Alarms
Temp. User Con
Signal Acquisition
This module is responsible for the A/D conversion of the analog signal from the temperature
transducer. The Signal Acquisition module provides a raw temperature value to the Average
Calculation module. The module also performs various self-tests and consistency checks to
ensure proper operation and reports errors and failures to the Alarming Module.
Average Calculation
This component averages the raw measured temperature values over an interval of 1 second.
The averaged values are converted to the user-selected unit.
Temperature Alarming
This component generates high/low alarms if an alarm limit is exceeded. Additionally, a
technical alarm is generated if no temperature can be measured.
Temperature User Controls
This component controls the user-selected settings:
• Set temperature alarm limits
• Select the temperature measurement units
Introduction to the Instrument
43
Page 60

Section 3 - Measurement Server Extensions Description and Features
Section 3 - Measurement Server Extensions Description
and Features
The Measurement Server Extensions (M3015A and M3016A) are flexible patient
measurement units which partner with the Meas urement Server to fo rm the base for a variety
of systems that enable easy customization to a hospital’s requirements. Extensions, as
convenient parts, expand on the important patient measurements provided by the
Measurement Server.
Used with the Measurement Server, the Measurement Server Extension is designed to
Monitor patients in most critical and acute patient care areas of the hospital. For be dside us e,
the Server and Extension are most commonly seen mounted on a Mon itor. The Server and an
Extension can also be mounted on a bed or a roller stand.
M3015A Measurement Server Extension
The Measurement Server Extension for sidestream CO2 measurement (M3015A) includes:
• Measurements of sidestream CO
• Signal and alarm processing
* (M3015A #C06 only.)
M3016A Measurement Server Extension
The Measurement Server Extension for mainstream CO2 measurement (M3016A) includes:
• Measurements of mainstream CO
• Signal and alarm processing
** (M3016A #A01 only.)
, and Press/Temp*
2
** and Press/Temp
2
Features
The Measurement Server Extensions have the following general features:
Data Management
The combination of the Measurement Server and the Measu rement Server Exten sion features
also Patient Data Management for CO
continuous 4-hour s torage of patient -related measurement informat ion. Th is allo ws you to do
the following:
and the second Pressure/Temp. This consists of
2
• Manage patient information.
• View patient data in graphs or tables via the Monitor.
• Print patient information reports to a local printer via the Monitor.
• Transfer data between Monitors.
44
Introduction to the Instrument
Page 61

M3015A Measurement Server Extension Theory of Operation
Settings Transfer
The combination of the Measurement Server and the Measurement Server Extension can be
transported from one Monitor to another and still keep its measurement settings. The settings
(such as alarm limits) are stored in the Measurement Server. This behaviour permits fast and
easy transport
Alarms Reset
The Measurement Server Extension responds to the Silence/Reset key on the Measurement
Server which allows you to silence alarm tones, while retaining visual alarm messages
(depending on your Monitor’ s configuration).
Server-to-Monitor Link Bar
A double connector version of the Server-to-Monitor link bar allows quick and easy
connection to a Monitor on one side and a Measurement Server on the other. This allows the
Monitor to show waves and alarms of interest from both the Measurement Server and the
Measurement Server Extension.
The interface subsystem consists of the physical interface to the Monitor and the
Measurement Server and controlling software.
Digitized patient information transmitted over the link bar may be waves (e.g. for ECG,
pressure, respiration, etc.); numeric information (for heart rate/pulse, pressure values, and
respiration rate); or alert information (for alarms and assorted status information).
M3015A Measurement Server Extension Theory of
Operation
The application-specific software for the second pressure/temp and CO2 runs on the main
CPU in the Measurement Server (see “Measurement Server Theory of Operation” on
page 21). The pressure/temperature and the CO
physiological data via the Frontend Link Protocol to the application-specific software on the
main CPU of the Measurement Server.
The T emp/Press features ava ilable on the Extension are identical to those available on the
Server. The Temp/Press selections specific to the Extension are T2 and P2.
If you press the Zero k ey on the Server, all invasive pressure measurements in use are zeroed.
To set independent zero and labels for P2, however, go into the Setup window on the
Monitor.
frontends communicate the pre-processed
2
If two temperatures are measured (one with the Server and one with the Extension), the
differential temperature (Delta Temp) is calculated by the Server.
For more information, see the section “Temperature and Invasive Blood Pressure (Temp/
Press) measurement” on page 37.
Introduction to the Instrument
45
Page 62

Functional Description of the M3015A Measurement Server Extension Hardware
Functional Description of the M3015A Measurement
Server Extension Hardware
The Extension receives information signals (such as Temp/Press) and a sidestream CO2
sample from the patient then transmits the data through the Server to the Monitor via the
Server-to-Monitor link bar. See the “Functional Description of the Measurement Server
Hardware” on page 22 for a description of the normal processing of measurement data.
The sidestream CO
Server and the Extension must have compatible software revisions.
WARNING Never use a Measurement Extension with a Measurement Server which contains
Release A software (A.XX.XX). Since the software required to process data from the
Extension is absent, the additional measurements will not be displayed.
To view the software revision, press the Setup key and select Revisions.
Pairing the Server with the Extension allows for the following:
• Measurement of both temperature and invasive blood pressure for the same patient.
• T wo temperatur e measurem ents for the same patient including a Delta Temp calculation
feature.
• Two invasive blood pressure measurements for the same patient.
For more information, see the section “Temperature and Invasive Blood Pressure (Temp/
Press) measurement” on page 37.
Extension is always used with a Server. To function correctly, both the
2
46
Introduction to the Instrument
Page 63

Functional Description of the M3015A Measurement Server Extension Hardware
e
Hardware Block Diagram
MUX
36-60V
28Vpp
+/-2%
36 - 60 Volt
Power Sync
RxD/TxD
FEL Addresses
Microstream CO2 BOARD
Power Supply
SRL Connector
to Measurement Server
}
(MSL connector)
Gas Inlet
Gas Outlet
+5V+15V
PRESS/
TEMP
Isoblock
Optocoupler and
Power transformer
Pressure or
Temperatur
Transducer
Main Functional Areas
• Microstream CO2 Board - consisting of an 80C552 Controller, the memory system (Flash
ROM, RAM, PLA, etc.), the Flow system (FilterLine recognition system, Inlet, soleno id
valve), Measurement Cell (Exciter, IR Source, Detectors and Temp Sensor) and an analog
section with ADC.
• DC/DC Converter Board -connecting to the Floating/Non-floating isolation area on the
Front-End Board. Consisting also of a multiplexer for Front-End Link communication to
the Measurement Server.
• PRESS/TEMP Front-End Board - consisting of the PRESS/TEMP Front-End and the
Floating/Non-floating Isolation area, all feeding signals to the DC/DC Board.
Introduction to the Instrument
47
Page 64

Sidestream CO2 Measurement
Sidestream CO2 Measurement
Description
The M3015A Measurement Server Extension has a sidestream carbo n dioxide respiratory gas
measurement for the Monitor monitoring device. It is designed to be used with the M3000A/
M3001A Measurement Server for adult, pediatric, or neonatal patients, in a hospital
environment and during patient transport in and outside hospitals by clinical users. The
patients can be intubated or non-intubated.
CO
respiratory gas measurements indicate the efficiency of the transfer of oxygen from
2
alveolar air into pulmonary capillary blood and the elimination of carbon dioxide from
pulmonary capillary blood and its transfer into alveolar air.
CO
respiratory gas measurements are evaluated as gas passes through the airway adapter on
2
the patient’s intubation system. CO
patient’s overall respiratory status.
Blood Gas concepts important to this section are:
respiratory gas measurements are an indication of the
2
• Airway Respiration Rate (AwRR)—The number of inspirations and expirations per
minute.
• End Tidal CO
(EtCO2)—The highest partial pressure of CO2 measured during one expi-
2
ration.
• Inspired Minimum CO
(ImCO2)—The lowest partial pressure of CO2 during inspi ra-
2
tion.
• Instantaneous CO
—The CO2 measurement at any instant.
2
• Ventilation—The movement of air in and out of the lungs by inspiration and expiration.
Measurements
The sidestream CO2 measurement produces respiratory CO2 gas readings in a real-time CO2
waveform together with numerics for End-tidal CO
(AwRR), and Inspired Minimum Carbon Dioxide (ImCO
Factors affecting accurate measurement of sidestream CO
• Proper connection between the Extension and the patient’s respiratory system.
• Temperature of the patient’s breath.
• Amount of water vapour in the patient’s breath.
• Barometric pressure at the site of measurement acquisition.
• Other gases, most notably N
O and O2, in the gas mixture.
2
The EtCO
(End Tidal Carbon Dioxide) measurement for Carbon Dioxide uses a technique
2
based on the absorption of infrared radiation by certain gases.
(EtCO2), Airway Respiration Rate
2
).
2
respiratory gas are as follows:
2
Infrared light is absorbed by CO
. The amount of absorption varies according to the CO2
2
concentration in the gas mixture. By using an infrared detector to measure the absorption, the
CO
concentration in a gas can be derived.
2
48
Introduction to the Instrument
Page 65

Sidestream CO2 Measurement
Sidestream CO2 Features
This illustration shows the user controls on the Server and the connector for appropriate
tubing for the sidestream CO
measurement on the Extension.
2
Connector for
sidestream CO
tubing.
2
Sidestream CO2 Wave
The two calibration marks are located at 10% and 60% of wave channel height. The lower
calibration mark is labelled 0 mmHg (0.0 kPa) on all scales. The upper one is adjustable from
20 mmHg (2kPa) to 100 mmHg (13 kPa) in steps of 10 mmHg (1kPa).
CO
2
40
Wave Range
0
Measurement Mode
In the measurement mode, the Extension continuously measures CO2 concentration,
calculates medical parameters and exchanges information with the Server via FELP.
• N
O Correction—This can be turned on or off. If N2O correction is off, only oxygen cor-
2
rection to CO
and N
2
is made. In this case, it is assumed that the gas mixture consists mainly of O2
2
(respiratory intensive care unit conditions).
If N
O correction is on, oxygen and N2O correction to the CO2 value is made. In this case,
2
it is assumed that the gas mixture consists mainly of O
and N2O (operating room condi-
2
tions).
Calibration Marks
Introduction to the Instrument
49
Page 66

Sidestream CO2 Measurement
O correction is required only on M3015A Measurement Server Exten sions with CO2 Data
N
2
Acquisition hardware revision A.01.09 or lower.
• N
O Correction—This can be turned on or off. If N2O correction is off, only oxygen cor-
2
rection to CO
and N
If N
it is assumed that the gas mixture consists mainly of O
tions).
• O
Correction— There is a fixed correction of 45% O2.
2
• Humidity Correction—This correction is selectable between Body Temperature Pressure
Saturated (BTPS) and Standard Pressure Temperature Dry (STPD). The Extension measures STPD and uses this correction formula:
• Max Hold—There are three possible selections:
is made. In this case, it is assumed that the gas mixture consists mainly of O2
2
(respiratory intensive care unit conditions).
2
O correction is on, oxygen and N2O correction to the CO2 value is made. In this case,
2
and N2O (operating room condi-
2
BTPS = 0.94 x STPD
• Off—The ETCO
• 10 seconds—The ETCO
and IMCO2 numerics display the breath-to-breath value.
2
and IMCO2 numerics display the highest/lowest value within a
2
moving window over a 10-second period.
• 20 seconds—The ETCO
and IMCO2 numerics display the highest/lowest value within a
2
moving window over a 20-second period.
50
Introduction to the Instrument
Page 67

Sidestream CO2 Measurement
Block Diagram of the Sidestream CO2 measurement
to/from Server
Serial
interface
with
Controller
and
Peripherals
Analog
Section
Exciter
Exciter
IR
IR
Source
Source
Detectors
and
Temp Sensor
Flow System
Pump,
solenoid,
tubing
Theory of Operation for M3015A Sidestream CO
Pressure
Sensor
Gas Outlet
Gas Inlet
with
Optical
Code
Recog-
nition
Sample Line Inlet
2
Sidestream CO2 is measured based on non-dispersive infrared absorption of breathing gas
samples. Signals progress through the circuit as follows:
Flow System
The flow system circulates the sidestream gas sample and pumps out waste gas.
Temperature Sensor
The temperature of the detector is measured and used to compensate temperature drift of the
CO
reading. Signals from the temperature sensor in the detector are amplified and then
2
passed through an Analog-to-Digital converter.
Exciter and Infrared Source
The exciter generates a high frequency, high voltage signal to ignite the infra-red source and
to generate the infrared radiation needed to measure the CO
concentration in the
2
measurement cell.
Introduction to the Instrument
51
Page 68

Sidestream CO2 Measurement
Detectors
The detectors are used to detect the reference signal (the signal which comes directly from
the IR source) and the main signal (the signal which passes through the sample cell).
Pressure Sensor
The pressure sensor is used to measure the ambient pressure during the auto zero process and
to measure the pressure in the measurement cell during measurement mode.
Analog Section
The analog section amplifies and digitizes the main, reference, pressure and temperature
signals.
Controller and Peripherals
The controller reads the digitized values from the analog s ection and calcul ates the CO2 wave
and numerics based on the measured main, reference, pressure and temperature signals. The
controller also controls the CO
Measurement Server, the Optical Code Recognition and the measured cell pressure.
frontend based on the control information received from the
2
Gas Inlet with Optical Code Recognition
The gas inlet allows the connection of Microstream FilterLines. The Microstream FilteLines
are detected by the Optical Code Recognition.
Serial Interface with FELP
The Serial Interface and Frontend Link Protocol (FELP) provide the communication
interface between the CO
frontend and the CO2 application softwa re mo dul e r unn i ng on th e
2
main CPU of the Measurement Server.
52
Introduction to the Instrument
Page 69

M3016A Measurement Server Extension Theory of Operation
M3016A Measurement Server Extension Theory of
Operation
The application-specific software for the second pressure/temp and CO2 runs on the main
CPU in the Measurement Server (see “Measurement Server Theory of Operation” on
page 21). The pressure/temperature and the CO
physiological data via the Frontend Link Protocol to the application-specific software on the
main CPU of the Measurement Server.
The T emp/Press features ava ilable on the Extension are identical to those available on the
Server. The Temp/Press selections specific to the Extension are T2 and P2.
If you press the Zero key on the Serv er all invasive pres sure channels in us e are zeroed. To set
independent zero and labels for P2, however, use the softkeys on the Monitor.
If two temperatures are measured (one with the Server and one with the Extension), the
differential temperature (Delta Temp) is calculated by the Server.
For more information, see the section “Temperature and Invasive Blood Pressure (Temp/
Press) measurement” on page 37.
frontends communicate the pre-processed
2
Introduction to the Instrument
53
Page 70

Functional Description of the M3016A Measurement Server Extension Hardware
Functional Description of the M3016A Measurement
Server Extension Hardware
The Extension receives information signals (such as Temp/Press and mainstream CO2) from
the patient then transmits the data through the Server to the Monitor via the Server-toMonitor link bar. See the “Functional Description of the Measurement Server Hardware” on
page 22 for a description of the normal processing of measurement data.
The mainstream CO
Server and the Extension must have compatible software revisions.
WARNING Never use a Measurement Extension with a Measurement Server which contains
Release A software (A.XX.XX). Since the software required to process data from the
Extension is absent, the additional measurements will not be displayed.
To view the software revision, press the Setup key and select Revisions.
Pairing the Server with the Extension allows for the following:
• Measurement of both temperature and invasive blood pressure for the same patient.
• T wo temperatur e measurem ents for the same patient including a Delta Temp calculation
feature.
• Two invasive blood pressure measurements for the same patient.
For more information, see the section “Temperature and Invasive Blood Pressure (Temp/
Press) measurement” on page 37.
Extension is always used with a Server. To function correctly, both the
2
54
Introduction to the Instrument
Page 71

Functional Description of the M3016A Measurement Server Extension Hardware
r
Hardware Block Diagram
MUX
36-60V
28Vpp
+/-2%
36 - 60 Volt
Power Sync
RxD/TxD
FEL Addresses
Opto-coupler
and Power
Transformer
Power Supply
SRL Connector
to Measurement Server
}
(MSL connector)
Mainstream CO
2
Isoblock
Floating/Non-floating
isolation
PRESS/
TEMP
Optocoupler and
Power transformer
CO2 Transduce
Pressure or
Temperature
Transducer
Main Functional Areas
• Front-End Board - consisting of the CO2 Front-End, PRESS/TEMP Front-End and the
Floating/Non-floating isolation area all feeding signals to the DC /DC Converter Board.
• DC/DC Converter Board - connecting to the Floating/Non-floating isolation area on the
Front-End Board. Consisting also of a multiplexer for Front-End Link communication to
the Measurement Server.
Introduction to the Instrument
55
Page 72

Mainstream CO2 Measurement
Mainstream CO2 Measurement
Description
The M3016A Measurement Server Extension has a mainstream carbon dioxide respiratory
gas measurement for the Monitor monitoring device. It is designed to be used with the
M3000A Measurement Server for adult, pediatric, or neonatal patients, in a hospital
environment and during patient transport in and outside hospitals by clinical users.
CO
respiratory gas measurements indicate the efficiency of the transfer of oxygen from
2
alveolar air into pulmonary capillary blood and the elimination of carbon dioxide from
pulmonary capillary blood and its transfer into alveolar air.
CO
respiratory gas measurements are evaluated as gas passes through the airway adapter on
2
the patient’s intubation system. CO
patient’s overall respiratory status.
Blood Gas concepts important to this section are:
• Airway Respiration Rate (AwRR)—The number of inspirations and expirations per
minute.
• End Tidal CO
tion.
• Inspired Minimum CO
• Instantaneous CO
• Ventilation—The movement of air in and out of the lungs by inspiration and expiration.
respiratory gas measurements are an indication of the
2
(EtCO2)—Highest partial pressure of CO2 measured during one expira-
2
(ImCO2)—Lowest partial pressure of CO2 during inspiration.
2
—The CO2 measurement at any instant.
2
Measurements
The mainstream CO2 measurement produces respiratory CO2 gas readings in a real-time CO2
waveform together with numerics for End Tidal CO
(AwRR), and Inspired Minimum Carbon Dioxide (ImCO
Factors affecting accurate measurement of mainstream CO
• Correct cleaning of the windows on the airway adapter and the transducer.
• Correct placement of the transducer on the airway adapter.
• Temperature of the patient’s breath.
• Amount of water vapour in the patient’s breath.
• Barometric pressure at the site of measurement acquisition.
• Other gases, most notably N
O and O2, in the gas mixture.
2
The EtCO
(End Tidal Carbon Dioxide) measurement for Carbon Dioxide uses a technique
2
based on the absorption of infrared radiation by certain gases.
Infrared light is absorbed by CO
. The amount of absorption varies according to the CO2
2
concentration in the gas mixture. By using an infrared detector to measure the absorption, the
CO
concentration in a gas can be derived.
2
(EtCO2), Airway Respiration Rate
2
).
2
respiratory gas are as follows:
2
56
Introduction to the Instrument
Page 73

Mainstream CO2 Measurement
Mainstream CO2 Features
This illustration shows the user controls on the Server and the connector for the mainstream
CO
measurement transducer on the Extension. The parts are described in the paragraphs
2
following the illustration:
Connector for a
mainstream CO
transducer.
2
Mainstream CO2 Wave
The two calibration marks are located at 10% and 60% of wave channel height. The lower
calibration mark is labelled 0 mmHg (0.0 kPa) on all scales. The upper one is adjustable from
20 mmHg (2kPa) to 100 mmHg (13 kPa) in steps of 10 mmHg (1kPa).
CO
2
40
Wave Range
0
Measurement Mode
In the measurement mode, the Extension continuously measures CO2 concentration and
calculates medical parameters.
• N
O Correction—This can be turned on or off. If N2O correction is off, only oxygen cor-
2
rection to CO
and N
2
is made. In this case, it is assumed that the gas mixture consists mainly of O2
2
(respiratory intensive care unit conditions).
If N
O correction is on, oxygen and N2O correction to the CO2 value is made. In this case,
2
it is assumed that the gas mixture consists mainly of O
and N2O (operating room condi-
2
tions).
Calibration Marks
Introduction to the Instrument
57
Page 74

Mainstream CO2 Measurement
Correction— There is a fixed correction of 45% O2.
• O
2
• Humidity Correction—This correction is selectable between Body Temperature Pressure
Saturated (BTPS) and Standard Pressure Temperature Dry (STPD). The Extension measures BTPS and uses this correction formula:
where P
P
P
= 47mmHg
H20
STPD
= P
BTPS .
P
abs
abs–PH2O
• Max Hold—There are three possible selections:
• Off—The EtCO
• 10 seconds—The EtCO
numerics display the breath-to-breath value.
2
numerics display the highest value within a moving window
2
over a 10-second period.
• 20 seconds—The EtCO
numerics display the highest value within a moving window
2
over a 20-second period.
Safety
To ensure the safety of the patient, the patient-applied part is isolated from ground by optocouplers and a transformer. The circuit is also encapsulated in plastic.
58
Introduction to the Instrument
Page 75

Mainstream CO2 Measurement
Block Diagram of the Mainstream CO2 measurement
OPTO-
COUPLER
COUNTERS
-
MICRO
PROCESSOR
EEPROM
A/D
DUAL
SL0PE
2
CO INPUT
AMPLIFIER
IR SOURCE
AZ PULSE
MONOFLOP
BIAS
REGULATION
IR
DETECTOR
PHASE
MOTOR
COMPARATOR
DRIVE
MOTOR
COIL
DRIVE
PULSE
POSITION
COIL
SENSE
AMPLIFIER
A/D
AMPLIFIER
Temp
HEATER
CONTROL
2
CO MODULE
SENSOR
HEATER
TRANSDUCER M1460A
GAS
Introduction to the Instrument
59
Page 76

Mainstream CO2 Measurement
Theory of Operation for the M3016A Mainstream CO
2
The signals progress t hrough the circuit as foll ows:
Microprocessor
This is in overall control of the mainstream CO2 measurement functions. As well, it performs
the following functions:
• Serial communication, via optocouplers.
• Calculation of the calibration constants.
• Calculation of the raw data of the mainstream CO
waveform.
2
Temperature Sensor, Amplifier, AIO, Heater Control and Heater
The temperature of the transducer is maintained at approximately 43°C to prevent
condensati on and to nega t e any discrepancies due to temperature changes. Signals from the
temperature sensor in the transducer are amplified and then passed through an Analog-toDigital converter. The microprocessor then adjusts the output of the heater control
accordingly.
Sense Coil, Motor Phase Comparator, Counters, Motor Drive, Drive Coil
The rotations of the chopper wheel in the transducer are regulated to 40 rotations per second.
The sense coil together with the motor phase comparator and the counters are used to
measure the actual number of rotations per second. The microprocessor reads the values out
of the counters and adjusts the motor drive output accordingly.
Infrared Detector, CO2 Input Amplifier, Dual Slope A/D, AZ Pulse Monoflop and Bias Regulation
Signals from the infrared detector are amplified and passed through a dual slope Analog-toDigital converter. This converter is controlled by the microprocessor via the counters. The
conversion is started at a predefined time and is performed synchronously with motor
rotation.
The following signals are produced and used as the input values for the mainstream CO
2
algorithm:
•Zero (GZ).
• Sample (GS).
• Reference (GR).
An auto zero signal (AZ), which is derived from the output of the motor phase comparator,
controls the bias regulation of the infrared detector. The AZ signal is enabled or disabled by
the microprocessor.
60
Introduction to the Instrument
Page 77

Tutorial for the Introduction to the Instrument
Tutorial for the Introduction to the Instrument
Question 1: Which is the complete list of what the Measurement Server measure?
a.The Multi-Measurement Server acquires the physiological signals ECG,
respiration, invasive and non-invasive blood pressure, oxygen saturation of the
blood, and temperature.
b.The Multi-Measurement Server acquires the physiological signals ECG,
respiration, non-invasive blood pressure, and oxygen saturation of the blood.
c.The Multi-Measurement Server acquires the physiological signals ECG, invasive
and non-invasive blood pressure, oxygen saturation of the blood, and
temperature.
Question 2: What is wireless printing? Does the M3046 Monitor sup port it?
a.A wireless interface functions in the same way as a normal serial interface except
that a modulated infrared beam is used to exchange data and status information
instead of a wire connection. Wireless printing is not presently supported on the
M3046 Monitor.
b.A wireless interface functions in the same way as a normal serial interface except
that a modulated infrared beam is used to exchange data and status information
instead of a wire connection. The IrDA interface in the M3046 Monitor provides
a wireless interface to an external printer.
c.A wireless interface functions in the same way as a normal serial interface except
that a modulated infrared beam is used to exchange data and status information
instead of a wire connection. There is no such product as yet.
Question 3: According to this Service Guide, how many layers is the Measurement Server
software divided into?
a.12.
b.2.
c.4.
Introduction to the Instrument
61
Page 78

Answers to the Tutorial for the Introduction to the Instrument
Answers to the Tutorial for the Introduction to the
Instrument
1) a. (See page 2 for more details.)
2) b. (See page 15 for more details.)
3) c. (See pa ge 21 for more details.)
62
Introduction to the Instrument
Page 79

2 Installing the Instrument
Objectives
In order to meet this chapter’s goals, you should be able to complete the installation of the
Monitor with a Server and an Extension including all of the following tasks:
• Install the Instrument.
• Configure the hardware.
• Perform post-installation checks.
• Connect a printer.
• Connect a local recorder.
• Comply with safety requirements.
As well, you should be able to perform site preparation and assemble any of the following
mounting options:
•Table Mount.
• Universal Bed Hanger.
• Wall Rail.
• Tilt/Swivel Mount.
• Universal Pole Clamp.
• Measurement Server Mounting Plate.
• Infrared Printer Connector.
The appropriate installation procedures are described in this chapter.
Concepts
The following section contains information that you need to understand befo re at tempt ing an
installation of an M3046A Monitor, an M3000A/M3001A Measurement Server and, where
present, M3015A/M3016A Measurement Server Extensions.
Instrument
Grounding
Line Voltage
Selection
Mounting Surface Analysis
Installing the Instrument 63
The detachable three-wire power cable grounds the Instrument to the power
line ground when plugged into an appropriate three-wire receptacle. This
cable protects both the patient and the hospital staff. Do not use any other
power cable.
Switch-mode power supply automatically selects the necessary line voltage
for the system.
The mounting surface frequently dictates the type of screw to be used when
mounting the equipment. Ability to analyse the mounting surface protects
both the patient and the hospital staff. Do not mount equipment unless the
screws are adequate and safe for the purpose.
Page 80

Safety
Safety
Patient Safety
To better secure patient safety, become familiar with the details of the “Monitor and
Measurement Server Specifications” chapter of the Instructions for Use.
Patient Leakage Current
The patient leakage current is less than 10µA at 230V/50Hz. The equipment has floating
inputs (Type CF) that are protected against the effects of defibrillation and electrosurgery.
This symbol indicates that the Instrument is Type CF and is designed to have
special protection against electric shocks (particularly regarding allowable
leakage currents, having an F-Type applied part, according to the standards
IEC 60601-1/EN60601-1/CSAC22.2 601.1/UL 2601-1), and is defibrillator proof.
Preparing to Install the Monitor
WARNING To avoid contaminating or infecting personnel, the service environment or other
equipment, make sure that equipment which has been used before has been
appropriately disinfected and decontaminated.
Power Source Requirements
See Electrical Specifications in the Specifications chapter of the Instructions for Use.
Protecting against Electric Shock
The M3046A Monitor is classified as Class I Equipment with an internal power source
according to IEC 60601-1/EN 60601-1/CSAC22.2 601.1/UL 2601-1, which means that it is
an instrument included in the protective grounding (protective earth) system of the room by
way of grounding contacts in the power plug.
T o prot ect the patient and hos pital personnel , when operating fr om an AC source, the cabinet
of the Monitor must be grounded. The Monitor is equipped with a detachable 3-wire cable
which grounds the Instrument to the power line ground (protective earth) when plugged into
an appropriate 3-wire receptacle.
CAUTION The Monitor uses DOUBLE POLE/NEUTRAL FUSING.
64
Installing the Instrument
Page 81

Preparing to Install the Monitor
g
WARNING Disconnect the Monitor from the AC source by unplugging the power cable from the
AC source receptacle or from the AC power connector at the side of the Monitor. The
On-Off/Standby button does not disconnect the Monitor from the AC mains supply.
WARNING Do not operate the M3046A Monitor on a 2-wire AC supply
Connect the grounding wire to the equipotential grounding post on the Monitor:
Equipotentia
Grounding Post
l
Equipotential Grounding
To eliminate potential differences between different pieces of equipment, in the
medically used room, for internal examinations on the heart or the brain, the Monitor
must have a separate connection to the equipotential grounding system.
One end of the equipotential grounding cable (potential equalization co ndu ctor) is conn ected
to the equipotential grounding post on the side of the Instrument and the other end is
connected to one point of the equipotential grounding system.
Examinations in or on the heart (or brain) should only be carried out in medically-used rooms
incorporating an equipotential grounding system, according to national standards.
Combining Equipment
All combinations of medical equipment with non-medical equipment must comply with IEC
60601-1-1.
WARNING If instruments are combined, the summation of the leakage currents can be hazardous
to the patient or hospital personnel.
If it is not evident from the Instrument specifications whether a particular instrument
combination is hazardous or not, service personnel must apply measurements and
install appropriate IEC 60601-1 compliant means to make sure the combination is safe
(see Chapter 4, “Testing the Instrument”). In a likely case, the user must consult the
manufacturers to ensure that the summation of leakage currents does not jeopardize
patient sa fety.
Installin
the Instrument
65
Page 82

Preparing to Install the Monitor
Apart from the possible danger caused by leakage currents, no other hazards are known to
result from the simultaneous use of the Monitor with other patient-connected equipment.
Environment
To ensure a completely safe electrical installation, follow the instructions described later in
“Installing the Monitor”. The environment where the system will be used should be
reasonably free from vibration, dust, corrosive or explosive gases, extremes of temperature,
humidity, and so on.
Allow at least 2 inches (5cm) clearance around the Instrument for proper air circulation.
For a cabinet-mounted installation, allow sufficient room at the front for operation and
sufficient room at the rear for servicing with the cabinet access door open.
Approximately 15 minutes after switch on, the Monitor operates within specifications at the
ambient temperatures shown in the tables given in Monitor Environmental Specifications and
Measurement Server Environmental Specifications in the Specifications chapter of the User’s
Guide.
Ambient temperatures that exceed these limits could affect the accuracy of the Monitor and
cause damage to the components and circuits.
Make sure that during operation, the Instrument is free of condensa tion. Condensation can
form when equipment is moved from one buildin g to another, thus being exposed to moistur e
and differences in temperature.
WARNING Possible explosion hazard if used in the presence of flammable anaesthetics.
66
Installing the Instrument
Page 83

g
Explanation of symbols used:
Standby for switching the Monitor on and off.
Attention, consult accompanying documents.
Infra-red Connector for connection to a printer.
On the Measurement Server - Defib Data In, that is the ECG marker
pulse sent from the defibrillator to th e Monitor. The marker pulse is then
processed with the ECG signal and displayed on the Monitor.
On the M3015A Measurement Serv er Ex tension - Gas Input
On the Measurement Server: ECG Data Out is the analog ECG signal
sent out from the Monitor to a defibrillator or other external device, such
as an intra-aortic balloon pump.
On the M3015A Measurement Server Extension: Gas Outlet/Exhaust.
On the Monitor: Data Output to serial recorder
Serial interface socket for connect io n to recorder (M3046A #J16 only)
Preparing to Install the Monitor
Alternating Current
Equipotential Grounding Post (see Equipotential Grou nding earlier in this
chapter)
Battery Compartment
Type CF Applied Part and defibrillator proof with special protection
against electric shocks for i nt racardiac application (rega rding allowable
leakage currents by having an F-Type isolated or floating section).
()(
)
Indicates a Monitor with Wireless LAN Interface (symbol appears on
carrying handle)
Class 2 Radio equipment identifier (1999/5/EC)
Installin
the Instrument
67
Page 84

Preparing to Install the Monitor
The following are the markings on the back of the Monitor:
This device complies
with FCC part 15
of the FCC rules.
Operation is subject to
the following two conditions:
(1) this device may not
cause harmful interference.
and
(2) this device must accept
any interference received,
including interferenc e that
may cause undesired
operation.
SN: XXXXXXXXXX
Radio module inside
FCC ID IMKRL2630M
R
NRTL/C
0366
0560
CLASS 1
LASER
PRODUCT
Prod No. M3046A Opt.
Philips
S
D-71034 Boeblingen,
Made in
Germany
Germany
2003-05
The printer port uses LED devices for infrared communication with the printer. These LED
devices are measured to be AEL Class 1 LED Products per IEC 825-1 and CENELEC
EN60825-1 Standards.
0366
0560
The Philips M3046A Compact Portable Patient Monitor complies with the
requirements of the Council Directive 93/42/EEC of 14 June 1993
(Medical Device Directive) and Council Directive 1999/5/EC of 9 March
1999 (Radio and Telecommunications Terminal Equipment Directive).
68
Installing the Instrument
Page 85

Preparing to Install the Monitor
g
The following are the markings on the back of the M3001A Measurement Server and the
Measurement Server Extension:
Prod No. M30XXA
SN: XXXXXXXXXX
Opt: XXX XXX XXXXXX
M30XXA
D-71034 Boeblingen Germany
Shows date
of manufacture
2003-05
The M3001A Multi-Measurement Server and M3015A/M3016A Measurement
0366
R
NRTL/C
0366
Made in
Germany
Server Extension comply with the requirements of the Council Directive 93/42/EEC of 14
June 1993 (Medical Device Directive).
Installin
the Instrument
69
Page 86

Unpacking the Monitor
Unpacking the Monitor
The box containing your Monitor comes with the following:
• The Monitor.
•A Power Cord.
• The Instructions for Use and Quick Reference Guide (printed).
• Translation Reference for M3/M4 Monitor Texts (non-Roman-8 languages only).
• Documentation CD-ROM including Instructions for Use, Quick Reference Guide, and
Service Guide.
The box containing your Measurement Server contains only the Measurement Server.
The box containing an M3016A Measurement Server Extension contains only the
Measurement Server Extension.
The box containing an M3015A Measurement Server Extension contains the Measurement
Server Extension and the associated accessories.
In addition you should receive all of the options and accessories that you have ordered.
If anything is missing, contact your Philips Medical Systems representative immediately.
If anything has been damaged in trans i t, keep the packing material for inspection and contact
your Philips Medical Systems representative immediately.
Do not use the Monitor if the casing has been damaged.
If the Monitor is damaged, make sure that the screen is not leaking. There is no known d anger
from the fluid of irritation to skin or eyes, or by inhalation. The median lethal dose if taken
orally is 2.0g/kg.
There are no special procedures necessary for cleaning spilled fluid.
Installing the Monitor
CAUTION Avoid placing the Monitor, Measurement Server or Measurement Server Extension
underneath an infusion bag. Make sure that infusion liquid cannot get into any of the
Measurement or Monitor connectors.
Be sure to read the sections on “Preparing to Install the Monitor” on pa ge 64 and “Unpacking
the Monitor” on page 70 before continuing.
T o install the Monitor yo u must make sur e it has an adequa te power supp ly (see “Preparin g to
Install the Monitor” on page 64 for information about AC power, and the “Using Your
Monitor in Patient Transport” chapter in the Instructions for Use for information about using
batteries).
70
Installing the Instrument
Page 87

Connecting the Measurement Server...
g
Switch the Monitor on using the On-Off/Standby button:
Silence
Reset
Suspend
Setup
Main
Screen
On-Off/Standby
On
Off/Standby
Making the Altitude Setting
A correct altitude setting is important to ensure accurate CO2 readings.
Step 1 Enter Config Mode and press the Setup key.
Step 2 Select Alti tude
Step 3 Select the val ue from th e list wh ich is closest to the altitude of the hospital.
AC Power
Battery
Connecting the Measurement Server...
...with the Measurement Server directly on the Monitor
You can connect the Measurement Server to the Monitor by mounting it directly on the
Monitor:
Step 1 Make sure that you r Moni tor ha s a link bar:
Latch
Link Bar
Plug to
Measurement Server
If your Monitor does not have a link bar:
a.Position the link bar as shown in the diagram above.
Make sure that the guide is in the slot under the plug (which connects to the
Measurement Server).
b.Press the Link Bar into pos ition until it clicks.
Installin
the Instrument
71
Page 88

Connecting the Measurement Server...
c.Turn the latch guard to lie perpendicular across the edge of the latch.
Step 2 Place the Measurement Server on the back of the Monitor.
If it is not tight against the back of the Monitor, slip it away from the link bar until it
is.
Step 3 Slip th e Measurement Server forward until it clicks into place.
T o remove the Measuremen t Server from the Monitor , move the latch (in the middle
at the top of the Monitor) toward the front of the Monitor, and slide the
Measurement Server away from the link bar:
Latch
72
Installing the Instrument
Page 89

Connecting the Measurement Server...
g
...with the Measurement Server Separate from the Monitor
You can connect the Measurement Server to the Monitor using a server link cable (MSL) as
follows:
Step 1 You can connect the cable to the plug on the link bar, or directly to the Monitor as
follows:
Latch
Link Bar
To remove the link bar,
a.Turn the latch guard away from the edge of the latch.
b.Unlatch the link bar from the back of the Monitor.
c.Slide the link bar away from the Monitor.
Step 2 Attach the socket end of the cable to the Monitor.
Step 3 Attach the other end of the cable to the Measurement Server or, if present, the
M3015A/M3016A Measurement Server Extension.
Installin
the Instrument
73
Page 90

Attaching the Monitor to a Mount
...with the Measurement Server Attached to an M3015A/M3016A Measurement Server Extension
The Measurement Server can be used in conjunction with a Measurement Server
Extension.When the Measurement Server is used together with a Measurement Server
Extension, CO
may be measured.
An M3015A/M3016A Measurement Server Extension must be used with a M3000A/
M3001A Measurement Server. The Extension does not function alone.
Attach the Measurement Server to the Measurement Server Extension by sliding it into the
grooves on the Measurement Server Extension and clicking it into place.
Attach the combination of Measurement Server Extension and Measurement Server to the
Monitor exactly as described above for the Measurement Server, by sliding the Extension
into the grooves on the Monitor and clicking it into place.
, a second temperature (TEMP) and/or a second invasive pressure (PRESS)
2
Attaching the Monitor to a Mount
Step 1 Make sure the front of the Monitor is facing the front of the mount. The front of the
mount has a blue button in the center.
Step 2 Lower the Monitor onto the mount until the feet of the Monitor click into the mount.
Detaching the Monitor from a Mount
Step 1 Press and hold in the button (indicated by the arrow) on the front of the mounting .
Step 2 Lift the Monitor away from the mount:
Step 3 Release the button.
74
Installing the Instrument
Page 91

Attaching the Measurement Server to a Mount
g
Attaching the Measurement Server to a Mount
Step 1 Make sure the Measurement Server is oriented correctly relative to the mount (see
the picture below).
Step 2 Place the Measurement Server on the back mount.
If it is not tight against the mount, slip it in the direction of the measurement
connectors until it is.
Step 3 Slip th e Measurement Server forward until it clicks into place.
Latch
Detaching the Measurement Server from a Mount
Step 1 Press and hold the latch (in the middle at the top of the mount) away from the
Measurement Server.
Step 2 Slide the Measurement Server off the mount in the direction of the measurement
connectors.
Positioning the Measurement Server on a Clamp Mount
For convenience, if you have your Measurement Server on the clamp mount, you can
position it with any one of the four edges facing upwards (four positions). Reposition it by
completing the following steps:
Installin
the Instrument
75
Page 92

Connecting to the Nurse Call Relay
Step 1 Press and hold the mount latch toward the clamp screw.
Rotate the Measurement Server and mount until you get it to the position you want.
Step 2 Release the mount latch, and make sure it is clicked into one of the four slots on the
back of the mount.
Connecting to the Nurse Call Relay
Mount
Latch
The nurse call relay is a 3.5mm, mono phone jack socket. It is completely isolated from the
rest of the circuitry. Under normal conditions, the tip and sleeve are “open” (not shorted
together). When an alarm is indicated, the tip and sleeve are shorted together by a relay.
WARNING Do not rely exclusively on the Nurse Call Relay for the notification of alarm conditions.
The relay output cannot be checked by the Monitor, and the Monitor cannot notify the
user of any failure of the relay.
See the specifications for the Nurse Call Relay in the Monitor and Measurement Server
Specifications chapter of the Instructions for Use, and the documentation for the device you
are connecting.
Modification for Nurse Call Alarm Relays
Some customers may want to have an Open-On-Alarm relay instead of a Closed-On-Alarm
for their Nurse Call system. Qualified Philips service personnel can modify the connector
board, part number M3046-66522.
The modification should be d one o nly on request, in the field. All factory supplied connecto r
boards or monitors have the original board including the Close-On-Alarm Relay.
To make the Open-On-Alarm relay modification, complete the following steps:
76
Installing the Instrument
Page 93

g
Step 1 Cut the existing conductor path on the upper side of the connector board with a
1. Cut connector path
Modification for Nurse Call Alarm Relays
sharp implement:
2. Remove Shavings
Step 2 Very carefully remove all copper or plastic shavings from the board.
Step 3 Turn board over.
Step 4 Build the new connection to the Open-On-Alarm contact, shown below.
Using a piece of wire and solder, connect the three (3) points on the bottom of the
circuit board as illustrated in the following photographs:
3. Turn board over
4. Build new connection
Installin
the Instrument
77
Page 94

Installation of Wireless Infrastructure
Verification Procedure
Perform the following tests.
Step 1 Power on test (see page 142)
Step 2 Nursecall Performance test (see page 157)
Step 3 Safety test (see page 159)
NOTE You must document the modification for a particular unit, including the verification tests, in
the CSO. You must add a printed, dated and signed installation note to the Service
documentation of the modified Monitor.
For convenience, we suggest that you attach a label to the instrument next to the output and,
using permanent black or blue ink, add localized text similar to:
“Nurse Call is Open-On-Alarm Relay” or “Nurse Call is open”.
Installation of Wireless Infrastructure
See the IntelliVue Clinical Network Service Manual.
Please also consult the configuration section of the monitor’s Instructions for Use for
information on assigning a label to the monitor.
Configuring the Radio Frequency of the M3/M4 Monitor
The configuration tool for this procedure is contained on the IntelliVue Information Center
Application Software CD ROM that corresponds to your revision of the monitor and
Information Center, and must be copied to the PC used for the configuration procedure.
The configuring PC must meet the following requirements.
• Microsoft Operating System software (Windows 98 or Windows NT)
• 200 MHz or higher clock speed
• RS 232 serial interface port (9-Pin D type connector)
• contain a CD ROM drive
M3/M4 monitors can have two IP Addresses, one for the monitor itself and one for the
Wireless Adapter card that transmits data to the Access Point. The M3/M4 monitor IP
Address is set dynamically by the Information or Surveillance Center dis pl a ying its
monitoring data. This procedure describes how to configure the Wireless Adapter card and
set its IP Address.
78
Installing the Instrument
Page 95

Installation of Wireless Infrastructure
g
The following cable is required to interconnect the configuring PC to the Wireless LAN
adapter in the M3/M4 patient monitor:
• 9-pin D female - 1/8 in. male stereo phono cable (PN M1360-61675)
Copying the Configuration Tools to the Configuring PC
The first step in the procedur e is to co py t he confi g urati on tool s oftwa re f rom the IntelliVue
Information Center Application Software CD ROM to the configuring PC.
Step 1 Turn on the configuring PC to display the Windows Main Menu.
Step 2 Insert the IntelliVue Information Center Application Software CD ROM
into the CD ROM drive of the configuring PC.
Step 3 Open Windows Explorer as follows:
a.Click on Start in the lower left of the Windows Main Menu to open the
Windows Workstation menu.
b.Click Programs to display the Programs menu.
c.Click Windows Explorer to display folders in the PCs CD ROM drive.
Find the Viridia directory on the CD ROM shown in the figure below and click on
it to display the tools directory .
Viridia
Step 4 Copy the Viridia\tools\ConfigTool directory to the drive on the configuring PC
to be used for storing this program as follows:
a.Open the directory to be used on the configuring PC
b.Click on, hold, and drag the Viridia\tools\ConfigTool directory to the open PC
directory
NOTE The Viridia\tools\ConfigTool directory file is less than 1.4 Mb so it can be stored on a 1.4
Mb floppy disk for later use, or for transfer to a PC without a CD ROM drive.
Installin
the Instrument
79
Page 96

Installation of Wireless Infrastructure
Making the Config Files Writeable
The Config Files are read-only and must be made writeable for the tool to be used for
configuration. The following steps describe the procedure after the files have been copied to
the configuring computer:
Step 1 Open the ConfigFiles directory by clicking on the ConfigFiles folder in the tools
menu on the configuring PC. The files on the right of the previous figure will be
displayed.
Step 2 Cl ick on the f ile labelled WB_WirelessM3_1-2b15.CFG to select it.
NOTE The selected file must be made writeable because settings used in the configuration process
are saved to this file so they can be reused when the configuration tool is used again.
Step 3 Place the cursor over either of the highlighted fields and right-click the mouse to
display a menu listing Properties, as shown below:
80
Installing the Instrument
Page 97

Installation of Wireless Infrastructure
g
Step 4 Click on Properties to display the selected file’s Properties window.
Click in the Attributes: box preceding Read-only to remove the check. This removes
Read-only from the selected file.
NOTE If the configuration tool is run with this file set as Read-only, the following error message
will be displayed. Clicking OK will exit the tool and the Read-only attribute must be
removed to clear this condition.
Running the Configuration Tool
Once the tool has been copied and made writeable, it can be run. The first step is to select
which device -- Access Point, Switch, or M3/M4 Monitor -- to configure.
Step 5 Run the configuration tools as follows:
a.select Start in the lower left of the Windows Main Menu
b.select Run in the Windows Workstation menu
Installin
the Instrument
81
Page 98

Installation of Wireless Infrastructure
c.click Browse to access the Browse application
d.select ConfigTool in the tools menu of the stored configuration t ools files
e.locate the file ConfigTool.exe in the ConfigTool directory
f. double click ConfigTool.exe to enter it into the Open: field of the Run
window.
g.click OK to open the Configuration Tool window:
The Configuration Tool Wi ndo w is used to select the Serial Port (COM1 or
COM2) on the configuring PC that will be used to perform the configuration and
the configuration file for the device being configured -- Access Point, Network
Switch, or Wireless Bedside.
Step 6 Select the Serial Port to be used (COM1 or COM2) in the Select Serial Port field
by clicking in the circle preceding the appropriate port.
Step 7 Select the appropriate Device to Configure in the drop down list in the
Configuration Tool window of the configuring PC. See previous figure.
Step 8 Select the file tools\ConfigTool\WB_WirelessM3_1-2b15.cfg in the
Configuration File fields.
NOTE If this file does not automatically appear in the Configuration File field, click Browse and
find this file on the computer drive directory where it was stored.
Step 9 Turn OFF the power of the Wireless M3/M4 Monitor and disconnect any cable
connected to the RJ-45 port on its rear panel.
82
Installing the Instrument
Page 99

Installation of Wireless Infrastructure
g
Step 1 0 Unsnap the gray cover on the upper right side of the M3/M4 Monitor housing to
expose the female stereo phono plug on the Wireless Adapter, as shown in the next
figure:
Stereo
Phono
Plug
Step 11 Connect the phono plug end of the 9-Pin D female - 1/8 in. male S tereo Phono cable
into the phono plug connector on the Wireless Adapter as shown above and the 9pin D end of the cable into the 9-Pin D Serial Port connector on the configuring PC.
Step 1 2 Turn ON the M3/M4 Monitor and insure that it passes its self-test.
Step 1 3 Select the WB_WirelessM3_1-2b15.cfg item in the drop down list in the
Configuration Tool window.
Installin
the Instrument
83
Page 100

Installation of Wireless Infrastructure
Step 1 4 Click OK to open the Wireless Bedside Parameters window:
Step 1 5 Modify the “domain” field according to your design requirements. Refer to
Appendix A of the M3185A IntelliVue Clinical Network Service Manual for the
appropriate wireless configuration worksheets.
NOTE Security ID: Keep the default entry m3150.
If an error message appears, see Troubleshooting in the Access Point section.
This configuration process takes about 1 minute. During configuration, status messages will
be displayed in the field at the bottom of the Wireless Bedside Parameters window as the
tool resets the configuration to factory default values, sets the configuration parameters, and
then resets the Wireless Adapter.
When the tool has successfully completed the configuration, the Wireless Bedside
Configuration is completed successfully window is displayed:
The configuration tool will write the configuration dialog and summary information to a file
if you wish. It will create a Log file name by combining Bed and the 2 digi ts of the Domain
entered in the Wireless Bedside Parameters window.
84
Installing the Instrument
 Loading...