

Page 1
Form 2971 • Price $21.00
Edition 7 • © October 1997
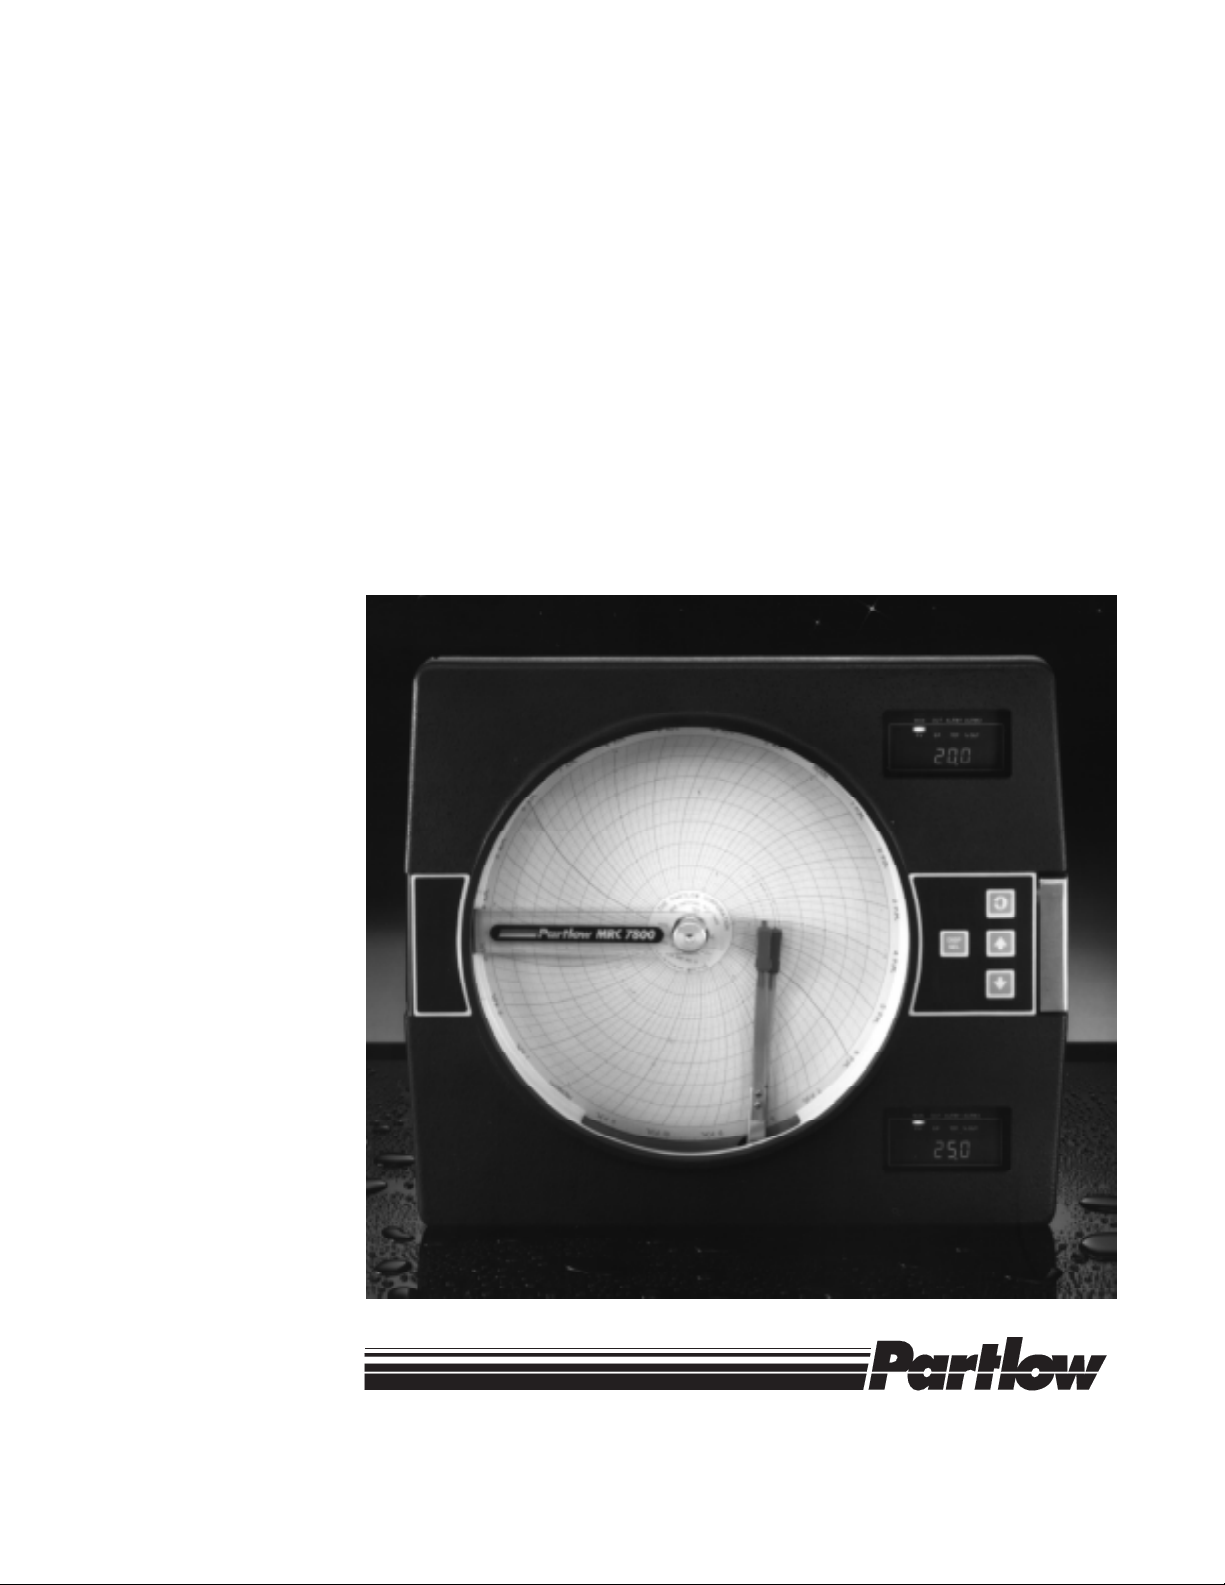
ONE AND TWO PEN CIRCLE CHART FLOW RECORDER
MRC 7800
Installation, W iring, Operation Manual
The Partlow-West Company • Two Campion Road • New Hartford NY 13413 • 315.797.2222 • Fax: 315.797.0403
QUALITY INSTRUMENTATION DESIGNED & MANUFACTURED IN THE U.S.A.
Page 2

PAGE 2
nformation in this installation, wiring, and operation
manual is subject to change without notice. One
manual is provided with each instrument at the time of
I
shipment. Extra copies are available at the price published
on the front cover.
Copyright © October 1997, The Partlow-West Company, all
rights reserved. No part of this publication may be reproduced, transmitted, transcribed or stored in a retrieval system, or translated into any language in any form by any
means without the written permission of the Partlow-West
Company.
This is the Seventh Edition of the MRC 7800 Flow Recorder
manual. It was written and produced entirely on a desktop-publishing system. Disk versions are available by written request to the Partlow Advertising and Publications
Department.
We are glad you decided to open this manual. It is written
so that you can take full advantage of the features of your
new MRC 7800 Flow Recorder.
Page 3

Table of Contents
SECTION 1 - GENERAL Page Number 1.1
Product Description 5
SECTION 2INSTALLATION & WIRING
2.1 Installation & Wiring 7
2.2 Unpacking 7
2.3 Location 7
2.4 Mounting 7
2.5 Preparation for Wiring 8
2.6 Wiring Connections 9
SECTION 3 - GENERAL OPERATION
3.1 How the instrument operates 14
PAGE 3
SECTION 4 CONFIGURATION & OPERATION
4.1 Configuration Introduction 18
4.2 Shipped Configuration / Jumper Positioning 19
4.3 Operation Summary 19
4.4 Start Up Procedure 20
4.5 Configuration & Operation 21
4.6 Data Logger Display Mode 32
SECTION 5 - SERVICE
5.1 Service 34
5.2 Changing Charts 34
5.3 Changing Pens 34
5.4 Calibration 35
5.5 Test Mode 37
5.6 Troubleshooting and Diagnostics 40
APPENDICES
A - Board Layouts
A-1 Processor Board 46
A-2A Relay (SPST) Output Board 47
A-2B Relay (SPDT) Output Board 48
A-3 Current Output Board 49
B - Glossary 50
C - Model Number Hardware Matrix Details 52
D - Specifications 53
E - Software Record/Reference Sheet 55
Warranty Inside Back Page
Page 4

PAGE 4
FIGURES & TABLES
Figure 1-1 Front View 5
Figure 1-2 Display Features 6
Figure 2-1, Panel Dimensions 8
Figure 2-2 Board & Terminal Locations 9
Figure 2-3 AC Power Input 10
Figure 2-4 Volt, millivolt, & milliamp Input 11
Figure 2-5 Transmitter Power Supply Input 11
Figure 2-6 Remote Reset Input 12
Figure 2-7A Relay Output (SPST) 12
Figure 2-7B Relay Output (SPDT) 13
Figure 2-8 SSR Driver Output 13
Figure 2-9 Current Output-Standard 13
Figure 4-1 Keypad Features 19
Figure 5-1 Changing Pens 34
Table 3-1 Variable exponents of Parshall flumes 16
Table 3-2 Totalizer Factor 17
Table 3-3 Totalizer Factor Example 17
Table 4-1 Enable Mode Configuration Procedure 25
Table 4-2 Program Mode Configuration Procedure 26
Table 4-3 Alarm Set Mode Configuraton Procedure 30
Table 4-4 Data logger Setup Mode Configuration 30
Table 4-5 Preset Adjust Mode Configuration 31
Table 4-6 Data logger Display Mode Configuration 33
Table 5-1 Calibration Procedure 35
Table 5-2 Test Procedure and Description 37
Page 5
Product Description 1.1
1.1.1 GENERAL
The instrument is a microprocessor based circular chart recorder capable of measuring,
displaying, recording, and datalogging flow process variables. Three square root extraction
algorithms are available for use with a variety of transmitters and transducers, and four
algorithms are available for use with a variety of weirs and flumes.
Recording functions, alarm settings, and other parameters are easily entered via the front
keypad. All user data can be protected from unauthorized changes by the Enable mode
security system, and is protected against loss from AC power failure by battery back-up.
The process input for each pen is user configurable to directly connect to either mVDC, VDC,
or mADC inputs. Changes in input type are easily accomplished in the field. The unit's
process input is isolated from the rest of the unit. An isolated 24VDC regulated transmitter
power supply can be provided for use with two-wire mADC inputs.
The unit can be ordered for either 115VAC or 230VAC power at 50/60Hz. The 230VAC
option includes a switch for changing back and forth between 230VAC and 115VAC. The unit
is housed in a plastic enclosure suitable for panel or surface mounting.
1.1.2 RECORDING
The unit incorporates a 10 inch circular chart. One box of standard charts is provided with
each unit. Charts are available in a wide selection of ranges. Chart rotation speed is
programmable from 0.1 to 999.9 hours per revolution in 0.1 hour increments. The instrument
can be provided with one or two pens. Pen 1 is red and Pen 2 is green. Pens are of the
disposable fiber-tip type. Changes in pens, as well as charts, are quickly and easily accomplished.
PAGE 5
A programmable chart/display filter is provided. This filter provides adjustable dampening of
the value displayed and recorded. The filter need not be used. (Configured in program mode
as "dFF," Display Filter Factor.)
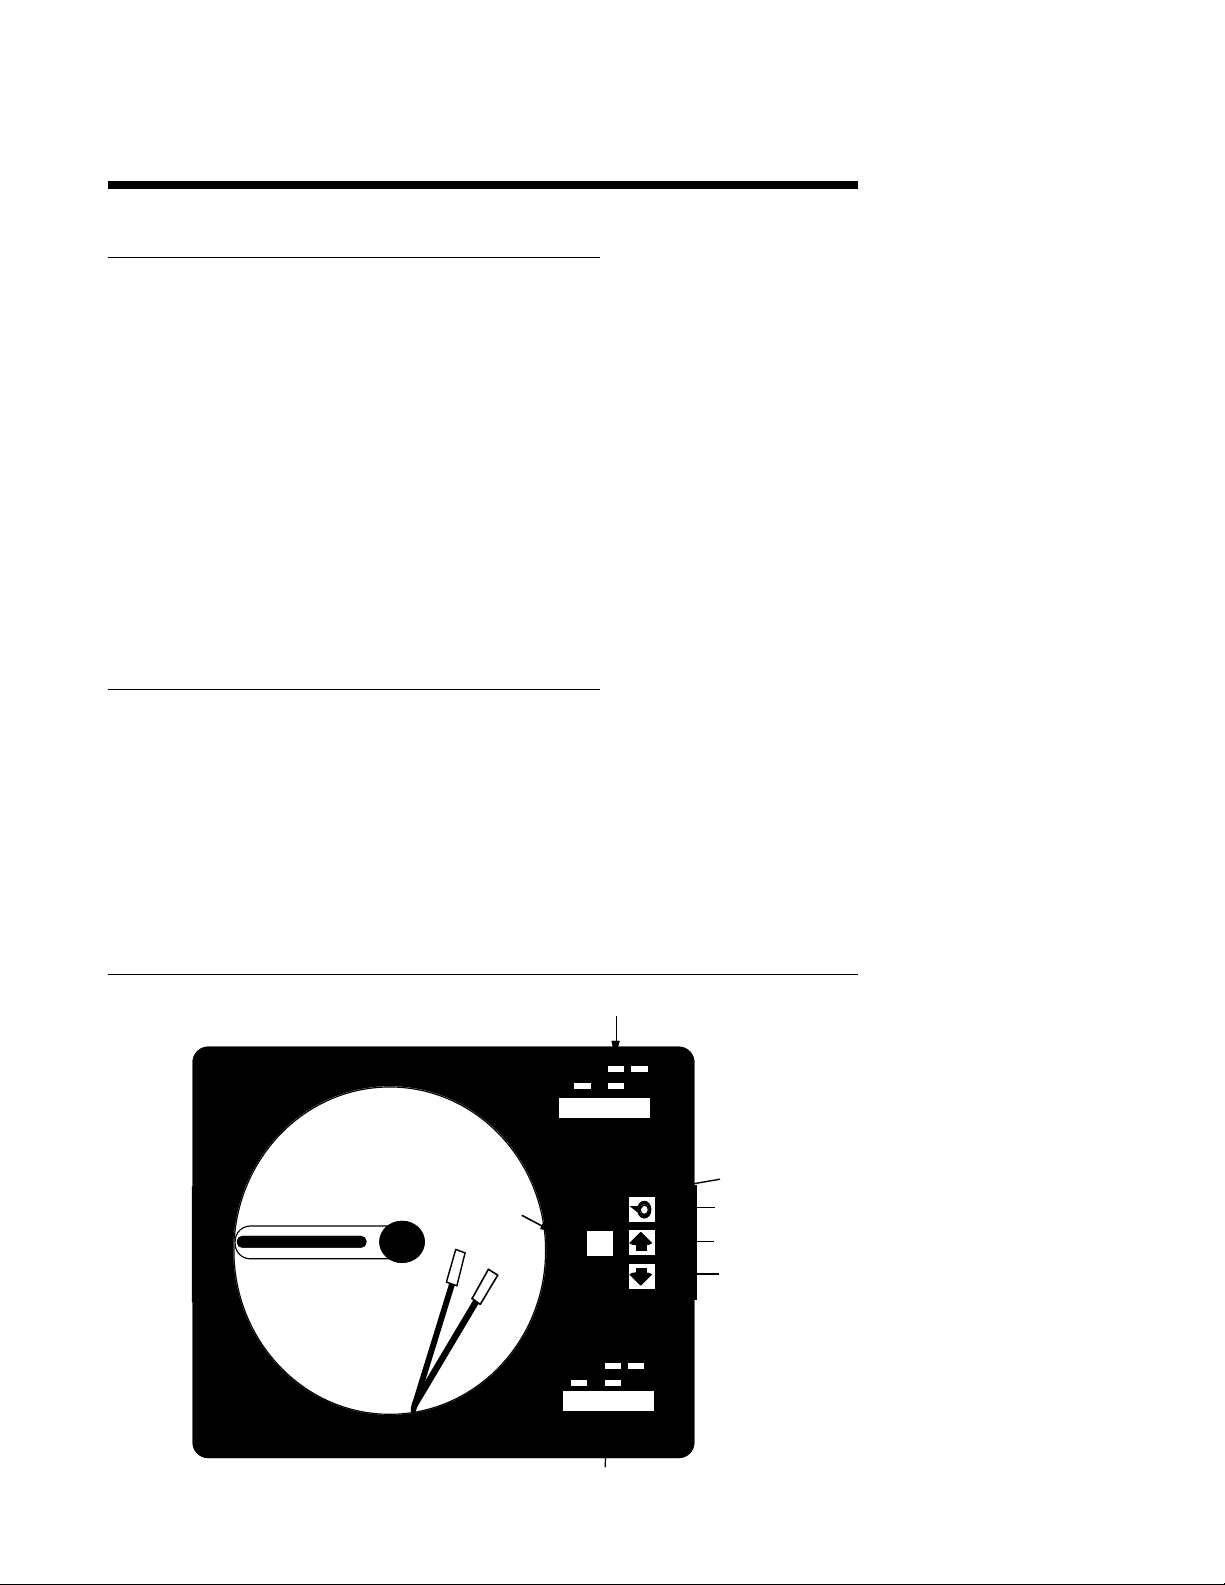
FIGURE 1-1
Pen 1
Auto/Manual
Display
Key
Select Key
Pen 2
Auto/Manual
Key
PEN 1 DISPLAY
Keypad
Scroll Key
Up Key
Down Key
PEN 2 DISPLAY
Page 6

PAGE 6
1.1.3 DISPLAYS
Each unit is provided with an eight character digital display and status indicators for each pen
provided. The display provided in the upper right corner is for Pen 1, and the display in the
lower right corner is for Pen 2. Status indication is provided for Alarm 1 and Alarm 2. The
display is programmable for none, one, two or three decimal places for process value and
total, with additional scaling ability for the total. The second display is also optional on one
pen units with totalization for simultaneous display of the process value and total.
1.1.4 ALARMS
Alarm indication is standard on all units. Alarm settings are fully programmable. Alarm type
may be set as Process high or low. Indication is via status LED's provided for each pen.
Alarm outputs can be provided by assigning any specified relays (SPST, SPDT or SSR driver)
to the respective alarm.
1.1.5 PROCESS VALUE OUTPUT
If a unit is specified with 4 to 20 mADC outputs, these outputs may be programmed to
operate as a Process Value Output. As such, the output is scaleable.
FIGURE 1-2
PV
ALRM1 ALRM2
TOT
Page 7

Installation & Wiring 2.1
CAUTION: The Instrument AC power input is as specified in the model number; 115VAC or 230VAC. Verify the AC power
input provided with the instrument prior to proceeding with installation.
Read these instructions carefully before proceeding with installation and operation. Electrical
code requirements and safety standards should be observed. Installation should be performed by qualified personnel.
Unpacking 2.2
Remove the unit from the carton and inspect it for any damage due to shipment. If any
damage is noticed due to transit, report and file a claim with the carrier. Write the model
number and serial number of the unit on the inside of the front cover of this Operation Manual
for future reference when corresponding with the factory.
Location 2.3
Locate the instrument away from excessive moisture, oil, dust, and vibration. Do not subject
the instrument to operating temperatures outside of 0 to 55˚ C.
PAGE 7
Mounting 2.4
Figure 2-1 (page 8) shows installation view and physical dimensions for a panel mounted
unit.
The panel that the unit will be mounted in must provide rigid support for the approximately 20
pound unit . Adjacent units may be mounted within a minimum of 2 inches horizontally and 3
inches vertically, providing that proper panel support is supplied.
PANEL MOUNTING HARDWARE REQUIRED: (not provided with instrument)
(4) 9/32" x 2" bolts w/nuts
(4) appropriate lockwashers
PANEL MOUNTING:
1) Cut panel hole to dimensions shown in Figure 2-1 (page 8).
2) If the rear of the panel is accessible for wiring after mounting, place the unit in the
panel cutout and fasten it to the panel through mounting holes supplied in the case
flange.
3) If the rear of the panel is not accessible for wiring, proceed with wiring preparation and
wiring, then mount the unit.
SURFACE MOUNTING:
1) If surface mounting is required, use Kit # 64402001 (ordered separately) Install mounting
brackets on sides of case and mount on the mounting surface.
Page 8
PAGE 8
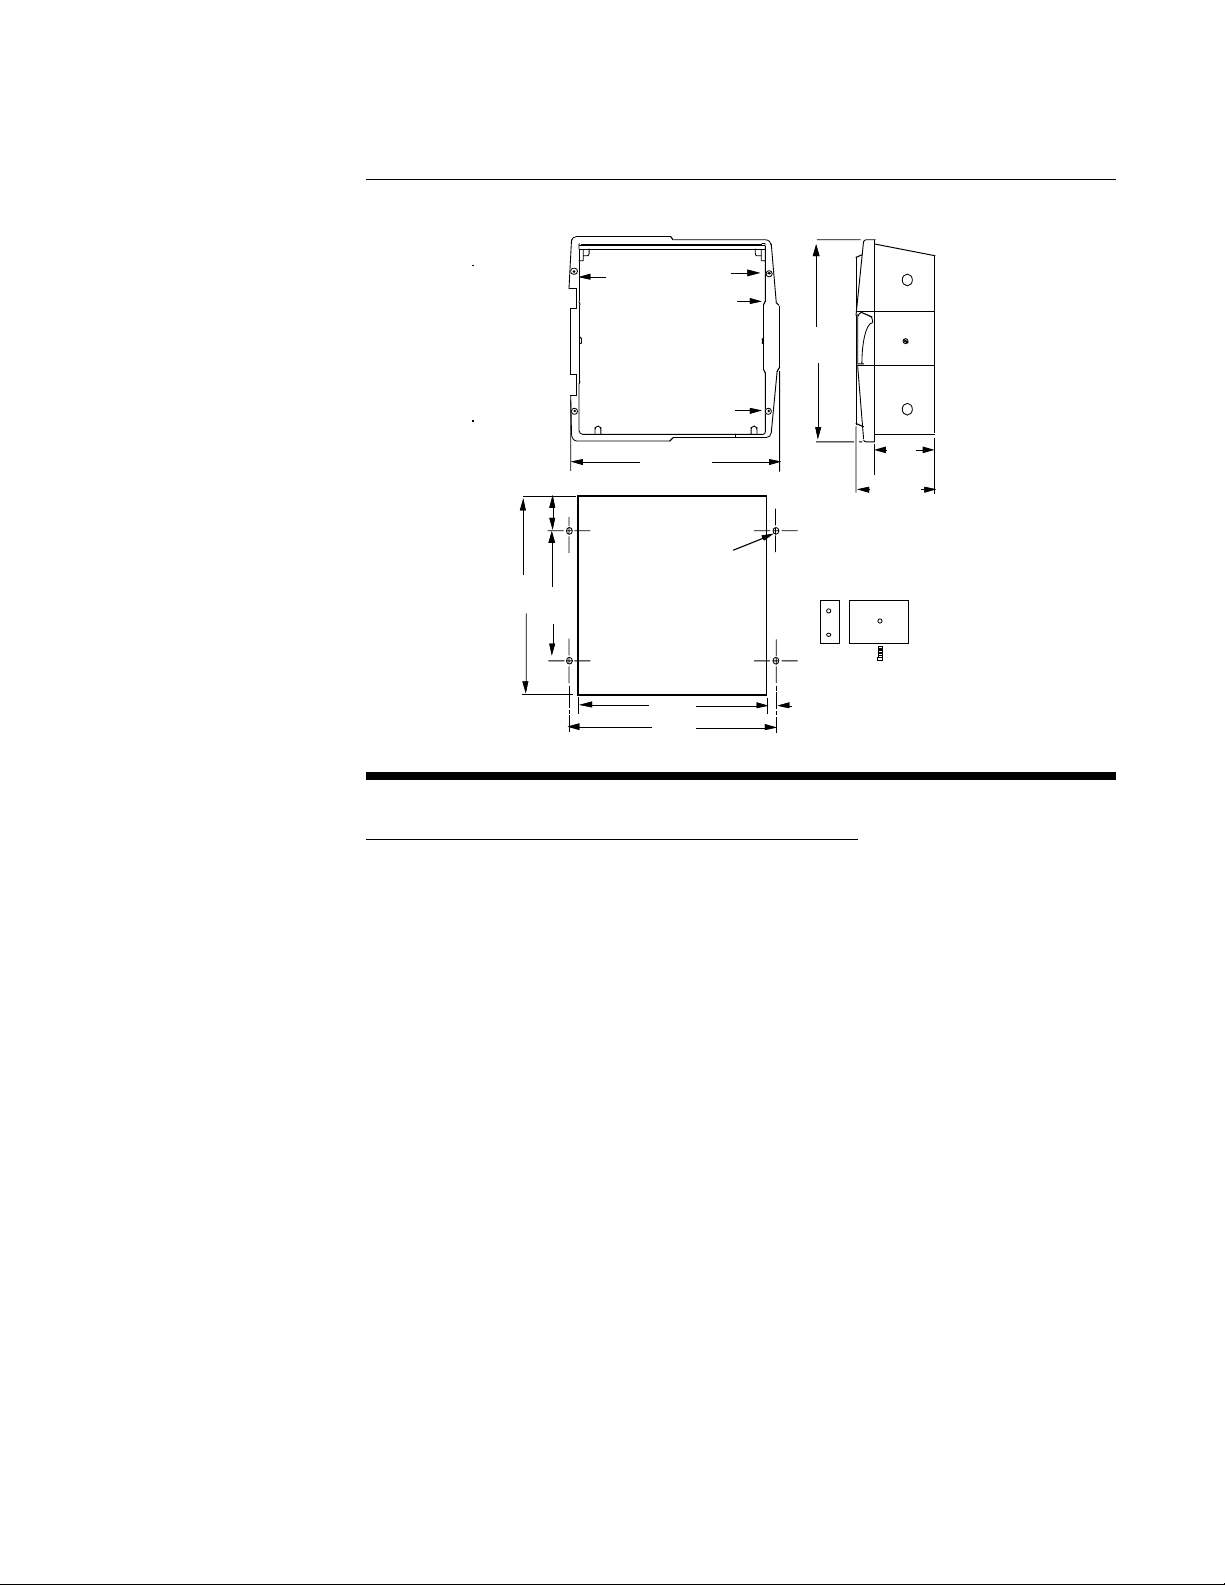
FIGURE 2-1
EC1
15 1/8
WIDTH OF COVER
2 19/32
(65.9mm)
12 5/8
7 1/2
(320.7
mm)
(190.5
mm)
Preparation for Wiring 2.5
(384.2
mm).
9/32
13 1/2
(342.5 mm )
13 15/16
(354 mm)
EC3
EC4
EC2
DIA.(7.1mm)
(64 mm)
13 3/16
(335 mm)
7/32
(5.5 mm)
Mounting
Bracket
3 3/4
(92.3 mm)
4 11/16
(119.1 mm)
(2)
2.5.1 WIRING GUIDELINES
Electrical noise is a phenomenon of the typical industrial environment. The following are
guidelines that must be followed to minimize the effect of noise upon any instrumentation.
2.5.1.1 INSTALLATION
Listed below are some of the common sources of electrical noise in the industrial environment:
* Ignition Transformers
* Arc Welders
* Mechanical contact relays
* Solenoids
* Motors
Before using any instrument with devices listed previously, the instructions below should be
followed:
1. If the unit is to be mounted in the same panel as any of the listed devices, separate them
by the largest distance possible. For maximum electrical noise reduction, the noise
generating devices should be mounted in a separate enclosure.
2. If possible, eliminate mechanical contact relays and replace them with solid state relays. If
a mechanical relay being powered by the unit's output device cannot be replaced, you may
wish to use a solid state relay to isolate the instrument from this source of noise.
3. A separate isolation transformer which feeds only instrumentation should be considered. If
available, it can isolate many noise sources from the AC power input of the unit.
4. If the unit is being installed in an existing installation, a review of the wiring in the existing
area should be done.
Page 9

2.5.1.2 AC POWER WIRING
5
4
2
Earth Ground
Each unit includes noise suppression components attached to the chassis that require an
earth ground connection. To verify that it is earth ground being attached, make a resistance
check from instrument chassis to the nearest metal water pipe or proven earth ground. This
reading should not exceed 100 ohms.
Neutral (For 115 VAC)
It is good practice to assure that the AC neutral is at or near ground potential. To verify this, a
voltmeter check between neutral and ground should be done. On the AC range, the reading
should not be more than 50 millivolts. If it is greater than this amount, the secondary of this
AC transformer supplying the instrument should be checked by an electrician. A proper
neutral will help ensure maximum performance from the instrument.
2.5.1.3 WIRE ISOLATION
The instrument is designed to promote proper separation of the wiring groups that connect to
the instrument. The AC power wire terminals are located near the top of the instrument
boards. The analog signal terminals are located near the bottom of the intrument boards.
Maintain this separation of the wires to insure the best protection from electrical noise. If the
wires need to be run parallel with any of the other lines, maintain a minimum 6 inch space
between the wires. If wires must cross each other, do so at 90 degrees. This will minimize the
contact with each other and reduces "cross talk". "Cross talk" is due to the EMF (Electro
Magnetic Flux) emitted by a wire as current passes through it. This EMF can be picked up by
other wires running in the same bundle or conduit.
PAGE 9
2.5.1.4 USE OF SHIELDED CABLE
Shielded cable helps eliminate pickup of noise the wires may be exposed to. Shielded cable
is a single or multi-pair of insulated wires with each wire or pair of wires surrounded by a wire
mesh or conductive foil and then covered with plastic insulation.
It is recommended that all analog signals be run with shielded cable. Connection lead length
should be kept as short as possible, thus keeping wires protected by the shielding. The shield
should be grounded at one end only, at the transmitter or transducer and the shield should be
stripped back before going inside the unit case .
Wiring Connections 2.6
All wiring connections are typically made to the unit with it installed. Connections should be
made at the terminal blocks, two 12 gauge wires maximum, using copper conductors only.
Terminal blocks are designated TB1 thru TB13. See Figure 2-2 for the terminal block
locations.
FIGURE 2-2
Processor Board
12
TB1
1 2 3 4 1 2 3 4 1 2 3
TB6 TB7 TB8
RELAY/SSR Driver
Board
TB9
1 2 3 4
Current Output Board
TB 2
1 2
TB3 TB4
1 2 1 2 3 4 5 1 2 3 4
TB5
TB10 TB11 TB12 TB13
1 2
1 2 1 2 1
Page 10

PAGE 10
2.6.1 ELECTRICAL CONDUIT OPENINGS
The instrument case will have 3 or 4 conduit openings, depending upon the number of outputs
specified. To help minimize electrical noise that may adversely affect the operation of the
instrument, the wires indicated below should be routed through the conduit opening specified.
See Figure 2-1 (page 8) for conduit opening locations.
EC1 - AC power
EC2 - Analog input and mAdc outputs
EC3 - SPST, SPDT relay or SSR driver outputs
EC4 - SPST, SPDT relay or SSR driver outputs
(provided when > 4 relays & SSR's are specified)
Unused conduit openings should be sealed if exposed to the environment.
2.6.2 AC POWER WIRING CONNECTIONS
WARNING: To avoid electrical shock AC power wiring must not be
connected at the source distribution panel until all wiring connections are completed.
FIGURE 2-3
AC Instrument Power Input
Connect the 115 VAC hot and neutral to terminals 1 and 2 respectively of TB1. See Figure 22 (page 9) for Terminal Board locations on the instrument. Connect the 230 VAC one leg to
each terminal, be sure to check the position of the Voltage Selector switch provided with 230
VAC instruments. The switch position must match the voltage input to the instrument.
Connect the AC
ground at the
green ground screw
on the left side of
the inside of the
case
Line 1
TB1
1
Line 2
2
Page 11
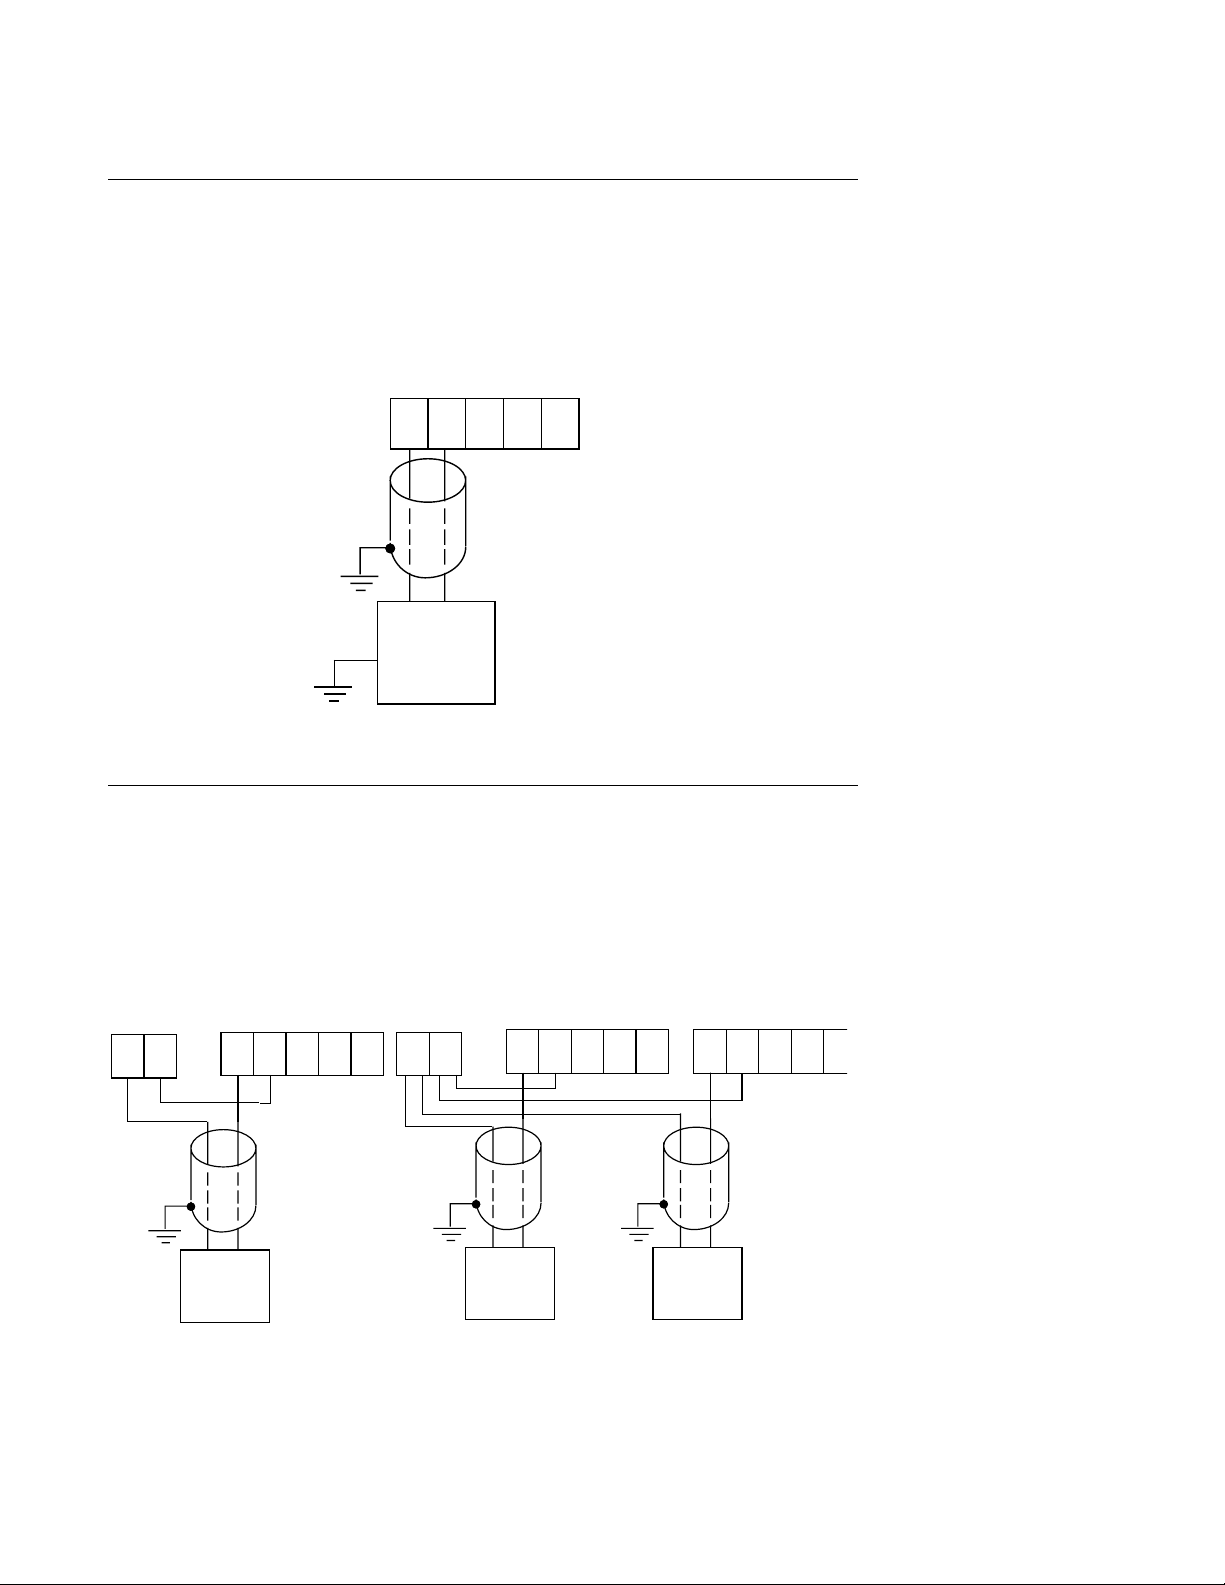
FIGURE 2-4
-
-
-
-
-
-
Volt, Millivolt and milliamp Input
Make the volt, millivolt or milliamp conections as shown below. Use TB4 for Pen 1 and TB5
for Pen 2. Terminal 1 is positive and terminal 2 is negative. Be sure that input conditioning
jumpers are in the correct positions for the input being connected. See Appendix A-1 (page
46).
TB4 or TB5
PAGE 11
+
-
2345
1
SHIELDED
NOTE: Fault Detection
Not Functional for 0-5V
Input.
TWISTED
PAIR
MAY BE
+
SOURCE
GROUNDED
OR
UNGROUNDED
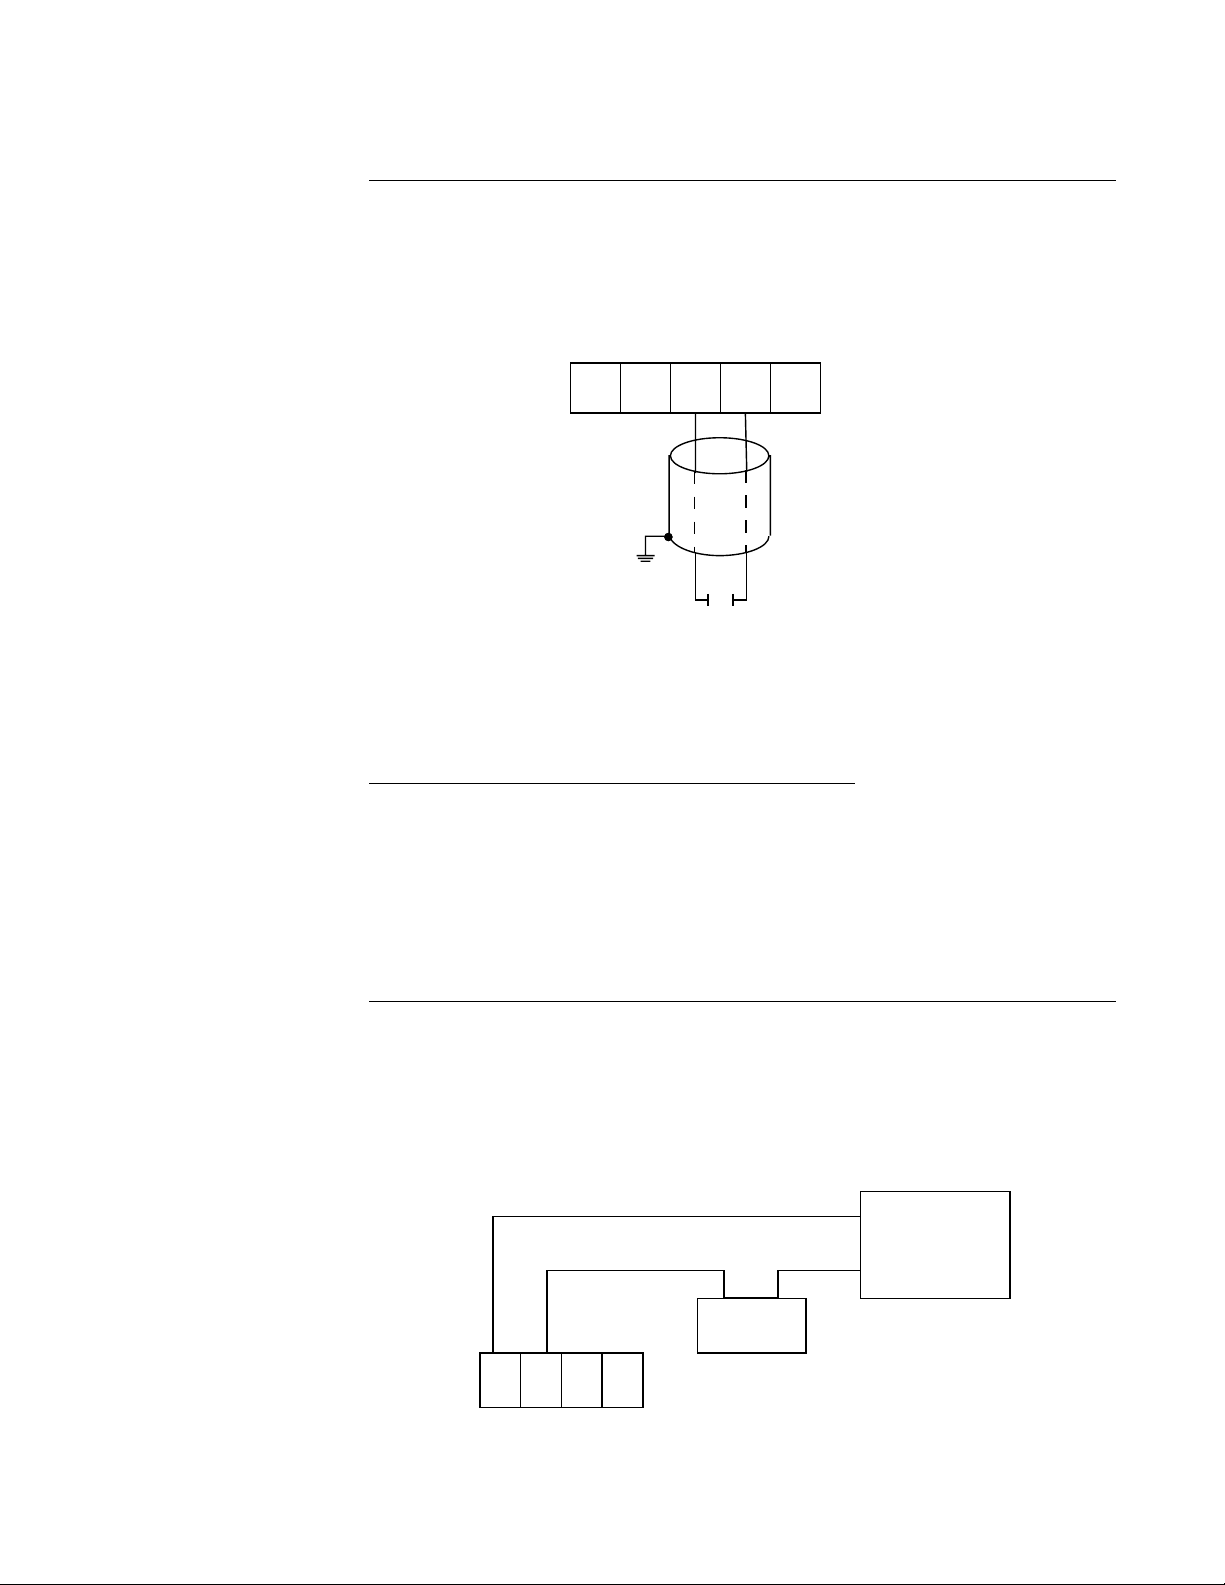
FIGURE 2-5
Transmitter Power Supply
If the isolated 24 VDC regulated transmitter power supply has been specified, the connections
should be made as shown. Connections are made using TB3, terminal 1 is positive and
terminal 2 is negative. The power supply is capable of providing the power needed by up to 2
transmitters.
TB3
TB4 or TB5
TB3
TB4
TB5
+
12
+
-
12345
SHIELDED
TWISTED
PAIRS
+
12
+
TWO WIRE
TRANSMITTERS
TWO WIRE
TRANSMITTERS
+
-
12345
+
TWO WIRE
TRANSMITTERS
+
-
12345
+
Page 12
PAGE 12
5
FIGURE 2-6
Remote Reset Input
Make connections as shown. Use TB4 for Pen 1 and TB5 for Pen 2. Terminal 3 is ground
and terminal 4 is the input.
TB4 or TB5
+
-
1 2 3 4
SHIELDED
TWISTED
PAIR
REMOTE
DRY
CONTACT
2.6.3 OUTPUT CONNECTIONS
Relay outputs, if provided in the instrument, may be assigned to alarm, preset, or pulsed
output functions for Pen 1 and/or Pen 2 (if present). Current outputs may be assigned to
process value retransmission output for Pen 1 and/or Pen 2 (if present). The assignment of
the output function is accomplished in the Program mode, see Section 4.5.3 (page 22).
SPST relay and/or SSR driver output(s) is/are designated as Relay A through Relay H. SPST
relays begin with Relay A designation, then B, C, etc. SSR drivers begin with Relay H
designation, then G, F, etc.
FIGURE 2-7A
Relay Output (SPST)
Connections are made to relays A through F as shown. Terminal connections are made
using TB6 (Relay/SSR Driver A, B), TB7 (Relay/SSR Driver C,D), and TB8 (Relay/SSR Driver
E, F).
HOT
NEU
POWER
LOAD
5 AMPERES
1234
MAXIMUM
AT 115 VAC
TB6 OR TB7 OR TB8
Page 13
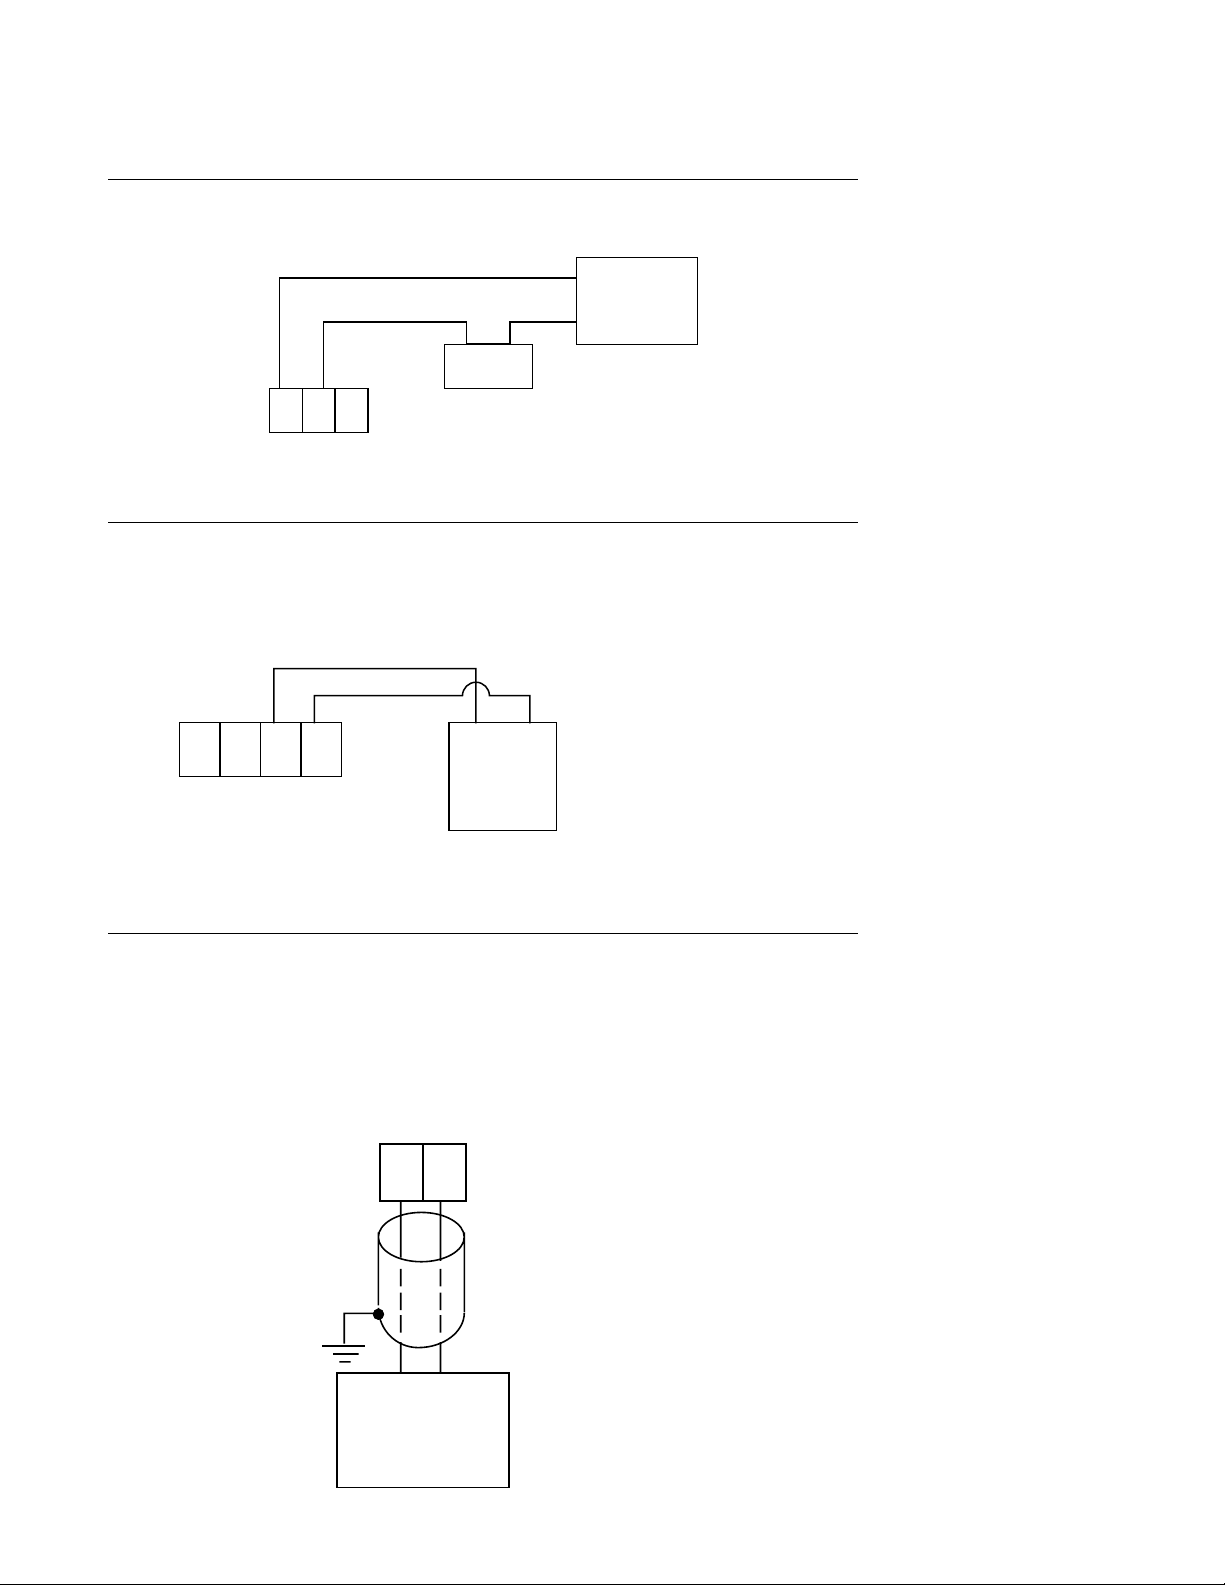
FIGURE 2-7B
7
-
-
Relay Output (SPDT)
HOT
NEU
PAGE 13
POWER
LOAD
N.O C
TB6 OR TB
FIGURE 2-8
SSR Driver Output
Connections are made to relays H through A as shown. Terminal connections are made
using TB9, TB8, etc. depending on the number of SSR Driver outputs specified.
1 234
N.C
123
+
SSR
5 AMPERES
MAXIMUM
AT 115 VAC
SOLID STATE RELAY
TB6 THRU TB9
FIGURE 2-9
Current Output
Connections are made to standard current outputs A through D as shown. Each current
output is programmable as either 4 to 20mADC or 0 to 20mADC. Each output must be
assigned to the desired function (refer to Table 4-2, page 26, for details). Terminal connections are made using TB10 through TB13 for current output A through D respectively. Connect positive lead (+) to terminal 1 and the negative lead (-) to terminal 2. Current outputs will
operate up to 650 ohms maximum load.
+
-
1 2
SHIELDED
TWISTED
PAIR
+
LOAD
650 OHMS
MAXIMUM
Page 14

PAGE 14
How The Instrument Operates 3.1
3.1.1 OFF MODE
In the Off mode, the instrument alarm and preset function(s) is/are turned off, pulsed output(s)
are inactive and process retransmission signal(s) remain(s) active. The chart rotation can be
selected in the Program mode to stop or continue to rotate when the instrument is in the Off
mode. The pen remains active. The totalization function is inactive, but datalogging functions
continue.
The Off mode is entered by pressing and releasing the SCROLL key until the display reads
oFF, then pressing the DOWN key. If the instrument was displaying process value, the
display will read oFF, then the current process variable at two second intervals. If the
instrument was displaying total, the display will read oFF, then the total at two second
intervals. Entering the Off mode of a dual pen instrument will cause both pens to enter the Off
mode. The second pen display will be blank as the upper display reads oFF and displays the
value for the second pen at the same time as the upper display.
To exit the Off mode, depress the SCROLL key to proceed to any other mode, pressing the
DOWN key to enter that mode.
3.1.2 OPERATE MODE
In the Operate mode, the instrument alarm function(s), the preset function(s), the pulsed
output(s) and the process retransmission signal(s) are actively responding to the process
variable as selected in the Program, Alarm Set and Preset modes and the chart will be
rotating at the rate selected. The totalization function is active, as is the datalogging function.
3.1.2.1 TOTALIZATION
Totalization can be implemented on instruments provided with the totalization feature.
Totalization can be programmed on or off for each pen.
To initiate totalization, depress the SCROLL key until oPEr is displayed, then depress the
DOWN key.
To view the total, depress the DISPLAY SELECT key once with the PV value displayed. The
TOT light should be lit and the total for Pen 1 in the upper display and the total for Pen 2 in the
lower display.
Instruments with Totalization and second display will have the total displayed in the lower
display whenever the upper display is set to PV.
On two pen units only, a Combined Total is available. When activated in the Program mode
an additional step is added to the display choice sequence provided by the Display Select
Key.
If the totals are displayed and the DISPLAY SELECT key is depressed, the Combined Flow
Rate will appear in the top display with a C in the leftmost digit and the Combined Total will
appear in the bottom display. The PV and TOT indicators will be lit, respectively.
Note: When Combined Total is being used, it is required that the decimal position,
dPoS, and totalizer decimal position, tdP, in the Program mode, for both pens are the
same. When the totalizer for Pen 1 is reset, the combined total is also reset.
Upon sensor break, the Combined Total will increment at a indeterminate rate.
Page 15

3.1.2.2 PULSED OUTPUTS
Pulsed output(s), one for each pen, can be implemented on instruments provided with the
totalization feature and a relay that is not assigned to any other function.
Pulsed output is selected in the Program mode. With a pulsed output select (PoS) equal to 1,
each time the Totalizer Display is incremented, the relay that is assigned, in the Program
mode, as a pulsed output will close for a duration of 50 milliseconds or 60 milliseconds based
on a 60 Hz or 50 Hz line frequency, respectively.
On two pen instruments, a Combined Pulse Output is available. This feature provides a
pulsed output as the Combined Total increases.
Note: Upon sensor break, the Combined Pulse Output will increment at a indeterminate rate.
3.1.2.3 PROCESS VALUE RETRANSMISSION
Process value retransmission can be implemented on instruments provided with at least one 4
to 20mA output.
Process value retransmission is selected in the Program mode. When selected, a current
output must be assigned and the process output must be scaled.
On two pen instruments, a Combined Flow Rate is available. When selected in the Program
mode, this feature provides a process value retransmission value equal to the combined flow
rate. The value is scaled using Pen 1 process output upper and lower parameters.
PAGE 15
3.1.2.4 DATA LOGGING
Data logging can be implemented on instruments provided with the data logging feature, and
it will store data for up to 28 days.
Each day, at the time specified by ttLd (time to log data), the following data will be logged:
date, minimum rate, its time, maximum rate, its time, daily total, and average rate. The daily
total is derived by substracting "yesterday's total" from the current total. The average rate is
derived from the daily total, taking into account the flow time base. After the data is logged,
"yesterday's total" will be set to the current total, and the minimum and maximum rates and
times are set to the current rate and time.
Logged data is accessed via a day number, with 1 through 7 corresponding to the current
week. At the beginning of each week (00:01 on day 1 - each Monday) the data is shifted
down one week, with the oldest weeks worth of data being discarded. All data for the current
week is zeroed, including the date for each day.
3.1.2.5 ENGINEERING UNITS PROCESSING ALGORITHM
In the Program mode, the parameter EuPA, Engineering Units Processing Algorithm specifies
how the engineering unit inputs are handled. This allows selection of the various algorithms
to convert the raw input in to the desired process value.
LINEAR CONVERSION - EuPA = 0
For those sensors/transmitters that provide an output directly proportional to flow, or other
applications where the instrument may be used with a linear input to output transformation.
SQUARE ROOT EXTRACTION - EuPA = 1
The square root extraction function applies to rate of flow measurments using differential
pressure sensors. Differential pressure transmitters typically generate a 4-20mADC signal
that represents differential pressure, not flow. The flow is a function of the square root of the
differential pressure.
2 STAGE SQUARE ROOT EXTRACTION - EuPA = 2
This approach is used to minimize the process value below a 4% input, since it is less
meaningful due to inaccuracy and repeatability problems. Below 4% a linear function is
applied.
(Continued on next page)
Page 16

PAGE 16
3 STAGE SQUARE ROOT EXTRACTION - EuPA = 3
This approach is used to further minimize the process value below a 1% input, since it is even
less meaningful. Below 1% a low gain linear function is applied. Between 1% and 2.5% a
higher gain linear function is applied. Above 2.5% the square root function applies, as the
sensor begins to provide a reasonably accurate and repeatable output. Refer to the glossary
(page 53).
VARIABLE EXPONENT - EuPA = 4
Open channel flow is used in wastewater and other applications. For rectangular weirs, the
flow is proportional to the height/head to the 3/2 power. For triangular (or V notch) weirs, the
flow is proportional to the height/head to the 5/2 power. For Parshall flumes, the flow is
proportional to the height/head to approximately the 3/2 power. See Table 3-1. When
variable exponent is selected in the Program mode, Engineering Units Exponent, EuE, must
be set for the correct exponent value.
TABLE 3-1
The exponent for a number of common Parshall flumes are as follows:
1 - inch = 1.55
2 - inch = 1.55
3 - inch = 1.547
6 - inch = 1.58
9 - inch = 1.53
1 to 8 ft = 1.522w raised to the .023 power
10 to 50 ft = 1.6
w = throat width in feet
PIECEWISE LINEAR - EuPA = 5
For some applications, the relationship between the input and process value cannot be
specified by one of the available algorithms. For these instances, the relationship can be
approximated by a straight line relationship over portions of the span. Provided enough
pieces, this method will provide the required accuracy. When piecewise linear is selected, the
second set of Engineering Units parameters, Euu2 and EuL2 must be used to specify the
span of the input, and then iu1, iu2....iu20 and Pu1, Pu2.....Pu20 are the input and process
values for the respective points, in engineering units.
VARIABLE EXPONENT WITH CORRECTION - EuPA = 6
For some applications, the relationship between the input and process value can be basically
characterized as exponential, but not to within the accuracy desired. Use of the Piecewise
Linear algorithm may require a large number of points to provide the desired accuracy. By
using the piecewise linear method to provide a correction to the simple exponential, a high
degree of accuracy can be achieved. This is especially applicable to open channel flow using
Palmer-Bowlus flumes or H flumes. Consult factory for assitance, if needed, when using
variable exponent with correction.
SATURATED STEAM FLOW WITH PRESSURE CORRECTION - EuPA = 7
Only available with a 2 Pen unit. For saturated steam flow, accurate flow measurement is
dependent on pressure correction. By using the second pen to input and record pressure, the
pressure data is available to correct the flow value. The input is typically gauge pressure,
which is converted to absolute pressure by the instrument. Since the pressure may be in the
60 PSIG range, barometric pressure or elevation can induce an error. Therefore, the barometric pressure, bAro, needs to be set in the Alarm Set mode. If the input is absolute
pressure, bAro must be set ot zero.
Page 17

3.1.2.6. TOTALIZER FACTOR
Scaling of the displayed total is possible, with the use of totalizer factor, tFAC. When used,
the displayed value is multiplied by a factor to obtain the actual total. See Table 3-2.
TABLE 3-2
tFAC = 0 Actual Total = Displayed Total Times 1
tFAC = -1 Actual Total = Displayed Total Times 10
tFAC = -2 Actual Total = Displayed Total Times 100
tFAC = -3 Actual Total = Displayed Total Times 1000
tFAC = -4 Actual Total = Displayed Total Times 10000
tFAC = 1 Actual Total = Displayed Total Times 0.1
tFAC = 2 Actual Total = Displayed Total Times 0.01
tFAC = 3 Actual Total = Displayed Total Times 0.001
Example
An application is measuring flow at a maximum rate of 6000 gallons per minute (6000 gpm).
The steady flow rate is 2000 gallons per minute (2000 pgm). Table 3-3 shows how, with
various settings in the Program mode, the process variable displayed and the total displayed
can be configured.
PAGE 17
TABLE 3-3
6000 gpm, flow rate 2000 gpm
dPoS Euu EuL PV tdP tFAC Ftb Total displayed at t = 1 min
0 6000 0 2000 0 0 2 XXXX2000
0 6000 0 2000 0 -1 2 XXXXX200
0 6000 0 2000 0 -3 2 XXXXXXX2
6000 gpm, flow rate 2000 pgm, PV in gps
dPoS Euu EuL PV tdP tFAC Ftb Total displayed at t = 1 min
0 100 0 33 0 0 1 XXXX1980
0 100 0 33 0 -1 1 XXXXX198
0 100 0 33 0 -3 1 XXXXXXX1
6000 gpm, flow rate 2000 gpm, PV in gpm
dPoS Euu EuL PV tdP tFAC Ftb Total displayed at t = 1 min
0 6000 0 2000 1 0 2 XXX2000.0
0 6000 0 2000 1 -3 2 XXXXXX2.0
6000 gpm, flow rate 2000 gpm, PV in gps
dPoS Euu EuL PV tdP tFAC Ftb Total displayed at t = 1 min
0 100 0 33 1 1 1 XXX1980.0
0 100 0 33 1 -3 1 XXXXXX1.9
6000 gpm, flow rate 2000 gpm, PV in mgd
dPoS Euu EuL PV tdP tFAC Ftb Total displayed at t = 1 min
3 8.640 0.000 0.002 0 0 4 XXXXXXX0
3 8.640 0.000 0.002 0 3 4 XXXXXXX2
3 8.640 0.000 0.002 2 3 4 XXXXX2.00
Page 18

PAGE 18
Configuration Introduction 4.1
After completing installation of the unit, the configuration procedures contained within this
section must be performed to prepare the unit for operation on the intended application. The
procedures include selecting specific parameters, entering data and possible jumper positioning.
Parameter selections and data entry are made via the front keypad. To ease configuration
and operation, user entered data has been divided up into several modes. Each mode
contains a different type of data or may be used for specific operating functions. For two pen
instruments, each mode is common to both pens. These modes are as follows:
Mode Display Code Function Description
Off oFF Operation Alarm Outputs off, Totalization off
Operation oPEr Operation Operation
Program Prog Configuration Configure operating parameters
Alarm Set ASEt Configuration Set alarm settings
Data logger dLS Configuration Adjust/set real time and log time
Setup
Data logger dLd Operation View logged data
Display
Preset PSA Operation Adjusts, sets preset values
Adjust
Test tESt Service Perform unit tests
Calibration CAL Service Perform unit calibration
Enable Enab Configuration Lockout or enable access to any
mode
Associated with each mode is a series of unique displays which are accessed via the front
keypad.
Prior to first time operation of the unit, the configuration procedures for the Program, Preset
Adjust, Data logger Setup, and Alarm Set modes must be performed as applicable.
Calibration and Test modes are not used as part of the unit configuration or operation. These
are used for service and maintenance functions and are discussed in detail in Section 5.6 of
this manual (page 40).
Page 19

Shipped Configuration/Jumper
Positioning 4.2
Each instrument is factory shipped ready to accept a 4-20 mA process input on each specified pen. All configuration parameters in each mode are set to default values. These defaults
are shown in tabular form under the description for each mode. Instrument AC power input is
as specified in the instrument model number and as shown on the ratings label. The 230VAC
option includes a switch for changing between 230VAC and 115VAC. If this feature is
provided, verify AC input and switch position before applying power to the instrument.
4.2.1 JUMPER POSITIONING
Jumpers are used in all units to provide a security lockout feature and to condition the process
input for each pen. All jumpers are typically of the three pin type and have two functions. All
jumpers are located on the instrument's Processor board. A board layout and jumper locations are shown in Appendix A-1 (page 46). Check the actual jumper position in the unit to be
configured and verify the proper position for the intended application. If the current position is
not correct, make changes.
The process input jumpers JU4 and JU5 condition the hardware at a basic level.
Detailed input type selection is made in the Program mode configuration (page 26).
PAGE 19
Operation Summary 4.3
The configuration and operating modes, the method of moving from one mode to another, and
the basic parameter functions are described in each individual section . Data and parameter
entry is made by stepping through each mode and making an appropriate response or entry to
each step.
4.3.1 KEYPAD OPERATION
Refer to Figure 4-1 for the Keypad features. Use the SCROLL, UP and DOWN keys as
indicated to program and operate the intrument.
4.3.1.1 UP/DOWN CHANGE RATE
The Up and Down keys are used to adjust numerical values up or down respectively. The
rate at which a given value will change is dependent upon the length of time the key is kept
depressed, initially slow then increasingly faster.
FIGURE 4-1
SCROLL
Key
DISPLAY
SELECT
Key
UP
Key
DISP
SEL
DOWN
Key
Page 20

PAGE 20
4.3.2 CONFIGURATION DISPLAYS
Each pen specified is provided with its own 4 digit LED display (8 digits for totalization option).
These are used during configuration to display the parameter codes and values. The display
located in the upper right hand corner of the instrument is used to show the codes for Pen 1
and those that are common between Pens 1 and 2. The display in the lower right hand
corner is used to show the configuration codes for Pen 2 (if provided).
During normal operation, the display(s) are used to indicate process value(s) as selected in
the Program mode.
4.3.3 MODE SELECTION
If the instrument is either in the Off mode or the Operation mode, repeated pressing and
releasing of the SCROLL key will cause the instrument to display the code corresponding to
each mode that is enabled. To enter a mode, while the code is displayed, press the DOWN
key.
Entry into any mode, except the Operation and Enable modes, will cause the alarm(s) to turn
off and any process re-transmission value output(s) to be 0%.
Start Up Procedure 4.4
All configuration parameters are listed in Tables 4-1 through 4-3 (pages 25-30)
For a single pen instrument, parameters for each mode are displayed in the upper right
display. If the instrument being configured is a two pen, a sequence of applicable parameters
will be displayed in the Pen 2 display after Pen 1 parameters have been reviewed and
configured. After the Pen 2 parameters have been completed, parameters common to both
pens will be configured and displayed in the Pen 1 display.
The instrument is provided with a time out feature. If the instrument is in any mode and no
keypad activity takes place for 30 seconds, the instrument will time out and exit the mode
automatically. The display will be the code for the respective mode. If a mode code is
displayed for 5 seconds with no keypad activity, then the time out will cause the instrument to
proceed to either the Operation or Off mode, depending upon which operational state was in
use before entrance into the mode.
4.4.1 POWER UP PROCEDURE
Step 1
Verify that all electrical connections have been properly made before applying power to the
unit.
Step 2A - For instruments with software revision R2.99 and below
Upon power up, 7XXX will be displayed (X representing digits), then XXXX, then XXXX,
identifying the twelve digit model number as defined in the order matrix. Next, the EPROM
part number will be indicated P-XX. After the EPROM part number, the software revision level
will be displayed in the format rX.XX then tSt1, tSt2, and tSt3 will be displayed while Test 1
through 3 are executed automatically. Upon successful completion of these test, oPEr or oFF
will be displayed for about 3 seconds. The mode displayed will be the mode the instrument
was in when the power was turned off. During this time, the operator may select another
mode (Alarm Set, Enable) or non-operational mode (Test, Program, Cal).
Page 21

Step 2B - For instruments with software revision r3.00 and above
Upon power up, a brief flash on all displays (upper and, if equipped, lower) will occur to show
the instrument is "alive". Then 7XXX will be displayed (X representing digits) then XXXX, then
XXXX, identifying the twelve digit model number as defined in the order matrix. Next, the
EPROM part number will be indicated P-XX. After the EPROM part number, the software
revision level will be displayed in the format rX.XX followed by P.dn (if Pen Action on Power
Up, PAPU, in Program Mode is set to 0, pens go to "home" position at power up). During this
display, the decimal point after the "P" will blink to show the mode is active. Upon successful
completion of this routine, oPEr or oFF will be displayed for about 3 seconds. The mode
displayed will be mode that the instrument was in when the power was turned off. During this
time the operator may select another mode (Alarm Set, Enable) or non-operational mode
(Test, Program, Cal).
Step 3
If any error messages are displayed, refer to Section 5.6 (page 40) for a definition of these
error messages and the required action.
Configuration 4.5
4.5.1 DIGITAL DISPLAY AND STATUS LED's
The digital display provided for each pen has 4 digits (8 digits for totalization option) and a
decimal point. Each digit has seven segments and is capable of producing numeric
characters from 0-9 and certain alpha characters. The digital display is used to provide
indication of process variable as well as displaying codes used for configuration and operation
of the instrument. The following status indicators are also provided:
PAGE 21
ALRM1 Red Lights when Alarm 1 is on
ALRM2 Red Lights when Alarm 2 is on
PV Red Lights to indicate that the Process Value is being
displayed
TOT Red Lights to indictae that the Total is being displayed
Refer to Figure 1-2 (page 6) for the display features.
4.5.2 KEYPAD CONTROLS
The keys provided on the keypad and their functions include:
SCROLL: Used to: 1. Advance the display through the enabled modes.
2. While in a mode, used to sequence the parameter
codes and values
3. Exit some Test and Calibration functions.
4. Work in conjuction with other keys.
UP: Used to: 1. Exit a mode.
2. Turn a mode On in the Enable mode.
3. Increase a numerical value.
4. Work in conjuction with other keys.
DOWN: Used to: 1. Enter a mode.
2. Turn a mode Off in the Enable mode.
3. Decrease a numerical value.
4. Work in conjuction with other keys.
Page 22

PAGE 22
DISPLAY SELECT: Used to: 1. For units specified with totalization, to change the
value displayed between Process Value (PV)
Total (TOT), Combined Flow/Total, and Alternate
Process Value.
2. For units not specified with totalization, this key has no
function.
3. DISP/SEL and UP will reset 1st pen total.
DISP/SEL and DOWN will reset 2nd pen total.
They must be kept depressed for 5 seconds.
Lamp test
All display and status LED's can be illuminated simultaneously by depressing the UP and
DOWN keys at the same time. Any defective LED's will not light.
*CHANGE CHART (also see Changing Charts, Section 5.2)
If the UP and DOWN keys are held depressed for more than 2 seconds but less than 4
seconds, the display will show Cchg momentarily. The pen(s) will move to and remain at a
point above the top graduation on the chart and the chart will stop rotation to allow the chart to
be changed. The pens will remain fully upscale with the chart OFF; otherwise, the unit will
continue to operate normally in the current mode. To restore pen(s) position and chart
rotation, press the UP and DOWN keys for more than 2 seconds but less than 4 seconds.
PEN RESYNCHRONIZATION
To resynchronize the pen(s), depress the UP and DOWN keys for 4 seconds, the display will
show P dn momentarily, the pen(s) are driven to the "Pen Home" position below the bottom
graduation on the chart while the unit resynchronizes their position. After about 14 seconds,
the pen(s) will return to their correct position. All other functions of the unit's present mode
continue to operate normally.
4.5.2.1 ENTERING THE ENABLE MODE
The Enable mode is entered by pressing and holding the UP and DOWN keys simultaneously
while in the Operate or Off modes. Holding the two keys depressed for 10 seconds will cause
the display to show the EnAb prompt which is the entry point into the Enable mode.
A hardware jumper located on the Processor Board (Appendix A-1, page 46) can be used to
lock/unlock the Enable mode. When the jumper is moved to the locked position, entry into the
Enable mode is not possible until the jumper is moved to the unlock position.
4.5.3 PROGRAM MODE CONFIGURATION PROCEDURE
The Program mode provides a means to configure or reconfigure the unit operation within the
limits of the hardware specified and provided. Only those parameters that are applicable, as
determined by the hardware provided, will appear.
Review the entry procedure in 4.4.1 and the configuration procedures in Table 4-2 (page 26).
Use the "Your Setting" column in the table to record your programming.
4.5.3.1 ENTERING THE PROGRAM MODE
From the Operate or Off mode, or with any other mode code displayed, depress the SCROLL
key until Prog is displayed. This is the mode code for the Program mode. With Prog in the
top display depress the DOWN key to enter the Program mode. If the Prog code does not
appear, then the mode has been disabled. Refer to Table 4-1 (page 25) for Enable mode
instructions.
Upon entering the Program mode, PEn1 wil be displayed. The Program mode is broken into
three parts. The parameters that are associated solely with Pen 1 will be displayed in the
upper display. The parameters associated with Pen 2, will be displayed in the lower display.
The parameters that are common to both pens, such as chart rotation speed, will be displayed
in the upper display. Access to the Pen 1, Pen 2, or Unit (common) parameters may be
quickly obtained by depressing the SCROLL key, if necessary, until the desired code, PEn1,
PEn2, or unit is displayed and then depressing the DOWN key. Once into the parameters,
the three parts automatically follow one another.
Page 23

4.5.3.2 MOVEMENT IN THE PROGRAM MODE
Each time the DOWN key is depressed while a parameter code is being displayed, such as
inPS, another parameter code will be displayed.
Depressing the SCROLL key while a parameter code is displayed will cause the parameter
value to appear. Depressing the SCROLL key with a parameter value displayed will cause
the next parameter code to appear.
Depressing the UP key while a parameter code is being displayed will exit the Program mode
and Prog will appear in the display. Use the DOWN key to re-enter the mode, or the
SCROLL key to proceed to another mode.
4.5.3.3 ONE PEN INSTRUMENTS
For instruments specified and provided with only one pen, all configuration and operating
parameters and values will appear in the upper display, which is dedicated to Pen 1 and Unit
parameters. This is the only display provided. PEn2 will not appear.
4.5.3.4 TWO PEN INSTRUMENTS
Instruments specified and provided with two pens require configuration of each pen.
4.5.3.5 PROGRAM MODE CONFIGURATION
Refer to Table 4-2 (page 26) for configuration procedures for the Program mode. All possible
parameters are shown for illustration purposes. Only those parameters applicable to each
respective pen and the unit will actually be shown.
PAGE 23
4.5.4 ALARM SET MODE CONFIGURATION PROCEDURE
The Alarm Set mode allows the entry, review or altering of any of the alarm settings. Parameters to be configured will be only those that are applicable as determined by the hardware
provided or as assigned in the Program mode.
Review the entry procedure and the configuration procedures in Table 4-3 (page 30). Use
the "Your Setting" column in the table to record your programming.
4.5.4.1 ENTERING THE ALARM SET MODE
From the Operation or any other mode code, depress the SCROLL key until ASEt is displayed. With ASEt in the top display depress the DOWN key to enter the mode. If ASEt
does not appear, then the mode has been disabled. Refer to Table 4-1 (page 25) for Enable
mode instructions.
4.5.4.2 MOVEMENT IN THE ALARM SET MODE
Each time the DOWN key is depressed while a parameter code is being displayed another
parameter code will be displayed.
Depressing the SCROLL key while a parameter code is displayed will cause the parameter
value to appear. Depressing the SCROLL key with a parameter value displayed will cause
the next parameter code to come up in the display.
Depressing the UP key while a parameter code is being displayed will exit the Alarm Set
mode and ASEt will appear in the display. Using the SCROLL key at this point will allow you
to proceed to any other mode.
4.5.4.3 ALARM SET MODE CONFIGURATION
Refer to Table 4-3 (page 30) for configuration procedures for the Alarm Set mode. All
possible parameters are shown for illustration purposes. Only those parameters applicable to
each respective pen will actually be shown.
Page 24

PAGE 24
4.5.5 DATA LOGGER SETUP MODE CONFIGURATION PROCEDURE
The Data logger setup mode allows the entry, review, or altering of the datalog settings.
4.5.5.1 ENTERING THE DATA LOGGER SETUP MODE
From the Operation or any other mode code, depress the SCROLL key until dLS is displayed.
With dLS in the top display, depress the DOWN key to enter the mode. If dLS does not
appear, then the mode has been disabled. Refer to Table 4-1 (page 25) for Enable mode
instructions.
4.5.5.2 MOVEMENT IN THE DATA LOGGER SETUP MODE
Each time the DOWN key is depressed while a parameter code is being displayed, another
parameter code will be displayed.
Depressing the SCROLL key while a parameter code is displayed will cause the parameter
value to appear. Depressing the SCROLL key with a parameter value displayed will cause
the next parameter code to come up in the display.
Depressing the UP key while a parameter code is being displayed will exit the Data logger
Setup mode and dLS will appear in the display. Using the SCROLL key at this point will
allow you to proceed to any other mode.
4.5.5.3 DATA LOGGER SETUP MODE CONFIGURATION
Refer to Table 4-4 (page 30) for configuration procedures for the Datalog Setup mode.
4.5.6 PRESET ADJUST MODE CONFIGURATION PROCEDURE
(TOTALIZATION OPTION ONLY)
The Preset mode allows the entry, review, and altering of the preset parameters. These
parameters are used to trigger relays at selected totalization totals.
4.5.6.1 ENTERING THE PRESET ADJUST MODE
From the Operate or any other mode code, depress the SCROLL key until PSA is displayed.
This is the mode code for the Preset Adjust mode. With PSA in the top display, depress the
DOWN key to enter the mode. If the PSA code does not appear, then the mode has been
disabled. Refer to Table 4-1 (page 25) for Enable mode instructions.
4.5.6.2 MOVEMENT IN THE PRESET ADJUST MODE
The preset values will be changeable in the Preset Adjust mode as follows: With the PSA
mode code displayed, depress the DOWN key. PS1H (preset high value) will be displayed in
the upper display, assuming that the Preset has been selected in the Program mode. When
the SCROLL key is depressed, the value will be displayed. The UP or DOWN keys can now
be used to increment or decrement the value by a factor of ten thousand (10,000) units per
depression. When the SCROLL key is depressed again, PS1L (preset low value) will be
displayed. The UP or DOWN keys can now be used to increment or decrement the values by
single units (ignoring the decimal position). When the SCROLL key is depressed again, the
next preset code will be displayed in the appropriate display. Refer to Table 4-5 (page 31).
4.5.6.3 PRESET ADJUST MODE CONFIGURATION
Refer to Table 4-5 (page 31) for configuration procedures for the Preset Adjust mode. All
possible paramters are shown for illustration purposes. Only those parameters applicable to
each respective pen will actually be shown. Access to either Pen 1 or Pen 2 parameters may
be quickly obtained by depressing the DOWN key at either the PEn1 or PEn2 code.
Page 25

4.5.7 TOTALIZATION CONFIGURATION
Selection of the totalization funciton, how to reset the totalizer, the decimal position, the low
flow cutoff point, the time base and the functions of the presets are all covered in the Program
mode. Preset values are adjusted in the Preset Adjust mode.
4.5.8 RESETTING THE TOTALIZER
Resetting the Totalizer (to 0) can be accomplished from the keypad or from a remote contact
closure.
Resetting the totalizer from the keypad for Pen 1 is accomplished by selecting the totalizer
display and by depressing the UP key and then also depressing the DISPLAY SELECT key
for 5 seconds. Resetting Pen 2 is accomplished by selecting the totalizer display and by
depressing the DOWN key and then also depressing the DISPLAY SELECT key for 5
seconds.
When the totalizer for Pen 1 is reset, the combined total is also reset.
Note: Remote Resetting of the totalizer will not operate if the unit is in the Off mode.
TABLE 4-1 ENABLE MODE
Press the UP and DOWN keys while in oPEr or oFF modes. All display lamps will light. After
10 seconds, the lamps will go out and EnAb will be displayed. Release the keys and the
display will change to EtSt. Press and release the DOWN key and each mode to be enabled/
disabled will be displayed. With the Enable mode prompt for the desired mode displayed,
press the SCROLL key to verify that the displayed mode is either on (enabled) or oFF
(disabled). Press the DOWN key to turn off the mode, press the UP key to turn on the mode
or press the SCROLL key to advance the display to the next Enable mode prompt. Use the
"Your Setting" column in the table to record your programming. The Test and Calibration
modes are factory set to oFF (disabled).
PAGE 25
DISPLAY AVAILABLE FACTORY YOUR
STEP DESCRIPTION CODE SETTINGS SETTING SETTING
1 Enable Test Mode EtSt on or oFF
2 Enable Calibration Mode ECAL on or oFF
3 Enable Program Mode EPro on or oFF
4 Enable Alarm Set Mode EASt on or oFF
5 Enable Data Logger Setup EdLS on or oFF
6 Enable Data Logger Display EdLd on or oFF
7 Enable Preset Adjust Mode EPSA on or oFF
oFF
oFF
on
on
on
on
on
Page 26

PAGE 26
TABLE 4-2 PROGRAM MODE CONFIGURATION PROCEDURE
Press the SCROLL key until Prog is displayed. Press the DOWN key to enter the Program
mode. PEn1 will be displayed in the upper display. To enter the Pen 1 parameter, press the
DOWN key. To enter the Pen 2 parameter, if provided, press the SCROLL key, then the
DOWN key. To enter the unit parameter, press the SCROLL key with either PEn1 or PEn2
displayed until unit is displayed, then press the DOWN key. Press the SCROLL key to
advance the display through the parameter codes and their values. Use the UP and DOWN
keys to adjust the values. After adjusting a parameter, press the SCROLL key to proceed to
the next parameter. After all selections have been made, press the UP key with a parameter
in the display (not a setting) to exit the mode. For two pen instruments, the parameters and
values which are applicable to Pen 1 will appear in the upper display, then the parameters
and values which are applicable to Pen 2 will appear in the lower display, then the unit
parameters and values will appear in the upper display.
DISPLAY AVAILABLE FACTORY YOUR
STEP DESCRIPTION CODE SETTINGS SETTING SETTING
1 Input Select inPS 0=4-20mA with the shunt
NOTE: Fault Detection
Not Functional for 0-5V
Input.
2 Input Correction iCor -1000 to 1000 units
3 Alarm 1 AL1 0=None
4 Alarm 2 AL2 Same selections as Alarm1
5 Decimal Position dPoS 0 to 3
6 Engineering Units EuPA 0=Linear 0
Processing Algorithm 1=Square Root
0 to 7 for Pen 1 of 2=Two Stage Square Root
2 pen units; 3=Three Stage Square Root
0 to 6 otherwise 4 = Variable Exponent
7 Engineering Units Euu 0 to 9999
Upper Value
8 Engineering Units EuL 0 to 9999
Lower Value
(parameter applies only
if EuPA=0)
9 Engineering Units EuE 0.400 to 4.000
Exponent
(parameter applies only
if EuPA=4 or 6)
10 Low Flow Cutoff LFC -25.0 to 25.0%
resistor in place
0=1-5V with resistor
removed
1-100=variable mV span
with JU4 (pen 1), JU5
(pen 2) in mV position
and resistor removed
(i.e., 50=0-50mV input)
100=0-5V with jumper JU4
(pen 1), JU5 (pen 2) in the
volt/mA position and the
resistor removed
1=Process Alarm-Direct
2=Process Alarm-Reverse
5 = Piecewise Linear Conversion
6 = Variable Exponent plus
Piecewise Linear Correction
7 = Saturated Steam Flow with
Pressure correction
(of Euu value)
0
0.0
0
0
1
100.0
0.0
1.500
-10.0
Note: Parameters dP2 through Pu20 only appear if EuPA = 5 or 6.
11 Decimal Position for dP2 0 to 3
12 Engineering Units Euu2 0 to 9999
Engineering Units Value 2
Upper Value 2
1
100
Page 27

DISPLAY AVAILABLE FACTORY YOUR
STEP DESCRIPTION CODE SETTINGS SETTING SETTING
PAGE 27
13 Engineering Units EuL2 0 to 9999
14 Number of piecewise nPtS 2 to 20
15 Hysteresis for Alarm HyAo 0 to 1000 units
16 Process Rounding Prnd 1 to 1000 units
17 Display Filter Factor dFF 1 to 20 units
18 Process Filter Factor PFF 1 to 20 units
19 Process Output Pout 0=Not selected
20 Process Output Pou 0 to 9999 units
21 Process Output PoL 0 to 9999 units
Lower Value 2
linear points
Input Units-Point 1 iu 1
Input Units-Point 2 iu 2
Input Units-Point 3 iu 3
•
•
•
Input Units-Point 20 iu20
Process Units-Point 1 Pu 1
Process Units-Point 2 Pu 2
Process Units-Point 3 Pu 3
•
•
•
Process Units-Point 20 Pu20
Outputs
Upper Value
Lower Value
0=No rounding
(number of values averaged)
1=no filtering
(number of values averaged)
1=no filtering
1=Selected
0
2
0.0
100.0
0.0
0.0
0.0
100.0
0.0
0.0
10.0
0.0
1
1
0
100.0
0.0
The output will be 0% when PV ≤ PoL and 100% when PV ≥ Pou and
will increase linearly from 0 to 100% as the Process Value goes from PoL to Pou.
22 Chart Range Cru 0 to 9999 units
23 Chart Range CrL 0 to 9999 units
24 Pen Action on PAEC 0=Pen goes to 0% span
25 Totalizer Select tSEL 0=Off
26 Totalizer Reset trES 0=Off (Non-Resettable)
27 Totalizer Decimal Position tdP 0 to 3
28 Totalizer Factor tFAC -4 to 3
29 Totalizer Low Flow Cutoff tLFC 0.0 to 25.0% (of Euu value)
30 Flow Time Base Ftb 1=units/second
Upper Value
Lower Value
Error Condition 1=Pen goes to 100% span
0 to 3 only for Pen 1 1=On
of 2 pen units; 2=Combined total
0 to 1 otherwise activated (Pen 1 plus Pen 2)
(if tSEL >0)
3=Combined total
activated (Pen 1 minus Pen 2)
1=Resettable from keypad
2=Resettable by remote
contact closure
3=Resettable from either
2=units/minute
3=units/hour
4=units/day
100.0
0.0
1
0
1
0
0
1.0
1
Page 28

PAGE 28
DISPLAY AVAILABLE FACTORY YOUR
STEP DESCRIPTION CODE SETTINGS SETTING SETTING
31 Preset Select 1 PSS1 0=Off
32 Preset Select 2 PSS2 Same selection as PSS1
33 Preset Select 3 PSS3 Same selection as PSS1
34 Pulsed Output Select PoS 0=Off
35 Scan Rate SCnr 3 scans/second on
36 Relay Assignment rLyA 0=Not assigned
37 Relay B Assignment rLyb Same selection as rLyA
38 Relay C Assignment rLyC Same selection as rLyA
39 Relay D Assignment rLyd Same selection as rLyA
40 Relay E Assignment rLyE Same selection as rLyA
41 Relay F Assignment rLyF Same selection as rLyA
42 Relay G Assignment rLyg Same selection as rLyA
43 Relay H Assignment rLyH Same selection as rLyA
44 Current OutputA CurA 0=Not Assigned
(if tSEL >0) 1 to 9999 (decimal point
Assignment 1=Assigned to Process
1=On when Total>Preset
Value
2=On when Total<Preset
Value
3=On when Combined
Total > Preset Value
4=On when Combined
Total < Preset Value
per tdP)
2 Pen units
5 scans/second on
1 Pen units
1=Assigned to Alarm 1 Pen 1
2=Assigned to Alarm 2 Pen 1
3=Assigned to Alarm 1 Pen 2
4=Assigned to Alarm 2 Pen 2
9=Assigned to Preset 1 Pen 1
10=Assigned to Preset 2 Pen 1
11=Assigned to Preset 3 Pen 1
12=Assigned to Preset 1 Pen 2
13=Assigned to Preset 2 Pen 2
14=Assigned to Preset 3 Pen 2
15=Assigned to Pulsed
Output-Pen 1
16=Assigned to Pulsed
Output-Pen 2
17=Assigned to Pulsed
Output-Combined
Value Output-Pen1
2=Assigned to Process
Value Output-Pen2
3=Assigned to Process
Value Output-Combined
1
1
1
0
3
5
0
0
0
0
0
0
0
0
0
Page 29

DISPLAY AVAILABLE FACTORY YOUR
STEP DESCRIPTION CODE SETTINGS SETTING SETTING
PAGE 29
45 Current OutputB Curb Same selection as CurA
Assignment
46 Current Output C CurC Same selection as CurA
Assignment
47 Current Output D Curd Same selection as CurA
Assignment
48 Current OutputA CoAr 0=0-20mA
Range 1=4-20mA
49 Current Output B Cobr Same selection as CoAr
Range
50 Current Output C CoCr Same selection as CoAr
Range
51 Current Output D Codr Same selection as CoAr
Range
52 Chart Rotation Time Crt 0.1 to 999.9 hours per
rotation
53 Pen Action on Power Up PAPu 0=Pen(s) go to the "home"
position (towards chart
center) when powered up
1=Pen(s) remain in last
position prior to power down
54 Chart Operation Coo 0=Chart continues rotating
in Off mode while in the Off mode
1=Chart stops rotating while
in the Off mode
0
0
0
1
1
1
1
24.0
0
1
Page 30

PAGE 30
TABLE 4-3 ALARM SET MODE CONFIGURATION PROCEDURE
Press and release the SCROLL key until ASEt is displayed, then press the DOWN key.
Press the SCROLL key to advance the display through the parameters
DISPLAY AVAILABLE FACTORY YOUR
STEP DESCRIPTION CODE SETTINGS SETTING SETTING
1 Process Alarm1 PAL1 0 to 9999 units
2 Process Alarm 2 PAL2 0 to 9999 units
3 Barometric Pressure bAro 0.0 to 35.9
(EuPA = 7 only)
0.0
0.0
29.9
TABLE 4-4 DATA LOGGER SETUP MODE CONFIGURATION
Depress the SCROLL key until dLS is displayed. Use the DOWN key to enter the Data logger
setup mode. Depress the SCROLL key to scroll through the parameters and their values.
Use the UP and DOWN keys to adjust the values. After adjusting a parameter, depress the
SCROLL key to proceed to the next parameter. After all selections have been made, depress
the UP key with a parameter code in the display (not a setting) to exit the mode.
DISPLAY AVAILABLE FACTORY YOUR
STEP DESCRIPTION CODE SETTINGS SETTING SETTING
1 Day of the week dAy 1 to 7
1=Monday through
7=Sunday
2 Time of Day in tod 00.00 to 23.59
HH.MM format
1
00.00
3 Time to Log Data ttLd 00.01 to 23.59
4 Date in MM.DD dAtE 1.01 to 12.31
month and day format
5 Year yEAr 1990 to 2089
Note: Before using the Data Logger Display mode, it is suggested that a CAL8 be
performed to initialize the data table.
23.59
01.01
1997
Page 31

TABLE 4-5 PRESET ADJUST MODE CONFIGURATION
Depress the SCROLL key until PSA is displayed. With PSA displayed, press the DOWN key
to enter the Preset Adjust mode. PS1H will be displayed in the upper display, assuming it has
been selected in the Program mode. When the SCROLL key is depressed, the value will be
displayed. The UP and DOWN keys can now be used to increment or decrement the displayed value by a factor of ten thousand (10,000) per depression (ignoring the decimal point).
When the SCROLL key is depressed again, PS1L will be displayed. When the SCROLL key
is depressed again, the value will be displayed again. The UP or DOWN keys can now be
used to increment or decrement the value by one (ignoring the decimal point). After adjusting
a parameter, depress the SCROLL key to proceed to the next parameter. After all selections
have been made, depress the UP key with a parameter in the display (not a setting) to exit the
mode
DISPLAY AVAILABLE FACTORY YOUR
STEP DESCRIPTION CODE SETTINGS SETTING SETTING
PAGE 31
1 Preset 1 High Value PS1H 0 to 99999999 units
Increment/Decrement
value by 10000
Preset 1 Low Value PS1L 0 to 99999999 units
Increment/Decrement
value by 1
2 Preset 2 High Value PS2H 0 to 99999999 units
Increment/Decrement
value by 10000
Preset 2 Low Value PS2L 0 to 99999999 units
Increment/Decrement
value by 1
3 Preset 3 High Value PS3H 0 to 99999999 units
Increment/Decrement
value by 10000
Preset 3 Low Value PS3L 0 to 99999999 units
Increment/Decrement
value by 1
Note: Upon a sensor error condition (SnSr), the preset outputs will remain in the state
they were in upon entering the error condition.
5000
10000
15000
Page 32

PAGE 32
Data Logger Display Mode 4.6
4.6.1 DATA LOGGER DISPLAY MODE OPERATION
The Data Logger Display mode allows the user to view the parameters and values that are
stored during data logging. In the Data Logger Display mode, the instrument operational
functions are all active, as in the Operate mode. This provides a means of viewing the logged
data, on-line, while the unit continues normal operation.
4.6.1.1 ENTERING THE DATA LOGGER DISPLAY MODE
From the Operation or any other mode code, depress the SCROLL key until dLd is displayed.
With dLd in the top display depress the DOWN key to enter the mode. If dLd does not
appear, then the mode has been disabled. Refer to Table 4-1 (page 25) for Enable mode
instructions.
4.6.1.2 MOVEMENT IN THE DATA LOGGER DISPLAY MODE
Each time the DOWN key is depressed while a parameter code is being displayed, another
parameter code will be displayed.
Depressing the SCROLL key while a parameter code is displayed will cause the parameter
value to appear. Depressing the SCROLL key with a parameter value displayed will cause
the next parameter code to come up in the display.
Depressing the UP key while a parameter code is being displayed will exit the Data Logger
Display mode and dLd will appear in the display. Using the SCROLL key at this point will
allow you to proceed to any other mode.
Page 33

TABLE 4-6 DATA LOGGER DISPLAY MODE
Depress the SCROLL key until dLd is displayed. Use the DOWN key to enter the Data
Logger Display mode. With dAy displayed, press the SCROLL key. Use the UP or DOWN
key to set the value equal to the day that is to be viewed. Press the SCROLL key to scroll
through the parameters and their values. After all parameters have been reviewed, depress
the UP key with a parameter code in the display (not a setting) to exit the mode.
DISPLAY AVAILABLE
STEP DESCRIPTION CODE SETTINGS
1 Day of the Week dAy 1 to 28
1= Monday through 7= Sunday of this week
8=Monday through 14=Sunday of previous week
etc.
2 Corresponding Date dAtE
in MM.DD format
3 Low or Minimum Flow LFLo
Rate for the 24 hour
period
4 Time of Day of Ltod
of minimum rate in
HH.MM format
PAGE 33
5 High or Maximum Flow HFLo
Rate for the 24 hour
period
6 Time of Day of maximum Htod
rate in HH.MM format
7 Average Flow Rate for AFLo
the 24 hour period
8 Total Flow for the dtot
24 hour period
Default parameters don't apply as this mode only displays data.
Page 34

PAGE 34
Service 5.1
This section contains information regarding calibration and test procedures that can be
performed in the field as well as items concerning the normal maintenance of the instrument.
Changing Charts 5.2
Chart changes may be done while in the normal operating mode.
CAUTION: The chart flange assembly pin is sharp to perforate the chart. Use caution
while installing the chart to avoid coming into contact with the pin.
1. Depress and hold the UP and DOWN keys for between 2 and 3 seconds. Immediately
after depressing the keys, the unit will do a Lamp Test with all LED segments and indicators
lighted on the upper (and lower) display.
2. After 2-3 seconds, the display will show Cchg, the pen(s) will move to and remain at a
point above the top graduation on the chart and the chart will stop rotating. All other functions
remain active (Operate, Display, etc).
3. Open the instrument door, snap up the chart hold down lever on the chart flange assembly, gently lift the pen(s) and remove old chart.
4. With the pen(s) held up, install new chart. Be sure to line up the chart time line so that the
current time is aligned with the time setting mark on the chart platen.
5. Snap down chart hold down lever and close the instrument door.
6. Depress and hold the UP and DOWN keys for between 2 and 3 seconds. Immediately
after depressing the keys, the unit will do a Lamp Test with all LED segments and indicators
lighted on the upper (and lower) display.
7. After 2-3 seconds, the display will show Cchg momentarily, then the pen(s) position and
chart rotation will be restored.
Changing Pens 5.3
Open the instrument door. Refer to Figure 5-1 for pen changing procedure. This procedure is
also provided on a label on the instrument chart platen. Be sure to replace the pen cartridge
with the same type (color) that was removed. Be careful not to bend the pen arm while
changing the pen.
FIGURE 5-1
For replacement pens, order:
Green #60500401
Red #60500402
2
1
To install pen, slide pen into
holder (1) and push down (2)
as shown by arrows
(Pens are sold in lots of five)
To remove pen, pull up at
back end (1) and push out
1
2
Page 35

Calibration 5.4
CAUTION: Do not attempt any calibrations without the proper test equipment that meets or exceeds the specifications
listed.
To enter the calibration mode it must first be turned on in the Enable mode (page 25). Once
enabled, press and release the SCROLL key until CAL appears on the display, then press the
DOWN key to enter the mode. The display will change to CAL1. Press the SCROLL key to
advance the display to the other calibration modes available. Table 5-1 provides a listing of
field calibration routines. All instruments are calibrated prior to shipment from factory.
TABLE 5-1 CALIBRATION PROCEDURES
Calibration
Procedure Description
CAL1 Reinitialization of program and tuning values.
CAL2 Main calibration necessary for all input types.
CAL6 & 7 Factory use only.
PAGE 35
CAL8 Data Logger Re-initialization.
CAL9 Pen position calibration used to calibrate pens to chart.
5.4.1 CAL 1 PARAMETER RE-INITIALIZATION
This routine is used to clear all information in the Program, Alarm Set, and Preset modes. All
parameters will be reset to default values. Before performing this procedure, make sure that
the Program, Alarm, and Preset values are written down so that they can be re-entered after
Calibration 1 is completed. No test equipment required.
With CAL1 displayed, press and hold the DOWN key, then press the SCROLL key. The
display will momentarily blank; release the keys. Upon completion of the routine, CAL1 will
re-appear on the display.
5.4.2 CAL 2 MAIN CALIBRATION
This routine determines and saves calibration values which correct for component variations
relating to the basic measuring function of the unit. A 100.00 mVDC ± .01 mVDC source is
required for testing.
non-volt positions. See Appendix A-1 (page 46) for proper positioning. After completing CAL2, be sure to re-position these jumpers to the appropriate position for your
input.
With CAL2 displayed, press and hold the DOWN key, then press the SCROLL key. Release
the keys when the instrument displays hLd1. Short the input terminals or apply 0.00 ± .01
mVDC to TB4 terminals 1 and 2. Press the DOWN key and dELy will appear for 10 seconds,
then SCAn will appear for 10 seconds. A calibration reference number will then appear, this
should be 0 ± 50. If this number falls outside these limits, press the SCROLL key and CAL2
will be displayed. Perform the calibration again. Repeat the calibration until the number falls
within the tolerance limits. If the number remains outside the limits, check the connections
and try the calibration again. If the number does not approach the tolerance limts, contact the
nearest representative or factory for assistance. With an acceptable reference number on the
display, remove the short and connect a 100.00, ± .01 mVDC source to the TB 4 terminals 1
and 2. Be sure to observe the proper polarity when connecting the source. Terminal 1 is
positive and terminal 2 is negative. (Continued on next page)
Make sure that the Processor board jumpers JU4 and JU5 are in the
Page 36

PAGE 36
(Continued from page 35)
Press the DOWN key, deLy will be displayed for 10 seconds and then SCAn for 10 seconds.
When the calibration is complete CAL2 will reappear.
CAL2 QUICK CALIBRATION
This routine will allow the operator to execute a rough calibration on their unit via the keypad
with no other equipment or disturbance to established wiring. It is intended to provide a
partial recovery from a calibration corruption where the necessary equipment indicated may
not be available. It should be noted that this is not intended as a substitution to the main
calibration procedure described earlier and may deter considerably from the accuracy of the
instrument.
With CAL2 displayed, press and hold the DOWN ARROW key, then press the SCROLL key.
Release both keys and the instrument will display hLd1. Press and hold the UP ARROW key,
then press the SCROLL key. The display will momentarily blank and then CAL1 will be
displayed. Release both keys and depress the UP ARROW key. CAL will be displayed.
Error recovery:
See section 5.6 (page 40) for details. Insure that the millivolt source is connected correctly
and functioning properly.
The calibration can be exited when hLd1 or the calibration reference number is displayed by
pressing the SCROLL key.
5.4.3 CAL8 DATA TABLE INITIALIZATION
This routine initializes the logged data on the recorder.
With CAL8 displayed, while pressing the DOWN ARROW key, press the SCROLL key. The
display will momentarily blank while the initialization is in progress. Upon completion of the
routine, CAL8 will be displayed. The routine can be executed again or another routine
selected.
5.4.4 CAL 9 PEN CALIBRATION
This procedure is used to calibrate the pen(s). No special test equipment required.
Valid inputs must be connected to TB 4 and TB 5 before performing this calibration. With CAL
9 displayed, push and hold the DOWN key, then press the SCROLL key . Release both keys
and the display will indicate PEn1. For 2 Pen instruments, press the DOWN key to toggle the
display between pen 1 and pen 2. With desired pen displayed, press the SCROLL key.
FOR INSTRUMENTS WITH SOFTWARE REVISION R2.99 AND BELOW:
dELY will be displayed as the pen selected moves toward the center chart hub. PEnL will be
displayed; use the UP and/or DOWN keys to adjust the pen to the low end or 0% of the chart.
When adjusted, press the SCROLL key, SCAn will appear for 10 seconds and the pen
location value will be saved in memory. Next dELY will appear as the pen moves to the outer
edge or, 100% mark on the chart. PEnh will appear, use the UP and/or DOWN keys to adjust
the pen position to the proper 100% of chart position. Press the SCROLL key and SCAn will
be displayed as the pen position value is saved. Then dELy will be displayed as the pen
moves to about mid-scale. CAL9 will be displayed showing that the calibration is complete.
When the calibration is complete, with CAL9 displayed, press the UP key twice to properly
exit the calibration mode. CAL9 can now be repeated on the other pen of a 2 pen instrument
or another routine can be selected.
Page 37

FOR INSTRUMENT WITH SOFTWARE REVISION R3.00 AND ABOVE:
P.dn will be displayed while the selected pen is moved to it's "HOME" position (toward the
chart hub) with the decimal point flashing to indicate this mode. Once "Pen Home" is found,
the pen will move to the inner ring and PEnL will be displayed. At this point, one of two
adjustments may be made; Pen Arc or Zero and Span.
Pen Arc - To adjust the pen arc, the UP and DOWN keys are pressed simultaneously to draw
an arc for visual reference. The display will show P uP while the selected pen moved upscale
to the top stop position. The pen then moves back downscale to nominally place the pen at
the outer ring (100%) of the chart. The display will now display ArC.
The pen arm may be loosened and the length adjusted to a position and angle to place the
pen tip near the outer ring then re-tighten the pen arm. Press any key and the pen will drive
to "HOME", then back to the inner ring (0%) and PEnL will be displayed.
Zero and Span - To begin a pen zero, with PEnL in the display, the UP or DOWN key may be
pressed to move the pen to the low end of the chart span (0%). When adjusted, press the
SCROLL key and P uP is displayed while the pen is moved to the outer edge (100%) of the
chart, then PEnh is displayed. To adjust pen span, use the UP and DOWN keys to adjust the
pen for the high end (100%) of the chart. When adjusted, press the SCROLL key and P dn
will be displayed for about 5 seconds while the pen is moved to the 50% point on the chart,
then PEn1 is displayed. Calibration may now be performed again to verify the accuracy, or
press the UP key twice to exit back to the CAL mode.
PAGE 37
Test Mode 5.5
To enter the Test mode, press and release the SCROLL key until tESt appears on the display
then press the DOWN key. tSt1 will be displayed, press and release the SCROLL key to
advance the display to the desired test. Tests 1, 2 and 3 are performed as a unit so the
display will advance directly to tSt4 from tSt1. Listed below in Table 5-2 are the test procedures available. Test 1, 2 and 3 are performed on start up, periodically during operation, and
on entry into the Test mode. Test 4 is executed on entry into and periodically during the
Operation mode. These tests can be used as a trouble shooting aid.
TABLE 5-2 TEST PROCEDURES AND DESCRIPTION
Test Description
Test 1 Microprocessor internal RAM test. Used to check the processor RAM to
make sure it is functioning correctly.
Test 2 External RAM test, used to test the RAM chip for proper function.
Test 3 EPROM checksum test, used to check that the EPROM program is correct.
Test 4 External RAM checksum test; instrument test and identifies how many
times Errors 16 and 17 have occured.
Test 5 Verifies that all keys are functional and all LEDs are working.
Test 6 Used to verify that all relays and solid state relay driver outputs are working
correctly.
Test 7 This procedure will allow operator to adjust the current output value to
check the output and to test the operation of the external device.
Test 8 Pen and chart motor operational check.
Test 9 Auxiliary input test, used to test remote reset.
Page 38

PAGE 38
5.5.1 TEST 1 INTERNAL RAM TEST
Tests the Random Access Memory internal to the microprocessor. No special test equipment
is required.
With tSt1 displayed, press and hold the DOWN key, then press the SCROLL key. tSt1 will be
displayed momentarily while the test is in progress. Upon successful completion, the instrument will proceed to Test 2.
5.5.2 TEST 2 EXTERNAL RAM TEST
Tests the battery backed up RAM external to the microcomputer. No special test equipment
is required.
After completion of Test 1, tSt2 will be displayed momentarily while the test is in progress.
Upon successful completion, the instrument will proceed to Test 3.
5.5.3 TEST 3 PROGRAM EPROM TEST
This is a checksum test to verify data integrity of the stored program. No special test equipment is requried.
After completion of Test 2, tSt3 will be displayed momentarily while the test is in progress.
Upon successful completion of Test 3, tSt1 will be displayed.
5.5.4 TEST 4 EXTERNAL RAM CHECKSUM TEST
This is a checksum test to verify the integrity of date stored in RAM and indicate the number
of times the instrument has had an Error 16 or 17. The unit may have automatically
recovered from these errors. No special test equipment is required.
5.5.5 TEST 5 KEYPAD/DISPLAY TEST
This test allows the operator to verify that the keys work and that all display elements can be
lighted. No special test equipment is required.
With tSt5 displayed, press and hold the DOWN key, then press the SCROLL key and then
release both keys. The display will go blank. The following code will be displayed while the
corresponding key is pressed:
Key Display
SCROLL SCrL
UP uAro
DOWN dAro
UP and DOWN (All Led's and segments lit)
DISPLAY SELECT diSp
SCROLL and UP (exit)
To exit, press the SCROLL and UP keys simultaneously, tSt5 will be displayed.
5.5.6 TEST 6 RELAY/SOLID STATE RELAY DRIVER OUTPUT TEST
Allows the operator to verify that the Relay and/or the Solid State Relay Driver output(s) are
working. A volt/ohm meter will be required to test the output.
With tSt6 displayed, press and hold the DOWN key, then press the SCROLL key. oFF will be
displayed. For SPST or SPDT Relay outputs, connect the meter across the relay output in
the ohm scale. For SPDT Relay outputs, connect the meter across the N.O. and COM output
in the ohm scale. The meter should read continuity with the relay on and infinity when the
relay is off. For SSR Driver outputs, connect the meter across the output in the Volt DC scale.
Page 39

The meter should read 5 VDC when the SSR driver is on and 0 VDC when the driver is off.
Press and release the DOWN key to advance through the following sequence:
Display Relay ON SPST RELAY ON SPDT
rLYA AA
rLYb BB
rLYC CC
rLYd DD
rLYE E None
rLYF F None
rLYg GG
rLYH HH
oFF None None
To exit, press the SCROLL key and tSt6 will be displayed. The existence of Relay and Solid
State Relay Driver output(s) is dependent upon the hardware configuration.
5.5.7 TEST 7 CURRENT OUTPUT TEST
This test allows the operator to verify that the current output(s) are functioning properly or will
allow the selection of an output value for testing of associated equipment. A milliamp meter is
required for testing.
With tSt7 displayed, press and hold the DOWN key, then press the SCROLL key. The
display will indiicate CurA, for the first current output. By pressing the DOWN key, the
instrument will advance through the selection sequence of Curb, CurC, Curd, and then back
to CurA. Choose the desired output to be tested and connect the milliamp meter across the
output terminals being tested. Be sure to observe the proper polarity when connecting the
meter. Terminal 1 is positive and terminal 2 is negative. Press the SCROLL key and the
display will indicate 4 milliamps.
PAGE 39
Use the UP and/or DOWN key to increase or decrease the current output in 1 mADC steps
from 0 to 20mADC. The current output reading should be ± 0.5 mADC at any output value.
A ± 5% of span adjustment for the current output(s) is provided by using the potentiometer
adjacent to the current output on the Current Output board. See Appendix A-3 (page 51). To
exit the test, press the SCROLL key and tSt7 will be displayed. The existence of a mADC
current output is dependent upon the hardware configuration.
5.5.8 TEST 8 PEN/CHART MOTOR TEST
This test allows the operator to verify that pen and chart motors are functioning properly. No
special test equipment is required.
With tSt8 displayed, press and hold the DOWN key, then press the SCROLL key. The
display will show ALL while the test is in progress. This test functions automatically. The
chart speed will be at maximum, 72 seconds per revolution. Starting at the current pen
position, pen 1 will move (sweep) upscale for about 5 seconds, then downscale for about 5
seconds. Pen 2 (if provided) will sweep in the opposite direction. The pens will continue to
cycle until the test is exited. To exit, press the SCROLL key. The display will show tSt8.
5.5.9 TEST 9 AUXILIARY INPUT TEST
This test allows the operator to verify that the auxilliary input(s) are functioning properly. With
tSt9 displayed, press and hold the DOWN key, then press the SCROLL key. The display will
show Ai1, Auxiliary Input 1. By pressing the DOWN key the instrument will alternate between
Ai1 and Ai2. With the desired input selected, press the SCROLL key. The corresponding
value will be displayed. To terminate a particular test, press the SCROLL key. The display
will show tSt9.
Page 40

PAGE 40
Trouble-shooting and Diagnostics 5.6
This section consists of two columns. The first column is a list of some possible instrument
conditions. The second column is a list of steps that should improve the condition. The steps
should be performed in order until the condition improves or all the steps have been completed. If the instrument condition has not improved, contact the nearest representative or the
factory for assistance.
Trouble-shooting should be performed by qualified personnel using the proper equipment and
following all safety precautions. Whenever possible, the trouble-shooting should be accomplished with the electrical power disconnected. The instrument contains static sensitive
components so care should be take to observe anti-static procedures.
Condition Correction Steps
Display(s) is/are blank 1. Verify that the correct instrument power, as indicated
on the wiring label on the platen, is supplied to TB1
terminals 1 & 2. Check the position of the power
select switch, on 230 VAC models, correctly indicates
the power that is connected to the instrument. If the
switch does not indicate the correct voltage, reposition
as necessary. If the voltage is not correct, check the
power source.
2. Turn off the instrument power. Wait about 5 seconds
then turn the power on again .
3. Turn off the instrument power, open the cover, loosen
the platen hold down screw, and swing the platen out
of the way. Inspect the instrument for poor
connections.
a. The white ribbon cables that connect the
Processor board (Appendix A-1, page 46) to
the platen must be properly aligned and
seated in the sockets.
b. The display board(s) white ribbon cable(s)
pins should be properly aligned and seated in
the sockets on the platen potentiometer
segment board.
c. Inspect the EPROM (U3), RAM (U8) and
microprocessor chips (U5) to see that the
legs are properly seated in their sockets on
the Processor Board (page 46).
d. Close the platen and tighten the hold down
screw. Close the cover and turn on the
power to see if the display(s) will now light.
4. Turn off the instrument power. Press and hold the UP
and DOWN keys. Turn on the power. Hold the keys
pressed for about 10 seconds. If the display(s) light(s)
the model number, Program and Alarm Set mode
parameters will need to be re-entered (pages 26 & 30
or Software Ref. Sheet, page 55, if already filled out).
Page 41

Model Number Displayed 1. Turn off the instrument power, wait 5 seconds then
during power up is re-apply the power. Verify that the number displayed
incorrect during the power up sequence is the same as
indicated on the label affixed to the platen. If the
number displayed is incorrect, perform the following
steps:
a. Turn off the power to the instrument. Press
and hold the UP and DOWN keys. Turn on
the power and keep the keys pressed until
the model number displayed resets to 78X0 0000-0021. Release the keys and turn off
the power.
b. To enter the correct model number, press
and hold the SCROLL and DOWN keys and
turn on the instrument power. 78X0 should
be displayed. Wait about 5 seconds and
release the keys. The display should stay
78X0. Use the UP/DOWN keys as neces
sary to change the displayed number to
match the first 4 digits of the model number
as indicated on the label on the platen. After
adjusting the first 4 digits to the proper
values, press the SCROLL key and the
display will change to 0000. Use the UP/
DOWN keys to set the next 4 digits of the
model number to the correct values. Press
the SCROLL key and the display will be
0000. Use the UP/DOWN keys to set the last
4 digits of the model number. Press the
SCROLL key and the power sequence will
complete. The Program, Alarm Set, Preset
and Datalog mode parameters will need to be
re-entered (pages 26 & 30 or Software Ref.
Sheet, page 55, if already filled out).
PAGE 41
Relay/SSR Driver 1. Verify that the Program, Alarm Set and Preset mode
Malfunction parameters are correctly set (pages 26 & 30 or
Software Ref. Sheet, page 55, if already filled out).
2. Turn off the power to the instrument. Wait about 5
seconds and turn the power on again. Confirm that
the model number displayed during the power up
sequence indicates that the output(s) is/are present in
the instrument. See Appendix C (page 52) for the
model number explaination/decoding. This number
should match the number on the label affixed to the
platen.
3. Turn off the power to the instrument. Open the cover.
Loosen the platen hold down screw and swing the
platen open. Inspect the instrument Relay/SSR Driver
board (See Figure 2-2, page 9) for the presence of
the output device(s). A relay output will appear to be a
cube. The SSR Driver will appear as a resistor and a
jumper wire. The output will not work if the hardware
is not present. Inspect that the output terminal
connections are present and firmly attached.
(Continued on next page)
Page 42

PAGE 42
(Continued from page 43)
4. Check the output(s) operation by performing Test 6 as
described in the Test section (page 38). If the
output(s) function(s) in the Test mode, re-examine the
Program, Alarm Set and Preset mode parameter
settings (pages 26 & 30 or Software Ref. Sheet, page
55, if already filled out).
5. If the output appears not to turn off, remove the power
to the instrument. Open the cover and loosen the
platen hold down screw. Swing the platen open. Clip
the resistor located on the Relay Board adjacent to the
output(s) that seem to stay on (See Appendix A-2A or
A-2B, page 47 or 48). A .01 microfarrad, 1 KV
capacitor should be connected from the terminal listed
below, for the output where the resistor indicated was
removed, to the AC ground.
SPST
Relay A R1 TB6 Terminal 1
Relay B R2 TB6 Terminal 3
Relay C R3 TB7 Terminal 1
Relay D R4 TB7 Terminal 3
Relay E R5 TB8 Terminal 1
Relay F R6 TB8 Terminal 3
SPDT
Relay A R1 TB6 Terminal 1
Relay A R2 TB6 Terminal 3
Relay B R3 TB7 Terminal 1
Relay B R4 TB7 Terminal 3
Relay C R5 TB8 Terminal 1
Relay D R6 TB8 Terminal 3
Close the platen and tighten the hold down screw. Close
the cover and turn the power on to the instrument. Check
the operation of the output(s).
mADC Output(s) 1. Verify that the Program mode parameters are correctly
Malfunction set (page 26).
2. Turn off the power to the instrument. Wait about 5
seconds and turn the power on again. Confirm that
the model number displayed during the power up
sequence indicates that the output(s) is/are present in
the instrument. See Appendix C (page 52) for the
model number explaination/decoding. This number
should match the number on the label affixed to the
platen.
3. Turn off the power to the instrument. Open the cover.
Loosen the platen hold down screw and swing the
platen open. Inspect the instrument Current Output
board (See Figure 2-2, page 9) for the presence of
the output device(s). The output will not work if the
hardware is not present. Inspect that the output
terminal connections are present and firmly attached.
Close the platen and tighten the hold down screw.
Close the cover and turn on the power.
Page 43

4. Refer to the Test section and carry out the procedure
for the Current Output(s) Test 7 (page 39). If the
current output operates properly in the Test mode,
re-check the Program mode parameters (page 26 or
Software Ref. Sheet, page 55) if already filled out).
Pen(s) do not operate 1. Verify that the Program mode parameters are properly
set (page 26 or Software Ref. Sheet, page 55, if
already filled out).
2. If the process value in the display exceeds the chart
upper or chart lower values selected in the Program
mode, the pen will appear stuck at the chart upper or
lower edge respectively. Re-configure values as
needed by the application (may require a new chart).
3. Perform Test 8 as described in the Test section of the
manual (page 39). If the pen(s) operate(s) in Test 8,
perform the pen calibration, Cal 9, as described in the
Calibration section of the manual (page 36). Return
the instrument to the oPEr and check the operation of
the pen(s).
4. For software revision R2.99 and below, perform Test
9 as described in the Test Section of the manual
(page 39). If the pen feedback voltage does not vary,
check the pen Potentiometer Segment board for
proper ribbon cable connection to the Processor
board (Appendix A-1, page 46) and that the pen
position fingers are making contact with Potentiometer
Segment board.
5. For software revision R2.99 and below, inspect to see
that the Potentiometer Segment of the pen feed back
is clean. Use a non-residue type cleaner that does
not affect the plastic to clean the segment if
necessary.
6. Verify the instrument is not in Change Chart function.
PAGE 43
Error Code Displayed
SnSr - Sensor Break or 1. Inspect the sensor for proper operation and
Over Range connection to the instrument. Acceptable sensor
ranges for the instrument are listed in the
Specifications section of Appendix D (page 53).
2. Verify that the Program mode input selection matches
the sensor input connected (page 26 or Software Ref.
Sheet, page 55, if already filled out).
3. Check that the input conditioning jumpers on the
processor board (Appendix A-1, page 46) are in the
proper position for the sensor input. Check that the
jumpers are in the proper position for the Terminal
Board where the sensor is connected.
4. Perform the calibration procedure(s), as described in
the Calibration section (page 35), for the sensor input
type.
Page 44

PAGE 44
Hi - Input more than 10% 1. Perform the steps listed for the SnSr Error Condition
Over Span (above).
Lo - Input more than 10% 1. Perform the steps listed for the SnSr Error Condition
Under Span (above).
o - display overranged 1. If this error code is displayed as a Program, Alarm
(the "broken 6" Set, or Preset mode parameter, perform the CAL1
appears on the left procedure as described in the Calibration section of
segment of the display) the manual (page 35).
2. If this error code appears as part of the model number
during the power up sequence, follow the steps listed
for the "Model Number is not correct" condition (page
41).
3. If this error appears, check the Program mode
parameter dPos, if set to 1, change to 0 and see if the
error clears.
Er1 - Microprocessor RAM 1. Turn off the power to the instrument. Wait 5 seconds,
Failure and turn the power on.
2. Turn off the power to the instrument. Open the cover,
and loosen the platen hold down screw. Swing open
the platen and inspect that the microprocessor chip
(U5) is properly seated in the socket located on the
Processor board (Appendix A-1, page 46). Close the
platen and tighten the screw. Close the cover and
turn on the power.
Er2 - External RAM Failure 1. Turn off the power to the instrument. Wait 5 seconds,
and turn the power on.
Er3 - EPROM Checksum 1. Perform the steps listed for Er1 except that the
Failure EPROM (U7) on the Processor board should be
inspected.
Er5 - No Zero Crossings 1. Turn off the power to the instrument. Wait 5 seconds,
Detected and turn the power on.
2. Connect the instrument to another AC power source.
Er6 - AC line below 45 HZ 1. Turn off the power to the instrument. Wait 5 seconds,
and turn the power on.
2. Connect the instrument to another AC power source.
Er7 - AC line over 65 HZ 1. Turn off the power to the instrument. Wait 5 seconds,
and turn the power on.
2. Connect the instrument to another AC power source.
Page 45

Er8 - Cal2 Volt Input 1. Check that 100mVDC is properly connected to the
Error instrument and is within the tolerance limts as
indicated in the CAL2 procedure of the Calibration
section (page 35).
2. Turn off the power to the instrument and open the
cover. Loosen the platen hold down screw and swing
the platen open. Inspect the Processor board
(Appendix A-1, page 46) to insure that the input
conditioning jumper JU4 is in the non-volt position.
The jumper must be in the non-volt position to perform
the CAL2 procedure properly. Close the platen and
tighten the hold down screw. Close the cover and
turn on the power to the instrument.
3. Perform the CAL2 procedure as described in the
Calibration section (page 35).
Er9 - ADC Reference 1. Perform the CAL2 procedure as described in the
Number Error Calibration section (page 35).
PAGE 45
Er10 - ADC Reference 1. Perform the CAL2 procedure as described in the
Voltage Error Calibration section (page 35).
Er12 - CAL2 Voltage Error 1. Check that 100 mVDC is properly connected to the
instrument and is within the tolerance limits as
indicated in the CAL2 procedure of the Calibration
section (page 35)
2. Turn off the power to the instrument and open the
cover. Loosen the platen hold down screw and swing
the platen open . Inspect the Processor board
(Appendix A-1, page 46) to insure that the input
conditioning jumper JU4 is in the non-volt position.
3. Perform the CAL2 procedure as described in the
Calibration section (page 35).
Page 46

PAGE 46
M
O
Appendix A
Board Layout
FIGURE A-1 - Processor Board
Top
JU1
ENABLE MODE
UNLOCKED
JU4 PEN 1 INPUT
LOCKED
JU8
RAM SIZE
JU3
EPROM SIZE
mV
VOLT/mA
64K
64K
MICR
U5
JU1
230
SWI for Rev. Y and above
SWI for Rev. X and below
RAM
EPRO
U8
JU8
TB1
230
230/115 VAC
SWITCH 230 VAC
MODEL ONLY
JU3
U7
Battery
JU4
JU5 PEN 2 INPUT
(REVERSE
OF JU4)
mV
VOLT/mA
TB2
TB3
TB4 TB5
JU5
Page 47

FIGURE A-2A - Relay/SSR (SPST) Driver Output Board
PAGE 47
TB6
TS1
R1 TS2 R2 TS3 R3
C1 C2
K1 K2
P7
TB7
TS4
R4 TS5
C3 C4 C5 C6
K3 K4 K6
K5
R5
TB8
TS6
TB9
R6
If the relay is connected to a
high impedance AC device,
the snubber network used to
protect the relay contact may
cause the output to appear
to be activated when the
relay is off. To cure the
problem, cut the snubber
resistor for the output that is
being affected.
Resistor Relay
R1 Relay A
R2 Relay B
R3 Relay C
R4 Relay D
R5 Relay E
R6 Relay F
Page 48

PAGE 48
FIGURE A-2B - Relay (SPDT) Output Board
TB6
TS1
R1 TS2 R2 TS3 R3
C1 C2
P7
K1
TB7
TS4
R4 TS5
C3 C4 C5 C6
K2
TB8
R5
TS6
K3 K4
TB9
R6
If the relay is connected to a
high impedance AC device,
the snubber network used to
protect the relay contact may
cause the output to appear
to be activated when the
relay is off. To cure the
problem, cut the snubber
resistor for the output that is
being affected.
Resistor Relay
R1 Relay A N.O
R2 Relay A N.C.
R3 Relay B N.O.
R4 Relay B N.C.
R5 Relay C
R6 Relay D
Page 49

FIGURE A-3 - Current Output Board
PAGE 49
U2
R50 R51
U1
U3
TB10 TB11
U4
U5
U6
U7
TB12
R52
U8
U9
TB13
R53
If this option board was ordered, you will find it located in the lower right hand corner of the
instrument.
Page 50

PAGE 50
Appendix B
Glossary
Display Filter Factor
This parameter is adjustable from 1 to 20 which represents the number of scans of the
process variable that are averaged together before updating the displayed and recorded
value, and process value for retransmission. The factory default is 1=no filtering. Display
code dFF.
Flow Time Base
Specifies whether the displayed process value is in units/second, units/minute, units/hour or
units/day, such that the
units/second. Display code Ftb.
Hysteresis
The paramter is adjustable from 0 to 1000 units representing the width of the band (half above
and half below alarm setting). Factory default =10. Display code HyAo.
Input Correction
This parameter is adjustable from -1000 to 1000 units and is used as a method to compensate for a linear sensor error. Factory default is 0=no correction. Display code iCor.
flow rate can be converted to flow for totalization. Factory default = 1,
Platen
The flat surface in the instrument upon which the chart rotates.
Process Filter Factor
This parameter is adjustable from 1 to 20 which represents the number of scans per second
of the process variable that are averaged together before updating the process value used for
alarm, presets. The factory default value is 1=no filtering. Display code PFF.
Process Output
Allows retransmisstion of the process variable. Factory default is 0=not selected. Display
code Pout. If selected, a current output must be assigned to it and scaled using Process
Output upper and lower values.
Process Output Upper and Lower Values
(used in conjunction with process output)
These parameters specify the process value range over which the assigned current output will
decrease linearly from 100% to 0%. If the process value is greater than Pou the output will
be 100%. If the process value is less than PoL the output will be 0%. Factory default values
are 100.0 for the upper value and 0 for the lower value. Display codes Pou (upper) and PoL
(lower).
Process Rounding
This parameter is adjustable from 0 to 1000 units and is used to round the process value to
the nearest value specified. Intended for use where the engineering units span is large, to
reduce fluctuation. Factory default is 0=no rounding. Display code Prnd (e.g.Prnd=3,
Process Value=-6, -3, 0, 3, 6, 9 ...).
Page 51

Square Root Extraction Algorithms
(Engineering Units Processing Algorithm)
This parameter chooses the equation for processing the input from a transmitter or
transducer.
EuPA = 0 - Linear is for inputs that are directly proportional to flow (no square root extraction
needed).
EuPA = 1 - Square Root, takes the square root of the input (pressure or differential pressure)
over the whole range of the input.
EuPA = 2 - Two Stage Square Root, takes the square root of the input when the input is
greater than 4% of input (20% of flow) and uses a linear relationship below 4% with a slope of
5.
EuPA = 3 - Three Stage Square Root, uses a linear relationship when input is less than 1%
with a slope of 1, a linear relationship between 1 and 2.5% with a slope of 10 and a square
root above 2.5%.
EuPA = 4 - Variable Exponent, when properly set , provides a means of accurately accommodating weirs and flumes.
EuPA = 5 - Piecewise Linear, provides the user with a means of inputing data from a nonlinear sensor.
EuPA = 6 - Variable Exponent with correction, provides a means to use Palmer-Bowlus or H
flumes.
EuPA = 7 - Saturated Steam Flow with Pressure Correction.
Display code EuPA.
Totalizer Decimal Position
Specifies how the total, preset, and pulsed output values will be displayed. The factory
default=0, no decimal. Display code tdP.
PAGE 51
Totalizer Factor
Specifies how the total will be scaled, and as a result, the corresponding scaling of the preset
and pulsed output values. For totalizer factor = -4, -3, -2, -1, 0, 1, 2, or 3, the total will be
multiplied by .0001, .001, .01, .1, 1, 10, 100, or 1000 respectively. The factory default=0.
Display code tFAC.
Totalizer Low Flow Cutoff
Below the specified percent of full scale Process Value, the flow will not be added to the total.
The factory default = 1.0. Display code tLFC.
Page 52

PAGE 52
Appendix C
Order Matrix
7
08
0
Pen and Totalization
Selection
5 1 Pen Recorder
6 1 Pen Recorder with Totalization
7 2 Pen Recorder
8 2 Pen Recorder with Totalization
9 1 Pen Recorder with
Totalization and
Second Display
*Relay Outputs
0 None
1 One SPST
2 Two SPST
4 Four SPST
6 Six SPST
7 One SPDT
8 Two SPDT
9 Two SPST
Two SPDT
*SSR Driver Outputs
0 None
1 One
2 Two
4 Four
6 Six
8 Eight
4 to 20mA Outputs
0 None
1 One Std.
2 Two Std.
3 Three Std.
4 Four Std.
Option Suffix
Blank - None
N3 - NEMA 3†
Voltage
1 115VAC Input
2 115/230VAC Input
CSA Approved
4 115VAC Input
5 115/230VAC Input
Enclosure Option
2 Standard Cover
(Plastic Window)
4 Door Lock**
6 Sealed conduit Conn.
7 Combination of 4 & 6.**
Fixed Character
Fixed Character
Data Logger
0 None
1 Data Logging
Transmitter Power
Supply
0 None
1 24VDC Regulated/Isolated
*Total quantity of Relays and SSR Drivers must be less than or equal to (8) eight.
** This option comes with structural foam cover.
† N3-NEMA3 Equivalent Spray Resistant Enclosure.
Page 53

Appendix D
Specifications
Measurement Error Limit mA, mV, and VDC +/- 0.25% of scaled span plus 1 Least
Significant Digit @ 25 degrees C
Ambient Temperature Error 0.01% of span per degree C deviation from 25 degrees C
Scan Rate 1 to 5 scans/second (One pen units)
1 to 3 scans/second (Two pen units)
Display Decimal Positions None, One, two or three decimal places
Noise Rejection Normal mode, 85dB minimum at 60Hz or greater
Common mode, 90dB minimum, 115VAC maximum
Line Voltage 115/230VAC +/- 10% 50/60 Hz
Power Consumption 25VA maximum
PAGE 53
Operating Temperature 0 to 55° C (ambient)
32 to 131° F
Storage Temperature -40 to 65° C
-40 to 149°F
Humidity 0 to 90% RH, noncondensing
Dimensions 13.19" H x 15.13" W x 3.63" Deep
Weight 20 pounds maximum
Transmitter Fault Detection Displays SnSr for sensor or transmitter break. Alarm
Outputs go off. Presets remain as they were, Pulsed
outputs stop.Fault detection is not functional for 0-5V
or 0-20mA inputs.
Agency Approvals UL and CSA
Transmitter Power Supply Provides up to 42mA of current at 24VDC
Warranty 3 years, see back page for details.
Page 54

PAGE 54
INPUTS
Milliamps Millivolts
4-20mADC 0 to 100mV
(Can be scaled to any portion of this range)
Volts
0 to 5VDC*
1 to 5VDC*
*Volt inputs are accomodated by removal of a shunt resistor
ALARM ADJUSTMENTS
Process Alarm 0 to 9999
Hysteresis 0 to 1000
PROCESS VALUE OUTPUT
Current 0 to 20 or 4 to 20 mADC
ALARM, PRESET, AND PULSED OUTPUTS
Relay SPST/SPDT
115VAC: 5.0A Resistive, 1/8HP or 250VA
230VAC: 2.5A Resistive, 1/8HP or 250VA
SSR Driver Open collector output
Short circuit protected @ 100mA maximum
Provides 4VDC at 20mA or 3VDC at 40mA
DISPLAY
Digital Display Two possible; one per installed pen. Red LEDs 0.36" high
Status Indicators LED indicators for Alarm 1 and Alarm 2, Process Value Displayed
(PV) and Total displayed (TOT)
RECORD
Chart 10 inch circular chart; 100 charts furnished with each instrument if
standard range
Chart Range 0 to 9999 units
Chart Drive DC stepper motor
Chart Rotation User configurable from 0.1 to 999.9 hours per revolution
Pen Type Disposable fiber tip
Pen Color Pen 1 - Red
Pen 2 - Green
Pen Response Time < 9 Seconds over chart span
Accuracy ±1% of chart span max. error from displayed value
Chart Rotation Accuracy ±.5% of chart rotation
Page 55

Appendix E
Software Record/Reference Sheet
PROGRAM MODE
Pen 1 Pen 2 Pen 1 Pen 2 unit
PAGE 55
Pen 1 Pen 2
inPS
iCor
AL1
AL2
dPos
EuPA
Euu
EuL
EuE
LFC
dP2
Euu2
EuL2
nPtS
iu1
iu2
iu3
iu4
iu5
iu6
iu7
iu8
iu9
iu10
iu11
iu12
iu13
iu14
iu15
iu16
iu17
iu18
iu19
iu20
Pu1
Pu2
Pu3
Pu4
Pu5
Pu6
Pu7
Pu8
Pu9
Pu10
Pi11
Pu12
Pu13
Pu14
Pu15
Pu16
Pu17
Pu18
Pu19
Pu20
HyAo
Prnd
dFF
PFF
Pout
Pou
PoL
Cru
CrL
PAEC
tSEL
trES
tdP
tFAC
tLFC
Ftb
PSS1
PSS2
PSS3
PoS
SCnr
rLyA
rLyb
rLyC
rLyd
rLyE
rLyF
rLyg
rLyH
CurA
Curb
CurC
Curd
CoAr
Cobr
CoCr
Codr
Crt
Coo
PAPu
CbS
CAd1
CAd2
ENABLE MODE
EtSt
ECAL
EPro
EASt
EdLS
EdLd
EPSA
DATA LOGGER
SETUP MODE
dAy
tod
ttLd
dAtE
YEAr
ALARM SET
Pen 1 Pen 2
PAL1
PAL2
bAro
PRESET ADJUST
Pen 1 Pen 2
PS1H
PS1L
PS2H
PS2L
PS3H
PS3L
Page 56

PAGE 56
Page 57

Warranty and Return Statement
These products are sold by The Partlow Corporation (Partlow) under the warranties set forth
in the following paragraphs. Such warranties are extended only with respect to a purchase of
these products, as new merchandise, directly from Partlow or from a Partlow distributor,
representative or reseller, and are extended only to the first buyer thereof who purchases
them other than for the purpose of resale.
Warranty
These products are warranted to be free from functional defects in materials and workmanship at the time the products leave the Partlow factory and to conform at that time to the
specifications set forth in the relevant Partlow instruction manual or manuals, sheet or sheets,
for such products for a period of three years.
THERE ARE NO EXPRESSED OR IMPLIED WARRANTIES WHICH EXTEND BEYOND
THE WARRANTIES HEREIN AND ABOVE SET FORTH. PARTLOW MAKES NO WARRANTY OF MERCHANTABILITY OR FITNESS FOR A PARTICULAR PURPOSE WITH
RESPECT TO THE PRODUCTS.
Limitations
PAGE 57
Partlow shall not be liable for any incidental damages, consequential damages, special
damages, or any other damages, costs or expenses excepting only the cost or expense of
repair or replacement as described above.
Products must be installed and maintained in accordance with Partlow instructions. Users are
responsible for the suitability of the products to their application. There is no warranty against
damage resulting from corrosion, misapplication, improper specifications or other operating
condition beyond our control. Claims against carriers for damage in transit must be filed by
the buyer.
This warranty is void if the purchaser uses non-factory approved replacement parts and
supplies or if the purchaser attempts to repair the product themselves or through a third party
without Partlow authorization.
Returns
Partlow’s sole and exclusive obligation and buyer’s sole and exclusive remedy under the
above warranty is limited to repairing or replacing (at Partlow’s option), free of charge, the
products which are reported in writing to Partlow at its main office indicated below.
Partlow is to be advised of return requests during normal business hours and such returns are
to include a statement of the observed deficiency. The buyer shall pre-pay shipping charges
for products returned and Partlow or its representative shall pay for the return of the products
to the buyer.
Approved returns should be sent to: PARTLOW CORPORATION
2 CAMPION ROAD
NEW HARTFORD, NY 13413 USA
 Loading...