

Page 1
Form 3029 • Price $32.00
The Partlow Corporation • Two Campion Rd. • New Hartford, NY 13413 USA • 315-797-2222 • FAX 315-797-0403
Edition 4 • © April 1997
CIRCLE CHART RECORDER; RECORDER CONTROLLER; RECORDER CONTROLLER
PROFILER FOR MEASURING AND CONTROLLING RELATIVE HUMIDITY
MRC 7700
Installation, W iring, Operation Manual
Page 2

PAGE 2
nformation in this installation, wiring, and operation
manual is subject to change without notice. One
I
of shipment. Extra copies are available at the price
published on the front cover.
Coyright © April 1997, The Partlow Corporation, all rights
reserved. No part of this publication may be
reproduced, transmitted, transcribed or stored in a
retrieval system, or translated into any language in any
form by any means without the written permission of the
Partlow Corporation.
This is the Fourth Edition of the MRC 7700 Recording Profile Controller Manual. It was written and produced entirely on a desk-top-publishing system. Disk versions are
available by written request to the Partlow Advertising and
Publications Department.
manual is provided with each instrument at the time
We are glad you decided to open this manual. It is written
so that you can take full advantage of the features of your
new MRC 7700 microbased chart recording profile
controller.
It is strongly recommended that Partlow equipped applications incorporate
a high or low limit protective device which will shut down the equipment
at a preset process condition in order to preclude possible damage to
NOTE
property or products.
!
CAUTION: READ THIS MANUAL
THE INTERNATIONAL HAZARD SYMBOL IS FOUND ADJACENT TO THE
PLA TEN HOLD DOWN SCREW. IT IS IMPORTANT T O READ THIS
MANUAL BEFORE INSTALLING OR COMMISSIONING THE UNIT.
Page 3

Table of Contents
SECTION 1 - GENERAL Page Number
1.1 Product Description 5
SECTION 2 - INSTALLATION & WIRING
2.1 Installation & Wiring 8
2.2 Unpacking 8
2.3 Location 8
2.4 Mounting 8
2.5 Preparation for Wiring 9
2.6 Wiring Connections 14
SECTION 3 - CONFIGURATION
3.1 Configuration (Set Up) 21
3.2 Configuration/Jumper Positioning 22
3.3 Operation Summary 22
3.4 Start Up Procedures 22
3.5 Front Panel Operation 23
PAGE 3
SECTION 4 - OPERATION
4.1 Operation 43
4.2 Alarm Operation 47
4.3 Tune Mode Operation 48
SECTION 5 - SERVICE
5.1 Service 51
5.2 Changing Charts 51
5.3 Changing Pens 51
5.4 Calibration 52
5.5 Test Mode 57
5.6 Troubleshooting and Diagnostics (Error Code Definitions) 61
APPENDICES
A - Board Layouts and Jumper Positioning
A-1 Processor Board 69
A-2 SPST Relay/SSR Driver Output Board 70
A-3 SPDT Relay/SSR Driver Output Board 71
A-4 Current Output Board 72
B - Glossary 73
C - Order Matrix 76
D - Product Specifications 77
E - Software Reference Sheet 81
F - Profile Developement Sheet 85
Warranty Inside back cover
Page 4

PAGE 4
FIGURES & TABLES
Figure 1-1 Recorder Description 5
Figure 1-2 Recorder Display 7
Figure 2-1 Installation Panel Dimensions Conduit 9
Opening Locations
Figure 2-2 Noise Suppression 11
Figure 2-3 Noise Suppression 11
Figure 2-4 Board and Terminal Locations 14
Figure 2-5 AC Power Input 15
Figure 2-6 Thermocouple Inputs 15
Figure 2-7 RTD Inputs 16
Figure 2-8 Milliamp and Volt Inputs 16
Figure 2-9 Remote Profile Run/Hold 17
Figure 2-10 Remote Setpoint Input VDC, mADC 17
Figure 2-11 Digital Communications 18
Figure 2-12 Relay Output 18
Figure 2-13 SSR Driver Output 19
Figure 2-14 Current Output 19
Figure 2-15 Transmitter Power Supply Input 20
Figure 2-16 Position Proportioning Control Output 20
Figure 3-1 Keypad Features 25
Figure 5-1 Changing Pens 50
Table 3-1 Program Mode Configuration Procedure 30
Table 3-2 Tune Mode Configuration Procedure 37
Table 3-3 Alarm Set Mode Calibration Procedure 39
Table 3-4 Profile Entry Mode Configuration Procedure 39
Table 3-5 Enable Mode Configuration Procedure 41
Table 4-1 Profile Continue Mode 44
Table 5-1 Calibration Procedures 53
Table 5-2 Test Procedures and Description 58
FLOW CHARTS
Flow - Calibration 52
Flow - Enable Mode 42
Flow - Program Mode 26
Flow - Test Mode 57
Flow - Tune Mode 36
Flow - Alarm Set 38
Page 5
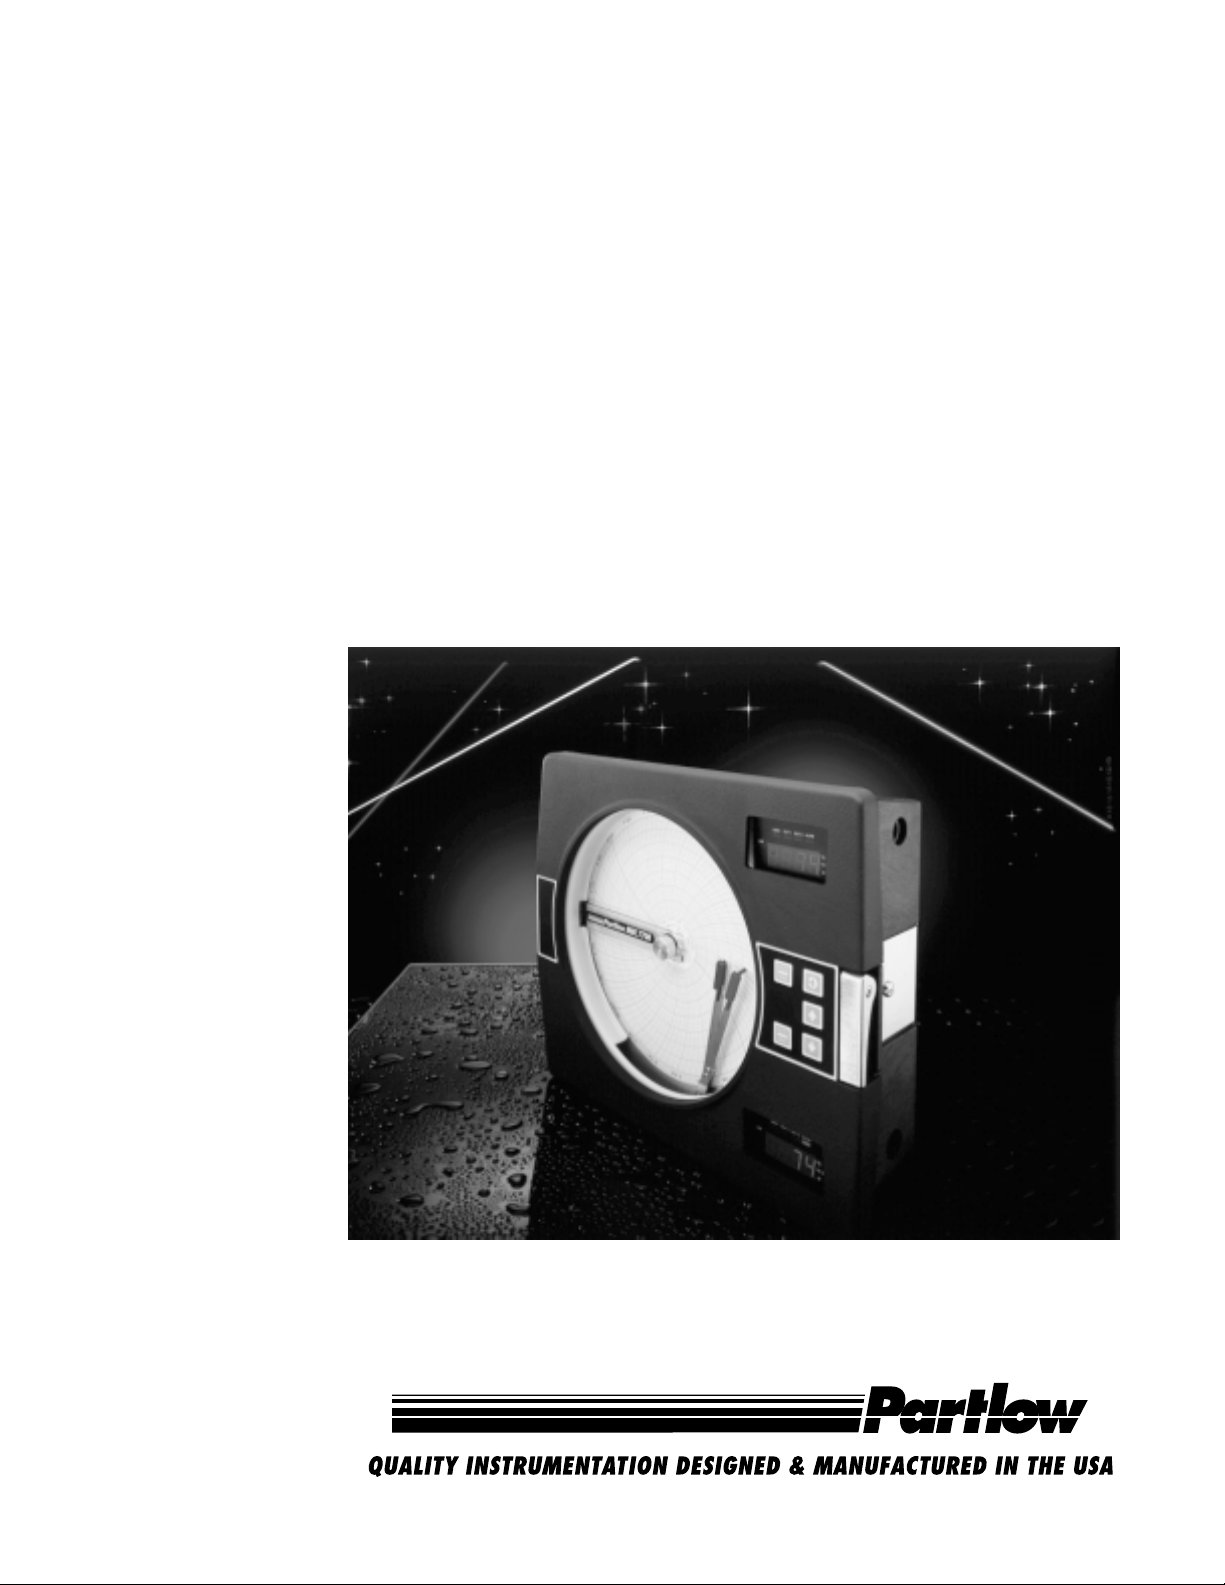
Product Description 1.1
1.1.1 GENERAL
The instrument is a microprocessor based circular chart Recording Profile Controller capable
of measuring, displaying, recording and controlling Relative Humidity and/or Temperature
using Dry Bulb and Wet Bulb temperatures from a variety of inputs. Two process sensor input
terminal boards are provided on each instrument. To perform the Relative Humidity calculations both inputs must be the same type. (2- RTD, 2-J T/C, for best results a matched pair of
sensors should be used). The instruments can be specified as either a single or as a dual pen
model. The second pen can be selected as a profile control or a single setpoint control.
Recording, control functions, alarm settings, profile entry and other parameters are easily
entered via the keypad. All user data can be protected from unauthorized changes by the
Enable mode security system, and is protected against memory loss, as a result of AC power
outage, by battery back-up.
The process sensor input for each terminal board is user configurable to directly connect to
either thermocouple, RTD, VDC, or mADC inputs. Changes in input type can easily be made
by the user. Thermocouple and RTD linearization, as well as thermocouple cold junction
compensation, are performed automatically. The instrument process variable inputs are
isolated. An isolated 24 VDC regulated transmitter power supply can be provided in the
instrument for use with up to two 4 to 20 mADC process sensor transducers.
PAGE 5
The instrument can be ordered to operate on either 115 VAC or 230 VAC power at 50/60 Hz.
The 230 VAC option includes a switch for selecting either 230 VAC or 115 VAC operation.The
Instrument is housed in a structural foam enclosure suitable for panel or surface mounting.
FIGURE 1-1
Pen 1 Display
Pen 1 Reset Key
Scroll Key
Up Key
Down Key
Pen 2 Reset Key
Pen 2 Display
Page 6

PAGE 6
1.1.2 RECORDING
The instrument records the selected process variable on a 10-inch circular chart. One box of
standard charts is provided with each recorder. Charts are available in a wide selection of
ranges. Chart rotation speed is programmable from 0.1 to 999.9 hours per revolution in 0.1
hour increments. The instrument can be ordered with one or two pens. Pen 1 is red and Pen 2
is green. Pens are the disposable fiber-tip type.
1.1.3 DISPLAYS
Each instrument is provided with a digital display and status indicator for each pen provided
(See Figure 1-1). The display may be configured to display the Dry Bulb Temperature, Wet
Bulb Temperature, or the Relative Humidity as the process value. During configuration the
display(s) is/are used to show the enabled modes of operation and the parameter codes.
The display in the upper right corner is for Pen 1, the display in the lower right corner is for
Pen 2 (if provided). The upper display provides status indication for the Manual mode
operation, Output 1, Output 2, Alarm , Setpoint, negative value, degrees C, degrees F, and
engineering units, Ramp, Soak and six Segment lamps. The lower display( if provided)
includes status indicators for Manual mode operation, Output 1, Output 2 , Alarm, Setpoint,
negative value, degrees C, degrees F, engineering units. (Relative Humidity will be indicated
in engineering units.) See Figure 1-2 (page 7).
Display resolution is programmable for 0.1 or 1 degree for thermocouple and RTD inputs, and
none, one, two or three decimal places for other input types. Relative Humidity will be
indicated as whole numbers only.
1.1.4 CONTROL
The instrument can be provided with relay, solid state relay driver and milliamp DC outputs.
Instruments can be programmed for on-off, time proportioning, current proportioning or
position proportioning control depending upon the output(s) present. Relay(s) and Solid State
Relay Driver(s) may be assigned to be on or off during the profile ramp and soak of a profile
segment. Switching between the Control mode and the Manual mode of operation is easily
accomplished with a dedicated key on the keypad. Switching is bumpless from the Control to
the Manual mode, and while in manual, adjustment of proportional outputs is possible. Each
pen of a dual pen recording controller is provided with its own AUTO/MANUAL key . Other
standard control features include proportional control output limits, setpoint limits, anti-reset
windup and a unique Automatic Transfer function. If configured, the Automatic Transfer
function allows manual control of the proportional output until the process reaches the setpoint
at which time the instrument will go into the Control mode of operation.
1.1.5 ALARM
An Alarm indicator is standard for each pen. Two alarm functions are provided for each pen
and the alarm indicator will light if either alarm for that pen is on. Alarm settings are programmable. Alarm type may be selected as process direct or reverse (high or low), deviation from
setpoint direct or reverse, and deviation band open or closed within the band. Alarm outputs
can be provided by assigning any relay(s) Single Pole/Single Throw (SPST) or Solid State
Relay (SSR) driver to the respective alarm.
1.1.6 PROCESS VALUE RE-TRANSMISSION OUTPUT
If an instrument is specified with mADC current output(s), any of the outputs may be programmed to operate as a process value re-transmission output. The output is scaleable but
can not be used as a control output while assigned as a process value re-transmission output.
Page 7
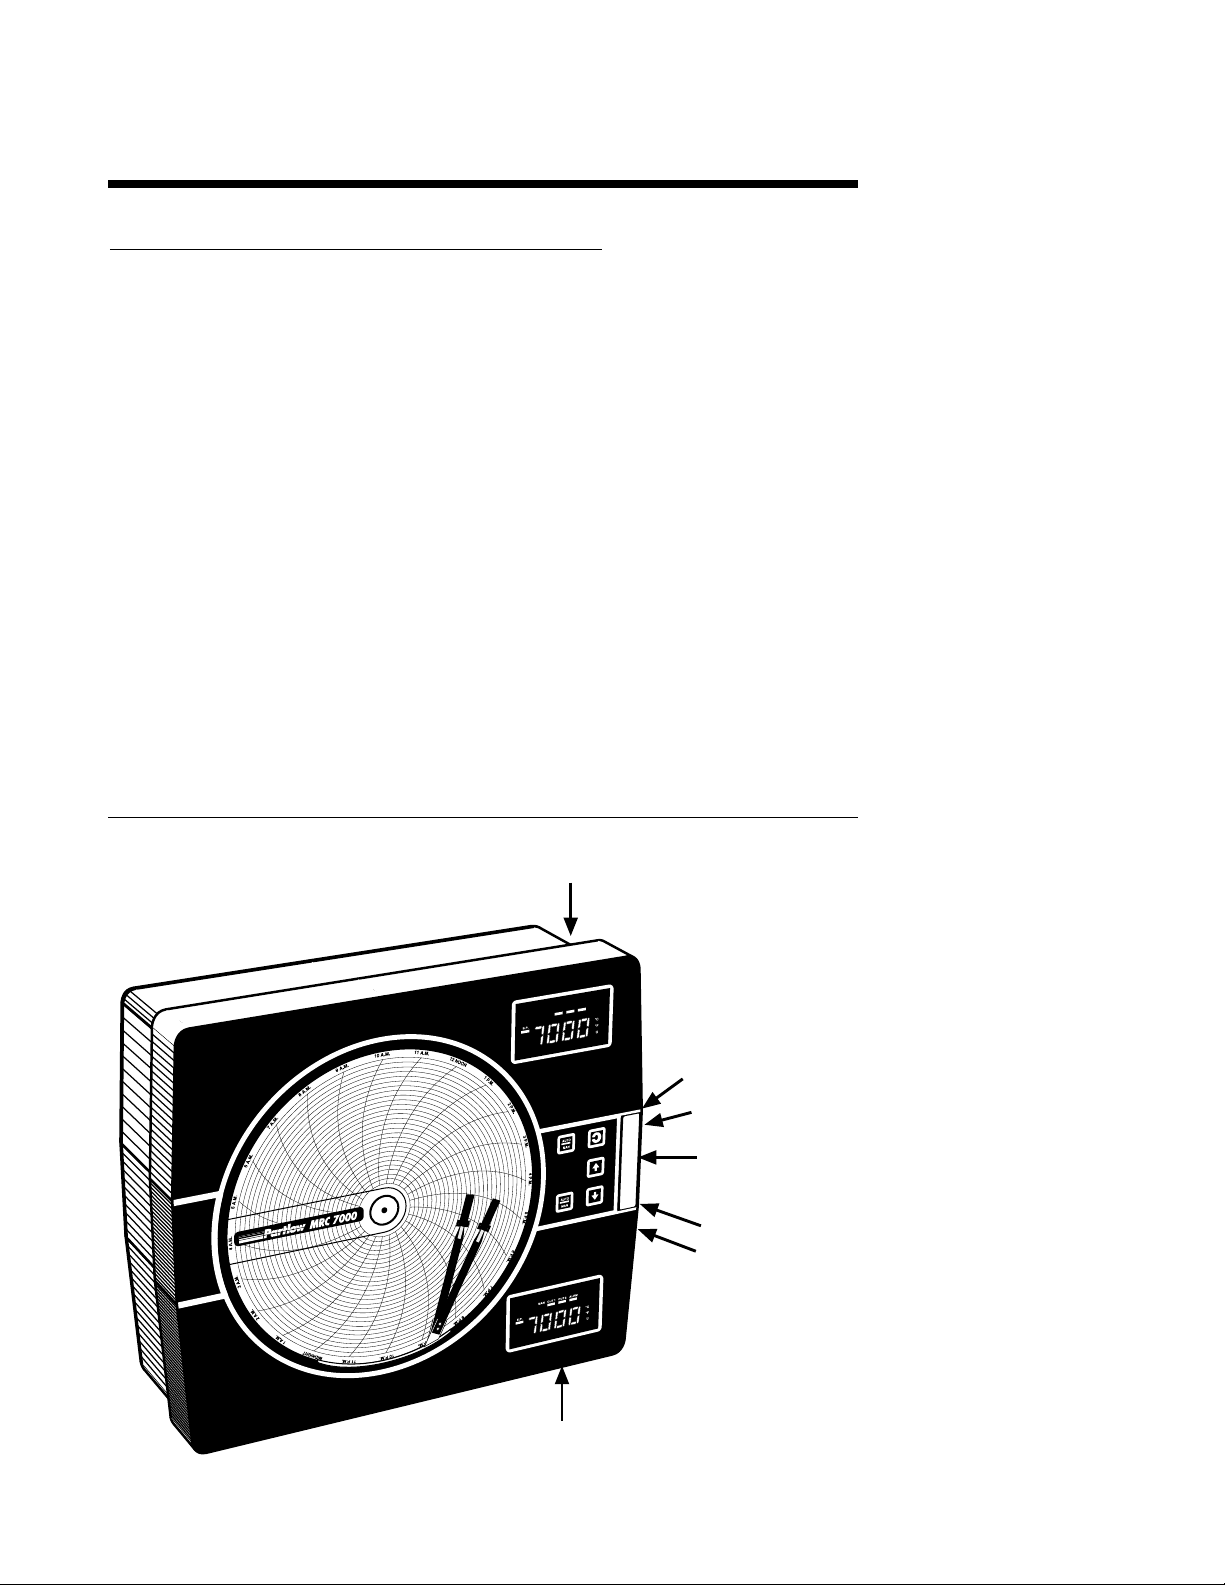
1.1.7 DIGITAL COMMUNICATIONS
The instrument can be ordered with a Digital Communications option that provides the
capability of bi-directional communications with a supervisory computer. A dual pen
instrument can have an individual address selected for each pen.
FIGURE 1-2
Pen 1 Display
PAGE 7
Setpoint
Minus
Sign
Setpoint
SEG1
RAMP SOAK
SP
SEG2 SEG3 SEG4 SEG5 SEG6
OUT2OUT1MAN
ALRM
Digital Display
Pen 2 Display (if Present)
Manual
Output 1
MAN
SP
Output 2
OUT2OUT1
ALRM
Alarm
C
F
U
Minus
Sign
C
F
U
Digital Display
Page 8

PAGE 8
Installation and Wiring 2.1
Read these instructions carefully before proceeding with installation and operation. Electrical
code requirements and safety standards should be observed. Installation should be performed
by qualified personnel.
CAUTION: The Instrument AC power input is specified in the model number and on the wiring label
affixed to the the top center of the platen. Verify the AC power input required by the instrument prior
to proceeding with installation.
Unpacking 2.2
Remove the instrument from the carton and inspect for any damage due to shipment. If any
damage is noticed due to transit, report and file a claim with the carrier. Write the model
number and serial number of the instrument on the inside of the front cover of this Operation
Manual for future reference.
Location 2.3
Locate the instrument away from excessive moisture, oil, dust, and vibration. Do not subject
the instrument to operating temperatures outside of the 0 to 55° C (32 to 131° F) range.
Mounting 2.4
Figure 2-1 (page 9) shows an installation view and physical dimensions for a panel mounted
instrument.
The panel where the instrument will be mounted must provide rigid support for the approximately 20 pound instrument. Adjacent instruments may be mounted within a minimum of 2
inches horizontally and 3 inches vertically, providing that proper panel support is supplied.
PANEL MOUNTING HARDWARE REQUIRED: (not provided with instrument)
(4) 1/4"-20 x 2" flat head bolts w/nuts
(4) appropriate lock washers
PANEL MOUNTING:
1) Cut panel opening to the dimensions illustrated in Figure 2-1 (page 9).
2) Insert the instrument in the panel opening. Firmly fasten the instrument to the panel using
the nuts, bolts and lock washers.
SURFACE MOUNTING:
1) Install the mounting brackets, ordered separately, on the vertical sides of
instrument housing. Use the brackets to fasten the instrument to the surface.
Page 9
FIGURE 2-1
)
EC1
5
1
12
7
8
2
20.7 mm)
(190.5 mm)
1
15
(384.2 mm)
8
WIDTH OF COVER
19
(65.9 mm)2
32
9
DIA.(7.1mm)
32
1
(342.5 mm)
13
2
15
( 354 mm)
13
16
Panel cut-out for flush mounting
PAGE 9
16
mm
1
2
(64 mm)
2
2.5"
63.5mm
4
16
Preparations for Wiring 2.5
2.5.1 WIRING GUIDELINES
Electrical noise is a phenomenon typical of industrial environments. The following are guidelines that must be followed to minimize the effect of noise upon any instrumentation.
2.5.1.1 INSTALLATION CONSIDERATIONS
Listed below are some of the common sources of electrical noise in the industrial environment:
• Ignition Transformers
• Arc Welders
• Mechanical contact relay(s)
• Solenoids
Before using any instrument near the devices listed, the instructions below should be
followed:
1. If the instrument is to be mounted in the same panel as any of the listed devices,
separate them by the largest distance possible. For maximum electrical noise
reduction, the noise generating devices should be mounted in a separate
enclosure.
2. If possible, eliminate mechanical contact relay(s) and replace with solid state
relays. If a mechanical relay being powered by an instrument output device
cannot be replaced, a solid state relay can be interposed to isolate the
instrument.
3. A separate isolation transformer to feed only instrumentation should be
considered. The transformer can isolate the instrument from noise found on the
AC power input.
4. If the instrument is being installed on existing equipment, the wiring in the area
should be checked to insure that good wiring practices have been followed.
Page 10

PAGE 10
2.5.1.2 AC POWER WIRING
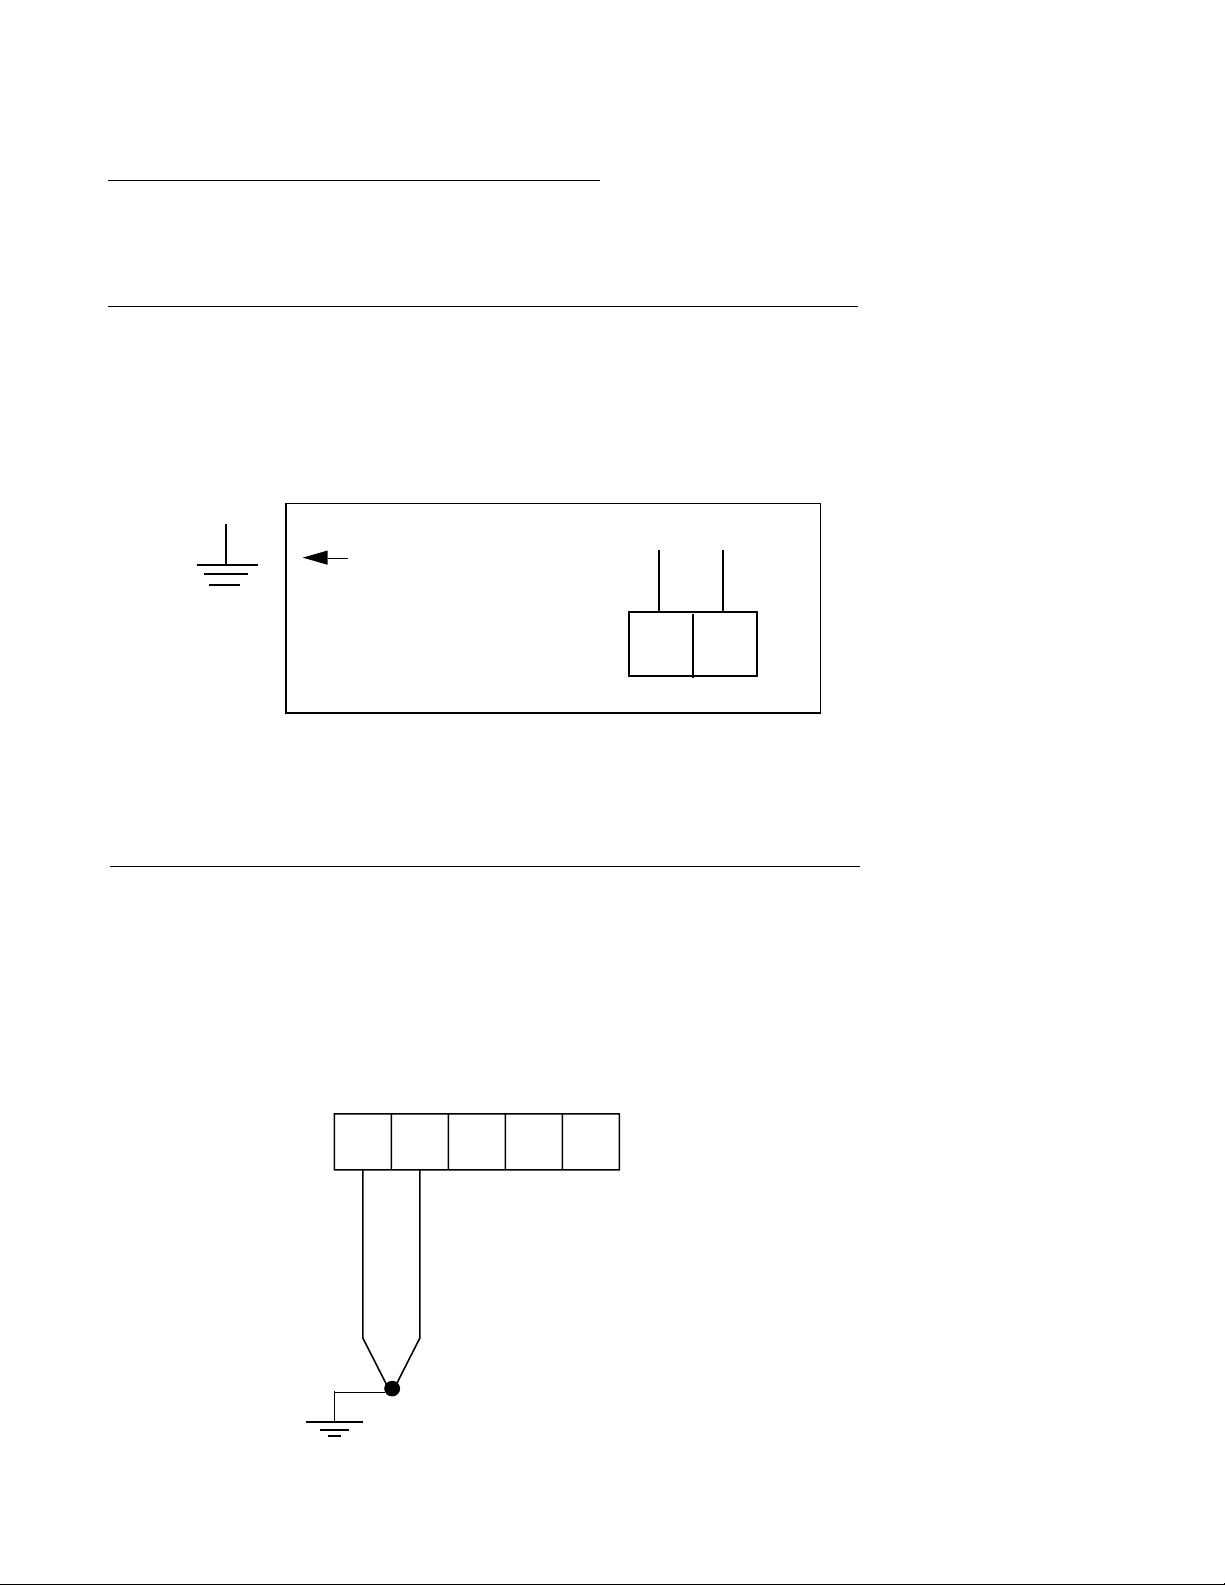
Earth Ground
The instrument includes noise suppression components that require an earth ground
connection to function. To verify that a good earth ground being is attached, make a
resistance check from the instrument chassis to the nearest metal water pipe or proven earth
ground. This reading should not exceed 100 ohms.
Neutral (For 115VAC)
It is good practice to assure that the AC neutral is at or near ground potential. To verify this, a
voltmeter check between neutral and ground should be done. On the AC range, the reading
should not be more than 50 millivolts. If it is greater than this amount, the secondary of this
AC transformer supplying the instrument should be checked by an electrician. A proper
neutral will help ensure maximum performance from the instrument.
2.5.1.3 WIRE ISOLATION/SEGRATION
The instrument is designed to promote proper separation of the wiring groups that connect to
the instrument. The AC power wire terminals are located near the top of the instrument
boards. The analog signal terminals are located near the bottom of the instrument boards.
Maintain this seperation of the wires to insure the best protection from electrical noise. If the
wires need to be run parallel with any other wiring type(s), maintain a minimum 6 inch space
between the wires. If wires must cross each other, do so at 90 degrees to minimize the
contact with each other and reduces cross talk. Cross talk is due to the EMF (Electro
Magnetic Flux) emitted by a wire as current passes through it.
2.5.1.4 USE OF SHIELDED CABLE
Shielded cable helps eliminate electrical noise being induced on the wires. All analog signals
should be run with shielded cable. Connection lead length should be kept as short as possible, keeping the wires protected by the shielding. The shield should be grounded at one end
only. The preferred grounding location is at the sensor, transmitter or transducer.
2.5.1.5 NOISE SUPPRESSION AT THE SOURCE
Usually, when good wiring practices are followed, no further noise protection is necessary.
Sometimes in severe electrical environments, the amount of noise is so great that it has to be
suppressed at the source. Many manufacturers of relays, contactors, etc., supply "surge
suppressors" which mount on the noise source.
For those devices that do not have surge suppressors supplied, RC (resistance-capacitance)
networks and/or MOV (metal oxide varistors) may be added.
Inductive Coils - MOV's are recommended for transient suppression in inductive coils connected in parallel and as close as possible to the coil. See Figure 2-2. Additional protection
may be provided by adding an RC network across the MOV.
Contacts - Arcing may occur across contacts when the contact opens and closes. This results
in electrical noise as well as damage to the contacts. Connecting a RC network properly
sized can eliminate this arc.
For circuits up to 3 amps, a combination of a 47 ohms resistor and 0.1 microfarad capacitor
(1000 volts) is recommended. For circuits from 3 to 5 amps, connect 2 of these in parallel.
See Figure 2-3.
Page 11
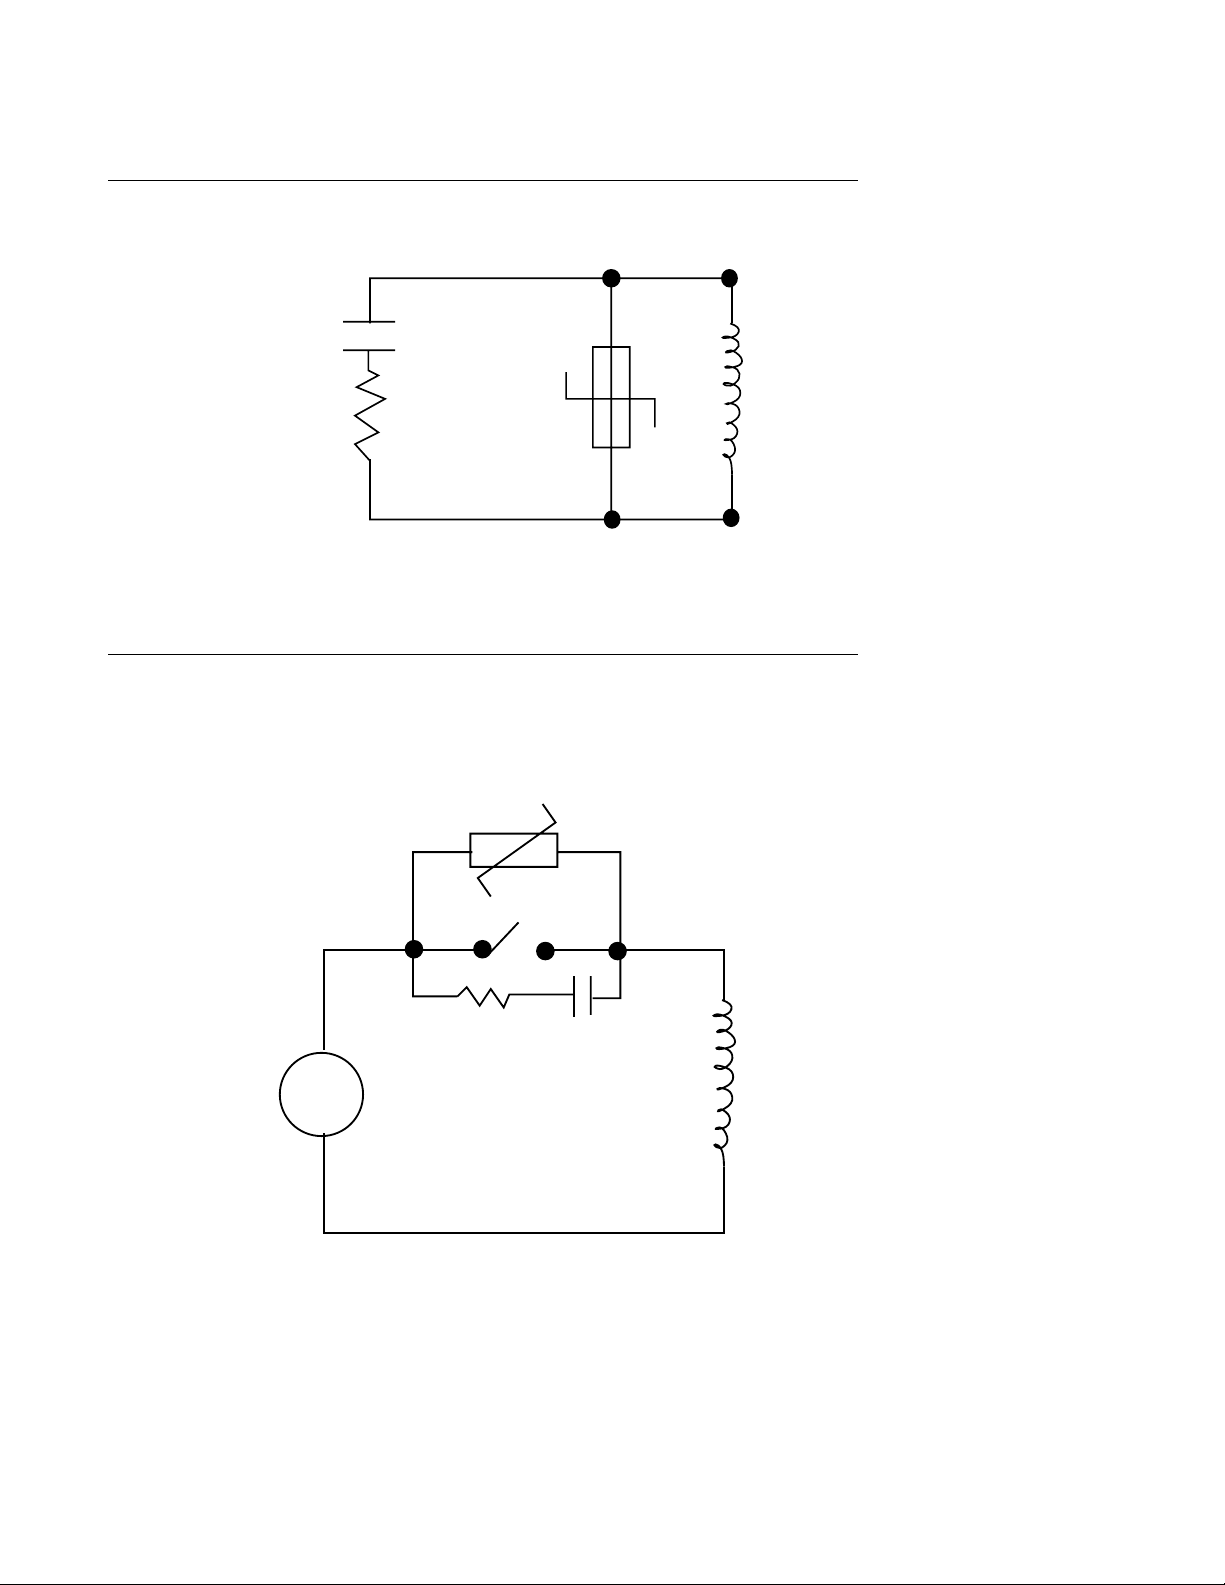
FIGURE 2-2
FIGURE 2-3
0.5
mfd
1000V
220
ohms
115V 1/4W
230V 1W
PAGE 11
Inductive
Load
AC
MOV
R
C
Inductive
Load
Page 12

PAGE 12
2.5.2 SENSOR PLACEMENT (Thermocouple or RTD)
If the temperature probe is to be subjected to corrosive or abrasive conditions, it should be
protected by the appropriate thermowell. The probe should be positioned to reflect true
process temperature:
In liquid media - the most agitated area.
In air - the best circulated area.
THERMOCUPLE LEAD RESISTANCE
Thermocouple lead length can affect instrument accuracy since the size (gauge) and the
length of the wire affect lead resistance.
To determine the temperature error resulting from the lead length resistance, use the following
equation:
Terr = TLe * L where; TLe = value from apropriate Table
L = length of leadwire in thousands of feet
TABLE 1
Temperature Error in °C per 1000 feet of leadwire
AWG Thermocouple Type
No. J K T R S E B N C
10 0.68 1.71 0.76 2.05 2.12 1.15 14.00 2.94 2.53
12 1.08 2.68 1.21 3.30 3.29 1.82 22.00 4.68 4.07
14 1.74 4.29 1.95 5.34 5.29 2.92 35.00 7.44 6.37
16 2.74 6.76 3.08 8.30 8.35 4.60 55.50 11.82 10.11
18 4.44 11.00 5.00 13.52 13.65 7.47 88.50 18.80 16.26
20 7.14 17.24 7.84 21.59 21.76 11.78 141.00 29.88 25.82
24 17.56 43.82 19.82 54.32 54.59 29.67 356.50 75.59 65.27
TABLE 2
Temperature Error in °F per 1000 feet of leadwire
AWG Thermocouple Type
No. J K T R S E B N C
10 1.22 3.07 1.37 3.68 3.81 2.07 25.20 5.30 4.55
12 1.94 4.82 2.18 5.93 5.93 3.27 39.60 8.42 7.32
14 3.13 7.73 3.51 9.61 9.53 5.25 63.00 13.38 11.47
16 4.93 12.18 5.54 14.93 15.04 8.28 99.90 21.28 18.20
18 7.99 19.80 9.00 24.34 24.56 13.44 159.30 33.85 29.27
20 12.85 31.02 14.12 38.86 39.18 21.21 253.80 53.79 46.68
24 31.61 78.88 35.67 97.77 98.26 53.40 641.70 136.07 117.49
Example
A recorder is to be located in a control room 660 feet away from the process. Usinging 16
AWG, type J themrocouple, how much error is induced?
Terr = TLe * L
TLe = 4.93 (°F/1000 ft) from Table 2
Terr = 4.93 (°F/1000 ft) * 660 ft
Terr = 3.3°F
Page 13

RTD LEAD RESISTANCE
RTD lead length can affect instrument accuracy. Size (gauge) and length of the wire used
affects lead length resistance.
To determine the temperature error resulting from the lead length resistance, use the following
equation:
Terr = TLe * L where; TLe = value from Table 3 if 3-wire or Table 4 if 2-wire
L = length of leadwire in thousands of feet
TABLE 3 3 Wire RTD
AWG No. Error °C Error °F
10 +/-0.04 +/-0.07
12 +/-0.07 +/-0.11
14 +/-0.10 +/-0.18
16 +/-0.16 +/-0.29
18 +/-0.26 +/-0.46
20 +/-0.41 +/-0.73
24 +/-0.65 +/-1.17
TABLE 4 2 Wire RTD
PAGE 13
AWG No. Error °C Error °F
10 +/-5.32 +/-9.31
12 +/-9.31 +/-14.6
14 +/-13.3 +/-23.9
16 +/-21.3 +/-38.6
18 +/-34.6 +/-61.2
20 +/-54.5 +/-97.1
24 +/-86.5 +/-155.6
Example
An application uses 2000 feet of 18 AWG copper lead wire for a 3-wire RTD sensor. What is
the worst case error due to this leadwire length?
Terr = TLe * L
TLe = +/- .46 (°F/1000 ft) from Table 1
Terr = +/- .46 (°f/1000 ft) * 2000 feet
Terr = +/- 0.92 °F
Page 14
PAGE 14
Wiring Connections 2.6
All wiring connections are typically made to the instrument at the time of installation. Connections are made at the terminal boards provided, two 12 gauge wires maximum, using copper
conductors only, except thermocouple inputs. Terminal blocks are designated TB1 through
TB13. See Figure 2-2 for the terminal block locations. The number of terminal blocks present
on the instrument depend upon the model number/hardware configuration.
FIGURE 2-4
Processor Board
TB 2
1 2
TB3 TB4
TB5
1 2 1 2 3 4 5 1 2 3 4 5
12
TB1
1 2 3 4 1 2 3 4 1 2 3 4
TB6
RELAY/SSR Driver
Board
TB7
TB8
TB9
1 2 3 4
Current Output Board
TB10 TB11 TB12 TB13
1 2
1 2 1 2 1 2
2.6.1 ELECTRICAL CONDUIT OPENINGS
The instrument case will have 3 or 4 conduit openings, depending upon the number of outputs
specified. To help minimize electrical noise that may adversely affect the operation of the
instrument, the wires groups indicated below should be routed through the conduit opening
specified. See Figure 2-1 for conduit opening locations.
EC1- AC Power Input
EC2- Analog input and mADC outputs
EC3- SPST or SPDT relay or SSR driver outputs
EC4- SPST or SPDT relay or SSR driver outputs (provided when > 4 relays & SSR Drivers
total are specified)
Unused conduit openings should be sealed.
Page 15
2.6.2 AC POWER WIRING CONNECTIONS
WARNING: Avoid electrical shock. AC power wiring must not be connected at the source distribution
panel until all wiring connections are completed.
FIGURE 2-5
AC Instrument Power Input
Connect the 115 VAC hot and neutral to terminals 1 and 2 respectively of TB1. See Figure 2-4
(page 14) for Terminal Block locations on the instrument. Connect the 230 VAC one leg to
each terminal, be sure to check the position of the Voltage Selector switch provided with 230
VAC instruments. The switch position must match the voltage input to the instrument.
PAGE 15
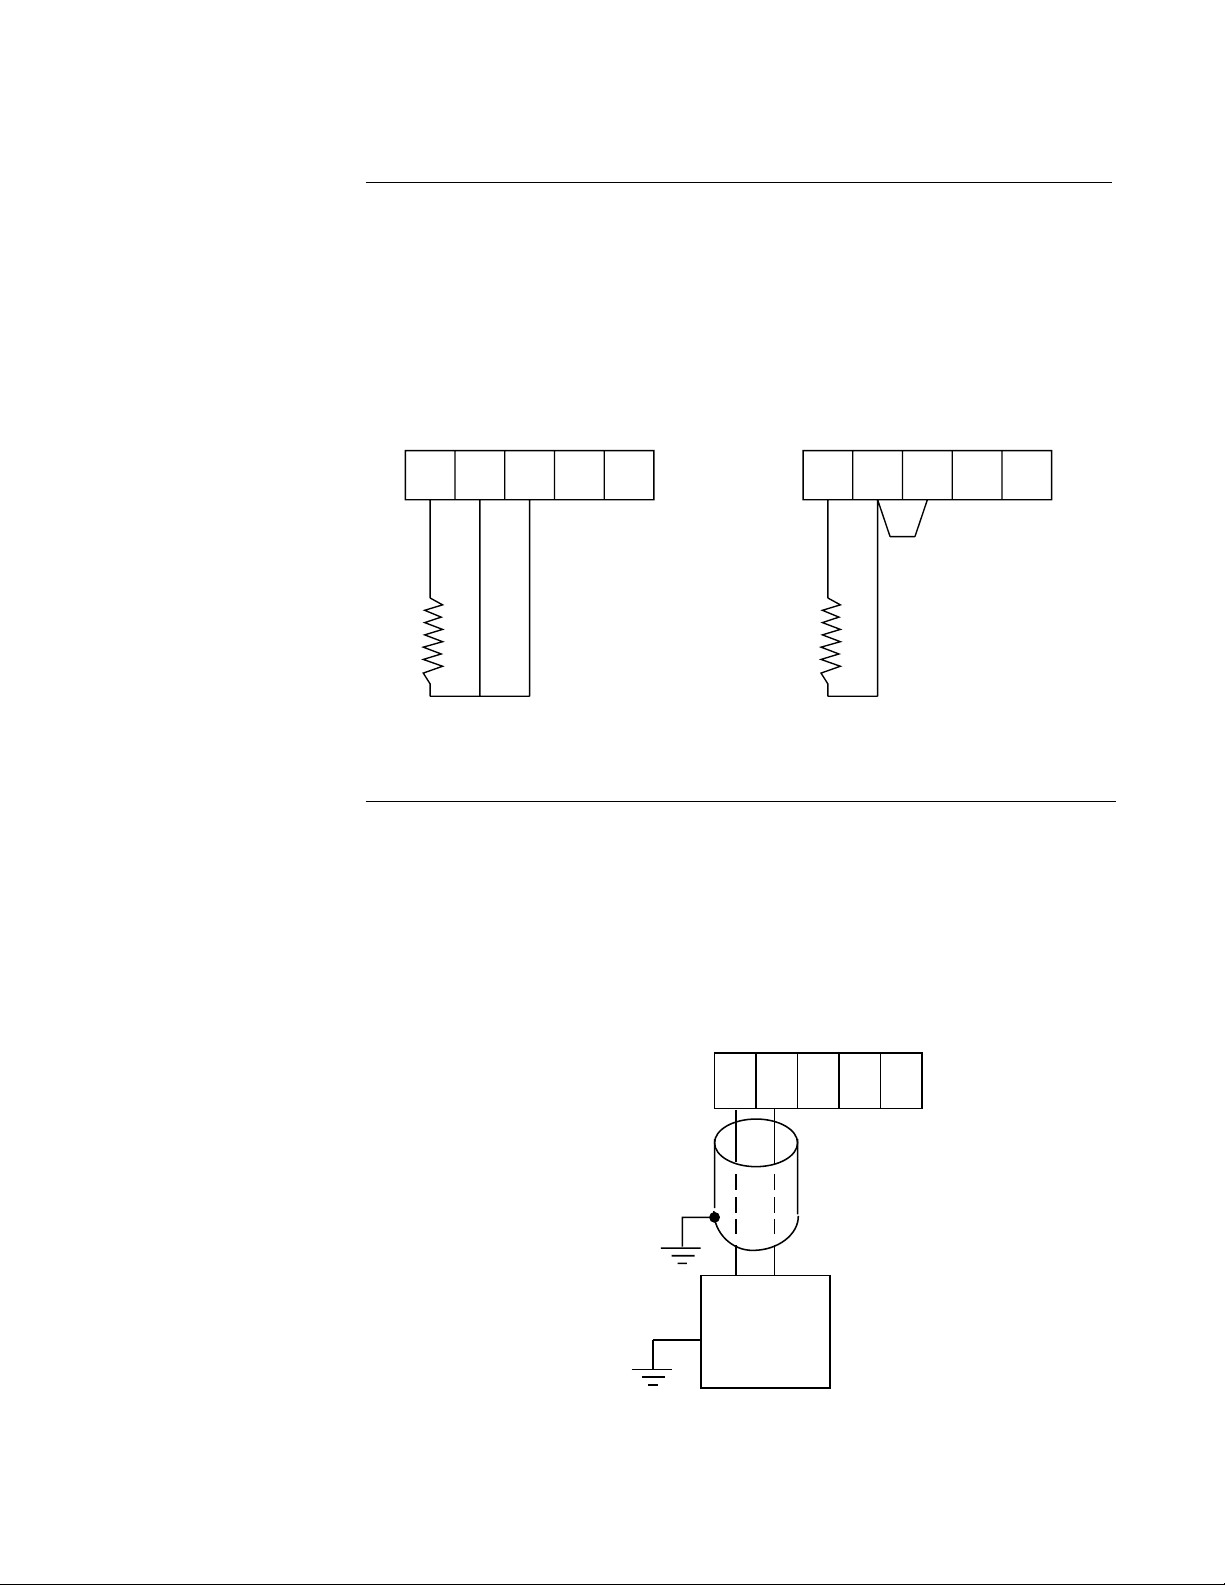
Connect the AC
ground at the
green ground screw
on the left side of
the inside of the
case
FIGURE 2-6
Thermocouple Inputs
For Relative Humidity calculations both sensor inputs must be the same kind. For best results,
a matched pair of sensors should be used.
Wet Bulb input. Connect the positive leg of the thermocouple to terminal 1, and the negative
to terminal 2. Be sure that the input conditioning jumpers are properly positioned for a
thermocouple input. See Appendix A-1 (page 68).
Use TB4 for the Dry Bulb input, and TB5 for the
Line 1
~
TB1
Line 2
~
12
TB4 and TB5
+
1
-
2
4
3
Grounded or
Ungrounded
Thermocouples
may be used
5
Page 16
PAGE 16
FIGURE 2-7
RTD Inputs
For Relative Humidity calculations both sensor inputs must be the same kind. For best
results, a matched pair of sensors should be used.
for the Wet Bulb input. Connections are shown for 3 wire and 2 wire RTD inputs. If a three
wire device is used, install the common legs to terminals 2 and 3. If a two wire device is used,
install a jumper between terminals 2 and 3. Be sure that the input conditioning jumpers are
properly positioned for an RTD input. See Appendix A-1 (page 68).
Use TB4 for the Dry Bulb input, and TB5
TB4 and TB5
-
+
12
345
TB4 and TB5
-
+
12
345
Jumper
SUPPLIED BY
CUSTOMER
3 Wire RTD 2 Wire RTD
FIGURE 2-8
Volt and milliamp Input
Make the volt and milliamp connections as shown below. Use TB4 for the Dry Bulb input, and
TB5 for the Wet Bulb input. Terminal 1 is positive and terminal 2 is negative. The milliamp
input requires the installation of an appropriate shunt resistor (ordered separately) between
terminals 1 and 2. Be sure that input conditioning jumpers are in the correct positions for the
input being connected. See Appendix A-1 (Page 68).
NOTE: Fault detection
is not functional
for 0-5V or 0-20mA
inputs
TB4 and TB5
+-
12345
SHIELDED
TWISTED
PAIR
+ -
SOURCE
MAY BE
GROUNDED
OR
UNGROUNDED
Page 17
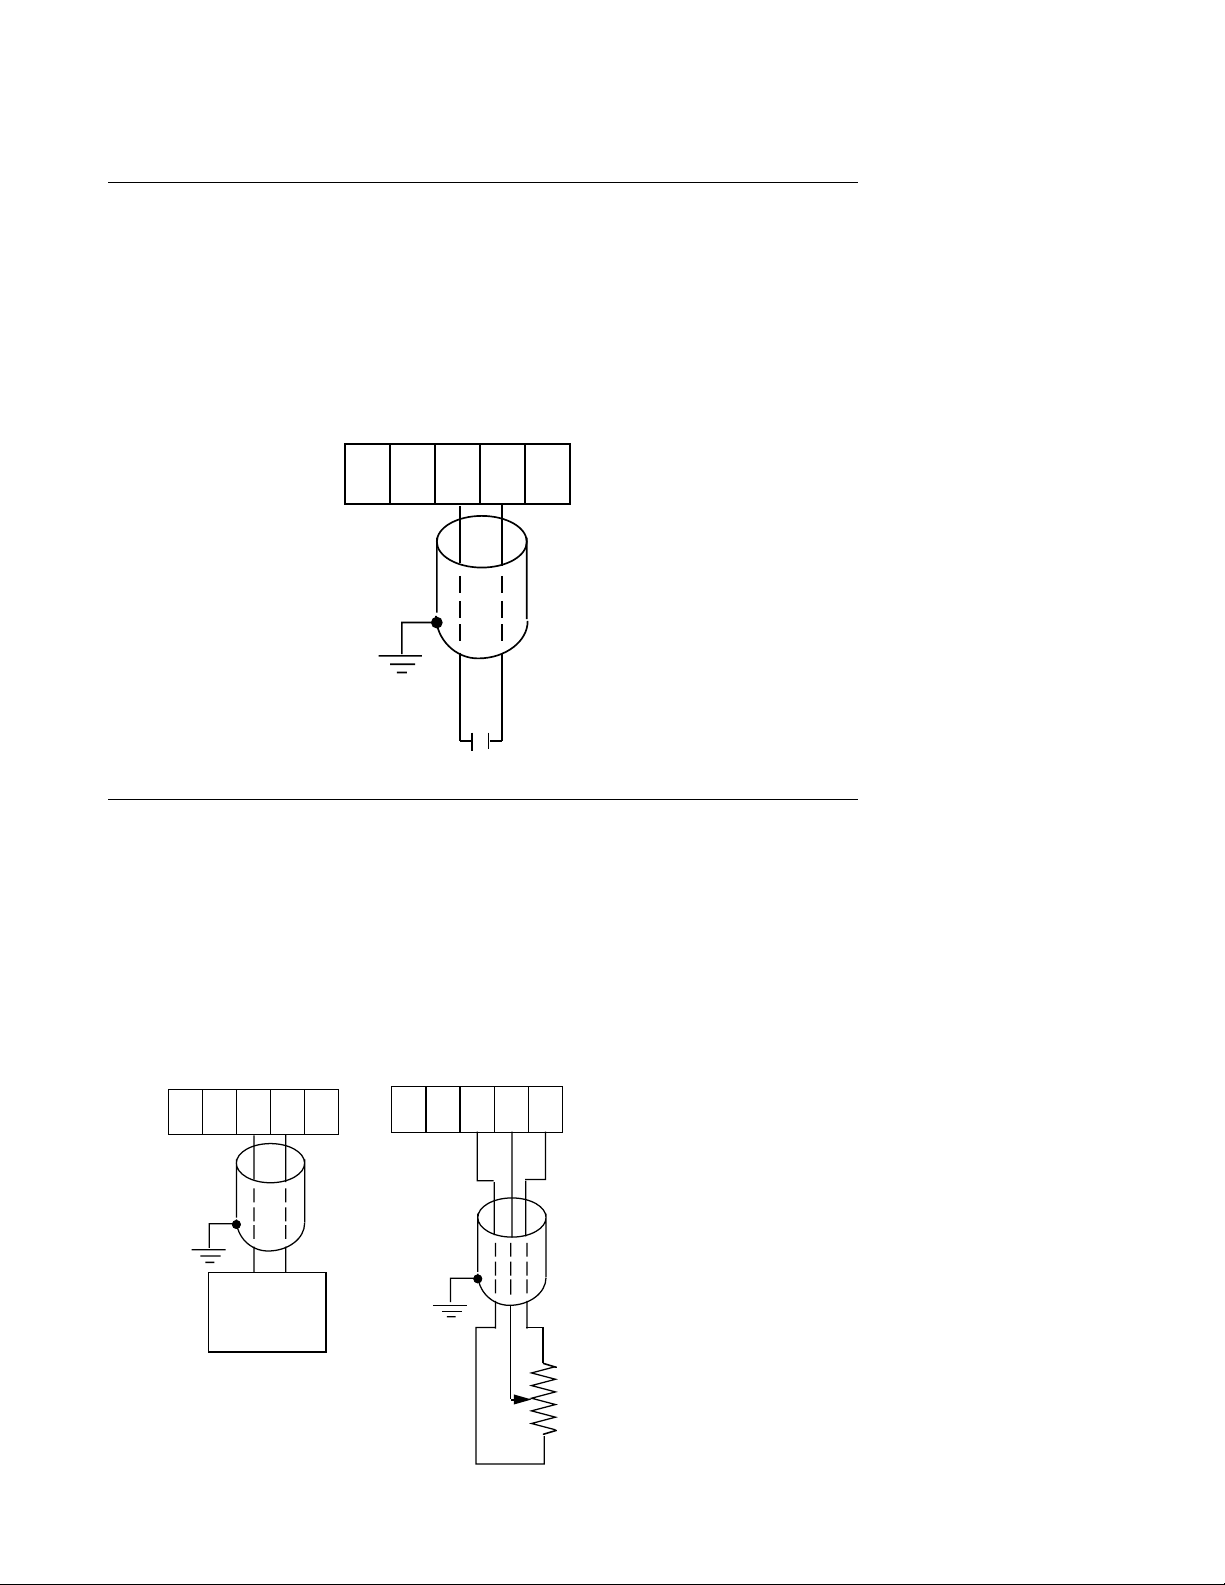
FIGURE 2-9
Remote Profile Run/Hold
If the Remote Run/Hold option has been specified, make the connections as shown. The
Remote Run/Hold option provides the capability of halting and restarting a running profile
from the operation of a remote contact closure. The operation of the Remote Run/Hold is
determined by the Program mode parameter selected. The closure of a remote dry contact
will cause the profile to hold. Re-opening the contact will cause the profile to continue to run
from the point at which it was halted. If both pens on a dual pen instrument are selected to
profile control the Remote Run/Hold will affect the operation of both pens.
TB4
+
-
12345
SHIELDED
TWISTED
PAIR
REMOTE
DRY
CONTACT
PAGE 17
FIGURE 2-10
Remote Setpoint Input VDC, mADC (Optional for the second pen of dual pen instruments)
If Remote Setpoint option has been specified, make connections as shown. The remote
setpoint input may be selected as either 0 to 5 VDC or 1 to 5 VDC input in the Program mode
section. Make sure the configuration properly matches the input used. Connect the positive
lead to terminal 4, and the negative lead to terminal 3 (Terminal 3 is the ground, terminal 4 is
the input, terminal 5 is 5 VDC.) If a 4 to 20 mADC remote setpoint is to be used, the instrument remote setpoint input should be configured for 1 to 5VDC in the Program mode, and a
250 ohm resistor should be installed across terminals 4 and 3.
TB4 or TB5
+
-
12345
SHIELDED
TWISTED
PAIR
+ -
SOURCE
TB4 or TB5
+
-
12345
SHIELDED
MULTI-CONDUCTOR
CABLE
150 OHM
TO 10K OHM
POTENTIOMETER
Page 18
PAGE 18
FIGURE 2-11
Digital Communications Options
Connections are made as shown using TB2. Refer to the Protocol Manual, Form #2878 for
more details regarding the connections and how to use this option. This document is provided
only when this option has been specified. If the communications network continues on to other
instruments, connect the cable shields together, but not to the instrument. A terminating
resistor should be installed at the terminals of the last unit in the communications loop. If the
communications network ends at the instrument, the shield is not connected.
TB2
Serial A
Serial B
1
2
TOWARD THE
COMPUTER
NETWORK
CONTINUATION
(IF APPLICABLE)
2.6.4 OUTPUT CONNECTIONS
Relay output(s), if provided in the instrument, may be assigned to control or alarm output
functions for Pen 1 and/or Pen 2 (if present). Current outputs may be assigned to control and
process value retransmission output for Pen 1 and/or Pen 2 (if present). The assignment of
the output function (s) are/is accomplished in the Program mode. SPST relay and/or SSR
driver output(s) is/are designated as Relay A through Relay H. SPST relays begin with Relay
A designation, then B, C, etc. SSR drivers begin with Relay H designation then G, F, etc.
except when 4 SSR drivers are required in conjunction with SPDT relays, then designation E
& F are not available. SSR driver designation becomes G, H, D, and C. SPDT relay output(s)
are designated as Relay A and Relay B only.
FIGURE 2-12A
SPST Relay Output
Connections are made to relays A through F as shown. Terminal connections are made using
TB6 (Relay/SSR Driver A, B), TB7 (Relay/SSR Driver C, D) and TB8 (Relay/SSR Driver E, F).
HOT
NEU
POWER
LOAD
1234
N.O.
C N.O. C
TB6 Relay A & B, Relay A Terminals 1 & 2
TB7 Relay C & D, Relay C Terminals 1 & 2
TB8 Relay E & F, Relay D Terminals 1 & 2
5 AMPERES
MAXIMUM
AT 115 VAC
Page 19
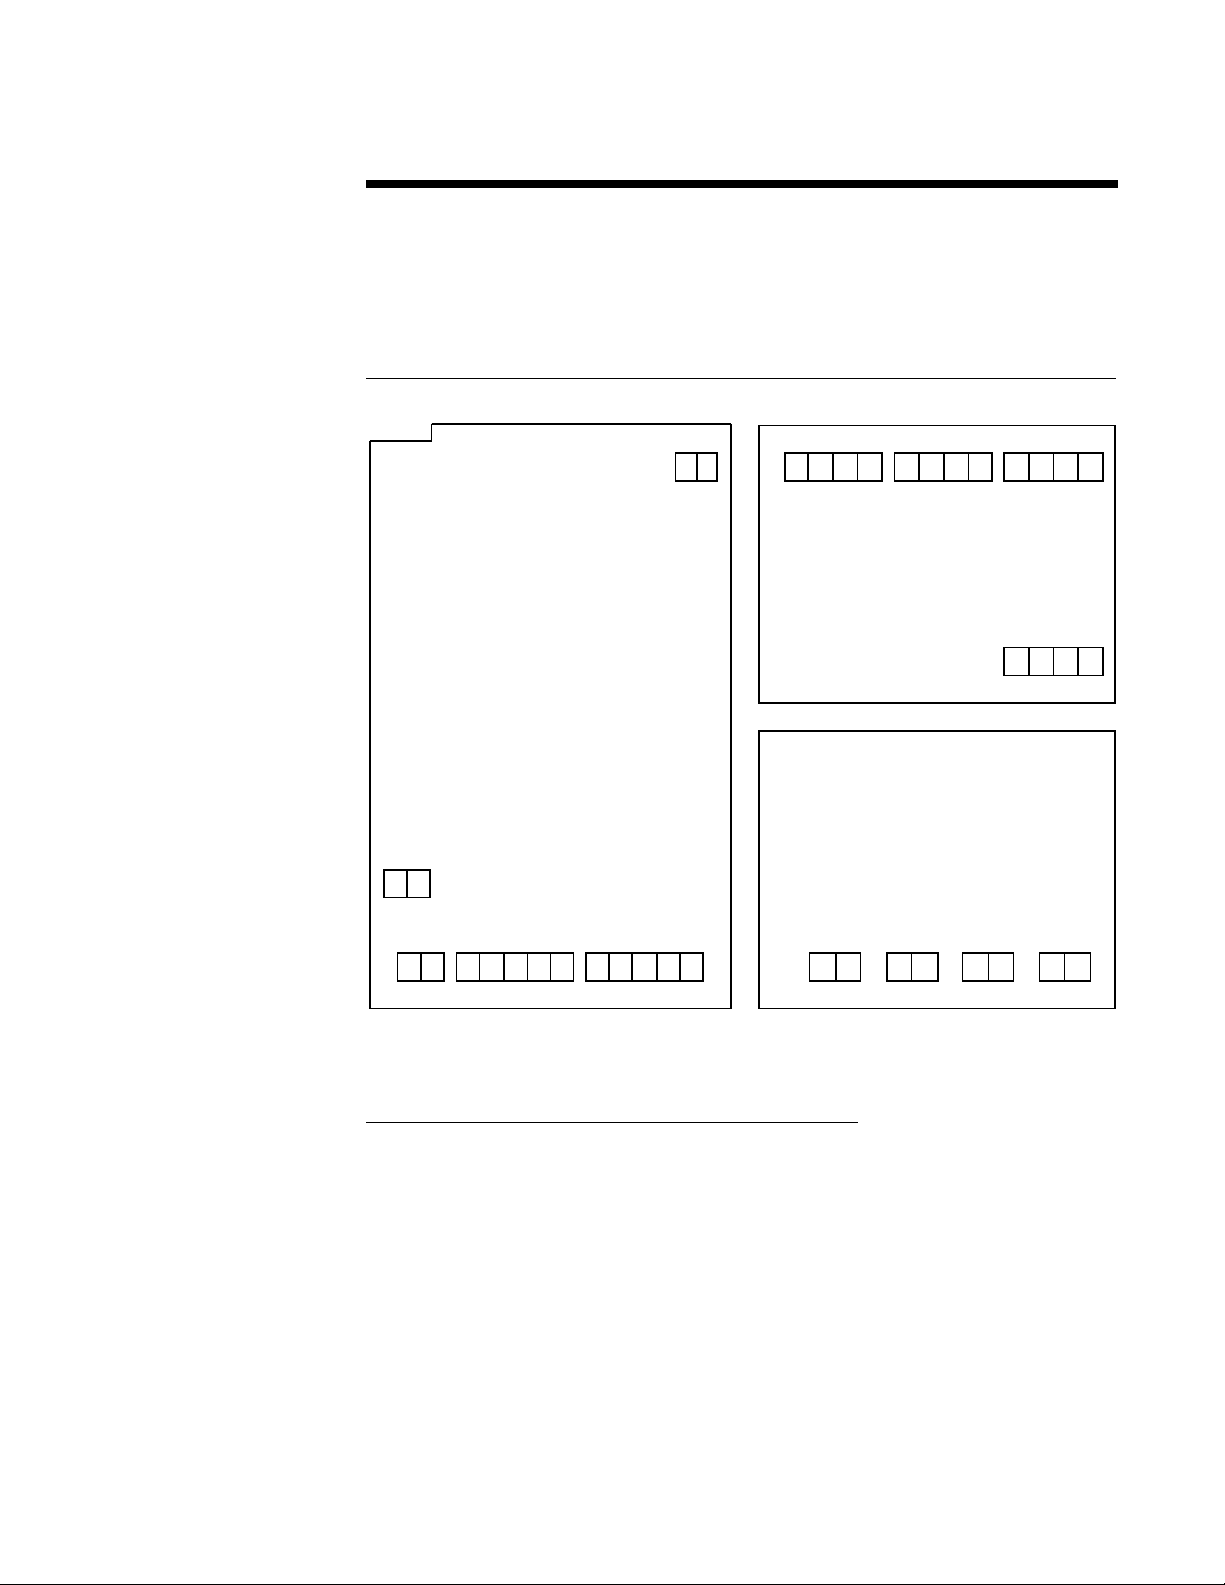
FIGURE 2-12B
-
SPDT Relay Output
PAGE 19
HOT
NEU
POWER
LOAD
5 AMPERES
123
N.O.
C N.C.
TB6 Relay A
TB7 Relay B
FIGURE 2-13
SSR Driver Output
Connections are made to relays H through A as shown. Terminal connections are made using
TB9, TB8, etc. depending on the number of SSR Driver outputs specified.
1234
MAXIMUM
AT 115 VAC
+ -
SSR
TB6 THRU TB9
TB9 SSRD G, H - all cases
TB8 SSRD E, F - no SPDT relays
TB8 SSRD C,D - SPDT relay/s E and F not available
FIGURE 2-14
Current Output
Connections are made to current outputs A thruough D as shown. Each current output is
programmable as either 4 to 20 mADC or 0 to 20 mADC. Each output must be assigned to the
desired function in the Program mode. Terminal connections are made using TB10 through
TB13 for current output A through D respectively. Connect positive lead (+) to terminal 1 and
the negative lead (-) to terminal 2. Each current output will operate up to a 650 ohms
maximum load.
+
-
12
SHIELDED
TWISTED
PAIR
+
LOAD
650 OHMS
MAXIMUM
Page 20
PAGE 20
-
-
-
5
-
-
FIGURE 2-15
Transmitter Power Supply Input
If the isolated 24 VDC regulated transmitter power supply has been specified, the connections should be made as shown. Connections are made using TB3, terminal 1 is positive and
terminal 2 is negative. The power supply is capable of providing the power needed for up to
2 transducers.
TB3
+
12
TB4 or TB5
+
-
12345
TB3
+
12
TB4
+
-
12345
TB
+
-
12345
SHIELDED
TWISTED
PAIRS
+
TWO WIRE
TRANSMITTERS
+
TWO WIRE
TRANSMITTERS
+
TWO WIRE
TRANSMITTERS
FIGURE 2-16
Position Proportioning Control Output
Position Proportioning control requires that two relays (or SSR Drivers) and the Position
Proportioning Auxiliary input be specified. On a dual pen instrument either pen may be
configured with Position Proportioning control provided the outputs and auxiliary inputs have
been properly specified.
L2
OPEN
CLOSE
Modulating Motor
4
TB6, TB7
or TB8
3
2
1
L1
TB4
or
TB5
5
4
3
C
Page 21

Configuration 3.1
After completing installation and wiring of the instrument the configuration (set up) procedures
must be performed to prepare the instrument for operation on the intended application. The
procedures include selecting specific parameters, entering data and possible jumper positioning. Once properly configured the instrument will retain the user selections in memory so this
procedure need not be repeated unless required by changes in the application.
Parameter selections and data entry are made via the front keypad. To ease configuration
and operation, user entered data has been divided up into several sections referred to as
modes. Each mode contains a different type of data or may be used for specific operating
functions. For two pen instruments, some modes are common to both pens. These modes are
as follows:
PAGE 21
Control
(CtrL)
Test
(tESt)
Calibrate
(CAL)
Program
(Prog)
Tune
(tunE)
Profile
Continue
(PCon)
Profile
Enter
(PEnt)
Profile No.
(P1...P8)
Off
(oFF)
Mode Display Code Function Description
Off oFF Operation Outputs and Alarms
Control CtrL Control Outputs and Alarms
(Operate) (oPEr) (Operation) are Active
Test tESt Service Tests Instrument
Calibration CAL Service Calibrates, Resets
Program Prog Configuration Configure Operating
Tune tunE Configuration & Enter Tune and
(Alarm Set) (ASEt) Operation Alarm Settings
Profile Entry PEnt Configuration Enter the Profile
are Off. Chart may
stop rotating
(selectable)
(Recorder)
Operation
Instrument
Parameters
Operation
(Recorder)
program(s)
Profile Continue PCon Operation Provides the means
to restart a profile
anywhere within the
program
Setpoint Change ESPC Operation Prohibits setpoint
change from the
keypad
Enable Enab Configuration Mode security
system, can lock
out everything except
off and operate (See
Appendix A-1, page
68, for hardware
lockout information)
Associated with each mode is a series of unique displays that are accessed via the front
keypad.
Page 22

PAGE 22
Prior to first time operation of the instrument, the configuration procedures for the Program
and Tune modes must be performed as applicable. Calibration and Test modes are not used
as part of the instrument configuration or operation. These are used for service and maintenance functions and are discussed in Section 5.6 (page 59) of this manual.
Shipped Configuration/
Jumper Positioning 3.2
Each instrument is factory shipped ready to accept a RTD input on TB 4 and TB 5. All
parameters in each mode are set to default values. These defaults are shown in tabular form
after the description for each mode. Instrument AC power input is as specified in the instrument model number and is shown on the ratings label. The 230 VAC option includes a switch
in the instrument for selecting either 230 VAC or115 VAC input power. If this feature is
provided, verify AC input and switch position before applying power to the instrument.
3.2.1 JUMPER POSITIONING
Jumpers are used to condition the sensor inputs and to provide a security lockout feature. All
jumpers are located on the instrument Processor board. The instrument board layout and
jumper locations and functions are shown in Appendix A-1 (Page 68). Check the jumper
positions in the instrument and verify that they are in the proper position for the intended
application.
The sensor input jumpers JU4, JU5, JU6 and JU7 condition the sensor input signals
and must be used in conjunction with input type selections made in the Program mode
(page 30).
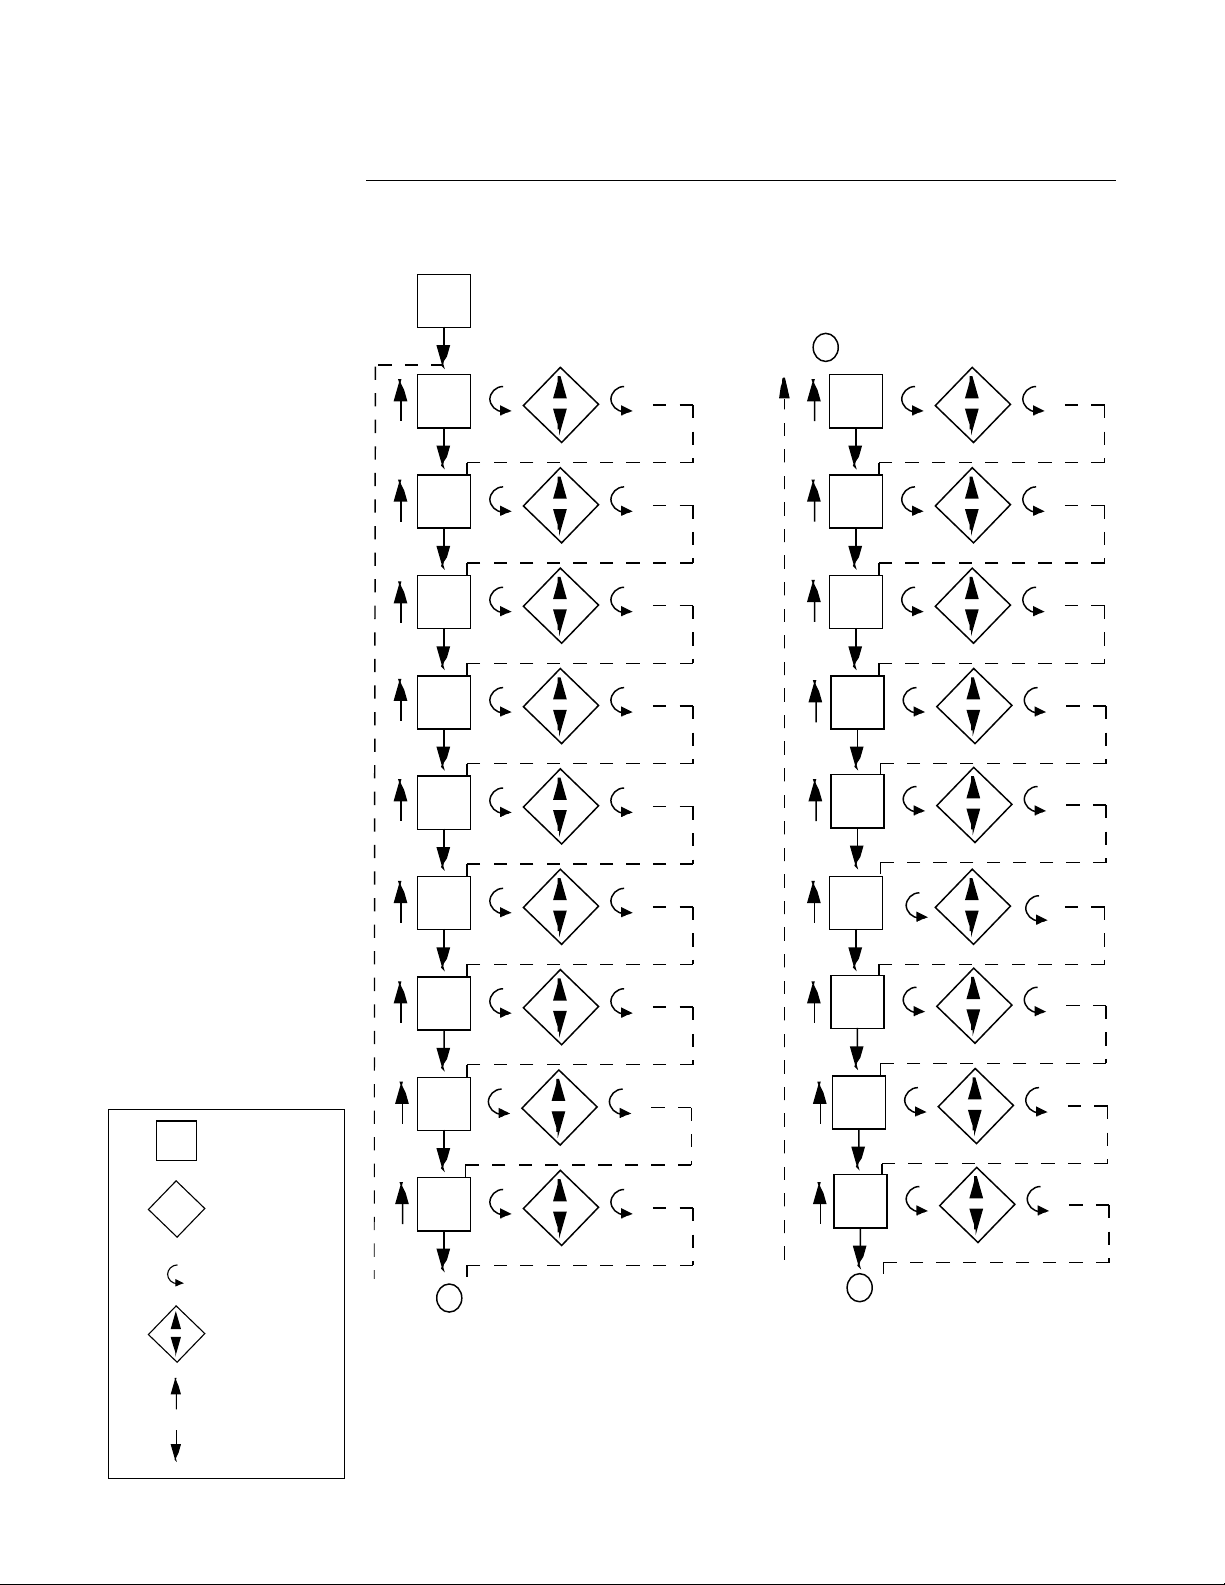
Operation Summary 3.3
3.3.1 MODE SELECTION
If the instrument is either in the Off mode or the Control mode repeated pressing and releasing of the SCROLL key will cause the instrument to display the code corresponding to each
mode that is enabled. To enter a mode, while the code is displayed, press the DOWN key. If a
mode does not appear, refer to the Enable mode section for information on how to determine
that the mode is on.
Entry into any mode except the Control, Tune, Manual and Enable modes, will cause the
output(s) to turn off and any process re-transmission value output(s) to be 0 %.
Entry into Off mode will cause the process re-transmission output to remain active.
Start Up Procedures 3.4
All configuration parameters are listed in Tables 3-1 through 3-5.
For a single pen instrument, parameters for each mode are displayed in the upper right
display. If the instrument being configured is a two pen model, a sequence of applicable
parameters will be displayed in the Pen 2 display after the Pen 1 parameters have been
reviewed and configured. After the Pen 2 parameters have been completed, parameters
common to both pens will be configured and displayed in the Pen 1 display.
Page 23

The instrument is provided with a time out feature. If the instrument is in any mode and no
keypad activity takes place for 30 seconds, the instrument will time out and exit the mode
automatically. The display will become the code for the respective mode. If a mode code is
displayed for 5 seconds with no keypad activity, then the time out will cause the instrument to
proceed to either the Control or Off mode, depending upon which operational state was in use
before entry into the mode.
3.4.1 POWER UP PROCEDURE
PAGE 23
A. Verify that all electrical connections have been properly made before applying
B. For instruments with software revision R2.99 and below
C For instruments with software revision r3.00 and above
power to the instrument.
Upon power up, 77XX will be displayed (X representing digits), then XXXX, then
XXXX, identifying the twelve digit model number as defined in the order matrix.
Next, the EPROM part number will be indicated P-XX. After the EPROM part
number, the software revision level will be displayed in the format rX.XX then
tSt1, tSt2, and tSt3 will be displayed while Test 1 through 3 are executed
automatically. Upon successful completion of these test, oPEr or oFF will be
displayed for about 3 seconds. The mode displayed will be the mode the
instrument was in when the power was turned off. During this time, the operator
may select another mode (Alarm Set, Enable) or non-operational mode (Test,
Program, Cal).
Upon power up, a brief flash on all displays (upper and, if equipped, lower) will
occur to show the instrument is "alive". Then 77XX will be displayed (X representing
digits) then XXXX, then XXXX, identifying the twelve digit model number as defined
in the order matrix. Next, the EPROM part number will be indicated P-XX. After the
EPROM part number, the software revision level will be displayed in the format
rX.XX followed by P.dn (if Pen Action on Power Up, PAPU, in Program Mode is set
to 0, pens go to "home" position at power up). During this display, the decimal point
after the "P" will blink to show the mode is active. Upon successful completion of
this routine, oPEr or oFF will be displayed for about 3 seconds. The mode displayed
will be mode that the instrument was in when the power was turned off. During this
time the operator may select another mode (Alarm Set, Enable) or non-operational
mode (Test, Program, Cal).
D. If any error messages are displayed, refer to Section 5.6 (page 60) for a
definition of the error message and the required action.
Front Panel Operation 3.5
3.5.1 DIGITAL DISPLAY AND STATUS LED’s
The digital display provided for each pen has 4 digits and a decimal point. Each digit has
seven segments and is capable of producing numeric characters from 0-9 and certain alpha
characters. The digital display is used to provide indication of process variable as well as
displaying codes used for configuration and operation of the instrument. The display includes
the following Status Indicator LED’s;
Label Color Function
MAN Amber Lights when the Manual (StbY) mode is on.
OUT1 Red Lights when Output 1 is on or mADC output selected.
OUT 2 Amber Lights when Output 2 is on or mADC output selected.
ALRM Red Lights when either Alarm is on.
C Red Lights to indicate that the process value is in degrees C
(Celsius).
(ALRM 1 Recorder)
(ALRM 2 Recorder)
Page 24

PAGE 24
F Red Lights to indicate that the process value is in degrees F
(Fahrenheit).
U Red Lights to indicate that the process value is in terms of
Relative Humidity or Engineering units.
SP Green Indicates that the value displayed is the setpoint.
- Red Lights to indicate a negative displayed value.
RAMP Red Lights to indicate that a profile is running and is ramping
the setpoint.
SOAK Red Lights to indicate that a profile is running and is at a
constant setpoint.
SEG1-6 Red Lights to indicate that a profile is running and is in the
segment that is lit.
*Refer to Figure 1-2 (page 7) for the display features illustration.
3.5.2 KEYPAD CONTROLS
The keys on the keypad functions include:
SCROLL: Used to : 1. Display the enabled modes.
UP: Used to: 1. Exit a mode.
DOWN:
Used to: 1. Enter a mode
2. While in a mode, used to sequence the parameter codes and
values.
3. Exit some Test and Calibration functions
4. Work in conjunction with other keys:
a. With the UP key to display proportional output %
b. With the DOWN Key;
1) On power up to alter model #
2) Enter Cal/Test functions
2.Turn a mode On in the Enable mode
3.Increase a parameter numerical value
4. View the setpoint for Pen 1 (Press and release)
5. Increase the setpoint value (Press and hold)
6. Work in conjunction with other keys:
a. With the SCROLL key to display proportional output %
b. With the DOWN key;
1) On power up to reset the instrument
2) Lamp test (Press and release)
3) Enter the Enable mode (Press and hold)
2. Turn a mode Off in the Enable mode
3. Decrease a parameter numerical value
4. View the setpoint for Pen 2 (if provided)
5. Decrease the setpoint value (Press and hold)
6. Step display through parameter codes in a mode
7. Start a profile
8. Work in conjunction with other keys:
a. With the SCROLL key;
1) On power up to alter the model number
displayed
2) Enter Cal/Test functions
b. With the UP key;
1) On power up resets the instrument
2) Lamp test (Press and release)
3) Enter the Enable mode (Press and hold)
Page 25

AUTO/MAN: Used to: 1. In the Control mode to enter the Manual mode if proportional
The upper key is for output(s) selected
Pen 1, the lower key 2. In the Manual mode to enter the Control mode if proportional
is for Pen 2 (if provided) output(s) selected
RUN/HOLD: Used to: 1. To start a profile.
2. To halt a running profile
FIGURE 3-1
PAGE 25
Pen 1
AUTO/MAN
Key
RUN/HOLD
Key
Pen 2
AUTO/MAN
Key
Lamp Test
All display and status LED’s can be illuminated simultaneously by depressing the UP and
DOWN keys at the same time. Any defective LED’s will not light.
*CHANGE CHART (also see Changing Charts, Section 4.2)
If the UP and DOWN keys are held depressed for more than 2 seconds but less than
4 seconds, the display will show Cchg momentarily. The pen(s) will move to and
remain at a point above the top graduation on the chart and the chart will stop
rotation to allow the chart to be changed. The pens will remain fully upscale with the
chart OFF; otherwise, the unit will continue to operate normally in the current mode.
To restore pen(s) position and chart rotation, press the UP and DOWN keys for more
than 2 seconds but less than 4 seconds.
AUTO
MAN
RUN
HOLD
AUTO
MAN
SCROLL
Key
UP
Key
DOWN
Key
*PEN RESYNCHRONIZATION
To resynchronize the pen(s), depress the UP and DOWN keys for 4 seconds, the
display will show P dn momentarily, the pen(s) are driven to the "Pen Home" position
below the bottom graduation on the chart while the unit resynchronizes their position.
After about 14 seconds, the pen(s) will return to their correct position. All other
functions of the unit's present mode continue to operate normally.
Page 26
PAGE 26
PROGRAM MODE FLOW CHART
Prog
Pen 1 Only
A
iSi1
iCi1
iSi2
iCi2
PEnS
rHC
out2
o2uL
o2LL
AL1
Pen 1 & Pen 2
AL2
diSP
ON
OFF
Key
Actual Display
On/Off Display Use arrow keys
to turn on or off
Scroll Key
Numeric Display Use arrow keys
to change value
Up Arrow Key
Down Arrow
out1
o1uL
o1LL
A
dPoS
Euu
EuL
B
Page 27
PAGE 27
B
HyCo
HyAo
rSP
rSPu
rSPL
SPuL
C
dFF
PFF
Pout
Pou
PoL
Cru
SPLL
AtFr
Prnd
C
CrL
P1EC
P2EC
D
Page 28

PAGE 28
D
PAEC
rLyA
rLyb
rLyC
rLyd
rLyE
E
CurA
Units
Curb
CurC
Curd
CoAr
Cobr
ON
OFF
Key
Actual Display
On/Off Display Use arrow keys
to turn on or off
Scroll Key
Numeric Display Use arrow keys
to change value
Up Arrow Key
Down Arrow
rLyF
rLyg
rLyH
CoCr
Codr
Ptb
E
F
Page 29

F
PIA
rrH
PPC
Crt
PAGE 29
PAPu
Coo
Con
CbS
CAd1
CAd2
Com (Optional)
Page 30

PAGE 30
TABLE 3-1 PROGRAM MODE CONFIGURATION PROCEDURE
Press the SCROLL key until Prog is displayed. Press the DOWN key to enter the Program
mode. Pen 1 will be displayed in the upper display. To enter the Pen 1 parameter, press the
DOWN key. To enter the Pen 2 parameter, if provided, press the SCROLL key, then the
DOWN key. To enter the unit parameter, press the SCROLL key with either Pen 1 or Pen 2
displayed until unit is displayed, then press the DOWN key. Press the SCROLL key to
advance the display through the parameter codes and their values. Use the UP and DOWN
keys to adjust the values. After adjusting a parameter, press the SCROLL key to proceed to
the next parameter. After all selections have been made, press the UP key with a parameter
in the display (not a setting) to exit the mode. For two pen instruments the parameters and
values which are applicable to Pen 1 will appear in the upper display, then the parameters
and values which are applicable to Pen 2 will appear in the lower display. Then the unit
parameters and values will appear in the upper display.
For illustration purposes all available Program mode parameters have been listed. The
parameters that will appear on the specific instrument will depend upon the model number
(hardware configuration) of the instrument and on the parameter selections previously made.
For future reference record the parameter selections for the application in the “Your Setting”
column and on the Software Reference Sheet in Appendix E (page 80).
To prevent unauthorized changes to the Program mode, the mode can be disabled (turned
off) in the Enable mode.
DISPLAY AVAILABLE FACTORY YOUR
STEP DESCRIPTION CODE SETTINGS SETTING SETTING
1 Input Select TB 4 iSi1 0=J T/C degrees C
Note: Fault Detection is not
functional for 0-5V or
0-20mA inputs.
2 Input Correction TB 4 iCi1 -300.0 to +300.0 degrees
3 Input Select TB 5 iSi2 0=J T/C degrees C
1=J T/C degrees F
2=K T/C degrees C
3=K T/C degrees F
4=T T/C degrees C
5=T T/C degrees F
6=R T/C degrees C
7=R T/C degrees F
8=S T/C degrees C
9=S T/C degrees F
10=E T/ C degrees C
11=E T/C degrees F
12=B T/ C degrees C
13=B T/C degrees F
14=N T/ C degrees C
15=N T/C degrees F
16=C T/ C degrees C
17=C T/C degrees F
20=RTD degrees C
21=RTD degrees F
30=0 to 5 VDC/0 to 20mA
31=1 to 5 VDC/4 to 20mA
-9999 to +9999 units
1=J T/C degrees F
2=K T/C degrees C
3=K T/C degrees F
4=T T/C degrees C
5=T T/C degrees F
6=R T/C degrees C
7=R T/C degrees F
8=S T/C degrees C
9=S T/C degrees F
10=E T/ C degrees C
11=E T/C degrees F
21
0.0
21
Page 31

DISPLAY AVAILABLE FACTORY YOUR
STEP DESCRIPTION CODE SETTINGS SETTING SETTING
12=B T/ C degrees C
13=B T/C degrees F
14=N T/ C degrees C
15=N T/C degrees F
16=C T/ C degrees C
17=C T/C degrees F
20=RTD degrees C
Note: Fault Detection is not
functional for 0-5V or
0-20mA inputs.
21=RTD degrees F
30=0 to 5 VDC/0 to 20mA
31=1 to 5 VDC/4 to 20mA
PAGE 31
4 Input Correction for TB 5 iCi2 -300.0 to +300.0 degrees
-9999 to +9999 units
5 Pen Select PEnS 1=Dry Bulb Temperature
2=Wet Bulb Temperature
3=Relative Humidity
6 Relative Humidity rHC -10 to +10%
correction(PEns=3)
7 Output 1 * out1 0=None
1=On-Off- Direct
2=On-Off- Reverse
3=Time Proportioning- Direct
4=Time Proportioning -Reverse
5=Current Proportioning -Direct
6=Current Proportioning -Reverse
7=Position Proportioning (open)
8 Output 1 Percent * o1uL 0 to 100 percent
Upper Limit (o1uLand
o1LL will not be seen if
out1 = 0,1,2)
9 Output 1 Percent * o1LL 0 to 100 percent
Lower Limit
10 Output 2 * out2 0=None (PositionProportioning
Direct Closed)
1=On-Off- Direct
2=On-Off- Reverse
3=Time Proportioning- Direct
4=Time Proportioning-Reverse
5=Current Proportioning- Direct
6=Current Proportioning -Reverse
7=Position Proportioning
(Reverse/Closed)
0.0
Pen 1=1
Pen 2=2
(if Provided)
0
0
100
0
0
11 Output 2 Percent * o2uL 0 to 100 percent
Upper Limit (o2uL and
o2LL will not be seen
if out2 = 0,1,2,7)
12 Output 2 Percent * o2LL 0 to 100 percent
Lower Limit
13 Alarm 1 AL1 0=None
the Alarm Point 1=Process Alarm-Direct
is selected in the 2=Process Alarm-Revers
Tune mode 3=Deviation Alarm-Direct
4=Deviation Alarm-Reverse
5=Deviation Band Alarm Open within band
100
0
0
Page 32

PAGE 32
DISPLAY AVAILABLE FACTORY YOUR
STEP DESCRIPTION CODE SETTINGS SETTING SETTING
6=Deviation Band Alarm Closed within band
Note: When Pen Select PEnS is
programmed to a 3 (RH), the
decimal position dPOS value
reverts to 0. All program and
tune parameters should be
reviewed to ensure that the
values are correct. (ie: Pb1=10.0
will revert to Pb1=100)
14 Alarm 2 AL2 Same selections as Alarm 1
15 Display Select * diSP 1=Process value only
2=Process value/setpoint
3=Deviation only
4=Deviation and setpoint
5=Setpoint only
16 Decimal Position dPoS 0 to 3
Not Available if PEnS=3 0=None
for Relative Humidity 1=One decimal place
2=Two decimal places
3=Three decimal places
RTD and thermocouple inputs
are limited to either 0 or 1 decimal positions
17 Engineering Units Euu -9999 to 9999
Upper Value (Euu and
EuL will be seen if the pen
input select = 30,31)
18 Engineering Units EuL -9999 to 9999
Lower Value
19 Hysteresis for * HyCo 0 to 300
Control Outputs Width of Hysteresis Band
(See page 72 for definition)
0
1
0
1000
0
3
20 Hysteresis for HyAo 0 to 300
Alarm Outputs Width of Hysteresis Band
(See page 72 for definition)
21 Remote Setpoint * rSP 0 to 2
(Pen 2 only) 0 = Not used
(If rSP is set to zero then 1 = 1 to 5VDC
rSPo and rSPL are not seen) 2 = 0 to 5VDC
22 Remote Setpoint * rSPu -9999 to 9999
Upper Value (Pen 2 only)
23 Remote Setpoint * rSPL -9999 to 9999
Lower Limit (Pen 2 only)
24 Setpoint Upper Limit * SPuL -9999 to 9999
25 Setpoint Lower Limit * SPLL -9999 to 9999
26 Automatic Transfer * AtFr 0=No Automatic Transfer
1=Transfers when the process
value goes below the setpoint
2=Transfers when the process
value goes above the setpoint
27 Process Rounding Prnd 1 to 100
0=No rounding
3
0
302
-94
302
-94
0
0
Page 33

DISPLAY AVAILABLE FACTORY YOUR
STEP DESCRIPTION CODE SETTINGS SETTING SETTING
28 Display Filter Factor dFF 1 to 20
1= no averaging
(number of scans averaged)
1
PAGE 33
29 Process Filter Factor PFF Same selection as dFF
30 Process Value Output Pout 0=Not selected
Retransmission 1=Selected
(If Pout =0 then Pou and
PoL will not display)
31 Process Output Pou -9999 to 9999
Upper Value
32 Process Output PoL -9999 to 9999
Lower Value
33 Chart Range Cru -9999 to 9999
Upper Value
34 Chart Range CrL -9999 to 9999
Lower Value
35 Proportional * P1EC 0 to 100%
Output 1 Action
on Error Condition
(If out1= 0,1,2 then
P1EC will not be seen)
36 Proportional * P2EC 0 to 100%
Output 2 Action
on Error Condition
(If out2 = 0,1,2,7 then
P2EC will not be seen)
1
0
2000
0
100
0
0
0
37 Pen Action on PAEC 0 or 1
Error Condition 0 = Pen goes to 0 % of chart
1 = Pen goes to 100 % of chart
1
* NOT AVAILABLE ON RECORDER ONLY INSTRUMENTS
Pressing the SCROLL key with the PAEC parameter value displayed in the Pen 1 window will
advance the display of a single pen instrument to the unit parameters. Pressing the SCROLL
key with the PAEC parameter displayed in the Pen 1 window of a two pen instrument will
advance the display to be PEns in the Pen 2 window. The Pen 2 Program mode parameter
selections can be made now. Pressing the SCROLL key with the PAEC parameter value
displayed in the Pen 2 window will cause the display to advance to the unit parameters.
Unit Parameters
38 Relay A assignment rLyA 0 to 14 *
0=Not assigned *
1=Assigned to Alarm 1-Pen 1 *
2=Assigned to Alarm 2-Pen 1 *
3=Assigned to Alarm 1-Pen 2 *
4=Assigned to Alarm 2-Pen 2 *
5=Assigned to Output 1-Pen 1
6=Assigned to Output 2-Pen 1
7=Assigned to Output 1-Pen 2
8=Assigned to Output 2-Pen 2
9=Assigned to Event 1
10=Assigned to Event 2
0
* Recoredr Only
Page 34

PAGE 34
DISPLAY AVAILABLE FACTORY YOUR
STEP DESCRIPTION CODE SETTINGS SETTING SETTING
11=Assigned to Event 3
12=Assigned to Event 4
13=Assigned to Event 5
14=Assigned to Event 6
39 Relay B Assignment rLyb Same selection as rLyA
40 Relay C Assignment rLyC Same selection as rLyA
41 Relay D Assignment rLyd Same selection as rLyA
42 Relay E Assignment rLyE Same selection as rLyA
43 Relay F Assignment rLyF Same selection as rLyA
44 Relay G Assignment rLyg Same selection as rLyA
45 Relay H Assignment rLyH Same selection as rLyA
46 Current Output A CurA 0 to 6 *
Assignment 0=Not Assigned *
1=Assigned to Process *
Value Output-Pen 1
2=Assigned to Process *
Value Output-Pen 2
3=Assigned to Output 1-Pen 1
4=Assigned to Output 2-Pen 1
5=Assigned to Output1-Pen 2
6=Assigned to Output 2-Pen 2
47 Current Output B Curb Same selection as CurA
Assignment
48 Current Output C CurC Same selection as CurA
Assignment
0
0
0
0
0
0
0
0
0
0
49 Current Output D Curd Same selection as CurA
Assignment
50 Current Output A CoAr 0=0-20 mA
Range 1=4-20 mA
51 Current Output B Cobr Same selection as CoAr
Range
52 Current Output C CoCr Same selection as CoAr
Range
53 Current Output D Codr Same selection as CoAr
Range
54 Profile Time Base *** Ptb 1=HHH.H Hours and Tentths
2=HH.MM Hours and Minutes
3=MM.SS Minutes and Seconds
55 Power Interupt Action *** PIA 0=Goes to Off mode
1=Continues Profile where left off
2=Go into Hold where left off
3=Restart the Profile
* Recoredr Only
*** Profiler Only
0
1
1
1
1
3
1
Page 35

DISPLAY AVAILABLE FACTORY YOUR
STEP DESCRIPTION CODE SETTINGS SETTING SETTING
PAGE 35
56 Remote Run/Hold *** rrH 0=Not used
(optional) 1=Remote overrides keypad
2=Remote or keypad will cause hold
57 Pen(s) Profile *** PPC 1 or 2
Configuration 1=Pen 1 only Profile Control
(only seen on 2 Pen instruments) 2=Both pens Profile Control
58 Chart Rotation Time Crt 0.1 to 999.9 hours per rotation
59 Pen Action on Power Up PAPu 0=Pen(s) go to "Home" position 0
(towards chart center) when
powered up
1=Pen(s) remain in last position
prior to power down
60 Chart Operation Coo 0=Chart continues rotating
in Off Mode in the Off mode
1=Chart stops rotating while
in the Off mode
Communications Options Parameters
61 Communication Con 0=Off
Configuration 1=Monitor Mode (Read Only)
2=Normal Mode (Read and Write)
3=Total Access with Limit Checking
4=Total Access without Limit Checking
0
1
1.0
1
3
62 Communication Bit CbS 1=300
Rate Selection 2=600
Will not be seen if 3=1200
Con=0 4=2400
5=4800
6=9600
63 Communications CAd1 0 to 99
Address-Pen 1
Will not be seen if
Con=0
64 Communications CAd2 0 to 99
Address-Pen 2
(If provided)
Wiil not be seen if
Con=0
* Recoredr Only
*** Profiler Only
6
1
2
Page 36

PAGE 36
TUNE MODE FLOW CHART
tunE
SoP
PAL1
dAL1
bAL1
PAL2
A
rSEt
ArS1
ArS2
rt1
rt2
Ct1
ON
OFF
Key
Actual Display
On/Off Display Use arrow keys
to turn on or off
Scroll Key
Numeric Display Use arrow keys
to change value
Up Arrow Key
Down Arrow
dAL2
Ct2
bAL2
SEnS
Pb1
FoP
Pb2
bAro
A
Page 37

TABLE 3-2 TUNE MODE CONFIGURATION PROCEDURE (Not Available on Recorder Only Instruments)
The Tune mode allows the entry, review or altering of the process control Tune adjustments,
the alarm setting(s) and the barometric pressure adjustment.
To enter the Tune mode, press and release the SCROLL key until tunE is displayed, then
press the DOWN key. Press the SCROLL key to advance the display through the parameters
and their values. Use the UP and DOWN keys to select (adjust) the values. Each time the
DOWN key is pressed while a parameter code is being displayed, such as dFF, the next
parameter code in the sequence will be displayed.
After selecting a parameter, press the SCROLL key to proceed to the next parameter. Pen 1
selections will appear in the Pen 1 window and the Pen 2 ( if provided) selections will appear
in the Pen 2 window after the Pen 1 parameters have displayed. In order to obtain the best
relative humidity accuracy the current local barometric pressure value must be entered in the
bAro parameter value. After all selections have been made, press the UP key with a parameter in the display (not a setting) to exit the mode.
For illustration purposes all available Tune mode parameters have been listed. The parameters that will appear on the specfic instrument will depend upon the parameter selections
previously made in the Program mode.
For future reference, record the parameter selections for the application in the “Your Setting”
column and on the Software Reference Sheet in the Appendix E (page 80).
To prevent unauthorized changes to the Program mode, the mode can be disabled (turned
off) in the Enable mode.
PAGE 37
The Tune mode is adjusted on-line. The instrument will react to changes as they are
made.
DISPLAY AVAILABLE FACTORY YOUR
STEP DESCRIPTION CODE SETTINGS SETTING SETTING
1 Second Output Position SoP -1000 to 1000 units
(Will not be seen if out2=0,7)
2 Process Alarm 1 PAL1 -9999 to 9999 units
(The Alarm setting seen
will depend upon the Alarm
selected in the Program mode)
3 Deviation Alarm 1 dAL1 -3000 to 3000 units
4 Deviation Band Al 1 bAL1 1 to 3000 units
5 Process Alarm 2 PAL2 -9999 to 9999 units
6 Deviation Alarm 2 dAL2 -3000 to 3000 units
7 Deviation Band Al 2 bAL2 1 to 3000 units
8 Proportional Band Pb1 1 to 3000 units
Output 1 (Will only be seen
if out1=3,4,5,6,7)
9 Proportional Band Pb2 1 to 3000 units
Output 2 (Will only be
seen if out2=3,4,5,6)
0
0
0
1
0
0
1
100
100
10 Manual Reset rSEt -1500 to 1500 units
(Will only be seen if
Pb1/Pb2 were shown)
0
Page 38

PAGE 38
DISPLAY AVAILABLE FACTORY YOUR
STEP DESCRIPTION CODE SETTINGS SETTING SETTING
11 Automatic Reset ArS1 0.0 to 100.0 repeats per minute
Output 1 - Integration
(Will be seen if Pb1 was shown)
12 Automatic Reset ArS2 0.0 to 100.0 repeats per minute
Output 2 - Integration
(Will be seen if Pb2 was shown)
13 Rate Output 1 rt1 0.0 to 10.0 minutes
Derivative (Will be seen
if Pb1 was seen)
14 Rate Output 2 rt2 0.0 to 10.0 minutes
Derivative (Will be seen
if Pb2 was shown)
15 Cycle Time Output 1 Ct1 1 to 240 seconds
(Will be seen if out1=3,4,7)
16 Cycle Time Output 2 Ct2 1 to 240 seconds
(Will be seen if out2=3,4)
17 Position Proportioning SEnS 0.0 to 50.0 percent
Sensitivity (Will be seen
if out1=7and out2=0,7)
18 First Output Position FoP -1000 to 1000 units
(Will not be seen if out1=0)
19 Barometric Pressure bAro 20.9 to 35.9 in. Hg.
(Will be seen if PEnS=3)
0.0
0.0
0.0
0.0
30
30
1.0
0
29.9
ALARM SET FLOW CHART
ASEt
PAL1
PAL2
Page 39

TABLE 3-3 ALARM SET MODE CONFIGURATION PROCEDURE
Press and release the SCROLL key until ASEt is displayed, then press the DOWN key. Press
the SCROLL key to advance the display through the parameters and their values. Use the UP
and DOWN keys to select (adjust) the values. After selecting a parameter, press the SCROLL
key to proceed to the next parameter. Pen 1 selections will appear in the Pen 1 window and
the Pen 2 ( if provided) selections will appear in the Pen 2 window. After all selections have
been made, press the UP key with a parameter in the display (not a setting) to exit the mode.
DISPLAY AVAILABLE FACTORY YOUR
STEP DESCRIPTION CODE SETTINGS SETTING SETTING
1 Process Alarm 1 PAL1 -9999 to 9999 degrees/units
0
PAGE 39
2 Process Alarm 2 PAL2 -9999 to 9999 degrees/units
If ASEt does not appear on the display refer to the Enable mode section of this manual for
directions on how to determine if the ASEt mode is enabled. If ASEt appears on the display,
but pressing the DOWN key causes the display to change to oFF, this indicates that no
alarm(s) have been selected in the Program mode.
0
ALARM OPERATION
There are two types available per pen, Process Direct or Process Reverse. These are
selected in the Program mode.
Process Alarm Direct - the alarm will be ON if the process value is greater than the process
alarm value selected in the Alarm Set mode.
Process Alarm Reverse - the alarm will be ON if the process value is less than the process
alarm value selected in the Alarm Set mode.
The alarms will be active while the instrument is in the Operate mode.
Alarm output chatter can be reduced by using the hysteresis (adjusted in Program mode) to
create a deadband around the alarm point.
TABLE 3-4 PROFILE ENTRY MODE CONFIGURATION PROCEDURE
Depress and release the SCROLL key until PEnt is displayed. Use the Down key to enter the
Profile Entry mode. Depress the SCROLL key to scroll through the parameters and their
values. Use the Up and Down keys to adjust the values. After adjusting a parameter, depress
the SCROLL key to proceed to the next parameter. After all selections have been made,
depress the Up key with a parameter in the display (not a setting) to exit the mode. For
assistance in developing the Profile refer to Appendix F (page 83).
DISPLAY AVAILABLE FACTORY YOUR
STEP DESCRIPTION CODE SETTINGS SETTING SETTING
1 Profile Number Pn 1 to 8
2 Number of Segments nS 0-6 segments
Steps 3-21 are repeated for each segment
3 Ramp Time rt 0 to 9999 units per Ptb **
4 Setpoint- SP Setpoint at end of Ramp
5 *Event Output 1 E1 on or off
6 *Event Output 2 E2 on or off
7 *Event Output 3 E3 on or off
8 *Event Output 4 E4 on or off
9 *Event Output 5 E5 on or off
**
**
**
**
**
**
**
**
Page 40

PAGE 40
DISPLAY AVAILABLE FACTORY YOUR
STEP DESCRIPTION CODE SETTINGS SETTING SETTING
10 *Event Output 6 E6 on or off
11 Soak Time St 0 to 9999 units per Ptb
12 *Event Output 1 E1 on or off
13 *Event Output 2 E2 on or off
14 *Event Output 3 E3 on or off
15 *Event Output 4 E4 on or off
16 *Event Output 5 E5 on or off
17 *Event Output 6 E6 on or off
18 Profile Loop Count PLCt 0 to 9999, 0=continuous
19 Deviation Hold after dhru 0 to 3000 units, 0=no auto hold
Ramp Up
20 Deviation Hold after dhrd 0 to 3000 units, 0=no auto hold
Ramp Down
21 Profile End Control PEnd -1=Hold at last setpoint
0=Abort-all outputs off or at 0%
Events off
1=Transfer to profile 1
2=Transfer to profile 2
3=Transfer to profile 3
4=Transfer to profile 4
5=Transfer to profile 5
6=Transfer to profile 6
7=Transfer to profile 7
8=Transfer to profile 8
**
**
**
**
**
**
**
**
**
**
**
**
After selecting the Prolile End Control parameter value press the SCROLL key to advance
the display to Pn. Press the UP key with Pn or any parameter code displayed to exit the
Profile Entry Mode.
*Event outputs will remain in their current status during an error condiiton (ie: sensor break
SnSr) and upon entering the Profile Continue mode PCon but will turn off when entering other
non-control modes (ie: Program Prog mode).
**All values except Profile Loop Count (PLCt) are initialized to zero and all event outputs are
initialized to Off, with the exception of the first profile. Profile Loop Count (PLCt) is set to 1.
The first profile has the number of segments initialized to zero, to turn the profile Off, but the
profile has values stored in it for demonstration purposes. By setting the number of segments
to two, the profile can be reviewed and/or executed.
PROFILE 1 VALUES FOR DEMONSTRATION PURPOSES
Code Value
rt .10 Ramp Time
SP 100 Setpoint
E1 on Event 1 on
E2 oFF Event 2 off
E3 oFF Event 3 off
St .10 Soak Time
E1 oFF Event 1 off
Page 41

E2 on Event 2 on
E3 oFF Event 3 off
rt .10 Ramp Time
SP 0 Setpoint
E1 oFF Event 1 off
E2 oFF Event 2 off
E3 on Event 3 on
St .10 Soak Time
E1 oFF Event 1 off
E2 oFF Event 2 off
E3 oFF Event 3 off
PLct 1 Profile Loop Count
dhru 0 Deviation Hold after Ramp Up-None
dhrd 0 Deviation Hold after Ramp Down-None
PEnd 0 Profile End Control-Abort-oFF mode
TABLE 3-5 ENABLE MODE CONFIGURATION PROCEDURE
To enter the Enable mode, press the UP and DOWN keys while in CtrL or oFF modes. All the
display lamps will light. After 10 seconds the lamps will go out and EnAb will be displayed.
Release the keys and the display will change to EtSt. Press and release the DOWN key and
each mode to be enabled/disabled will be displayed,. With the enable mode prompt for the
desired mode displayed press the SCROLL key to verify that the displayed mode is either on
(enabled) or oFF (disabled). Press the DOWN key to turn off the mode,press the UP key to
turn on the mode or press the SCROLL key to advance the display to the next enable mode
prompt. Use the Your Setting column in the table to record your programming.
PAGE 41
A hardware jumper located on the Controller Board (See Appendix A-1, page 68) can be used
to lock/unlock the Enable mode. When the jumper is moved to the locked position, entry into
the Enable mode is not possible until the jumper is moved to the unlocked position.
1 Test Mode EtSt on or oFF oFF
2 Calibration Mode ECAL on or oFF oFF
3 Program Mode EPro on or oFF on
4 Tune Mode Etun on or oFF on
5 Manual (Stby) Mode ESby on or oFF on
6 Profile Continue Mode EPC on or oFF oFF
7 Profile Entry Mode EPE on or oFF on
8 Setpoint Change ESPC on or oFF on
Page 42

PAGE 42
ENABLE MODE FLOW CHART
EnAb
EtSt
ECAL
EPro
Etun
ESbY
EPC
ON
OFF
ON
OFF
ON
OFF
ON
OFF
ON
OFF
ON
OFF
EPE
ESPC
ON
OFF
ON
OFF
ON
OFF
Key
Actual Display
On/Off Display Use arrow keys
to turn on or off
Scroll Key
Numeric Display Use arrow keys
to change value
Up Arrow Key
Down Arrow
Page 43

Operation 4.1
4.1.1 OFF MODE
In the Off mode, the instrument control and alarm function(s) are turned off. Process retransmission signals remain active. The chart rotation can be selected in the Program mode
to stop or continue to rotate when the instrument is in the Off mode. The pen(s) will remain
active. The Off mode can be entered by pressing and releasing the SCROLL key until the
display reads oFF, then pressing the DOWN key. The display will read oFF and then current
process variable at two second intervals. Entering the Off mode of a dual pen instrument will
cause both pens to enter the Off mode. The second pen display will be blank as the upper
display reads oFF and displays the process value for the second pen at the same time as the
upper display.
4.1.2 CONTROL MODE
In the Control mode, the instrument control function(s) and alarm(s) are actively responding to
the process variable as selected in the Program and Tune modes and the chart will be
rotating at the rate selected. The Control mode allows setpoint changes from either local
setpoint (standard) adjustment by an operator at the front keypad or from a remote setpoint
source (optional). Other operations in the Control mode include a lamp test and proportional
output display.
4.1.2.1 LOCAL SETPOINT OPERATION
Single Pen Instruments: The instrument must be in the Control mode to allow setpoint value
to be displayed and adjusted. In the Control mode, to view the setpoint, press and release the
UP or DOWN key. The green LED under the SP label will light to indicate that the displayed
value is the setpoint. To change the setpoint value, press and hold the appropriate key (UP or
DOWN). Press and hold the UP key to increase the setpoint or press and hold the DOWN key
to decrease the setpoint. The setpoint will change slowly at first then faster as the key is held
pressed. If the setpoint will not increase, check the Program mode to see that you are not
trying to increase the setpoint above the setpoint upper limit SPuL. If the setpoint will not
decrease, check the Program mode to see that you are not trying to decrease the setpoint
below the setpoint lower limit SPLL. If the setpoint will not increase or decrease check that
the Setpoint Change mode is on in the Enable mode.
PAGE 43
Dual Pen Instruments:The setpoint of each instrument can be reviewed seperately. PEN 1: To
review and change the local setpoint for Pen 1 press the UP key. The green LED in the
upper display will light indicating that the setpoint value is displayed. The setpoint can now be
raised by pressing and holding the UP key or decreased by pressing the DOWN key. PEN 2:
The setpoint for Pen 2 is viewed and changed in the same manner, except the DOWN key
must be pressed to access the Pen 2 setpoint. The setpoint will change slowly at first then
faster as the key is held pressed. If the setpoint will not increase check the Program mode to
see that you are not trying to increase the setpoint above the setpoint upper limit SPuL. If the
setpoint will not decrease check the Program mode to see that you are not trying to decrease
the setpoint below the setpoint lower limit SPLL. If the setpoint will not increase or decrease
check that the Setpoint Change mode is on in the Enable mode.
4.1.2.2 REMOTE SETPOINT OPERATION (Optional)
Dual Pen Instruments: The Remote Setpoint Option is only available on the second pen of a
dual pen. To use this option, if available, the Program mode selections must be properly
made. The Remote Setpoint parameter rSP must be selected as a 1 or 2 as needed. The
Remote Setpoint Upper rSPu and Lower rSPL parameters need to be selected for the
application. Pen Profiling Configuration parameter PPC must be selected as 1 Pen Profiling
only. The Remote Setpoint signal is connected to the TB5 terminals as shown in Section 2 of
the manual.
Digital Communications: The setpoint can be adjusted from a supervisory computer system.
Dual pen instruments are capable of having independent setpoint adjustments for each pen.
Page 44

PAGE 44
4.1.2.3 PROFILE CONTROL OPERATION
To start a profile press and release the Scroll key until the number of the profile that is to be
started is displayed. With the desired profile number displayed press either the DOWN or the
RUN/HOLD to start the profile. RUN will be displayed for about 2 seconds to indicate that the
profile is starting. The status lamps will indicate which segment is active and if in the ramp or
soak portion of the segment.
To stop a profile that is running, press the RUN/HOLD key. The display will show hold for
about 2 seconds, then the process value for about 2 seconds and then continue to display this
sequence. The profile timer will stop but the control, alarm and event outputs will remain
active. The profile can be restarted by pressing the RUN/HOLD key. To exit the profile, press
and release the SCROLL key until the display shows oFF or CtrL, then press the DOWN key.
Pressing the DOWN key with oFF displayed will cause the control alarm and events to be
turned off. Pressing the DOWN key with CtrL displayed will abort the profile and begin
controlling the process automatically at the last setpoint value. Event outputs remain in the
state (on or off) they were in prior to aborting the profile.
While a profile is running, it is possible to display additional profile status information. To
activate the Profile Execution Status Display sequence, hold the DOWN key and press the
SCROLL key. This will cause the display to sequence through the following series of display
codes and values:
Display Code Description Value
Pn Profile Number Actual Profile Number
tr Time remaining in current Ramp or Soak Actual time remaining value
(in whatever units were
configured in the Program
mode for Ptb)
E1, E2, E3 Event 1-3 status (if applicable) on or oFF
SP Current Setpoint Actual Setpoint Value
ProC Current Process Value Actual Process Value
PLCt Profile Loop Count remaining Profile Loop Count Value
Each code or value will only be displayed if they are appropriate. Each code or value will be
displayed for one second. This sequence will continue until any key is depressed.
To start a profile running at some point within the profile other than the start can be accomplished by using the Profile Continue mode. Press and release the SCROLL key until the
display is PCon, then press the DOWN Key. The display will be Pn, adjust the profile parameter values as needed in the Profile Continue Configuration mode, then press the RUN key.
The instrument will execute the profile selected as directed by the information entered in the
Profile Continue mode. The parameter values seen in the Profile Continue mode will indicate
the values of the last active profile.
TABLE 4-1 PROFILE CONTINUE MODE
DISPLAY
STEP DESCRIPTION CODE ACTION
1. Profile Pn Press the SCROLL key to see the number of the
Number last active profile.
2. Profile X If necessary, use the UP or DOWN key to
Number change the profile number to the desired value,
Value then press the SCROLL key.
3. Segment Sn Press the SCROLL key to see the number of the
Number last active segment.
Page 45

4. Segment X If necessary, use the Up or Down key to change
Number the segment number to the desired value, then
Value press the SCROLL key. DO NOT SET THIS
VALUE TO 0 AND ATTEMPT TO RUN THE
PROFILE. AN ERROR 19 CODE WILL DIS
PLAY AND THE PROFILE WILL NOT RUN.
PAGE 45
5. Ramp Time rtr Press the SCROLL key to see the Ramp Time
6. Ramp Time X If necessary, use the UP or DOWN key to adjust
7. Soak Time Str Press the SCROLL key to see the Soak Time
8 Soak Time X If necessary, use the UP or DOWN key to adjust
9 Event(s) E1-E6 If any event outputs have been selected in the
10 Event(s) Status on/oFF If necessary, use the UP key to turn on an event
Remaining Remaining value.
Remaining the Ramp Time Remainig value, then press the
Value SCROLL key. If the time remaining is set to 0
when the SCROLL key is pressed the Soak
Time Remaining code will be displayed. If the
time remaining is greater than 0 then the display
will advance to the events, if programmed. If no
events are programmed, the display will
advance to Profile Loop Count.
Remaining Remaining value of the last active profile.
Remaining the Soak Time Remaining value, then press the
Value SCROLL key.
Program mode then each event number
selected will be displayed in sequence. Press
the SCROLL key to see the status of the
event(s).
that is off or the DOWN key to turn off an event
that is on. Press the SCROLL key to see the
next event number. After the last event status is
selected pressing the SCROLL key will
advance the display to PLCt.
11 Profile Loop PLCt Press the SCROLL key to see the Profile Loop
12 Profile Loop X If necessary,use the UP or Down key to adjust
To start the profile running press the RUN/HOLD key while in the Profile Continue mode. The
profile selected will start at the point selected.
4.1.2.4 ON-OFF CONTROL
On-Off control can only be implemented on controllers provided with SPST relay or SSR
driver output(s). On-Off operation can be assigned to either or both output 1 and 2 for each
pen. The On-Off control can be selected as direct or reverse acting. Direct action is typically
used in cooling applications. The output device will turn on when the process value is greater
than the setpoint. Reverse action is typically a heating application. The output device will turn
on if the process value is below the setpoint. A hysteresis adjustment is provided for On-Off
outputs on each pen. This adjustment is in terms of degrees/engineering units and defines the
width of the hysteresis bandwidth about the setpoint. This parameter may also be referred to
as a dead band. Relay chatter can be eliminated by proper adjustment of this parameter.
When operating in On-Off control, the control algorithm will turn the output on or off depending
upon the setpoint, the relative position of the process value, and the hysteresis adjustment.
The respective OUT 1 or OUT2 indicator for the respective pen will illuminate to indicate that
the output device is on.
Count Remaining Count Remaining for the last active profile.
Remaining the Profile Loop Count Remaining value.
Page 46

PAGE 46
4.1.2.5 TIME PROPORTIONING CONTROL
Time Proportioning Control can be implemented on controllers provided with SPST relay or
SSR driver output(s). Time proportioning can be programmed for output 1 and/or 2 for each
pen. Time Proportioning control is accomplished by cycling the output on and off when the
process value is within the proportional bandwidth selected at a prescribed time period. The
time period is selected in the Tune mode by adjusting Ct1 and/or Ct2. The on time is a
percentage of the Cycle Time.
Example: Calculated output % = 40%; Cycle Time adjustment = 20 seconds
4.1.2.6 CURRENT PROPORTIONING CONTROL
Current Proportioning control provides a proportional current output in response to process
value and setpoint. The current output can be selected for direct or reverse operation. Direct
current output control is typically used for cooling applications. The current output will
increase as the process value increases within the proportional bandwidth selected. The
reverse current output control is typically used in heating applications. The current output will
decrease as the process value increases within the proportional bandwidth selected.
The instrument can be programmed to provide 0 to 20 mADC or 4 to 20 mADC current
output(s). The output selected is dependent upon the final control element being used in the
process.
4.1.2.7 POSITION PROPORTIONING CONTROL
Position Proportioning control can be implemented on those controllers provided with two
SPST relay outputs or two SSR Driver outputs and Slidewire Feedback option for the
respective pen. This control implementation can be performed on each pen.
Position proportioning control permits the use of PID control where the final control element is
a modulating device such as a motorized valve. In this form, each of the two required relays
or SSR Drivers will be used to control the valve. One output will be used to open the valve,
the other is used to close the valve. The slidewire feedback is used to provide a signal
relative to the valve armature position to the instrument.
As with the other proportioning control forms, the process input, tuning parameters and the
setpoint are used by the control algorithm to calculate the output % required to correct for the
deviation between setpoint and process.
Output on time = .4 x 20 = 8 seconds
Output off time = .6 x 20 - 12 seconds
Proportional Output 1 Action PIEC on error condition does not apply to position proportioning
control. In an error condition, the unit goes only to 0% output (full closed).
With Position Proportioning control, it may be necessary to adjust the Sensitivity SEnS Tune
mode parameter to reduce or eliminate oscillations of the motor around setpoint . If oscillation
occurs, increase the SEnS value until the motor stops oscillating. If the differential between
the Open and Closed rotation is too large, then decrease the SEnS value. Also, for proper
Position Proportioning operation, it is necessary to specify the actuation time of the valve or
damper from full open to full closed. If the motor has a stroke duration of 60 seconds, change
the value in the Cycle Time parameter Ct1 to 60. This ensures that the controller will move
the motor for the proper amount of time when making adjustments.
4.1.2.8 PROPORTIONAL OUTPUT PERCENTAGE DISPLAY
While in the Control mode, pressing the UP and the Scroll keys at the same time will cause
the display to sequence through a series of display codes and values:
Po1 Percent Output 1 (if applicable) Output 1% value
Po2 Percent Output 2(if applicable) Output 2% value
Proc Process Value Actual Process Value
Each code and output value will be displayed only if the corresponding proportional output is
present. Each code or value will be displayed for 1 second. This sequence of displays will
continue until the SCROLL key is pressed, which will then return the display to the normal
mode. Displays will be sequenced for both Pen 1 and 2 as applicable on dual pen
instruments.
Page 47

4.1.3 MANUAL MODE FOR PROPORTIONAL OUTPUTS
Manual adjustment of the proportional output(s) can be used to test the operation of the
output(s), while tuning to establish basic process control, or to provide control of the proportional output(s) during the occurance of certain error conditions.
Note: The proportional output(s) do not change automatically in response to changes
in the process while in the Manual mode. Be sure to pay close attention to the process
to avoid damage.
To enter the Manual mode, press and release the AUTO/MAN key for the specific pen. If the
Standby mode is on in the Enable mode and a control output is selected for proportional
control, the instrument will enter the Manual mode. The Manual mode status LED will light for
that pen to indicate that the Manual mode is in use. Shifting from the Control to the Manual
mode is bumpless. The proportional output(s) will stay at the last value(s) calculated by the
control algorithm. Po1 will appear on the display if output 1 is a proportional output or Po2 if
output 1 is not a proportional control.
In order to vary a proportinal output value, press and release the SCROLL key until the
display code for the output is displayed Po1 or Po2. Press the SCROLL key to see the
percentage of output value. Press the UP key to increase the output percentage value. Press
the DOWN key to decrease the output percentage value.
If no keys are pressed, the display will sequence through the following displays:
Po1 if output 1 is 3, 4, 5, 6, 7 then the output 1 percentage of output value.
Po2 if output 2 is 3, 4, 5, 6 then the output percentage of output value.
PAGE 47
Proc will be displayed then current process value for that pen.
In order to change a proportional value once the cyclic display begins, press and release the
UP or DOWN key then press the SCROLL key until the display code for the output is displayed Po1 or Po2. Press the SCROLL key again to see the percentage of output value.
Press the UP key to increase the output percentage value. Press the DOWN key to decrease
the output percentage value.
To return to the Control mode of operation from the Manual mode, press the specified AUTO/
MAN key. If the Automatic Transfer feature is selected in the Program mode, the instrument
will switch from the Manual mode to the Control mode when the process value reaches the
setpoint value.
Alarm Operation 4.2
There are two alarms available per pen. The type of alarm is selected in the Program mode
as follows:
1. Process Alarm Direct - the alarm will be on if the process value is greater than the process
value selected.
2. Process Alarm Reverse - the alarm will be on if the process value is less than the process
value selected.
3. Deviation Alarm Direct - the alarm will be on if the process value is greater than the
setpoint plus the deviation value selected.
4. Deviation Alarm Reverse - the alarm will be on if the process value is less than the
setpoint plus the deviation value selected.
5. Deviation Band Alarm Open Within - the alarm will be on if the process value is greater
than one half the deviation band alarm values selected above or below the setpoint.
Page 48

PAGE 48
6. Deviation Band Alarm Closed Within - the alarm will be on if the process value is less than
one half the deviation band value selected above or below the setpoint.
The alarms will be active while the instrument is in the Control mode. Relay and solid state
relay drivers can be assigned to provide output capability for the alarm functions.
The alarm value (Process deviation or bandwidth) is selected in the Tune mode.
Alarm output chatter can be reduced by using the hysteresis for the alarm outputs adjustable
in the Program mode to create a deadband around the alarm point.
Tune Mode Operation 4.3
Proportional output controllers may require the adjustment (tuning) of the PID and other
related parameters. This provides a means for the instrument’s control algorithm to be
adjusted to meet specific application requirements.
4.3.1 SYSTEMATIC TUNING METHOD
1. Changes in tuning parameters should be made one at a time.
2. After making any changes in tuning parameters, a disturbance should be introduced into
the process so that the process reaction may be observed. This process reaction, or
recovery, will tell whether the tuning parameters provide the desired control. It is usually
easiest to make a step change in setpoint to introduce this disturbance.
3. The change in setpoint, or disturbance, referenced above should be large enough to cause
an observable deviation of process from setpoint. However, this change should not be so
large that it will cause the controller output to proceed to either extreme limit.
4. Controller tuning for optimal control is not hard and fast, BE PATIENT: The process will
take a certain amount of time to react to the setpoint changes during tuning. The amount of
time depends upon the specific process, however, a period of 8 to 12 minutes should be
allowed between changes. The important point to remember is to allow the process to
react completely, do not rush through tuning of the controller. If the complete process
reaction is not observed, optimum control may never be achieved.
5. Time Proportioning control output(s) require the cycle time be adjusted for the application.
Short cycle times typically result in the most accurate process control, but will cause the
quickest wear out of any mechanical components.
6. Leave all other tuning parameters (except for the alarm and barometeric pressure settings)
at the factory default settings. Obtain the best possible process reaction by adjusting the
Proportional Bandwidth parameter. The setting that achieves the best response for the
process should be left in the controller programming, and should be noted on the Software
Reference Sheet in Appendix E (page 80).
7. If there are to be no setpoint or load changes in the process, the Proportional Band
adjustment may be all that is necessary for proper control. If an offset still exists (the
process does not settle out at setpoint with the best possible proportional band adjustment)
Manual Reset may be added to eliminate this offset.
8. Auto Reset may be added to eliminate offsets and improve response to setpoint and load
changes. Increase Auto Reset from 0 in 0.2 increments. Start with a small amount.
Increase this increment if there is no apparent reaction. Remember to allow the process 8
to 12 minutes to react to any changes.
9. If necessary, Rate may be added. Rate is a dynamic tuning parameter. Rate may be
required to compensate for process lags or to help inhibit reset windup when a large
amount of Auto Reset (4 or 5 repeats per minute) is being used.
10. Controller tuning is not hard and fast. It may be necessary to adjust the tuning parameters
over a period of time to obtain optimal control of the process.
Page 49

4.3.2 ZIEGLER NICHOLS TUNING METHOD
This procedure has been determined empirically to yield 1/4 wave decay tuning parameters
that are determined by watching the system in a sustained oscillation (curve C, page 49, the
ultimate proportional band and ultimate time period) and then using these values from this
sustained oscillation to calculate ideal parameters.
To aid in determining the process oscillation, the instrument configuration parameters can be
adjusted. By reducing the chart upper value Cru and increasing the chart lower value CrL the
resolution of the oscillation can be better observed. Also the chart rotation time Crt can be
reduced to improve the observation of the oscillation cycle times.
Determining Ultimate Proportional Band and Ultimate Time Period
1. Set Manual Reset rSet to 0.0, set ArS1 and ArS2 to 0.0 and set rt1 and rt2 to
0.0.
2. Enter the Control mode of operation, observe the process reaction.
3. Set the Proportional Band (PB) at 100 and upset the process and observe the
response. One easy method for imposing the upset is to move the setpoint for a
few seconds and then return it to its original value.
4. Achieve a response curve similiar to the sustained oscillation (curve C), this is the
Ultimate Proportional Band (UPB) and Ultimate Time Period (UTP).
a) If the response curve from step 3 does not dampen, as in Curve A from
the drawing, the PB is too low. The PB should be increased and step 3
repeated.
PAGE 49
b) If the response in step 3 dampen, the PB is too high. The PB should
be decreased and step 3 repeated.
These values obtained for Ultimate Proportional Band (UPB) and Ultimate Time Period (UTP)
are used to calculate ideal P, PI, PD, PID tuning parameters using the following ZieglerNichols equations:
Proportional only control (P) -
P (Pb) = 2 x UPB (degrees or units)
Proportional plus automatic reset (PI) -
P (Pb) = 2.2 x UPB (degrees or units)
I (ArSt) = 1.2 / UTP (repeats per minute)
Proportional plus derivative (or rate) (PD) -
P (Pb) = 1.7 x UPB (degrees or units)
D (rAtE) = UTP / 8 (minutes)
Proportional plus automatic reset plus derivative (PID) -
P (Pb) = 1.7 x UPB (degrees or units)
I (ArSt) = 2 / UTP (repeats per minute
D (rAtE) = UTP / 8 (minutes)
If an overdamped response is desired, multiply the proportional band by two.
Page 50

PAGE 50
Period
C
B
A
Curve A : unstable
Curve B : stable
Curve C : continuously cycling, ultimate PB and period
Page 51

Service 5.1
This section contains information regarding calibration and test procedures that can be
performed in the field as well as items concerning the normal maintenance of the instrument.
Changing Charts 5.2
Chart changes may be done while in the normal operating mode.
CAUTION: The chart flange assembly pin is sharp to perforate the chart. Use caution
while installing the chart to avoid coming into contact with the pin.
1. Depress and hold the UP and DOWN keys for between 2 and 3 seconds. Immediately
after depressing the keys, the unit will do a Lamp Test with all LED segments and indicators
lighted on the upper (and lower) display.
2. After 2-3 seconds, the display will show Cchg, the pen(s) will move to and remain at a
point above the top graduation on the chart and the chart will stop rotating. All other functions
remain active (Control, Display, etc).
3. Open the instrument door, snap up the chart hold down lever on the chart flange assembly,
gently lift the pen(s) and remove old chart.
PAGE 51
4. With the pen(s) held up, install new chart. Be sure to line up the chart time line so that the
current time is aligned with the time setting mark on the chart platen.
5. Snap down chart hold down lever and close the instrument door.
6. Depress and hold the UP and DOWN keys for between 2 and 3 seconds. Immediately
after depressing the keys, the unit will do a Lamp Test with all LED segments and indicators
lighted on the upper (and lower) display.
7. After 2-3 seconds, the display will show Cchg momentarily, then the pen(s) position and
chart rotation will be restored.
Changing Pens 5.3
Open the instrument door. Refer to Figure 5-1 for pen changing procedure. This procedure is
also provided on a label on the instrument chart platen. Be sure to replace the pen cartridge
with the same type (color) that was removed. Be careful not to bend the pen arm while
changing the pen.
FIGURE 5-1
Changing Pens
1
For replacement
pen cartridges order:
2
To install pen, slide pen into
holder (1) and push down (2)
as shown by arrows.
Green #60500401
Red #60500402
(Pens are sold in lots
of 5 each)
2
1
To remove pen, pull up at
back end (1) and push out.
Page 52

PAGE 52
Calibration 5.4
CAUTION: Do not attempt any calibrations without the proper test equipment that meets or exceeds
the specifications listed.
Press and release the SCROLL key until CAL appears on the display , then press the DOWN
key to enter the mode. The display will change to CAL1. Press the SCROLL key to advance
the display to the other calibration modes available. For two pen units, CAL2 and CAL 3 will
only need to be preformed on TB 4 to calibrate both TB4 and TB5 inputs. Both TB 4 and TB
5 inputs must be calibrated for RTD inputs. Table 5-1 provides a listing of field calibration
routines. All instruments are calibrated prior to shipment from factory.
CALIBRATION FLOW CHART
CAL
CAL1
ON
OFF
Key
Actual Display
On/Off Display Use arrow keys
to turn on or off
Scroll Key
CAL2
CAL3
CAL4
CAL5
CAL6
CAL7
Numeric Display Use arrow keys
to change value
Up Arrow Key
Down Arrow
CAL8
CAL9
Page 53

TABLE 5-1 CALIBRATION PROCEDURES
Calibration
Procedure Description
PAGE 53
CAL 1 Reinitialization of Program and Tuning mode values. All parameters are
CAL 2 Main calibration necessary for all input types.
CAL 3 Cold Junction Compensation calibration used to correct for component
CAL 4 Cold Junction Utility, displays temperature the cold junction compensator
CAL 5 RTD input calibration. Necessary to be performed on both terminal boards.
CAL 6 Cold Junction Compensation on/off. Used for validating thermocouple
CAL 7 Factory use only
CAL 8 Reintialization of all profile information.
CAL 9 Pen position calibration used to calibrate pens to chart.
reset to factory set default values.
variation in the CJC circuit. Necessary for thermocouple inputs.
is sensing. No adjustment is made with this procedure.
inputs with a millivolt source. (Non temperature compensating)
5.4.1 CAL 1 PARAMETER RE-INITIALIZATION
This routine is used to clear all information in the Program and Tune modes. All parameters
will be reset to default values.
Program and Tune values are written down so that they can be re-entered after
Calibration 1 is completed. No test equipment required.
Before performing this procedure make sure that the
With CAL 1 displayed, press and hold the DOWN key, then press the SCROLL key. The
display will momentarily blank; Release the keys. Upon completion of the routine CAL 1 will
reappear on the display.
5.4.2 CAL 2 MAIN CALIBRATION
This routine determines and saves calibration values which correct for component variations
relating to the basic measuring function of the unit. A 12.4 mVDC ± .01mVDC source is
required for testing.
non-volt positions. See Appendix A-1 (page 68) for proper positioning. After
completing CAL2, be sure to reposition these jumpers to the appropriate position for
your input.
With CAL 2 displayed, press and hold the DOWN key, then press the SCROLL key. Release
the keys when the instrument displays hLd1. Short both input terminals, TB4 & TB5, or apply
0.00, ± .01 mVDC to TB 4 terminals 1 and 2. Press the DOWN key and dELy will appear for
10 seconds, then SCAn will appear for 10 seconds. A calibration reference number will then
appear; this should be 0 ± 50. If this number falls outside these limits, press the SCROLL key
and CAL 2 will be displayed. Perform the calibration again. Repeat the calibration until the
number falls within the tolerance limits. If the number remains outside the limits, check the
connections and try the calibration again. If the number does not approach the tolerance limits
contact the nearest representative or the factory for assistance. With an acceptable reference
number on the display, remove the short and connect a 12.4, ± .01 mVDC source to the TB 4
terminals 1 and 2. Be sure to observe the proper polarity when connecting the source.
Terminal 1 is positive and terminal 2 is negative. Press the DOWN key, deLy will be displayed for 10 seconds and then SCAn for 10 seconds. When the calibration is complete CAL
2 will reappear.
Make sure that the Processor board jumpers JU4 and JU5 are in the
Page 54

PAGE 54
Error recovery:
See section 5.6 (page 60) for details. Insure that the millivolt source is connected correctly
and functioning properly.
The calibration can be exited when hLd1 or the calibration reference number is displayed by
pressing the SCROLL key.
CAL2 QUICK CALIBRATION
This routine will allow the operator to execute a rough calibration on their unit via the keypad
with no other equipment or disturbance to established wiring. It is intended to provide a partial
recovery from a calibration corruption where the necessary equipment indicated may not be
available. It should be noted that this is not intended as a substitution to the main calibration
procedure described earlier and may deter considerably from the accuracy of the instrument.
With CAL2 displayed, press and hold the DOWN ARROW key, then press the SCROLL key.
Release both keys and the instrument will display hLd1. Press and hold the UP ARROW key,
then press the SCROLL key. The display will momentarily blank and then CAL1 will be
displayed. Release both keys and depress the UP ARROW key. CAL will be displayed.
5.4.3 CAL 3 COLD JUNCTION COMPENSATION
This routine determines and saves calibration values which correct for component variations
relating to the cold junction compensation. This calibration must be preceded by CAL 2 the
main calibration, to properly calibrate the instrument. These two calibrations are all that is
needed for proper operation with thermocouple inputs.
Test equipment: 1-type J thermocouple
Allow 30 minutes of warm up time for the instrument with the thermocoupleconnected
before proceeding with calibration.
Operation:
With CAL 3 displayed press and hold the DOWN key, then press the SCROLL key . Release
both keys and the instrument will display hoLd. Connect the J thermocouple to TB 4 terminals
1 and 2 and place the thermometer inside the case at the bottom of the instrument. Short the
input terminals TB5, 1 and 2. Press the DOWN key, deLy will be displayed for about 10
seconds, then SCAn for 10 seconds. The display will be the temperature to the nearest tenth
of a degree C. Compare the display reading with thermometer and use the UP and DOWN
keys to correct the reading. To exit press the SCROLL key and CAL 3 will be displayed again.
If the display stays in SCAn for more than 15-20 seconds, press the SCROLL key. CAL3
should be displayed. With CAL3 displayed, while pressing the DOWN key, press the
SCROLL key. The instrument will display hoLd. Press the UP key. The instrument will begin
the calibration procedure with a default calibration value and proceed to dELy as described .
Error recovery:
See section 5.6 (page 60) for details on specific errors. The calibration can be exited if hoLd
or the CJC temperature is displayed by pressing the SCROLL Key.
1-mercury thermometer ± .25 degrees F or equivalent
5.4.4 CAL 4 COLD JUNCTION UTITILITY
This procedure displays the temperature the cold junction compensator is sensing. No test
equipment is required.
With CAL 4 displayed press and hold the DOWN key, then press the SCROLL key . Release
both keys and SCAn will be displayed for 10 seconds while the instrument senses the CJC
temperature. The result will then be displayed to a tenth of a degree C. The input terminals
must be shorted. CAL 3 must first be performed.
ambient temperature. It is the temperature of the CJC .
and CAL 4 will be displayed.
The displayed temperature is not the
To exit, press the SCROLL key
Page 55

5.4.5 CAL 5 RTD INPUT
This procedure determines and saves calibration values relating to RTD inputs. This calibration must be preceded by CAL 2 to properly calibrate the instrument. Both RTD inputs must
be calibrated and both inputs must have valid inputs during the calibration. Decade resistance
substitution box with .01% resolution or equivalent are required.
sor board jumpers JU4, JU6 and JU5, JU7 are in the proper positions. See Appendix A1 (page 68).
With CAL 5 displayed, press and hold the DOWN key and then press the SCROLL key.The
display will now be PEn1 to indicate that the instrument is set to calibrate the RTD input on
TB 4 . Press the DOWN key to change the display to PEn2 to calibrate the RTD input at TB
5. Choose the input TB to be calibrated and press the SCROLL key, hLd1 will then be
displayed. Connect the decade box at 100 ohm setting across the input terminals 1 and 2 and
a jumper wire from terminal 2 to 3. (Continued on next page)
Press the DOWN key and dELy will be displayed for 10 seconds, then SCAn for ten seconds.
When hLd2 is displayed, change the decade box setting to 138.5 ohms to the input terminals
( do not disturb the wiring) and press the DOWN key. The display will change to dELy for 10
seconds, followed by SCAn for ten more seconds. CAL 5 will be displayed after the calibration is completed.
Error recovery:
See section 5.6 (page 60) for details on specific errors.
The calibration can be exited when the instrument displays hLd1 or hLd2 by pressing the
SCROLL key.
Make sure that the Proces-
PAGE 55
5.4.6 CAL 6 COLD JUNCTION UTILITY
This routine provides selection of operating modes for the cold junction compensation used
for thermocouple inputs.
With CAL 6 displayed, press and hold the DOWN key, then press the SCROLL key. The
instrument will display C6 and the number of the mode in effect. Press the UP or DOWN key
to change the mode selection indicated by the number to the right of the C6. Pressing the
SCROLL key will exit the calibration with the last mode number displayed in effect.
The selected mode will remain in effect if power is interrupted. To return the instrument to
normal operation, CAL 6 must be exited, with mode zero selected, or CAL 1 must be
executed to initialize all parameters.
Mode 0: Normal operating mode.
Mode 1: Cold Junction Compensation temperature will be internally fixed at 0 degrees C by
the software to facilitate linearization testing when using an uncompensated millivolt source to
simulate the thermocouple millivolt input signal .
This calibration mode is only available on dual pen instruments.
Mode 2: Select Mode 2. Exit the Calibration Mode. Enter setpoint (SP) values for Pen 1 and
for Pen 2. The SP for Pen 1 is used as the dry-bulb temperature and the SP for Pen 2 is used
as the wet-bulb temperature. Enter Setpoints (dry-bulb and wet-bulb temperatures) for a
known Relative Humidity value. Pen 1 or Pen 2 must also be preselected for Relative
Humidity-PEnS=3. Check the display for the pen with PEnS=3 for the Relative Humidity
percentage based on Setpoint selections of Pen 1 and Pen 2. After viewing the Relative
Humidity percentage, enter the Calibration Mode, CAL 6, and select 0 (normal mode) for the
mode selection. Exit the Calibration Mode and return the instrument to the desired mode of
operation. This is a validation of the accuracy of the instrument’s algorithm and Pen 1 and
Pen 2 accuracy where whole numbers are used. The instrument will not control properly while
in this mode.
Note: If the Process Value exceeds 999.9, the leftmost digit will be the letter o with a bar over
it. The other digits will be valid.
Page 56

PAGE 56
WARNING: It is highly recommended to disconnect all outputs before selecting Mode 2 of CAL 6 as the
instrument will not control properly.
If the mode value can only be set to 0 or 1, only the normal and CJC Temp= 0 are available.
This change applies to newer software which includes normal operation to a tenth of a degree.
5.4.7 CAL 8 PROFILE REINTIALIZATION
This procedure is used to erase all profiles that have been entered in the instrument. Be sure
to record any profile information on the Profile Recording Sheets (Appendix F, page 83) that
will need to be re-entered after performing this procedure
With CAL 8 displayed, press and hold the DOWN key , then press the SCROLL key. The
display will blank momentarily and then CAL 8 will be displayed.
5.4.8 CAL 9 PEN CALIBRATION
This procedure is used to calibrate the pen(s). No special test equipment required.
Valid inputs must be connected to TB 4 and TB 5 before performing this calibration. With CAL
9 displayed, push and hold the DOWN key, then press the SCROLL key . Release both keys
and the display will indicate PEn1. For 2 Pen instruments, press the DOWN key to toggle the
display between pen 1 and pen 2. With desired pen displayed, press the SCROLL key.
FOR INSTRUMENTS WITH SOFTWARE REVISION R2.99 AND BELOW:
dELY will be displayed as the pen selected moves toward the center chart hub. PEnL will be
displayed; use the UP and/or DOWN keys to adjust the pen to the low end or 0% of the chart.
When adjusted, press the SCROLL key, SCAn will appear for 10 seconds and the pen location
value will be saved in memory. Next dELY will appear as the pen moves to the outer edge or,
100% mark on the chart. PEnh will appear, use the UP and/or DOWN keys to adjust the pen
position to the proper 100% of chart position. Press the SCROLL key and SCAn will be
displayed as the pen position value is saved. Then dELy will be displayed as the pen moves
to about mid-scale. CAL9 will be displayed showing that the calibration is complete. When
the calibration is complete, with CAL9 displayed, press the UP key twice to properly exit the
calibration mode. CAL9 can now be repeated on the other pen of a 2 pen instrument or
another routine can be selected.
FOR INSTRUMENT WITH SOFTWARE REVISION R3.00 AND ABOVE:
P.dn will be displayed while the selected pen is moved to it's "HOME" position (toward the
chart hub) with the decimal point flashing to indicate this mode. Once "Pen Home" is found,
the pen will move to the inner ring and PEnL will be displayed. At this point, one of two
adjustments may be made; Pen Arc or Zero and Span.
Pen Arc - To adjust the pen arc, the UP and DOWN keys are pressed simultaneously to draw
an arc for visual reference. The display will show P uP while the selected pen moved upscale
to the top stop position. The pen then moves back downscale to nominally place the pen at
the outer ring (100%) of the chart. The display will now display ArC. The pen arm may be
loosened and the length adjusted to a position and angle to place the pen tip near the outer
ring then re-tighten the pen arm. Press any key and the pen will drive to "HOME", then back to
the inner ring (0%) and PEnL will be displayed.
Zero and Span - To begin a pen zero, with PEnL in the display, the UP or DOWN key may be
pressed to move the pen to the low end of the chart span (0%). When adjusted, press the
SCROLL key and P uP is displayed while the pen is moved to the outer edge (100%) of the
chart, then PEnh is displayed. To adjust pen span, use the UP and DOWN keys to adjust the
pen for the high end (100%) of the chart. When adjusted, press the SCROLL key and P dn
will be displayed for about 5 seconds while the pen is moved to the 50% point on the chart,
then PEn1 is displayed. Calibration may now be performed again to verify the accuracy, or
press the UP key twice to exit back to the CAL mode.
Page 57

Test Mode Procedures 5.5
To enter the Test mode, press and release the SCROLL key until tESt appears on the
display then press the DOWN key. tSt1 will be displayed, press and release the SCROLL key
to advance the display to the desired test. Tests 1, 2 and 3 are preformed as a unit so the
display will advance directly to tSt4 from tSt1. Listed below in Table 5-2 are the test procedures available. Test 1, 2 and 3 are performed on start up, periodically during operation, and
on entry into the Test mode. Test 4 is executed on entry into and periodically during the
Control mode. These tests can be used as a trouble shooting aid.
TEST MODE FLOW CHART
tESt
tSt1
PAGE 57
tSt4
tSt5
tSt6
tSt7
tSt8
tSt9
ON
OFF
Key
Actual Display
On/Off Display Use arrow keys
to turn on or off
Scroll Key
tStA
Numeric Display Use arrow keys
to change value
Up Arrow Key
Down Arrow
Page 58

PAGE 58
TABLE 5-2 TEST PROCEDURES AND DESCRIPTION
Test Description
Test 1 Microprocessor internal RAM test. Used to check the processor RAM to
Test 2 External RAM test, used to test the RAM chip for proper function.
Test 3 EPROM checksum test, used to check that the EPROM program is
Test 4 External RAM checksum test; instrument test and identifies how many
Test 5 Verifies that all keys are functional and all LEDs are working.
Test 6 Used to verify that all relays and solid state relay driver outputs are working
Test 7 This procedure will allow operator to adjust the current output value to
Test 8 Pen and chart motor operational check.
Test 9 Auxiliary Input Test. Allows for the viewing of the optional auxiliary input
Test A Communications Hardware Test.
make sure it is functioning correctly.
correct.
times Errors16, 17 and18 have occurred.
correctly.
check the output and to test the operation of the external device.
voltage level and the pen motor position feedback signal.
5.5.1 TEST 1 INTERNAL RAM TEST
Tests the Random Access Memory internal to the microprocessor. No special test equipment
is required.
With tSt1 displayed, press and hold the DOWN key, then press the SCROLL key. tSt1 will be
displayed momentarily while the test is in progress. Upon successful completion, the instrument will proceed to Test 2.
5.5.2 TEST 2 EXTERNAL RAM TEST
Tests the battery backed-up RAM external to the microcomputer. No special test equipment is
required.
After completion of Test 1, tSt2 will be displayed momentarily while the test is in progress.
Upon successful completion, the instrument will proceed to Test 3.
5.5.3 TEST 3 PROGRAM EPROM TEST
This is a checksum test to verify data integrity of the stored program. No special test equipment is required.
After completion of Test 2, tSt3 will be displayed momentarily while the test is in progress.
Upon successful completion of Test 3 tst1 will be displayed.
5.5.4 TEST 4 EXTERNAL RAM CHECKSUM TEST
This is a checksum test to verify the integrity of data stored in RAM and indicate the number
of times the instrument has had an Error 16 or 17. The unit may have automatically recovered
from these errors. No special test equipment is required.
With tst4 displayed, press and hold the DOWN key then press the SCROLL key. The display
will blank momentarily, then momentarily display two numbers, and then tst4 will be displayed. These numbers indicate the number of times Error 16 and 17 have occurred respectively. Test 4 can be executed again, or another test may be selected.
Page 59

5.5.5 TEST 5 KEYPAD/DISPLAY TEST
This test allows the operator to verify that the keys work and that all display elements can be
lighted. No special test equipment is required.
With tSt5 displayed press and hold the DOWN key, then press the SCROLL key and then
release both keys. The display will go blank. The following code will be displayed while the
corresponding key is pressed:
Key Display
SCROLL SCrL
UP uAro
DOWN dAro
AUTO/MAN (Pen 1) Autu
RUN/HOLD run
AUTO/MAN (Pen 2) AutL
UP and DOWN (All LED’s and segments lit)
SCROLL and UP (exit)
To exit, press the SCROLL and UP keys simultaneously, tSt5 will be displayed.
5.5.6 TEST 6 RELAY/ SOLID STATE RELAY DRIVER OUTPUT TEST
Allows the operator to verify that the Relay and /or the Solid State Relay Driver output(s) are
working. A volt/ohm meter will be required to test the output.
With tSt6 displayed, press and hold the DOWN key, then press the SCROLL key. oFF will be
displayed. For SPST Relay outputs, connect the meter across the relay output in the ohm
scale. For SPDT Relay outputs, connect the meter across the N.O. and COM output in the
ohm scale. The meter should read continuity with the relay on and infinity when the relay is
off. For SSR Driver outputs, connect the meter across the output in the Volt DC scale. The
meter should read 5 VDC when the SSR driver is on and 0 VDC when the driver is off. Press
and release the DOWN key to advance through the following sequence:
PAGE 59
DISPLAY RELAY ON SPST RELAY ON SPDT
rLYA AA
rLYb BB
rLYC CC
rLYd DD
rLYE E None
rLYF F None
rLYg GG
rLYH HH
oFF None None
To exit, press the SCROLL key and tSt6 will be displayed. The existence of Relay and
Solid State Relay Driver output(s) is dependent upon the hardware configuration.
5.5.7 TEST 7 CURRENT OUTPUT TEST
This test allows the operator to verify that the current output(s) are functioning properly or will
allow the selection of an output value for testing of associated equipment. A milliamp meter is
required for testing.
With tSt7 displayed press and hold the DOWN key, then press the SCROLL key. The display
will indicate CurA, for the first current output. By pressing the DOWN key, the instrument will
advance through the selection sequence of Curb, CurC, Curd, and then back to CurA.
Choose the desired output to be tested and connect the milliamp meter across the output
terminals being tested. Be sure to observe the proper polarity when connecting the meter.
Terminal 1 is positive and terminal 2 is negative. Press the SCROLL key and the display will
indicate 4 milliamps. Use the UP and/or DOWN key to increase or decrease the current
output in 1 mADC steps from 0 to 20 mADC. The current output reading should be +/- 0.1
mADC at any output value. An +/- 5 % of span adjustment for the current output(s) is provided by using the potentiometer adjacent to the current output on the Current Output board.
See Appendix A-4 (page 83) .
Page 60

PAGE 60
To exit the test, press the SCROLL key and tSt7 will be displayed. The existence of a
mADC current output is dependent upon the hardware configuration.
5.5.8 TEST 8 PEN/CHART MOTOR TEST
This test allows the operator to verify that pen and chart motors are functioning properly. No
special test equipment is required.
With tSt8 displayed press and hold the DOWN key, then press the SCROLL key. The display
will show ALL while the test is in progress. This test functions automatically. The chart speed
will be at maximum, approximately 80 seconds per revolution. Starting at the current pen
position, pen 1 will move (sweep) upscale for 2 seconds, then downscale for 2 seconds. Pen
2 (if provided) will sweep in the opposite direction. The pens will continue to cycle until the test
is exited. To exit, press the SCROLL key. The display will show tSt8.
5.5.9 TEST 9 AUXILARY INPUT TEST
This test allows the operator to verify that the auxiliary input(s), if specified, pen position
feedback input(s) are functioning properly.
Auxiliary inputs are the remote setpoint and position proportioning options. With tSt9 dis-
played, press and hold the DOWN key, then press the SCROLL key. The display will show
Ai1, Auxiliary Input 1. By pressing the DOWN key, the instrument will sequence through the
selections for testing: PF1, Ai2, PF2, then back to Ai1 (PF=Pen Feedback). With the desired
input selected, press the SCROLL key. The corresponding value will be displayed. For
software revision R2.99 and below only, the pen position feedback input voltage will be
displayed to the nearest tenth of a millivolt. Manually move the pen up and down scale and
verify that the displayed reading changes from about 0 to 50 millivolts. For software revision
R3.00 and above, the pen position feedback input voltages are disabled and will display a
fixed value of zero. To terminate a particular test, press the SCROLL key. The display will
show tSt9.
5.5.10 TEST A COMMUNICATION HARDWARE TEST (Communications Option)
This test allows the operator to verify that the communications hardware is functioning
properly.
With tStA displayed, press and hold the DOWN key then press the SCROLL key. The display
will indicate SEnd. Press the DOWN key to toggle the display between SEnd and rEC . With
the desired function selected, press the SCROLL key. In the SEnd (send or transmit) mode,
the instrument will repeat the following sequence. First the transmitter will output a logic 1 on
the line for one second. Next the transmitter will change the logic level to 0 for one second.
Then the transmitter will disable for one second. In the rEC (receive) mode, the transmitter is
continuously disabled. In either mode, the instrument will monitor the line and display rEC1
when a logic 1 is on the line or rEC0 when a logic 0 is on the line . In the SEnd mode, the
instrument will display rEC when the transmitter is disabled. To perform an internal test and
verify the basic operation of the hardware, place the instrument in the Send mode and verify
that the display cycles through rEC1, rEC0, and rEC. To verify that the transmitter functions
properly, two LED’s, each with a current limiting resistor, can be connected with opposite
polarity observed to the TB 2 terminals 1 and 2. The following three states should be observed: one LED on, then the other LED on, then both off. Alternately, a load resistor can be
placed on the terminals, and observe that the voltage generated across the load resistor is as
follows: > +3 VDC, then < -3 VDC, and then 0 VDC.
Another method, to test the communications hardware, would be to connect one or more
instruments in the Receive mode to an instrument in the Send mode. All of the instruments in
the Receive mode should have their displays alternating in sync with the instrument in the
Send mode. When the sending instrument displays rEC, the receiving instruments should
display rEC1. To terminate the test, press the SCROLL key for one second. Upon exit, tStA
will be displayed. The existence of the communications hardware is dependent on the
hardware configuration.
Page 61

Trouble-shooting and Diagnostics 5.6
The Trouble-shooting Guidelines Section consists of two columns. The first column is a list of
some possible instrument conditions. The second column is a list of steps that should improve
the condition. The steps should be performed in order until the condition improves or all the
steps have been completed. If the instrument condition has not improved contact the nearest
Partlow representative or the factory for assistance.
Trouble-shooting should be performed by qualified personnel using the proper equipment and
following all safety precautions. Whenever possible the trouble-shooting should be accomplished with the electrical power disconnected. The instrument contains static sensitive
components so care should be taken to observe anti-static procedures.
Condition Correction Steps
PAGE 61
Display(s) is/are blank 1. Verify that the correct instrument power, as indicated
on the wiring label on the platen, is supplied to TB 1
terminals 1 & 2. Check the position of the power select
switch, on 230 VAC models, correctly indicates the
power that is connected to the instrument. If the switch
does not indicate the correct voltage reposition as
necessary. If the voltageis not correct check the
power source.
2. Turn off the instrument power. Wait about 5 seconds
then turn the power on again.
3. Turn off the instrument power, open the cover, loosen
the platen hold down screw, and swing the platen out
of the way. Inspect the instrument for poor
connections.
a. The white ribbon cables that connect the
Processor board (Appendix A-1, page 68) to
the platen must be properly aligned and
seated in the sockets.
b. The display board(s) white ribbon cable(s)
pins should be properly aligned and seated in
the sockets on the platen potentiometer
segment board.
c. Inspect the PROM, RAM and
microprocessor chips to see if they are
properly seated in their sockets (Appendix
A-1, page 68).
d. Close the platen and tighten the hold down
screw. Close the cover and turn on the power
to see if the display(s) will now light.
4. Turn off the instrument power. Press and hold the UP
and DOWN keys. Turn on the power. Hold the keys
pressed for about 10 seconds. If the display(s) light(s),
the model number, Program and Tune mode
parameters will need to be re-entered (page 30 and
37, or the Software Ref. Sheet, page 80, if already
filled out).
Page 62

PAGE 62
Model Number Displayed 1. Turn off the instrument power, wait 5 seconds then
during power up is incorrect re-apply the power. Verify that the number displayed
(Re-initialization) during the power up sequence is the same as
indicated on the label affixed to the platen. If the
number displayed is incorrect perform the following
steps:
a. Turn off the power to the instrument. Press
and hold the UP and DOWN keys. Turn on
the power and keep the keys pressed until
the model number displayed resets to 77X0 0000-0000. Release the keys and turn off the
power.
b. To enter the correct model number press and
hold the SCROLL and DOWN keys and turn
on the instrument power. 77X0 should be
displayed. Wait about 5 seconds and release
the keys. The display should stay 77X0. Use
the UP/DOWN keys as necessary to change
the displayed number to match the first 4
digits of the model number as indicated on
the label on the platen. After adjusting
the first 4 digits to the proper values, press
the SCROLL key and the display will change
to be 0000. Use the UP/DOWN keys to set
the next 4 digits of the model number to the
correct values. Press the Scroll key and the
display will be 0X21. Use the UP/DOWN keys
as necessary to adjust the last 4 digits of the
number. Press the SCROLL key and the
power up sequence will complete. The
Program and Tune mode parameters will
need to be re-entered (page 30 and 37), or
the Software Ref. Sheet, page 80, if already
filled out).
Relay/SSR Driver 1. Verify that the Program and Tune mode parameters
malfunction are correctly set (page 30 and 37, or the Software Ref.
Sheet, page 80, if already filled out).
2. Turn off the power to the instrument. Wait about 5
seconds and turn the power on again. Confirm
that the model number displayed during the power up
sequence indicates that the output(s) is/are present in
the instrument. See Appendix C (page 75) for the
model number explanation/decoding. This number
should match the number on the label affixed to the
platen.
3. Turn off the power to the instrument. Open the cover.
Loosen the platen hold down screw and swing the
platen open. Inspect the instrument Relay/SSR Driver
board (See Fig. 2-4, page 14) for the presence of
the output device(s). An output relay will appear to be
a cube. The SSR Driver will appear as a resistor and a
jumper wire. The output will not work if the hardware is
not present. Inspect that the output terminal
connections are present and firmly attached.
Page 63

4. Check the output(s) operation by performing Test 6 as
described in the Test section. If the output(s) function
in the Test mode, check the Program and Tune mode
parameters to see if correctly selected (see page 30 &
37 or the Software Ref. Sheet, page 75, if already
filled out).
5. If the output appears not to turn off remove the power
to the instrument. Open the cover and loosen the
platen hold down screw. Swing the platen open. Clip
the resistor located on the Relay Board adjacent to the
output(s) that seem to stay on (See Appendix A-2, A-3
page 69, 70). A .01 microfarrad, 1 KV should be
connected from the terminal listed below, for the
output where the resistor indicated was removed, to
the AC ground.
Relay A R1 TB 6 Terminal 1
Relay B R2 TB 6 Terminal 3
Relay C R3 TB 7 Terminal 1
Relay D R4 TB 7 Terminal 3
Relay E R5 TB 8 Terminal 1
PAGE 63
Relay F R6 TB 8 Terminal 3
Close the platen and tighten the hold down screw. Close
the cover and turn the power on to the instrument. Check
the operation of the output(s).
mADC Output(s) 1. Verify that the Program mode parameters are correctly
malfunction set (page 30 or the Software Ref. Sheet, page 80, if
already filled out).
2. Turn Off the power to the instrument. Wait about 5
seconds and turn the power on again. Confirm that the
model number displayed during the power up
sequence indicates that the output(s) is/are present in
the instrument. See Appendix C (page 75) for the
model number explanation/decoding. This number
should match the number on the label affixed to the
platen.
3. Turn off the power to the instrument. Open the cover.
Loosen the platen hold down screw and swing the
platen open. Inspect the instrument Current Output
board (See Fig. 2-4, page 14) for the presence of
the output device(s). The output will not work if the
hardware is not present. Inspect that the output
terminal connections are present and firmly attached.
Close the platen and tighten the hold down screw.
Close the cover and turn on the power.
4. Refer to the Test section and carry out the procedure
for the Current Output(s) Test 7 (page 58). If the
current output operates properly in the Test mode
recheck the Program mode parameters (page 30, or
the Software Ref. Sheet, page 80, if already filled out).
Page 64

PAGE 64
Note: Since the 7700 is
available as a one pen unit
with one display, even
though it always has two
inputs, the error routine has
been changed. Any error, in
particular pen or input related
errors, will always be
displayed in the upper
display. The second display,
if present, will be blanked.
Therefore, a sensor break on
either input will be identified
by a SnSr message in the
upper display and outputs for
both pens to to the error
condition.
Pen(s) do not operate 1. Verify that the Program mode parameters are properly
set (page 30 or the Software Ref. Sheet, page 80, if
already filled out).
2. If the process value in the display exceeds the chart
upper or the chart lower values selected in the
Program mode the pen will appear stuck at the chart
upper or lower edge respectively. Reconfigure values
as needed by the application (May require a new
chart).
3. Perform Test 8 as described in the Test section of the
manual (page 59) . If the pen(s) operate in Test 8,
perform the pen calibration, Cal 9, as described in the
Calibration section of the manual (page 55). Return
the instrument to the oPEr and check the operation of
the pen(s).
4. For software revision R2.99 and below, perform Test
9 as described in the Test Section of the manual
(page 59). If the pen feedback voltage does not vary,
check the pen Potentiometer Segment board for
proper ribbon cable connection to the Processor
board (Appendix A-1, page 67) and that the pen
position fingers are making contact with Potentiometer
Segment board.
5. For software revision R2.99 and below, inspect to see
that the Potentiometer Segment of the pen feed back
is clean. Use a non-residue type cleaner that does
not affect the plastic to clean the segment if
necessary.
6. Verify the instrument is not in Change Chart function.
Error Code Displayed
SnSr - Sensor Break or 1. Inspect the sensor for proper operation and
Over Range connection to the instrument. Acceptable sensor
ranges for the instrument are listed in the
Specifications section of the Appendix D (page 76).
2. Verify that the Program mode input selection matches
the sensor input connected.
3. Check that the input conditioning jumpers on the
Processor board(Appendix A-1, page 68) are in the
proper position for the sensor input. Check that the
jumpers are in the proper position for the Terminal
Board where the sensor is connected.
4. Perform the calibration procedure(s), as described in
the Calibration section, for the sensor input type.
Hi - Input more than 10% 1. Perform the steps listed for the SnSr Error Condition.
Over Span
Lo - Input more than 10% 1. Perform the steps listed for the SnSr Error Condition.
Under Span
Page 65

FbEr 1. Inspect the Slidewire Feedback connections at
Slidewire Feedback Error terminals 8, 7 and 5. Be sure that the connections are
the same as shown in the position proportioning
illustration (page 20).
2. Measure the resistance of the Slidewire segment. The
minimum resistance must be 135 ohms, the maximum
10 K ohms.
3. Perform the Auxiliary Input Test, Test 9 as described
in the Test secion (page 59). The voltage indicated
should be between 0 and 5 VDC.
rSEr - Remote Setpoint 1. Check the Program mode (page 30) to see that the
Error correct remote setpoint voltage has been selected.
2. Check the voltage at the remote setpoint terminals 3
and 5 for the proper voltage.
o - display overranged 1. If this error code is displayed as a Program or Tune
(the “broken 6” mode parameter perform the Cal 1 procedure as
appears on the left described in the Calibration section of the manual
segment of the display) (page 52).
PAGE 65
2. If this error code appears as part of the model number
during the power up sequence follow the steps listed
for when the “Model Number is not correct”
condition (page 61).
Er 1 - Microprocessor RAM 1. Turn off the power to the instrument. Wait 5 seconds,
Failure and turn the power on.
2. Turn off the power to the instrument. Open the
cover,and loosen the platen hold down screw. Swing
open the platen and inspect that the microprocessor
chip (U5) is properly seated in the socket located on
the Processor board (Appendix A-1, page 68). Close
the platen and tighten the screw. Close the cover and
turn on the power.
Er 2 - External RAM 1. Turn off the power to the instrument. Wait 5 seconds,
Failure and turn the power on.
Er 3 - PROM Checksum 1. Perform the steps listed for Er 1 except that the
Failure PROM (U7) on the Processor board (Appendix A-1,
page 68) should be inspected.
Er 4 - RTD Mismatch Error 1. Check the connections to the instrument for the RTD
Input Calibration(CAL5) are as described in the
Calibration section (page 54). Repeat the RTD Input
Calibration.
Page 66

PAGE 66
Er 5 - No Zero Crossings 1. Turn off the power to the instrument. Wait 5 seconds,
Detected and turn the power on.
2. Connect the instrument to another AC power source.
Er 6 - AC line below 45 HZ 1. Turn off the power to the instrument. Wait 5 seconds,
Er 7 - AC line over 65 HZ 1. Turn off the power to the instrument. Wait 5 seconds,
Er 8 - Cal 2 Volt Input 1. Check that 12.4 mVDC is properly connected to the
Error instrument and is within the tolerance limits as
and turn the power on.
2. Connect the instrument to another AC power source.
and turn the power on.
2. Connect the instrument to another AC power source.
indicated in the CAL2 procedure of the Calibration
section (page 52).
2. Turn off the power to the instrument and open the
cover. Loosen the platen hold down screw and swing
the platen open. Inspect the Processor board
(Appendix A-1, page 68) to insure that the input
conditioning jumper JU4 is in the non-volt position.
The jumper must be in the non-volt position to perform
the Calibration 2 procedure. Close the platen and
tighten the hold down screw. Close the cover and turn
on the power to the instrument.
3. Perform the CAL2 procedure as described in the
Calibration section (page 52).
Er 9 - ADC Reference 1. Perform the CAL2 procedure as described in the
Number Error Calibration section (page 52).
Er10 - ADC Reference 1. Perform the CAL2 procedure as described in the
Voltage Error Calibration section (page 52).
Er11 - Cold Junction 1. Perform the CAL3 procedure as described in the
Compensation Error Calibration section (page 53).
Er12 - CAL2 Voltage Error 1. Check that 12.4 mVDC is properly connected to the
instrument and is within the tolerance limits as
indicated in the CAL2 procedure of the
Calibration section (page 52).
Page 67

2. Turn off the power to the instrument and open the
cover. Loosen the platen hold down screw and swing
the platen open. Inspect the Processor board
(Appendix A-1, page 68) to insure that the input
conditioning jumper JU4 is in the non-volt position.
3. Perform the CAL2 procedure as described in the
Calibration section (page 52).
Er13 - RTD CAL5 Input 1. Check that the resistance device is of the correct value
Error and properly connected to the instrument and is within
the tolerance limits as indicated in the CAL5 procedure
of the Calibration section (page 54).
2. Turn off the power to the instrument and open the
cover. Loosen the platen hold down screw and swing
the platen open. Inspect the Processor board
(Appendix A-1, page 68) to insure that the input
conditioning jumpers are in the correct position for the
RTD input for the Terminal Board being calibrated.
For TB 4, JU4 should be in the non-volt position
and JU6 in the RTD position. For TB 5, JU5 should be
in the non-volt position and JU7 in the RTD position.
3. Perform the CAL5 procedure as described in the
Calibration section (page 54).
PAGE 67
Er14 - Cold Junction 1. Perform the CAL3 procedure as described in the
Compensation Error Calibration section (page 53).
Er15 - Ground Reference 1. Perform the CAL2 procedure as described in the
Tolerance Error Calibration section (page 52).
Er16 - Program/Tune Mode 1. Record all Program and Tune mode parameters.
Checksum Error perform the CAL 1 procedure as described in the
Er17 - Calibration 1. Perform the calibration procedures that are needed for
Checksum Error the input sensors that will be used (page 51).
Er18 - Profile Data 1. Record all Profile data that was entered. Perform the
Checksum Error CAL 8 procedure as described in the Calibration
Calibration section (page 52). Re-enter the Program
and Tune mode parameters.
2. Perform a re-initialization (see Page 61).
section (page 55). Re-enter the Profile data as
needed.
Page 68

PAGE 68
Er19 - Tried to run 1. Press the RUN/Hold key, then press and release the
profile with 0 segments SCROLL key until oFF or CtrL are displayed then
press the DOWN key. This error occurs if a profile
number is selected in the Profile Continue mode for a
profile that has not been developed.
Er20 - Setpoint Error 1. Press the UP or DOWN key to change the setpoint to
Er21 - Pen Feedback 1. Perform the steps listed for “Pens do not operate”
Error condition (page 63).
Er36 -Incorrect Crystal 1. Turn off the power to the instrument, wait 5 seconds,
For Digital Comm. then turn the power on.
Er37 - Incorrect Micro. 1. Turn off the power to the instrument wait 5 seconds,
For Digital Comm. then turn the power on.
Momentary Er70 - 1. Tried to communicate while unit was in a non-control
Controller unable to respond mode.
within 250 milliseconds
Momentary Er71 - 1. The unit received a request before proper amount of
Byte received before the time has elapsed since last request.
response was transmitted
a different value, then restore the needed setpoint.
2. Perform the CAL1 procedure as described in the
Calibration section (page 52).
Momentary Er72 - 1. Data received not valid, possible corruption on the
Incorrect Block check comm link. Possible noise.
character received
Momentary Er73 - 1. Improper parity selection on the transmitting terminal.
Byte received with incorrect
parity 2. Incorrect baud rate.
3. Noise.
Page 69

Appendix A
T
D
T
D
E
)
D
Board Layout
FIGURE A-1 - Processor Board
PAGE 69
Top
JU1
ENABLE MODE
UNLOCKED
JU8
RAM SIZE
16K
JU3
EPROM SIZ
32K
JU4 PEN 1 INPU
T/C, RT
VOLT/mA
JU5 PEN 2 INPU
(REVERSE OF JU4
LOCKED
64K
64K
SWI for Rev. Y and above
230
U5
JU1
SWI for Rev. X and below
TB1
230
230/115 VAC
SWITCH 230 VAC
MODEL ONLY
JU3
U7
JU8
T/C, RT
VOLT/mA
Battery
JU6
JU4
JU5
JU7
TB2
JU6 /JU7
RTD
INPUT
TB3 TB4 TB5
NONRTD
RT
Page 70

PAGE 70
FIGURE A-2 - SPST Relay/SSR Driver Board
TB6 TB7 TB8
TS1
R1 TS2 R2 TS3 R3
C1 C2
K1 K2
(rlyA)
(rlyB)
P7
If the relay is connected to a
high impedance AC device,
the snubber network used to
protect the relay contact may
cause the output to appear to
be activated when the relay
is off. To cure the problem,
cut the snubber resistor for
the output that is being
affected. Connect a .01 mf,
1KV capacitor from the odd
numbered terminal to
ground.
TS4
R4 TS5
R5
TS6
C3 C4 C5 C6
K3 K4 K6K5
(rlyC) (rlyD)
(rlyE) (rlyF)
TB9
(rlyG)
Resistor Relay
R1 Relay A
R2 Relay B
R3 Relay C
R4 Relay D
R5 Relay E
R6 Relay F
R6
(rlyH)
Page 71

FIGURE A-3 - SPDT Relay/SSR Driver Board
PAGE 71
TB6
TS1
R1 TS2 R2 TS3 R3
C1 C2
K1 K2
(rlyA) (rlyB)
P7
If the relay is connected to a
high impedance AC device,
the snubber network used to
protect the relay contact may
cause the output to appear to
be activated when the relay
is off. To cure the problem,
cut the snubber resistor for
the output that is being
affected.
K3
R5
TB8
TS6
K4
TB7
TS4
R4 TS5
C3 C4 C5 C6
(rlyC) (rlyD)
TB9
(rlyG)
Resistor Relay
R1 Relay A N.O.
R2 Relay A N.C.
R3 Relay B N.O.
R4 Relay B N.C.
R5 Relay C
R6 Relay D
(rlyH)
R6
Page 72

PAGE 72
FIGURE A-4 - Current Output Board
R51 R52
U1
U2
U3
R50
U4
U5
TB10 TB11 TB12
U6
U7
R53
U8
U9
TB13
If this option board was ordered, you will find it located in the lower right hand corner of the
instrument.
Page 73

Appendix B
Glossary
Assured Soak
The instrument may be programmed to interupt the Profile Soak segment if the process value
exceeds a selectable deviation from setpoint value. The Profile will restart from where it was
stopped when the process value does not exceed the deviation value selected from setpoint.
Automatic Reset (Integral)
This parameter is used so that the instrument will compensate for process variable deviations
from setpoint that occur when the process load characteristics change. Instructions for
determining the automatic reset settings are given in Section 4.3 (Page 47). Factory default
is.0.0. Display code ArS1 and ArS2.
Automatic Transfer
This feature, if configured, allows manual control of the process until setpoint is reached, at
which point the controller automatically transfers from manual to automatic control. Factory
default value is 0 = no auto transfer. Display code AtFr.
Bumpless Transfer
This feature prevents step changes in proportional outputs when changing from automatic to
manual control only.
PAGE 73
Cycle Time
This Tune mode parameter is used to select the on/off cycle time for time proportioning
outputs (Ct1 for Output 1 and/or Ct2 for Output 2)
Display Filter Factor
This parameter is adjustable from 1 to 20 which represents the number of scans of the
process variable that are averaged together before updating the displayed and recorded
value. The factory default value is 1 = no filtering. Display code dFF.
Dry Bulb
Is the temperature sensor connected to TB4 that provides the ambient temperature input
necessary for Relative Humidity calculations.
Engineering Units Upper and Engineering Units Lower
These Program mode parameters are used with volt and milliamp inputs. The Engineering
Units Upper Euu should be selected as the value to be displayed when the input is at maximum. The Engineering Units Lower EuL should be selected as the value to be displayed
when the input at at minimum.
First Output Position
This parameter is adjustable from -1000 to 1000 units and represents a shift or offset of the
on-off actuation points or proportional band for the first output relative to the normal position.
For example, a negative value could be used to offset an expected overshoot. First Output
Position also shifts the proportional band with respect to the process value range outside of
which integral action is inhibited. Factory default is 0. Display code FoP.
Hysteresis
This parameter is adjustable from 0 to 300 units representing the width of the band (half
above and half below setpoint). Used with ON/OFF or Alarm outputs to reduce cycling. For
instance, with a value of 4 and a setpoint of 70 the output will turn ON when the process
variable drops to 68 and stay ON until 72 is reached, then turn OFF the output. Factory
default = 3. Display code HyAo for Alarm outputs. Display code HyCo for ON/OFF Control
Outputs.
Page 74

PAGE 74
Input Correction
This parameter is adjustable from -300 to 300 units and is used as a method to compensate
for a linear sensor error. Factory default is 0 = no correction. Display code iCi1 and iCi2.
Manual Reset
This parameter is adjustable from -1500 to 1500 units representing a manual shift of proportional band(s) relative to the normal position. Manual reset is intended to be used when
automatic reset is not used to allow compensation for deviations from setpoint which remain
after the process has stabilized. Factory default is 0. Increasing the value increases the
process variable, i.e. if the process variable stabilizes too low, increase the manual reset
value. Integral action, and conversely reset-windup inhibit apply over the same process value
range regardless of the manual reset value. Display code rSEt.
Pen Action on Power Up
This parameter specifies whether the pen, on a power-up will drive to the "Home Position"
(center of chart), then return to its correct postion. This is done as a cal check. Settings are
0=go to "home" and 1=remain in last position prior to power down. Default is 0.
Platen
The flat surface in the instrument upon which the chart rotates.
Position Proportioning Sensitivity
A percentage of the first output proportional band width (Pb1).
Process Filter Factor
This parameter is adjustable from 1 to 20 which represents the number of scans of the
process variable that are averaged together before updating the process value used for
control purposes. The factory default value is 1 = no filtering. Display code PFF.
Process Retransmission Output
Allows re-transmission of the process variable. Factory default is 0 = not selected. Display
code Pout. If selected, must be assigned to a current output and scaled using Process
Output upper and lower values.
Process Output Upper and Lower Values
(Used in conjunction with process retransmission output)
These parameters specify the process value range over which the assigned current output
will vary in a linear manner from 100% to 0%. If the process value is greater than Pou the
output will be 100%. If the process value is less than PoL the output will be 0%. Factory
default values are 2000 for the upper value and 0 for the lower value. Display codes Pou
(upper) and PoL (lower).
Process Rounding
This parameter is adjustable from 0 to 100 units and is used to round the process value to the
nearest value specified. This is for display only and does not affect the recorded value or
control action. Intended for use where the engineering units span is large, to reduce display
fluctuation. Factory default is 0 = no rounding. Display code Prnd. (e.g. Prnd = 3, Process
Value = -6, -3, 0, 3, 6, 9....)
Proportional Band (PB)
This parameter is adjustable from 1 to 3000 units (not Percent of span) and represents the
process value range where the proportional output is at a percentage of the full output.
Instructions for determining Pb are given in Section 4.3. Factory default is 100 units. Display
code Pb1 and Pb2. Figures 1 and 2 in this appendix illustrate the position of the proportional
band.
Ramp
A Ramp is the section of a profile segment where the setpoint value is being changed from
the initial value to the value selected over the time period selected. The first Ramp of a profile
will take the process value at the time the profile was started as the initial setpoint value.
Page 75

Rate (Derivative)
This parameter is adjustable from 0.0 to 10.0 minutes and specifies how the control action
responds to the rate of change in the process variable. For example, if the process variable is
rising rapidly to setpoint, power is turned off sooner than it would be if the rise were slow. In
effect, derivative action anticipates lags within the system and shifts the proportioning band by
an amount determined by the rate of change of the input sensor.
Magnitude of the shift is determined by a derivative time constant. If the time constant is, say
.1 minute (6 seconds), for every unit per second rate of change of the process variable at the
sensor, the proportioning band is moved 7 units in the direction that helps control. Likewise, if
the time constant is 1 minute (60 seconds), for every unit per second rate of change of the
process variable at the sensor, the proportioning band is moved 60 units in the direction that
helps control.
Instructions for determining rate are given in Section 4.3. Factory default is 0.0 Display code
rt1, rt2.
Relative Humidity
Stated as a percentage, Relative Humidity is the ratio of water vapor that is present in the air
to the maximum water vapor that the air can hold at the same temperature.
Second Output Position
This parameter is adjustable form -1000 to 1000 units and represents a shift or offset of the
on-off actuation points or proportional band for the second output relative to the normal
position. A positive value creates a gap where no control outputs are on, a negative value
creates an overlap of control outputs (if the first output position is at the normal position).
Second Output Position also shifts the proportional band with respect to the process value
range outside of which integral action is highlighted (reset-windup inhibit). Factory default is 0.
Display code SoP.
PAGE 75
Segment
A segment refers to a part of a profile. A segment consists of a Ramp and a Soak section.
Soak
A Soak is the section of a profile segment where the setpoint value is at a constant value for
the time period selected.
Wet Bulb
Is the temperature sensor that is kept moist (damp) and is connected to TB 5. This input is
necessary for Relative Humidity calculations.
Page 76

PAGE 76
Appendix C Order Matrix
77
1 Pen/2 Pen Options
1 One Pen Recorder Only
2 One Pen Recording Controller
3 One Pen Recording Profile Controller
4 Two Pen Recorder Only
5 Two Pen Recording Controller
6 Two Pen Recording Profile Controller
* Relay Outputs
0 None
1 One SPST
2 Two SPST
4 Four SPST
6 Six SPST
7 One SPDT
8 Two SPDT
9 Two SPDT and Two SPST
*SSR Driver Outputs
0 None
1 One
2 Two
4 Four
6 Six
8 Eight
4 to 20mA Outputs
0 None
1 One
2 Two
3 Three
4 Four
Transmitter Power Supply
0 None
1 24VDC Regulated/Isolated
Option Suffix
None - Blank
N3 NEMA3†
CE CE Compliance
Voltage
1 115VAC
2 115/230VAC
CSA Approved
4 115VAC input
5 115/230VAC
Enclosure Option
2 Standard Cover
(Plastic Windows)
4 Door Lock**
6 Sealed Conduit Conn.
7 Combination 4 & 6**
Communications
0 None
2 RS-485 Total Access
Pen 2 Auxiliary Input
0 None
1 Position Proportioning
2 Remote Setpoint
Pen 1 Auxiliary Input
0 None
1 Position Proportioning
3 Remote Run/Hold
*Total quantity of SPST Relays and SSR Drivers must be less than or equal to (8) eight. When SPDT
Relays are included, the total must be less than or equal to (6) six.
** This option comes with a structural foam cover.
† N3 - NEMA3 Equivalent Spray Resistant Enclosure.
Note: 4-20mA inputs are accommodated using the 1-5V input and a 250 ohm Shunt Resistor.
Page 77

Appendix D Product Specifications
PAGE 77
Measurement Error Limit • Type J,K,T,E,N,C T/C’s and RTD +/- 0.25% of reading
Ambient Temperature Error 0.01% of span per degree C deviation from 25 degrees C
Scan Rate 1 scan/second
Display Decimal Positions One, two or three decimal places (0.1 or 1 degrees for
Noise Rejection Normal mode, 85 dB minimum at 60 Hz or greater.
Line Voltage 115/230 VAC +/-10% 50/60 Hz
Power Consumption 25 VA maximum
plus 1 degree @ 25 degrees C
• Type R,S, B T/C’s +/- 0.25% of span @ 25 degrees C
• mA andVDC +/- 0.25% of scaled span plus 1 Whole
Digit @ 25 degrees C
T/C or RTD)
Common mode, 90 dB minimum, 115 VAC maximum.
Operating Temperature 32 degrees to 131 degrees F
Storage Temperature -40 degrees to 149 degrees F
Humidity 0 to 90% RH, non-condensing
Dimensions 13.19'’H x 15.13"W x 3.63" Deep
Weight 20 pounds maximum
Sensor Fault Detection Displays SnSr for sensor or transmitter break. Outputs go
Agency Approvals UL and CSA
EMI Susceptibility Designed to meet EN 50082-2:1992
0 degrees to 55 degrees C (ambient)
-40 degrees to 65 degrees C
off. PV Out to 100%, Events status remains same. Fault
detection is not functional for 0-5V or 0-20mA inputs
Page 78

PAGE 78
EMI Emissions Designed to meet EN 50081:1994
Safety Considerations Designed to comply with IEC 1010-1 in as far as it is
Transmitter Power Supply Provides up to 40mA of current at 24 VDC
Relative Humidity Based on 100 OHM RTD (.00385 OHMS/OHM/degrees
Algorithm Accuracy Actual user accuracy will be dependent upon the quality
Warranty 3 years, see back cover for details.
applicable
C) input, the Relative Humidity Accuracy is +/- 2% RH @
25 degrees C and +/- 3% RH @ 5 to 50 degrees C range.
Below 0.5°C/33°F Wet bulb sensed temperature, the RH
value will be set to 100%.
of the sensors used, the proper installation of the
sensors, the input correction adjustments, and the
barometric pressure adjustments.
Input Specifications
THERMOCOUPLE
TYPE RANGE TYPE RANGE
J 0 to 270C E 0 to 215C
0 to 520 F 0 to 420F
K 0 to 360C B 200 to 1800C
0 to 680F 400 to 3300F
T -220 to 300C N 0 to 450C
-330 to 570F 0 to 842F
R 200 to 1300C C 200 to 810C
400 to 2370F 390 to 1490F
S 200 to 1425C
400 to 2600F
MILLIAMPS RTD
4-20 MADC 100 OHM
(with resistor) (.00385 OHMS/OHM/C)
-70 to 150°C, -94 to 300°F
VOLTS REMOTE RUN/HOLD
0 to 5 VDC Dry Contact Closure
1 to 5 VDC
REMOTE SETPOINT
0 to 5 VDC
1 to 5 VDC
Page 79

CONTROL ADJUSTMENTS
Proportional Band 1 to 3000 units
Manual Reset -1500 to 1500 units
Auto Reset (Integral) 0.0 to 100.0 repeats per minute
Rate (Derivative) 0.0 to 10.0 minutes
Cycle Time 1 to 240 seconds
Position Proportioning 0.0 to 50.0%
Sensitivity
On/Off Hysteresis 0 to 300 units
(width of hysteresis band)
First Output Position -1000 to 1000 units
Second Output Position -1000 to 1000 units
Automatic User selectable to transfer from manual to
Transfer Function automatic control when setpoint is reached
Can be disabled.
PAGE 79
Auto/Manual Bumpless transfer from automatic to manual.
Manual Output 0 to 100%
ALARM ADJUSTMENTS
Process Alarm -9999 to 9999 units
Deviation Alarm -3000 to 3000 units
Deviation Band Alarm 1 to 3000 units
Hysteresis 0 to 300 units
CONTROL OUTPUTS
Relay SPST/SPDT 115 VAC: 5.0A Resistive, 1/8HP or 250VA
230 VAC: 2.5A Resistive, 1/8HP or 250VA
SSR Driver Open collector output
Short circuit protected @ 100mA maximum
Provides 4VDC at 20mA or 3VDC at 40mA
mADC Current 4-20 or 0-20 mADC into 650 ohms maximum load
DISPLAY
Digital Display Two- 4 digit possible; one per installed pen. Red LED’s
0.56" high.
Status Indicators LED indicators for Output 1, Output 2, Manual Operation,
Alarm, Setpoint, minus sign and process value units.
Page 80

PAGE 80
RECORD
Chart 10 in circular chart; 100 charts furnished with each
Chart Range 0 to 9999 units
Chart Drive DC Stepper motor
Chart Rotation User configurable from 0.1 to 999.9 hours per revolution
Pen Type Disposable Fiber-tip
Pen Color Pen 1-Red
Pen Response Time <9 seconds over chart span
Accuracy ±1.0% of chart span max. error from displayed value
Chart Rotation Accuracy ±0.5% of Chart Rotation Time
instrument if standard range
Pen 2-Green
DIGITAL COMMUNICATIONS
Type RS-485 serial communications port. Half-duplex
bi-directional communications.
Character Format ASCII
Protocol Per ANSI X3.28 subcategories 2.5 & A4
Configuration User configurable to Monitor (read only) or Normal (read
Bit Rate User configurable to 300, 600, 1200, 2400, 4800, or 9600
Address User configurable for each pen; 0 to 99
and write)
bits per second
Page 81

Appendix E
Recorder Only Software Reference/Record Sheet
PROGRAM MODE
ENABLE MODE
ENAB
EtSt
ECAL
EPro
EASt
ALARM SET
Pen 1 Pen 2
PAL1
PAL2
bAro
iSi1
iCi1
iSi2
iCi2
PEnS
rHC
AL1
AL2
dPoS
Euu
EuL
HyAo
Prnd
dFF
Pout
Pou
PoL
Cru
CrL
PAEC
Pen 1 Pen 2
rLyA
rLyb
rLyC
rLyd
rLyE
rLyF
rLyg
rLyh
CurA
Curb
CurC
Curd
CoAr
Cobr
CoCr
Codr
Crt
PAPu
Coo
CCon
CbS
CAd1
CAd2
PAGE 81
unit
Page 82

PAGE 82
Appendix F
Recorder Controller; Recorder Controller Profiler
Software Reference/Record Sheet
iSi1
iCi1
iSi2
iCi2
PEnS
rHC
out1
o1uL
o1LL
out2
o2uL
o2LL
AL1
AL2
diSP
dPoS
Euu
EuL
HyCo
HyAo
rSP
rSPu
rSPL
SPuL
SPLL
AtFr
Prnd
dFF
PFF
Pout
Pou
PoL
Cru
CrL
P1EC
P2EC
PAEC
PROGRAM MODE
Pen 1 Pen 2 unit
rLyA
rLyb
rLyC
rLyd
rLyE
rLyF
rLyg
rLyh
CurA
Curb
CurC
Curd
CoAr
Cobr
CoCr
Codr
Ptb
PiA
rrh
PPC
Crt
PAPu
Coo
CCon
CbS
CAd1
CAd2
TUNE MODE
Pen 1 Pen 2
SoP
PAL1
dAL1
bAL1
PAL2
dAL2
bAL2
Pb1
Pb2
rSEt
ArS1
ArS2
rt1
rt2
rAtE
Ct1
Ct2
SEnS
FoP
bAro
ENABLE MODE
EtSt
ECAL
EPro
Etun
ESby
EPC
EPE
ESPC
Page 83

PAGE 83
P1 S1 S2 S3 S4 S5 S6
rt
SP1
SP2
E1
E2
E3
E4
E5
E6
St
E1
E2
E3
E4
E5
E6
PLCt= dhru= dhrd= Pend=
P2 S1 S2 S3 S4 S5 S6
rt
SP1
SP2
E1
E2
E3
E4
E5
E6
St
E1
E2
E3
E4
E5
E6
PLCt= dhru= dhrd= Pend=
P3 S1 S2 S3 S4 S5 S6
rt
SP1
SP2
E1
E2
E3
E4
E5
E6
St
E1
E2
E3
E4
E5
E6
PLCt= dhru= dhrd= Pend=
P4 S1 S2 S3 S4 S5 S6
rt
SP1
SP2
E1
E2
E3
E4
E5
E6
St
E1
E2
E3
E4
E5
E6
PLCt= dhru= dhrd= Pend=
Page 84

PAGE 84
P5 S1 S2 S3 S4 S5 S6
rt
SP1
SP2
E1
E2
E3
E4
E5
E6
St
E1
E2
E3
E4
E5
E6
PLCt= dhru= dhrd= Pend=
P6 S1 S2 S3 S4 S5 S6
rt
SP1
SP2
E1
E2
E3
E4
E5
E6
St
E1
E2
E3
E4
E5
E6
PLCt= dhru= dhrd= Pend=
P7 S1 S2 S3 S4 S5 S6
rt
SP1
SP2
E1
E2
E3
E4
E5
E6
St
E1
E2
E3
E4
E5
E6
PLCt= dhru= dhrd= Pend=
P8 S1 S2 S3 S4 S5 S6
rt
SP1
SP2
E1
E2
E3
E4
E5
E6
St
E1
E2
E3
E4
E5
E6
PLCt= dhru= dhrd= Pend=
Page 85

Appendix G
Profile Development Sheet
The Profile Development Worksheet is intended to assist the Profile Recorder
Controller customers. By filling in the worksheet with the application requirements,
profile information can easily be obtained for entry into the instrument. The worksheet is a convenient record of the profile for future use.
A profile is a programmed sequence of setpoint changes over a period of time
(Ramp) and setpoint maintained at a single point for a period of time (Soak). A sequence of a ramp and a soak is referred to as a Segment. A profile can contain from
1 to 6 segments. The instrument can store in memory up to 8 profiles.
The profile controllers can provide timed output relay action while running a profile,
this is called an Event. Events may be selected as on or off as needed during each
Ramp and Soak segment of the profile.
The first step to completing the worksheet is to determine the range of the setpoints
necessary for the application. Fill out the setpoint scale along the left side of the
worksheet. For dual pen profile controller be sure to scale the setpoint range for the
greater range. Remember that the profile ramp will start at the process value indicated when the profile is initiated.
PAGE 85
The next step is to sketch the profile outline on the worksheet. Use the setpoint
scale to determine the setpoint levels. Draw each profile separately on a dual pen
instrument. Be sure to fill in the time periods for each part of the segment in the
boxes provided at the top of each column. The Ramp and Soak time boxes are
located at the top of each column below the setpoint boxes for the segment. There
are boxes at the bottom of each column to indicate the status of events, if used. If
more than six segments are needed for the profile then individual profiles can be
linked to preform sequentially. Linked profiles operate like one long profile.
Profile program information is easily determined by completing the Profile
Developmental Worksheet for the application. The information derived within the
worksheet is directly related to the profile entry parameters of the profile controller.
Page 86

PAGE 86
Profile Number
Number of Segments
Profile Worksheet
Segments
Setpoint
Scale
123456
SP1 SP2 SP1 SP2 SP1 SP2 SP1 SP2 SP1 SP2 SP1 SP2
Ramp Soak Ramp Soak Ramp Soak Ramp Soak Ramp Soak Ramp Soak
Time Time Time Time Time Time Time Time Time Time Time Time
Event 1
Event 2
Event 3
Event 4
Event 5
Event 6
Profile End Action
Profile Loop Count
Deviation Hold After Ramp Up
Deviation Hold After Ramp Down
Profile Time Base
Profile Interrupt Action
Page 87

Sample Profile
The following is a sample profile intended to assist in understanding how the profile recorder
functions. Be sure to disconnect all control outputs before running this profile. This profile
does not make use of the second pen on a dual pen instrument to help keep the profile short.
Press and release the SCROLL key until Prog appears on the display then press the DOWN
key. Press and release the DOWN key until diSp appears then press the SCROLL key. Press
and hold the UP key until the display shows a 5 then press the SCROLL key. Press and
release the Down key until Ptb appears then press the SCROLL key. Press and hold the UP
key until a 3 appears then press the SCROLL key. Press the UP key and Prog will appear.
Press and release the SCROLL key until PEnt appears then press the DOWN key. Perform
the following keystrokes:
Display Keystroke
PAGE 87
Pn SCROLL
X DOWN
1 SCROLL
Sn SCROLL
X UP
6 SCROLL
rt SCROLL
X UP/DOWN
0.10 SCROLL
SP SCROLL
X UP/Down
100 SCROLL
St SCROLL
X UP/DOWN
0.10 SCROLL
rt SCROLL
X UP/DOWN
0.10 SCROLL
SP SCROLL
X UP/DOWN
150 SCROLL
St SCROLL
X UP/DOWN
rt SCROLL
X UP/DOWN
0.10 SCROLL
SP SCROLL
X UP/DOWN
300 SCROLL
St SCROLL
X UP/DOWN
0.10 SCROLL
rt SCROLL
X UP/DOWN
0.10 SCROLL
SP SCROLL
X UP/DOWN
200 SCROLL
St SCROLL
X UP/DOWN
0.10 SCROLL
rt SCROLL
X UP/DOWN
0.10 SCROLL
SP SCROLL
X UP/DOWN
100 SCROLL
St SCROLL
X UP/DOWN
0.10 SCROLL
rt SCROLL
X UPDOWN
0.10 SCROLL
SP SCROLL
X UP/DOWN
50 SCROLL
St SCROLL
X UP/DOWN
0.10 SCROLL
PLct SCROLL
X UP/DOWN
2 SCROLL
dHru SCROLL
X UP/DOWN
0 SCROLL
dHrd SCROLL
X UP/DOWN
0 SCROLL
PEnt SCROLL
X UP/DOWN
0 SCROLL
Pn UP
PEnt
With PEnt on the display,
press and release the
SCROLL key until P 1
appears in the display then
press RUN/ HOLD key. The
display will show run, then
display the ramping setpoint
of the profile. This is to
demonstrate how the profile
recorder controller functions.
Page 88

PAGE 88
Warranty and Return Statement
These products are sold by The Partlow Corporation (Partlow) under the warranties set forth
in the following paragraphs. Such warranties are extended only with respect to a purchase of
these products, as new merchandise, directly from Partlow or from a Partlow distributor,
representative or reseller, and are extended only to the first buyer thereof who purchases
them other than for the purpose of resale.
Warranty
These products are warranted to be free from functional defects in materials and workmanship at the time the products leave the Partlow factory and to conform at that time to the
specifications set forth in the relevant Partlow instruction manual or manuals, sheet or sheets,
for such products for a period of three years.
THERE ARE NO EXPRESSED OR IMPLIED WARRANTIES WHICH EXTEND BEYOND
THE WARRANTIES HEREIN AND ABOVE SET FORTH. PARTLOW MAKES NO WARRANTY OF MERCHANTABILITY OR FITNESS FOR A PARTICULAR PURPOSE WITH
RESPECT TO THE PRODUCTS.
Limitations
Partlow shall not be liable for any incidental damages, consequential damages, special
damages, or any other damages, costs or expenses excepting only the cost or expense of
repair or replacement as described above.
Products must be installed and maintained in accordance with Partlow instructions. Users are
responsible for the suitability of the products to their application. There is no warranty against
damage resulting from corrosion, misapplication, improper specifications or other operating
condition beyond our control. Claims against carriers for damage in transit must be filed by
the buyer.
This warranty is void if the purchaser uses non-factory approved replacement parts and
supplies or if the purchaser attempts to repair the product themselves or through a third party
without Partlow authorization.
Returns
Partlow’s sole and exclusive obligation and buyer’s sole and exclusive remedy under the
above warranty is limited to repairing or replacing (at Partlow’s option), free of charge, the
products which are reported in writing to Partlow at its main office indicated below.
Partlow is to be advised of return requests during normal business hours and such returns are
to include a statement of the observed deficiency. The buyer shall pre-pay shipping charges
for products returned and Partlow or its representative shall pay for the return of the products
to the buyer.
Approved returns should be sent to: PARTLOW CORPORATION
2 CAMPION ROAD
NEW HARTFORD, NY 13413 USA
 Loading...