

Page 1
Form 2854
Edition 10
© December 1993
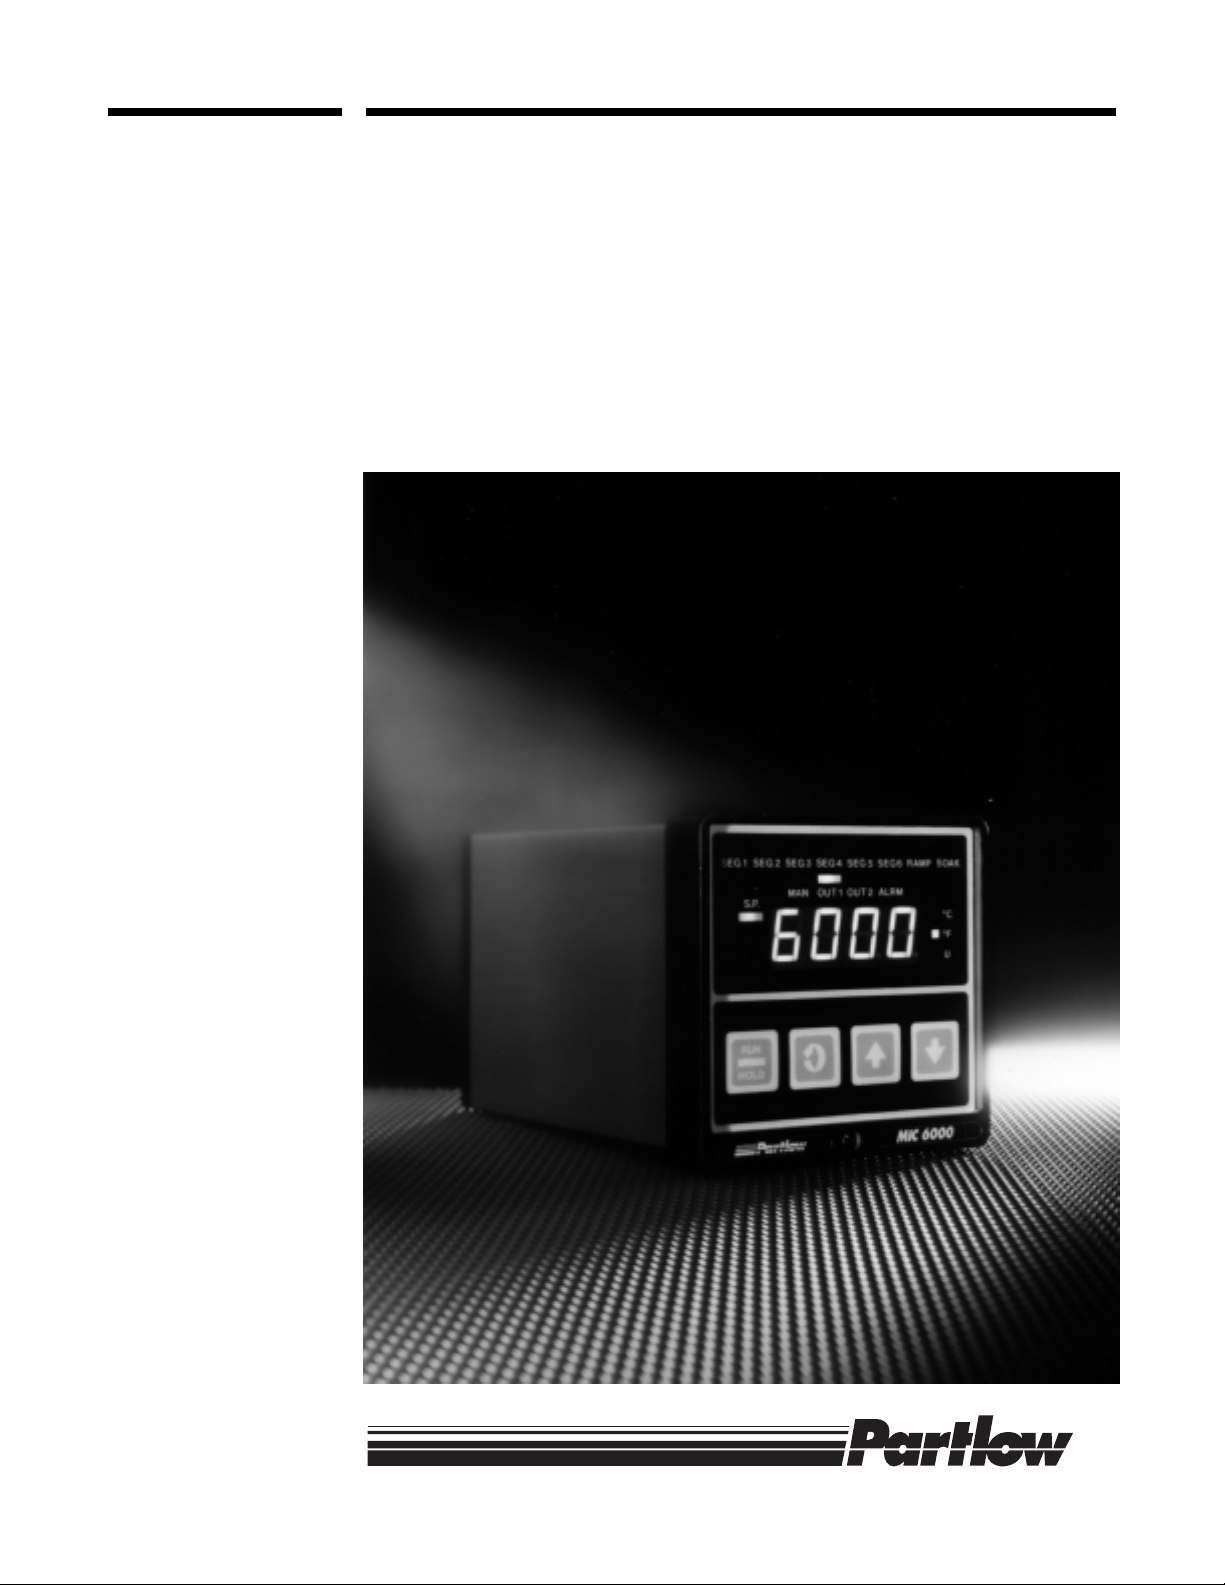
MIC 6000
Installation, W iring, Operation Manual
Brand
Page 2

PAGE 2
nformation in this installation, wiring, and operation
manual is subject to change without notice. One
I
manual is provided with each instrument at the time of
shipment. Extra copies are available at the price published
on the front cover.
Copyright © December 1993, all rights reserved. No part of
this publication may be reproduced, transmitted, transcribed or stored in a retrieval system, or translated into any
language in any form by any means without the written
permission of the factory.
This is the Tenth Edition of the Manual. It was written and
produced entirely on a desk-top-publishing system. Disk
versions are available by written request to the factory Advertising and Publications Department.
NOTE
We are glad you decided to open this manual. It is written
so that you can take full advantage of the features of your
new 1/4 DIN Profiling Controller.
It is strongly recommended that factory equipped applications incorporate a high or
low limit protective device which will shut down the equipment at a preset process
condition in order to preclude possible damage to property or products.
Page 3

Table of Contents
SECTION 1 - GENERAL Page Number
1.1 Product Description 5
SECTION 2 - INSTALLATION & WIRING
2.1 Installation & Wiring 7
2.2 Unpacking 7
2.3 Location 7
2.4 Mounting 7
2.5 Preparation for Wiring 8
2.6 Wiring Connections 13
SECTION 3 - CONFIGURATION
3.1 Configuration 21
3.2 Shipped Configuration/Jumper Positioning 22
3.3 Start up Procedure 22
3.4 Front Panel Operation 23
3.5 Operation Summary 25
PAGE 3
SECTION 4 - OPERATION
4.1 Operation 38
4.2 Alarm Operation 44
4.3 Tune Mode Operation 44
SECTION 5 - SERVICE
5.1 Service 47
5.2 Calibration 47
5.3 Test Mode Procedures 52
5.4 Troubleshooting and Diagnostics 56
APPENDICES
A - Board Layouts
A-1 Power Supply Board 63
A-2 Processor Board 64
A-3 Option Board (Revision D and Below) 65
Option Board (Revision E and Above) 66
B - Glossary 67
C - Order Matrix 70
D - Specifications 71
E - Software Record/Reference Sheet 75
F - Profile Development Sheet 78
Warranty Inside Back Cover
Page 4

PAGE 4
Figures and Tables
Figure 1-1 Front Panel Display 5
Figure 2-1 Installation View and Dimensions 8
Figure 2-2 Noise Suppression 10
Figure 2-3 Noise Suppression 10
Figure 2-4 Wiring Connection Diagram 13
Figure 2-5 AC Power Input 14
Figure 2-6 Thermocouple Input 14
Figure 2-7 RTD Input 15
Figure 2-8 Volt, Millivolt, milliamp Input 15
Figure 2-9A 24V Transmitter Power Supply 16
Figure 2-9B 24V Power Supply 16
Figure 2-10 Remote Run/Hold Input 17
Figure 2-11 Remote Digital Communications Option 17
Figure 2-12 Alternate Remote Digital Communications 18
Figure 2-13 Relay Output 18
Figure 2-14 SSR Driver Output 19
Figure 2-15 Current Output 20
Figure 2-16 Position Proportioning Control 20
Figure 4-1 Dual Output Control 42
Table 3-1 Program Mode Configuration Procedures 25
Table 3-2 Tune Mode Configuration Procedures 32
Table 3-3 Profile Entry Mode Configuration Procedures 35
Table 3-4 Enable Mode Configuration Procedures 36
Table 4-1 Profile Continue Mode 40
Table 5-1 Calibration Procedures 48
Table 5-2 Test Procedures and Description 53
Flow Charts
Flow - Calibration 47
Flow - Enable Mode 37
Flow - Profile Entry 34
Flow - Profile Continue 39
Flow - Program Mode 26
Flow - Tune Mode 33
Flow - Test 52
Page 5

Product Description 1.1
1.1.1 GENERAL
This instrument is a microprocessor based profiling controller capable of measuring,
displaying, and controlling a process variable from a variety of inputs. Applications
include temperature, pressure, level, flow, and others.
Control functions, alarm settings and other parameters are easily entered via the front
keypad. All user data can be protected from unauthorized changes by the Enable
mode security system, and is protected against loss from AC power failure by battery
back-up.
The process input is user configurable to directly connect to either thermocouple,
RTD, mVDC, VDC, or mADC inputs. depending on the input type specified. Thermocouple and RTD linearization, as well as thermocouple cold junction compensation, is
performed automatically. The instrument's process input is isolated from the rest of the
instrument.
The instrument can be ordered to operate on either 115VAC or 230VAC power at 50/
60Hz. The instrument is housed in an extruded aluminum enclosure suitable for panel
mounting.
FIGURE 1-1
PAGE 5
SEG2
MAN
SEG3
Scroll
SEG4 SEG5
OUT1
OUT2
SEG6 RAMP
ALRM
Up
Down
SOAK
°C
°F
U
Operation Status
Indicators
Degrees C, F, or
Engineering Units
SEG1
Setpoint Indicator
Minus Sign
RUN
HOLD
Run/Hold
1.1.2 DISPLAYS
Each instrument is provided with a digital display and status indicators as shown in
Figure 1-1. The digital display is programmable to display the process value only,
process and setpoint, deviation from setpoint only, deviation and setpoint, or setpoint
continuously.
Status indication is provided for Alarm , Output 1, Output 2, degree C, degree F,
engineering units, Manual operation, Segment 1 thru 6, Ramp, and Soak.
Display resolution is programmable for 0.1 or 1 degree for thermocouple and RTD
inputs, and 0.001, 0.01, 0.1, or 1 unit for volt, mV input types.
Page 6

PAGE 6
1.1.3 CONTROL
Instruments can be programmed for On-Off, Time Proportioning, Current Proportioning, or
Position Proportioning control implementations. Selectable direct or reverse control action is
also provided. Proportional control implementations are provided with fully programmable PID
parameters.
Automatic to Manual switching is easily accomplished via the Standby mode . Switching is
bumpless, and while in manual, manipulation of proportional outputs is possible.
Other standard control features include control output limits, setpoint limits, anti-reset windup
control, and a unique Automatic Transfer function, which, if configured, allows manual control
of the process until setpoint is reached, at which time the unit will automatically transfer from
manual to automatic control.
Remote Run-Hold capability can be provided via the Auxiliary Input.
1.1.4 PROGRAMMABLE SETPOINT PROFILES
Up to eight profiles can be programmed on any of these Profile Controllers. Each of the
eight profiles can contain up to six segments. Each segment contains a ramp and a soak
operation. Profiles can be programmed to run continuously or any number of times up to
9999. A combination of profiles may be combined for back to back execution. This has the
affect of acting as a single profile of more than six segments.
Assured Soak is provided with the use of two programmable parameters that will activate an
Auto/Hold feature. This feature will place a running profile in the Hold condition and prohibit a
Soak operation from starting or completing if an acceptable process value is not reached and
then maintained.
Event outputs may also be provided. Up to three events may be assigned and can be turned
on or off at the beginning of each ramp and soak.
1.1.5 ALARMS
Alarm settings are fully programmable. Alarm type may be set as Process direct or reverse
(High or Low), Deviation direct or reverse (above or below setpoint), or Deviation Band type
(closed or open within band).
Alarm outputs can be provided by assigning any specified relays (SPST or SSR driver) to the
respective alarm.
1.1.6 DIGITAL COMMUNICATIONS
The instrument can be provided with an RS-422/485 communications port which allows
bi-directional multidrop communications with a supervisory computer.
Page 7

Installation and Wiring 2.1
Read these instructions carefully before proceeding with installation and operation. Electrical
code requirements and safety standards should be observed. Installation should be
performed by qualified personnel.
CAUTION: The Instrument AC power input is specified in the model number and on the wiring label for either 115VAC or
230VAC. Verfiy the AC power input required by the instrument prior to proceeding with installation.
Unpacking 2.2
Remove the instrument from the carton and inspect it for any damage due to shipment. If any
damage is noticed due to transit, report and file a claim with the carrier. Write the model
number and serial number of the instrument on the front cover of this Operation Manual for
future reference when corresponding with the factory.
Location 2.3
Locate the instrument away from excessive moisture, oil, dust, and vibration. Do not subject
the instrument to operating temperatures outside of 0 to 55˚ C (32° to 131° F).
PAGE 7
Mounting 2.4
Figure 2-1 (page 8) shows installation view and physical dimensions for the panel mounted
instrument.
The electronics can be removed from the housing for installation, if so desired. To remove,
loosen the locking screw centered on the bottom face of the unit. The instrument pulls
straight out. When installing, be sure that the verically mounted circuit boards are inserted in
the correct grooves in the top and bottom of the housing. Also make sure the screw lock is
sufficiently tight. When installing multiple instruments, be sure to reinsert the proper
instrument into its correct enclosure by matching the serial number with the number inside the
housing. This will insure that the accuracy of the control will be within the published
specifications. The ambient compensator on the rear of the enclosure is calibrated to the
electronics at the factory.
Cut the panel cutout to the dimensions shown in Figure 2-1 (page 8). Insert the instrument
housing into the panel cutout and install the mounting bracket. Place the mounting screws on
the back of the housing and tighten until the instrument is rigidly mounted. Do not
overtighten.
A surface mounting kit is available - part number 64405801. For installation of the instrument
in areas subjected to washdowns, a water tight cover option is available (part # 64417801).
Page 8

PAGE 8
FIGURE 2-1
4.8 (.188) MAX PANEL THICKNESS
165.9 (6.53)
146.8 (5.78)
96.0 (3.78)
92 + or - 0.8
(3.622 + or - .031)
PANEL
CUTOUT
SIZE
All dimensions shown
in mm and inches. Inches
shown in ( ).
96.0
(3.78)
92+ or-.8
(3.622
+ or-.031)
Side View
Panel
Top View
90.4
(3.560)
Mounting Bracket
90.4
(3.560)
Mounting screw
Preparation for Wiring 2.5
2.5.1 WIRING GUIDELINES
Electrical noise is a phenomenon typical of industrial environments. The following are
guidelines that must be followed to minimize the effect of noise upon any instrumentation.
2.5.1.1 INSTALLATION CONSIDERATIONS
Listed below are some of the common sources of electrical noise in the industrial
environment:
• Ignition Transformers
• Arc Welders
• Mechanical contact relay(s)
• Solenoids
Before using any instrument near the devices listed, the instructions below should be
followed:
1. If the instrument is to be mounted in the same panel as any of the listed devices, separate
them by the largest distance possible. For maximum electrical noise reduction, the noise
generating devices should be mounted in a separate enclosure.
Page 9

2. If possible, eliminate mechanical contact relay(s) and replace with solid state relays. If a
mechanical relay being powered by an instrument output device cannot be replaced, a
solid state relay can be used to isolate the instrument.
3. A separate isolation transformer to feed only instrumentation should be considered. The
transformer can isolate the instrument from noise found on the AC power input.
4. If the instrument is being installed on existing equipment, the wiring in the area should be
checked to insure that good wiring practicies have been followed.
2.5.1.2 AC POWER WIRING
Earth Ground
The instrument includes noise suppression components that require an earth ground connection to function. To verify that a good earth ground is being attached, make a resistance
check from the instrument chassis to the nearest metal water pipe or proven earth ground.
This reading should not exceed 100 ohms.
Neutral (For 115VAC)
It is good practice to assure that the AC neutral is at or near ground potential. To verify this, a
voltmeter check between neutral and ground should be done. On the AC range, the reading
should not be more than 50 millivolts. If it is greater than this amount, the secondary of this
AC transformer supplying the instrument should be checked by an electrician. A proper
neutral will help ensure maximum performance from the instrument.
PAGE 9
2.5.1.3 WIRE ISOLATION
Four voltage levels of input and output wiring may be used with the unit:
* Analog input or output (i.e. thermocouple, RTD, VDC, mVDC or mADC)
* SPST Relays
* SSR driver outputs
* AC power
The only wires that should be run together are those of the same category. If they need to
be run parallel with any of the other lines, maintain a minimum 6 inch space between the
wires. If wires must cross each other, do so at 90 degrees. This will minimize the contact with
each other and reduces "cross talk".
emitted by a wire as current passes through it. This EMF can be picked up by other wires
running in the same bundle or conduit.
In applications where a High Voltage Transformer is used, (i.e. ignition systems) the secondary of the transformer should be isolated from all other cables.
This instrument has been designed to operate in noisy environments, however, in some cases
even with proper wiring it may be necessary to suppress the noise at its source.
2.5.1.4 USE OF SHIELDED CABLE
Shielded cable helps eliminate electrical noise being induced on the wires. All analog signals
should be run with shielded cable. Connection lead length should be kept as short as
possible, keeping the wires protected by the shielding. The shield should be grounded at one
end only. The preferred grounding location is at the sensor, transmitter or transducer.
"Cross talk" is due to the EMF (Electro Magnetic Flux)
Page 10
PAGE 10
2.5.1.5 NOISE SUPPRESSION AT THE SOURCE
Usually when good wiring practices are followed, no further noise protection is necessary.
Sometimes in severe electrical environments, the amount of noise is so great that it has to be
suppressed at the source. Many manufacturers of relays, contactors, etc. supply "surge
suppressors" which mount on the noise source.
For those devices thta do not have surge suppressors supplied, RC (resistance-capacitance)
networks and/or MOV (metal oxide varistors) may be added.
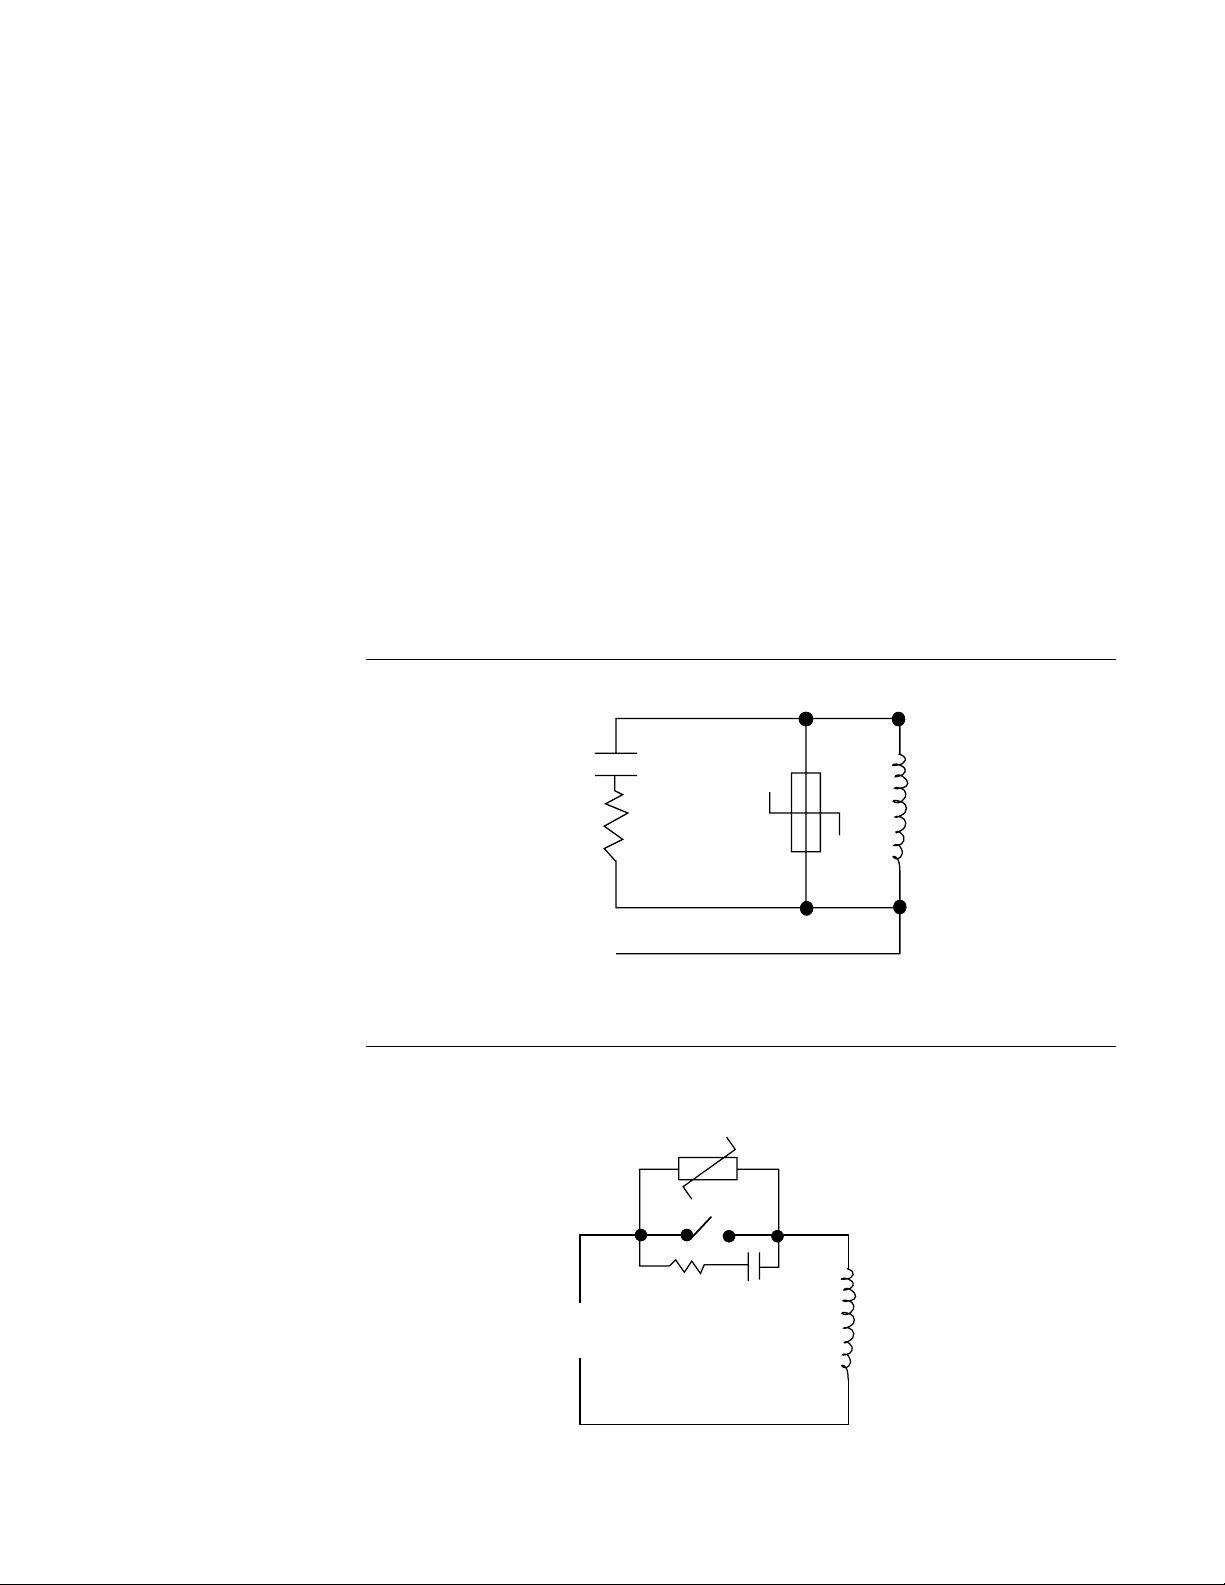
Inductive Coils - MOV's are recommended for transient suppression in inductive coils connected in parallel and as close as possible to the coil. See Figure 2-2. Additional protection
may be provided by adding an RC network across the MOV.
Contacts - Arcing may occur across contacts when the contact opens and closes. This results
in electrical noise as well as damage to the contacts. Connecting a RC network properly
sized can eliminate this arc.
For circuits up to 3 amps, a combination of a 47 ohm resistor and 0.1 microfarad capacitor
(1000 volts) is recommended. For circuits from 3 to 5 amps, connect 2 of these in parallel.
See Figure 2-3.
FIGURE 2-2
FIGURE 2-3
0.5
mfd
1000V
220
ohms
115V 1/4W
230V 1W
MOV
R
Coil
C
Inductive
Load
Page 11

2.5.2 SENSOR PLACEMENT (Thermocouple or RTD)
If the temperature probe is to be sufnected to corrosive or abrasive conditions, it should be
protected by the appropriate thermowell. The probe should be positioned to reflect true
process temperature:
In liquid media - the most agitated area.
In air - the best circulated area.
THERMOCOUPLE LEAD RESISTANCE
Thermocouple lead length can affect instrument accuracy since the size (gauge) and the
length of the wire affect lead resistance.
To determine the temperature error resulting from the lead length resistance, use the following equation:
Terr = TLe * L where; TLe = value from appropriate table below
L = length of leadwire in thousands of feet
TABLE 1
Temperature error in °C per 1000 feet of Leadwire
AWG Thermocouple Type:
No. J K T R S E B N C
10 .34 .85 .38 1.02 1.06 .58 7.00 1.47 1.26
12 .54 1.34 .61 1.65 1.65 .91 11.00 2.34 2.03
14 .87 2.15 .97 2.67 2.65 1.46 17.50 3.72 3.19
16 1.37 3.38 1.54 4.15 4.18 2.30 27.75 5.91 5.05
18 2.22 5.50 2.50 6.76 6.82 3.73 44.25 9.40 8.13
20 3.57 8.62 3.92 10.80 10.88 5.89 70.50 14.94 12.91
24 8.78 21.91 9.91 27.16 27.29 14.83 178.25 37.80 32.64
PAGE 11
TABLE 2
Temperature Error in °F per 1000 feet of Leadwire
AWG Thermocouple Type:
No. J K T R S E B N C
10 .61 1.54 .69 1.84 1.91 1.04 12.60 2.65 2.27
12 .97 2.41 1.09 2.97 2.96 1.64 19.80 4.21 3.66
14 1.57 3.86 1.75 4.81 4.76 2.63 31.50 6.69 5.74
16 2.47 6.09 2.77 7.47 7.52 4.14 49.95 10.64 9.10
18 4.00 9.90 4.50 12.17 12.28 6.72 79.95 10.64 9.10
20 6.43 15.51 7.06 19.43 19.59 10.61 126.90 26.89 23.24
24 15.80 39.44 17.83 48.89 49.13 26.70 320.85 68.03 58.75
Example:
An MIC is to be located in a control room 660 feet away from the process. Using 16 AWG,
type J thermocouple, how much error is induced?
Terr = TLe * L
TLe = 2.47 (°F/1000 ft) from Table 2
Terr = 2.47 (°F/1000 ft) * 660 ft
Terr = 1.6 °F
Page 12

PAGE 12
RTD LEAD RESISTANCE
RTD lead length can affect instrument accuracy, since the size (gauge) and length of the wire
affect lead resistance.
To determine the temperature error resulting from the lead length resistance, use the following
equation:
Terr = TLe * L where; TLe = value from Table 3 if 3 wire RTD or Table 4 if 2 wire RTD
L = length of lead wire in thousands of feet
TABLE 3 - 3 Wire RTD
AWG No. Error °C Error °F
10 +/- 0.04 +/- 0.07
12 +/- 0.07 +/- 0.11
14 +/- 0.10 +/- 0.18
16 +/- 0.16 +/- 0.29
18 +/- 0.26 +/- 0.46
20 +/- 0.41 +/- 0.73
24 +/- 0.65 +/- 1.17
TABLE 4 - 2 Wire RTD
AWG No. Error °C Error °F
10 +/- 5.32 +/- 9.31
12 +/- 9.31 +/- 14.6
14 +/- 13.3 +/- 23.9
16 +/- 21.3 +/- 38.6
18 +/- 34.6 +/- 61.2
20 +/- 54.5 +/- 97.1
24 +/- 86.5 +/- 155.6
Example:
An application uses 2000 feet of 18 AWG copper lead wire for a 3 wire RTD sensor. What is
the worst case error due to this leadwire length?
Terr = TLe * L
TLe = +/- .46 (°F/1000 ft) from Table 3
Terr = +/- .46 (°F/1000 ft) * 2000 ft
Terr = +/- 0.92°F
Page 13
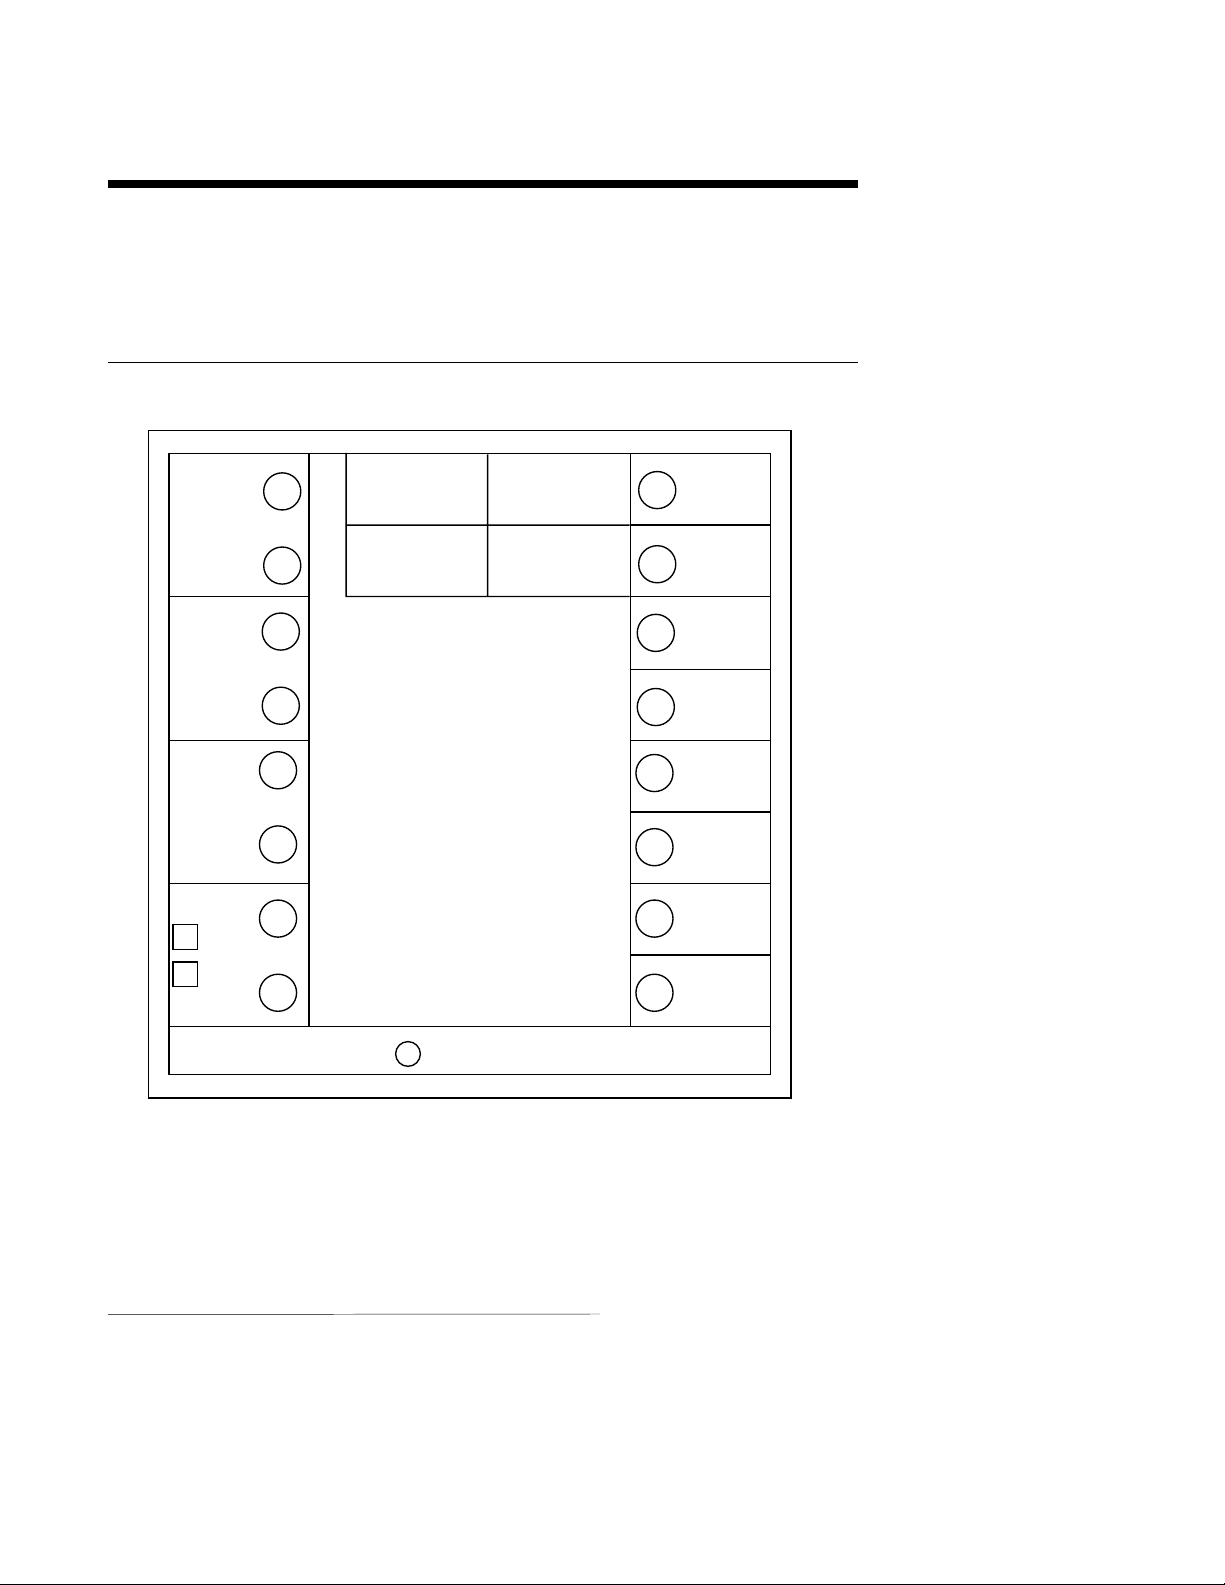
Wiring Connections 2.6
All wiring connections are typically made to the instrument with it installed. Terminal connections should be made via the rear panel with 14 gauge wire maximum (see Figure 2-4).
FIGURE 2-4
PAGE 13
RELAY C
RELAY B
RELAY A
115
230
D
C
B
VAC
A
H
G
F
E
SERIAL A
SERIAL B
INPUT RATINGS:
115/230 VAC 50/60 HZ 15VA MAX
RELAY OUTPUT RATINGS:
115VAC 5.0A RESISTIVE
230VAC 2.5A RESISTIVE
230VAC 1/8 HP
115/230VAC 250VA
MAXIMUM AMBIENT: 55˙C
POS. PROP.
WIPER
POS. PROP.
HIGH
REMOTE
8
RUN/
HOLD
OUT2
7
4-20MA
OUT1
6
4-20MA
5
RETURN
4
SIGNAL +
3
2
CJC
1
SIGNAL -
+
+
MADE IN U.S.A.GROUND
2.6.1 INPUT CONNECTIONS
WARNING: Avoid electrical shock. AC power wiring must not be connected at the source distribution panel until all wiring
connections are completed.
Consult the model code and the wiring label for the appropriate line voltage for the instrument.
Page 14
PAGE 14
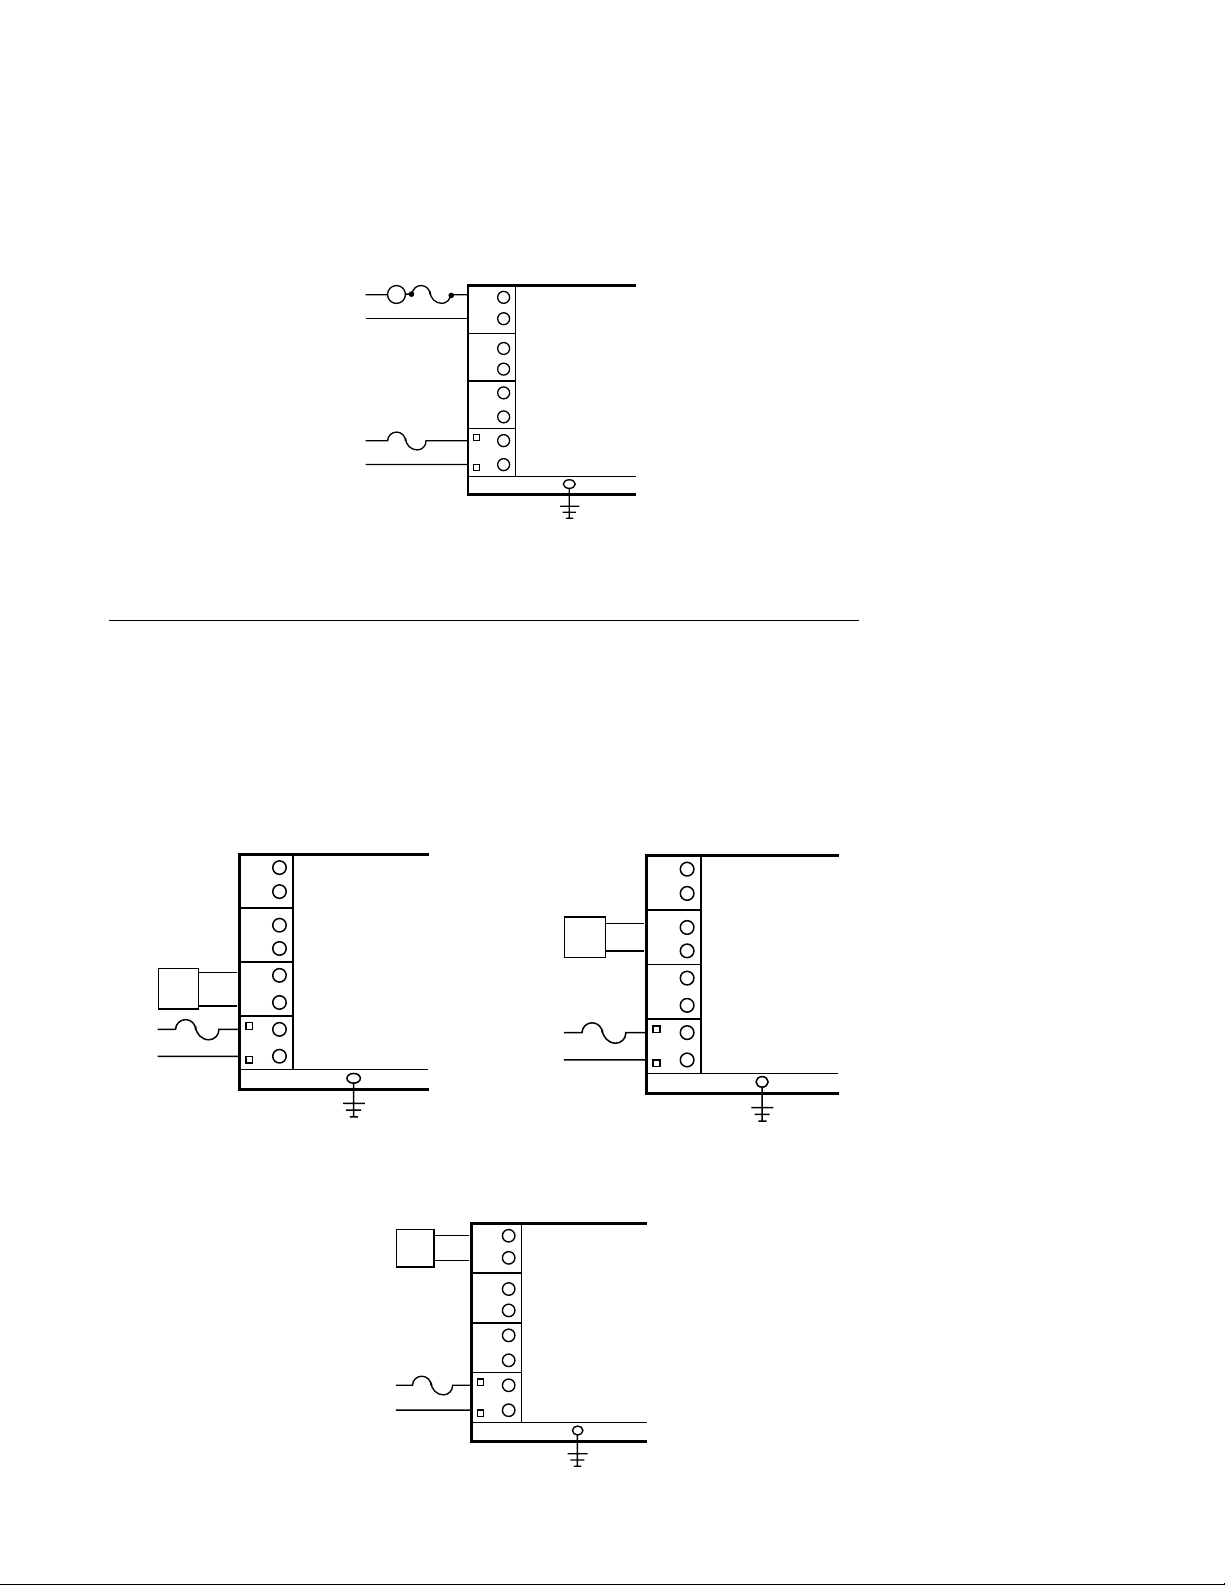
FIGURE 2-5
AC Power
Connect 115 VAC hot and neutral to terminals B and A respectively as illustrated below.
Connect 230 VAC as described below. Connect Earth ground to the ground screw as shown.
115 VAC INSTRUMENT VOLTAGE
Rear View
.5 AMP*
FUSE
L1
L2
B
A
GROUND
230 VAC INSTRUMENT VOLTAGE
Rear View
.25 AMP*
FUSE
L1
L2
B
A
GROUND
*Supplied by the customer
*Supplied by customer
FIGURE 2-6
Thermocouple Input
Make thermocouple connections as illustrated below. Connect the positive lead of the
thermocouple to terminal 3, and the negative to terminal 1. For industrial environments with
comparatively high electrical noise levels, shielded thermocouples and extension wire are
recommended. Be sure that the input conditioning jumpers are properly positioned for a
thermocouple input. See Appendix A-2 (page 64) and A-3 (page 65 or 66).
THERMOCOUPLE INPUT
Rear view
8
7
6
5
4
+
3
2
1
-
300 OHMS
MAXIMUM
LEAD
Page 15
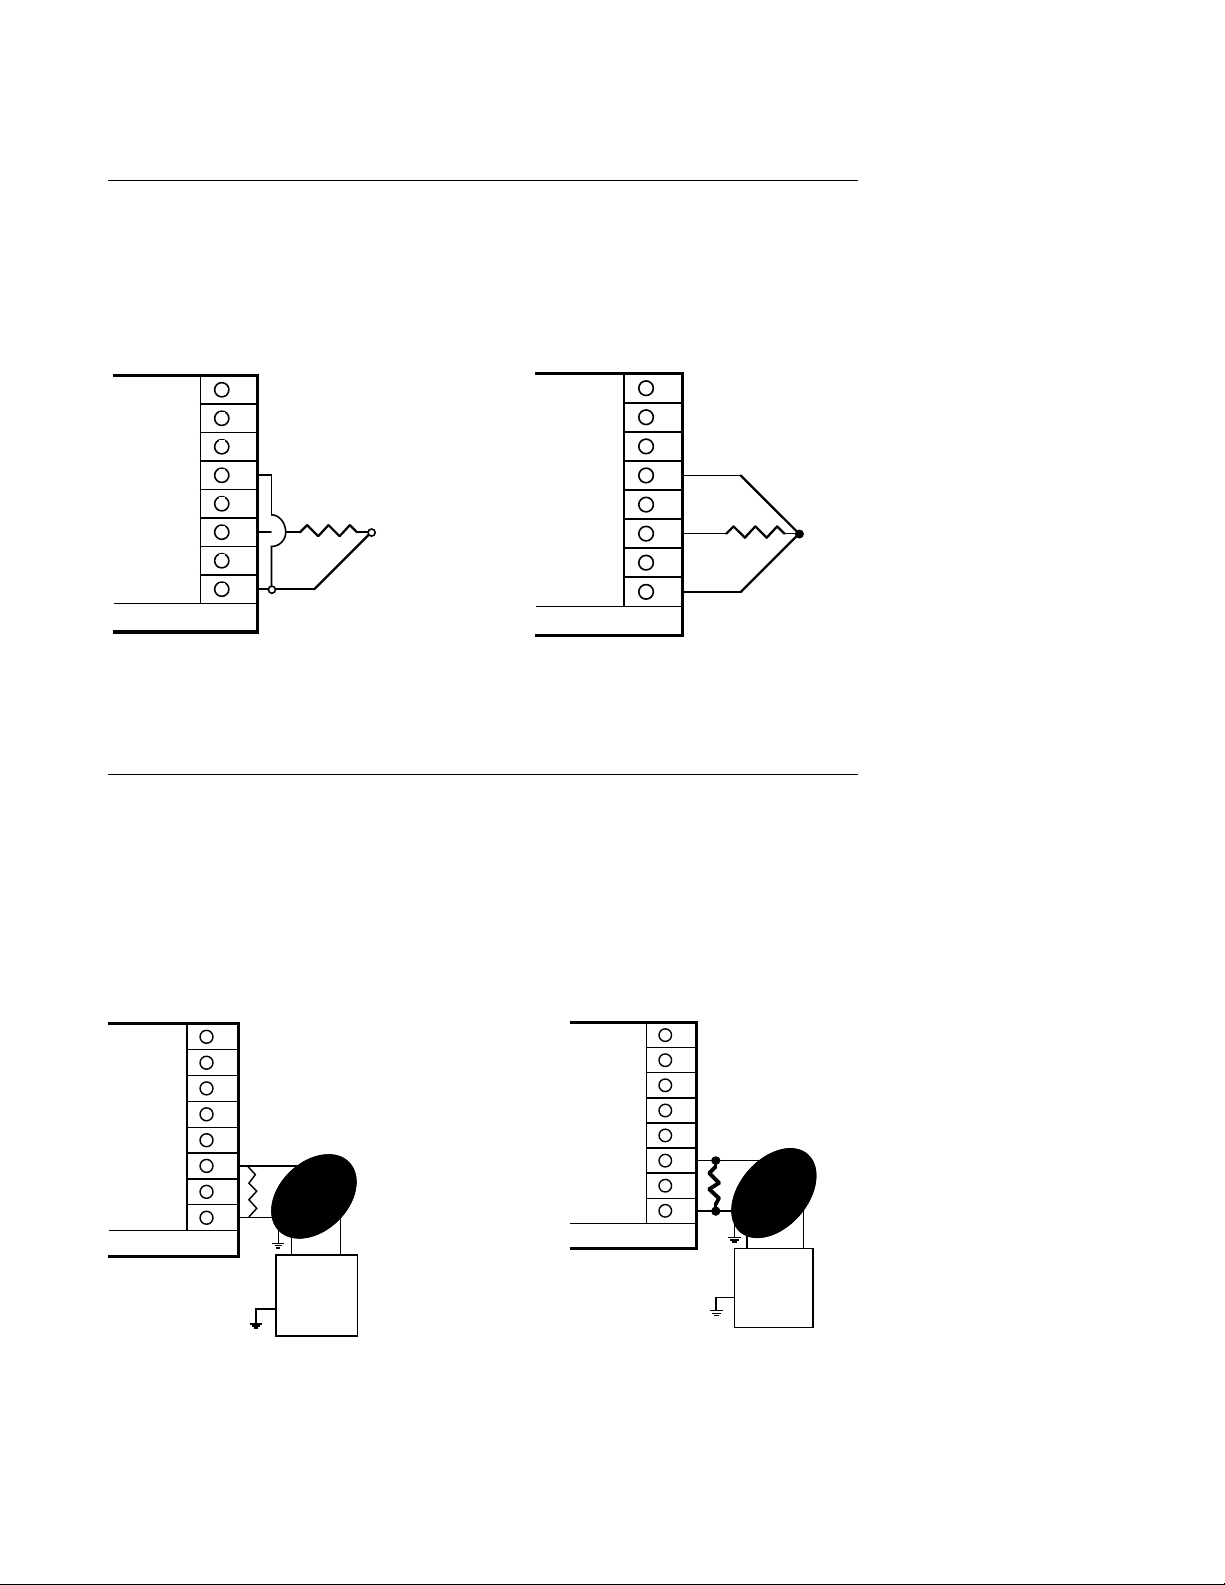
FIGURE 2-7
RTD Input
Connections are shown for 3 wire and 2 wire RTD's. If a three wire device is used, install the
common wires to terminals 1 and 5. If a two wire device is used, install a jumper between
terminals 1 and 5.
PAGE 15
2 WIRE RTD INPUT
Rear View
8
7
6
5
JUMPER*
4
3
2
1
100 OHM*
PLATINUM
3 WIRE RTD INPUT
Rear View
8
7
6
5
4
3
2
1
100 OHM*
PLATINUM
10 FEET
LEAD
*Supplied by the customer
MAXIMUM
*Supplied by customer
FIGURE 2-8
Volt, Millivolt and Milliamp Input
Make volt, millivolt or milliamp connections as shown below. Terminal 3 is positive and
terminal 1 is negative. Milliamp input requires a shunt resistor be installed across the input
terminals as shown. 4-20mA input are accommodated by setting up the instrument for either
10 to 50mVDC or 1 to 5VDC input. Make sure that the appropriate resistor value is used.
Terminal 3 is positive and terminal 1 is negative. (.1% resistors recommended.) (Continued
on next page)
MILLIAMP DC INPUT
Rear View
8
7
6
5
4
3
2
1
Shielded Twisted
Pair
+
-
MILLIAMP DC
SOURCE
250 OHM SHUNT
RESISTER
REQUIRED
MILLIAMP DC INPUT
Rear View
NOTE: Fault detection is not functional for 0-5 V or 0-20 mA inputs.
8
7
6
5
4
3
2
1
Shielded Twisted
Pair
+
-
MILLIAMP DC
SOURCE
2.5 OHM SHUNT
RESISTER
REQUIRED
Page 16
PAGE 16
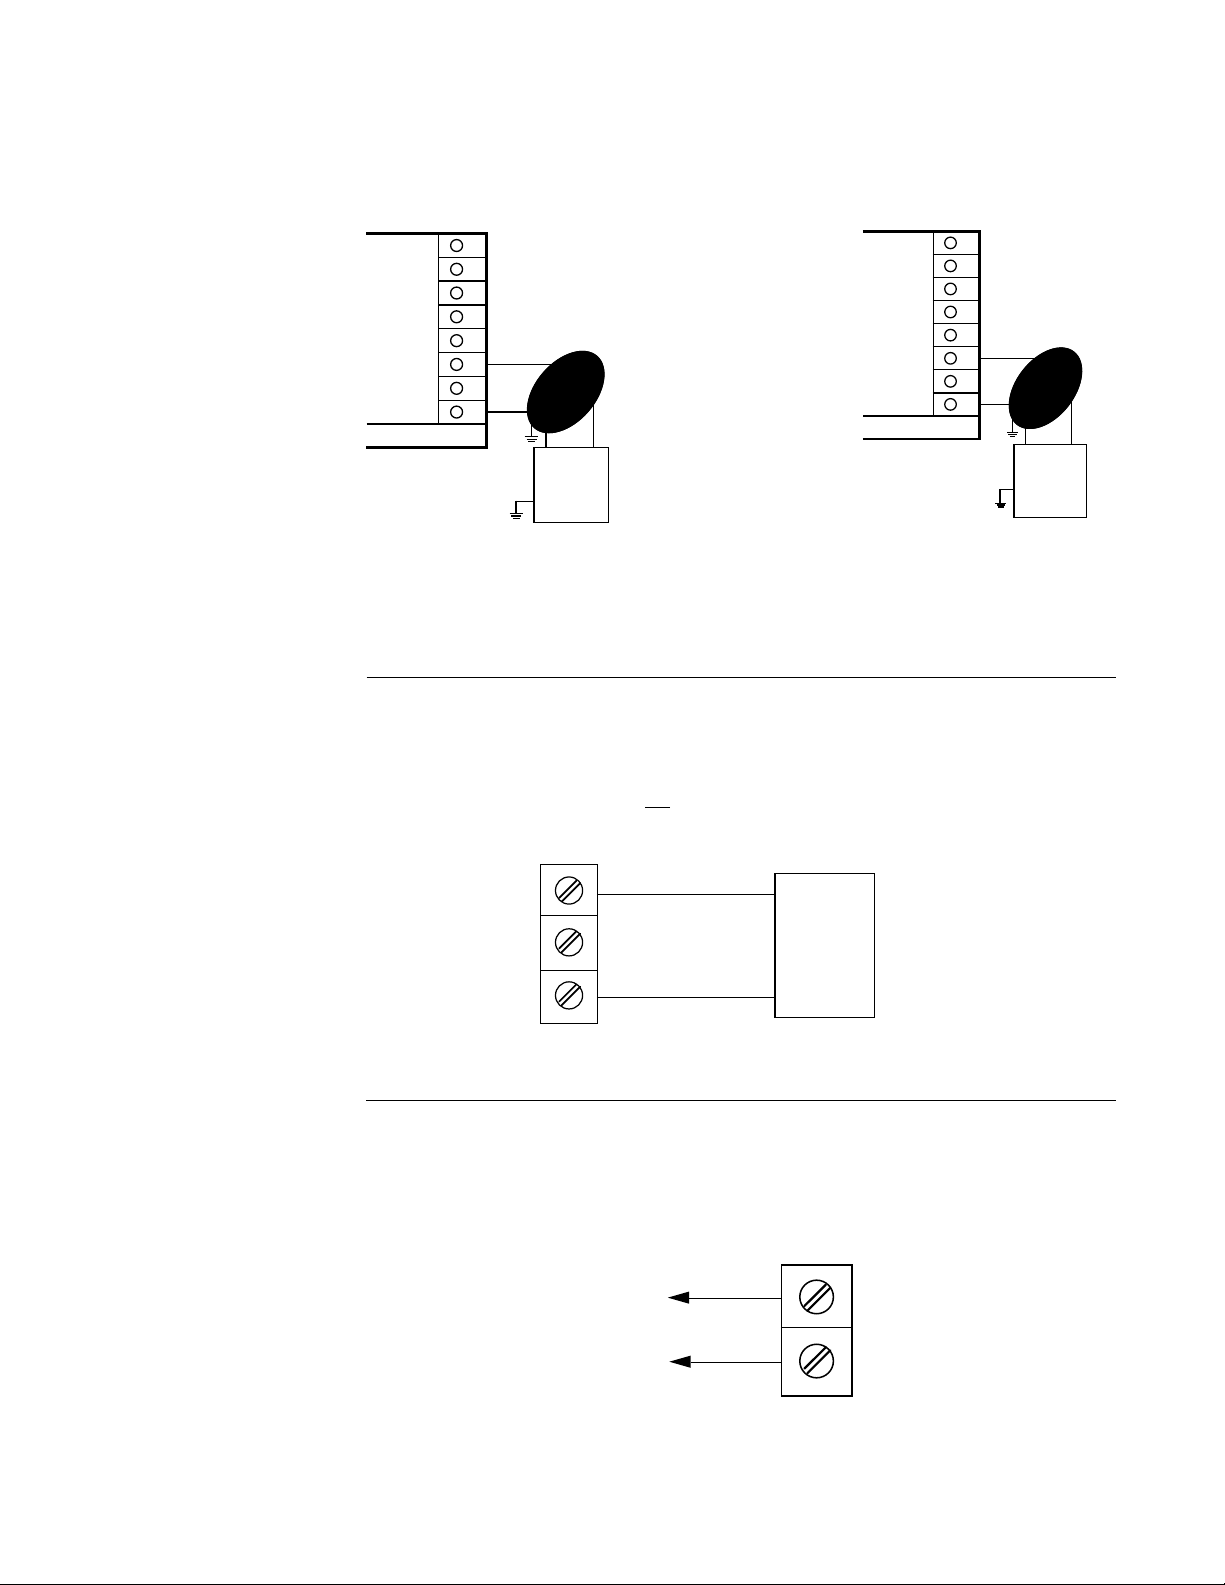
MILLIVOLT DC INPUT
Rear View
8
7
6
5
4
+
3
2
1
-
Shielded Twisted
Pair
MILLIVOLT DC
SOURCE
50 MILLIVOLT DC
MAXIMUM
VOLT DC INPUT
Rear View
8
7
6
5
4
+
3
2
1
-
Shielded Twisted
Pair
VOLT DC
SOURCE
5 VOLT DC
MAXIMUM
FIGURE 2-9A
24Volt Transmitter Power Supply (XP Option)
Make connections as shown below. Terminal 3 is positive (+) and terminal 1 is negative (-).
Be sure the input conditioning jumpers are properly positioned for the input type selected.
See Figure A-2 Processor Board, page 64 and Figure A-3 Option Board, page 65 or 66.
Note the 250 ohm shunt resistor is
not required.
+3
2
-1
+
Two Wire
Transmitter
-
FIGURE 2-9B
24 Volt Power Supply (XA Option)
Make connections as shown below. Terminal G is positive (+) and terminal H is negative (-).
Be sure the input conditioning jumpers are properly positioned. See Figure A-2 Processor
Board, page 64 and Figure A-3 Option Board, page 65 or 66.
H -
24VDC
G +
Page 17
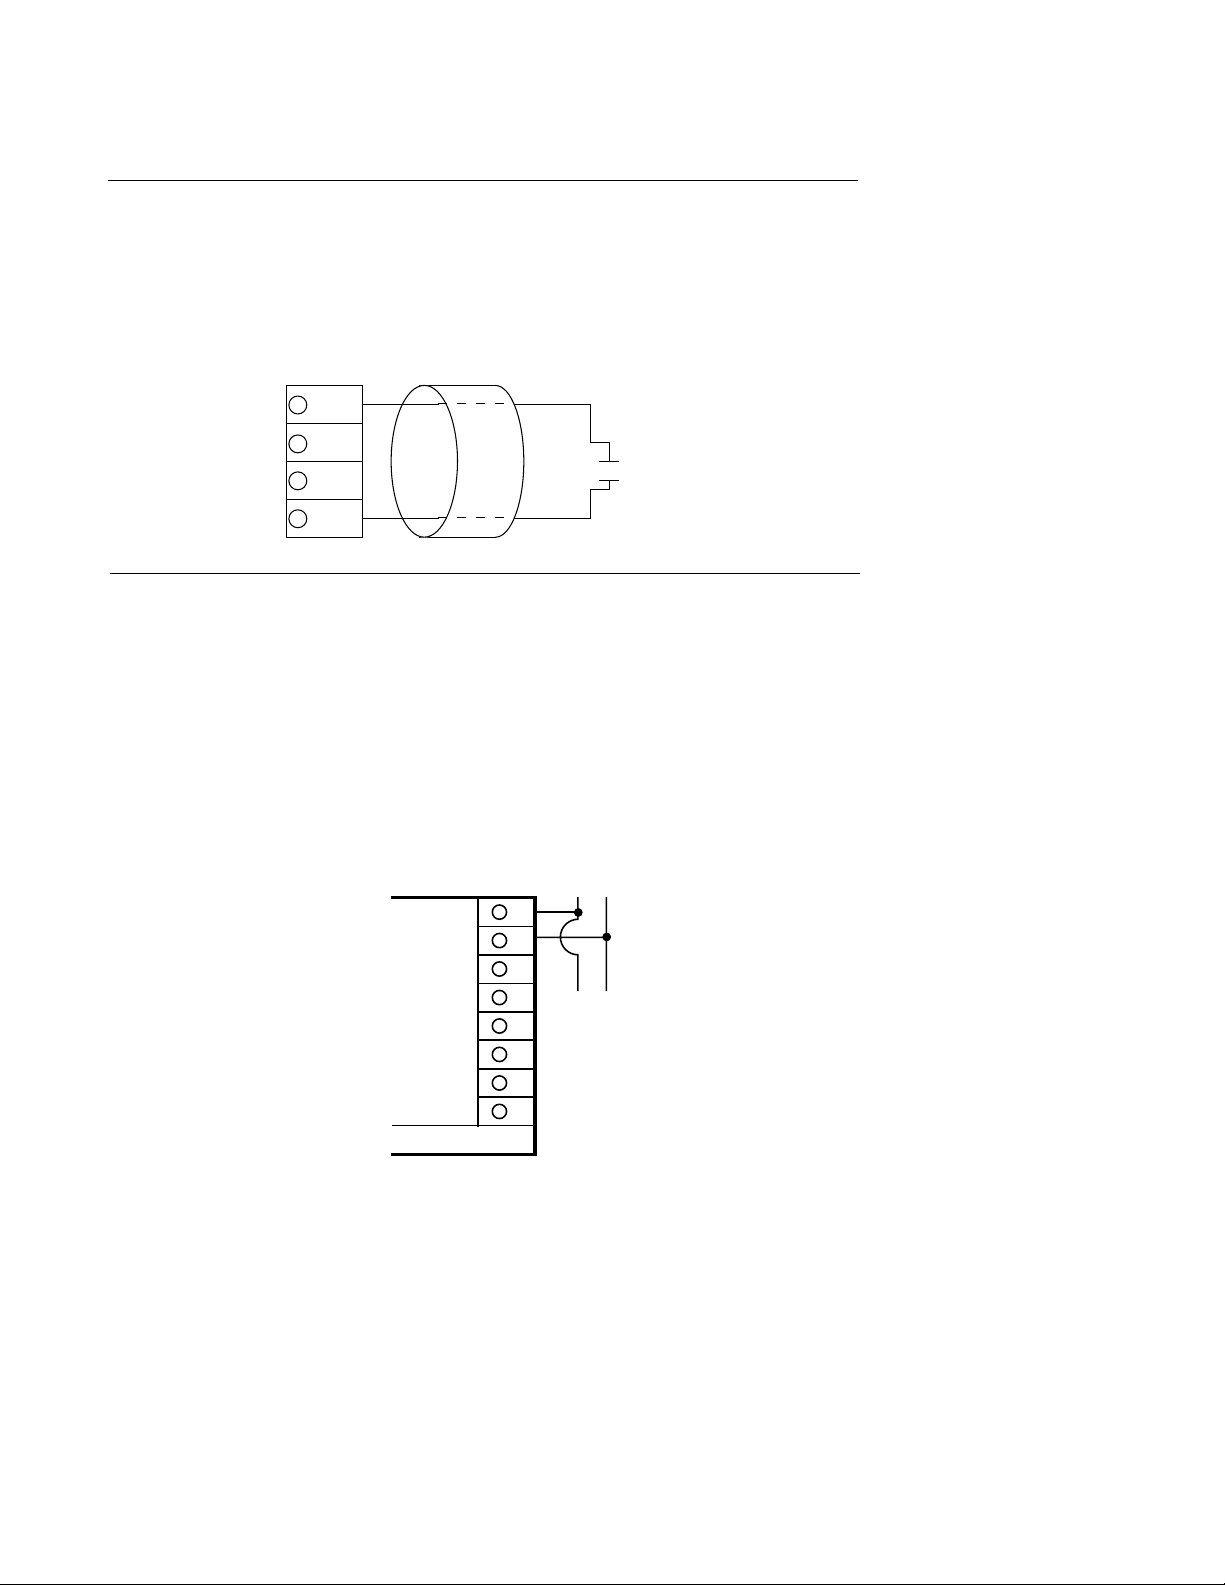
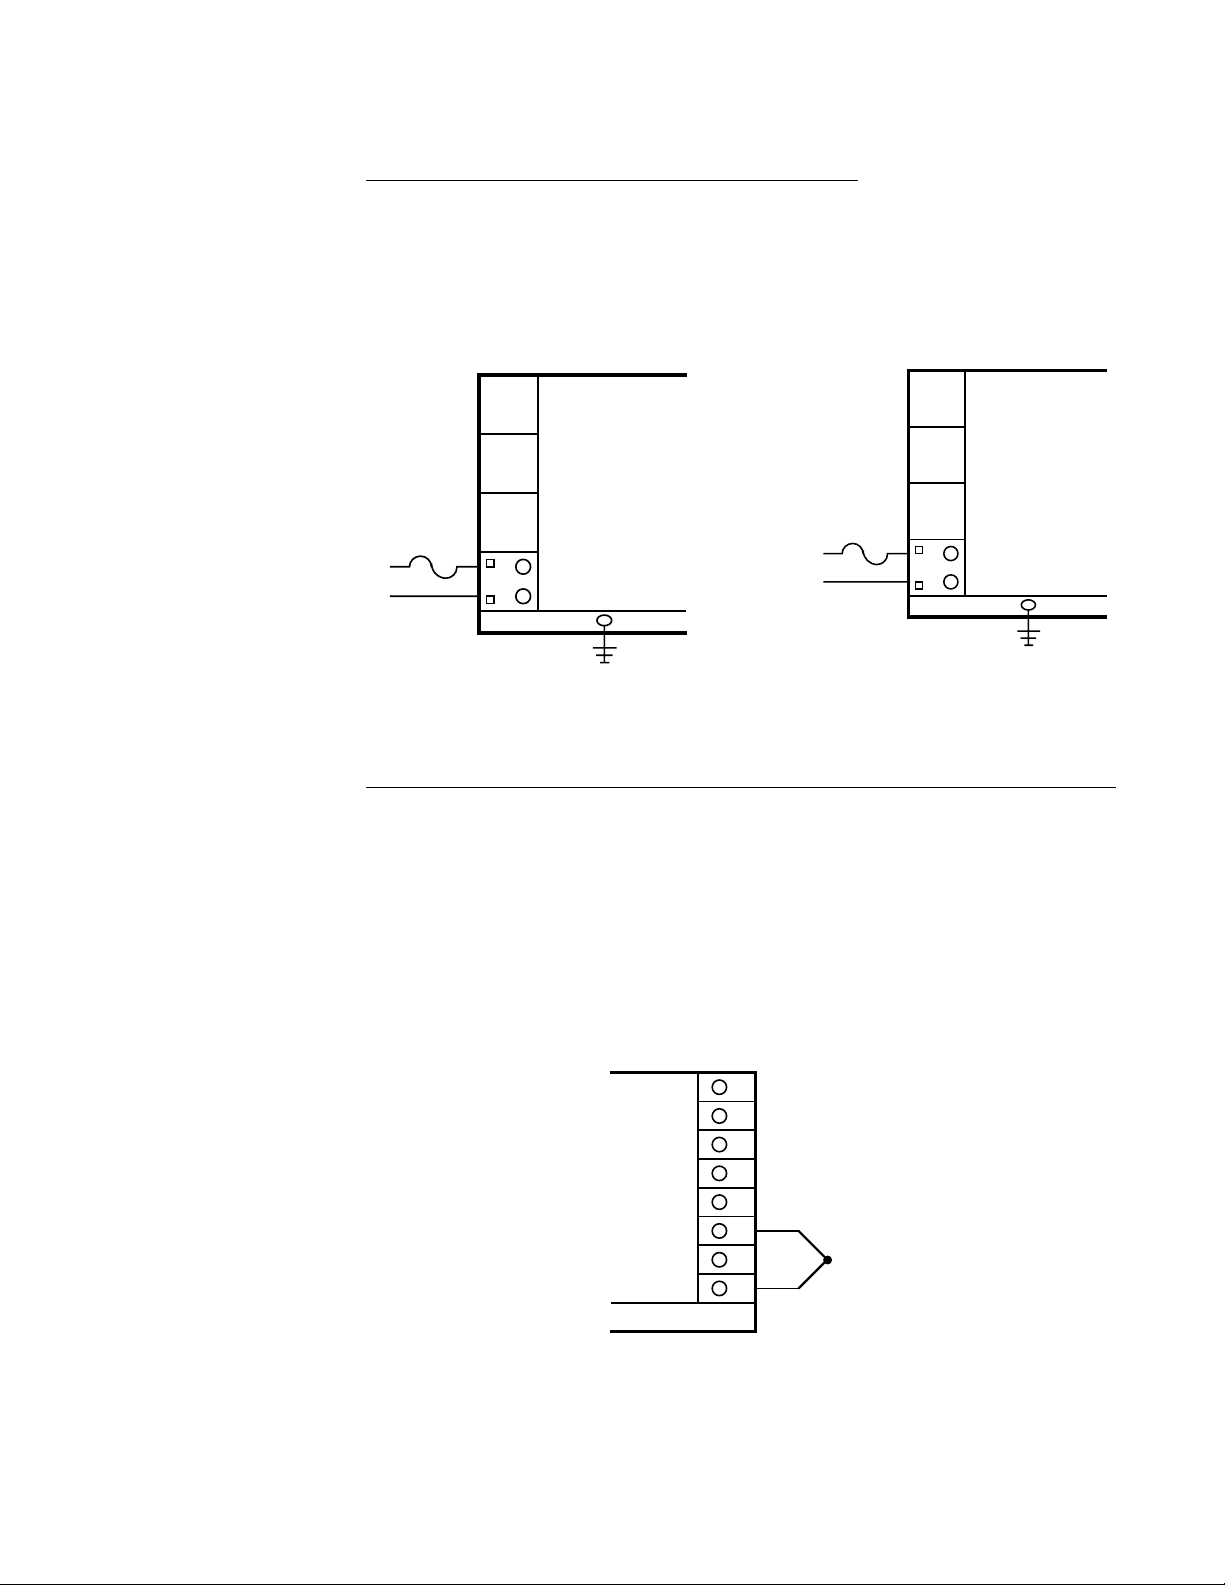
FIGURE 2-10
Remote Run/Hold Input
If Remote Run/Hold capability has been specified, make connections as shown. Terminal 5 is
the ground and terminal 8 is the input.
Shielded
Multi-Conductor
Cable
Run/
+
8
Hold
+
Out2
7
4-20mA
Out1
6
4-20mA
Return
5
+
Remote
Dry
Contact
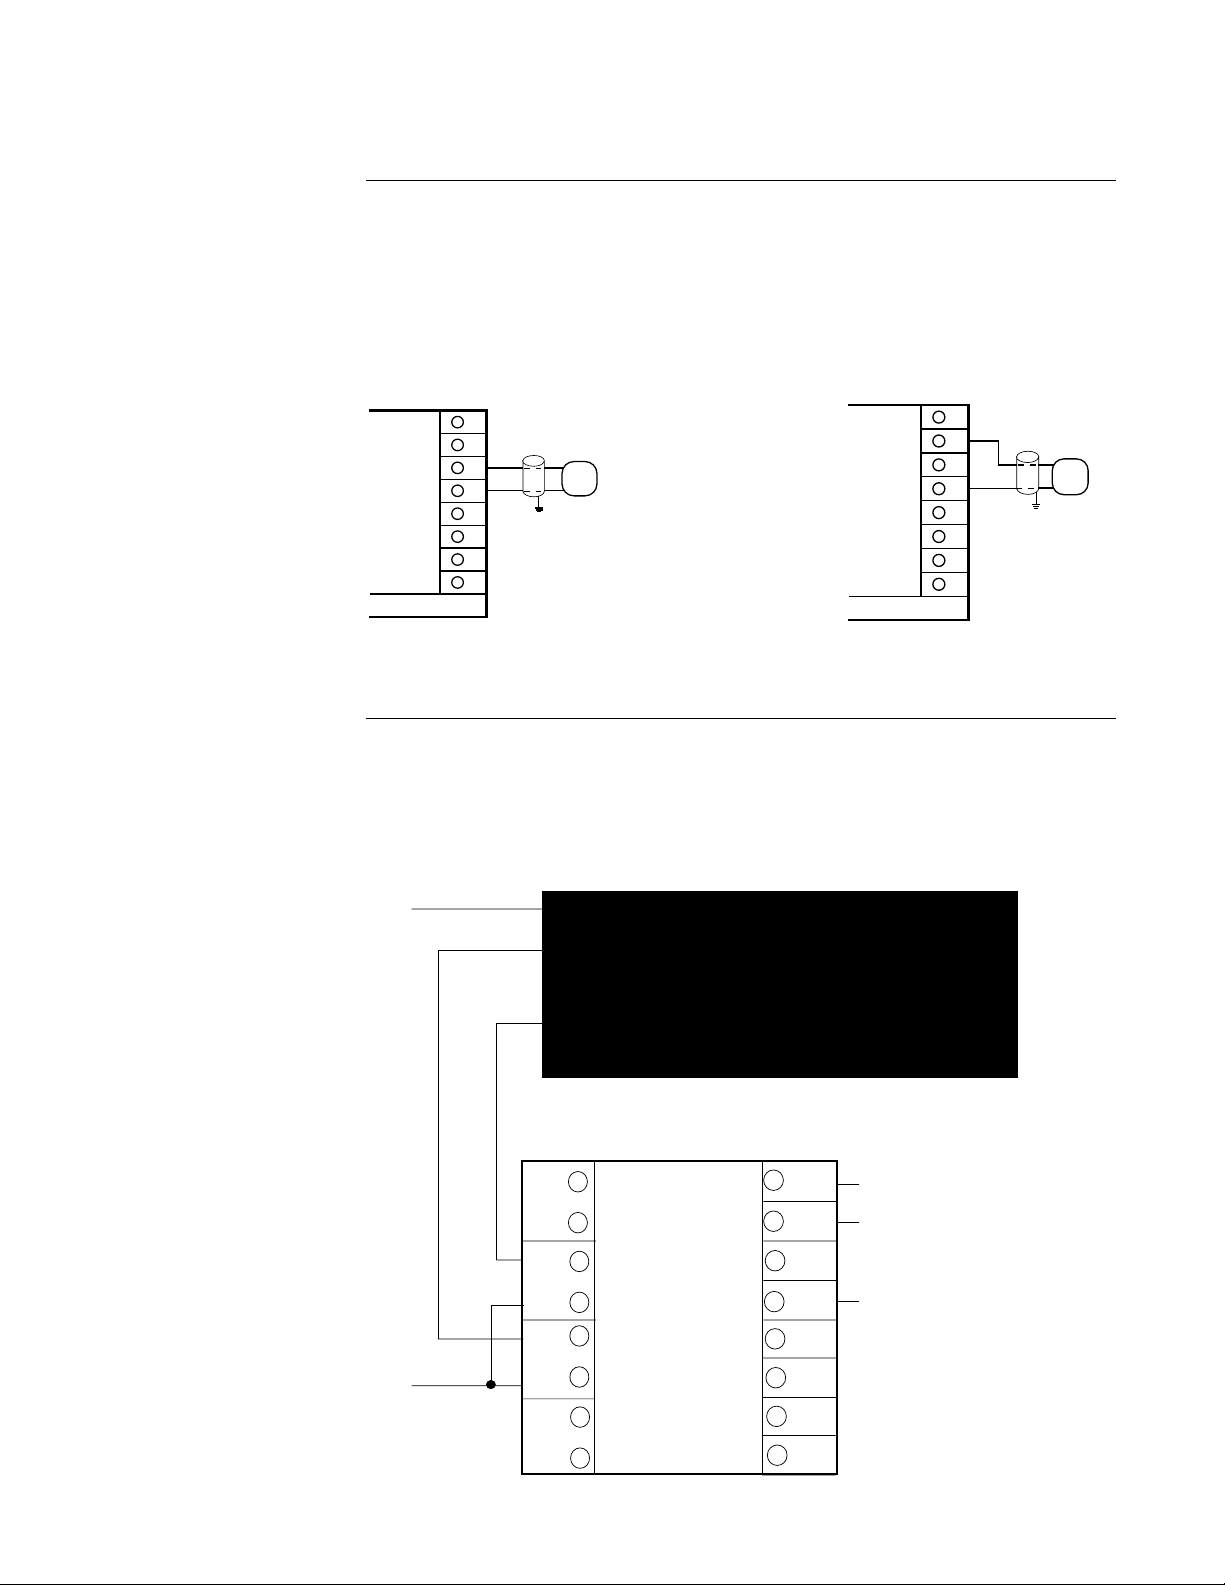
FIGURE 2-11
Remote Digital Communications RS-485 Terminals 7 & 8 (Optional)
If the communications network continues on to other units, connect the shields together, but
not to the instrument. A terminating resistor should be installed at the terminals of the last
instrument in the loop. The shield should be grounded at the computer or the convertor box, if
used. See the Protocol Manual (Form 2878) for more details on the use of the digital
communications option.
PAGE 17
Terminals 7 & 8 are used
for communications when
the model number is
6XXYX3X or 6XXYX5X
where X= any valid number
and Y=0, 1, or 2.
DIGITAL COMMUNICATIONS
CONNECTIONS - TERMINALS 7 & 8
FROM HOST
Output 2 cannot be DC Current
8
7
6
5
4
3
2
1
COMPUTER
TO OTHER
INSTRUMENTS
Page 18
PAGE 18
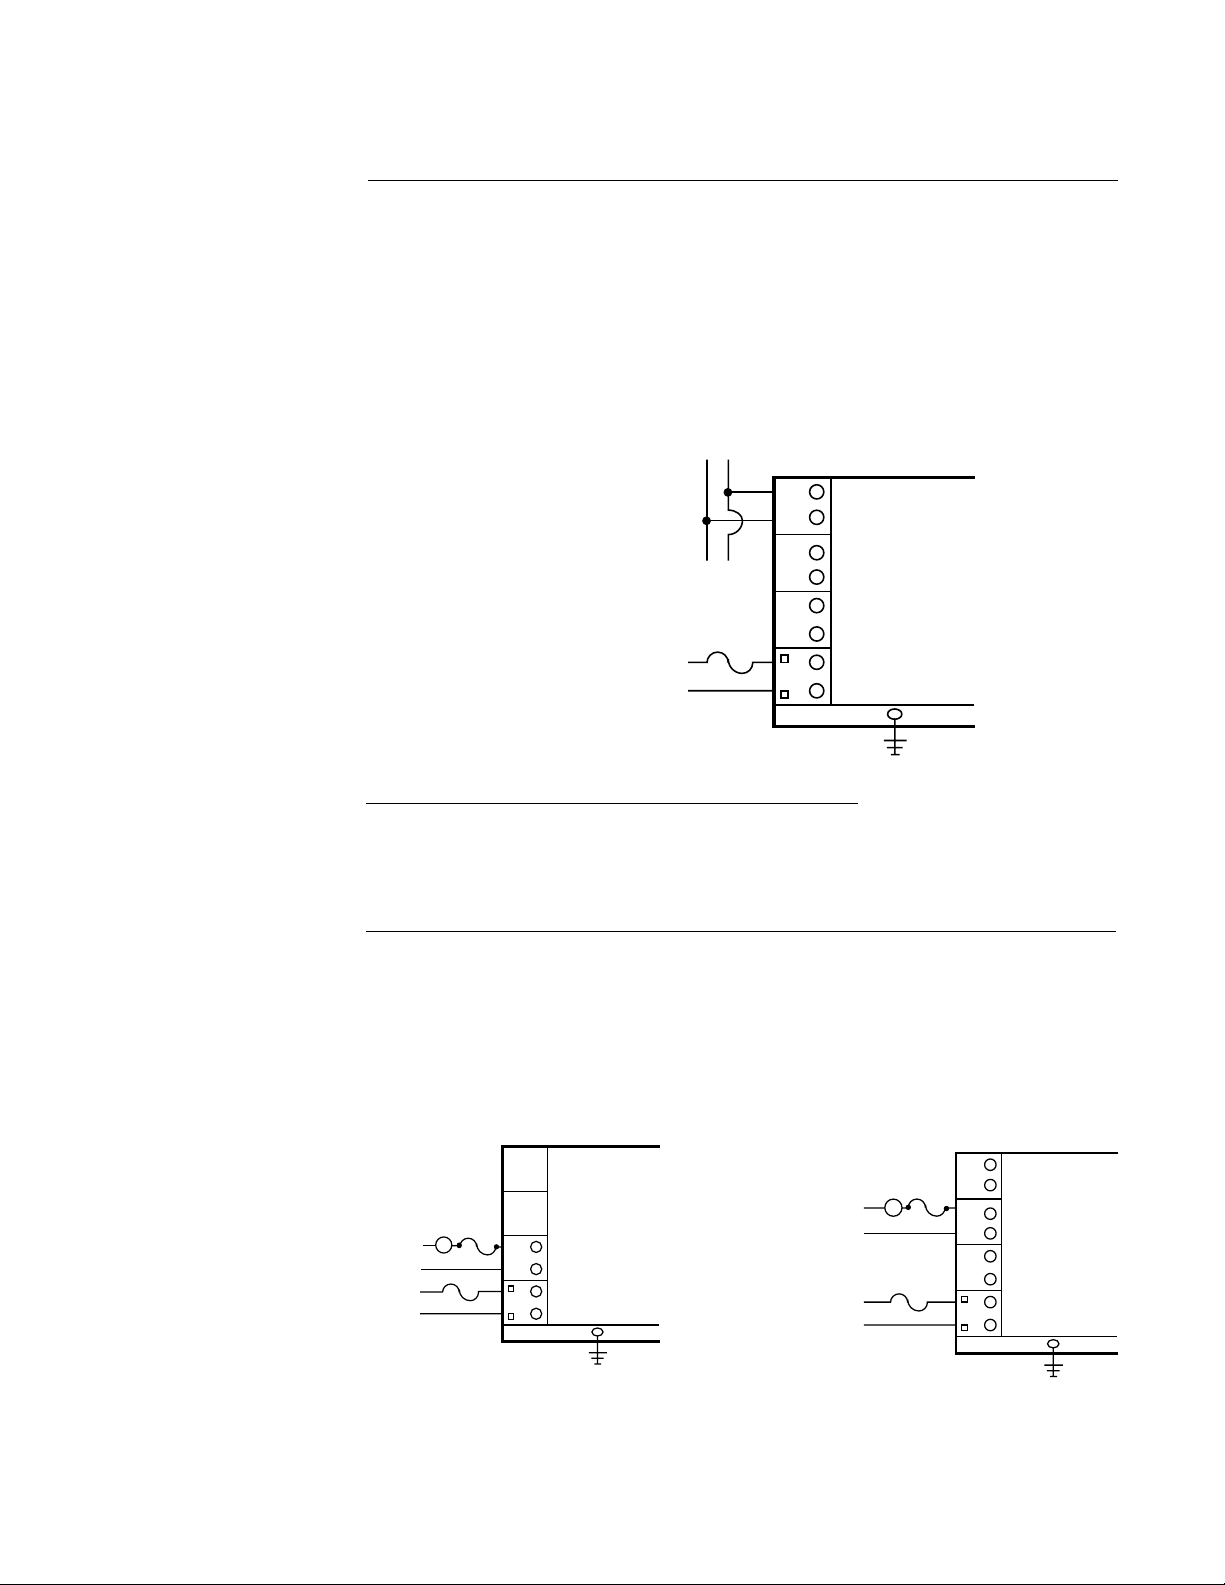
FIGURE 2-12
Alternate Remote Digital Communications RS-485 Terminals G & H (Optional)
If the communications network continues on to other units, connect the shields together, but
not to the instrument. A terminating resistor should be installed at the terminals of the last
instrument in the loop. The shield should be grounded at the computer or the convertor box, if
used. See the Protocol Manual (Form 2878) for more details on the use of the digital
communications option.
DIGITAL COMMUNICATIONS
Terminals G & H are used
for communications when
the model number is
6XXY04X or 6XXY06X where
X= any valid number and
Y=3, 4, or 5.
CONNECTIONS - TERMINALS G & H
From Host
Computer
Output 3 Must Be 0
Rear View
H
G
F
E
D
C
B
A
GROUND
INPUT
POWER
To Other
Instruments
2.6.3 OUTPUT CONNECTIONS
Output connections include SPST relays, SSR drivers, and 4 to 20mADC. Relay outputs
may be assigned control, alarm or event functions. Assignment of output function is accomplished via the front keypad and is described in Section 4 (page 38) of this manual.
FIGURE 2-13
Relay Output
Connections are made to relay A as illustrated below. Connect relay(s) B & C (if present) in
the same manner. Relay contacts are rated at 5 amp resistve at 130 VAC.
INPUT
POWER
L2
L1
LOAD
RELAY A
D
C
B
A
Rear View
GROUND
L2
L1
INPUT
POWER
LOAD
RELAY B
Rear View
H
G
F
E
D
C
B
A
GROUND
Page 19
RELAY C
PAGE 19
Rear View
H
G
F
E
D
C
B
A
GROUND
INPUT
POWER
LOAD
L2
L1
FIGURE 2-14
SSR Driver Output
Connections are made to the solid state relay
shown. The solid state relay driver is a 5 VDC current sink output type. Connect the solid
state relay driver(s) in the Relay B and C position (if present) in the same manner.
SSR DRIVER (RELAY A)
Rear View
H
G
SOLID STATE
RELAY
INPUT
POWER
F
E
+
D
C
-
B
A
GROUND
driver
output located in the Relay A position as
SSR DRIVER (RELAY B)
Rear View
SOLID STATE
RELAY
INPUT
POWER
+
H
G
F
-
E
D
C
B
A
GROUND
INPUT
POWER
SOLID STATE
RELAY
SSR DRIVER (RELAY C)
Rear View
+
H
-
G
F
E
D
C
B
A
GROUND
Page 20
PAGE 20
FIGURE 2-15
mADC Output
Connections are made to current outputs 1 and 2 as shown. Connect the positive lead to
terminal 6 for Output 1 or terminal 7 for Output 2, the negative leads connect to terminal 5.
Current outputs will operate up to 650 ohms maximum load. The current output(s) can be
selected for either 4-20mADC or 0-20mADC (if EO option is present).
DC CURRENT OUTPUT 1
Rear View
8
7
6
5
4
3
2
1
Shielded
Twisted
Pair
+
-
LOAD
650 OHMS
MAXIMUM
DC CURRENT OUTPUT 2
Rear View
8
7
6
5
4
3
2
1
Shielded
+
Twisted
Pair
-
LOAD
650 OHMS
MAXIMUM
FIGURE 2-16
Position Proportioning Control
The relay and slidewire feedback connections are made as illustrated below. The relay
assigned to Output 1 will be used to drive the motor in the open direction and the relay
asssigned to Output 2 will be used to drive the motor in the closed direction. The minimum
slidewire feedback resistance is 135 ohms, the maximum resistance is 10K ohms.
L2
L1
RELAY B
RELAY A
OPEN
CLOSE
H
G
F
E
D
C
B
A
Modulating Motor
Rear View
POS.PROP.
8
WIPER
POS.PROP.
7
HIGH
6
5
4
3
2
1
+
RETURN
Page 21
Configuration 3.1
After completing installation of the unit, the configuration procedures contained within
this section must be performed to prepare the instrument for operation on the intended
application. The procedures include selecting specific parameters, entering data and
possible jumper positioning.
Parameter selections and data entry are made via the front keypad. To ease
configuration and operation, user entered data has been divided up into several
modes. Each mode contains a different type of data or may be used for specific
operating functions. These modes are as follows:
PAGE 21
Control
(CtrL)
Standby
A
(Stby)
Test
(tESt)
Profile
Continue
(PCon)
Calibrate
(CAL)
Profile
Entry
(PEnt)
Program
(Prog)
P1..P8
Profile
Number
Tune
(tunE)
OFF
A
Mode Display Code Function Description
Off oFF Operation Outputs and Alarm Off
Control CtrL Operation Operates in automatic
control; Change local
setpoint, Alarms are On
Manual Stby Operation Manual control of
proportional outputs
Program Prog Configuration Configures operating
parameters
Tune tunE Configuration & Sets alarm settings &
Operation tunes the controller to
the process
Profile PCon Operation Provides Profile
Continue Continue function
Profile PEnt Configuration Configures profile Entry
Entry parameters
P1 thru P8 P1 - P8 Operation Executes any of the 8
profiles
Test tESt Service Performs instrument
tests
Calibration CAL Service Performs instrument
calibration
Enable EnAb Configuration Locks out or enables
access to any modes
(Continued on next page)
Page 22

PAGE 22
Associated with each mode is a series of unique displays which are accessed via the front
keypad.
Prior to first time operation of the instrument, the configuration procedures for the
Program, Profile Entry and Tune modes must be performed as applicable. The Control, Off,
Standby, Profile Continue and Profile execution (P1 thru P8) modes are discussed in Section
4.1 (page 38) of this manual.
Calibration and Test modes are not used as part of instrument configuration or operation.
These are used for service and maintenance functions and are discussed in Section 5.2
(page 47) of this manual.
Shipped Configuration/
Jumper Positioning 3.2
All configuration parameters in each mode are set to default values. These defaults are
shown in tabular form under the description for each mode. Instrument AC power input is as
specified in the instrument model number and as shown on the instrument ratings label.
3.2.1 JUMPER POSITIONING
Jumpers are used in all instruments to provide a security lockout feature and to condition the
process input . All jumpers are typically of the three pin type and have two functions. All
jumpers are either located on the Options Board or the Processor Board. Board layouts
and jumper locations are shown in Appendix A-2 and A-3 (pages 64 and 65 or 66).
Check the actual jumper position in the instrument to be configured and verify the proper
position for the intended application. If the current position is not correct, make changes.
Start up Procedures 3.3
Step by step procedures are provided in Tables 3-1 thru 3-4 . These tables provide the
display sequence, parameter adjustment and factory setting for each step.
The instrument is provided with a "time out" feature. If the instrument is in any mode and no
keypad activity takes place for 30 seconds, the instrument will "time out" and exit the mode
automatically. The instrument will display the code for the respective mode. If a mode code
is displayed for 5 seconds with no activity it will then "time out" and proceed to either the
Control or Off mode, depending upon which operational state the instrument was in last.
3.3.1 POWER UP PROCEDURE
A. Verify that all electrical connections have been properly made before applying power to
the instrument.
If the instrument is being configured for the first time, it may be desirable to
disconnect the controller output connections as the instrument may go into the
Control mode automatically following the power up sequence. Upon verification,
power may be applied.
Page 23

B. Upon power up, "6XXX" will be displayed (X representing digits), then "XXX-",
identifying the seven digit model number as defined in the order matrix. Next, the
software revision level will be displayed in the format "rX.XX". Then "tSt1", "tSt2", and
"tSt3" will be displayed while Test 1 thru 3 are executed automatically. Upon successful
completion of these tests, "Ctrl" (for the Control mode) or "oFF" (for the Off mode) will
be displayed for about three seconds. During this time the operator may select another
mode prior to the instrument automatically going into the Control mode.
C. If any error messages are displayed, refer to Section 5.4, page 56 for a definition of these
error messages and the required action.
D. If the instrument has been configured or operated previously, the mode that the
instrument will go into upon power up, depends on what mode the instrument was in on
power-down and how it has been programmed.
Front Panel Operation 3.4
3.4.1 DIGITAL DISPLAY AND STATUS LED's
The digital display provided has 4 digits and a decimal point. Each digit has seven segments
and is capable of producing numeric characters from 0-9 and certain alpha characters. The
digital display is used to provide indication of process variable as well as displaying codes
used for configuration and operation of the instrument. The display includes the following
Status Indicator LED's:
PAGE 23
Label Color Function
MAN Amber Lights when the Manual StbY mode is on.
OUT1 Red Lights when Output 1 is on.
OUT2 Amber Lights when Output 2 is on.
ALRM Red Lights when either Alarm is on or active.
SEG 1 Red Lights to indicate the profile section segment number
thru that is active.
SEG 6
RAMP Red Lights during the Ramp section of any profile segment.
SOAK Red Lights during the Soak section of any profile segment.
SP Green Indicates that the value displayed is the setpoint.
C Red Lights to indicate that the process value is in terms of
degrees C (Celcius)
F Red Lights to indicate that the process value is in terms of
degrees F (Farenheit)
U Red Lights to indicate that the process value is in terms of
engineering units.
- Red Lights to indicate a negative displayed value
Page 24

PAGE 24
3.4.2 KEYPAD CONTROLS
The keys on the keypad functions include:
SCROLL: Used to: 1. Display the enabled modes and programmed profiles.
2. While in a mode, used to sequence the parameter codes and
values.
3. Exit some Test and Calibration functions.
4. Work in conjuction with other keys:
a. With the UP key to display proportional output %
when in the Control mode or while a profile is
running.
b. With the DOWN key:
1) On power up to alter model #
2) Enter Cal/Test functions
3) While a profile is running to view the
ramp/soak time remaining.
UP: Used to: 1. Exit a mode.
2. Turn a mode On in the Enable mode
3. Increases a parameter numerical value.
4. View the setpoint.
5. Increase the setpoint value in the Control mode.
6. Work in conjuction with the other keys:
a. With the SCROLL key to display proportional
output %
b. With the DOWN key:
1) On power up to reset the instrument
2) Lamp test
3) Enter the Enable mode
DOWN: Used for: 1. Enter a mode.
2. Turn a mode Off in the Enable mode.
3. Decrease a parameter numerical value.
4. To start a profile when the profile number is displayed.
5. Decrease the setpoint value in the Control mode.
6. Step display through parameter codes in a mode.
7. Work in conjuction with the other keys:
a. With the SCROLL key:
1) On power up to alter the model number
displayed.
2) Enter Cal/Test functions
b. With the UP key:
1) On power up resets the instrument
2) Lamp test
3) Enter the Enable mode
RUN/HOLD: Used to: 1. To start the profile number being displayed.
2. Change between the profile Run and Hold profile conditions.
Page 25

Operation Summary 3.5
The configuration and operating modes, the method of moving from one mode to another,
and the basic parameter functions are described in each individual section . Data and
parameter entry is made by stepping through each mode and making an appropriate
response or entry to each step.
3.5.1 MODE SELECTION
If the instrument is in either the Off mode or Control mode, repeated depression of the Scroll
key will cause the instrument to display the code corresponding to each mode which is
enabled and each profile which has been entered. To enter a mode while its code is
displayed, depress the Down key.
To exit the OFF mode, press the SCROLL key until CtrL is displayed, then press the DOWN
key.
Entry into any mode except the Control, Tune, Standby, Enable and Profile execution, will
cause the instrument's outputs to turn off. Access to the Tune mode is provided while the
instrument continues normal operation if in Control or running a Profile.
3.5.2 CONFIGURATION DISPLAYS
During configuration, the display is used to show the parameter codes and values. During
normal operation, these displays are used to indicate process values, setpoints, etc. .
PAGE 25
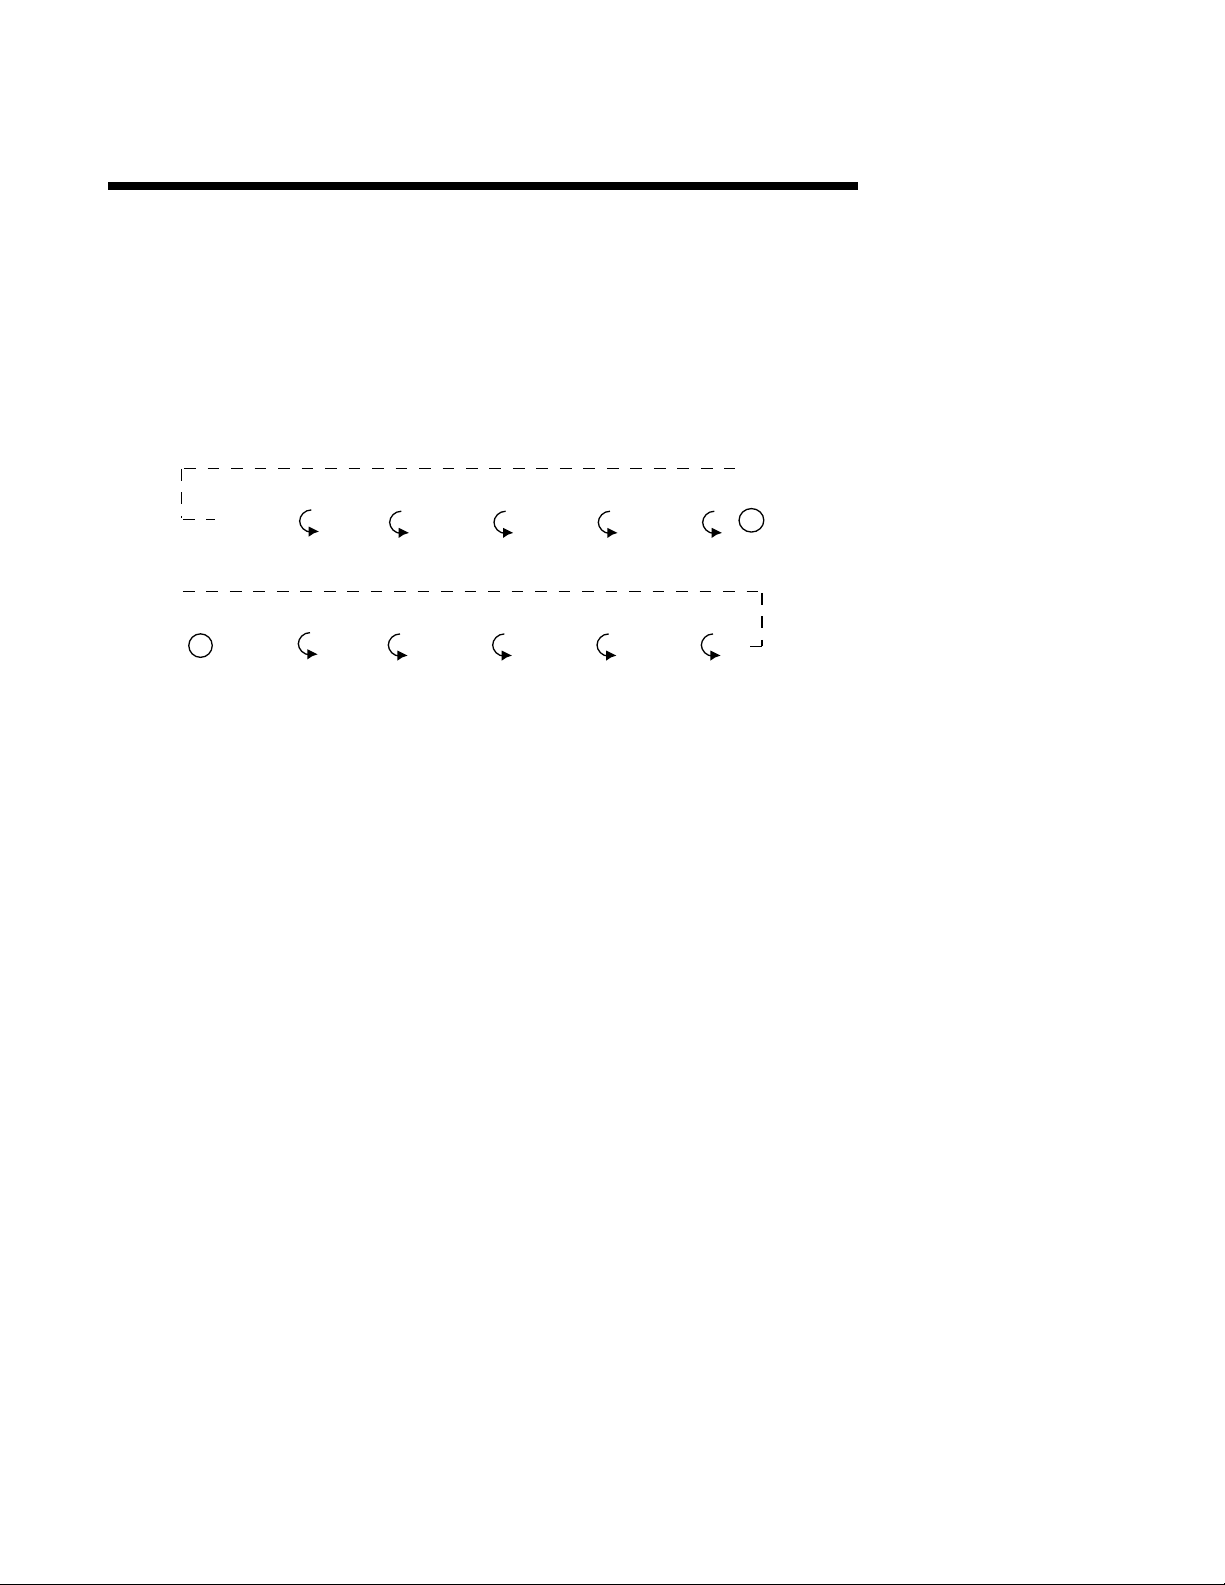
TABLE 3-1 PROGRAM MODE CONFIGURATION PROCEDURE
Press and release the SCROLL key until Prog is displayed. Press the DOWN key to enter
the Program mode. Press the SCROLL key to advance the display through the parameter
codes and their values. Use the Up and DOWN keys to adjust the values. After adjusting a
parameter, press the SCROLL key to proceed to the next parameter. Each time the DOWN
key is pressed while a parameter code is being displayed, such as dFF, the next parameter
code in the sequence will be displayed.
After all selections have been made, to exit the mode, press the UP key with a parameter in
the display (not a setting ).
For illustration purposes, all available Program mode parameters have been listed. The
parameters that will appear on the specific instrument will depend upon the model number
(hardware configuration) of the instrument and on the parameter selections previously made.
For future reference, record the parameter selections for the application in the "Your Setting"
column and on the Software Reference Sheet in Appendix E (page 75).
To prevent unauthorized changes to the Program mode, the mode can be disabled (turn off)
in the Enable mode.
(Continued on next page)
Page 26

PAGE 26
PROGRAM MODE FLOW CHART
Prog
A
inPS
iCor
out1
o1PL
out2
o2PL
rLyC
diSP
dPoS
Euu
EuL
HySt
ON
OFF
Key
Actual Display
On/Off Display Use arrow keys
to turn on or off
Scroll Key
Numeric Display Use arrow keys
to change value
Up Arrow Key
Down Arrow
out3
rLyA
rLyb
SPL
(SPuL EO
Option)
SPLL
(EO
Option)
AtFr
A
B
Page 27

PAGE 27
Com (Optional)
B
C
Ptb
PiA
rrH
PFF
dFF
Co1r
PoL
CCon
CbS
CAd
EO Option
Co2r
Pout
Pou
C
Page 28

PAGE 28
DISPLAY AVAILABLE FACTORY YOUR
STEP DESCRIPTION CODE SETTINGS SETTING SETTING
1 Input Selection inPS 0=J T/C degrees C
NOTE: Fault detection
is not functional for 0-5 V
or 0-20mA inputs.
2 Input Correction iCor -300 to 300 degrees
3 Output 1 out1 1=On-Off - Direct
1=J T/C degrees F
2=K T/C degrees C
3=K T/C degrees F
4=T T/C degrees C
5=T T/C degrees F
6=R T/C degrees C
7=R T/C degrees F
8=S T/C degrees C
9=S T/C degrees F
10=E T/C degrees C
11=E T/C degrees F
12=B T/C degrees C
13=B T/C degrees F
14=N T/C degrees C
15=N T/C degrees F
16=C T/C degrees C
17=C T/C degrees F
20=RTD degrees C
21=RTD degrees F
30=0 to 5VDC/0 to 20mA
31=1 to 5VDC/4 to 20mA
32=0 to 50mVDC
33=10 to 50mVDC
34=0 to 25mVDC
(cooling)
2=On-Off - Reverse
(heating)
3=Time Proportioning Direct (cooling)
4=Time Proportioning Reverse (heating)
5=Current Proportioning Direct (cooling)
6=Current Proportioning Reverse (heating)
7=Position Proportioning Open
1
0
2
4 Output 1Percent Limit o1PL 0 to 100%
5 Output 2 out2 0=None
(Position Prop.
Direct - Close)
1=On-Off Direct (cooling)
2=On-Off - Reverse
(heating)
3=Time Proportioning Direct (cooling)
4=Time Proportioning Reverse (heating)
5=Current Proportioning Direct (cooling)
6=Current Proportioning Reverse (heating)
7=Position Proportioning
Reverse - Close
100
0
Page 29

DISPLAY AVAILABLE FACTORY YOUR
STEP DESCRIPTION CODE SETTINGS SETTING SETTING
PAGE 29
6 Output 2 Percent Limit o2PL 0 to 100 %
7 Output 3 out3 0=None
1=Process Alarm Direct
2=Process Alarm Reverse
3=Deviation Alarm Direct
4=Deviaiton Alarm Reverse
5=Deviation Band Alarm Open withing band
6=Deviaiton Band Alarm Closed within band
8 Relay A Assignment rLyA 0=Not Assigned
1=Assigned to Output 1
2=Assigned to Output 2
3=Assigned to Output 3
4=Assigned to Event 1
5=Assigned to Event 2
6=Assigned to Event 3
9 Relay B Assignment rLyb Same selection as Relay A
10 Relay C Assignment rLyC Same selection as Relay A
11 Display Select diSP 1=Process Value
2=Process Value & Setpoint
3=Process Value Deviation
4=Process Value Deviation &
Setpoint
5=Setpoint
12 Decimal Position dPoS 0 or 1 decimal place
(dPoS can be 2, 3, &4
if Euu is selected)
13 Engineering Units Euu -9999 to 9999 units
Upper Value
14 Engineering Units EuL -9999 to 9999 units
Lower Value
100
0
1
2
3
1
0
1000
0
NOTE:
When changing the Decimal
position dPoS, the operator
MUST ensure that all values
previously programmed or
tuned are now valid with the
entry of a decimal point.
15 Hysteresis HySt 0 to 300 degrees
16 Setpoint Upper Limit SPL -9999 to 9999 degrees
17 Setpoint Lower Limit SPLL -9999 to 9999 degrees
18 Automatic Transfer AtFr 0=No automatic transfer
(SPuL -EO option)
(EO Option)
(width of hysteresis band,
see Page 68)
1=Transfer when
temperature goes
below setpoint
2=Transfer when
temperature goes
above setpoint
3
1400
0
0
Page 30

PAGE 30
DISPLAY AVAILABLE FACTORY YOUR
STEP DESCRIPTION CODE SETTINGS SETTING SETTING
19 Profile Time Base Ptb 1=HHH.T - Hours & Tenths
2=HH.MM - Hours & Min.
3=MM.SS - Minutes & Sec.
EO Option
4=Units/Hr ramp rate;
Hrs. & Tenths soak time
5=Units/Hr ramp rate;
Hrs/Mins soak time
6=Units/Hr ramp rate;
Mins & Secs soak time
20 Profile Interrupt Action PiA 0=Go to Off mode
1=Continue profile
2=Go into hold condition
3=Restart at the beginning
of the profile
21 Remote Run/Hold rrH 0=Not selected
1=Selected. Remote
Run/Hold will override
controller front panel
when placed in hold
from remote source
2=Selected. Remote
Run/Hold will not
override controller
front panel when placed
in hold from remote source
22 Process Filter Factor PFF 1 to 20 (# of scans aver.)
1=No filtering
3
1
0
1
23 Display Filter Factor dFF 1 to 20 (# of scans aver.)
1=No filtering
Parameters 24 - 28 are for Extended Option (EO) Only
24 Current Output 1 Range Co1r 0=0 to 20 mA
1=4 to 20 mA
25 Current Output 2 Range Co2r 0=0 to 20 mA
1=4 to 20mA
26 Process Output Pout 0=Not selected
1=Process Assigned to
Current Output 1
2=Process Assigned to
Current Output 2
3=Setpoint Assigned to
Current Output 1
4=Setpoint Assigned to
Current Output 2
27 Process/Setpoint Pou -9999 to 9999
Output Upper Value
28 Process/Setpoint PoL -9999 to 9999
Output Lower Value
1
1
1
0
2000
0
Page 31

DISPLAY AVAILABLE FACTORY YOUR
STEP DESCRIPTION CODE SETTINGS SETTING SETTING
Parameters 29 - 31 are for Communications Option Only
PAGE 31
29 Communications CCon 0=Off
Configuration 1=Monitor only (read only)
2=Normal mode (read and
write)
3=Total Access with Limit
Checking
4=Total Access without Limit
Checking
30 Communication CbS 1=300 bits per second (bps)
Bit Rate Select 2=600 bps
3=1200 bps
4=2400 bps
5=4800 bps
6=9600 bps
31 Communication Address CAd 0 to 99
* Factory setting for Total Access
0, 4*
6
0, 1*
Page 32

PAGE 32
TABLE 3-2 TUNE MODE CONFIGURATION PROCEDURE
The Tune mode allows the entry, review or altering of the process control Tune adjustments
and the alarm setting.
To enter the Tune mode, press and release the SCROLL key until tunE is displayed, then
press the DOWN key. Press the SCROLL key to advance the display through the parameters
and their values. Use the UP and DOWN keys to select (adjust) the values. Each time the
DOWN key is pressed while a parameter code is being displayed, such as dFF, the next
parameter code in the sequence will be displayed.
After selecting a parameter, to exit the mode, press the SCROLL key to proceed to the next
parameter. After all selections have been made, press the UP key with a parameter in the
display (not a setting).
For illustration purposes, all available Tune mode parameters have been listed. The parameters that will appear on the specific instrument will depend upon the parameter selection
previously made in the Program mode.
For future reference, record the parameter selections for the application in the "Your Setting"
column and on the Software Reference Sheet in Appendix E (page 75).
To prevent unauthorized changes to the Tune mode, the mode can be disabled (turned off) in
the Enable mode.
The Tune mode is adjusted on-line. The instrument will react to changes as they are
made.
DISPLAY AVAILABLE FACTORY YOUR
STEP DESCRIPTION CODE SETTINGS SETTING SETTING
1 Second Output Position SPrd -1000 to 1000 units
2 Process Alarm PAL -9999 to 9999 units*
3 Deviation Alarm dAL -3000 to 3000 units*
4 Deviation Band Alarm dbAL 1 to 3000 units*
5 1st Output Proportional Pb1 1 to 3000 units
Band Width
6 2nd Output Proportional Pb2 1 to 3000 units
Band Width
7 Manual Reset rSEt -1500 to 1500 units
8 Automatic Reset (integral) ArSt 0.0 to 100.0 repeats per
minute
9 Rate (or Derivative) rAtE 0.0 to 10.0 minutes
10 Cycle Time Output 1 Ct1 1 to 240 seconds
11 Cycle Time Output 2 Ct2 1 to 240 seconds
12 Position Proportioning SEnS 0.0 to 50.0%
Sensitivity
0
0
0
1
100
100
0
0.0
0.0
30
30
1.0
13 First Output Position FoP -1000 to 1000 units
* See Section 4.2, page 44 for explaination of setting alarms.
0
Page 33

TUNE MODE FLOW CHART
tunE
PAGE 33
A
SPrd
PAL
dAL
dbAL
Pb1
Pb2
rSEt
Ct1
Ct2
SEnS
FoP
ArSt
rAtE
Key
Actual Display
A
ON
OFF
On/Off Display Use arrow keys
to turn on or off
Scroll Key
Numeric Display Use arrow keys
to change value
Up Arrow Key
Down Arrow
Page 34

PAGE 34
PROFILE ENTRY MODE FLOW CHART
PEnt
A
SP
E1
E2
Pn
nS
E1
E2
rt
rr
E3
PLCt
dhru
dhrd
PEnd
ON
OFF
Key
Actual Display
On/Off Display Use arrow keys
to turn on or off
Scroll Key
Numeric Display Use arrow keys
to change value
Up Arrow Key
Down Arrow
E3
St
A
Page 35

TABLE 3-3 PROFILE ENTRY MODE CONFIGURATION PROCEDURE
Depress and release the SCROLL key until PEnt is displayed. Use the DOWN key to enter
the Profile Entry mode. Depress the SCROLL key to scroll through the parameters and their
values. Use the UP and DOWN keys to adjust the values. After adjusting a parameter,
depress the SCROLL key to proceed to the next parameter. After all selections have been
made, to exit the mode, depress the UP key with a parameter in the display (not a setting).
For assistance in developing the Profile refer to Appendix F (page 78).
DISPLAY AVAILABLE FACTORY YOUR
STEP DESCRIPTION CODE SETTINGS SETTING SETTING
1 Profile Number Pn 1 to 8
**
PAGE 35
2 Number of Segments nS 0-6 segments
Steps 3-11 are repeated for each segment
3 Ramp Time rt 0 to 9999 units per Ptb
3 *Ramp Rate rr 0 to 9999 units per Ptb
4 Setpoint SP Setpoint at end of Ramp
5 Event Output 1 E1 on or off
6 Event Output 2 E2 on or off
7 Event Output 3 E3 on or off
8 Soak Time St 0 to 9999 units per Ptb
9 Event Output 1 E1 on or off
10 Event Output 2 E2 on or off
11 Event Output 3 E3 on or off
**
**
**
**
**
**
**
**
**
**
**
* Will be displayed instead of Ramp Time rt if Ramp Rate is utilized (see Ptb, EO Option
only, page 29).
12 Profile Loop Count PLCt 0 to 9999, 0-continuous
13 Deviation Hold after dhru 0 to 3000 units
Ramp Up 0=no auto hold
**
**
14 Deviation Hold after dhrd 0 to 3000 units
Ramp Down 0=no auto hold
15 Profile End control PEnd -1=Hold at last setpoint
0=Abort - all outputs off
or at 0% Events off
1=Transfer to profile 1
2=Transfer to profile 2
3=Transfer to profile 3
4=Transfer to profile 4
5=Transfer to profile 5
6=Transfer to profile 6
7=Transfer to profile 7
8=Transfer to profile 8
**
**
After selecting the Profile End Control parameter value, press the SCROLL key to advance
the display to Pn. Press the UP key with Pn or any parameter code displayed to exit the
Profile Entry Mode. (Continued on next page)
Page 36

PAGE 36
**All values except Profile Loop Count (PLCt) are initialized to zero and all event outputs are
initialized to OFF, with the exception of the first profile. Profile Loop Count (PLCt) is set to 1.
The first profile has the number of segments initialized to zero, to turn the profile OFF, but the
profile has values stored in it for demonstration purposes. By setting the number of segments
to two, the profile can be reviewed and/or executed.
PROFILE 1 VALUES FOR DEMONSTRATION PURPOSES
Code Value
rt .10 Ramp Time
SP 100 Setpoint
E1 on Event 1 on
E2 oFF Event 2 off
E3 oFF Event 3 off
St .10 Soak Time
E1 oFF Event 1 off
E2 on Event 2 on
E3 oFF Event 3 off
rt .10 Ramp Time
SP 0 Setpoint
E1 oFF Event 1 off
E2 oFF Event 2 off
E3 on Event 3 on
St .10 Soak Time
E1 oFF Event 1 off
E2 oFF Event 2 off
E3 oFF Event 3 off
PLct 1 Profile Loop Count
dhru 0 Deviation Hold after Ramp Up - None
dhrd 0 Deviation Hold after Ramp Down - None
PEnd 0 Profile End Control - Abort - oFF Mode
TABLE 3-4 ENABLE MODE CONFIGURATION PROCEDURE
To enter the Enable mode, press and hold the UP and DOWN keys while in CtrL or oFF
modes. All the display lamps will light. After 10 seconds, the lamps will go out and EnAb will
be displayed. Release the keys and the display will change to EtSt. Press and release the
DOWN key and each mode to be enabled/disabled will be displayed. With the Enable mode
prompt for the desired mode displayed, press the SCROLL key to verify that the displayed
mode is either on (enabled) or oFF (disabled). Press the DOWN key to turn off the mode,
press the UP key to turn on the mode or press the SCROLL key to advance the display to the
next Enable mode prompt. Use the "Your Setting" column in the table to record your programming.
A Hardware jumper located on the Controller Board (See Appendix A-2, page 64) can be used
to lock/unlock the Enable mode. When the jumper is moved to the locked position, entry into
the Enable mode is not possible until the jumper is moved to the unlock position.
DISPLAY AVAILABLE FACTORY YOUR
STEP DESCRIPTION CODE SETTINGS SETTING SETTING
1 Test Mode EtSt on or oFF
2 Calibration Mode ECAL on or oFF
oFF
oFF
Page 37

DISPLAY AVAILABLE FACTORY YOUR
STEP DESCRIPTION CODE SETTINGS SETTING SETTING
3 Program Mode EPro on or oFF
on
PAGE 37
4 Tune Mode Etun on or oFF
5 Manual (Stby) Mode ESby on or oFF
6 Profile Continue Mode EPC on or oFF
7 Profile Entry Mode EPE on or oFF
8 Setpoint Change ESPC on or oFF
ENABLE MODE FLOW CHART
EnAb
EtSt
ECAL
ON
OFF
ON
OFF
on
on
oFF
on
on
EPro
Etun
ESbY
EPC
EPE
ESPC
ON
OFF
ON
OFF
ON
OFF
ON
OFF
ON
OFF
ON
OFF
ON
OFF
Key
Actual Display
On/Off Display Use arrow keys
to turn on or off
Scroll Key
Numeric Display Use arrow keys
to change value
Up Arrow Key
Down Arrow
Page 38

PAGE 38
Operation 4.1
4.1.1 OFF MODE
In the Off Mode, the instrument control, process retransmission signal(s) and alarm
function(s) are turned off. The Off mode can be entered by pressing and releasing the
SCROLL key until the display reads oFF, then pressing the DOWN key. The display will read
oFF and then the current process variable at two second intervals. This sequence will repeat
to indicate that the instrument is in the Off mode.
4.1.2 CONTROL MODE
In the Control mode, the instrument control function(s) and alarm(s) are actively responding
to the process variable as selected in the Program and Tune modes. The control mode
allows setpoint changes from local setpoint (standard) adjustment by an operator at the front
keypad. Other operations in the Control mode include a lamp test and proportional output %
display.
4.1.2.1 DIRECT/REVERSE OPERATION OF OUTPUTS
Direct operation is typically used with cooling applications. On-Off direct output(s) will turn on
when the process variable exceeds setpoint. Proportional direct output(s) will increase the
precentage of output as the process value increases within the proportional band.
Reverse operation is typically used with heating applications. On-Off reverse output(s) will
turn off when the process variable exceeds setpoint. Proportional reverse output(s) will
decrease the percentage of output as the process value increases within the proportional
band.
4.1.2.2 LOCAL SETPOINT OPERATION
The instrument must be in the Control mode to allow the setpoint value to be adjusted. In the
Control mode, to view the setpoint, press and release the UP or DOWN key. The green LED
under the SP label will light to indicate that the displayed value is the setpoint. To change the
setpoint value, press and hold the appropriate key. Press and hold the UP key to increase
the setpoint or press and hold the DOWN key to decrease the setpoint. The setpoint will
change slowly at first then faster as the key is held pressed. If the setpoint will not increase,
check the Program mode (page 25) to see that you are not trying to increase the setpoint
above the setpoint limit SPL. Check that the Setpoint Change mode is on in the Enable
mode.
4.1.2.3 PROFILE OPERATION
To start a profile, press and release the SCROLL key to sequence the display to the profile
number display code P1, P2, etc. With the desired profile number displayed, press either the
DOWN or the RUN/HOLD to start the profile. run will be displayed for about 2 seconds to
indicated that the profile is starting. The status lamps will indicate which segment is active
and if the profile is in the ramp or soak portion of the segment.
To stop a profile that is running, press the RUN/HOLD key. The display will show hold for
about 2 seconds, then the process value for about 2 seconds and then continue to display
this sequence. The profile timer will stop but the control, alarm, and event outputs will remain
active. The profile can be restarted by pressing the RUN/HOLD key. To exit the profile, go to
hold and then press and release the SCROLL key until the display shows oFF or CtrL, then
press the DOWN key. Pressing the DOWN key with oFF displayed will cause the control,
alarm, and events to be turned off. (Pressing the DOWN key with CtrL displayed will leave
the events as they were, and the control and alarm outputs will remain active). The setpoint
will be the last setpoint seen in the profile.
While a profile is running, it is possible to display additional profile status information. To
activate the Profile Execution Status Display sequence, hold the DOWN key and press the
SCROLL key. This will cause the display to sequence through the following series of display
codes and values:
Page 39

Display Code Description Value
Pn Profile Number Actual Profile Number
tr Time remaining in current Ramp or Soak Actual time remaining value
(in whatever units were config
ured in the program mode for
Ptb)
E1, E2, E3 Event 1-3 status (if applicable) on or oFF
SP Current Setpoint Actual Setpoint Value
ProC Current Process Value Actual Process Value
PLCt Profile Loop Count remaining Profile Loop count Value
Each code or value will only be displayed if they are appropriate. Each code or value will be
displayed for one second. This sequence will continue until any key is depressed.
To start a profile running at some point within the profile other than start can be accomplished
by using the Profile Continue mode. Press and release the SCROLL key until display is
PCon, then press the DOWN key. The display will be Pn; adjust the profile parameter values
as needed in the Profile Continue Configuration mode, then press the RUN key. The
instrument will execute the profile selected as directed by the information entered in the
Profile Continue mode. See Table 4-1, page 40. If you are running a profile and it is desired
to alter the profile you must go to hold and then scroll to the Off or Control mode before
entering Pcon.
Note: Pcon is not available when Profile Time Base (Ptb) in Program mode has been
set for Units Ramp Rate (EO Option).
PAGE 39
PROFILE CONTINUE MODE FLOW CHART
PCon
Pn
Sn
rtr
Str
E1-E3
ON
OFF
Key
Actual Display
On/Off Display Use arrow keys
to turn on or off
Scroll Key
Numeric Display Use arrow keys
to change value
PLCt
Up Arrow Key
Down Arrow
Page 40

PAGE 40
TABLE 4-1 PROFILE CONTINUE MODE - Not available when Ptb=4, 5, or 6
(EO Option only)
DISPLAY
STEP DESCRIPTION CODE ACTION
1 Profile Number Pn Press the SCROLL key to see the
number of the last active profile.
2 Profile Number Value X If necessary, use the UP or DOWN key
to change the profile number to the
desired value, then press the SCROLL
key.
3 Segment Number Sn Press the SCROLL key to see the
number of the last active segment.
4 Segment Number Value X If necessary, use the Up or Down key
to change the segment number to the
desired value, then press the SCROLL
key. DO NOT SET THIS VALUE TO 0
AND ATTEMPT TO RUN THE
PROFILE. AN ERROR 19 WILL
DISPLAY AND THE PROFILE WILL
NOT RUN.
5 Ramp Time Remaining rtr Press the SCROLL key to see the
Ramp Time Remaining value.
6 Ramp Time Remaining X If necessary, use the UP or DOWN key
Value to adjust the Ramp Time Remaining
value, then press the SCROLL key. If
the time remaining is set to 0 when the
SCROLL key is pressed, the Soak Time
Remaining code will be displayed. If
the time remaining is greater than 0,
then the display will advance to the
Profile Loop Count code.
7 Soak Time Remaining Str Press the SCROLL key to see the Soak
Time Remaining value of the last active
profile.
8 Soak Time Remaining X If necessary, use the UP or DOWN key
Value to adjust the Soak Time Remaining
value, then press the SCROLL key.
9 Event(s) E1-E3 If any event outputs have been selected
in the Program mode then each event
number selected will be displayed in
sequence. Press the SCROLL key to
see the status of the event(s).
10 Event(s) Status on/oFF If necessary, use the UP key to turn on
an event that is off or the DOWN key to
turn off an event that is on. Press the
SCROLL key to see the next event
number. After the last event status is
selected, pressing the SCROLL key
will advance the display to be PLCt.
Page 41

11 Profile Loop Count PLCt Press the SCROLL key to see the
Remaining Profile Loop Count Remaining for the
last active profile.
12 Profile Loop Remaining X If necessary, use the UP and DOWN
key to adjust the Profile Loop Count
Remaining value.
To start a profile running, press the RUN/HOLD key while in the Profile Continue mode. If no
changes were made to any of the Profile Continue parameters, press the RUN/HOLD key
twice. The profile selected will start at the point selected.
4.1.2.4 ON-OFF CONTROL
On-Off control can only be implemented on controllers provided with SPST relay or SSR
driver output(s). On-Off operation can be assigned to either or both output 1 and 2. The
On-Off control can be selected as direct or reverse acting. Direct action is typically used in
cooling applications. The output device will turn on when the process value is greater than
the setpoint. Reverse action is typically a heating application. The output device will turn on
if the process value is below the setpoint. A hysteresis adjustment is provided for On-Off
outputs. This adjustment is in terms of degrees/engineering units and defines the width of
the
hysteresis bandwidth about the setpoint. This parameter may also be referred to as a dead
band. Relay chatter can be eliminated by proper adjustment of this parameter. When
operating in On-Off control, the control algorithm will turn the output on or off depending upon
the setpoint, the relative position of the process value, and the hysteresis adjustment. The
respective OUT1 or OUT2 indicator will illuminate to indicate that the output device is on.
The hysteresis will also affect the operation of the alarm output if used.
PAGE 41
4.1.2.5 TIME PROPORTIONING CONTROL
Time Proportioning Control can be implemented on controllers provided with SPST relay or
SSR driver output(s). Time proportioning can be programmed for output 1 and/or 2. Time
Proportioning control is accomplished by cycling the output on and off when the process
value is within the proportional bandwidth selected at a prescribed time period. The time
period is selected in the Tune mode by adjusting Ct1 and/or Ct2. The on time is a percentage of the Cycle Time.
Example: Calculated output % = 40%; Cycle Time adjustment = 20 seconds
Output on time = .4 x 20 = 8 seconds
Output off time = .6 x 20 = 12 seconds
4.1.2.6 CURRENT PROPORTIONING CONTROL
Current Proportioning control provides a proportional current output in response to process
value and setpoint. The current output can be selected for direct or reverse operation. Direct
current output control is typically used for cooling applications. The current output will
increase as the process value increases within the proportional bandwidth selected. The
reverse current output control is typically used in heating applications. The current output will
decrease as the process value increases within the proportional bandwidth selected.
The instrument can be programmed to provide 0 to 20mADC or 4 to 20mADC (if EO option is
present) current output(s). The output selected is dependent upon the final control element
being used in the process. The output 1 and/or output 2 LED will be lighted whenever the
Current Proportional outputs are selected.
Page 42

PAGE 42
g
g
4.1.2.7 POSITION PROPORTIONING CONTROL
Position Proportioning control can be implemented on those controllers provided with two
SPST relay outputs or two SSR Driver outputs and Slidewire Feedback option.
Positioning proportioning control permits the use of PID control where the final control
element is a modulating device such as a motorized valve. In this form, each of the two
required relays or SSR Drivers will be used to control the valve. One output is used to open
the valve, the other is used to close the valve. The slidewire feedback is used to provide a
signal relative to the valve armature position to the instrument.
As with the other proportioning control forms, the process input, tuning parameters and the
setpoint are used by the control algorithm to calculate the output % requried to correct for the
deviation between setpoint and process.
With Position Proportioning control, it may be necessary to adjust the Sensitivity (SEnS) Tune
mode parameter to reduce or eliminate oscillations of the motor around setpoint. If oscillation
occurs, increase the SEnS value until the motor stops oscillating. If the differential between
the Open and Closed rotation is too large, then decrease the SEnS value. Also, for proper
Position Proportioning operation, it is necessary to specify the actuation time of the valve or
damper from full open to full closed. If the motor has a stroke duration of 60 seconds, change
the value in the Cycle Time parameter Ct1 to 60. This ensures that the controller will move
the motor for the proper amount of time when making adjustments.
4.1.2.8 DUAL OUTPUT CONTROL
Dual output control can be performed when two outputs are specified. The outputs may be
programmed for On-Off, Time Proportioning, or Current Proportioning, as applicable.
The output action is dependent upon the setpoint, the process value, and Tune mode
parameters. If two proporitonal outputs are selected, both output proportional bands will be
biased so that 0% of output is seen when the process value equals setpoint. The output(s)
can be biased by the use of the Tune mode parameters FOP and SPrd as shown in
Figure 4-1 (below).
The first output is programmed as a proportional reverse output and the second as a proportional direct output. (See Glossary, page 67, for definitions of these terms). Dual proportioning outputs are provided with separate proportional bands and cycle time
adjustments for each output.
FIGURE 4-1
100%
Proportional
Output 1
Reverse
Actin
Output
Control
Setpoint
Direct
Actin
Output
100%
Proportional
Output 2
Process
First
Output
Position = X
+Y
-X
Second
Output
Position = Y
Value
Page 43

4.1.2.9 PROPORTIONAL OUTPUT PERCENTAGE DISPLAY
While in the Control mode, press and hold the UP key and then press the SCROLL key to
cause the display to sequence through a series of display codes and values:
Po1 Percent Output 1 (if applicable) Output 1% value
Po2 Percent Output 2 (if applicable) Output 2% value
Proc Process Value Actual Process Value
Each code and output value will be displayed only if the corresponding proportional output is
present. Each code or value will be displayed for 1 second. This sequence of displays will
continue until the SCROLL key is pressed, which will then return the display to the normal
mode.
4.1.3 MANUAL MODE FOR PROPORTIONAL OUTPUTS
Manual adjustments of the proportional output(s) can be used to test the operation of the
output(s), while tuning to establish basic process control, or to provide control of the
proportional output(s) during the occurance of certain error conditions.
Note: The proportional output(s) do not change automatically in response to changes
in the process while in the Manual mode. Be sure to pay close attention to the process
to avoid damage.
To enter the Manual mode, press and release the SCROLL key until you see Stby. Then
press the DOWN key . The Manual mode status LED will light to indicate that the Manual
mode is in use. Shifting from the Control to the Manual mode is bumpless. The proportional
output(s) will stay at the last value(s) calculated by the control algorithm. Po1 will appear on
the display if output 1 is a proportional output or Po2 if output 1 is not a proportional control. If
no keys are pressed, the display will sequence through the following displays:
PAGE 43
Po1 if output 1 is 3, 4, 5, 6, 7 then the output 1 percentage of output value
Po2 if output 2 is 3, 4, 5, 6 then the output 2 percentage of output value.
Proc will be displayed, then the current process value.
In order to vary a proportional output percentage value, press and release the SCROLL key
until the display code for the output is displayed Po1 or Po2. Press and release the SCROLL
key again to see the percentage of output value. Press the UP key to increase the output
percentage value. Press the DOWN key to decrease the output percentage value.
To return to the Control mode of operation from the Manual mode, press the SCROLL key
until you see Po1 or Po2 then press the UP key. The display will change to Stby. Press the
SCROLL key until you see the mode you wish to enter, then press the DOWN key. If the
Automatic Transfer feature is selected in the Program mode, the instrument will switch from
Manual mode to the Control mode when process value reaches the setpoint value.
4.1.4 PROCESS RE-TRANSMISSION OUTPUT - EO OPTION ONLY
If the instrument is provided with a current output not used for process control, this output
may be assigned to provide a linear re-transmission of the process value. This output can be
used to provide a process signal to remotely installed recorders, panel meters, or dataloggers.
The process output is scaled for the application by using the Program mode parameters
process/setpoint value upper Pou and process/setpoint value lower PoL. The current output
resolution is @ 200 steps, so for the best re-transmission accuracy, the span between Pou
and PoL should be as small as possible. If a current output is used for re-transmisssion, the
corresponding control output, out1 or out2, cannot be assigned to it.
Upon an error condition, Process Value output will be set to 0 percent if the 1st output control
is direct acting. If the control action is reverse acting, the Process Value output will be set to
100 percent.
Page 44

PAGE 44
4.1.5 SETPOINT RE-TRANSMISSION OUTPUT - EO OPTION ONLY
If the instrument is provided with a current output not used for process control, this output
may be assigned to provide a linear re-transmission of the setpoint value. The setpoint
output is scaled for the application by using the Program mode parameters process/setpoint
output value upper Pou and process/setpoint output value lower PoL. The current output
resolution is @ 200 steps, so for the best re-transmission accuracy, the span between Pou
and PoL should be as small as possible. If a current output is used for re-transmission, the
corresponding control output, out1 or out2, cannot be assigned to it.
Alarm Operation 4.2
The type of alarm is selected in the Program mode as follows:
1. Process Alarm Direct - the alarm will be on if the process value is greater than the process
value selected.
2. Process Alarm Reverse - the alarm will be on if the process value is less then the process
value selected.
3. Deviation Alarm Direct - the alarm will be on if the process value is greater than the
setpoint plus the deviation value selected.
4. Devation Alarm Reverse - the alarm will be on if the process value is less than the
setpoint plus the devation value selected.
5. Deviation Band Alarm Open Within - the alarm will be on if the process value is greater
than one half the deviation band alarm values selected above or below the setpoint.
6. Deviation Band Alarm Closed Within - the alarm will be on if the process value is less than
one half the deviation band value selected above or below the setpoint.
The alarm will be active while the instrument is in the Control mode or while the profile is
running. Relay and solid state relay drivers can be assigned to provide output capability to
the alarm function.
The alarm value (Process, deviation or bandwidth) is selected in the Tune mode.
Alarm output chatter can be reduced by using the hysteresis parameter in the Program mode
to create a deadband around the alarm point.
Tune Mode Operation 4.3
Proportional output control may require the adjustment (tuning) of the PID and other related
parameters. This provides a means for the instrument's control algorithm to be adjusted to
meet specific application requirements.
4.3.1 SYSTEMATIC TUNING METHOD
1. Changes in tuning parameters should be made one at a time.
2. After making any changes in tuning parameters, a disturbance should be introduced into
the process so that the process reaction may be observed. This process reaction, or
recovery, will tell whether the tuning parameters provide the desired control. It is usually
easiest to make a step change in setpoint to introduce this disturbance.
Page 45

3. The change in setpoint, or disturbance, referenced above should be large enough to
cause an observable deviation of process from setpoint. However, this change should not
be so large that it will cause the controller output to proceed to either extreme limit.
4. Controller tuning for optimal control is not hard and fast, BE PATIENT. The process will
take a certain amount of time to react to the setpoint changes during tuning. The amount
of time depends upon the specific process, however, a period of 8 to 12 minutes should be
allowed between changes. The important point to remember is to allow the process to
react completely, do not rush through tuning of the controller. If the complete process
reaction is not observed, optimum control may never be achieved.
5. Time Proportioning control output(s) require(s) the cycle time to be adjusted for the
application. Short cycle times typically result in the most accurate process control, but will
cause the quickest wear out of any mechanical components.
6. Leave all other tuning parameters (except for the alarm settings, if used) at the factory
default settings. Obtain the best possible process reaction by adjusting the Proportional
Bandwidth parameter. The setting that achieves the best response for the process should
be left in the controller programming, and should be noted on the Software Reference
Sheet in Appendix E (page 75).
7. If there are to be no setpoint or load changes in the process, the Proportional Band
adjustment may be all that is necessary for proper control. If an offset still exists (the
process does not settle out at setpoint with the best possible proportional band adjustment)
Manual Reset may be added to eliminate this offset.
PAGE 45
8. Auto Reset may be added to eliminate offsets and improve response to setpoint and load
changes. Increase Auto Reset from 0 in 0.2 increments. Start with a small amount.
Increase this increment if there is no apparent reaction. Remember to allow the process 8
to 12 minutes to react.
9. If necessary, Rate may be added. Rate is a dynamic tuning parameter. Rate may be
required to compensate for process lags or to help inhibit reset windup when a large
amount of Auto Reset (4 or 5 repeats per minute) is being used.
10. Controller tuning is not hard and fast. It may be necessary to adjust the tuning parameters
over a period of time to obtain optimal control of the process.
4.3.2 ZIEGLER NICHOLS TUNING METHOD
This procedure has been determined empirically to yield 1/4 ampitude decay tuning parameters that are determined by watching the system in a sustained oscillation (curve C, page 46)
the ultimate proportional band and ultimate time period) and then using these values from this
sustained oscillation to calculate ideal parameters.
Determining Ultimate Proportional Band and Ultimate Time Period
1. Set Manual Reset rSet to 0.0, set ArSt to 0.0 and set rAtE to 0.0
2. Enter the Control mode of operation, observe the process reaction.
3. Set the Proportional Band (PB) at 100 and upset the process and observe the
response. One easy method for imposing the upset is to move the setpoint for a
few seconds and then return it to its original value.
(Continued on next page)
Page 46

PAGE 46
4. Achieve a response curve similiar to the sustained oscillation (curve C), this is the
Ultimate Proportional Band (UPB) and Ultimate Time Period (UTP).
a) If the response curve from step 3 does not damp out, as in Curve A from
the drawing, the PB is too low. The PB should be increased and step 3
repeated.
b) If the response in step 3 damps out, the PB is too high. The PB should
be decreased and step 3 repeated.
These values obtained for Ultimate Proportional Band (UPB) and Ultimate Time Period (UTP)
are used to calculate ideal P, PI, PD, PID tuning parameters using the following ZieglerNichols equations:
Proportional only control (P) -
P(Pb) = 2 x UPB (degrees or units)
Proportional plus automatic reset (PI) -
P (Pb) = 2.2 x UPB (degrees or units)
I (ArSt) = 1.2 / UTP (repeats per minute)
Proportional plus derivative (or rate) (PD) -
P (Pb) = 1.7 x UPB (degrees or units)
D (rAtE) = UTP / 8 (minutes)
Proportional plus automatic reset plus derivative (PID)
P (Pb) = 1.7 x UPB (degrees or units)
I (ArSt) = 2 / UTP (repeats per minute)
D (rAtE) = UTP / 8 (minutes)
If an overdamped response is desired, multiply the proportional band by two.
Period
C
A
B
Curve A : unstable
Curve B : stable
Curve C : continuously cycling,
ultimate PB and period
Page 47

Service 5.1
This section contains Calibration, Test and Trouble-shooting procedures that can be
performed by the user. Instruments are calibrated to all input type specified when ordered at
the factory prior to shipment. Re-calibration should not be necessary under normal operating
conditions.
Calibration 5.2
Caution: Do not attempt any of these calibrations without the proper test equipment with specifications equal to or better
than those listed.
Press and release the SCROLL key to sequence the display until CAL appears. If CAL does
not appear, refer to Section 3 for instructions on how to enable the Calibration mode. When
CAL appears on the display, press the DOWN key. The display will read CAL 1. CAL 1 can
be initiated at this time or press the SCROLL key to advance the display to other calibrations
available.
CALIBRATION FLOW CHART
PAGE 47
CAL
CAL1
CAL2
CAL3
CAL4
CAL5
CAL6
CAL7
Prog
ON
OFF
Key
Actual Display
On/Off Display Use arrow keys
to turn on or off
Scroll Key
Numeric Display Use arrow keys
to change value
Up Arrow Key
CAL8
Down Arrow
Page 48

PAGE 48
TABLE 5-1 CALIBRATION PROCEDURES
Calibration
Procedure Description
CAL 1 Re-initialization of Program and Tune mode values.
CAL 2 Main Calibration used by all inputs. This is the only calibration requried for
voltage and millivolt inputs.
CAL 3 Cold Junction Compensation calibration used to correct for component
variation in CJC circuit.
CAL 4 Cold Junction utility. The temperature of the cold junction is displayed. No
adjustment is made with this procedure.
CAL 5 RTD input calibration used to correct for component differences in the RTD
input circuit.
CAL 6 CJC turn on/off.
CAL 7 Factory Use Only.
CAL 8 Re-initialization of all profile information
5.2.1 CAL 1 PARAMETER INITIALIZATION
This procedure is performed to erase the information that was entered in the Program and
Tune modes. All parameters will be reset to default values. Prior to beginning this procedure
record the Program and Tune mode parameters so that they can be re-entered. No special
test equipment is required.
With CAL 1 displayed, depress and hold the DOWN key, then press the SCROLL key. The
display will momentarily go blank. Release the keys. CAL 1 will reappear on the display.
This calibration can be done again or another may be selected.
5.2.2 CAL 2 MAIN CALIBRATION
This procedure determines and saves calibration values which correct for component
variations relating to the input measuring function of the instrument. This is the only
calibration required for the volt and millivolt inputs. Additional calibration procedures are
required for thermocouple and RTD inputs.
A 50.00 ± .01 mVDC source is required for calibrating. In addition, make sure that JU1 on the
Processor board is in the "non volt" position. See Appendix A-2 (page 64).
Make sure all input wiring is disconnected. Short the input terminals 1 and 3 or apply
0.00 ± mV to the input. With CAL2 displayed, press and hold the DOWN key, then press the
SCROLL key. Release both keys and the instrument will display hLd1. Depress the DOWN
key; dELy will appear for up to ten seconds, then SCAn will appear for up to ten seconds. If
the calibration reference number which appears is not between -50 and +50, proceed per note
below. Otherwise, connect a 50.00 ± .01 mV source to the input terminals. Press the DOWN
key and dELy will be displayed for ten seconds and the SCAn for ten seconds. Then CAL2
will reappear. If there is a problem, the appropriate error code will be displayed. Restore JU1
to the position necessary for the input type.
Page 49

NOTE: If the calibration reference number falls outside the -50 to +50 range, depress
the SCROLL key and CAL2 will be displayed. Depress the DOWN key and perform the
calibration once more. Repeat the calibration until the number falls within the tolerance limits. If the calibration number remains outside these limits, check the connections to the test equipment and try the calibration again. If the number still does not
aproach the tolerance limits contact an Applications Service Engineer at the factory or
a local representative.
Error Recover - see 5.4 (page 56) for details. However, be sure that the millivolt source is
securely connected, functioning properly and the polarity is correct. Press the DOWN key to
bring the instrument back to dELy and try the calibration again. The calibration can be exited
at anytime. hLd1 or the reference number is displayed by pressing the SCROLL key.
CAL 2 QUICK CALIBRATION
This routine will allow the operator to execute a rough calibration on their unit via the keypad
with no other equipment or disturbance to established wiring. It is intended to provide a partial
recovery from a calibration corruption where the necessary equipment indicated in Cal 2-5
may not be available. It should be noted that this is not intended as a substitution to the main
calibration procedure described earlier and may considerably deter from the accuracy of the
instrument.
With CAL2 displayed, press and hold the DOWN ARROW key, then press the SCROLL key.
Release both keys and the instrumet will display hLd1. Press and hold the UP ARROW key,
then press the SCROLL key. The display will momentarily blank and then CAL1 will be
displayed. Release both keys and depress the UP ARROW key. CAL will be displayed.
PAGE 49
5.2.3 CAL 3 COLD JUNCTION COMPENSATION
This procedure determines and saves calibration values which correct for component variations relating to the cold junction compensation. This calibration must be preceded by CAL2
the main calibration, to properly calibrate the instrument. These two calibrations are all that is
needed for proper operation with thermocouple inputs.
Test equipment: : one type J thermocouple and one mercury thermometer, accurate to ± .25
degrees C or equivalent are required.
Make sure all input wiring is disconnected and connect the J thermocouple to the input. Place
the thermometer next to the thermocouple and allow the controller to warm up for 30 minutes,
before proceeding with the calibration.
With CAL3 displayed, press and hold the DOWN key, then press the SCROLL key and the
unit will display hoLd. Release both keys. Press the DOWN key and dELy will be displayed
for ten seconds, then SCAn for ten seconds. If SCAn remains in the display for much longer
than ten seconds, refer to the the note below. The instrument will compute and display the
cold junction temperature to the nearest tenth of a degree C. Compare reading with thermometer and use the UP and DOWN keys to correct the reading, if necessary. To end
procedure, press the SCROLL key and CAL3 will be displayed again.
NOTE: If the instrument continues to display in SCAn, proceed as follows. With SCAn
displayed, press the SCROLL key. The instrument will display hoLd. Press the UP key .
The instrument will begin the calibration procedure with a default value and proceed to dELy.
Complete calibration as described above.
Error recovery - see section 5.4 (page 56) for details on specific errors. The calibration can
be exited at any time. hoLd is displayed by pressing the SCROLL key.
Page 50

PAGE 50
5.2.4 CAL4 COLD JUNCTION UTILITY
This procedure displays the temperature the cold junction compensator is sensing. No test
equipment is required.
With CAL4 displayed, press and hold the DOWN key, then press the SCROLL key. Release
both keys and SCAn will be displayed for 10 seconds while the instrument senses the CJC
temperature. The result will then be displayed to a tenth of a degree C. The input terminals
must be shorted. CAL3 must first be performed.
ambient temperature. It is the temperature of the CJC
and CAL4 will be displayed.
The displayed temperature is not the
. To exit, press the SCROLL key
5.2.5 CAL5 RTD INPUT
This procedure determines and saves calibration values relating to RTD inputs. This
calibration must be preceded by CAL2 to properly calibrate the instrument. A decade
resistance substitution box with .01% resolution or equivalent is required.
Processor board jumper JU1 is in the non-volt position (Appendix A-2, page 64) and
that the Option board jumpers JU2 and JU3 are in the proper positions (Appendix A-3,
page 65).
With CAL5 displayed, press and hold the DOWN key and then press the SCROLL key. The
display will now be hLd1 to indicate that the instrument is set to calibrate the RTD input.
Connect the decade box at 100 ohm setting across the input terminals 1 and 3 and a jumper
wire from terminal 1 to 5. Press the DOWN key and dELy will be displayed for 10 seconds,
then SCAn for ten seconds. When hLd2 is displayed, change the decade box setting to 277
ohms to the input terminals (do not disturb the wiring) and press the DOWN key. The display
will change to dELy for 10 seconds, followed by SCAn for ten more seconds. CAL5 will be
displayed after the calibration is completed.
Make sure that the
Error recovery:
See section 5.4 (page 56) for details on specific errors.
The calibration can be exited when the instrument displays hLd1 or hLd2 by pressing the
SCROLL key.
5.2.6 CAL6 COLD JUNCTION COMPENSATION
This routine provides selection of operating modes for the cold junction compensation used
for thermocouple inputs.
With CAL6 displayed, press and hold the DOWN key, then press the SCROLL key. The
instrument will display C6 and the number of the mode in effect. Press the UP or DOWN key
to change the mode selection, indicated by the number to the right of the C6. Pressing the
SCROLL key will exit the calibration with the last number displayed in effect.
The selected mode will remain in effect if power is interrupted. To return the instrument to
normal operation, CAL6 must be exited, with mode zero selected, or CAL1 must be executed
to initalize all parameters.
Mode 0: Normal operating mode.
Mode 1: Cold Junction Compensation temperature will be internally fixed at 0 degrees C by
the software to facilitate linearization testing when using an uncompensated millivolt source to
simulate thermocouple millivolt input signal.
Note: If the Process Value exceeds 999.9, the leftmost digit will be the letter o with a bar over
it. The other digits will be valid.
Page 51

5.2.7 CAL8 PROFILE REINTIALIZATION
This procedure is used to erase all profiles that have been entered in the instrument. Be sure
to record any profile information on the Profile Recording Sheets (Appendix F, pages 78 and
79) so that they can be re-entered.
With CAL8 displayed, press and hold the DOWN key, then press the SCROLL key. The
display will blank momentarily and then CAL8 will be displayed.
PAGE 51
Page 52

PAGE 52
Test Mode Procedures 5.3
To enter the Test mode, press and release the SCROLL key until tESt appears on the
display, then press the DOWN key. tSt1 will be displayed, press and release the SCROLL
key to advance the display to the desired test. Test 1, 2 and 3 are performed as a unit so the
display will advance directly to tSt4 from tSt1. Listed below in Table 5-2 are the test procedures available. Test 1, 2 and 3 are performed on start up, periodically during operation, and
on entry into the Test mode. Test 4 is executed on entry into and periodically during the
Operation mode. These tests can be used as a trouble shooting aid.
TEST MODE FLOW CHART
tESt
tSt1
ON
OFF
Key
Actual Display
On/Off Display Use arrow keys
to turn on or off
Scroll Key
Numeric Display Use arrow keys
to change value
tSt4
tSt5
tSt6
tSt7
tSt8
tSt9
Up Arrow Key
Down Arrow
tStA
Page 53

TABLE 5-2 TEST PROCEDURES AND DESCRIPTION
Test Description
Test 1 Microprocessor internal RAM test. Used to check the processor RAM to
make sure it is functioning correctly.
Test 2 External RAM test, used to test the RAM chip for proper function.
Test 3 EPROM checksum test, used the check that the EPROM program is
correct.
Test 4 External RAM checksum test; instrument test and identifies how many times
Errors 16, 17 and 18 have occured.
Test 5 Verifies that all keys are functional and all LEDs are working.
Test 6 Used to verify that all relays and solid state relay driver outputs are working
correctly.
Test 7 This procedure will allow operator to adjust the current output value to
check the output and to test the operation of the external device.
Test 8 This is the same as Test 7 except it is for Output 2.
PAGE 53
Test 9 Auxiliary Input Test. Allows for the viewing of the optional auxiliary input
voltage level.
Test A Communications Hardware Test
5.3.1 TEST 1 INTERNAL RAM TEST
Tests the Random Access Memory internal to the microprocessor. No special test equipment
is required.
With tSt1 displayed, press and hold the DOWN key, then press the SCROLL key. tSt1 will be
displayed momentarily while the test is in progress. Upon successful completion, the
instrument will proceed to Test 2.
5.3.2 TEST 2 EXTERNAL RAM TEST
Tests the battery backed-up RAM external to the microcomputer No special test equipment is
required.
After completion of Test 1, tSt2 will be displayed momentarily while the test is in progress.
Upon successful completion, the instrument will proceed to Test 3.
5.3.3 TEST 3 PROGRAM EPROM TEST
This is a checksum test to verify data integrity of the stored program. No special test
equipment is required.
After completion of Test 2, tSt3 will be displayed momentarily while the test is in progress.
Upon successful completion of Test 3, tSt1 will be displayed.
Page 54

PAGE 54
5.3.4 TEST 4 EXTERNAL RAM CHECKSUM TEST
This is a checksum test to verify the integrity of data stored in RAM and indicate the number
of times the instrument has had an Error 16, 17 and 18. The unit may have automatically
recovered from these errors. No special test equipment is required.
With tSt4 displayed, press and hold the DOWN key, then press the SCROLL key. The
display will blank momentarily, then momentarily display three numbers, and then tSt4 will be
displayed. These numbers indicate the number of times Error 16, 17, and 18 have occured
respectively. Test 4 can be executed again, or another test may be selected.
5.3.5 TEST 5 KEYPAD/DISPLAY TEST
This test allows the operator to verify that the keys work and that all display elements can be
lit. No special test equipment is required.
With tSt5 displayed, press and hold the DOWN key, then press the SCROLL key and then
release both keys. The display will go blank. The following code will be displayed while the
corresponding key is pressed:
Key Display
SCROLL SCrL
UP uAro
DOWN dAro
RUN/HOLD run
UP and DOWN (All LED's and segments lit)
To exit, press the SCROLL and UP key simultaneously, tSt5 will be displayed.
5.3.6 TEST 6 RELAY/SOLID STATE RELAY DRIVER OUTPUT TEST
Allows the operator to verify that the Relay and/or the Solid State Relay Driver output(s) are
working. A volt/ohm meter will be required to test the output.
With tSt6 displayed, press and hold the DOWN key, then press the SCROLL key. oFF will be
displayed. For SPST Relay outputs, connect the meter across the relay output in the ohm
scale. The meter should read continuity with the relay on and infinity when the relay is off.
For SSR Driver outputs, connect the meter across the output in the Volt DC scale. The meter
should read 5 VDC when the SSR driver is on and 0 VDC when the driver is off. Press and
release the DOWN key to advance through the following sequence:
Display Relay On
rLYA A Only
rLYb B Only
rLYC C Only
oFF None
To exit, press the SCROLL key and tSt6 will be displayed. The existence of Relay and Solid
State Relay Driver output(s) is dependent upon the hardware configuration.
5.3.7 TEST 7 CURRENT 1 OUTPUT TEST
This test allows the operator to verify that the current output(s) are functioning properly or will
allow the selection of an output value for testing of associated equipment. A milliamp meter is
required for testing.
With tSt7 displayed, press and hold the DOWN key, then press the SCROLL key. The
display will indicate 4 milliamps. Use the UP and/or DOWN key to increase or decrease the
current output in 1 mADC steps from 4 to 20mADC. The current output reading should be
± 0.5 mADC at any output value. To exit the test, press the SCROLL key and tSt7 will be
displayed. The existence of mADC current output is dependent upon the hardware
configuration. See Appendix A-3 (page 65 or 66) to make sure hardware is present.
Page 55

5.3.8 TEST 8 CURRENT OUTPUT 2 TEST
This test is the same as Test 7 except that it is for Output 2.
5.3.9 TEST 9 AUXILIARY INPUT TEST
This test allows the operator to verify that the auxiliary inputs used for motor modulation
feedback and remote Run/Hold contact closure are functioning properly. A variable voltage
source, 5VDC, is required for testing.
With tSt9 displayed, press and hold the DOWN key, then press the SCROLL key. The
Auxiliary input voltage will be displayed to the nearest hundredth of a volt. Connect the +5V
source across the Auxiliary input terminals (terminals 8 and 5) and adjust the supply up and
down to verify that it changes on the display. The displayed voltage should typically be
0-5VDC +/- 0.3 volts. To terminate the test, press the SCROLL key. The display will show
tSt9. Test 9 can be initiated again or another may be selected. The existence of the auxiliary
inputs tested in Test 9 depends upon the hardware configuration.
5.3.10 TEST A COMMUNICATION HARDWARE TEST
(Communications Option)
This test allows the operator to verfiy that the communications hardware is functioning
properly.
PAGE 55
With tStA displayed, press and hold the DOWN key then press the SCROLL key. The display
will indicate SEnd. Each time the DOWN key is depressed, the unit will toggle between SEnd
and rEC (receive). With the desired function selected, depress the SCROLL key. The unit
will perform as described below.
In the SEnd (send or transmit) mode, the unit will repeat the following sequence. First it will
enable the transmitter and put a logic 1 on the line for one second. Second, with the
transmitter still enabled, it will change the logic level to 0 for one second. Third, it will disable
the transmitter for one second. In the rEC mode, the unit will have its transmitter continuously
disabled. In either mode, the unit will monitor the line and display rEC1 or rEC0 when it
senses a logic 1 or 0 on the line respectively. In the SEnd mode, the unit will display rEC
when the transmitter is disabled.
To perform an internal test and verify the basic operation of the hardware, place the unit in the
SEnd mode and verify that the display cycles through rEC1, rEC0 and rEC. To verify that the
transmitter functions properly, two LED''s, each with a current limiting resistor, can be
connected to the communications terminals, with their polarities connected oppositely, and it
should be observed that the following states are produced: one LED on, then the other LED
on, then both off. Alternately, a load resistor can be placed on the terminals and it can be
observed that the voltage generated across the load resistor is as follows : >+3 VDC, then
>-3 VDC, and then 0 VDC.
Another method, which would also apply to an applications network, would be to connect one
or more units in the Receive mode to a first unit in the Send mode. All of the units in the
Receive mode should have their display alternating in sync with the first unit which is in the
Send mode. When the sending unit displays rEC, the receiving units should display rEC1.
To terminate the test, press the SCROLL key for one second. Upon exit, tStA will be
displayed. Test A can now be initiated again or another test selected.
Page 56

PAGE 56
Trouble-shooting and Diagnostics 5.4
This section consists of two columns. The first column is a list of some possible instrument
conditions. The second column is a list of steps that should improve the condition. The steps
should be performed in order until the condition improves or all the steps have been completed. If the instrument condition has not improved, contact the nearest representative or
factory for assistance.
Trouble-shooting should be performed by qualified personnel using the proper equipment
and following all safety precautions. Whenever possible, the trouble-shooting should be
accomplished with the electrical power disconnected. The instrument contains static sensitive
components so care should be taken to observe anti-static procedures.
Condition Correction Steps
Display is blank 1. Verify that the correct instrument power, as indicated
on the wiring label on the housing, is supplied to
terminals A & B. If the voltage is not correct, check
the power source.
2. Turn off the instrument power. Wait about 5 seconds
then turn the power on again.
3. Turn off the instrument power, loosen the front panel
screw and remove the instrument from the housing.
Inspect the instrument for poor connections.
a. The white ribbon cable that connects the
Processor board (Appendix A-2, page 64) to
the Power Supply Board (Appendix A-1, page
63), must be properly aligned and seated.
b. The Front Display board pins should be
properly aligned and seated in the sockets on
the Processor board (Appendix A-2, page
64) and the Power Supply board (Appendix
A-1, page 63).
c. The EPROM and RAM chips, located on the
Processor board (Appendix A-2, page 64)
must be free from corrosion and firmly seated
in the socket. Also check the Display Driver
chip U1 loacted on the display board for the
same. Reinsert the instrument in the
housing, tighten the panel screw, and turn
on the power.
4. Turn off the instrument power. Press and hold the UP
and DOWN keys. Turn on the power. Hold the keys
depressed for about 10 seconds. If the display lights
the model number, Program , Tune and Profile mode
parameters will need to be re-entered (pages 25 - 35,
or the Software Ref. Sheet, pages 75-77, if already
filled out).
Model Number Displayed 1. Turn off the instrument power, wait 5 seconds then
is incorrect reapply power. Verify that the number displayed
during the power up sequence is the same as
indicated on the label affixed to the lower front of the
display bezel.
Page 57

2. Turn off the power to the instrument. Press and hold
the UP and DOWN keys and turn on the power. Keep
the keys depressed until the model number resets to
6100-000. Release the keys and turn off the power.
3. To enter the correct model number press and hold the
SCROLL and DOWN keys and turn on the instrument
power, 6100 should be displayed. Wait about 5
seconds and release the SCROLL key first and then
release the DOWN key. The display should
remain 6100. Use the UP/DOWN keys as necessary
to change the displayed number to match the first 4
digits of the model number. After adjusting the first 4
digits to the proper values, press the SCROLL key and
the display will change to 000-. Use the UP/DOWN
keys to set the last 3 digits of the model number to the
correct values. Press the SCROLL key and the power
up sequence will complete. The Program , Tune and
Profile mode parameters will need to be re-entered
(pages 25 - 35, or the Software Ref. Sheet, pages 75 77, if already filled out).
Relay/SSR Driver Output(s) 1. Verify that the Proagram and Tune mode parameters
Malfunction are correctly set (pages 25 - 32 or the Software Ref.
Sheet, page 75, if already filled out).
PAGE 57
2. Turn off the power to the instrument. Wait about 5
seconds and turn the power on again. Confirm that
the model number displayed during the power up
sequence indicates that the output(s) is/are present in
the instrument. This number should match the
number on the label affixed to the bottom of the
front display bezel. If the model # is incorrect, follow
the steps for "Model # displayed is incorrect".
3. Turn off the power to the instrument. Loosen the front
panel screw and remove the unit from the housing.
Inspect the Power Supply board (Appendix A-1, page
63) for the presence of the output device(s). Relay A
is located at K1, Relay B at K2, and Relay C at K3. A
relay output will appear to be a cube. The SSR Driver
will appear as a resistor and a jumper wire. The
output will not work if the hardware is not present.
4. Check the output operation by performing Test 6 as
described in the Test section (page 54). If the
output(s) function(s) in the Test mode, re-examine the
Program and Tune mode parameter settings (pages
25- 32, or the Software Ref. Sheet, page 75, if already
filled out).
5. If the output appears not to turn off, remove the power
to the instrument. Loosen the front panel screw and
take the unit out of the housing. Clip the resistor
located on the Power Supply board (Appendix A-1,
page 63) for the output(s) that seem to stay on. A .01
microfarrad, 1 KV should be connected from the
terminal listed below, for the output where the resistor
indicated was removed, to the AC ground.
(Continued on next page)
Page 58

PAGE 58
(Continued from page 57)
Relay A R12 Terminal C
Relay B R13 Terminal E
Relay C R14 Terminal G
Return the instrument to the case and tighten the front
panel screw. Turn the power on to the instrument and
check the operation of the output(s).
mADC Output(s) 1. Verify that the Program and Tune mode parameters
Malfunction are correctly set (page 25 & 32 or the Software Ref.
Sheet, page 75, if already filled out).
2. Turn off the power to the instrument. Wait about 5
seconds and turn the power on again. Confirm that
the model number displayed during the power up
sequence indicates that the output is present in the
instrument. The number should match the model
number on the label located on the bottom of the
front display bezel. If the model # is incorrect, follow
the steps for "Model # displayed is incorrect" (page
57).
3. Verify that the hardware is present on the Option
board (Appendix A-3, page 65 or 66).
4. Check the output operation in the Test mode. Use
Test 7 for Output 1 and Test 8 for Output 2. If the
output works in the Test mode, re-check the Program
& Tune mode parameter settings ( pages 25 - 32,
or the Software Ref. Sheet, page 75, if already filled
out).
Error Code Displayed
SnSr 1. Inspect the sensor for proper operation and
Sensor Break or out of range connection to the instrument. Acceptable sensor
ranges for the instrument are listed in the
Specifications section of Appendix D (page 71).
2. Verify that the Program mode input selection matches
the sensor input connected.
3. Check that the input conditioning jumpers on the
Processor board (Appendix A-2, page 64) and the
Option Board (Appendix A-3, page 65 or 66) are in the
proper position for the sensor input.
4. Perform the calibration procedure(s), as described in
the Calibration section (page 47) for the sensor input
type.
FbEr 1. Inspect the Slidewire Feedback connections at
Slidewire Feedback Error terminals 8, 7 and 5. Be sure that the connections are
the same as shown in the position proportioning
illustration (page 20).
Page 59

2. Measure the resistance of the Slidewire segment. The
minimum resistance must be 135 ohms, the
maximum 10 K ohms.
3. Perform the Auxiliary Input Test, Test 9 as described
in the Test section (page 55). The voltage indicated
should be between 0 and 5 VDC.
4. Turn off the power to the instrument. Loosen the front
panel screw and take the instrument out of the
housing. Verify that the jumper JU-1 on the Option
board (Appendix A-3, page 65) is in the Motor
Modulation position.
Hi - Input more than 10% 1. Perform the steps listed for the SnSr error condition
Over Span (page 58).
Lo - Input more than 10% 1. Perform the steps listed for the SnSr error condition
Under Span (page 58).
o - display overranged 1. If this error code is displayed as a Program or Tune
(the "broken 6" appears mode parameter value, perform CAL1 procedure as
on the left side of the display) described in the Calibration section (page 48).
PAGE 59
2. If this error code appears as part of the model number
during the power up sequence, follow the steps listed
for the "Model # is incorrect" condition (page 57).
3. If this error appears in the process reading and dPoS
equals 1, then it means the process is greater then
999.9.
Er1 - Microprocessor RAM 1. Turn off the power to the instrument.
Failure
2. Loosen the front panel screw and remove the
instrument from the housing. Inspect that the
microprocessor (U1) is properly seated in the socket
located on the Processor board (Appendix A-2, page
64). Return the instrument to the housing and tighten
the front panel screw. Turn the power on.
Er2 - External RAM Failure 1. Turn off the power to the instrument. Wait 5 seconds
and turn the power on.
Er3 - EPROM Checksum 1. Perform the steps listed for Er1 except that the
Failure EPROM (U2) on the Processor board (Appendix A-2,
page 64) should be inspected.
Er4 - RTD Mismatch Error 1. Check the connections to the instrument for the RTD
Input Calibration procedure (page 50). Repeat the
RTD Input Calibration.
Page 60

PAGE 60
Er5 - No Zero Crossings 1. Turn off the power to the instrument. Wait 5 seconds
Detected and turn the power on.
2. Turn off the power to the instrument. Loosen the front
panel screw and remove the instrument from the
housing. Inspect the white ribbon cable that connects
the Processor board to the Power Supply board. Be
sure that the cable is properly aligned and seated in
the socket on the Power Supply board. Return the
instrument to the housing and tighten the front panel
screw. Turn the power on to the instrument.
3. Connect the instrument to another AC power source.
Er6 - AC line below 45 HZ 1. Turn off the power to the instrument. Wait 5 seconds
and turn the power on.
2. Turn off the power to the instrument. Loosen the front
panel screw and remove the instrument from the
housing. Inspect the white ribbon cable that connects
the Processor board to the Power Supply board. Be
sure that the cable is properly aligned and seated in
the socket on the Power Supply board. Return the
instrument to the housing and tighten the front panel
screw. Turn on the power to the instrument.
3. Connect the instrument to another AC power source.
Er7 - AC line over 65 HZ 1. Turn off the power to the instrument. Wait 5 seconds
and turn the power on.
2. Turn off the instrument power. Loosen the front panel
screw and remove the instrument from the housing.
Inspect the white ribbon cable that connects the
Processor board to the Power Supply board. Be sure
that the cable is properly aligned and seated in the
socket on the Power Supply board.
3. Connect the instrument to another AC power source.
Er8 - Cal 2 Volt Input Error 1. Check that 50 mVDC is properly connected to the
instrument and is within the tolerance limits as
indicated in the CAL2 procedure of the Calibration
section (page 48).
2. Loosen the front panel screw and remove the
instrument from the housing. Inspect the Processor
board (Appendix A-2, page 64) to insure that the input
conditioning jumper JU1 is in the non-volt position.
3. Perform the CAL2 procedure as described in the
Calibration section (page 48).
Er9 - ADC Reference Number 1. Perform the CAL2 procedure as described in the
Error Calibration section (page 48).
Page 61

Er10 - ADC Reference 1. Perform the CAL2 procedure as described in the
Voltage Error Calibration section (page 48).
Er11 - Cold Junction 1. Be sure the Cold Junction Sensor is firmly attached
Compensation Error to terminals 2 and 4.
2. Perform the CAL3 procedure as described in the
Calibration section (page 49).
Er12 - CAL2 Voltage Error 1. Check that 50mVDC is properly connected to the
instrument and is within the tolerance limits as
indicated in the CAL2 procedure of the Calibration
section (page 48).
2. Loosen the front panel screw and remove the
instrument from the housing. Inspect the Processor
board (Appendix A-2, page 64) to insure that the input
conditioning jumper JU1 is in the non-volt position.
3. Perform the CAL2 procedure as described in the
Calibration section (page 48)
PAGE 61
Er13 - RTD CAL5 Input Error 1. Check that the resistance device is of the correct value
and properly connected to the instrument and is within
the tolerance limits as indicated in the CAL5 procedure
of the Calibration section (page 50).
2. Loosen the front panel screw and remove the
instrument from the housing. Inspect the Processor
board (Appendix A-2, page 64) to insure that the input
conditioning jumper JU1 is in the non-volt position and
that the Option board jumpers (Appendix A-3, page
65) JU2 and JU3 are in the RTD position.
3. Perform the CAL 5 procedure as described in the
Calibration section (page 50).
Er14 - Cold Junction 1. Be sure the Cold Junction Sensor is firmly attached
Compensation Error to terminals 2 and 4.
2. Perform the CAL3 procedure as described in the
Calibration section (page 49).
Er15 - Ground Reference 1. Perform the CAL2 procedure as described in the
Tolerance Error Calibration section (page 48).
Er16 - Program/Tune Mode 1. Record all Program and Tune mode parameters.
Checksum Error Perform the CAL1 procedure as described in the
Calibration section (page 48). Re-enter the Program
and Tune mode parameters.
Er17 - Calibration Checksum 1. Perform the calibration procedures that are needed for
Error the input sensors that will be used (page 48).
Page 62

PAGE 62
Er18 - Profile Data 1. Record all Profile data that was entered. Perform
Checksum Error the CAL8 procedure as described in the Calibration
section (page 51). Re-enter the Profile data as
needed.
Er19 - Tried to run profile 1. Press the RUN/HOLD key, then press and release the
with 0 segments SCROLL key until oFF or CtrL are displayed, then
press the DOWN key. This error occurs if a profile
number is selected in a Profile Continue mode for a
profile that has not been developed.
Er20 - Setpoint Error 1. Use the UP or DOWN key to change the setpoint
value.
2. Record all Program and Tune mode parameters.
Perform the CAL1 procedure as described in the
Calibration section (page 48). Re-enter the Program
and Tune mode parameters.
Er36 - Incorrect Cystal 1. Turn off the power to the instrument, wait 5 seconds
For Digital Comm. then turn the power on.
2. Check the cyrstal for 11 MHZ Y1 (see Appendix A-2,
page 64)
Er37 - Incorrect Micro. 1. Turn off the power to the instrument, wait 5 seconds
For Digital Comm. then turn the power on.
2. Check to make sure U1 is a 8032 (see Appendix A-2,
page 64)
Errors 70 through 73 are communication errors that are briefly displayed when they occur.
Er70 - The Controller was When the unit receives a complete message, the
unable to respond within 250 controller has 250 milliseconds to respond to the request.
milliseconds If for any reason the controller is unable to respond within
250 milliseconds, the error is posted and the request
ignored.
Er71 - A byte was received by While the unit is processing a message, no data should
the controller before the response be on the communication link until the unit has
was transmitted responded. If the unit receives data before a response is
transmitted, the error is posted and the message aborted.
Er72 - An incorrect Block Check After the complete message has been received, if the
character was received Block Check Character (BBC) transmitted does not match
the calculated BCC, the error is posted and the unit will
send a Negative Acknowledge (NAK).
Er73 - A byte was received with If incoming data has incorrect Parity, the unit will post the
incorrect parity error and ignore the rest ofthe message. The number of
ones in the transmitted byte is expected to be even
(Even Parity).
Page 63

Appendix A
Board Layout - Jumper Positioning
FIGURE A-1 - Power Supply Board
TOP
K3
R14
R13
RELAY C
K2
RELAY B
115 VAC JUMPER POSITION
JU6
JU5
PAGE 63
FRONT
OF UNIT
R12
RELAY A
K1
COMPONENT SIDE
230 VAC UNITS MAY BE
FIELD CONVERTED
TO 115 VAC BY MOVING
JUMPERS AS SHOWN
ABOVE .
(115 VAC UNITS CANNOT
BE FIELD CONVERTED TO
230 VAC!!)
T1
230 VAC JUMPER POSITION
JU6
JU5
T1
Page 64

PAGE 64
FIGURE A-2 - Processor Board
TOP
FRONT
OF UNIT
JU1
BATTERY
T/C,mV,RTD,
CAL2
VOLT
MICRO U1
EPROM U2
RAM U3
COMPONENT SIDE
JU2
JU2
Y1
ENABLE MODE
LOCKED
ENABLE MODE
UNLOCKED
JU12
JU1
JU12
IF NO
OPTION
BOARD
Page 65

FIGURE A-3 - Option Board - Revision D and below
REV
FRONT
OF UNIT
For 2nd 4-20mA,
U5 is populated
PAGE 65
TOP
JU1
U5
U1
For 1st 4-20mA,
U1 is populated
JU1
2ND 4-20 mADC
MOTOR MODULATION/
POSITION PROPORTIONING
POTENTIOMETER REMOTE
SETPOINT
DIGITAL
COMMUNICATIONS
422/485
COMPONENT SIDE
JU2
JU3
JU2
RTD
T/C, mV, VOLT
JU3
(NON-RTD)
RTD
T/C , mV , VOLT
(NON-RTD)
Page 66

PAGE 66
FIGURE A-3 - Option Board - Revision E and above
2nd 4-20
Position
Prop.
Com
RS-485
JU1
JU3
JU2
T/C, mV, V
RTD
JU2
J15
J16
JU3
JU1
JU13
T/C, mV, V
RTD
REV
JU14
Com &
2nd 4-20
Pos. Prop. &
Alt. Com
RSP &
Com
RRH &
Com
Alt.
Com
XPS
JU13
XPS
J15 - AC Input XPS cable from transformer
J16 - XPS to Relay C
XPS
JU14
XPSNo XPS No XPS
Page 67

Appendix B
Glossary
Assured Soak
Assured Soak refers to the ability of the instrument to be programmed to interrupt the Soak
segment time down if the process value exceeds a deviation value selected in the Profile
Entry mode from the setpoint. The Soak timer will restart from where it was stopped when the
process value does not exceed the deviation value selected from setpoint.
Automatic Reset (Integral)
This parameter is used so that the instrument will compensate for process variable deviations
from setpoint that occur when the process load characteristics change. Instructions for
determining the automatic reset settings are given in Section 4.3 (page 44). Factory default is
0.0. Display code ArSt.
Automatic Transfer
This feature, if configured, allows manual control of the process until setpoint is reached, at
which point the controller automatically transfers from manual to automatic control. Factory
default value is 0 = no auto transfer. Display code AtFr.
Balanceless Transfer
This feature prevents changes in proportional output when changing from the Manual to
Control mode of operation. When transferring from the manual mode to the control mode, the
proportional outputs will be "Balanceless" regardless of whether the unit is inside or outside
the proportional band. This only holds true if the Auto Reset (ArSt) value is greater than 0.
PAGE 67
Bumpless Transfer
This feature prevents step changes in proportional outputs when changing from
manual control only
Control Algorithm
A pre-programmed series of instructions that are used by the instrument when determining
the status of the output(s).
Cycle Time
This Tune mode parameter is used to select the on/off cycle time for time proportioning
outputs (Ct1 for Output 1 and/or Ct2 for Output 2).
When using the Position Proportioning option, Ct1 must be selected for the stroke time of the
motor.
Display Filter Factor
This parameter is adjustable from 1 to 20 which represents the number of scans of the
process variable that are averaged together before updating the displayed value. The factory
default value is 1 = no filtering. Display code dFF.
Engineering Units Upper and
Engineering Units Lower
These Program mode parameters are used with volt, millivolt, and milliamp inputs. The
Engineering Units Upper Euu should be selected as the value to be displayed when the input
is at maximum. The Engineering Units Lower EuL should be selected as the value to be
displayed when the input is at minimum.
.
automatic to
First Output Position
This parameter is adjustable from -1000 to 1000 units and represents a shift or offset of the
on-off actuation points or proportional band for the first output relative to the normal position.
For example, a negative value could be used to offset an expected overshoot. First Output
Position also shifts the proportional band with respect to the process value range outside of
which integral action is inhibited. Factory default is 0. Display code FoP.
Page 68

PAGE 68
Hysteresis
This parameter is adjustable from 0 to 300 units representing the width of the band (half
above and half below setoint). Used with On-Off or Alarm outputs to reduce cycling. For
instance, with a value of 4 and a setpoint of 70, the output will turn On when the process
variable drops to 68 and stay On until 72 is reached, then turn Off the output. Factory default
is 3. Display code is HySt.
Input Correction
This parameter is used to adjust the process variable value to compensate for sensor errors.
This Program mode parameter is selectable from -300 to +300 degrees/units. The factory
default is 0. Display code is iCor.
Manual Reset
This parameter is adjustable from -1500 to 1500 units representing a manual shift of proportional band(s) relative to the normal position. Manual reset is intended to be used when
automatic reset is not used to allow compensation for deviations from setpoint which remain
after the process has stabilized. Factory default is 0. Increasing the value increases the
process variable, i.e. if the process variable stabilized too low, increase the manual set.
Integral action, and conversely reset-windup inhibit apply over the same process value range
regardless of the manual reset value. Display code rSEt.
Position Proportioning Sensitivity
A percentage of the first output proportional band width (Pb1).
Process Filter Factor
This Program mode parameter is used to dampen the process value used to calculate output
action. The process value is averaged to dampen the control outputs. This parameter is
adjustable from 1 to 20. Factory default is 1. Display code PFF.
Process Retransmission Output (EO Software Option)
Allows retransmission of the process variable. Factory default is 0 = not selected. Display
code Pout. If selected, must be assigned to a current output and scaled using Process/
Setpoint upper and lower values.
Process/Setpoint Output Upper and Lower Values (Used in conjuction with process or
setpoint retransmission output)
These parameters specify the process or setpoint value range over which the assigned
current output will vary in a linear manner from 100 % to 0 %. If the process value or setpoint
is greater than Pou the output will be 100%. If the process or setpoint value is less than PoL
the output will be 0%. Factory default values are 2000 for the upper value and 0 for the lower
value. Display codes Pou (upper) and PoL (lower).
Process Variable
The process variable refers to the condition of the process being measured (sensed). The
instrument will accept process inputs other than temperature (pressure, level, flow, etc.).
Proportional Band (PB)
This Tune mode parameter selects the span of the proportional output range. This parameter
is adjustable from 1 to 3000 degrees/units. Factory default is 100. If Output 1 is selected as a
proportional output, a display code of Pb1 will be seen. If Output 2 is selected as a proportional output, the display code will be Pb2.
Ramp
A Ramp is the section of profile segment where the setpoint value is being changed from the
initial value to the value selected over the time period selected. The first Ramp of a profile will
take the process value at the time the profile was started as the initial setpoint value.
Page 69

Rate (Derivative)
This parameter is adjustable from 0.0 to 10.0 minutes and specifies how the control action
responds to the rate of change in the process variable. For example, if the process variable is
rising rapidly to setpoint, power is turned off sooner than it would be if the rise were slow. In
effect, derivative action anticipates lags within the system and shifts the proportioning band by
an amount determined by the rate of change of the input sensor. Magnitude of the shift is
determined by a derivative time constant. If the time constant is, say, .1 minute (6 seconds),
for every unit per second rate of change of the process variable at the sensor, the proportioning band is moved 7 units in the direction that helps control. Likewise, if the time constant is 1
minute (60 seconds), for every unit per second rate of change of the process variable at the
sensor, the proportioning band is moved 60 units in the direction that helps control. Instructions for determining rate is given in Section 4.3 (page 44). Factory is 0.0. Display code
rAtE.
Rate of Change (EO Software Option)
This parameter is used to provide ramp changes based upon a selectable rate of change.
Degrees per hours, minutes, seconds.
Second Output Position
This parameter is adjustable from -1000 to 1000 units and represents a shift or offset of the
on-off actuation points or proportional band for the second output relative to the normal
position. A positive value creates a gap where no control outputs are on, a negative value
creates an overlap of control outputs (if the first output position is at the normal position).
Second Output Position also shifts the proportional band with respect to the process value
range outside of which integral action is highlighted (reset-windup inhibit). Factory default is
0. Display code Sprd.
PAGE 69
Segment
A segment refers to a part of a profile. A segment consists of a Ramp and a Soak section.
Setpoint Re-Transmission Output (EO Software Option)
Allows for re-transmission of the setpoint value. Factory default is 0 = not selected. Display
code Pout. If selected, must be assigned to a current output and scaled using Process/
Setpoint upper and lower values.
Soak
A Soak is the section of a profile segment where the setpoint value is at a constant value for
the time period selected.
Page 70

PAGE 70
Appendix C - Order Matrix
6
Input
1 T/C or mV
2 Volts/mA
3 RTD
4 All Inputs
Output Group 1
Control Output 1
and/or Event
1 Relay
2 SSR Driver
3 4-20 mA & Relay
4 4-20 mA & SSR Driver
Output Group 2
Control Output 2
and/or Event
0 None
1 Relay
2 SSR Driver
3 4-20 mA
4 4-20 mA & Relay
5 4-20 mA & SSR Driver
Output Group 3
Alarm or Event
0 None
1 Relay
2 SSR Driver
Remote
0 None
1 Position Prop.*
2 Remote Run/Hold
3 RS-485 Std. Com.**
4 RS-485 Std. Com.***
5 RS-485 Total Access Com.**
6 RS-485 Total Access Com.***
Voltage
1 115VAC Input & Relays
2 230VAC Input & Relays
3 115VAC Input & 230VAC Relays
Option Suffix
(Blank) None
EO Extended Features Software Option
XP 24VDC Transmitter Power Supply
XA 24VDC Power Supply
* Output Group 2 cannot be 0 or 3.
** Cannot be included when Output Group 2 selections 3, 4, or 5.
***Cannot be included when Output Group 3 selection is 1 or 2.
Page 71

Appendix D
Product Specifications
Measurement Error Limit • Type J, K, T, E, N, C, T/C's and RTD +/-.25% of reading
plus 1 degree @ 25 degrees C
• Type R, S, B T/C's +/- .25% of span @ 25 degrees C
• mA, mV and VDC +/- .25% of scaled span plus 1 Least
Significant Digit @ 25 degrees C
Ambient Temperature Error 0.01% of span per degree C deviation from 25 degrees C
Scan Rate 1 scan/second
Display Resolution 0 to 3 decimal places (depending upon input type
selected)
Noise Rejection Normal mode, 85 dB minimum at 60 Hz or greater.
Common mode, 90 dB minimum, 115 VAC maximum.
Line Voltage 115/230 VAC +/- 10% 50/60 Hz
PAGE 71
Power Consumption 15VA maximum
Operating Temperature 0 to 55 degrees C
32 to 131 degrees F
Storage Temperature -40 to 65 degrees C
-40 to 149 degrees F
Humidity 0 to 90% RH, non condensing
Dimensions 1/4 DIN front panel (96mm x 96mm) and 5.8 inches deep
Weight 3 pounds maximum
Vibration 0.5 to 100 Hz @ 0.5g
Agency Approvals UL and CSA
Warranty 3 years, see inside back page.
Page 72

PAGE 72
THERMOCOUPLE
TYPE RANGE TYPE RANGE
J -130 to 760°C E 0 to 750°C
-200 to 1400°F 0 to 1400°F
K -130 to 1370°C B 200 to 1800°C
-200 to 2500°F 400 to 3300°F
T -200 to 400°C N 0 to 1300°C
-330 to 750°F 0 to 2370°F
R 200 to 1650°C C 200 to 2300°C
400 to 3000°F 390 to 4170°F
S 200 to 1650°C
400 to 3000°F
RTD VOLTS MILLIVOLTS
100 OHM 0 to 5VDC 0 to 25mVDC
-140 to 440°C 1 to 5VDC 0 to 50mVDC
-220 to 750°F 10 to 50mVDC
0 to 25mVDC
MILLIAMPS
4-20mA input is accommodated via
10-50mV or 1-5V with the addition
of the appropriate external shunt resistor
SENSOR FAULT DETECTION
Displays Hi or Lo process input for thermocouple or RTD inputs (10% above or below range)
and sensor break, SnSr. On/Off outputs and events go off, proportional outputs go to 0%
output. Sensor fault detection is not functional for 0 to 5 VDC.
CONTROL ADJUSTMENTS
On/Off Hysteresis 0 to 300 units
Proportional Band 1 to 3000 units
Manual Reset -1500 to 1500 units
Auto Reset 0.0 to 100 repeats/min.
Rate 0.0 to 10.0 min.
Cycle Time 1 to 240 sec.
Position Proportioning 0.0 to 50.0%
Sensitivity
First Output Position -1000 to 1000 units
Spread -1000 to 1000 units
(Second Output Position)
Page 73

ALARM ADJUSTMENTS
Process Alarm -9999 to 9999 units
Deviation Alarm -3000 to 3000 units
Deviation Band Alarm 1 to 3000 units
CONTROL OUTPUTS
Relay SPST
115VAC: 5.0A Resistive; 1/8HP or 250VA
230VAC: 2.5A Resistive; 1/8HP or 250VA
SSR Driver Open collector output
Short circuit protected @ 100mA maximum.
4VDC at 20mA or 3VDC at 40mA.
Current 4-20mADC into 650 ohms maximum
ALARM OUTPUT
Relay SPST
115VAC: 5.0A Resistive; 1/8HP or 250VA
230VAC: 2.5A Resistive; 1/8HP or 250VA
PAGE 73
SSR Driver Open collector output
Short circuit protected @ 100mA maximum
4VDC at 20mA or 3VDC at 40mA
DISPLAY
Digital Display Four (4) .56 inch high, 7 segment LED's
Status Indicators LED indicators for Setpoint, Output 1, Output 2, Manual,
Alarm, Degrees C, Degrees F, U (engineering units),
Seg1 thru Seg 6, Ramp and Soak
DIGITAL COMMUNICATIONS
Type RS-485 serial communications port. Half duplex
bi-directional communications
Character Format ASCII
Protocol Per ANSI X3.28 subcategories 2.5 and A4
Configuration User configurable to Monitor (read only) or Normal (read
and write)
Bit Rate User configurable to 300, 600, 1200, 2400, 4800, or 9600
bits per second
Address User configurable 0 to 99
Page 74

PAGE 74
PROFILE PARAMETERS
Programmable Profiles 8 user programmable profiles
Segments 1 to 6 segments per profile
Ramp and Soak 1 ramp and soak per segment
Profile Time Base Selectable:
HHH.T (hours and tenths)
HH.MM (hours and minutes)
MM.SS (minutes and seconds)
EO Option:
Units per hour ramp rate, HHH.T soak time
Units per hour ramp rate, HH.MM soak time
Units per minute ramp rate, MM.SS soak time
Profile Interrupt Action Upon return of AC power either:
Go to OFF mode
Continue profile
Go into HOLD
Restart profile at beginning
Profile Loop Count 1 to 9999, 0=continuous
Profile End Control Selectable:
Hold at last setpoint
Abort (all outputs off or 0%)
Transfer to another profile
Assured Soak Deviation Hold after Ramp Up;
1 to 3000 units, 0=no auto hold
Deviation Hold after Ramp Down;
1 to 3000 units, 0=no auto hold
Remote Run/Hold Selectable:
Override RUN/HOLD key
Allow RUN/HOLD key to function
Event Outputs 3 possible event outputs. Each event can be set on or off
for each ramp and soak.
Page 75

Appendix E
Software Reference/Record Sheet
PROGRAM MODE TUNE MODE
PAGE 75
InPs
Icor
out 1
o1PL
out 2
o2PL
out 3
rLyA
rLyb
rLyC
dISP
Standard Software
dPOS
Euu
EuL
HySt
SPL
SPuL
EO
SPLL
AtFr
Ptb
EO
PIA
rrH
PFF
dFF
SPrd
PAL
dAL
dbAL
Pb 1
Pb 2
rSET
ArSt
rAtE
Ct 1
Ct 2
SEns
FoP
ENABLE MODE
ENAB
EtSt
ECAL
EPro
Etun
ESby
EPC
EPE
ESPC
ON
OFF
Co1r
Co2r
Pout
EO
Pou
PoL
CCon
Cbs
CAd
Comm
Page 76

PAGE 76
Pn
nS
Seg 1 2 3 4 5 6
rt
rr
EO
SP
E1
E2
E3
St
E1
E2
E3
PLCt
dhru
dhrd
PEnd
Pn
nS
Seg 1 2 3 4 5 6
rt
rr
EO
SP
E1
E2
E3
St
E1
E2
E3
PLCt
dhru
dhrd
PEnd
Pn
nS
Seg 1 2 3 4 5 6
rt
rr
EO
SP
E1
E2
E3
St
E1
E2
E3
PLCt
dhru
dhrd
PEnd
Pn
nS
Seg 1 2 3 4 5 6
rt
rr
EO
SP
E1
E2
E3
St
E1
E2
E3
PLCt
dhru
dhrd
PEnd
Page 77

PAGE 77
Pn
nS
Seg 1 2 3 4 5 6
rt
rr
SP
E1
E2
E3
St
E1
E2
E3
PLCt
dhru
dhrd
PEnd
Pn
nS
Seg 1 2 3 4 5 6
rt
rr
EO
SP
E1
E2
E3
St
E1
E2
E3
PLCt
dhru
dhrd
PEnd
Pn
nS
Seg 1 2 3 4 5 6
rt
rr
EO EO
SP
E1
E2
E3
St
E1
E2
E3
PLCt
dhru
dhrd
PEnd
Pn
nS
Seg 1 2 3 4 5 6
rt
rr
EO
SP
E1
E2
E3
St
E1
E2
E3
PLCt
dhru
dhrd
PEnd
Page 78

PAGE 78
Appendix F
Profile Development Sheet
The Profile Development Worksheet is intended to assist the Profile Controller
customers. By filling in the worksheet with the application requirements, profile
information can easily be obtained for entry into the instrument. The worksheet is a
convenient record of the profile for future use.
A profile is a programmed sequence of setpoint changes over a period of time (or at
a rate of change with the EO option) (Ramp) and a constant setpoint (Soak). A
sequence of a ramp and a soak is referred to as a Segment. A profile can contain
from 1 to 6 segments. The instrument can store in memory up to 8 profiles.
The profile controllers can provide timed output relay action while running a profile,
this is called an Event. Events may be selected as on or off as needed during each
Ramp and/or Soak segment of the profile.
The first step to completing the worksheet is to determine the range of the setpoints
necessary for the application. Fill out the setpoint scale along the left side of the
worksheet. Remember that the profile ramp will start at the process value indicated
when the profile is initiated.
The next step is to sketch the profile outline on the worksheet. Use the setpoint
scale to determine the setpoint level. Be sure to fill in the time periods for each part
of the segment in the boxes provided at the top of each column. The Ramp and
Soak time boxes are located at the top of each column below the setpoint box for
the segment. There are boxes at the bottom of each column to indicate the status of
events, if used. If more than six segments are needed for the profile, individual
profiles can be linked to preform sequentially. Linked profiles operate like one long
profile.
Profile program information is easily determined by completing the Profile
Developmental Worksheet (page 78) for the application. The information derived
within the worksheet is directly related to the profile entry parameters of the profile
controller.
Page 79

Profile Worksheet
Profile Number
Number of Segments
PAGE 79
Segments
Setpoint
Scale
123456
SP SP SP SP SP SP
Ramp Soak Ramp Soak Ramp Soak Ramp Soak Ramp Soak Ramp Soak
Time Time Time Time Time Time Time Time Time Time Time Time
Event 1
Event 2
Event 3
Profile End Action
Profile Loop Count
Deviation Hold After Ramp Up
Deviation Hold After Ramp Down
Profile Time Base
Profile Interrupt Action
Page 80

PAGE 80
Sample Profile
The following is a sample profile intended to assist in understanding how the profile controller
functions. Be sure to disconnect all control outputs before running this profile.
Press and release the SCROLL key until Prog appears on the display then press the DOWN
key. Press and release the DOWN key until diSp appears then press the SCROLL key. Press
and hold the UP key until the display shows a 5 then press the SCROLL key. Press and
release the Down key until Ptb appears then press the SCROLL key. Press and hold the UP
key until a 3 appears then press the SCROLL key. Press the UP key and Prog will appear.
Press and release the SCROLL key until PEnt appears then press the DOWN key. Perform
the following keystrokes:
Display Keystroke
Pn SCROLL
X DOWN
1 SCROLL
nS SCROLL
X UP
6 SCROLL
rt SCROLL
X UP/DOWN
0.10 SCROLL
SP SCROLL
X UP/Down
100 SCROLL
St SCROLL
X UP/DOWN
0.10 SCROLL
rt SCROLL
X UP/DOWN
0.10 SCROLL
SP SCROLL
X UP/DOWN
150 SCROLL
St SCROLL
X UP/DOWN
rt SCROLL
X UP/DOWN
0.10 SCROLL
SP SCROLL
X UP/DOWN
300 SCROLL
St SCROLL
X UP/DOWN
0.10 SCROLL
rt SCROLL
X UP/DOWN
0.10 SCROLL
SP SCROLL
X UP/DOWN
200 SCROLL
St SCROLL
X UP/DOWN
0.10 SCROLL
rt SCROLL
X UP/DOWN
0.10 SCROLL
SP SCROLL
X UP/DOWN
100 SCROLL
St SCROLL
X UP/DOWN
0.10 SCROLL
rt SCROLL
X UPDOWN
0.10 SCROLL
SP SCROLL
X UP/DOWN
50 SCROLL
St SCROLL
X UP/DOWN
0.10 SCROLL
PLct SCROLL
X UP/DOWN
2 SCROLL
dhru SCROLL
X UP/DOWN
0 SCROLL
dhrd SCROLL
X UP/DOWN
0 SCROLL
PEnd SCROLL
X UP/DOWN
0 SCROLL
Pn UP
PEnt
With PEnt on the display,
press and release the
SCROLL key until P 1
appears in the display then
press RUN/ HOLD key. The
display will show run, then
display the ramping setpoint
of the profile. This is to
demonstrate how the profile
controller functions.
Page 81

Warranty and Return Statement
These products are sold by the factory under the warranties set forth in the following paragraphs. Such warranties are extended only with respect to a purchase of these products, as
new merchandise, directly from the factory or from a factory distributor, representative or
reseller, and are extended only to the first buyer thereof who purchases them other than for
the purpose of resale.
Warranty
These products are warranted to be free from functional defects in materials and workmanship at the time the products leave the factory and to conform at that time to the specifications
set forth in the relevant instruction manual or manuals, sheet or sheets, for such products for
a period of three years.
THERE ARE NO EXPRESSED OR IMPLIED WARRANTIES WHICH EXTEND BEYOND
THE WARRANTIES HEREIN AND ABOVE SET FORTH. THE FACTORY MAKES NO
WARRANTY OF MERCHANTABILITY OR FITNESS FOR A PARTICULAR PURPOSE
WITH RESPECT TO THE PRODUCTS.
Limitations
PAGE 81
The factory shall not be liable for any incidental damages, consequential damages, special
damages, or any other damages, costs or expenses excepting only the cost or expense of
repair or replacement as described above.
Products must be installed and maintained in accordance with factory instructions. Users are
responsible for the suitability of the products to their application. There is no warranty against
damage resulting from corrosion, misapplication, improper specifications or other operating
condition beyond our control. Claims against carriers for damage in transit must be filed by
the buyer.
This warranty is void if the purchaser uses non-factory approved replacement parts and
supplies or if the purchaser attempts to repair the product themselves or through a third party
without factory authorization.
Returns
Factory’s sole and exclusive obligation and buyer’s sole and exclusive remedy under the
above warranty is limited to repairing or replacing (at Factory’s option), free of charge, the
products which are reported in writing to the factory at its main office indicated below.
The factory is to be advised of return requests during normal business hours and such returns
are to include a statement of the observed deficiency. The buyer shall pre-pay shipping
charges for products returned and the factory or its representative shall pay for the return of
the products to the buyer.
Approved returns should be sent to: 2 CAMPION ROAD
NEW HARTFORD, NY 13413 USA
Page 82

THE PARTLOW-WEST COMPANY
2 CAMPION ROAD • NEW HARTFORD, NY 13413 USA
1-800-866-6659 • 315-797-2222 • FAX 315-797-0403
 Loading...