

Page 1

INSTALLATION & OPERATION
MANUAL
IT200N REV. D
Remote Rate Indicator
DOC#: MN-200N-D.doc
Page 2

Sponsler, Inc.
IT200N Remote Rate Indicator
pg.
2
DOC#: MN-200N-D.DOC
Figure 6 – Dimensional Information .........................................................................................12
TABLE OF CONTENTS
PAGE #
SPECIFICATIONS ........................................................................................................................... 3
INTRODUCTION ............................................................................................................................. 4
General .................................................................................................................................... 4
Theory of Operation.................................................................................................................. 4
Calibration ................................................................................................................................ 4
INSTALLATION .............................................................................................................................. 5
Installation ................................................................................................................................ 5
Physical .................................................................................................................................... 5
Electrical ................................................................................................................................... 5
Signal ....................................................................................................................................... 5
CALIBRATION ................................................................................................................................ 6
Sensitivity ................................................................................................................................. 6
Calibration Factor ...................................................................................................................6,7
Change of Calibration Engineering Units ................................................................................7,8
Field Correction of Calibration Factor .....................................................................................8,9
Rate Display Considerations ..................................................................................................... 9
FUNCTION SELECTION ................................................................................................................10
Reset Function ........................................................................................................................10
MISCELLANEOUS .........................................................................................................................10
Factored Digital Pulse Output ..................................................................................................10
Battery Replacement ...............................................................................................................11
% of Flow Display ....................................................................................................................11
LIST OF ILLUSTRATIONS
Figure 1 – Mounting P.C.B. ...................................................................................................... 5
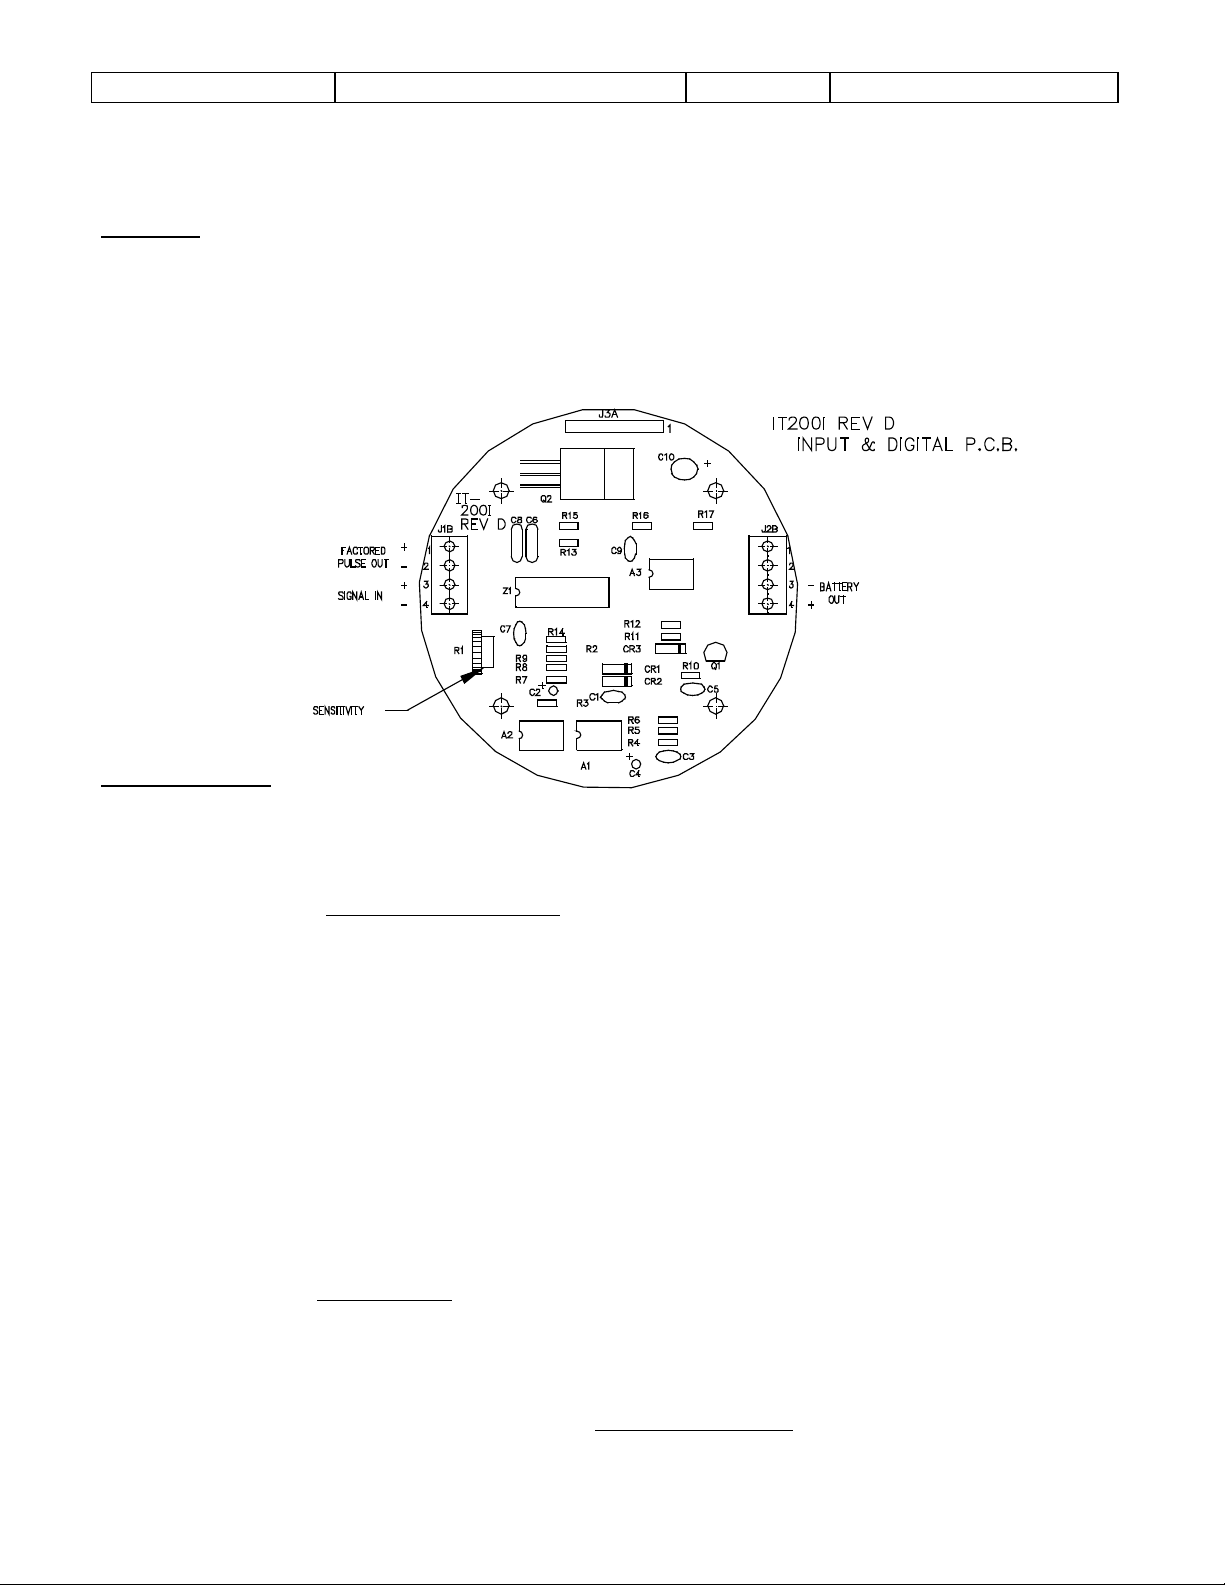
Figure 2 – Input & Digital P.C.B. ............................................................................................... 6
Figure 3 – Factoring P.C.B. ...................................................................................................... 7
Figure 4 – Resetting the Display ..............................................................................................10
Figure 5 – Board Stack Removal .............................................................................................11
Page 3

Sponsler, Inc.
IT200N Remote Rate Indicator
pg.
3
DOC#: MN-200N-D.DOC
INPUT VOLTAGE:
Internal AA Lithium Battery
LCD, 6 Digit .35” characters
OUTPUT:
Factored pulse output via open drains @ 1A
ACCURACY:
Rate Indicator +/- 1%
Mounts directly on flowmeter
Weight @ 2. 5 lbs.
SPECIFICATIONS
TEMPERATURE:
Operating -40 to 85°C
Storage –65 to 125°C
Battery Operating Life –
Rate Function: 3 years typical
(Assuming 24 hr. operation at max. flowrate)
INPUT SIGNAL:
DISPLAY:
FEATURES:
ENCLOSURE:
Frequency 0-2500 Hz
Amplitude 25 mV – 36V sine or squarewave
Sensitivity field adjustable
Impedance 10K
Rate Indicator – 5 Digit
Leading zero blanking on rate display
Engineering units – Input f actoring 1 – 99,999
Pulse width 2ms
Reset externally initiated
FM Approved, C.S.A. Certified
Class I, Groups B,C,D
Class II, Groups E,F,G
Nema 4
Page 4

Sponsler, Inc.
IT200N Remote Rate Indicator
pg.
4
DOC#: MN-200N-D.DOC
INTRODUCTION
General
The Model IT200N Industrial Remote Rate Indicator is a battery powered device that provides flow rate
in any engineering unit. Rate is displayed via a 6-digit liquid crystal display. Selection of the reset
function is accomplished externally by a magnetic field. T his par ticular feature retains the unit's int egrity
permitting complete operational contr ol in hazardous environments.
Negatives previously associated with LCD’s – poor cold temperature perform ances, condensation which
is a byproduct of heaters and display ghosting have all been eradicated by incorporating a low
temperature coefficient LCD (-35
temperature specs of –40 t o 125
In addition, the IT200N provides 1 digital interface output. The scaled pulse output is an open drain
configuration in which the pulse amplitude assumes the level of the host device. The output is a 2ms
negative pulse for each unit of displayed rate.
Theory of Operation
The IT200N amplifies and shapes the incoming pulses generated by the turbine's response to f low. The
amplified pulse train is then divided, factored by a phase locked loop ( PLL) and co m bined with a
timebase circuit for absolute accur acy.
Calibration
Field Calibration is accomplished by incorporating a calibration factor based on the turbine K-Factor.
Divider switches provide divisional increments of 1-99,999. The calibration fact or is entered via 5 BCD
switches.
(SPONSLER, INC. ST RONGLY RECOMMENDS THOROUGH REVIE W AND
UNDERSTANDING OF THIS MANUAL PRIOR TO INSTALLATION)
o
C). All monolithic and discrete devices of the IT200N have
o
C.
Page 5

Sponsler, Inc.
IT200N Remote Rate Indicator
pg.
5
DOC#: MN-200N-D.DOC
INSTALLATION
Inspection
All units are completely assembled, inspected and tested at the factory prior to shipment. Upon receipt
of the unit, a visual inspection should be conducted to detect any impropriety or damage that may have
occurred during shipment. Report any discrepancy to t he factory immediately.
Physical
The IT200N Remote Rate Indicator is m et er mounted and should be positioned as practically as possible
taking into account display visibility, accessibility, etc. The IT 200N enclosur e is r ated Class I Groups
B,C,D; Class II Groups E,F,G; and Class III Nema 4 and will withstand the harshest environment.
Electrical
The IT200N Remote Rate Indicator is designed to operate with a single internal AA battery and requires
no external wiring for power. Wiring of the digital output can be accom plished in a couple of different
methods to fit the application. For t he digital output, shielded cable (ALPHA 1710) is recommended to
insure adequate noise immunity.
Signal
A 2-wire twisted pair with molex and tinned terminations is standard. Pin orientation of t he m olex
connector or the tinned terminations is negligible.
FIGURE 1
Page 6
Sponsler, Inc.
IT200N Remote Rate Indicator
pg.
6
DOC#: MN-200N-D.DOC
K-Factor x Flowrate
60
K-Factor (Gallon)
Engineering Units
F x 60
C.F.
Formula 1
Formula 2
CALIBRATION
Sensitivity
The sensitivity adjust R1 is located on the IT200I (I nput and Dig it al) P. C. B. The amplitude of the signal
generated by the turbine is proportional to the r ate of flow; therefore, se nsit ivity should be adjusted at
the lowest usable flow rate. Rotate R1 completely counterclockwise then slowly rotate R1 clock wise until
the display correctly responds then increase R1 slightly clockwise. The nominal R1 position is with the
arrow indicating 11 o’clock.
Calibration Factor
The calibration factor is derived fr om the turbine’s K-Factor (Pulses per g allon or other desired
engineering unit).
FIGURE 2
C.F. =
EXAMPLE 1: K-Factor = 250 pulses per gallon
Engineering Units = gallons
∴ C.F. = 250/1 = 250
On the Factoring P.C.B.:
Set S1@0, S2@5, S3@2, S4@0, S5@0 (S5 is most significant digit, ∴ CF entered is
00250)
The Calibration Factor is initially loaded @ ‘POWER ON’ or by activating RESET.
The electrical accuracy can be verified by injecting a stable frequency @ TB2-1,2 on the Mounting
P.C.B. and incorporating the following formula:
Rate =
Where F = Frequency in Hz ( )
Frequency =
Page 7

Sponsler, Inc.
IT200N Remote Rate Indicator
pg.
7
DOC#: MN-200N-D.DOC
500 x 60
30,000
250
250
Pulses per Gallon
Units per Gallon
Formula 3
C.F. = Calibration Factor as entered in S1-S5 (S5 is the m ost significant digit)
EXAMPLE #2: F = 500 Hz C.F. = 250
Rate Displayed =
=
= 120
FIGURE 3
Change of Calibration E n g ineering Units
Assume that liters rather than gallons are the desired engineering unit.
Example # 3: K-Factor = 250 pulses per gallon
Liters = 3.785 per gallon
C.F. =
C.F. = 250/3.875
C.F. = 66 Pulses per liter
On the Factoring P.C.B.:
Set S1@6, S2@6, S3@0, S4@0, S5@0
Example #4: The Engineering Unit is pounds in 10ths CO2
K-Factor = 250 pulses per gallon
Pounds of CO
= 8.470 per gallon
2
In order to establish 10ths, increase lbs./gal. by a fact or of 10
C.F. = 250/84.7
C.F. = 3
Page 8

Sponsler, Inc.
IT200N Remote Rate Indicator
pg.
8
DOC#: MN-200N-D.DOC
Displayed Quantity
Actual Quantity
Formula 4
On the Factoring P.C.B.:
Set S1@3, S2, 3, 4, 5@0
Example #5: The engineering unit is ACF (FT3)
K-Factor = 250 pulses per gallon
ACF = .13369 per gallon
C.F. = .250/.13669
C.F. = 1870
On the Factoring P.C.B.:
Set S1@0, S2@7, S3@8, S4@1, S5@0
Example #6: Desired Engineering Unit is ACF x 10
K-Factor = 250 pulses per gallon
ACF = .13369 per gallon
In order to establish x 10, decrease ACF/gal by a factor of 10
C.F. = 250/.013369 = 18700
On the factoring P.C. B. :
Set S1@0, S2@0, S3@7, S4@8, S5@1
If the gallons per unit volume, such as 7. 48 gallons per FT3, is known but no the unit volume per gallon
as required to calculate the calibration factor, simply take the reciprocal of gallons per unit volume to
derive the unit volume per gallon i.e. 7.48 gallons per FT
Field Correction of Calibration Factor
3
– 1/7.48 = .13369 FT3 per gallon.
To adjust the calibration factor to reflect the turbine’s act ual resp onse t o the operating conditions,
incorporate the following formula:
New C.F =
x Present C.F.
Example #7: Actual = 50
Displayed = 52
C.F. = 250
New C.F.= 52/50 x 250 = 1.04 x 250 = 260
On the factoring P.C. B. :
Set S1@0, S2@6, S3@2, S4@0, S5@0
In the above example, 1.04 denotes that the meter is oper at ing 4% fast. Multiplying the present C.F.
(250) by the Displayed : Actual Ratio (1.04) effectively reduces the error by increasing the C.F. 4%.
Example #8: Actual = 52
Displayed = 50
C.F. = 250
Page 9

Sponsler, Inc.
IT200N Remote Rate Indicator
pg.
9
DOC#: MN-200N-D.DOC
New C.F. = 50/52 x 250 = .96 x 250 = 240
On the Factoring P.C.B.:
Set S1@0, S2@4, S3@2, S4@0, S5@0
In the above example, .96 denotes that the meter is oper at ing 4% slow. Multiplying by the present C.F.
(.250) by the Displayed : Actual Ratio (.96) eff ectively reduces the error by decreasing the C.F. by 4%.
Rate Display Considerations
The displayed rate is limited to a maximum of 30,000. This limitation must be considered when
determining the displayed engineering unit. Note t hat if the rate displayed is other than ‘Per Minute’, the
calibration factor is only correct f or the rate function. The factored output pulse is correct with rate per
minute only.
Example #9: A 1” turbine meter has a maximum f low rate of 60 GPM and a K-Factor of 970 pulses per
gallon in Liquid Oxygen. The desired engineering unit is SCFH.
Given: 1 gallon O
1) Determine maximum flow rate; does it exceed 30,000?
60 GPM x 115 SCF = 6900 SCFM
6900 SCFM x 60 = 414,000 SCFH
414,000 exceeds 30,000; therefore, dir ect SCFH units are not permissible and some
factor of SCFH must be det er m ined.
2) Determine what factor of SCFH is permissible –
4140 is the largest SCFH factor under 30,000; 1/100 of the actual SCFH flow rate
3) Determine the calibration factor for SCFH x 100 K-Factor = 970 Pulses per gallon
SCF O
= 115 per gallon
2
A) In order to establish x 100 decrease SCF/Gal by a factor of 100 (115 / 100 = 1.15)
B) In order to establish per hour increase SCF/G al by a f actor of 60 (1.15 x 60 = 69)
C.F. = 970/69 = 14
On the Factoring P.C.B.:
Set S1@4, S2@1, S3@0, S4@0, S5@0
Example #10: Using the specifics of example #9 establish SCFM as an engineering unit.
C.F. = 970/115 = 8
On the Factoring P.C.B.:
Set S1@8, S2@0, S3@0, S4@0, S5@0
To check the C.F. calculations, formula #2 or #3 should be incorporated. Frequent ly, only the K-Factor
is known, so it is necessary to determine the frequency for a given flow rate; to do so use t his formula:
Frequency = K-Factor x Flowrate ÷ 60
= 115 SCF
2
Page 10

Sponsler, Inc.
IT200N Remote Rate Indicator
pg.
10
DOC#: MN-200N-D.DOC
IT200M
SIGNAL OUT +
V+
TB1-3
TB1-4
RL
FUNCTION SELECTION
Reset Function
Reset is valid only to load a new calibration factor.
Reset is initiated externally by placing a magnet in the proximity of reset S6 locat ed on the Display
P.C.B. and indicated on the enclosure label as ‘RESET’.
FIGURE 4
MISCELLANEOUS
Factored Digital Pulse Output
This signal output is an open drain configuration that can sink 1A continuously. The maximum drain
voltage should not exceed 150VDC (V+). A pull-up resistor must be in series with V+ and T B1-3. The
output is a 2ms negative pulse for each eng ineering unit i.e. 1 pulse for each gallon, lb., et c..
Typical Configuration-
SIGNAL OUT –
(V-)
Page 11

Sponsler, Inc.
IT200N Remote Rate Indicator
pg.
11
DOC#: MN-200N-D.DOC
Battery Replacement
The battery is located on the Mounting P.C.B. and inserts into 2 so ckets. W hen inst alling the battery, it
is imperative to OBSERVE POLARITY. Simply pull the 3-board stack (See Fig ur e #5) out of the
enclosure, install the battery and reinsert the boar d stack. The display will be all zeros.
FIGURE 5
This figure illustrates t he r em oval of the 3-board stack from t he condulet . Note that the mounting board
is not removed.
CAUTION: Do not use the LCD module or S6 as grip points to remove the board stack. Use the
extended screw mounts provided.
To put the 3-board stack back in the condulet, align as illustrated and push down.
% of Flow Display
By incorporating a calibration factor formula the IT200N can be used to display rate of flow as a
percentage
% C.F. = F/S Frequency x 60/100
Example #11: The calibration sheet indicates that the maximum flow rate of an 1 ½” flowmeter is 130
GPM @ a frequency of 500Hz, 65 GPM (50%) = 250 Hz
% C.F. = 500 Hz x 60/100
= 30,000/100
= 300
On the Factoring P.C.B.:
Set S1@0, S2@0, S3@3, S4@0, S5@0
Given 65 GPM = 250 Hz = 50% % = 250 Hz x 60/300 = 50% displayed
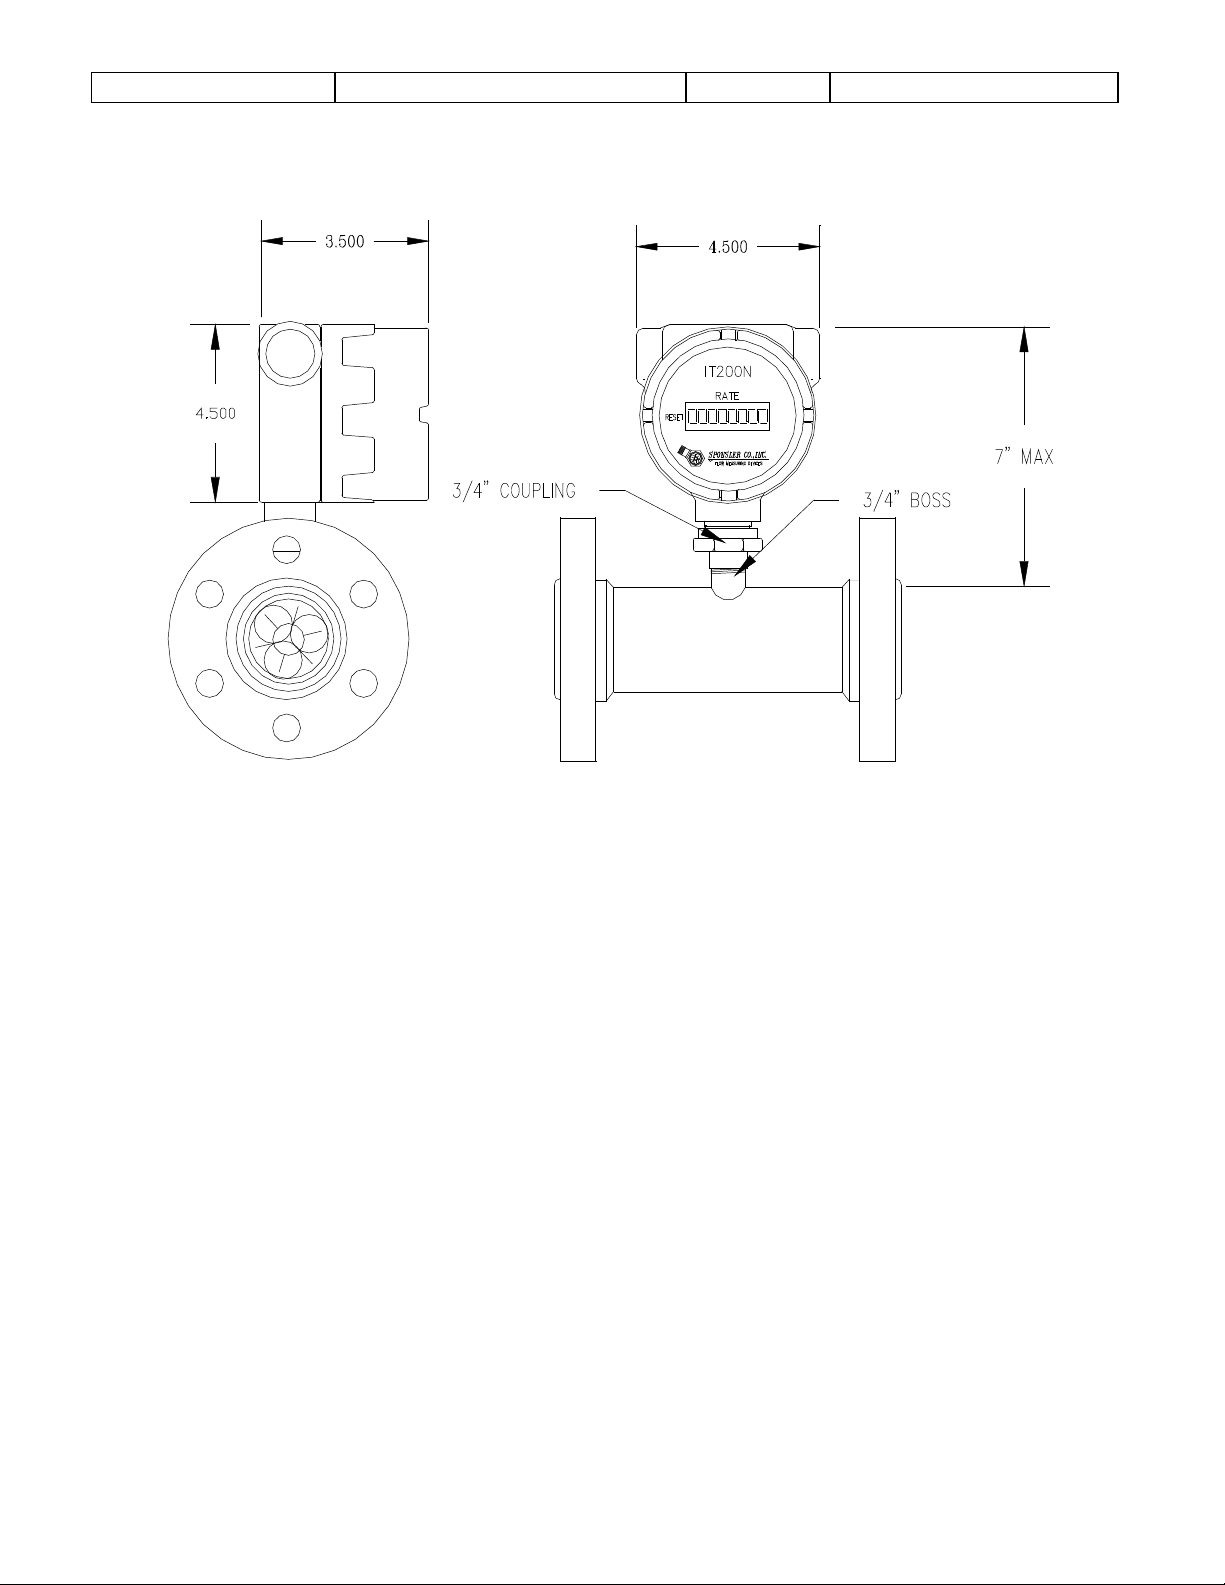
Dimensional Information
Page 12
Sponsler, Inc.
IT200N Remote Rate Indicator
pg.
12
DOC#: MN-200N-D.DOC
FIGURE 6
©2009
Pub. No. MN-200N-D
(09/09)
 Loading...