

GENOVA NANO
Application note: A09-012A
Accuracy and precision of the Genova Nano
Introduction
The Jenway Genova Nano spectrophotometer combines a micro volume
accessory with the dedicated life science
measurement modes of the Genova Plus as
well as those of a standard spectrophotometer. The Genova Nano is able to
measure sample volumes as low as 0.5µl
with a high degree of accuracy,
reproducibility and speed. This ability
conserves precious samples, reduces the
need for dilution and eliminates the
requirement for cuvettes. Cleaning is quick
and simple: wiping the read heads with a lintfree cloth removes all trace of the sample,
allowing faster change over between
samples and therefore increasing sample
throughput.
and precision is a measurement of
repeatability or reproducibility. The Genova
Nano is specified to an absorbance accuracy
of +/-2% at 260nm and a precision of <
0.005A between 0 and 1A (at 0.5mm path
length). This application note demonstrates
this specification on eight individual units and
also shows concentration reproducibility
when measuring in dsDNA mode.
Materials and Methods
Each of the Genova Nano units was
calibrated using the certified calibration
standard solution provided following the
instructions detailed in the user manual.
To determine absorbance accuracy, the unit
was set up in multiwavelength mode to
measure at 260nm and 330nm. The unit was
zeroed using 2µl of the calibration blank
solution then 2µl aliquots of the calibration
standard solution were measured. Following
each measurement, the sample was wiped
off the read head using a lint-free wipe. This
test was performed at both at 0.5mm and
0.2mm path lengths and on each individual
unit. 10 successive readings were used for
data analysis.
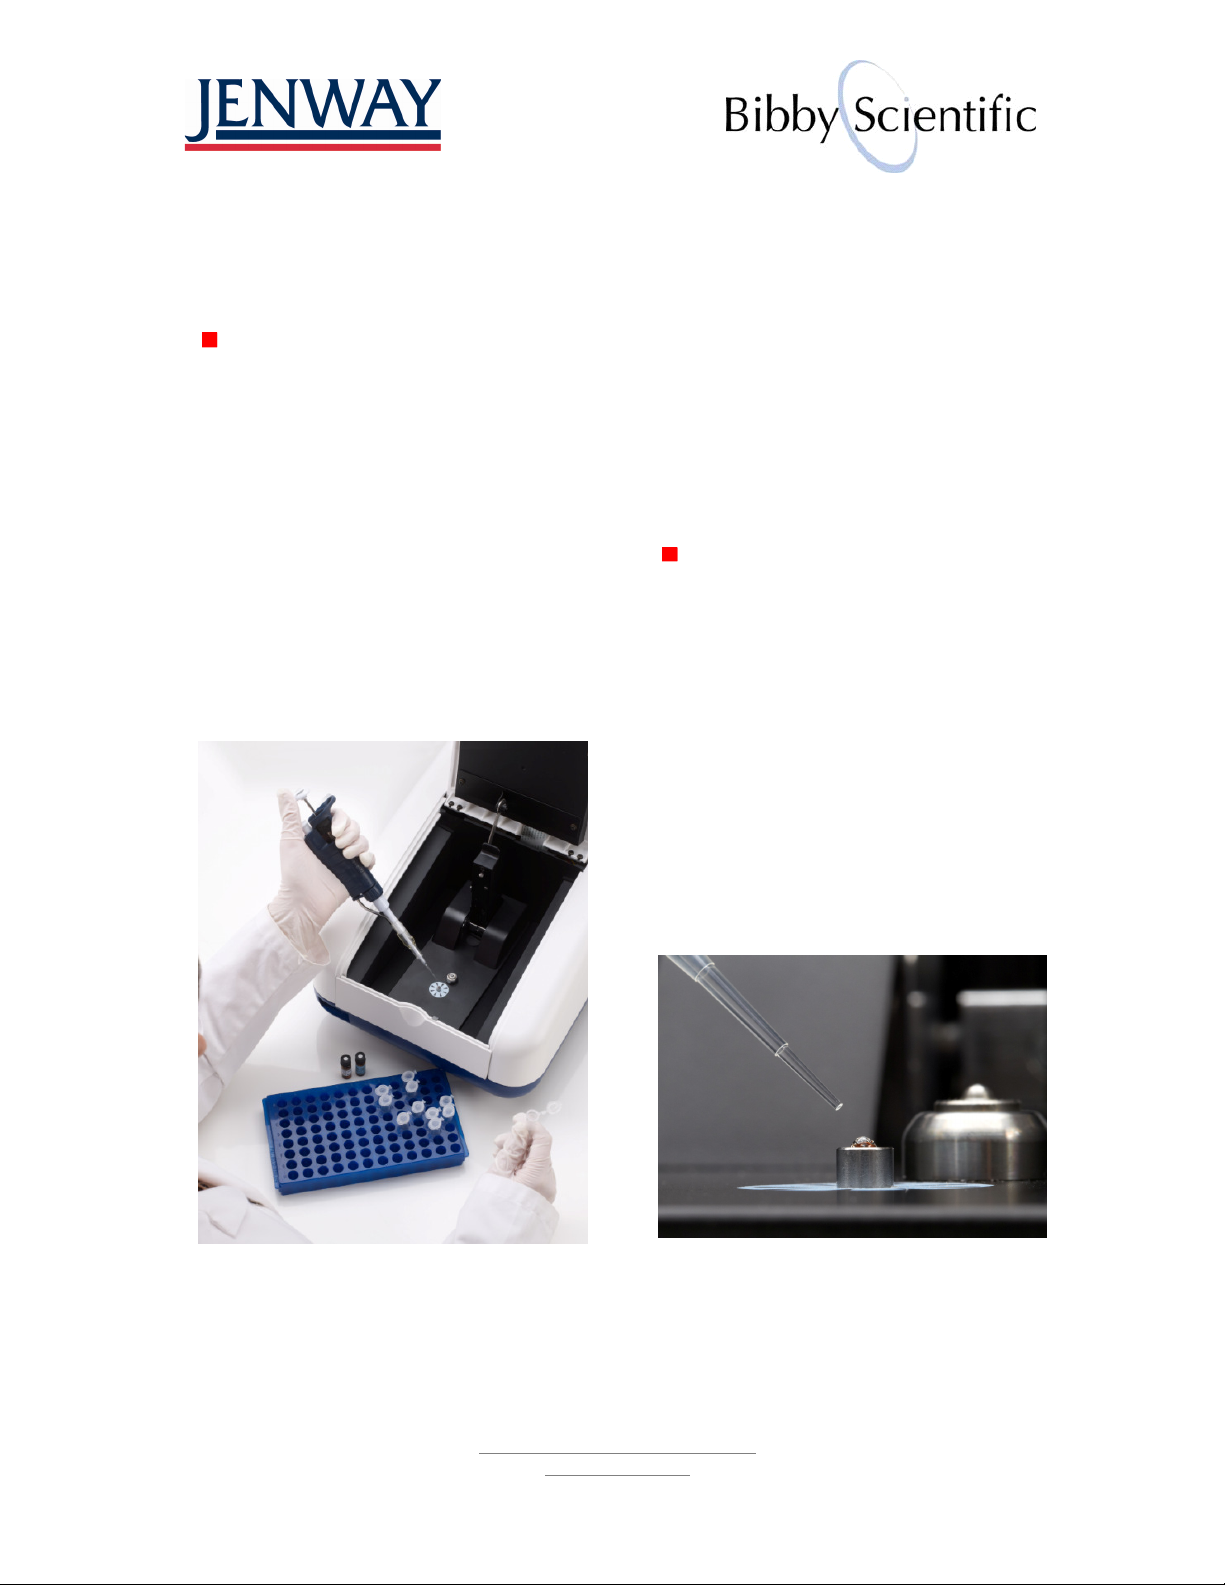
Fig. 1: Applying samples to the read head of the
micro volume accessory.
An important requirement for measurement
of micro volumes is accuracy and precision.
Accuracy is defined as how close the
measured parameter is to a defined value
jenwayhelp@bibby-scientific.com
www.jenway.com
Tel: +44 (0)1785 810433
Fig. 2: A droplet of sample is shown on the
Genova Nano read head.
In order to measure absorbance precision or
repeatability, a sample of green food
colouring (Supercook, Leeds, UK) was used.
This contains a mix of tartrazine (E102) and
Green S (E142). The absorbance spectrum
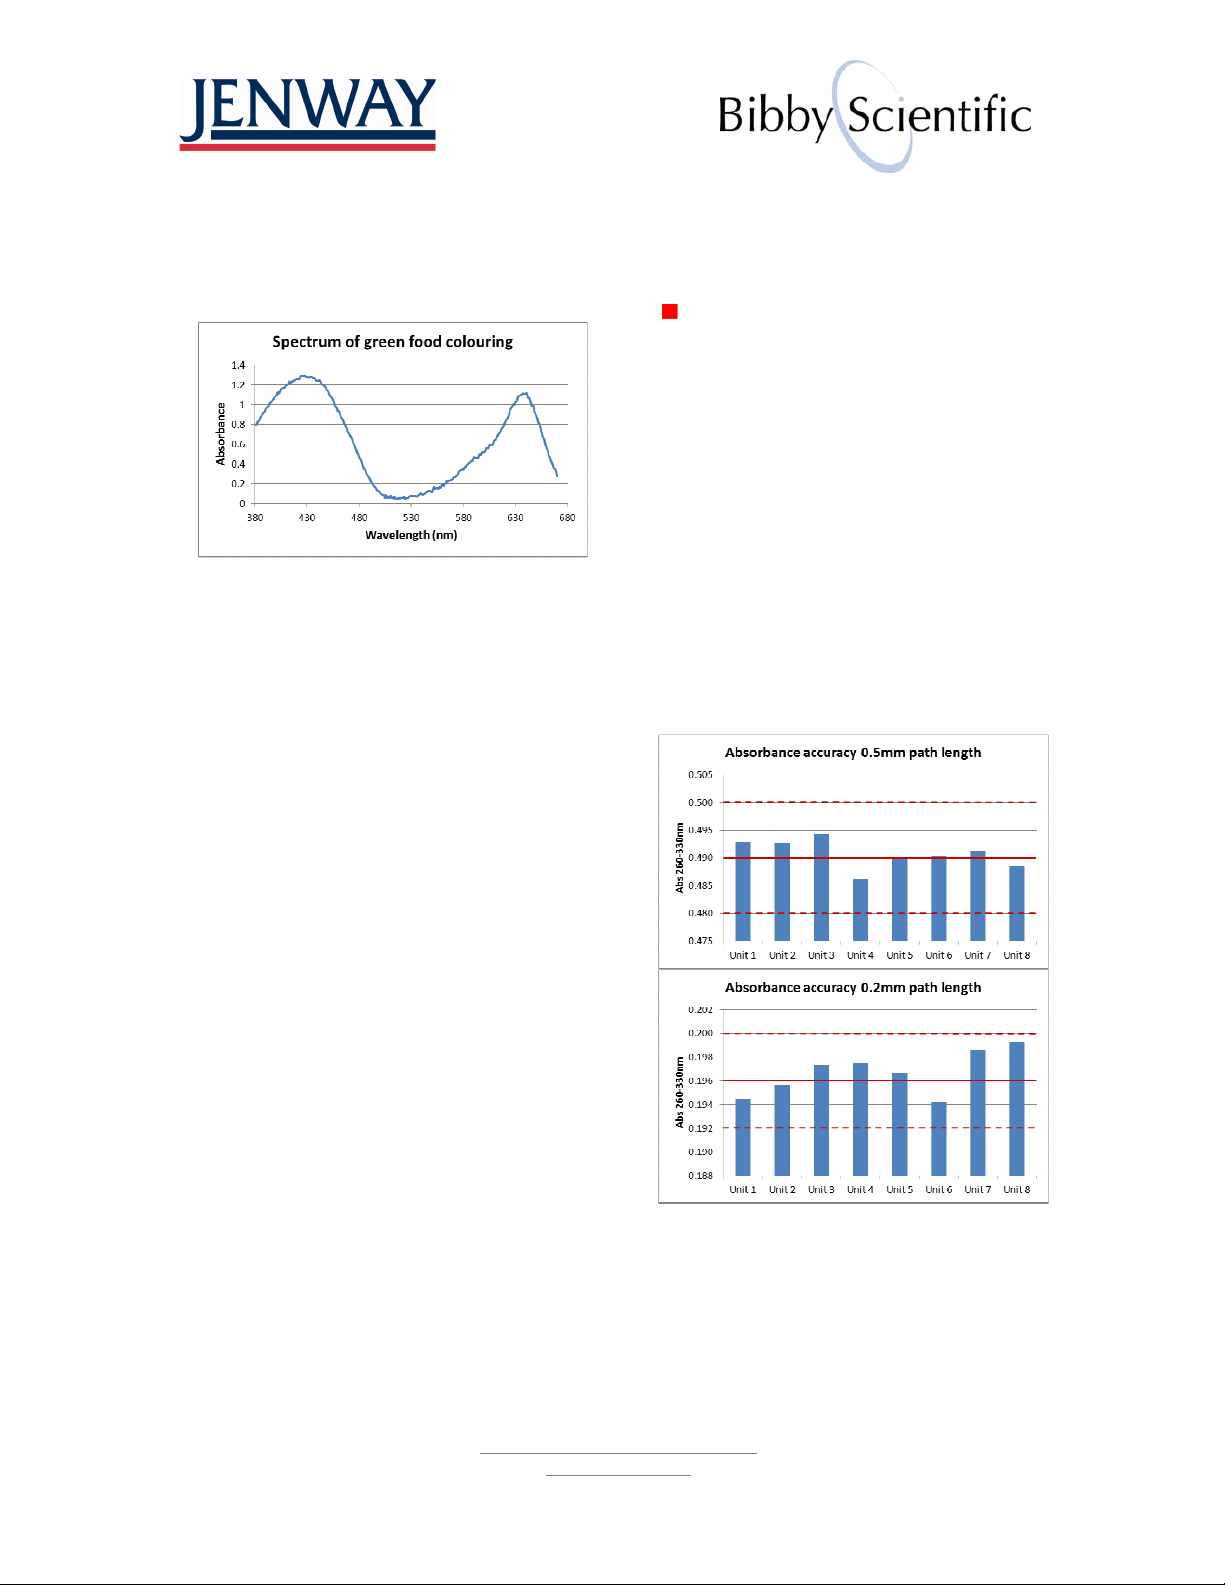
of the food colouring shows a peak at 430nm
and a trough at 520nm (Fig. 3), therefore
these wavelengths were chosen for
measurement. The food colouring was
diluted with water to give an absorbance
between 0 and 1 in a path length of 0.5mm.
Fig. 3: Visible spectrum of green food colouring
measured using the microvolume accessory at
0.5mm path length showing a peak at 430nm and
trough at 520nm.
In a similar manner to the absorbance
accuracy test, the unit was set up in
multiwavelength mode, however this time
measurements were made at 430nm and
520nm. The instrument was zeroed using 2µl
of water then 2µl aliquots of the food
colouring solution were measured. Following
each measurement, the sample was wiped
off the read head using a lint-free wipe. This
test was performed at 0.5mm path length on
each individual unit. 10 successive readings
were used for data analysis.
For measurement of concentration
repeatability, the unit was set up in the Life
Science Multiwavelength mode with the
following parameters:
a. Wavelength 1 = 260
b. Wavelength 2 = 280
c. Wavelength 3 = 230
d. Wavelength 4 = 330
e. Sum = (xF1*(A1-A4))-(xF2*(A2-A4))
f. F1 = 50 for dsDNA
g. F2 = 0
h. Units = µg/ml
The sample used was Calf thymus DNA
(Sigma, D3664) diluted to approximately
100µg/ml with nuclease-free water.
Measurements were performed as described
previously. The instrument was zeroed using
2µl of water then 2µl aliquots of the DNA
solution were measured. Following each
measurement, the sampls was wiped off the
read head using a lint-free wipe. This test
was performed at 0.5mm path length on each
individual unit. 10 successive readings were
used for data analysis.
Results
In order to minimise any factors which may
interfere with a reading it is recommended,
when performing micro volume measurements, that a reading is also made at a
second reference wavelength (where the
absorbance of the sample is very low and
unchanging) in order to perform a
background correction. In each of the
measurements shown here, background
correction was performed at 330nm for the
calibration solution and DNA and at 520nm
for the green food colouring. For analysis the
absorbance at the background wavelength
was subtracted from that of the measurement
wavelength.
Results for the absorbance accuracy tests
are shown in Fig. 4.
Fig 4: Absorbance accuracy tests on 8 individual
Genova Nano units at 0.5mm path length (top)
and 0.2mm path length (bottom). The centre
unbroken line on each graph represents the
expected absorbance value of the standard
solution. The broken lines are set +/- 2% from the
expected value. The mean of 10 consecutive
readings are shown.
jenwayhelp@bibby-scientific.com
www.jenway.com
Tel: +44 (0)1785 810433

The expected absorbance values for the
calibration standard solution were 0.490 at
0.5mm path length and 0.196 at 0.2mm path
length, according to the certificate supplied
with the reagents. All units were well within
the specification set at +/-2% of the expected
values at both 0.5 and 0.2mm path lengths.
In addition there was less than 2% variation
between instruments at 0.5mm path length.
To determine repeatability of measurement,
a series of food colouring samples were
measured and the maximum and minimum
reading of the range determined. The results
are shown in Fig. 5 and demonstrate highly
reproducible results with a range of
≤0.005Abs for 10 consecutive sample
readings.
Fig. 5: Absorbance precision tests on 8 individual
Genova Nano units. The bars represent the
maximum (blue) and minimum (red) values of 10
consecutive readings. The error bar above the
minimum values is set to 0.005Abs.
When measuring micro volume samples,
very small changes in absorbance can lead
to much greater differences in calculated
concentration values due to the inherent
“dilution” factor of the small path length (20x
for the 0.5mm path length and 50x for
0.2mm). Therefore reproducibility in
concentration measurements is an important
feature. For example, when measuring DNA,
an absorbance change of just 0.001 equates
to a derived concentration change of 1µg/ml
at 0.5mm path length (based on 1 A
260
unit of
dsDNA = 50µg/ml) and 2.5µg/ml at 0.2mm.
A sample of DNA of approximately 100µg/ml
was measured using the Life Science
multiwavelength mode of the Genova Nano
and two representative results are shown in
Fig. 6. The results illustrate that a variation of
less than +/-2µg/ml was obtained in ten
consecutive sample readings. This illustrates
further the reproducibility of the Jenway
Genova Nano.
Fig. 6: Concentration reproducibility of the Genova
Nano. 10 consecutive readings are shown. The
shaded area represents a range spread of +/2µg/ml, centred over the mid-point of the range.
Conclusions
This application note demonstrates that the
Genova Nano is extremely accurate and
precise in terms of absorbance measurement
both within and between instruments. The
ability of the Genova Nano to measure small
sample volumes pipetted directly onto the
read head, introduces considerable cost
savings in terms of time, sample and
consumables.
Fig. 7: The Genova Nano read head in reading
position.
jenwayhelp@bibby-scientific.com
www.jenway.com
Tel: +44 (0)1785 810433

jenwayhelp@bibby-scientific.com
www.jenway.com
Tel: +44 (0)1785 810433
 Loading...