

Page 1
Installation
After inserting the Dataway CD into your CD Drive, the above menu will be
displayed. From here, selecting the Install option will begin the install process.
Clicking on the Help option will bring up this help file.
The Exit option will close the Menu.
Page 2
Welcome to Dataway
Welcome to the Dataway software, a software package created to download
and process results from a range of Jenway instruments. This software has
been designed so that it is simple to use and gives you the opportunity to
achieve maximum productivity with the minimum of efforts.
This help file is has been produced to guide you through getting the most out
of this software. This document shows screenshots of the major areas of the
software, with written instructions describing how separate areas operate and
the functions available.
Supported Instruments
At present, supported instruments include:
• 3510 - pH meter.
• 3520 - pH meter.
• 3540 - Combined pH and Conductivity meter.
• 4510 - Conductivity meter.
• 4520 - Conductivity meter.
• 6400/5 - Spectrophotometer.
• 6500/5 - Spectrophotometer.
• Genova - Spectrophotometer.
More instruments will be added to this list as they are required and will be
available for download from our website at Jenway.com.
Help and support
For the latest help and support please visit the Jenway Software website.
Page 3
Starting the software
Once the software has been activated, all of the instruments on the search
screen will have 'Unscanned' written next to them. In order to scan for the
relevant instruments, the tick boxes to the left of the instrument name must be
selected. After this has been done, clicking 'Search' will look for the
instruments that have been selected. This may take some time, depending on
the number of instruments you have selected.
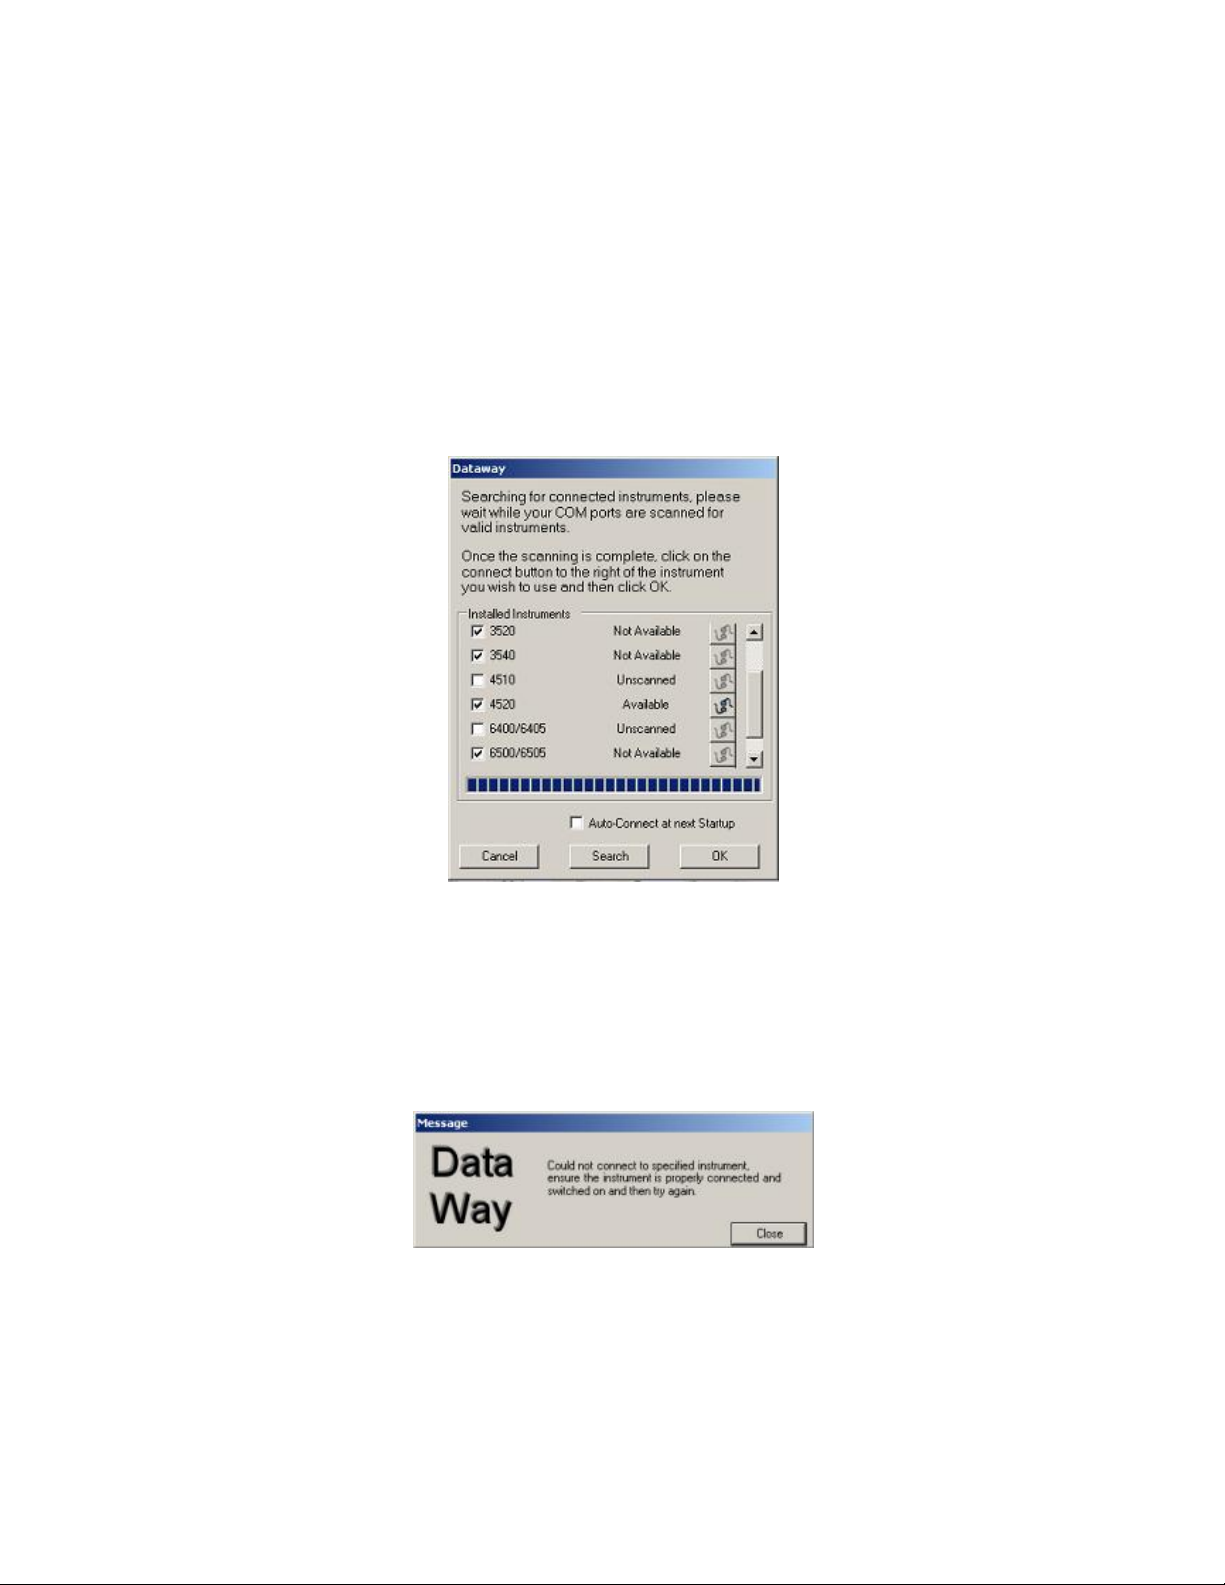
Once all the instruments have been searched for, all the instruments found
will be shown as 'Available' on the list as shown below.
Next to each of the available instruments is a button, which can be used to
connect to that instrument. Once selected and the instrument has successfully
connected, the 'Available' tag changes to a 'Connected' tag. If 'Connected' is
not shown, the connection attempt has failed and a message will appear
telling you that the connection to the specified instrument has not been
successful as shown below:
If an error occurs when trying to connect to an instrument, the PC is again
scanned for instruments to locate any change in the connection of
instruments.
Page 4

At the bottom of this screen is a tick box labelled 'Auto-connect at next start
up'.
Selection of this option, provides instrument connection without user
intervention, from the next use of Dataway. By checking this box, the software
will connect to the last available instrument in the displayed list and continue
into the main program. The 'Auto connect' preference can be unspecified on
the Setup screen.
The Search button forces the software to search again for instruments in case
the software has not found a newly added instrument.
The Cancel button exits the software.
Once the instrument has been connected, click on the OK button to continue
into the main application. It is possible to bypass the selection of an
instrument and enter the main software in offline mode by just selecting the
OK button before choosing an instrument to connect to.
Page 5
Home Tab
The home tab is the screen that welcomes you when you have connected to
an instrument. From here you have access to all other areas of the software.
At the top right of this screen is the Search button. Search allows you to scan
the PC for any instruments that may have been installed since the current
software session began.
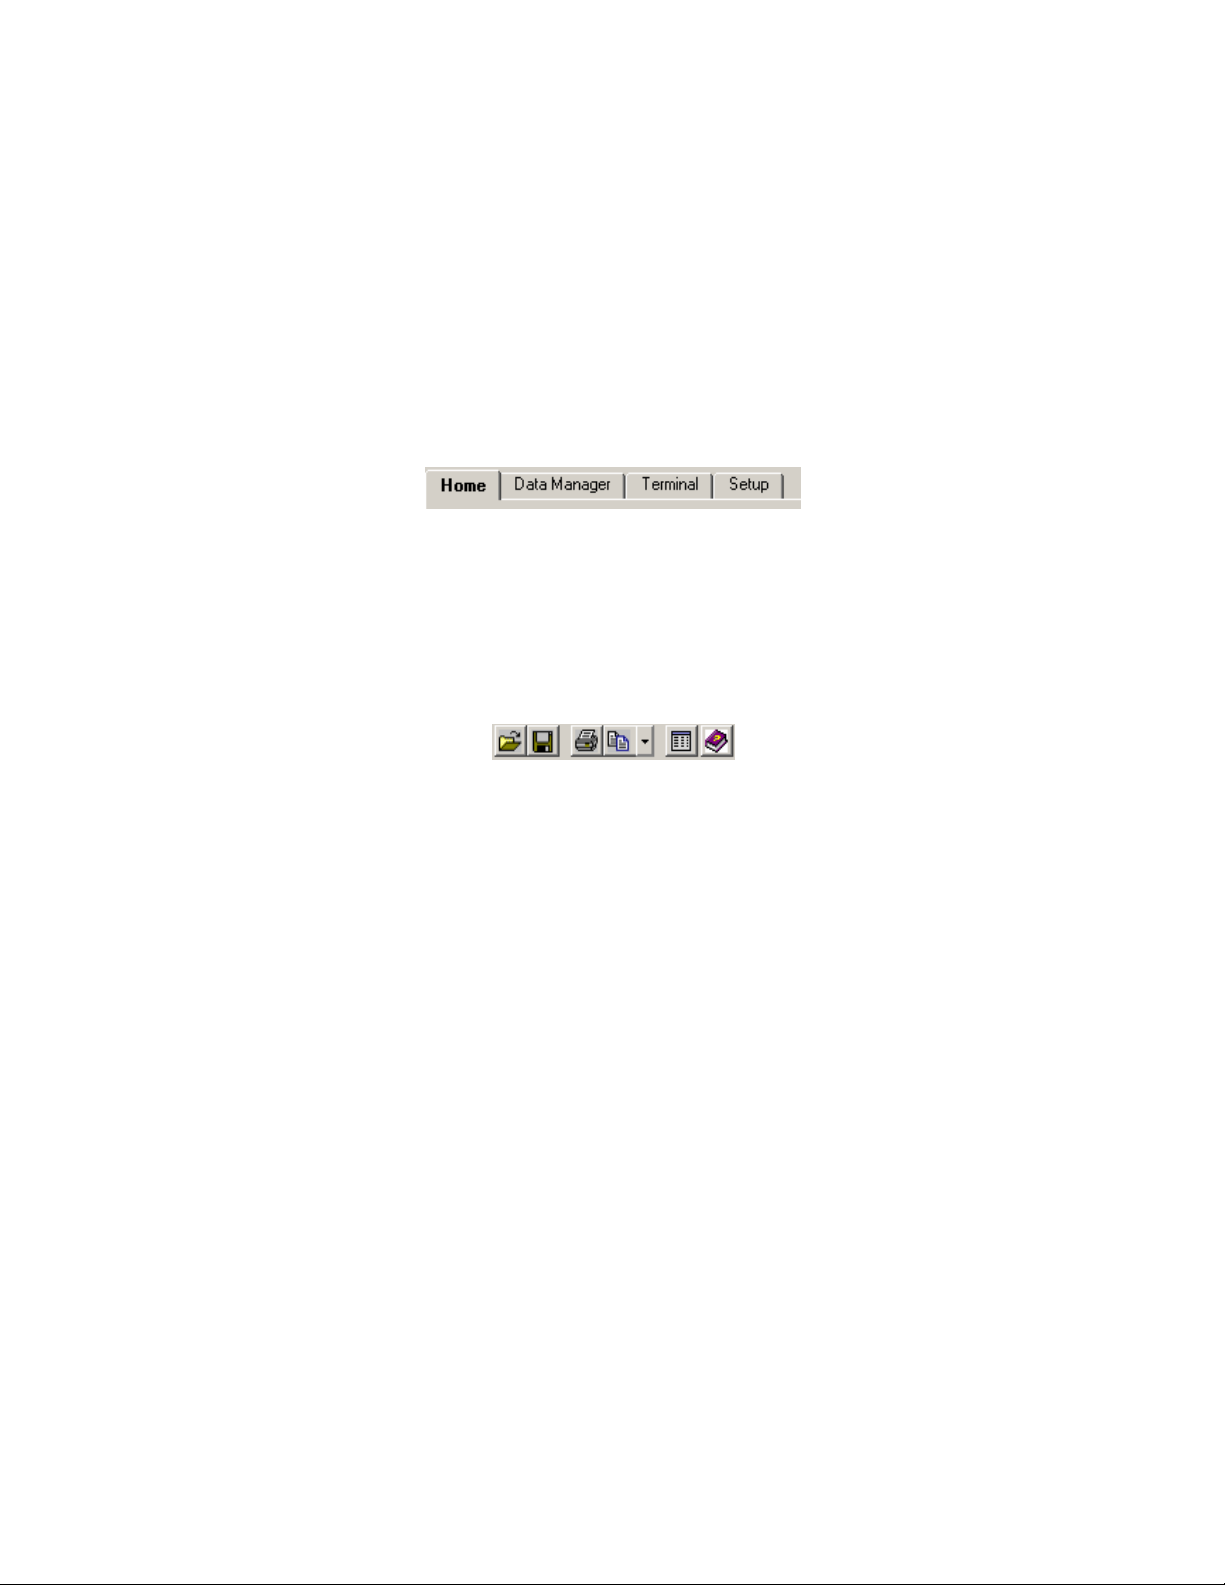
The Tabs
Along the top of the screen there is a row of tabs as shown below:
These tabs enable you to access different areas of the software.
The Toolbar
The toolbar is located at the top of the page and has a number of buttons that
can be used to process and handle data.
From left to right:
Open File
Open a file containing data saved by the Dataway software into the main
'Data Manager' area.
Save File
Save the current data into a file, which can be opened at a later time for
analysis.
Print
Open the print dialog screen to select the type of printout required for the
current data.
Copy
Click on the arrow next to the copy button to select the data destination. Two
options are available, copy to the clipboard or copy directly into Microsoft
Excel®. Selecting Excel® from this list will open a copy of Excel® with the
data from the 'Data Manager' and paste the data automatically as formatted in
Dataway.
Copying to the clipboard will put all the data into the clipboard, ready to be
pasted to another application. If a destination is not selected and the copy
button is used, the data will by default be copied to the clipboard.
Page 6

Note- only the numerical data and column headings are copied, not the graph
shown above the data.
Search
Opens the Search screen in order to search for newly connected instruments.
Help
Brings up this help document.
The Status Bar
The status bar is located at the bottom of the screen and contains two areas:
Instrument Status
Located on the left, this area shows which instrument is currently connected
to the software and its status.
Software Status
Located on the right, this area shows the current status of the Dataway
software. Information such as whether the software is receiving any data from
the instrument is displayed in this area.
Print
When the print button is pressed, the following is displayed:
Page 7

In the 'Printers' section you are able to choose the printer to which you wish to
print the information to. Once selected some information about the printer will
be displayed on the right of this area.
The 'Options' section offers a number of alternatives in regard to printing the
graph and data. By choosing one of the options, the 'Preview' box on the left
changes to reflect that choice. The 'Print Preview' button in the bottom left
corner brings up a standard print preview. When all options are set as
required, click the 'Print' button and the information will be sent to the selected
printer.
Page 8

The Data Manager
The 'Data Manager' area of Dataway, displays the data received from the
instrument and presents this graphically. Between the data and graph there is
a dividing bar which can be moved with the mouse, in order to increase or
decrease the display area of the section.
Data Section
The 'Data Section' consists of a number of buttons and coloured cells as
shown below:
The Buttons
From left to right:
Clear Table
Clicking on this button will clear all the data from the cells and clear any charts
that are shown on the current graph.
Take Reading
Requests a current reading from the connected instrument and tabulates it in
the data area.
Timer Section
The timer requests a reading from the instrument at regular intervals. Set the
interval value in the right hand box and then start the timer. When the timer
expires, Dataway will take a reading from the instrument and then begin
counting down again. Once the 'Start timer' button has been pressed, it will
change to a 'Stop timer' button and clicking on it again will stop the timer.
Load Data
Use the load data button to select and open a previously saved dataset into
Dataway.
Save Data
Saves the current set of data displayed in the data area to a specified file.
Copy to...
Click on the copy button to select the data destination. Two options are
available, copy to the clipboard or copy directly into Microsoft Excel®.
Page 9

Selecting Excel® from this list will open a copy of Excel® with the data from
the 'Data Manager' and paste the data automatically as formatted in Dataway.
Copying to the clipboard will put all the data into the clipboard, ready to be
pasted to another application.
Note- only the numerical data and column headings are copied, not the graph
shown above the data.
Data Section
The data section is located under the set of buttons and consists of a number
of cells, the top row of which is a different colour to those beneath it. The top
row is used for column headings received from the printouts of the
instruments and allows a label to be associated with each column. Clicking on
the label you wish to change and typing inside it can change the label for each
column. This allows each of the columns in the current dataset to be changed
to values, which are more relevant to your needs.
Under the headings, are columns of yellow cells, which hold data received
from the connected instrument as shown below:
Graph Section
Above the data section of the data manager tab is the graph section. Until
data is displayed in the data section and one or more charts are added to the
graph, this area will show 'No Data Available'. To add a series of data, to be
shown on the graph section, use the 'Edit series' button.
Edit chart
To add, edit or remove charts from the graph area, click the 'Edit chart' button.
Clicking on this button will open an additional window, within which the graph
axis can be assigned a data column and the colour of the markers and line
can be set. Several charts can be set and displayed with different colour lines
and markers to compare data sets.
Within the 'Edit chart' windows, alerts can also be set to indicate when a given
parameter has passed a level set for that chart.
Page 10

Clicking on an individual data point on the graph will display the chart
parameters and the corresponding values for that point.
Toggle point markers button
Individual data point markers can be shown on all the charts by use of the
'Toggle point markers' button above the graph. This will switch between the
point markers being on and off.
Show alerts button
On the right of the graph section there is a 'Show alerts' button which when
clicked, displays in text form, any breaches of alerts set against the charts
shown on the graph.
Page 11

New Series
In order to display new data on the graph, a series must be added to it. This
can be achieved through use of the 'Chart Details' window. To access 'Chart
Details', click either the 'Edit chart' button or use the right hand mouse button
on the graph area and selecting 'Edit chart' from drop down options.
Once selected, the 'Chart Details' window will show any current series already
on the graph.
On the first use of 'Edit chart' the 'Chart Details' window will be empty. To add
a first or new series, use the 'Add new series' on the top right of the 'Chart
Details' window. However, once a series has been added it can be reviewed
here and edited using the two buttons on the left and one on the right of the
axis settings.
On the left there is the delete button .When clicked, this button will remove
the given series from the graph and the 'Chart Details' window.
Next to this button is the edit button . To make changes to a currently set
series, click this button to open the 'Series information' window.
On the right of each current series is a coloured button, denoting the current
colour that the series will be drawn in. Clicking on this button will bring up a
window allowing you to define a new colour for the series.
Add New Series
Click the 'Edit chart' button above the data area and then the 'Add New
Series' button on the 'Chart Details' window.
Page 12

Next to the X and Y-axis labels there is a drop down list of instrument data
parameters. Clicking on these will give you a list of all the headers found in
the data. If the drop-down lists are empty then no data is displayed in your
data area of the data manager screen. After selecting parameters for the X
and Y-axis, an alert can be added to this series. The alert will log when the
points being plotted on the Y-axis pass a given level. Use the tick box to 'Add
Alert' and the 'Alert' section below it becomes available. Here select the alert
level and whether the alert is to be signalled when the Y-Axis data goes
above or below the alert level.
The colour button below the 'Alert' section can be clicked in order to change
the colour that represents this series on the graph.
Once all of these settings have been completed, clicking the OK button will
return Dataway to the 'Chart Details' screen which will now show the details of
the series just added. If any of the settings are incorrect use the edit button on
the left of that series to readjust any of the settings.
Page 13

Terminal
The terminal section of Dataway displays all information received from the
instrument. 'Data Manager' processes communications in order that data is
presented in a tabular format from the result section of instrument printouts.
Other information from instrument printouts such as header features, test
names etc. can be seen in terminal view.
The 'Clear' button will clear all of the information from the terminal view.
It is possible to highlight any of the text you wish to copy and choose copy
after pressing the right mouse button. This will copy the highlighted data onto
the PC's clipboard to be pasted into another application.
Page 14

Setup
The setup page of the Dataway software is used in order to set options within
Dataway.
The 'Auto-Connect' section determines whether or not the software will
automatically connect to an instrument next time it is started up. If the box is
ticked then Dataway will automatically connect to the last available
instrument, making user input unnecessary for connection.
The 'File Options' section determines the default location for saved files.
When the open/load or save buttons are used, Dataway will automatically
begin at the set file location. Click on the button on the right of the location
address and a screen will open for selection of a default folder. After selecting
a location and clicking ok, this default folder will be saved for future reference.
To change a set default location, use the button on the right as detailed
above.
At the bottom of this screen is a list of the instruments with which the current
edition of Dataway can be used.
 Loading...