

Jenway 7305 User Manual

Spectrophotometers
Models 7300 & 7305
Operating Manual
730 005 REV E /12-10

2

Safety
Please read this information carefully prior to installing or using this equipment.
1. The unit described in this manual is designed be operated only by trained personnel. Any adjustments,
maintenance and repair must be carried out as defined in this manual, by a person qualified to be aware
of the hazards involved.
2. It is essential that both operating and service personnel employ a safe system of work, in addition to
the detailed instructions specified in this manual.
3. Other than for those items defined in the maintenance procedures herein there are no user serviceable
items in this instrument. Removal of covers and attempted adjustment or service by unqualified personnel
will invalidate the warranty and may incur additional charges for repair.
4. References should always be made to the Health and Safety data supplied with any chemicals used.
Generally accepted laboratory procedures for safe handling of chemicals should be employed.
5. If it is suspected that safety protection has been impaired in any way, the unit must be made inoperative
and secured against any intended operation. The fault condition should immediately be reported to the
appropriate servicing authority.
3

4

Contents
Page
Safety 3
SECTION 1 - Introduction 8
1.1 Instrument description 8
1.2 Instrument specification 8
SECTION 2 - Installation 9
2.1 Unpacking 9
2.2 Installation 9
2.3 Display 10
2.4 Controls 11
2.5 Rear panel 12
2.6 Front panel 12
SECTION 3 - Theory and practice of spectroscopy measurements 13
3.1 Theory of spectroscopy measurement 13
3.2 Spectroscopy measurement 13
3.3 Good practice guidelines 14
SECTION 4 - Instrument setup 16
4.1 Navigating and screen setup 16
4.2 Time and date 17
4.3 Instrument settings menu 17
4.4 Diagnostics 18
4.5 Screen contrast 18
4.6 Lamp save 18
SECTION 5 - Photometrics 20
5.1 Mode specific parameters 20
5.2 Method set up 20
5.2.1 Selecting a wavelength 21
5.3 Calibration 21
5.4 Sample measurment 21
SECTION 6 - Concentration 22
6.1 Mode specific parameters 22
6.2 Method setup 22
6.2.1 Selecting a wavelength 22
6.2.2 Settings 23
6.2.2.1 Selecting concentration units 23
6.2.2.2 Changing the resolution 24
6.2.2.3 Using a standard 24
6.2.2.4 Using a factor 24
6.3 Calibration 24
6.3.1 Calibrating to a standard 24
5
1

6.3.2 Calibrating to a factor 25
6.4 Sample measurement 25
6.4.1 Measuring a sample after calibrating to a standard 25
6.4.2 Measuring a sample after calibrating to a factor 25
SECTION 7 – PRINTING AND AUTOLOGGING 26
7.1 Printing 26
7.1.1 Print Setup 26
7.1.2 Printing Results 27
7.2 Autologging 27
7.2.1 Setting the Number of Sample Repetitions 27
7.2.2 Selecting Result’s Destination 28
7.3 Connecting to a PC 28
SECTION 8 - Accessories and spare parts 29
8.1 Optional accessories 29
8.2 Connecting the accessories 29
8.2.1 Internal printer 29
8.2.2 Passive accessories 30
8.2.3 Active accessories 30
8.2.3.1 Automatic 8 cell turret 31
8.2.3.2 Peltier 31
8.2.3.3 Sipper pump 32
8.2.3.4 Combined sipper peltier pump 33
8.3 Using the accessories 34
8.3.1 Automatic 8 cell turret 34
8.3.2 Peltier 34
8.3.3 Sipper pump 35
8.3.3.1 Manual sipper pump settings 35
8.3.3.2 Timed sipper pump settings 36
8.3.4 Combined sipper peltier pump 38
8.4 Spares 39
SECTION 9 - Maintenance and service 40
9.1 Routine maintenance 40
9.2 Lamp replacement 40
9.2.1 Tungsten halogen lamp replacement 40
9.2.2 Xenon lamp module replacement 40
9.3 Service 41
SECTION 10 - Troubleshooting 42
10.1 Error codes 42
10.2 Troubleshooting guide 44
10.3 Technical support 44
SECTION 11 - Declaration of conformity 45
SECTION 12 - Glossary of icons 47
Index 54
6

7

SECTION 1 - Introduction
1.1 INSTRUMENT DESCRIPTION
The 7300 and 7305 spectrophotometers are suited to a wide range of applications in education,
quality control, environmental and clinical analysis. The 7300 is a visible spectrophotometer covering
a wavelength range from 320nm to 1000nm. The 7305 is a UV/Visible spectrophotometer with a
wavelength range from 198nm to 1000nm. Both models feature measurement modes for absorbance,
% transmittance and concentration. These instruments use icon driven software and have an improved
navigation system for easy and intuitive usability.
1.2 INSTRUMENT SPECIFICATION
7300 7305
Wavelength
Range 320 to 1000nm 198 to 1000nm
Resolution 1nm
Accuracy ± 2nm
Repeatability ± 0.5nm
Spectral bandwidth 5nm
Photometrics
Transmittance 0 to 199.9%
Absorbance -0.300 to 2.500A
Accuracy ±1%T, ±0.01Abs at 1.000 Absorbance
Resolution 0.1%T, 0.001A
Stray light <0.5% at 340nm <0.5% at 340nm and 220nm
Concentration
Range -300 to 9999
Resolution Selectable 1/0.1/0.01/0.001
Calibration Blank with a single standard or factor
Units no units, %, ppm, EBC, SRM, mEq/l, mEq, M, mM, µM, nM, U, U/l, U/ml, g/l, mg/l,
µg/l, ng/l, g/dl, mg/dl, µg/dl, mg/ml, µg/ml, ng/ml, µg/µl, ng/µl, mol/l, mmol/l
Factor 0.001 to 10000
Standard 0.001 to 1000
Other
Beam height 15mm
Light source Tungsten halogen lamp Xenon lamp
Lamp save Yes Not applicable
GLP Current time and date
Outputs USB, Analogue, RS232, Internal printer
Power 24V
Size (w x d x h) 275 x 400 x 220mm
Weight 6kg
8
SECTION 2 - Installation
2.1 UNPACKING
Remove the 7300 or 7305 from the packaging and ensure the following items are included:
1. Model 7300 spectrophotometer (730 001), or Model 7305 spectrophotometer (730 501)
2. 24V 65W power supply unit (021 060)
3. Pack of 100 disposable plastic visible wavelength cuvettes (060 084),
or pack of 100 disposable UV plastic cuvettes (060 230)
4. Jenway 73 series PC software (735 100) and interface cable (013 203)
5. Instruction manual (730 005)
6. Jenway Foreign Manual CD (JENMANCD)
7. Optional accessories (as ordered)
2.2 INSTALLATION
Models 7300 and 7305 are supplied ready to use.
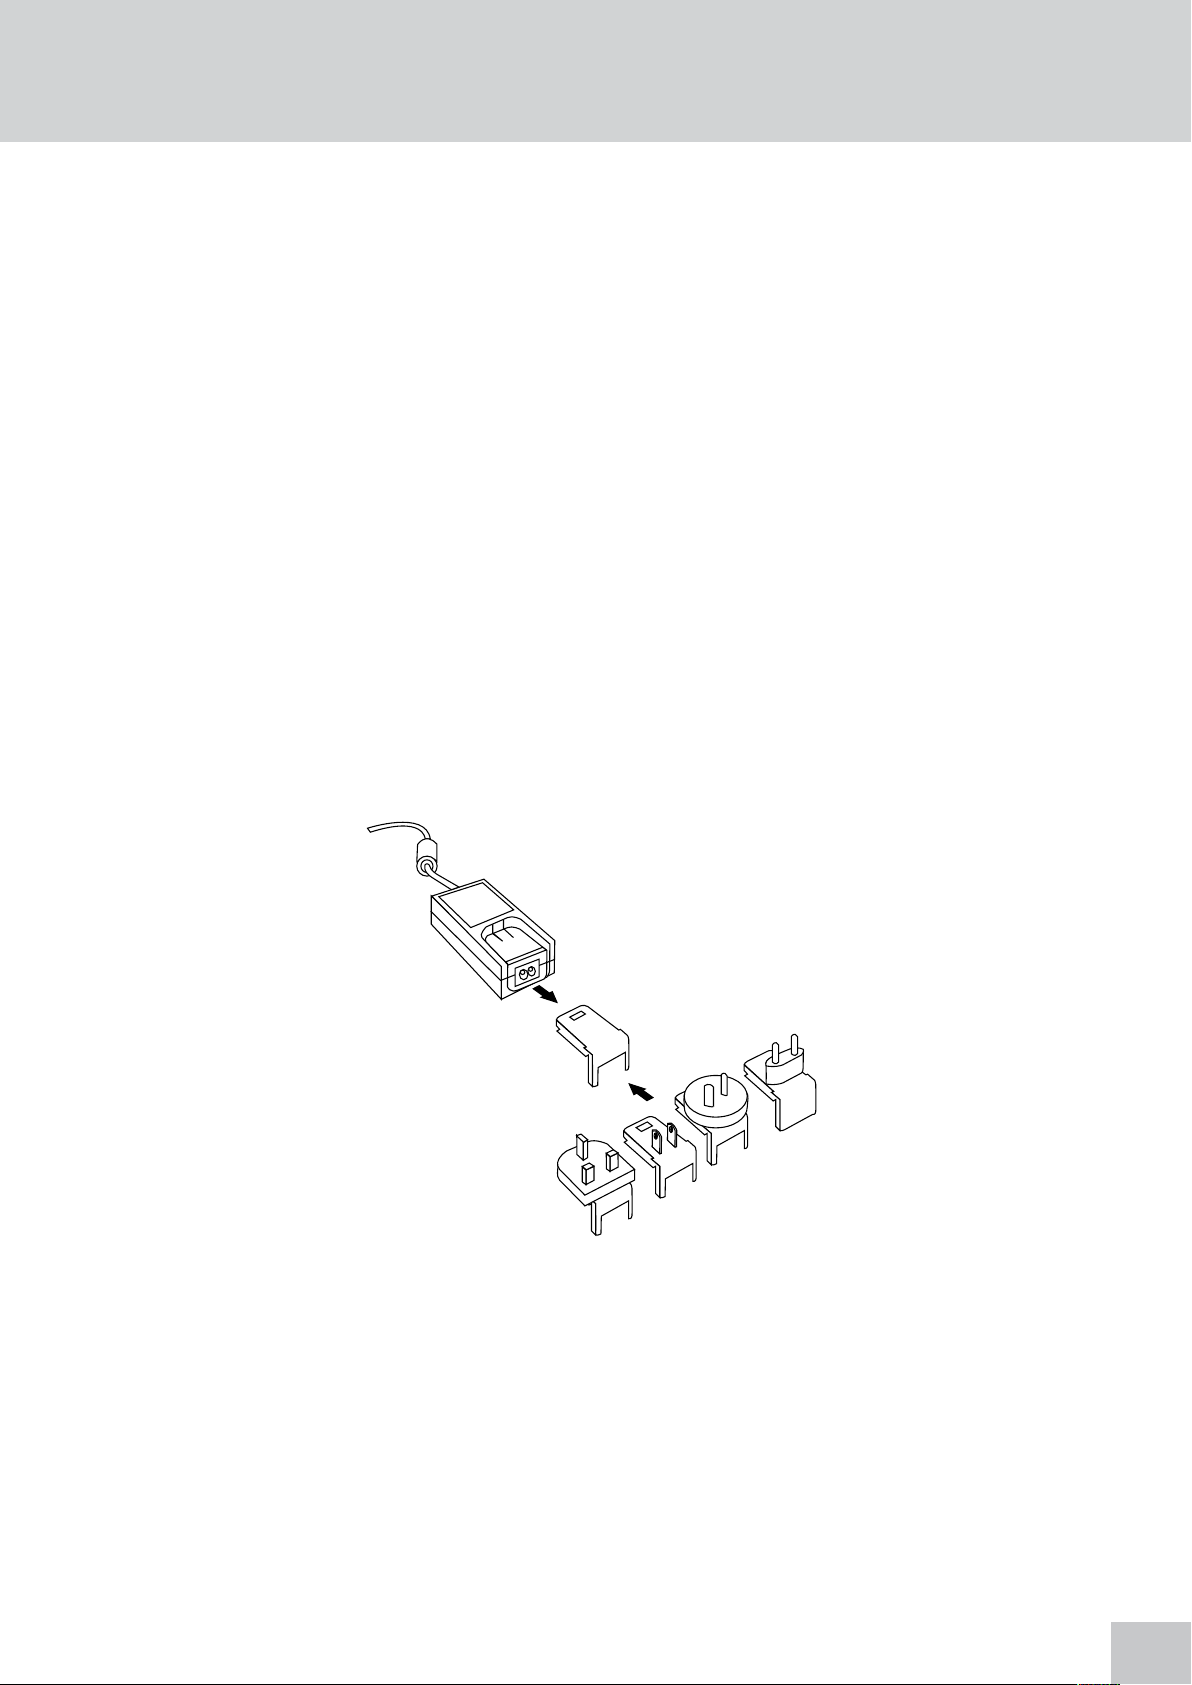
The unit should be placed on a clean flat surface which is free from drafts and vibrations. The units are
designed for operation on 90V to 264V AC input at 47 to 63Hz. Select the correct plug attachment and
attach to the power supply unit as shown below:
Fig 2.2.1 – Power supply unit with various plugs
Connect the power supply unit to the power inlet socket on the rear panel of the instrument and
connect to the mains socket. Turn the power on at the mains and switch the instrument on using the
power switch on the rear of the instrument.
The instrument will perform several power on tests before displaying the main menu:
9
7300
09 : 02
1 3
7300
2
09 : 02
Fig 2.2.2 – All Power On Tests Complete
1. Instrument check – ensures the validity of the saved parameters
2. Dark test
3. Checks for the accessory fitted. If an active accessory is found the instrument verifies communication
and response
4. Self calibration of wavelengths
2.3 DISPLAY
These spectrophotometers have a dot matrix display which enables icons and graphs to be displayed
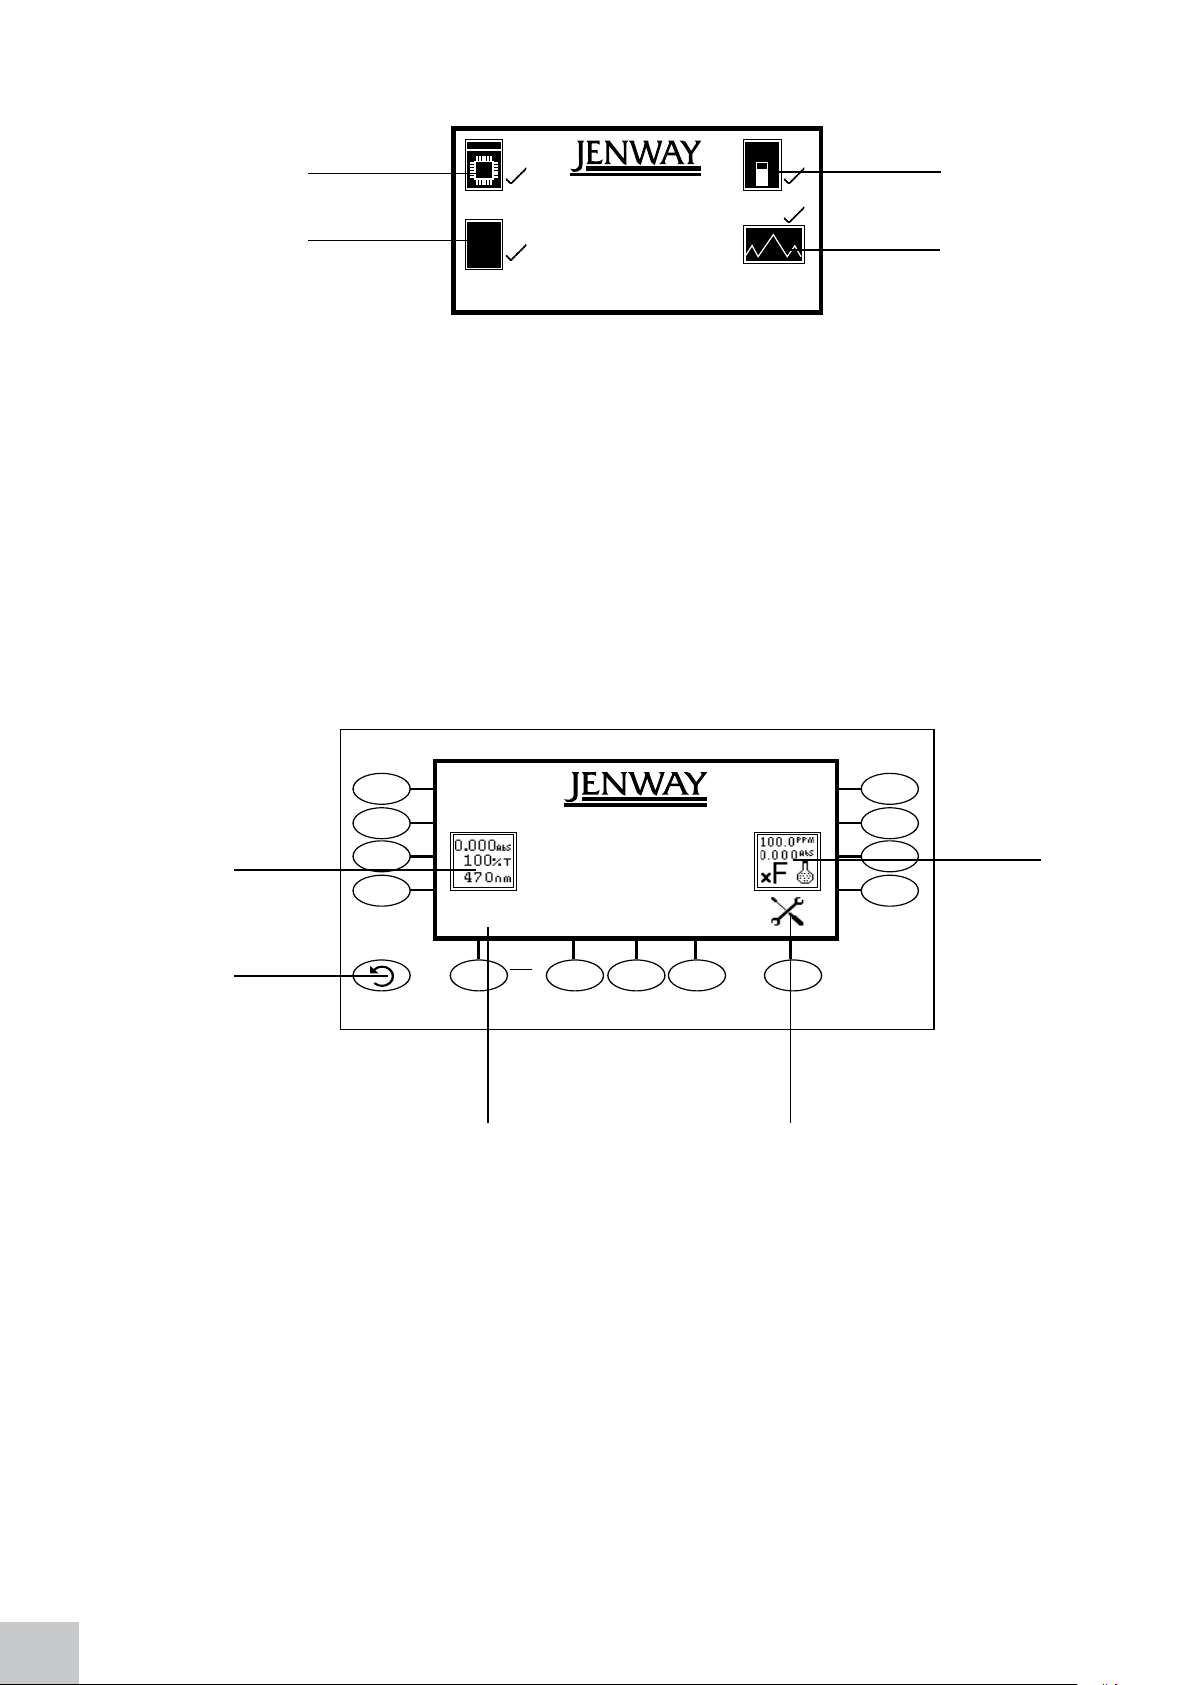
clearly. Following successful completion of the power on tests the main menu screen will be displayed:
4
1
2
3
1. Photometrics measurement mode
2. Back key
3. Time and date menu
4. Instrument settings menu
5. Concentration measurement mode
5
4
Fig. 2.3.1 – Display
10
2.4 CONTROLS
7300
09 : 02
The keypad used for these models enables an easy and effective way of navigating the different
measurement modes, entering numbers, saving and analysing results. The soft keys are active when an
icon is displayed above or adjacent to the key. The only exception to this is the back key which is always
active.
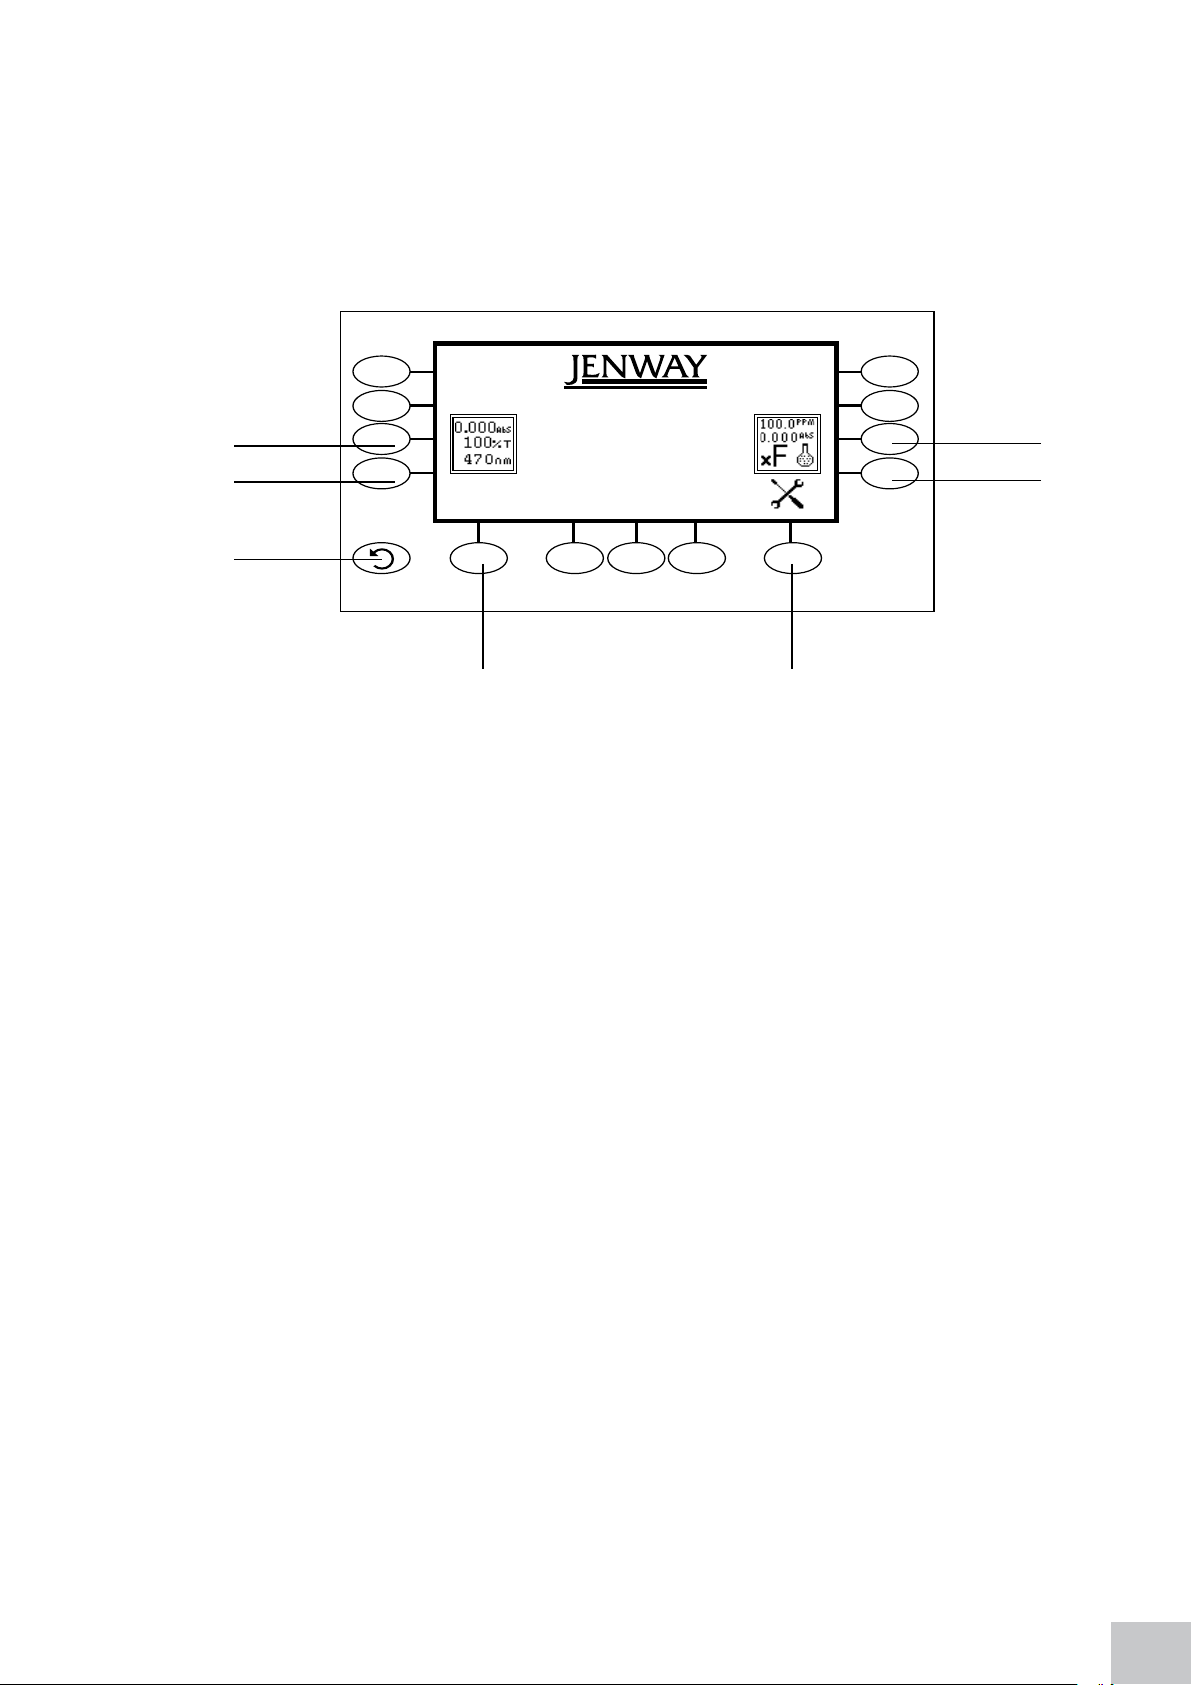
The main menu screen and surrounding keypad is displayed below.
1
1
2
3 4
Fig. 2.4.1 – Display
1. Photometrics measurement mode
2. Back key
3. Time and date menu
4. Instrument settings menu
5. Concentration measurement mode
5
5
11
2.5 REAR PANEL
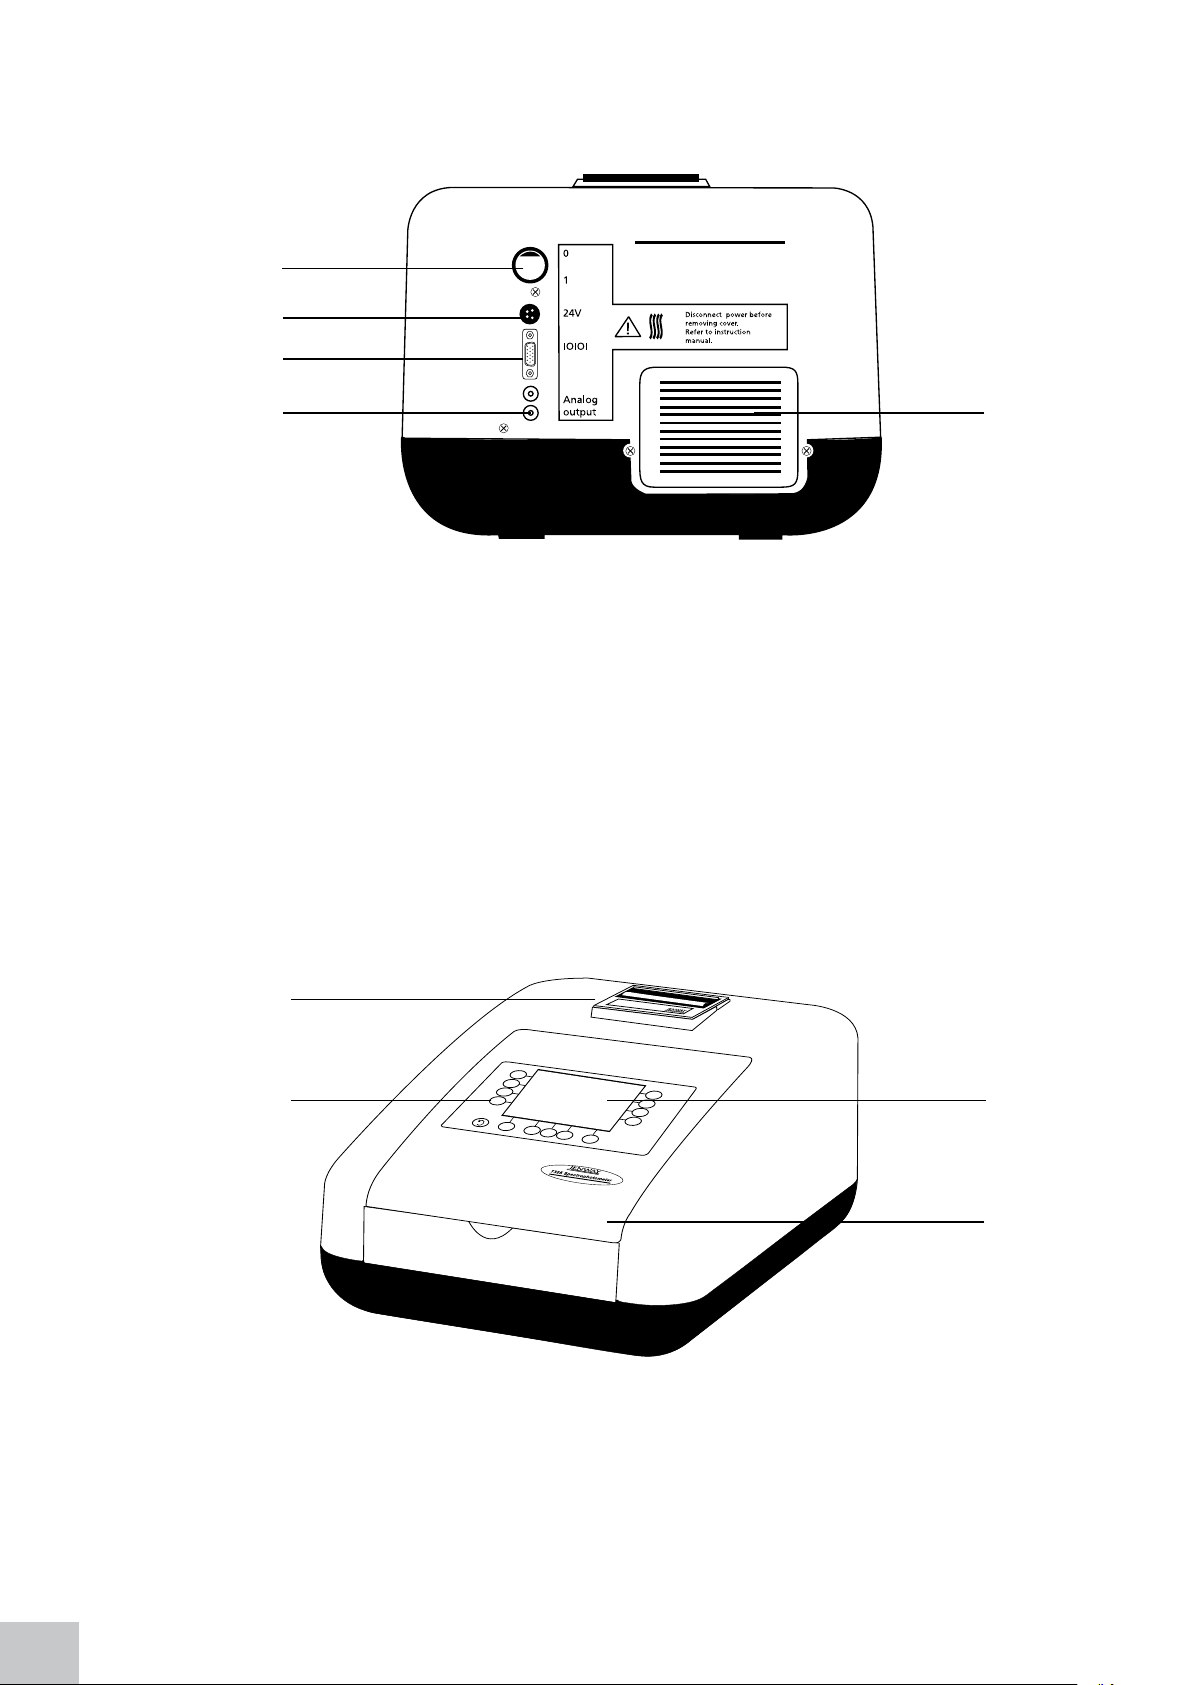
The image below shows the rear panel on the instrument:
2
3
4
5
1.
Lamp access panel Allows access to lamp when replacement is necessary
2. Power switch On/off switch for the unit
3. Power in socket Connection socket for power supply unit
4. RS232 serial port Connection to a PC or external serial printer
5. Output sockets Analogue output
2.6 FRONT PANEL
The image below shows the front panel of the instrument:
1
Fig. 2.5.1 – Rear Panel
1
2
Fig. 2.6.1 – Front Panel
1. Integral printer (optional accessory)
2. Keypad
3. Instrument lid
4. Display
4
3
12
SECTION 3 – Theory and Practice of Spectroscopy Measurements
t
3.1 THEORY OF SPECTROSCOPY MEASUREMENT
UV-visible spectroscopy is the measurement of the absorbance of light at a specific wavelength in a
sample. This is used to identify the presence and concentration of molecular entities within the sample.
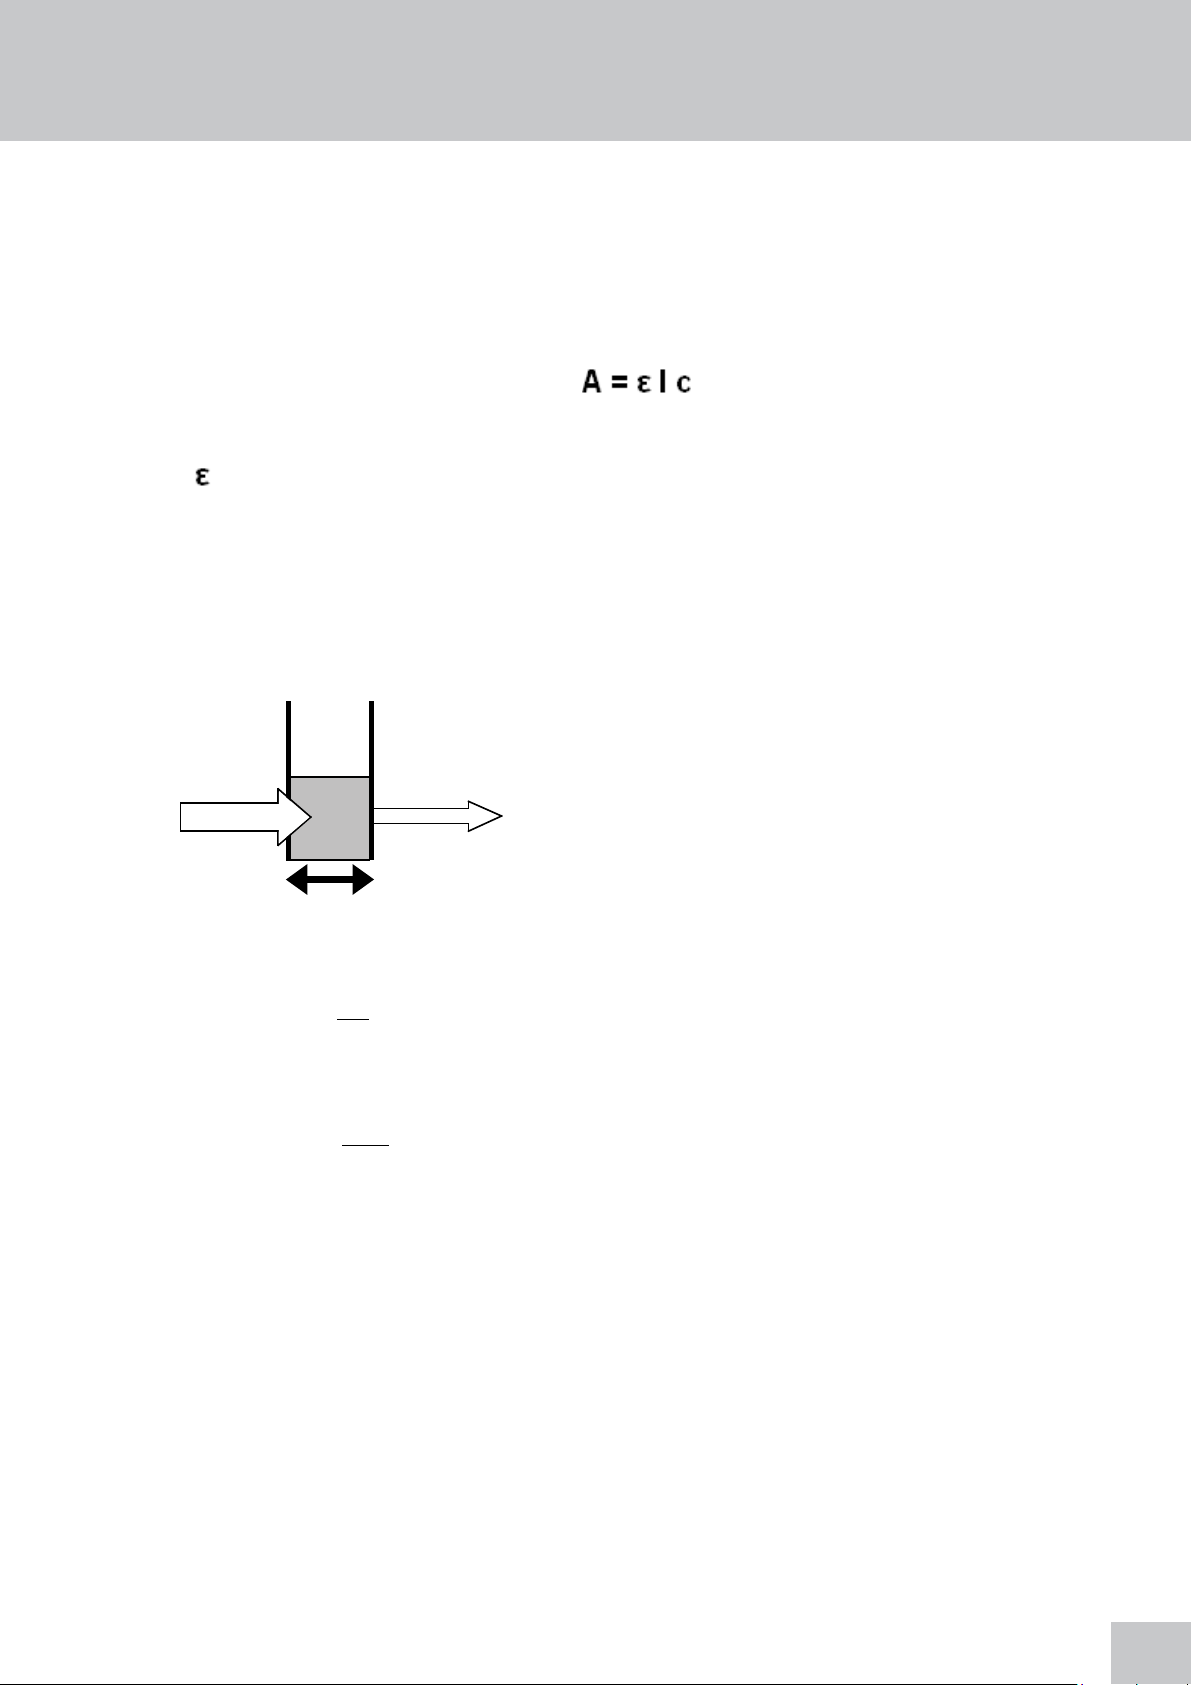
The Beer-Lambert law is used to relate the absorption of light to the properties of the sample through
which the light is travelling through. The Beer-Lambert law states that:
A is the absorbance
is the molar absorption coefficient (l mol
c is the concentration (mol l
-1
)
l is the path length (cm)
This law shows that absorbance is linear to concentration but this is only true for low concentrations. For
absorbance levels above 3 the concentration starts to move away from the linear relationship.
Transmittance is the proportion of the light which passes through the sample:
-1cm-1
)
I
o I
l
Therefore: T = I
t
Io
Absorbance is inversely related to transmittance:
A = log 1
T
3.2 SPECTROSCOPY MEASUREMENT
There are four main components of a spectrophotometer. These are a light source to emit a high and
constant amount of energy over the full wavelength range; a method for separating the light into
discreet wavelengths; a sample holder and a light detector.
Where:
Lo is the incident light
lt is the transmitted light
l is the path length
13
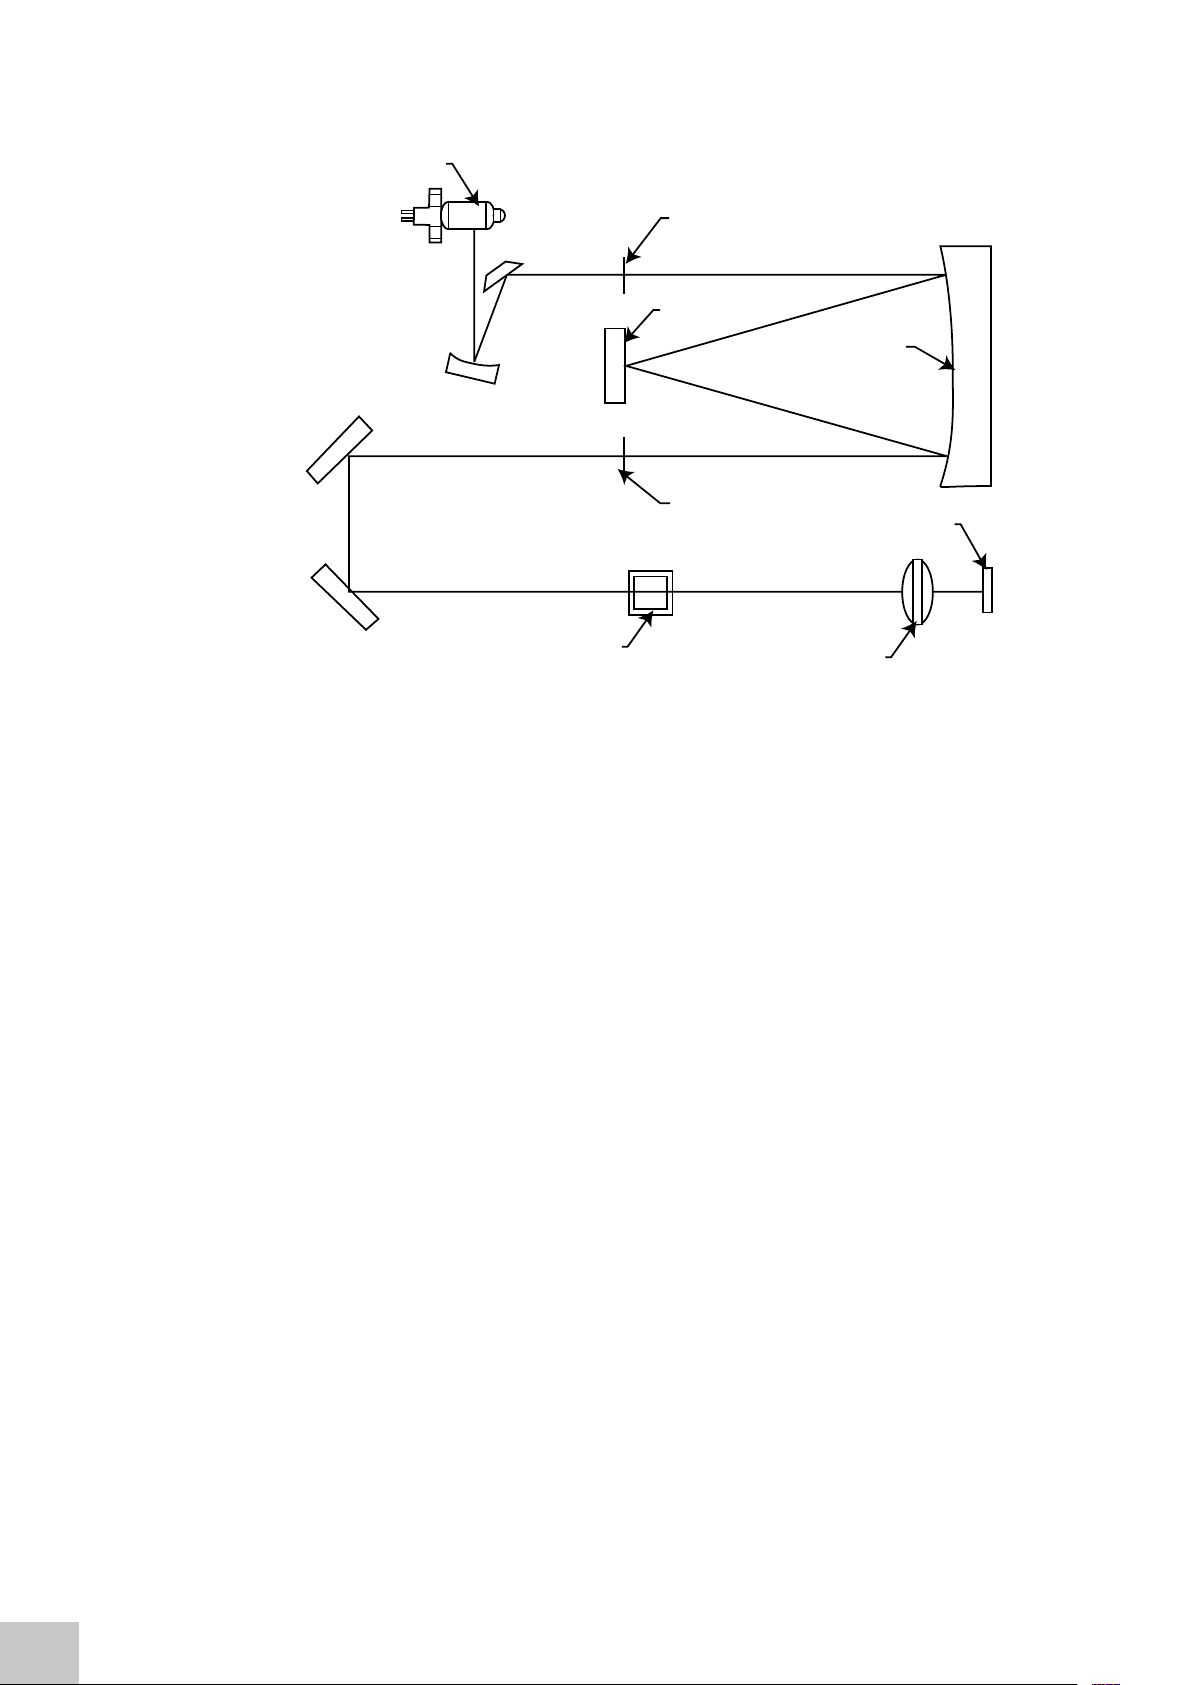
The optical layout of the 7300 and 7305 spectrophotometers is shown below:
Lamp
Entrance slit
Grating
Collimator mirror
Exit Slit
Detector
The light from the pre-focused tungsten halogen (7300) or pre-aligned xenon (7305) lamp is focused
onto the grating, with 1200 lines per millimeter, which separates the light into discreet wavelengths.
The diffracted spectrum of light then passes through a further slit and lens arrangement before passing
through the sample in the sample chamber from left to right. The light which is not absorbed by the
sample is transmitted through a collecting lens and onto the signal detector. The photo-diode detector
used is mounted directly onto the detector PCB and is used to calculate the % transmittance. The result
is displayed either as % transmittance or absorbance on the instrument display.
3.3 GOOD PRACTICE GUIDELINES
1. For optimum performance all spectrophotometers should be sited in a clean, dry, dust free atmosphere.
When in use ambient temperature and light levels should remain as constant as possible.
2. If required adherence to Standard Operating Procedures (SOP) and Good Laboratory Practice (GLP)
should be monitored with regular calibration checks and a suitable Quality Control (QC) programme.
3. The sample chamber lid must be fully closed during measurement and before any readings are
recorded or printed.
Sample
Collecting Lens
Figure 3.2.1 – Diagram of light path
14
4. The correct selection of sample containers is imperative for accurate and reproducible results:
a) Check that the material of the sample container is compatible with the wavelengths to be used
for measurement. In general glass can only be used down to 360nm or 320nm depending on quality.
Standard plastic cuvettes can be used down to 320nm. Special UV versions can be used down to
260nm. Below this level quartz cuvettes must be used.
b) Plastic disposable cuvettes should only be used ONCE.
c) Glass cuvettes should be thoroughly cleaned after use. Discard when scratches become evident on
optical surfaces.
d) Care should be taken when selecting semi-micro or micro cuvettes. The cuvette window on the

inner chamber (the area filled with sample) must be wider than the aperture in the sample holder or
light will reach the detector without passing through the sample. In this case, semi-micro or micro
cuvettes with self-screening black surrounds must be used or, alternative holders for these cuvettes
should be used.
e) Glass test tubes and other sample tubes should be used with care. Where possible, matched tubes
should be used and any index mark set to the correct position before measurements are made.
f) Ensure any sample containers used are compatible with the constituents of both the samples and
standards they are to hold. Plastic cuvettes are not compatible with organic solvents.
g) All sample containers must be handled with care; by the top, bottom and non-optical surfaces only.
Any finger marks evident must be removed by a suitable cleaning process.
h) Flow-through cuvettes must be selected with care and consideration for the sample type, sample
volume, pumping system, rinse, sample and waste handling to be used.
5. Samples and standards should not be stored in open cuvettes or sample containers as evaporation will
change the value and lead to staining of the walls which may be irreversible. If stored in stoppered and
sealed cuvettes, they should be filled with little or no air space and the values regularly checked against
a reference standard or quality control material.
6. Samples should be allowed to equilibrate to ambient temperature before measurement (unless a
suitable temperature controlled sample holder is in use). Temperature change during measurement may
cause air bubbles to form on the walls of the sample holder. This is a common cause of drift during
measurement.
7. In the preparation of samples and standards high grade borosilicate glass and AR grade chemicals
and reagents must be used. Good quality deionised water or other suitable solvents must be used for
dissolving or diluting samples, chemicals and reagents.
8. All measurements require calibration to a blank, for maximum accuracy this should be prepared
with care using the same deionised water or solvent used for dissolving or diluting the sample. Where
reagents are added to the sample to produce a colour proportional to its concentration a ‘sample based’
blank should be used. In this case the blank should consist of all reagents or chemicals to be used,
except the sample which will produce the colour to be measured.
9. Deviations from the Beer-Lambert Law may occur at high and low concentrations giving non-linear
response during sample concentration measurements. For all new methods a linear range should be
defined by the preparation of a calibration curve.
10. Cuvettes and sample holders must be filled to a minimum level which covers the light path. All
Jenway spectrophotometers have a beam height of 15mm.
11. The instrument must be calibrated to zero absorbance/100% transmittance prior to taking readings.
15
SECTION 4 – Instrument Setup
7300
09 : 02
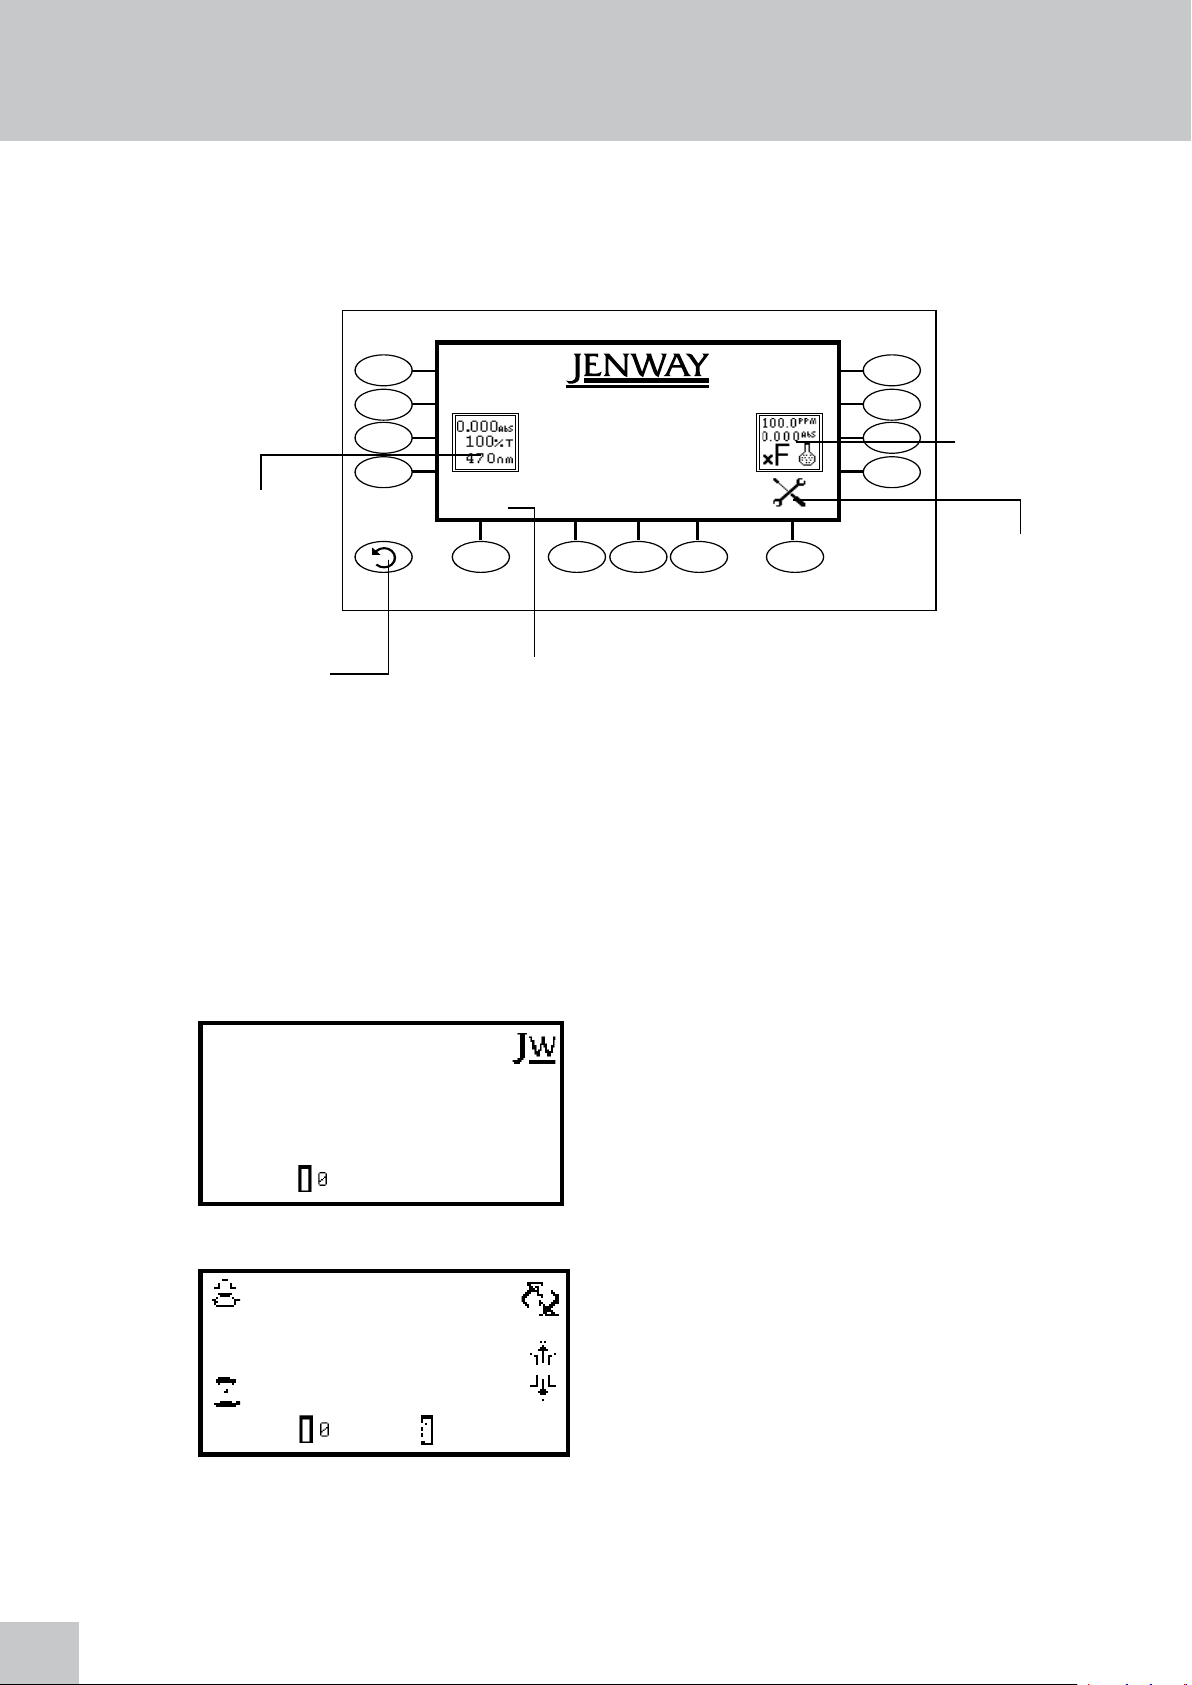
4.1 NAVIGATING AND SCREEN SETUP
The main menu screen is displayed below.
Photometrics
measurement
mode
Back key Time and date menu
Concentration
measurement
mode
Instrument
settings menu
Fig 4.1.1 – Home Screen
To navigate around the spectrophotometer screen press the soft keys adjacent to icons displayed on the
screen. In the main menu either of the two soft keys adjacent to the measurement mode icon can be
pressed to access the mode. There is a back key which returns to the previous menu without saving any
changes.
The main menu screen provides access to the measurement modes, the time and date menu and the
instrument settings menu. The measurement modes are photometrics and concentration. The instrument
settings menu enables access to the screen contrast and lamp save menus.
All of the measurement modes open initially into a
ABS
0.000
400
%T
nm
ABS
100.0
09 : 02
Minimal Operating Menu
0.000
400
%T
nm
100.0
09 : 02
Expanded Operating Menu
(Photometrics measurement mode)
minimal operating menu. This menu allows calibration
and simple readings to be taken without changing any
measurement parameters. Pressing the key adjacent to
the JW icon opens the expanded operating menu.
This menu enables changes to measurement parameters
and settings to be made. Depending on the mode, the
measurement parameters can be accessed through the
settings menu which is displayed in the top right hand
corner of the screen. The only mode where this function
is not available is the photometrics mode; instead a
toggle icon is displayed which is used to change the
primary and secondary displays.
16
 Loading...