

Page 1
Communication Protocol
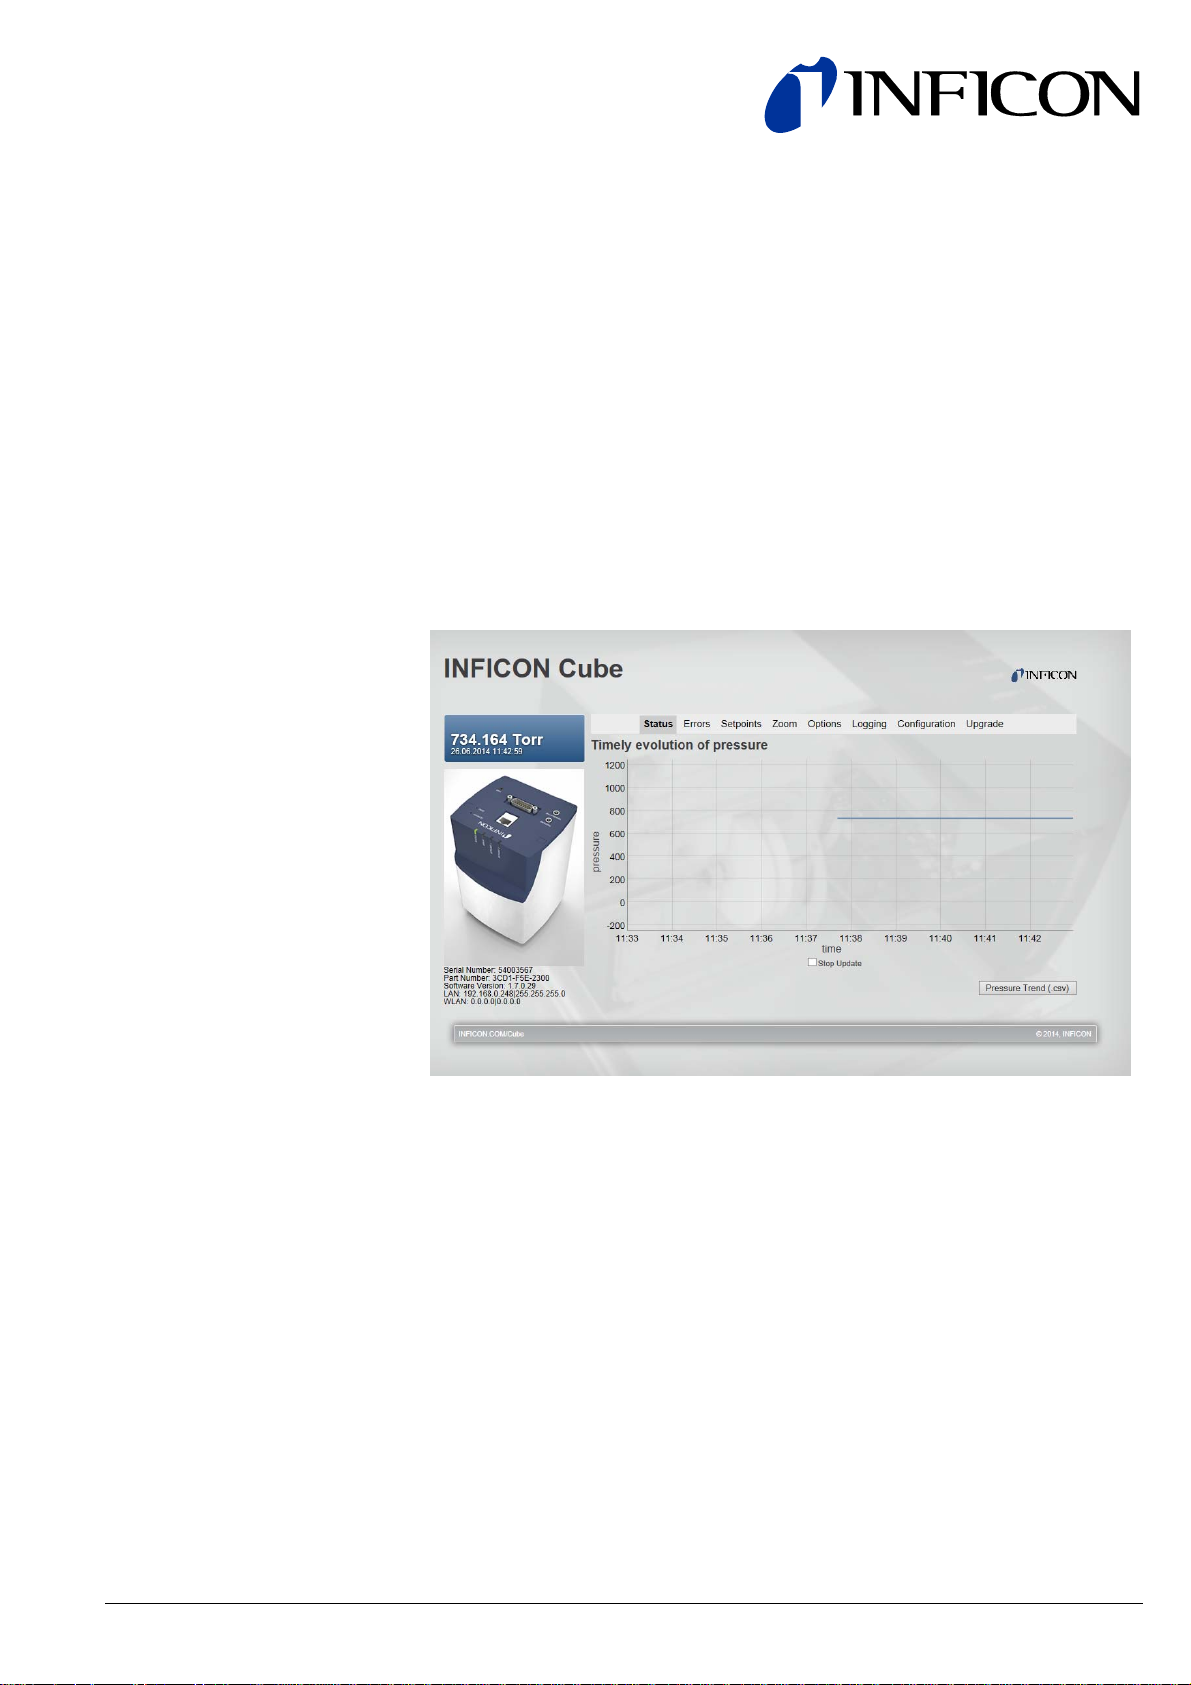
Web Interface
for Capacitance Diaphragm Gauge
Cube CDGsci
tira92e1-a (2014-07) 1
Page 2
General Information
Validity
This document contains instructions for operating INFICON Cube using the built-in
web interface.
For safety information, specifications and operation instructions of the
vacuum gauge refer to the appropriate Operating Manual (→ [1]).
The web pages may only be viewed and operated correctly with the
following internet browsers:
• Firefox > version 20
• IE ≥ version 10.
This document applies to products with part numbers:
3CS1-311-230 0
Flange
Measurement range
1
DN 16 ISO-KF
3
DN 16 CF-R
E
8VCR female
3
(F.S.)
6
9
C
F
0.1
1
10
100
1000
The part number (PN) can be taken from the product nameplate.
If not indicated otherwise in the legends, the illustrations in this document correspond to Cube CDGsci gauges with the DN 16 ISO-KF vacuum connection. They
apply to gauges with other vacuum connections by analogy.
We reserve the right to make technical changes without prior notice.
2
tira92e1-a (2014-07) CDGsci Web Interface.cp
Page 3

Contents
General Information 2
Validity 2
Operation 4
1
1.1 Overview 4
1.2 Tab <Status> 4
1.3 Tab <Errors> 6
1.4 Tab <Setpoints> 6
1.5 Tab <Zoom> 7
1.6 Tab <Options> 7
1.7 Tab <Logging> 9
1.8 Tab <Configuration> 10
1.9 Tab <Upgrade> 11
2 Literature 12
For cross-references within this document, the symbol (→ XY) is used, for cross-
references to further documents, listed under literature, the symbol (→ [Z]).
tira92e1-a (2014-07) CDGsci Web Interface.cp 3
Page 4
1 Operation
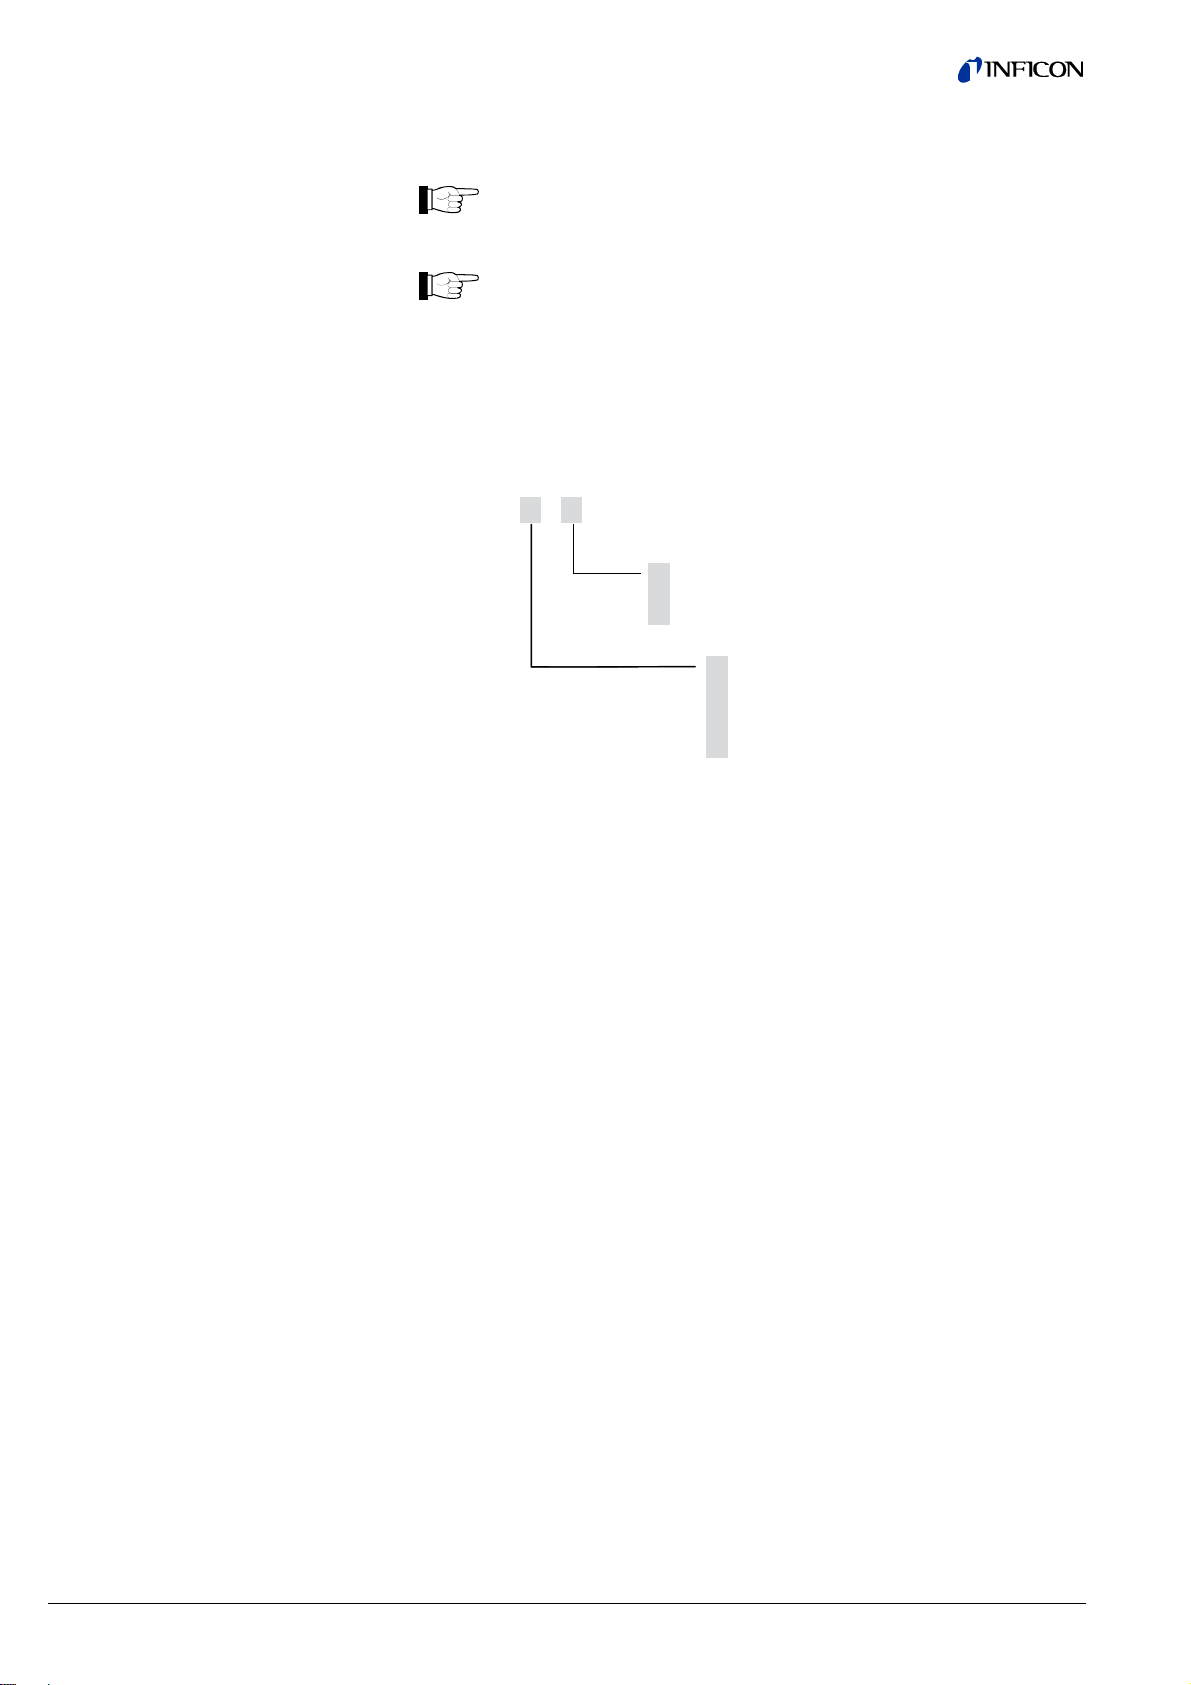
1.1 Overview
Pressure
Last refresh of the
measurement
Information field
Tabs
Reading
(depends on tab)
Link to the Inficon
Cube web pages
1.2 Tab <Status>
The information field displays the following:
• Serial number of Cube
• Part number of Cube configuration
• Software version
• LAN settings
• WLAN settings.
• Pressure characteristic of the last 15 minutes, ~2 s/point
• Stop / start or refreshing the measurement value
• Measurement point with time / pressure reading
• Zooming in graph (pressure or time axis)
For scientific measurements, the status graph data is of less value. In
those cases it is advisable, to use a digital interface or the high
resolution analogue output.
4
tira92e1-a (2014-07) CDGsci Web Interface.cp
Page 5
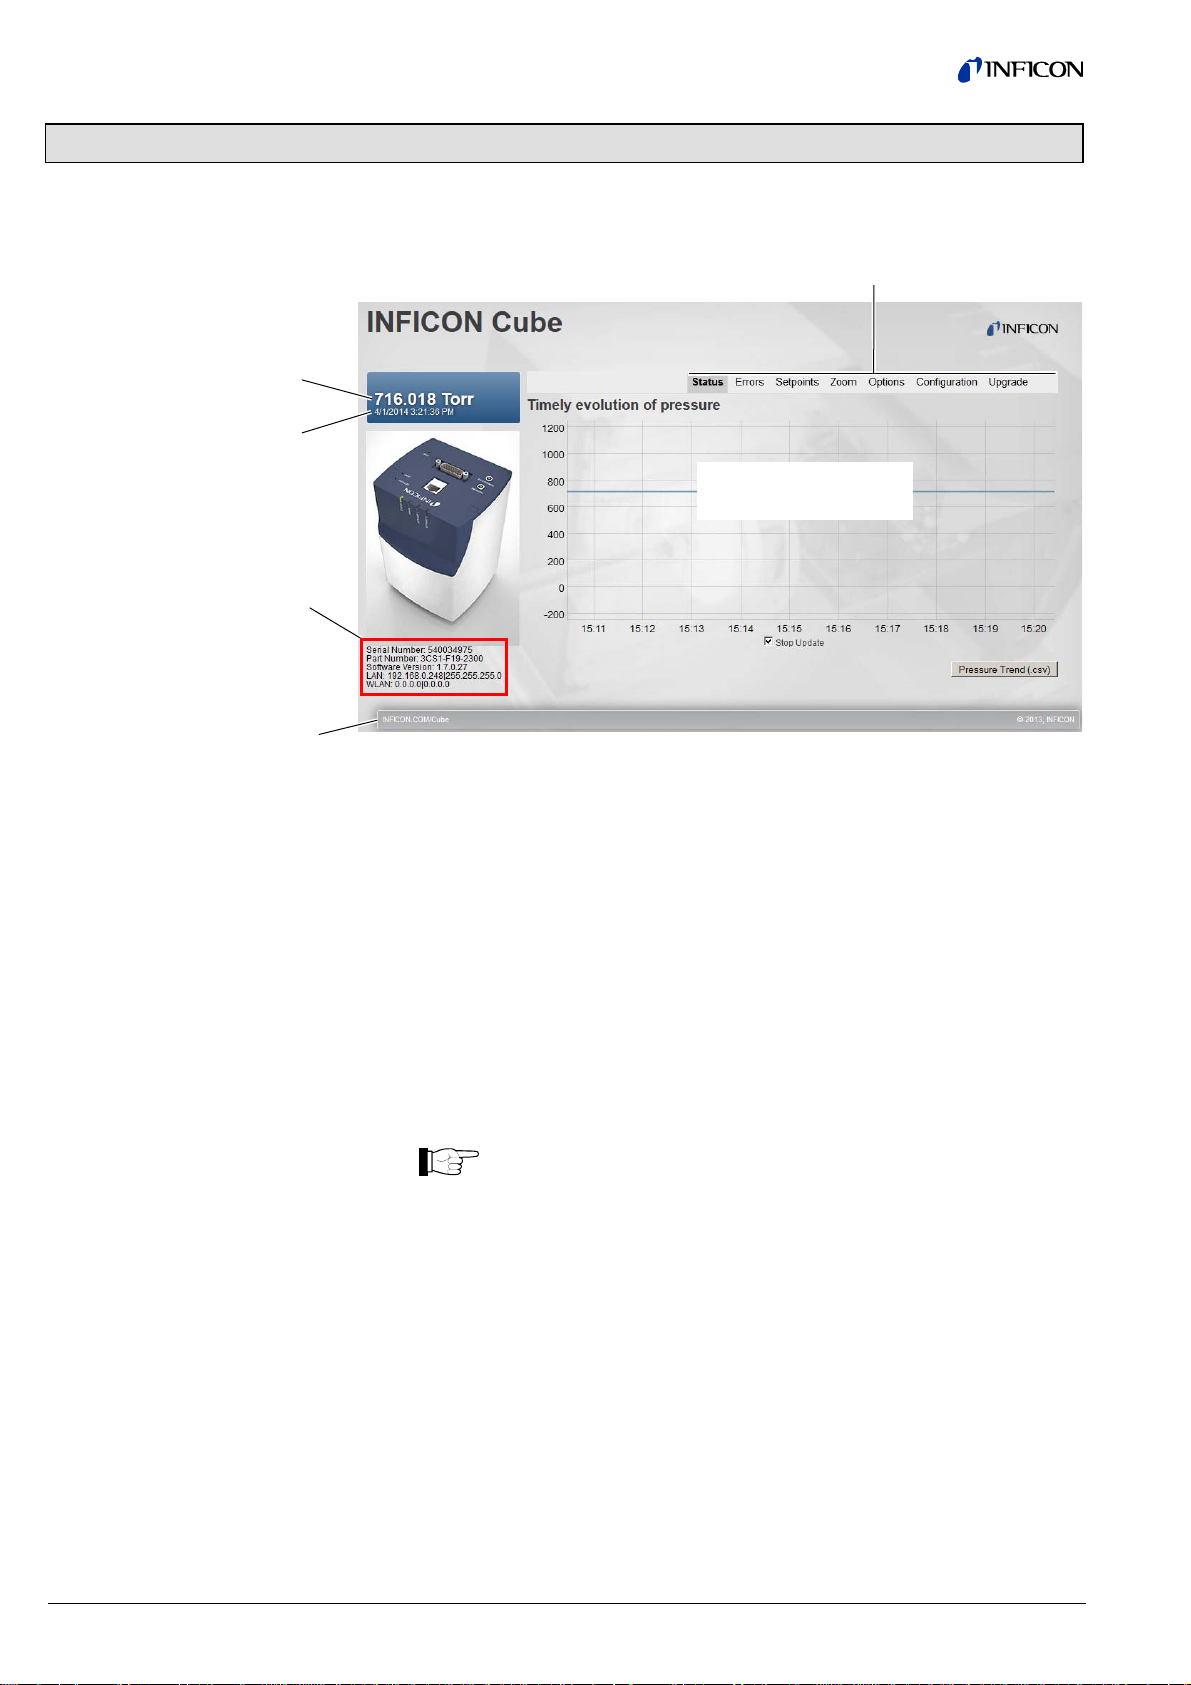
Stop / start refreshing the
measurement value
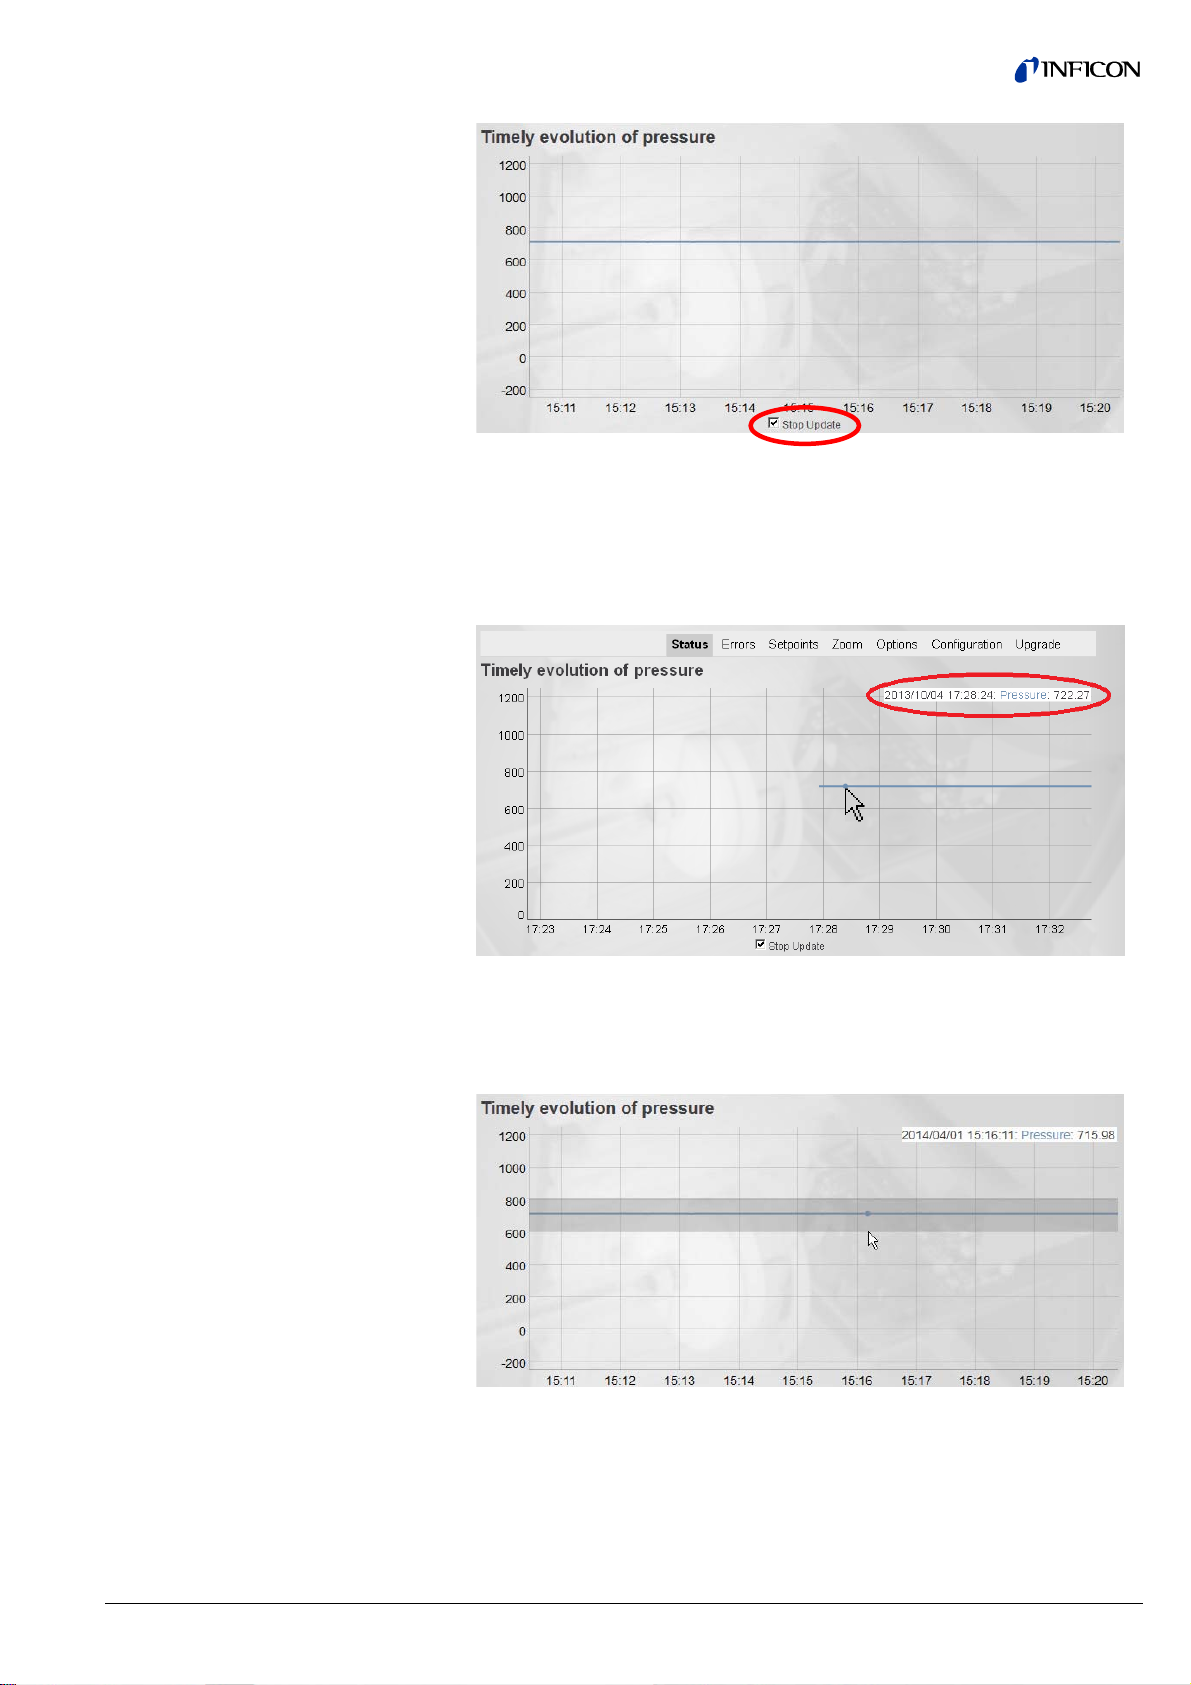
Measurement point with time /
pressure reading
Checking the <Stop Update> box stops the data refresh. Any zoom will remain in
effect. Unchecking the box will resume normal refresh. The graph is automatically
updated to display all data.
Move the mouse on the measurement line, the time and pressure values at this
point (indicated by a circle) are shown.
Zooming in the graph vertically
(pressure)
Click and hold with the left mouse button in the selected pressure range and drag
the mouse vertically (on pressure axes) to the desired size.
The vertical zoom can be reset by clicking <Reset vertical zoom>.
tira92e1-a (2014-07) CDGsci Web Interface.cp 5
Page 6

Zooming in the graph
horizontally (time)
Saving pressure trend
1.3 Tab <Errors>
Click and hold with the left mouse button in the selected time range and drag the
mouse horizontally (on time axes) to the desired size.
The horizontal zoom can be reset by double-clicking into the graph.
The pressure trend of the displayed data can be saved as a CSV file by clicking on
the <Pressure Trend (csv)> button. A dialog box opens and the file can be saved
locally.
• Displaying errors
• Possible causes and correction measures
If an error occurs, <Errors> changes to red color.
1.4 Tab <Setpoints>
• Setting the setpoint functions (hysteresis: 1% of the threshold value,
(Setting the values takes approx. 3 s)
6
tira92e1-a (2014-07) CDGsci Web Interface.cp
Page 7

1.5 Tab <Zoom>
• Zoom of high resolution analog output. An arbitrary range can be zoomed.
The lower limit of the selected pressure range is displayed at the analog output with
0.0 V, the upper limit with 10.0 V. The values between these limits are
automatically scaled.
First enter the high mark, then the low mark before setting the zoom to On.
Activating/deactivating the zoom by selecting On or Off. Setting the values takes
approx. 3 s.
1.6 Tab <Options>
This tab offers a wide range of configuration possibilities for the signal flow inside
the Cube.
• Change conversion time capacity/voltage
• Switch temperature compensation on/off
• Switch pressure compensation on/off
• Switch ATM compensation on/off
• Change filter settings
• Change output signal of Temp/ATM
• Change pressure unit
Standard settings for the Options page are:
• C-V Conversion: 62 ms
• T-Comp: on
• P-Comp: on
• ATM-Comp: on
• Adaptive Filter: Slow
• 2. Stage Filter: None
• Low-Res DAC: SL TempOut
• Unit: Torr
tira92e1-a (2014-07) CDGsci Web Interface.cp 7
Page 8

Conversion time capacity /
voltage
Higher value: Less noise, but slower reaction to
pressure steps.
Temperature compensation
Pressure compensation
ATM Compensation
Activate/deactivate compensation for temperature
fluctuations by selecting On or Off.
Switching this option off will deactivate the
temperature compensation of Cube. The user
has to take care for the correct treatment of the
pressure data.
In an unstable environment, it is recommended
to leave this option at On.
Activate/deactivate compensation for pressure fluctuations
by selecting On or Off.
Switching this option off will deactivate the
linearization of Cube. The output pressure will
resemble a hyperbolic function due to the
nature of the capacitive measurement. The user
has to take care for the correct treatment of the
pressure data.
Activate/deactivate compensation for atmospheric
pressure fluctuations by selecting On or Off.
Adaptive Filter
Switching this option off will deactivate the
atmospheric pressure compensation of Cube.
The user has to take care for the correct treatment of the pressure data.
In an unstable environment, it is recommended
to leave this option at On.
Fast: The Cube CDGsci responds more quickly to
changes in pressure. As a result, noise will be
larger.
Slow: The Cube CDGsci responds slower to changes
in pressure. As a result, noise will be smaller.
Dynamic: Depending on the measuring conditions, the
Cube CDGsci selects dynamically <Fast> or
<Slow>.
8
tira92e1-a (2014-07) CDGsci Web Interface.cp
Page 9

Second Stage Filter
Resolution
Pressure unit
In situation of very long static measurements, the data can
be further smoothed by applying a secondary stage filter. If
a Second Stage Filter is applied, the CDC and the
Adaptive Filter settings are adapted accordingly.
Moving Exp AVG: Exponential moving average.
Savitzky-Golay: Symmetrical filter of 4
n
= nR = 5.
L
th
order with
Loess: Locally weighted scattered data smoothing.
When a Second Stage Filter is applied, the
settings for the C-V Conversion and Adaptive
Filter are fixed to 62ms and Slow respectively.
They cannot be changed as long as a Second
Stage Filter is active.
This setting changes the signal output at <TEMP / ATM>:
Either current ATM pressure or temperature of the gauge
can be output.
For scaling of temperature and pressure see operating
manual (→ [1]).
1.7 Tab <Logging>
Changes pressure unit of the measurement values,
threshold values, etc.
• Continuous logging of data up to 24h, 1s/point
• Download of data possible, even during logging.
<Start> starts the logging, <Stop> ends the logging. The start time/date and the
running number of measurement points are displayed. <Download (.csv)> opens a
download dialogue.
tira92e1-a (2014-07) CDGsci Web Interface.cp 9
Page 10

1.8 Tab <Configuration>
• Settings for LAN and WLAN
• Backup and restore of user settings
• Factory Reset
LAN Settings
WLAN Settings
The IP address / Subnet of the LAN interface can be changed. Clicking <Apply>
will open a confirmation window. The gauge will reboot after clicking on <OK>.
Cube can be connected to a wireless access point using DHCP. Ad hoc
connections are not possible. With <Scan>, Cube searches for accessible networks. Selecting the proper network and inserting the password will connect to this
network after clicking <Connect>.
Connecting to the access point may take up to 20s. Thereafter, the IP address and
Subnet mask are displayed.
Backup / restore settings
User settings can be backed up and restored using the <Backup Settings> and
<Restore Settings> buttons. Up to 10 sets can be stored and differ by number.
Reset Factory
Clicking on this button will reload the Cube gauge factory settings. All settings,
configurations and options set by the user will be deleted.
10
tira92e1-a (2014-07) CDGsci Web Interface.cp
Page 11

1.9 Tab <Upgrade>
• Firmware upgrade
The <Browse…> button opens a file dialog in which the upgrade file, e.g.
"SilverlineFactory-Vxxxxx.zip" can be selected. The new firmware is transmitted to
the gauge by clicking <Submit>. An automatic reset of the gauge is performed, if
the upgrade was successfully. Updating the firmware takes approx. 3min.
The new firmware version is displayed on the left side in the information section
under the Cube image.
tira92e1-a (2014-07) CDGsci Web Interface.cp 11
Page 12

2 Literature
[1] www.inficon.com
Operating Manual
Cube CDGsci
tina88d1 (German)
tina88e1 (English)
INFICON AG, LI–9496 Balzers, Liechtenstein
12
tira92e1-a (2014-07) CDGsci Web Interface.cp
Page 13

Notes
tira92e1-a (2014-07) CDGsci Web Interface.cp 13
Page 14

LI–9496 Balzers
Liechtenstein
Tel +423 / 388 3111
Fax +423 / 388 3700
Original: English tira92e1-a (2014-07) reachus@inficon.com
t i ra92e1- a
www.inficon.com
 Loading...