

Page 1

HP StoreEver Interface Manager and Command View for Tape Libraries
Version 3.7.00 User Guide
Abstract
This guide provides information about installing the Command View for Tape Libraries (Command View TL) software, and using
the Command View TL graphical user interface (GUI) and Interface Manager command line interface (CLI). This book is intended
for system administrators and IT personnel responsible for operating and maintaining an Enterprise Storage Library (ESL) or
Enterprise Modular Library (EML).
HP Part Number: 344841-026
Published: April 2014
Edition: 24
Page 2

© Copyright 2003, 2014 Hewlett-Packard Development Company, L.P.
Confidential computer software. Valid license from HP required for possession, use or copying. Consistent with FAR 12.211 and 12.212, Commercial
Computer Software, Computer Software Documentation, and Technical Data for Commercial Items are licensed to the U.S. Government under
vendor's standard commercial license.
The information contained herein is subject to change without notice. The only warranties for HP products and services are set forth in the express
warranty statements accompanying such products and services. Nothing herein should be construed as constituting an additional warranty. HP shall
not be liable for technical or editorial errors or omissions contained herein.
Acknowledgements
Intel, Itanium, Pentium, Intel Inside, and the Intel Inside logo are trademarks or registered trademarks of Intel Corporation or its subsidiaries in the
United States and other countries.
Microsoft, Microsoft Excel, Windows, Windows XP, and Windows NT are U.S. registered trademarks of Microsoft Corporation.
Adobe is trademark of Adobe Systems Incorporated in the United States and/or other countries.
Java is a US trademark of Sun Microsystems, Inc.
UNIX is a registered trademark of The Open Group.
Page 3

Contents
1 Introduction.............................................................................................10
New features in Command View TL 3.7.00................................................................................10
SNIA compliance...................................................................................................................10
User interfaces.......................................................................................................................11
Network configuration overview...............................................................................................11
External features overview........................................................................................................14
2 Command View TL GUI.............................................................................15
Primary management station....................................................................................................15
Prerequisites...........................................................................................................................15
Installing Command View TL....................................................................................................18
Starting Command View TL......................................................................................................21
Testing the Insight Remote Support............................................................................................23
Managing libraries.................................................................................................................24
Navigating Command View TL.................................................................................................25
Device numbering conventions.................................................................................................26
Initial configuration steps.........................................................................................................26
Adding and removing libraries.................................................................................................27
Adding libraries manually...................................................................................................27
Editing a library name........................................................................................................27
Removing libraries.............................................................................................................27
Changing the e-mail settings....................................................................................................28
Configuring e-mail alerts.........................................................................................................29
Managing license keys............................................................................................................31
Adding a license key..........................................................................................................32
Viewing the Management Station.............................................................................................33
Changing the network settings of the management station............................................................33
Changing management station passwords.................................................................................34
Recovering a password...........................................................................................................35
Changing the library settings...................................................................................................35
Changing the network settings of the Interface Manager card......................................................36
RDC Configuration..................................................................................................................37
Verifying connectivity..............................................................................................................37
Getting information about an EML or ESL E-Series library.............................................................38
Viewing the health summary....................................................................................................38
Viewing the physical connections..............................................................................................38
Viewing the status of components.............................................................................................39
Viewing the alert log...............................................................................................................39
Changing the Interface Manager mode.....................................................................................41
Changing the connection properties of the interface controllers.....................................................41
Managing the interface controllers............................................................................................42
Replacing an interface controller..........................................................................................42
Clearing a WWN mismatch...............................................................................................43
Using TapeAssure...................................................................................................................44
Configuring standalone drives for TapeAssure........................................................................45
Configuring MSL libraries for TapeAssure..............................................................................45
Viewing TapeAssure information..........................................................................................45
Viewing the dashboard..................................................................................................46
Viewing the Health tab..............................................................................................46
Viewing the Library tab.............................................................................................48
Library TapeAssure views...............................................................................................51
Usage tabular view.......................................................................................................53
Contents 3
Page 4

Empty slots per library...................................................................................................53
Moves per library..........................................................................................................56
Sorting and filtering.......................................................................................................59
Action menu drop down list............................................................................................59
Application bar............................................................................................................59
Viewing drive health......................................................................................................59
Viewing Drive Health and Life.........................................................................................61
Write Health tab......................................................................................................61
Life tab....................................................................................................................62
Viewing drive performance.............................................................................................63
Viewing drive utilization.................................................................................................65
Choosing a sample time................................................................................................66
Viewing drive performance and utilization history..............................................................67
Drive Performance tab...............................................................................................68
Drive Utilization tab..................................................................................................69
Utilization Analysis tab..............................................................................................71
Viewing the Performance Advisor graph...........................................................................74
Viewing the Collection Status..........................................................................................75
Viewing drive performance and utilization graph...............................................................76
Viewing detailed LTO drive information............................................................................77
Using the Tapes Content panel........................................................................................87
Viewing tape health......................................................................................................97
Viewing Tape Health and Life.........................................................................................98
Write Health tab......................................................................................................98
Life tab....................................................................................................................99
Viewing tape utilization................................................................................................100
Viewing the tape utilization and performance history.......................................................101
Tape Capacity tab..................................................................................................101
Tape Unloads tab...................................................................................................102
Tape Performance tab.............................................................................................103
Launching the Newly Added Tapes graph......................................................................105
Searching for a specific tape........................................................................................107
Viewing information about the Cleaning Tapes................................................................107
Exporting Library Data to CSV via TapeAssure................................................................108
Exporting TapeAssure panels as PDF files.......................................................................109
Scheduling a Library Data Export via TapeAssure............................................................112
Analyzing TapeAssure data from CSV files using the TapeAssure Analysis Template.............112
Backing up the TapeAssure database.................................................................................113
Restoring a TapeAssure database file.................................................................................114
Saving or copying a database backup file..........................................................................115
Using data verification..........................................................................................................115
Configuring the libraries to use data verification...................................................................116
Creating the data verification partition................................................................................116
Deleting the data verification partition............................................................................118
Viewing the Data Verification Control Panel.........................................................................118
Starting and stopping the data verification service...........................................................119
Setting the default verification type................................................................................119
Deleting the data verification test logs............................................................................119
Viewing the detailed data verification information for each library..........................................119
Viewing tapes that are present in the data verification partition.........................................121
Viewing tapes that are currently under data verification....................................................122
Viewing tapes that are queued for data verification.........................................................122
Viewing drives that are present in the data verification partition.........................................123
Adding, removing, and changing tapes from the queue...................................................125
Configuring the data verification policy...............................................................................125
4 Contents
Page 5

Selecting the tapes for verification......................................................................................125
Setting up data verification email notifications.....................................................................126
Disabling data verification email notification...................................................................127
Viewing the test results for Data Verification.........................................................................127
Viewing the drive assessment results...................................................................................129
Working LTO4 and later tape drives........................................................................................130
Adding an LTO4 and later tape drive to a library.................................................................130
Replacing an LTO2 or LTO3 tape drive with an LTO4 or later tape drive..................................131
Changing the connection properties of LTO4 and later tape drives.........................................131
Using SNMP alerts...............................................................................................................132
Adding an SNMP trap......................................................................................................132
Editing an SNMP trap......................................................................................................133
Removing an SNMP trap...................................................................................................133
Saving the configuration of the library.....................................................................................134
Saving the current configuration.........................................................................................134
Restoring a configuration..................................................................................................134
Viewing a saved configuration...........................................................................................135
Rebooting components..........................................................................................................136
Rebooting a single component...........................................................................................136
Rebooting the Interface Manager and all controllers.............................................................136
Rebooting all components that require a reboot...................................................................136
Moving tape cartridges.........................................................................................................136
Updating the firmware with the Firmware Update wizard...........................................................137
Updating the firmware from version I1xx to version I2xx........................................................140
Restoring factory defaults.......................................................................................................141
Restoring factory defaults for one component.......................................................................141
Restoring factory defaults for all components.......................................................................141
Using factory overrides..........................................................................................................142
Disabling factory overrides....................................................................................................143
3 Advanced features in the GUI..................................................................144
Using license keys.................................................................................................................144
Configuring host HBA access with HP Secure Manager.............................................................144
About Access Control Groups (ACG)..................................................................................145
Creating an Access Control Group.....................................................................................145
Editing an Access Control Group.......................................................................................149
Removing an Access Control Group...................................................................................152
Synchronizing host access settings......................................................................................152
Viewing the device map....................................................................................................152
Partitioning a library.............................................................................................................153
Adding a partition...........................................................................................................153
Removing a partition........................................................................................................154
Removing all partitions.....................................................................................................155
Extending a partition........................................................................................................155
Upgrading capacity..............................................................................................................156
Capacity upgrades for ESL E-Series libraries........................................................................156
Capacity upgrades for EML E-Series libraries.......................................................................157
Enabling capacity upgrades..............................................................................................157
Encrypting data with the HP StorageWorks Secure Key Manager (SKM) or HP Enterprise Secure Key
Manager (ESKM)..................................................................................................................158
Enrolling libraries with the SKM or ESKM............................................................................160
Selecting the SKM or ESKM as the key manager..................................................................160
Un-enrolling SKM or ESKM and reverting to the backup application as the key manager...........162
Changing the login on an SKM or ESKM............................................................................164
Changing the tier information for an SKM or ESKM..............................................................166
Contents 5
Page 6

Adding or deleting addresses or hostnames for SKM or ESKM appliances..........................166
Adding a tier to the Key Manager Configuration.............................................................168
Deleting a tier from the Key Manager Configuration........................................................168
Updating certificates or the certificate authority for an SKM or ESKM.....................................168
Changing library partitions after initial SKM or ESKM setup..................................................169
Verifying connectivity from the library to SKM or ESKM.........................................................169
Transferring current HP StorageWorks Secure Key Manager (SKM) enrollment settings to an HP
Enterprise Secure Key Manager (ESKM)..............................................................................170
Using support tickets.............................................................................................................172
Generating a support ticket...............................................................................................172
Viewing a support ticket....................................................................................................175
Saving a management station log......................................................................................176
Saving a support ticket.....................................................................................................177
Sending a support ticket by e-mail.....................................................................................177
Removing a support ticket.................................................................................................179
4 Command View TL CLI............................................................................180
Accessing the CLI.................................................................................................................180
Starting a serial session....................................................................................................180
Starting a Telnet session....................................................................................................181
Telnetting through the LAN...........................................................................................181
Telnetting through the cascade port...............................................................................181
Command syntax structure.....................................................................................................182
Using command sequences...............................................................................................182
Abbreviating commands...................................................................................................183
Device numbering conventions...........................................................................................183
Navigating the CLI...........................................................................................................184
Interface Manager mode.......................................................................................................184
Common CLI functions...........................................................................................................185
Configuring a library........................................................................................................185
Configuring the FC interface controllers..............................................................................185
Monitoring device status...................................................................................................186
Updating the firmware with the CLI.....................................................................................186
Generating support tickets with the CLI...............................................................................187
Using HP Secure Manager functions...................................................................................188
Accessing Basic Secure Manager through the CLI............................................................188
5 CLI Command Reference.........................................................................190
clear station.........................................................................................................................191
create host...........................................................................................................................191
download drive....................................................................................................................192
download interface...............................................................................................................193
download library..................................................................................................................194
download mgmt...................................................................................................................194
map host.............................................................................................................................195
move media.........................................................................................................................196
reboot interface....................................................................................................................196
reboot library.......................................................................................................................197
reboot mgmt........................................................................................................................197
remove host.........................................................................................................................197
replace interface..................................................................................................................198
restore interface defaults........................................................................................................199
restore system config.............................................................................................................200
restore system defaults...........................................................................................................201
save drive lttsupportticket.......................................................................................................202
save interface lttsupportticket..................................................................................................202
6 Contents
Page 7

save library lttsupportticket.....................................................................................................202
save ltt................................................................................................................................203
save mgmt lttsupportticket......................................................................................................203
save system config................................................................................................................204
set drive hostport mode.........................................................................................................204
set drive hostport speed.........................................................................................................205
set host name.......................................................................................................................205
set inet ftp...........................................................................................................................206
set inet telnet........................................................................................................................206
set interface beacon..............................................................................................................206
set interface clearwwnmismatch..............................................................................................207
set interface hostport alpa......................................................................................................207
set interface hostport connection.............................................................................................208
set interface hostport mode....................................................................................................208
set interface hostport speed....................................................................................................208
set mgmt clock.....................................................................................................................209
set mgmt ntp........................................................................................................................210
set mgmt password...............................................................................................................210
set mgmt timezone................................................................................................................210
set mgmt wwnstate...............................................................................................................211
set mode.............................................................................................................................212
set net v6 dhcpv6.................................................................................................................212
set net v6 ipaddress..............................................................................................................212
set net v6 ipversion...............................................................................................................213
set net v6 manual.................................................................................................................214
set net v6 stateless................................................................................................................214
set network config ................................................................................................................215
set network dhcp..................................................................................................................216
set network ipaddress............................................................................................................216
set network snmpcommunity...................................................................................................216
set network snmptrap............................................................................................................217
set ssh hostkeys....................................................................................................................218
set supportticket disable.........................................................................................................218
set supportticket enable.........................................................................................................218
set system contact assetnumber...............................................................................................219
set system contact email.........................................................................................................219
set system contact location.....................................................................................................219
set system contact name........................................................................................................219
set system contact pager........................................................................................................220
set system contact phone.......................................................................................................220
set system name...................................................................................................................220
show drive access.................................................................................................................221
show drive hostport...............................................................................................................221
show drive info.....................................................................................................................222
show drive interface..............................................................................................................222
show drive productid.............................................................................................................223
show drive revision...............................................................................................................223
show drive serialnumber........................................................................................................224
show drive status..................................................................................................................224
show drive type....................................................................................................................225
show firmware available........................................................................................................225
show firmware revisions.........................................................................................................226
show host access..................................................................................................................226
show host info......................................................................................................................227
show host name...................................................................................................................227
Contents 7
Page 8

show host sparselunmap........................................................................................................227
show inet.............................................................................................................................227
show interface access...........................................................................................................228
show interface beacon..........................................................................................................228
show interface hostport alpa..................................................................................................229
show interface hostport connection.........................................................................................229
show interface hostport mode.................................................................................................229
show interface hostport sid....................................................................................................230
show interface hostport speed................................................................................................230
show interface info...............................................................................................................231
show interface name.............................................................................................................233
show interface revision..........................................................................................................233
show interface status.............................................................................................................233
show interface wwninfo.........................................................................................................234
show library access..............................................................................................................234
show library info..................................................................................................................234
show library interface...........................................................................................................235
show library name................................................................................................................235
show library productid..........................................................................................................235
show library revision.............................................................................................................236
show library sensors.............................................................................................................236
show library serialnumber......................................................................................................237
show library status................................................................................................................237
show library topology...........................................................................................................237
show license........................................................................................................................238
show media.........................................................................................................................238
show mgmt clock..................................................................................................................239
show mgmt info....................................................................................................................239
show mgmt log detail............................................................................................................239
show mgmt log event............................................................................................................240
show mgmt revision..............................................................................................................240
show mgmt status.................................................................................................................240
show mgmt timezone............................................................................................................240
show mgmt wwnstate............................................................................................................241
show mode..........................................................................................................................241
show network info................................................................................................................241
show network dhcp...............................................................................................................242
show network ipaddress........................................................................................................242
show network snmpcommunity...............................................................................................242
show partition......................................................................................................................243
show robotics status..............................................................................................................243
show ssh hostkeys.................................................................................................................243
show station.........................................................................................................................244
show supportticket cache.......................................................................................................244
show supportticket policy.......................................................................................................244
show supportticket statistics....................................................................................................245
show system contact assetnumber...........................................................................................245
show system contact email.....................................................................................................245
show system contact location..................................................................................................245
show system contact name.....................................................................................................246
show system contact pager....................................................................................................246
show system contact phone....................................................................................................246
show system info..................................................................................................................246
show system name................................................................................................................247
show system status................................................................................................................247
8 Contents
Page 9

synch secmgr.......................................................................................................................247
unmap host..........................................................................................................................247
6 Troubleshooting......................................................................................249
LED diagnostic codes............................................................................................................249
Common issues....................................................................................................................249
ESL9000 Series issues......................................................................................................250
ESL E-Series issues............................................................................................................252
EML E-Series issues...........................................................................................................254
ESL G3 issues..................................................................................................................256
MSL issues......................................................................................................................256
ESKM enrollment issues....................................................................................................256
7 Support and other resources....................................................................259
Contacting HP......................................................................................................................259
Related information...............................................................................................................259
Related documentation.....................................................................................................259
HP websites....................................................................................................................259
HP tape cartridges......................................................................................................260
Product warranties.......................................................................................................260
Subscription services....................................................................................................260
Typographic conventions.......................................................................................................260
Updated regulatory compliance and recycling notices...............................................................261
A ALPA matrix...........................................................................................262
B New features in previous versions of Command View TL..............................263
New features in Command View TL 3.6.00..............................................................................263
New features in Command View TL 3.5.00..............................................................................263
New features in Command View TL 3.1.00 and Interface Manager firmware version I274..............264
New features in Command View TL 3.0.1 and Interface Manager firmware version I273................264
New features in Command View TL 3.0 and Interface Manager firmware version I272..................264
New features in Command View TL 2.8...................................................................................265
New features in Command View TL 2.7...................................................................................265
New features in Command View TL 2.6...................................................................................265
New features in Command View TL 2.5...................................................................................265
New features in Command View TL 2.4...................................................................................266
New features in Command View TL 2.3.0.1 and 2.3.02.............................................................266
New features in Command View TL 2.3...................................................................................266
New features in Command View TL 2.2...................................................................................266
New features in Command View TL 2.0...................................................................................267
Index.......................................................................................................269
Contents 9
Page 10

1 Introduction
The HP StorageWorks Interface Manager for tape libraries is a management card designed to
consolidate and simplify the management of HP StorageWorks ESL9000 Series,1ESL E-Series,
and EML E-Series tape libraries. The Interface Manager card provides the following features:
• Simple, unified, graphical setup and configuration of Fibre Channel (FC) interface controllers.
• Remote management of FC interface controllers via a Web-based GUI or command line
interface.
• SAN-related diagnostics for key library components, such as interface controllers, drives, and
robotics.
• Additional advanced SAN security and management features are available via licensing.
These features improve security, performance, reliability, and ease of control.
New features in Command View TL 3.7.00
• Administrator can manually select tapes in a separate media verification partition without
interfering with host applications.
• Configurable policies permit periodic scans based on a user-chosen time interval.
• Support for Data verification and Drive Assessment in ESL G3 libraries for LTO5 and LTO6
drives and corresponding supported tapes.
• Manage media verification, configuration, and usage though CVTL while ensuring data is
secure.
• Licensing enforcement and management for data verification license for ESL G3 libraries.
• MSL6480 license management via CVTL.
• User notifications of degraded tapes.
• Reports of data verification and drive assessment results.
• Library TapeAssure enhancements including the Library Dashboard with Library TapeAssure
graphs.
• Support Remote Data Collection (RDC) for ESL G3, MSL6480, and MSL G3 libraries. SMI-S
will implement the TapeAssure profile which can be collected by IRS RDC, and you can
configure collection days for the RDC from the CVTL interface.
SNIA compliance
The Storage Management Initiative (SMI) was created by the Storage Networking Industry
Association (SNIA) to develop and standardize interoperable storage management technologies
and aggressively promote them to the storage, networking, and end user communities.
For more information about SNIA and the SMI, see the following website: http://www.snia.org/
smi/home.
The HP StoreEver Command View TL Provider follows the Storage Management Initiative
Specification (SMI-S) and provides an interface for SMI-S compliant applications to manage HP
StoreEver tape libraries. See the HP StoreEver Command View for Tape Libraries Software SMI-S
Provider installation instructions at http://www.hp.com/support/cvtl for installation instructions.
1. ESL9000 libraries can be added, selected, and managed from the Command View TL 2.0 Launcher, but new features
in versions 2.0 and newer are not available on ESL9000.
10 Introduction
Page 11

NOTE: If installing Command View TL on the same management station as Command View EVA
v10.2, special steps must be taken. For full instructions, see the HP StoreEver Command View for
Tape Libraries Software SMI-S Provider installation instructions at http://www.hp.com/support/
cvtl.
User interfaces
Four different user interfaces (UIs) can be used to control the Interface Manager card. These UIs
are provided by the Interface Manager card or by Command View TL. This chapter explains the
purpose and use of each UI. The UIs are as follows:
NOTE: The Interface Manager card is only used with EML and ESL E-Series tape libraries.
• Serial—Uses a command line interface (CLI) and connects directly to the Interface Manager
card through an RS232 serial interface rather than through the LAN.
• Telnet—Uses the same CLI as the serial interface, but requires the IP address of the Interface
Manager card to initiate the session. This IP address can be set through the Interface Manager
card serial interface or cascade port or, on ESL E-Series libraries, through the library Operator
Control Panel (OCP). The advantage of using Telnet over the serial interface is that users can
Telnet from any client machine that is on the LAN; a separate serial connection is not needed.
You can disable Telnet (see set inet telnet (page 206)).
NOTE: If you use Telnet to change the IP address of the Interface Manager card or library,
you must log in to a new Telnet session with the new IP address.
• SSH—This protocol uses the same CLI as the Telnet and serial interfaces, but over a more
secure channel. Different SSH client applications are available for various operating systems.
When connected via SSH, use it in the exact way you would use Telnet.
• Command View TL—Is a browser-based graphical user interface (GUI). This is the preferred
UI for controlling the Interface Manager card because it provides the most functionality and
should be used in most circumstances. From any client on the LAN, you can use a browser to
access Command View TL, which is hosted on a management station. For more information
on using Command View TL, see Command View TL GUI (page 15).
You can have multiple sessions open at the same time (serial, Telnet, SSH, or Command View TL).
If a write operation is in progress in one session, subsequent write operations for that library from
other sessions will be denied.
Network configuration overview
With the EML E-Series tape library, the external LAN communicates directly to the Interface Manager
card using the card's network IP address. The Interface Manager card processes requests and
relays information to the FC interface controllers.
ESL E-Series libraries contain a private LAN internal to the library. The library cabinet controller
provides a bridge between the external LAN and the library internal LAN and Interface Manager
card.
ESL E-Series and EML E-Series tape libraries with LTO4 or later tape drives also contain an internal
network switch to connect the LTO4 and later tape drives to the Interface Manager or library
internal LAN.
(page 12) and (page 13) show how the different UIs communicate with the Interface Manager
card in the various libraries.
User interfaces 11
Page 12
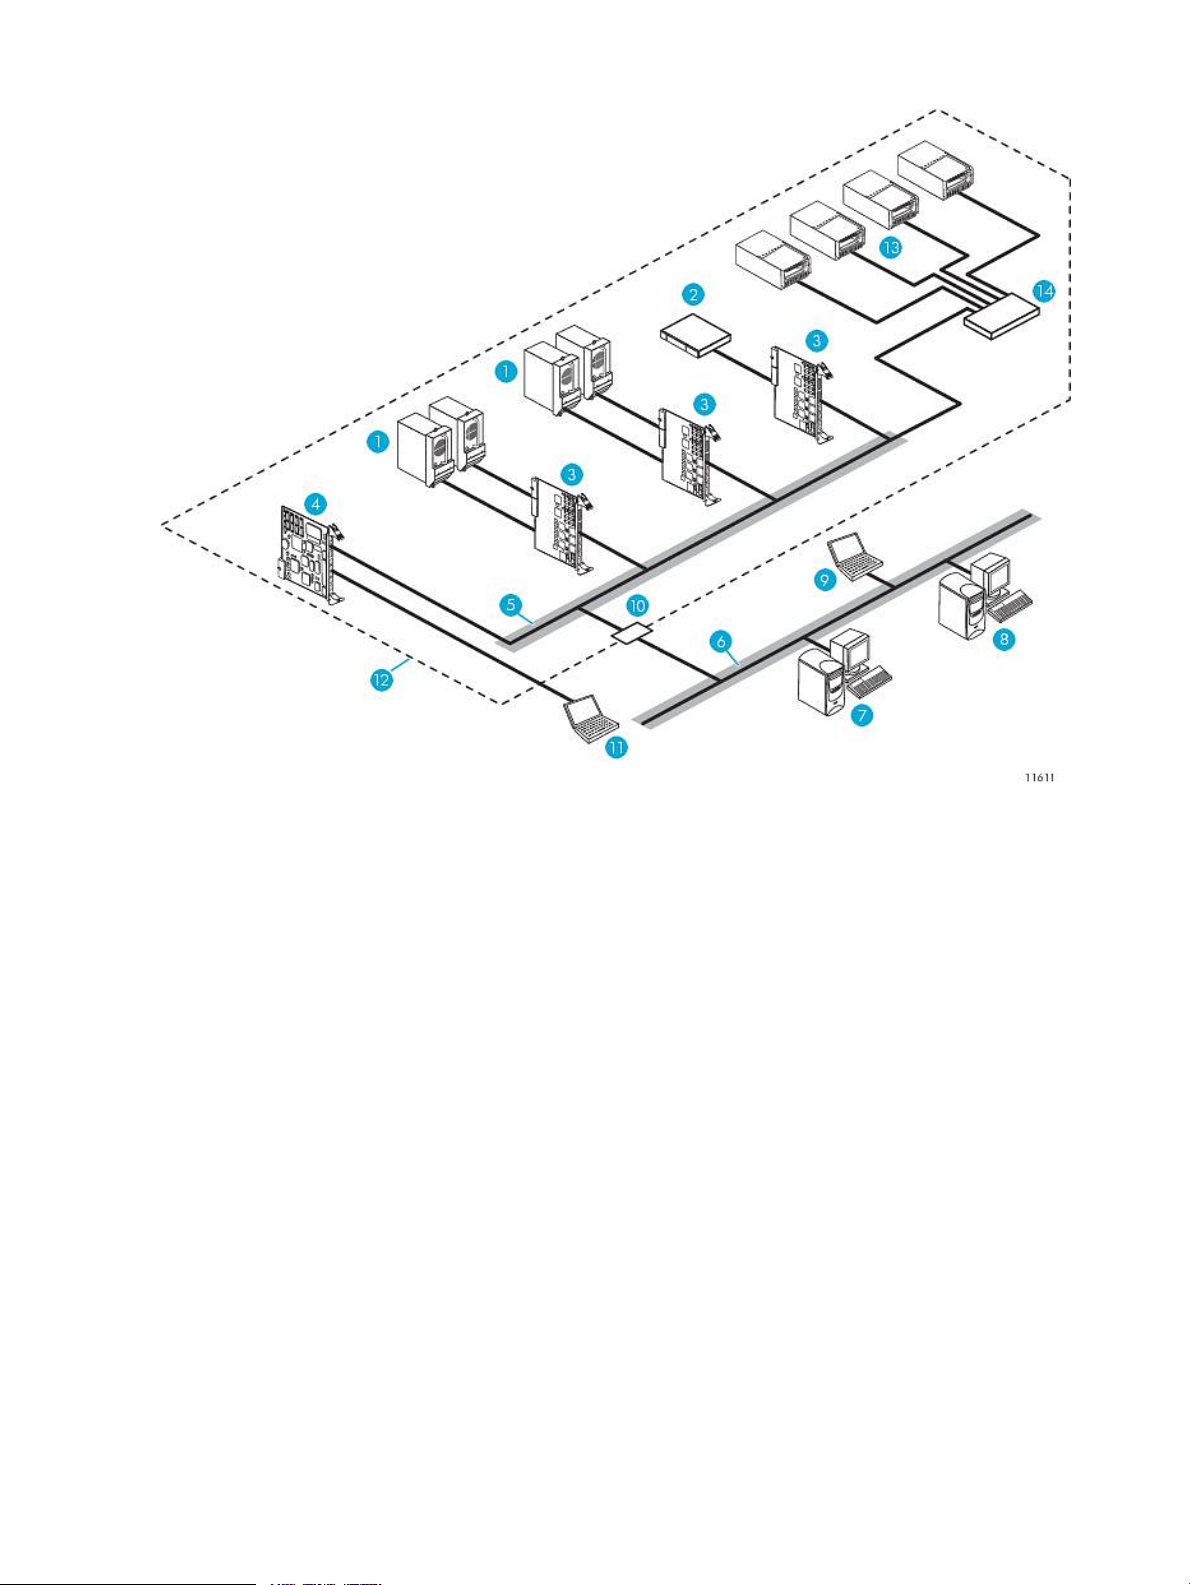
Figure 1 Network configuration for ESL E-Series tape libraries
7. Management station with Command View TL
2. Robot1. SDLT, LTO1, LTO2, or LTO3 tape drives
4. Interface Manager card3. FC interface controllers
6. External network5. Internal network
8. Remote web browser connected to management station
via HTTP
10. Library Cabinet Controller9. Telnet connection
12. Library boundary11. Serial CLI via RS-232 connection
14. Internal network switch (LTO4 or later libraries only)13. LTO4 or later tape drives
12 Introduction
Page 13
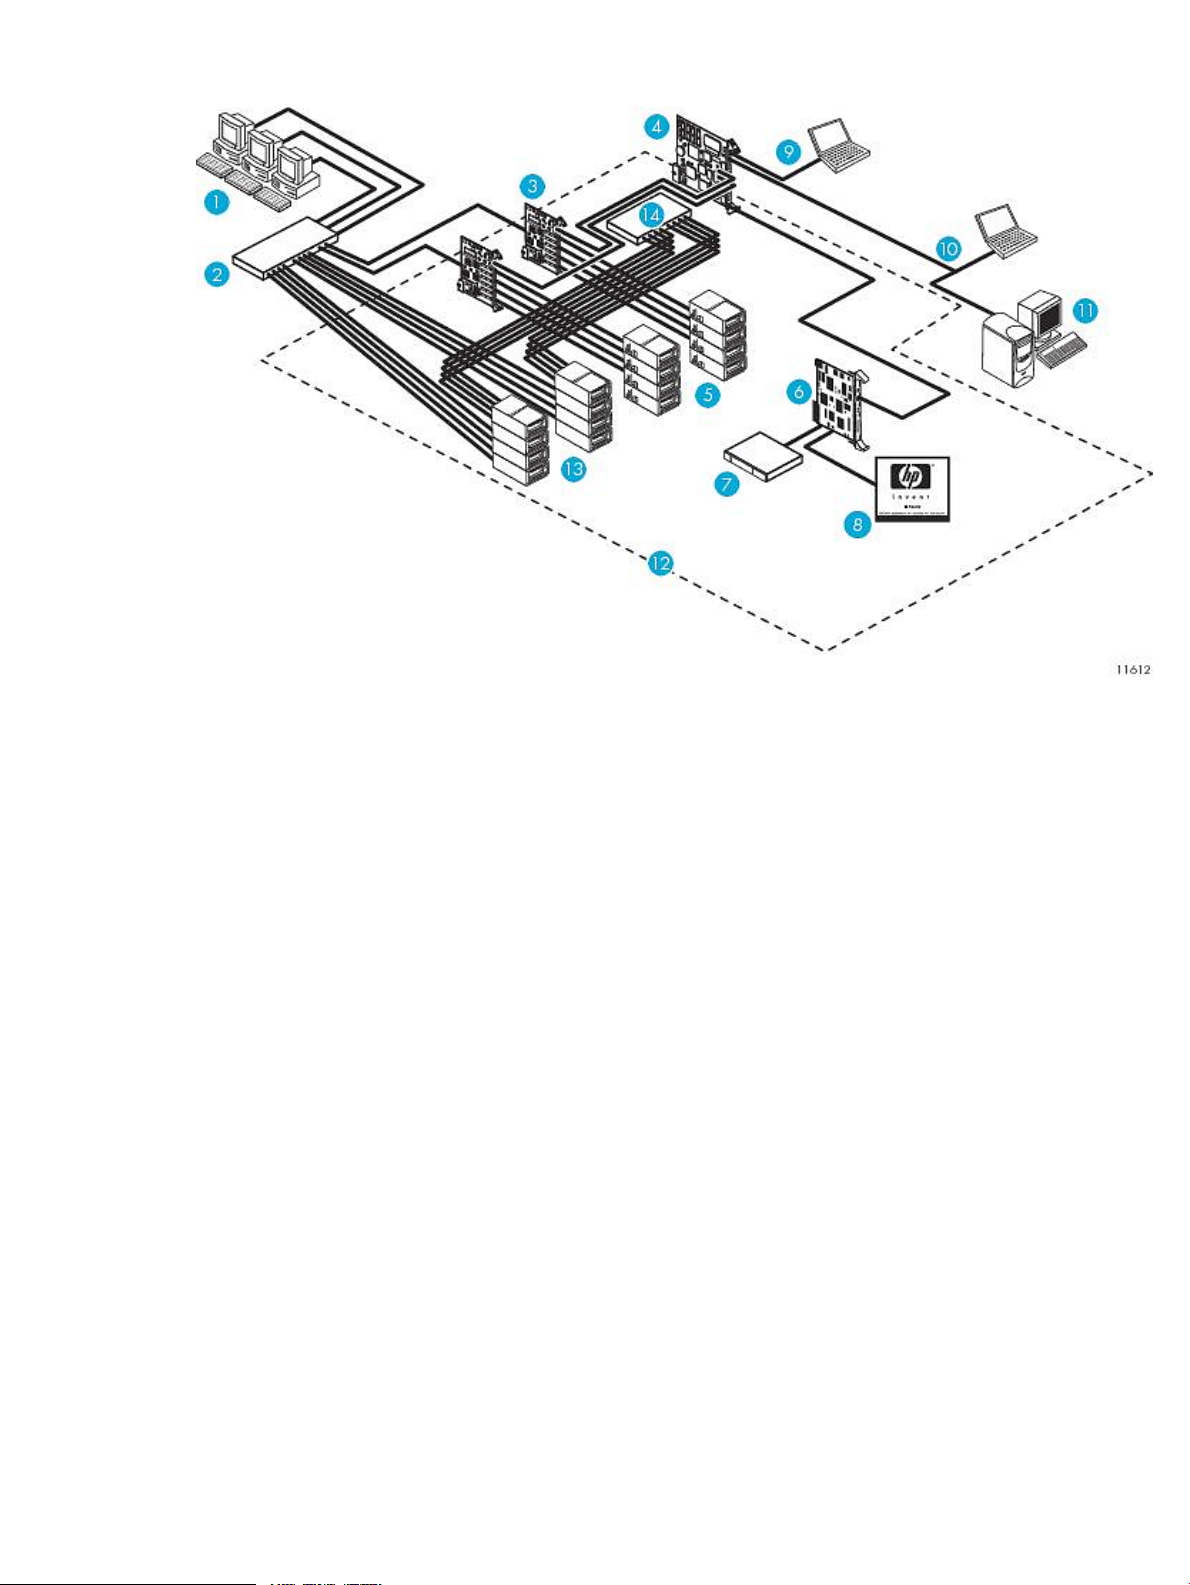
Figure 2 Network configuration for EML E-Series tape libraries
2. FC switch1. Hosts
4. Interface Manager card3. FC interface controllers (up to four)
6. Library robotics controller5. LTO2 and LTO3 tape drives
8. Operator control panel7. Robot
10. Telnet connection9. Serial connection
12. Library boundary11. Management station
14. Internal network switch (LTO4 and LTO5 libraries only)13. LTO4 and later tape drives
Network configuration overview 13
Page 14
External features overview
You can have either of the following Interface Manager cards. The two cards are functionally
equivalent if the 342213-001 or 393531-001 has a 256 MByte RAM. If a 128 MByte RAM is
installed the TapeAssure features will be disabled.
NOTE: Interface Manager firmware version I272 and later requires 256MB RAM on the Interface
Manager board to maintain a consistent connection with Command View TL.
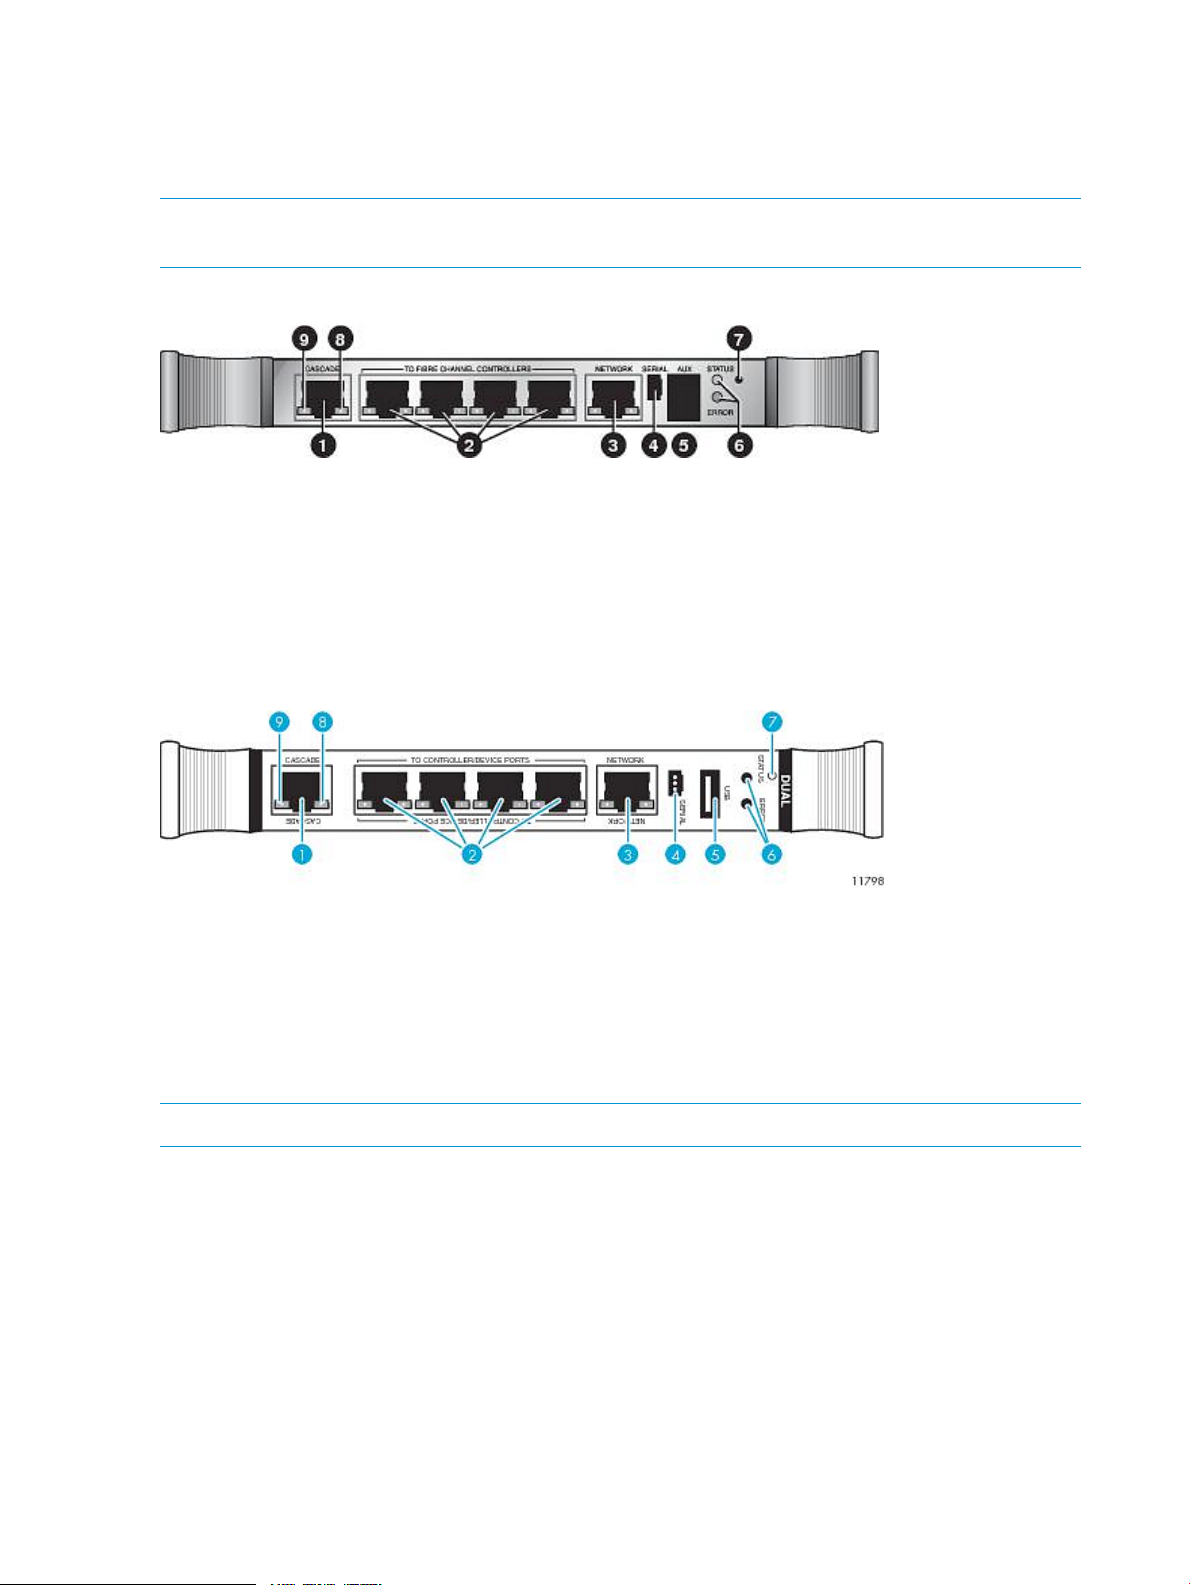
Figure 3 Interface Manager card faceplate—342213–001 or 393531–001
9. Green link activity LED
2. Private Ethernet ports to FC interface controllers1. Cascade in back-end Ethernet port
4. Serial port3. Front-end Ethernet port (to LAN)
6. Board status LEDs5. Auxiliary RJ-11 serial connector or USB port (not used)
8. Green link speed LED7. Reset button
Figure 4 Interface Manager card faceplate—480240-001
2. Private Ethernet ports to FC interface controllers1. Cascade in back-end Ethernet port
4. Serial port3. Front-end Ethernet port (to LAN)
6. Board status LEDs5. Auxiliary RJ-11 serial connector or USB port (not used)
8. Green link speed LED7. Reset button
9. Green link activity LED
NOTE: For an explanation of the various LED states, see Troubleshooting (page 249).
14 Introduction
Page 15

2 Command View TL GUI
HP StoreEver Command View TL software provides a browser-based GUI for remote management
and monitoring of your Interface Manager card through a LAN. Command View TL is the preferred
user interface for controlling the Interface Manager card because it provides the most functionality.
In conjunction with the Interface Manager card, Command View TL provides the following:
• Configuration and management of the Interface Manager card and FC interface controllers
• Management of the entire library system
• Hardware inventory and identity information
• Status information for connected hardware
• Error reporting and comprehensive error logs
• Firmware management
• License management
• Access to TapeAssure.
IMPORTANT: While Command View TL is not required to manage ESL G3 and MSL6480 libraries,
it is required for TapeAssure functionality. Command View TL can list ESL G3 and MSL6480 in
the launcher panel, show the status of the library, and launch the ESL G3 and MSL6480 GUI to
a separate browser. Other ESL G3 and MSL6480 features are managed directly through the library
GUI. For more information on ESL G3 tape libraries, see HP Enterprise Systems Libraries (ESL) G3
Tape Library User Guide available from http://www.hp.com/support/eslg3.
Command View TL is installed on the management station and communicates with the Interface
Manager card through the LAN. The management station processes information from the Interface
Manager card and hosts the Command View TL GUI. You can access Command View TL, either
from the management station directly or through any client on the LAN, by using a browser-based
GUI interface. Multiple Command View TL GUI clients can be open simultaneously across the LAN,
and multiple libraries can be managed through the Command View TL software.
NOTE: Prior to version 1.5, Command View for Tape Libraries software was called Command
View ESL.
Primary management station
The primary management station is the first management station to manage a library. The primary
management station is the only management station that collects and stores TapeAssure data. For
best performance, the primary management station should be in the same physical location and
on the same IP subnet as the libraries it manages.
Prerequisites
Management station minimum system
For environments with fewer than 10 tape libraries, Command View TL requires a management
station (server) with a minimum of:
• 1.6-GHz CPU, 2-GB RAM
• 2 GB of free disk space for installation
• 10/100 Base-T network card (static IP address recommended)
• Command View TL 3.7.00 installation support matrix:
Primary management station 15
Page 16

NOTE: Command View TL software is only fully compatible with English-language versions
of Windows.
3.7.00Command View TL Operating System
YesMicrosoft Windows Server 2003 SP2 (32/64 bit)
YesMicrosoft Windows Server 2008 SP2 (32/64 bit)
YesMicrosoft Windows Server 2008 R2 SP1 (64 bit)
YesMicrosoft Windows Server 2012 Datacenter (64 bit)
NOTE: On the above listed Microsoft Windows Operating Systems (64–bit), Command
View TL will run as a 32–bit application.
• Compatible with VMWare ESX 5.0 and 5.1
Management station recommended system
For environments with up to 20 tape libraries:
• 3.0-GHz CPU or greater, Dual Core, 4-GB RAM
For environments with 20 to 70 tape libraries:
• 3.0-GHz CPU or greater, Dual Core, 16-GB RAM
For environments with more than 70 tape libraries, or more than 900 tape drives (total), multiple
management stations will be required.
Browser minimum requirements
• Microsoft Internet Explorer v8, v9, and v10
• Mozilla Firefox v15.0.1 or higher
• Google Chrome v24 or higher
• Adobe Flash Player 10.3 or greater
NOTE: On Windows Server 2012 Internet Explorer 10 has an embedded version of Adobe
Flash Player. Ensure that the most recent Windows updates are installed using the Windows
update feature in the Control Panel.
Windows Server 2012 configuration to use Adobe Flash applications:
1. Ensure that the most recent Windows updates are installed using the Windows update
feature in the Control Panel.
2. Configuring Windows Server 2012:
a. Click Server Manager in the bottom left corner of the screen.
b. In the Server Manager dialog box, click Add Roles and Features Wizard.
c. Continue with Next with the default options selected and provide specific options in
the wizard.
d. In the Features dialog box choose User Interfaces and Infrastructure (installed). This
feature has three sub-features. Select the Desktop Experience check box.
e. Click Next and the Install.
16 Command View TL GUI
Page 17

3. Configure Internet Explorer:
a. Select Tools→Compatibility View Settings.
b. Enter the website address, then click Add.
c. Verify the Include updated websites lists from Microsoft and Display intranet sites in
Compatibility View check boxes are selected.
d. Click Close.
NOTE: Clearing the Internet Explorer cache will remove the added websites in
Compatibility View Settings. If the cache is cleared, the websites must be added
back to the Compatibility View Settings list.
• For ESL G3 Tape Libraries (only), Java Runtime Environment (JRE) version 1.6.0 Update 24 is
also required.
Enable Java support for browsers:
1. Close all open browser windows.
2. From the Windows Control Panel, select Java.
3. Select the Advanced tab.
4. Expand the Default Java for browsers node and select the item for your browser if it is
not already selected.
5. Click OK.
• An internet connection is recommended for Command View TL to connect to the HP Support
website.
Recommended minimum screen resolution: 1152 x 864
Library hardware requirements
EML and ESL E-Series tape libraries shipped before November 2007 may require a RAM upgrade
to be TapeAssure capable. This upgrade is customer installable and can be ordered as HP part
number 464581-001 from the HP Parts Store (http://www.hp.com/buy/parts) or PartSurfer (http://
partsurfer.hp.com). After replacing the part using the included instructions, remove and re-add the
library on the Command View TL Launcher window.
Other requirements
Command View TL version 2.8 includes support for the ESL G3 tape drives and library.
Command View TL version 2.6 and later includes TapeAssure support for MSL G3 and 1/8 G2
tape drives (LTO Utrium 1840 and later) and Standalone SCSI and SAS tape drives (LTO Ultrium
960 and later). MSL G3 and 1/8 G2 support is enabled through that library's remote management
interface. The Standalone TapeAssure Service requires a Windows agent downloadable from
http://www.hp.com/go/tapeassure. Additional documentation can be found at that website.
To install and run this software on Windows Server 2008, you must either login as Administrator,
or perform the following steps:
1. Become a member of the Administrators group using the Server Manager (Start→All
Programs→Administrative Tools→Server Manager).
2. If prompted by Internet Explorer, add the hostname of the management station to your Trusted
Sites Zone.
3. Launch the Command View TL installer by right-clicking on the executable and selecting Run
as Administrator.
The Windows Management Instrumentation service must be started before installation or
uninstallation of Command View TL.
Prerequisites 17
Page 18

Installing Command View TL
NOTE: Upgrading to Command View TL 3.7.00 is only supported from versions 3.6.00 and 3.6
Patch 01. If your current Command View TL software is older than 3.6.00, upgrade to version
3.6.00 before you upgrade to 3.7.00.
Before upgrading Command View TL to the latest version, backup the TapeAssure database. To
perform the backup, refer to “Backing up the TapeAssure database” (page 113) and “Saving or
copying a database backup file” (page 115).
If you are upgrading from a previous version of Command View TL (Command View ESL prior to
version 1.5), follow the procedure below to install the new version over the old version. All previous
settings (device list, support tickets, proxy settings and so forth) are migrated during the upgrade.
During the upgrade, the Command View TL installation path (destination folder) will point to the
existing installation path where an earlier version of Command View TL is installed. Do not change
the Command View TL installation path to a new location.
Do not click cancel or close the installation dialog while the Command View TL installation/upgrade
is in progress.
Table 1 Command View TL upgrade support matrix for Windows Operating System variants
Command View
TL Version
Operating System
3.6.00/3.6.013.5.003.1.003.0.13.0.00
Windows Server
2003 SP2
(32/64 bit)
Windows Server
2008
SP1(32/64 bit)
Windows Server
2008 R2 (64 bit)
Windows XP (32
bit)
Windows Vista
(64 bit)
Windows 7 (64
bit)
YesNoNoNoNoMicrosoft
YesNoNoNoNoMicrosoft
YesNoNoNoNoMicrosoft
NoNoNoNoNoMicrosoft
YesNoNoNoNoMicrosoft
YesNoNoNoNoMicrosoft
18 Command View TL GUI
Page 19

IMPORTANT:
To install and run this software on Windows Server 2008, you must either login as Administrator,
or perform the following steps:
1. Become a member of the Administrators group using the Server Manager (Start→All
Programs→Administrative Tools→Server Manager).
2. If prompted by Internet Explorer, add the hostname of the management station to your Trusted
Sites Zone.
3. Launch the Command View TL installer by right-clicking on the executable and selecting Run
as Administrator.
No changes are required to remotely browse to a library or management station.
1. If the management station is running firewall software, configure the firewall to enable
communication on the ports used by the management station; see Table 2.
If the management station is running anti-virus software, ensure the ports that are used by
CVTL are not blocked by the anti-virus software.
The following network ports are used by the management station to communicate with the
web browser (Command View TL):
Table 2 Management station to web browser network ports
PurposePort number
TCP (added in 2.4)7
bidirectional, HTTP library is a webserver for administration purposes80 (TCP)
UDP bidirectional, required to communicate SNMP with library161
UDP inbound, one port in the range required to receive the SNMP traps162-169
TCP inbound, HTTPS Secure Webserver443
TCP and UDP outbound In Command View TL 2.8.00 or lower2715
TCP bidirectional4093 - 4095
TCP bidirectional5450
5696
TCP outbound, KMIP (future feature) communication port on the server.
Library uses a non privileged port
TCP (added in 2.4)7755
By configuring the firewall to enable communication through these ports, the web browser
used to run Command View TL can be on the other side of the firewall from the management
station.
The following network ports are used by the management station to communicate with the
Interface Manager card:
Installing Command View TL 19
Page 20

Table 3 Management station to Interface Manager card network ports
PurposePort number
TCP inbound8099
TCP SSL outbound18098
TCP bidirectional in Command View TL 2.8.00 or lower8098
By configuring the firewall to enable communication through these ports, the management
station can be on the other side of the firewall from the Interface manager.
See your firewall documentation for instructions on configuring network access.
Table 4 Interface Manger uses this port for SNMP
PurposePort number
UDP SNMP from SKM bidirectional161
Servers intending to receive SNMP traps will need to have this port open.
Table 5 Interface Manger uses this port for Network Time Protocol (NTP)
PurposePort number
TCP and UDP bidirectional123
Servers intending to use NTP will need to have this port open.
HP recommends that an Secure Key Manager (SKM) or Enterprise Secure Key Manager (ESKM)
appliance (node) use the following network ports to communicate with the SKM or ESKM
management user interface, or for SKM or ESKM communication to other devices. All ports
are TCP and SSL capable.
Table 6 SKM or ESKM network ports
PurposePort number
SSH login to SKM bidirectional22
SNMP from SKM bidirectional161
Interface Manager login to SKM) bidirectional9000
FIPS status server from SKM bidirectional9081
SKM networking bidirectional9001
Web login to SKM bidirectional9443
Table 7 SMTP port
PurposePort number
SMTP to send e-mails bidirectional25
Table 8 LTT service ports
20 Command View TL GUI
PurposePort number
LTT Service requests from clients7999-8099
Used for SSH tunneling7011-7027
Used for LTT Notification server7000-7010
Page 21

NOTE: The ESL G3 and MSL6480 notifies CVTL of status changes by connecting to CVTL
on one port in the range of 162-169. Please ensure your firewall allows connections to each
port in this range.
2. Download the Command View TL software from http://www.hp.com/support/cvtl.
3. Save the EXE file to your management station and double-click to execute the Command View
TL setup.
4. Follow the instructions in the window to complete the installation.
Command View TL is a web server that hosts a GUI interface to web clients. Command View
TL runs on the management station as a service. By default, this service starts automatically
whenever the management station is booted, and runs invisibly in the background. In most
cases, the default installation settings are adequate.
IMPORTANT: The typical installation does not include SMIS Tape Provider. In order to install
SMIS Tape provider, choose the custom installation and select SMIS Tape provider from the
features list.
After complete installation of Command View TL , restart Command View TL service to receive
Test Alerts when set from CVTL GUI Administrator+Send Insight Remote Support Test Alert.
If you need to stop Command View TL from running on the management station, use the
Services applet that is included with Windows. To access the Services applet, select
Start+Settings→Control Panel→Administrative Tools→Services and locate the Command View
TL service in the list. Use the Services applet to start and stop services, and to set whether the
service is started automatically when the computer is booted. See the online help that comes
with the Services applet for more information.
5. The product documentation is located in the docs directory on the Installation CD.
Starting Command View TL
Command View TL requires Adobe Flash Player 10.3 plug-in. If the Adobe Flash Player 10.3
plug-in is not already installed on your computer and you are using a Windows operating system,
Command View TL attempts to download and install it for you. If prompted to install the Adobe
Flash Player 10.3, click OK and follow the instructions in the window. Otherwise, manually
download and install Adobe Flash Player 10.3 on the management station or remote client.
To start Command View TL, open your browser, either on the management station or on a client
machine on the LAN, and enter the following URL in the address field:
http://hostname:4095/
(where hostname is the IP address or network name of the management station. If you are starting
Command View TL on the management station itself, you can substitute localhost for the
hostname).
On the management station, you can also start Command View TL from the Windows Start button:
Start+All Programs→HP Command View TL→Command View TL
Enter your user name and password
The following table lists the user names that are available and the default passwords. For more
information about the tasks each user can perform or to change one of these passwords, see
Changing library passwords (page 34).
Starting Command View TL 21
Page 22
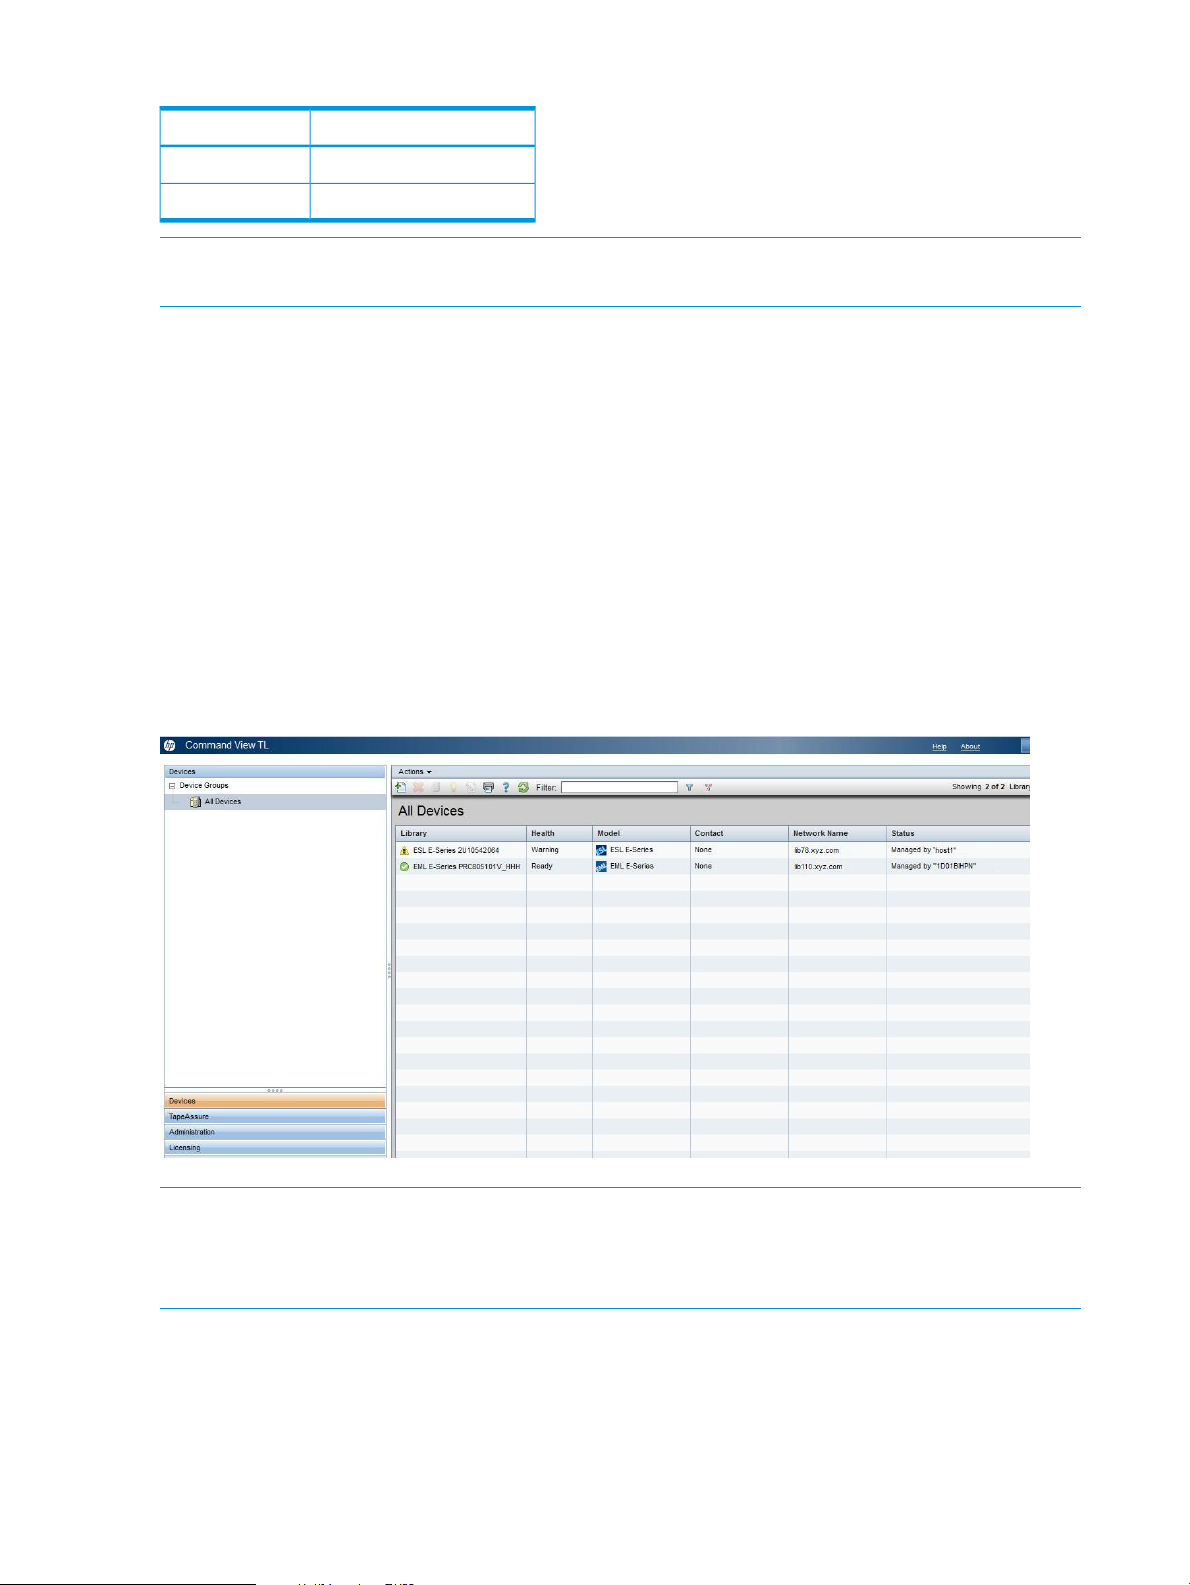
Table 9 User names and default passwords
Default passwordUser name
securitysecurity
adminadmin
NOTE: Multiple users can log in at the same time. If one user is modifying the settings for a
library, other modify operations for that library will be denied.
Using Command View TL
The Launcher window has the following menu tabs in the lower left corner:
• Devices—Displays a list of libraries and virtual tape libraries that can be managed by
Command View TL. You can add or delete libraries from this list, or select a library to manage.
• TapeAssure—Displays a consolidated summary of drive and tape utilization, advanced health,
and performance, for every drive and tape on every library using this management station as
its primary management station. It also includes data on the number of uses remaining on the
cleaning tapes in these libraries.
• Administration—Displays the network settings of the management station. You can configure
these settings.
• Licensing—Provides a convenient way to track and safely store any additional license keys
you have purchased for use with tape libraries.
Figure 5 The Launcher window
NOTE: For each library, the status column displays messages such as “Firmware update in
progress” or “Cannot communicate with library”. It there are no messages to display, the status
column displays the name of the management station that is managing the library or if the library
is not currently managed, “Ready to manage”.
Licensing Notes
On initial installation of the Command View TL, you have a 60–day instant-on license period and
a subsequent 30–day grace period to install the TapeAssure Advanced license.
22 Command View TL GUI
Page 23
Instant-on license behavior for devices:
• During instant-on period, all the supported libraries can be added to the CVTL management
station regardless of the license that they have.
• Double clicking the library from the devices page will allow the library to be managed.
• During the instant-on and grace periods, if all the libraries are licensed then no messages are
visible on the devices page.
For ESL G3/MS6480 libraries:
• During the instant-on period, the library is available to be managed.
• After 90 days, the license expires and a message indicates that you can no longer manage
the library.
• If you have a permanent license, you can manage the library.
For EML/ESL libraries:
• During the instant-on period, the library is available to be managed for the first 90 days. (Prior
to version 3.0 the license was only available for 60 days.)
• After 90 days, the license expires. A nagging message indicates that the license has expired
in the device management screen. However, you can still manage and perform all the
operations that were available during the instant-on period.
• If you have a permanent license, you can manage the library.
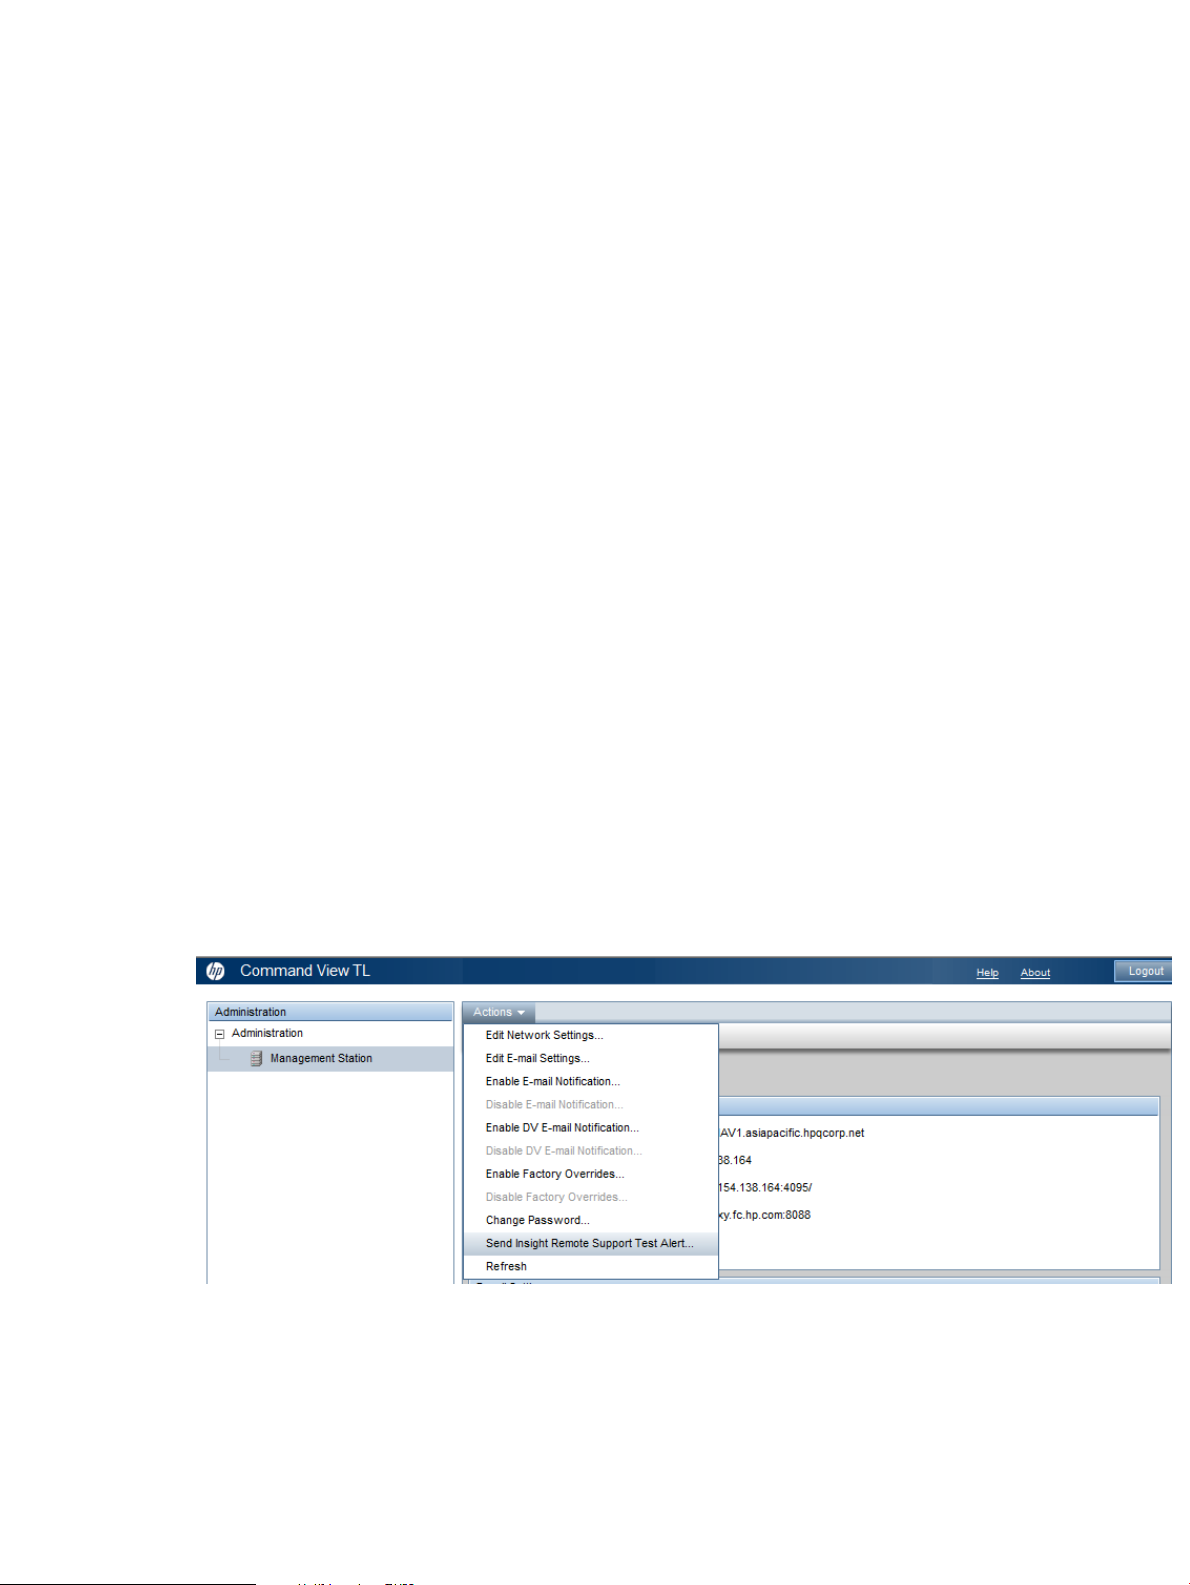
Testing the Insight Remote Support
The Send Insight Remote Support Test Alert feature allows library administrators to verify the Insight
Remote Support installation on the server. The Send Insight Remote Support Test Alert sends a test
alert to Insight Remote Support; if Insight Remote Support receives the test alert you can consider
the Insight Remote Support installation successful.
CVTL provides an action to trigger an SMI-S Tape Provider event to the Insight Remote Support
client/back end. This makes testing of Insight Remote Support installations easy. To test the Insight
Remote Support installation, navigate to Administrator→Actions→Send Insight Remote Support
Test Alert.
You will receive a message that indicates whether or not the Insight Remote Support alert was sent
successfully.
Testing the Insight Remote Support 23
Page 24
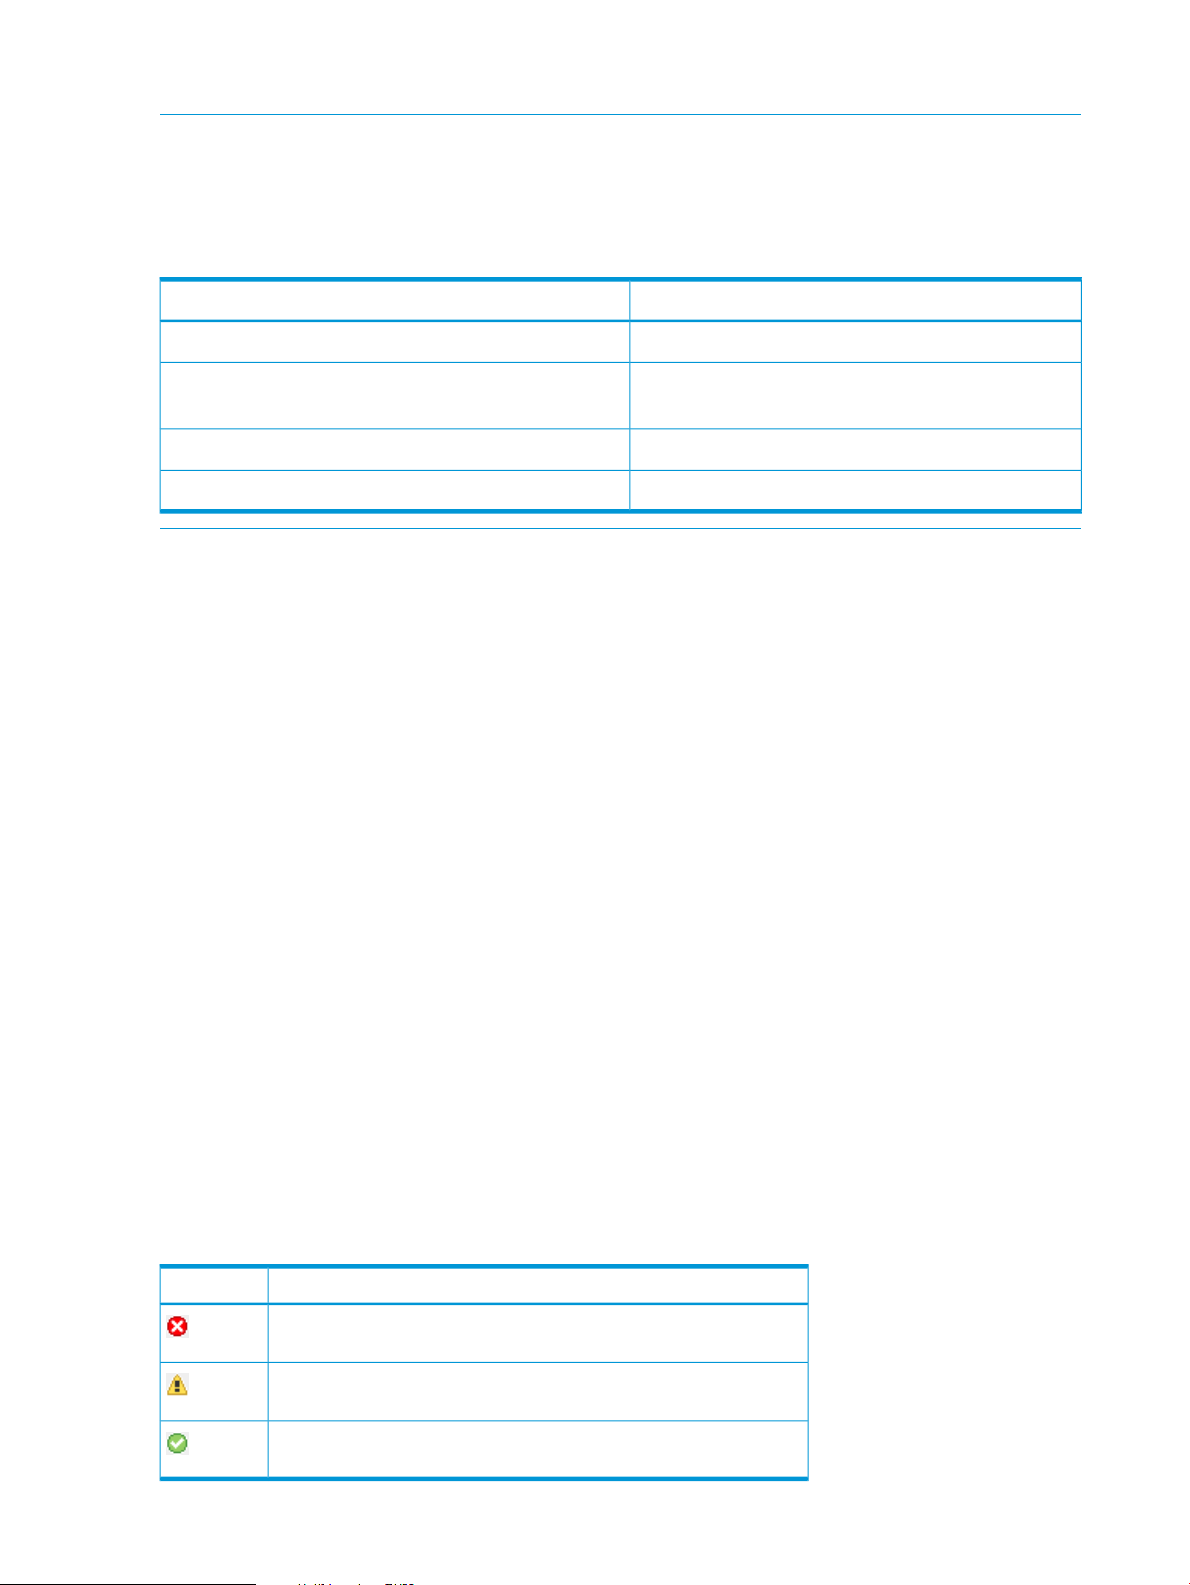
Managing libraries
NOTE: The Launcher window contains all of the HP libraries that you have added. Different
versions of Command View will open depending on the type of library that you want to manage.
For instructions on using Command View versions earlier than Command View TL 2.0, see the
documentation provided with your library.
Table 10 Command View versions that open for different types of libraries
MSL8096)
To manage a library, do one of the following:
• In the Launcher window, double-click the library.
• In the Launcher window, select the library, and then select Actions→Manage Library.
When you select an EML or ESL-E library to manage, a new window opens with the following four
tabs:
Version of Command View used to manage libraryType of library
Command View TLESL E-Series, EML E-Series tape library
Command View MSLMSL tape library (MSL2024, MSL4048, MSL8048,
ESL G3 Library Management ConsoleESL G3
MSL6480 Library Management ConsoleMSL6480
• Status—Displays details about the library and a hierarchical view of the library and its
components in the left panel. The right panel displays status information about the selected
item. On the Status tab, you can also view a health summary of the entire library, view an
alert log, or view the inventory of the library.
• Configuration—Lets you configure library settings, interface settings, network settings,
management station passwords, and licensed capacity (for those libraries that support it). You
can partition the physical library into multiple logical libraries (using Secure Manager), and
configure HP StorageWorks Secure Manager or HP Enterprise Secure Key Manager (assuming
the appropriate licenses have been purchased for those features). You can also save and
restore a library configuration.
• Operations—Provides a convenient way to move media and to reboot the library or individual
components of the library.
• Support—Provides useful resources for finding support. On the Support tab, you can also
update firmware, generate support tickets, start a hardware replacement wizard, and restore
factory defaults for the Interface Manager card and selected interface controllers.
The upper-left corner of the window contains an icon that indicates the library status. The upper-right
corner contains a summary of the component status and recent alerts. The following table lists the
status icons used.
Table 11 Status icons
DescriptionIcon
Critical—May prevent normal operations of the library and must be
addressed immediately
Warning—Does not require immediate attention but should be
addressed as soon as possible
Information—Presents information the user should be aware of but
does not require immediate attention
24 Command View TL GUI
Page 25
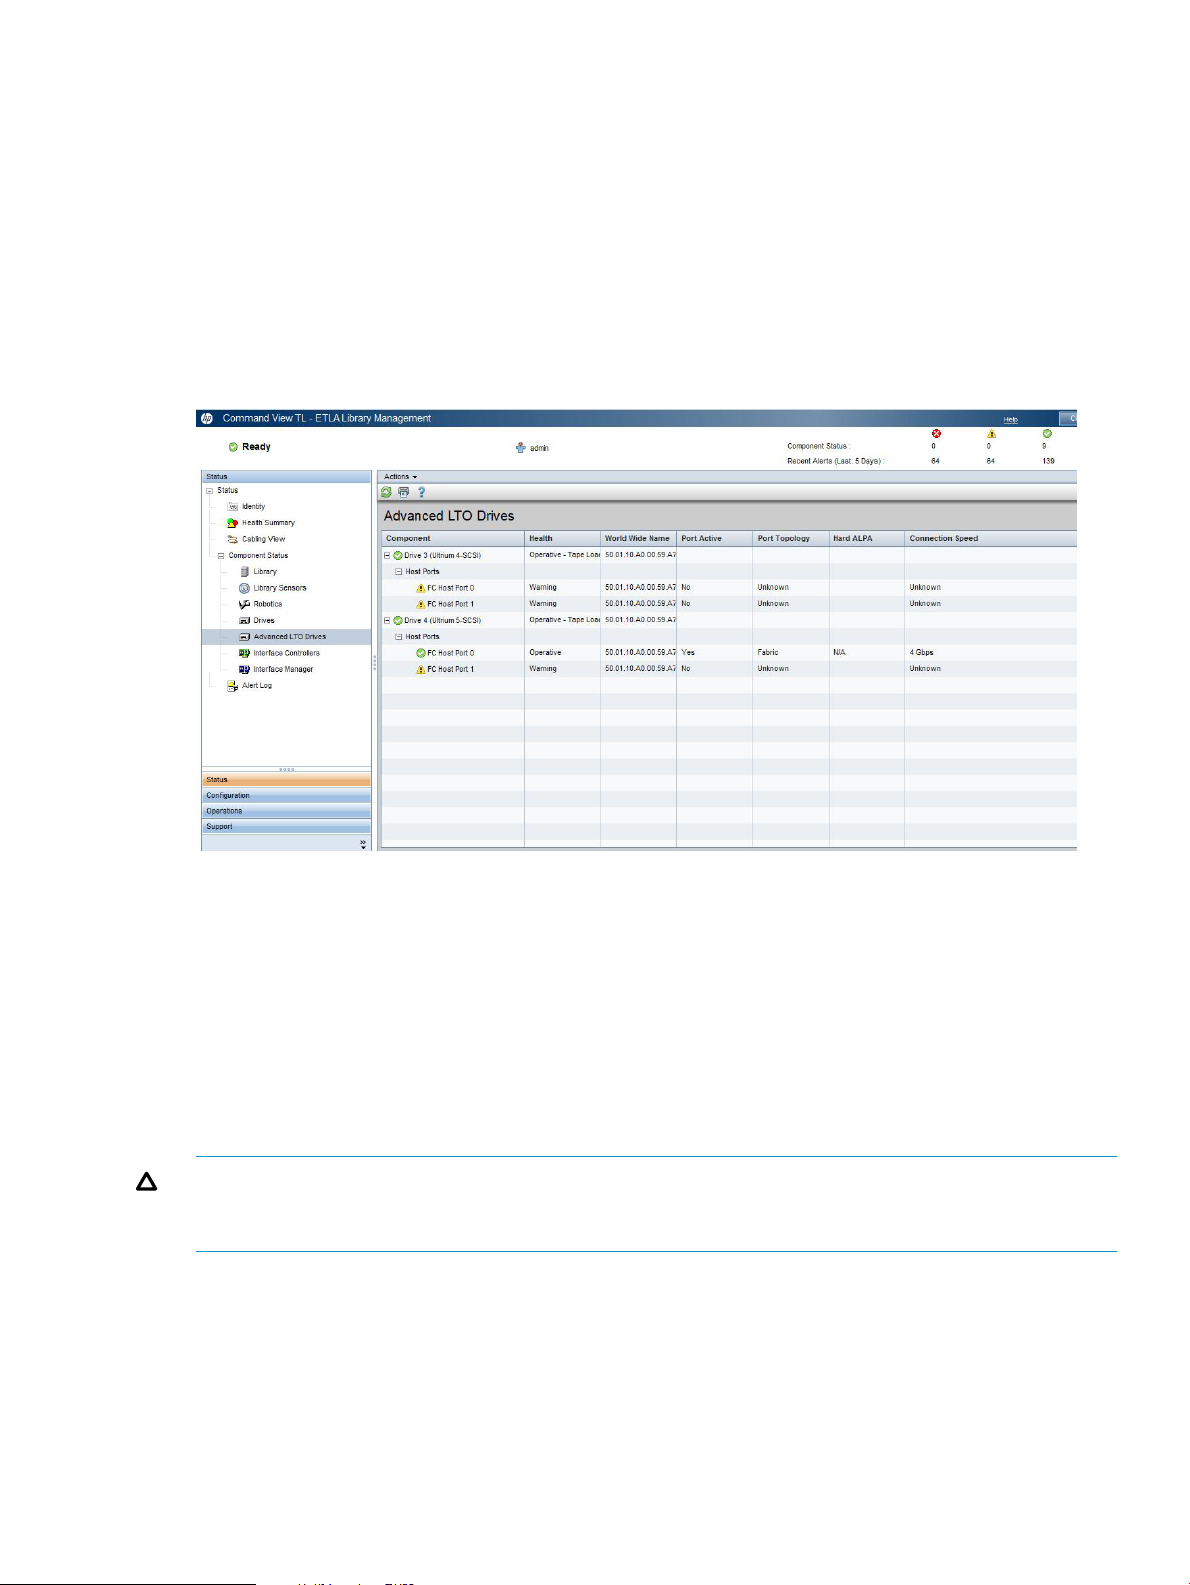
The name of the current library appears in the lower-right corner of the screen. To change the
currently selected library, click Close in the upper-right corner of the screen to go to the Launcher
window.
While managing the MSL, ESL G3, and MSL6480 libraries, if prompted by Microsoft Internet
Explorer, add the library address to your Trust Sites Zone.
Navigating Command View TL
Many windows are divided vertically into two panels. The left panel contains a list showing a
hierarchical structure. The right panel displays additional information about items selected in the
left panel.
Figure 6 A two-panel window
Some windows show data in columns. To show text that is truncated, you can drag the vertical
lines between the column titles to adjust the width of the columns or you can pause your mouse
over some truncated text to show the complete text as a tool tip. Depending on the data being
displayed, you can find more detailed information by:
• Double-clicking an item in the list.
• Selecting one or more items in the list, and then selecting an item in the Actions menu.
Most windows have an Actions menu that displays a list of actions that you can perform from that
window or on the selected item. Menu items in bold type show the default action for that window
or selected item. Double-click the item to perform the action.
CAUTION: Use the various tabs, menus, and buttons throughout the program to navigate. Do
not use the browser navigation buttons. Doing so may cause loss of configuration data entered on
a window.
Command View TL uses toolbar buttons to perform tasks. These buttons may or may not be available
depending on the window. (page 26) lists these buttons and a description of the action performed.
Navigating Command View TL 25
Page 26
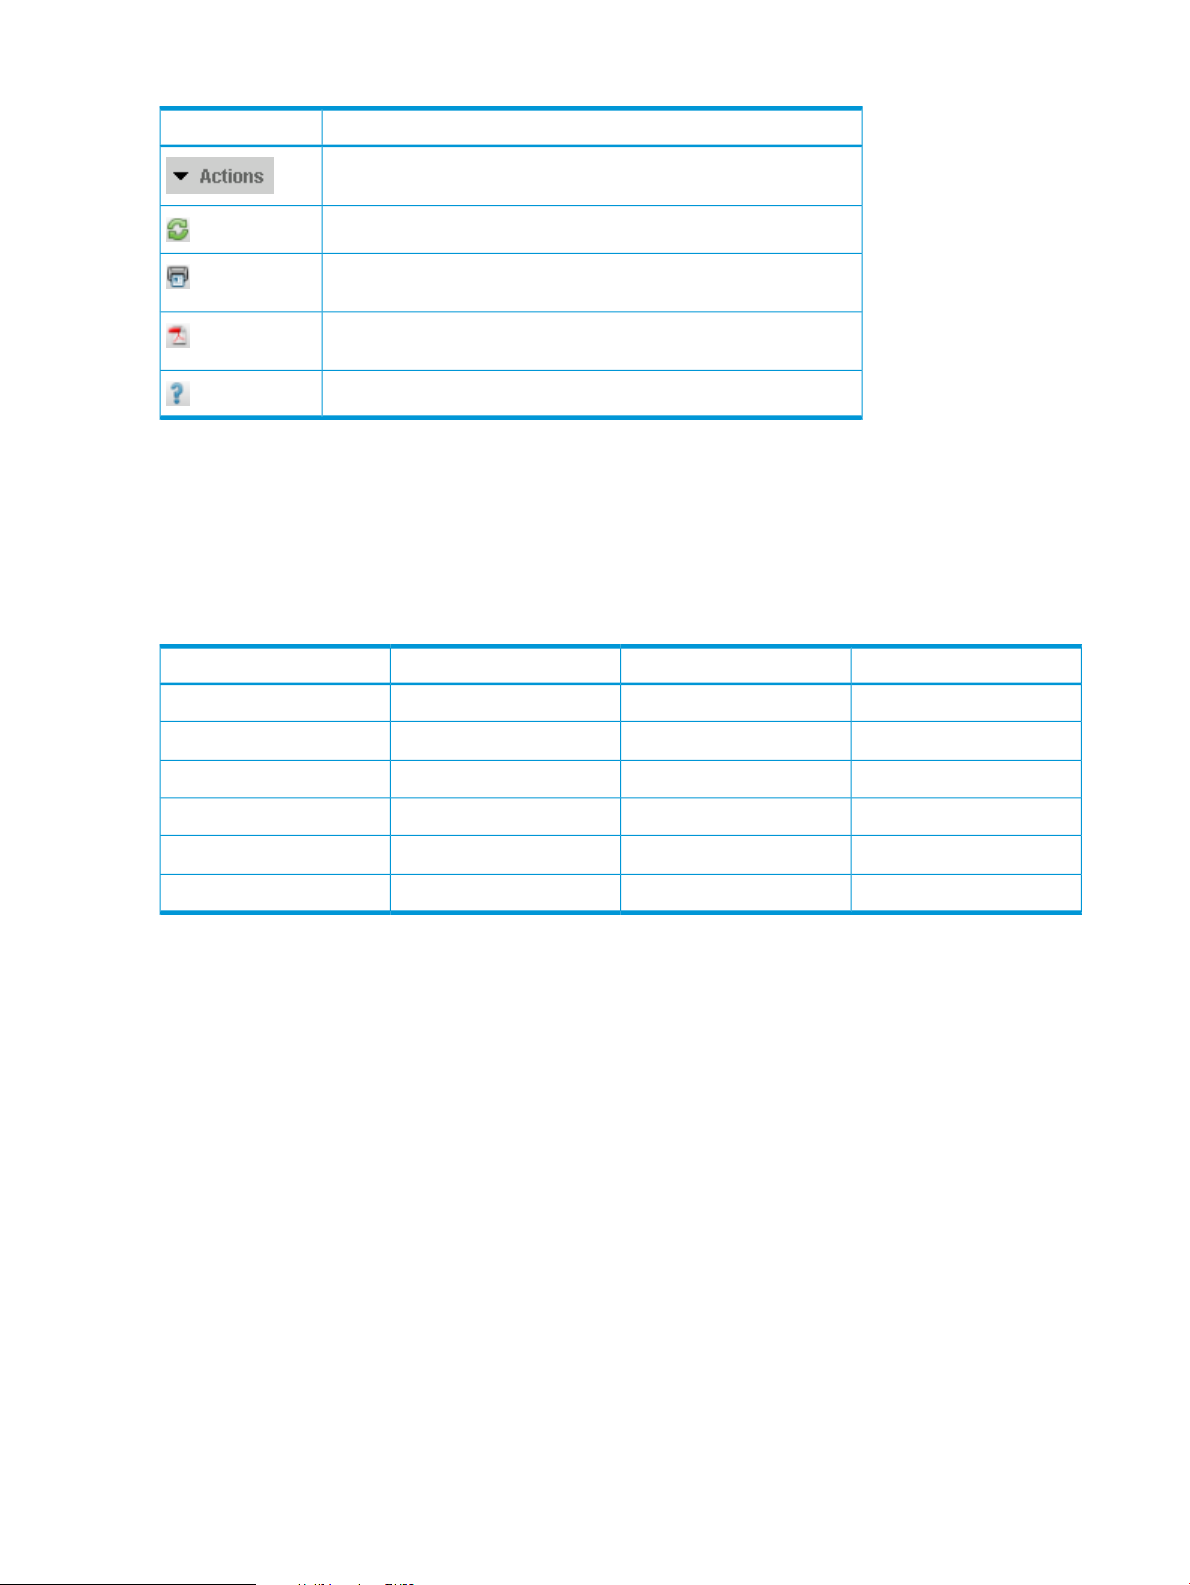
Table 12 Toolbar buttons
DescriptionButton
Actions—Displays a menu of available actions for the current window
or selected items.
Refresh—Refreshes the data on the current window.
Print—Opens the Print dialog box to print the data on the current
window to the selected printer.
Export—Exports the data or report on the current window to a PDF
file that you can save and print.
Help—Opens a help topic associated with the current window.
Device numbering conventions
In some instances, Command View TL numbers devices differently from how they are numbered
on the library front panel.
(page 26) shows the device numbering conventions used by Command View TL and by the library
front panel (when applicable).
Table 13 Device numbering conventions, GUI
n/aDrive clusters
FC host port numbers
SCSI bus numbers
1
Drive clusters in the ESL E-Series libraries are zero-based, although they are not referred to from the front panel of the
library.
2
The zero-based numbering of the FC host ports and SCSI busses corresponds to the numbers that are printed on the
actual hardware.
Initial configuration steps
After you have successfully installed the Interface Manager card and started Command View TL:
1. Verify that the proxy settings for the management station are correct. See Changing the network
settings of the management station (page 33).
2. Add all libraries that will be monitored to Command View TL. See Adding and removing
libraries (page 27).
3. Add the license key for Command View TL and any additional features that you have
purchased. See Managing license keys (page 31).
4. Change the management station passwords. See Changing library passwords (page 34).
5. Configure the library name, system date and time, and contact information for each library.
See Changing the library settings (page 35).
6. Edit the network settings of the Interface Manager card. See Changing the network settings
of the Interface Manager card (page 36).
7. (Optional) Configure library partitions. Use Secure Manager (license required) to configure
library partitions. Partitioning the library erases all host access configuration settings. See
Partitioning a library (page 153).
EML E-Series front panelESL E-Series front panelCommand View TLDevice
One-basedOne-basedOne-basedDrives
1
2
2
n/aZero-based
One-basedn/aOne-basedSlots
One-basedn/aOne-basedFC interface controllers
n/an/aZero-based
n/an/aZero-based
26 Command View TL GUI
Page 27

Adding and removing libraries
You must add any library that you want to manage to each management station or client that you
want to launch or manage it from.
NOTE: The primary management station collects and stores data from the library. For best
performance, the primary management station should be in the same physical location and on the
same IP subnet as the libraries it will manage.
NOTE: If you wish to change the primary management station for a library, first remove the
library from the current management station. If the library is not removed from the current
management station first, the new management station will not be able to collect TapeAssure data
until an Interface Manager clear station command is issued through the CLI (for EML and ESL
E-series libraries.
For more information on the TapeAssure status for a library, click the TapeAssure tab on the
Launcher window.
Adding libraries manually
To manually add a single or multiple libraries:
1. In the Launcher window, click the Devices tab. A list of the libraries that you can currently
manage appears.
2. Click Actions→Add Library(ies).
This launches the Add Multiple Library wizard.
3. Click Next.
4. Enter the management IP address or FQDN of the library. If you are adding multiple libraries,
separate them with commas.
5. Click Next.
6. The Summary page shows the libraries that have been entered; select the libraries to add. At
this point no validation has been done to determine if the library is invalid, down, etc.
7. Click Next.
8. The Progress page displays the libraries and the current progress of adding the library.
9. Once all libraries are added, click Finish. The wizard closes and the newly added libraries
are shown in the panel.
Editing a library name
NOTE: This feature is only available for the ESL G3 and MSL6480 libraries.
To edit the library name:
1. In the Launcher window, click the Devices tab. A list of the libraries that you can currently
manage appears.
2. To edit the library name, click Action→Edit Library name.
The Library name dialog box appears.
3. Edit the library name.
4. Click OK.
Removing libraries
Removing a library removes it only from the management station that you are using when you
remove it. When the library is removed from the primary management station, TapeAssure data
is no longer collected. TapeAssure data previously collected on the primary management station
is retained after the library removal and can be exported, if needed. See “Using TapeAssure”
Adding and removing libraries 27
Page 28
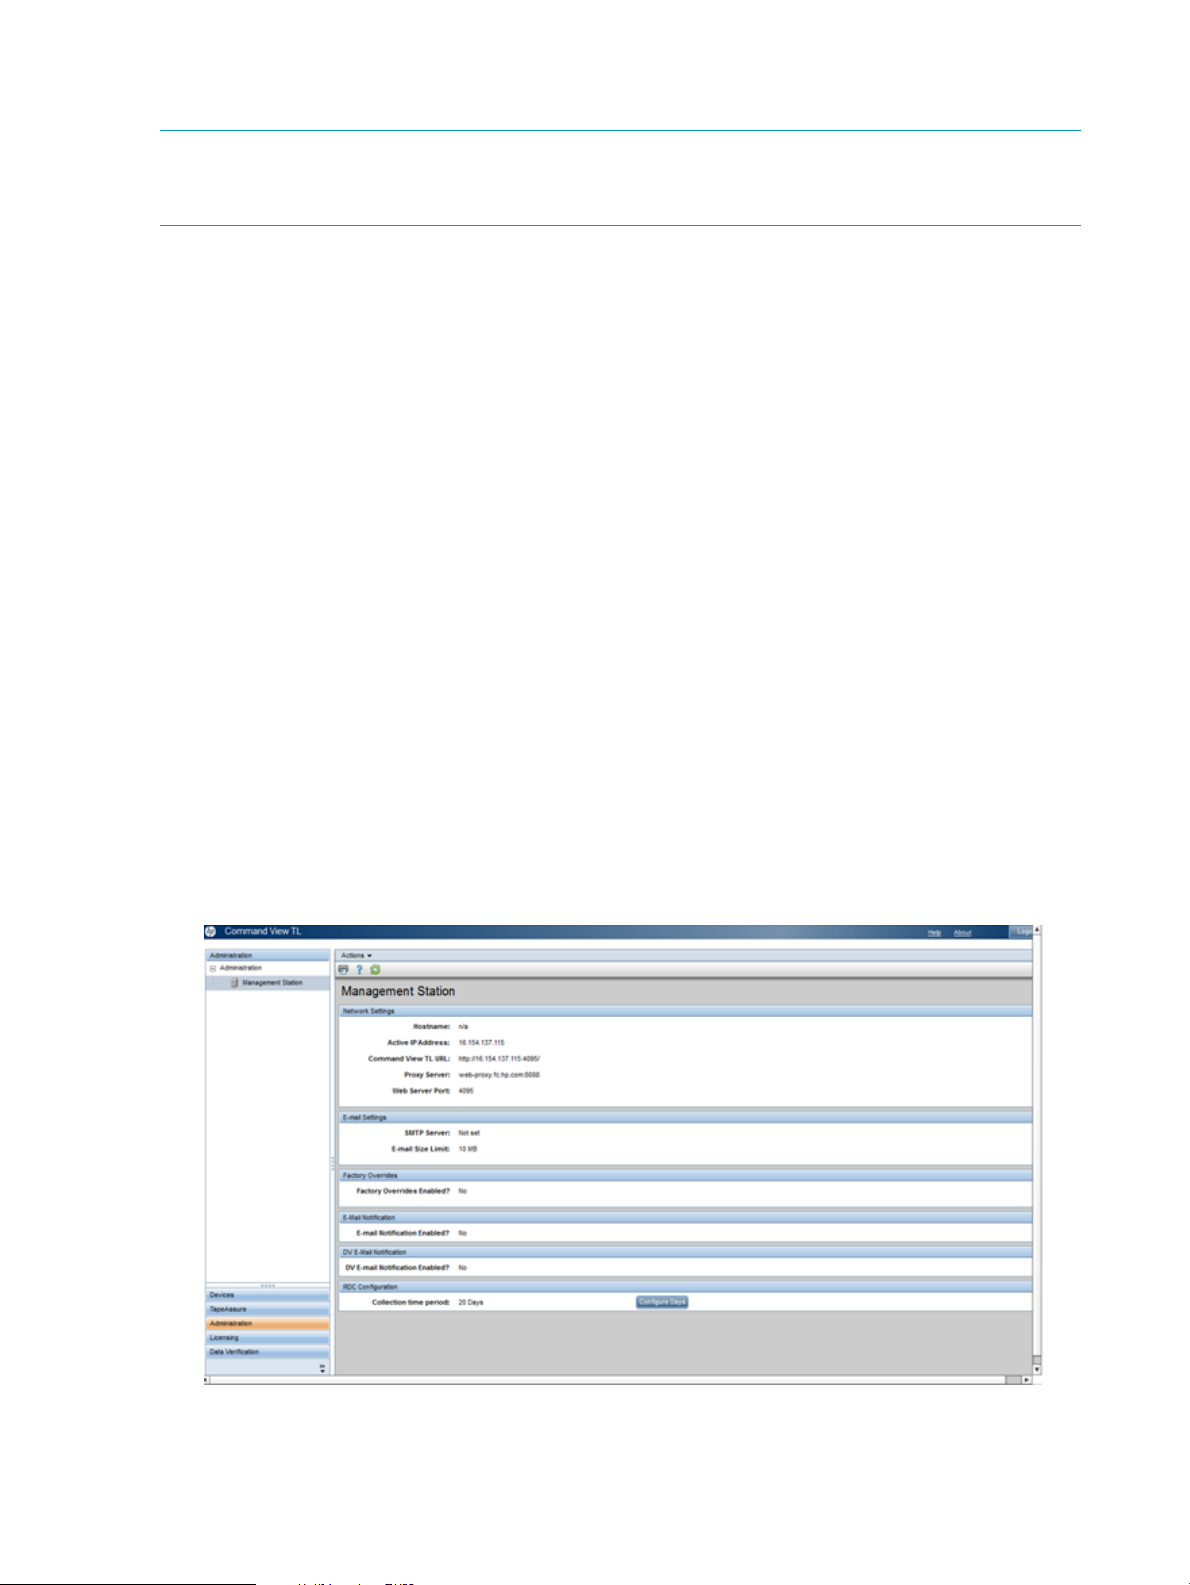
(page 44), “Exporting Library Data to CSV via TapeAssure” (page 108), and “Scheduling a Library
Data Export via TapeAssure” (page 112).
NOTE: If the management station will not be managing this library in the future (for example,
when temporarily managing a library from a management station on a laptop computer), remove
the library from the management station before removing the management station from the network.
To remove a library from the management station:
1. In the Launcher window, click the Devices tab. A list of the libraries that you can currently
manage appears.
2. Select the library to be removed.
3. Select Actions→Remove Library.
4. Confirm that you want to remove the libraries. The confirmation window will indicate if deleting
any of the selected libraries is of particular concern:
• A library that is the primary collector of TapeAssure events and data
• An MSL library
• An ESL/EML library
5. If you get an additional confirmation list, select the libraries to remove then click Remove
libraries.
Changing the e-mail settings
During troubleshooting, you can e-mail support tickets to HP Support. The e-mail settings menu
enables you to specify the SMTP server and the maximum e-mail size. To edit the e-mail settings
1. In the Launcher window, click the Administration tab. The current e-mail settings appear.
2. Select Actions→Edit E-mail Settings to display the E-mail Settings dialog box.
3. Enter the SMTP address in the SMTP Server text box.
4. Specify the maximum e-mail size. E-mail larger than the maximum size are broken up into
smaller e-mail.
5. Click OK to close the dialog box.
28 Command View TL GUI
Page 29
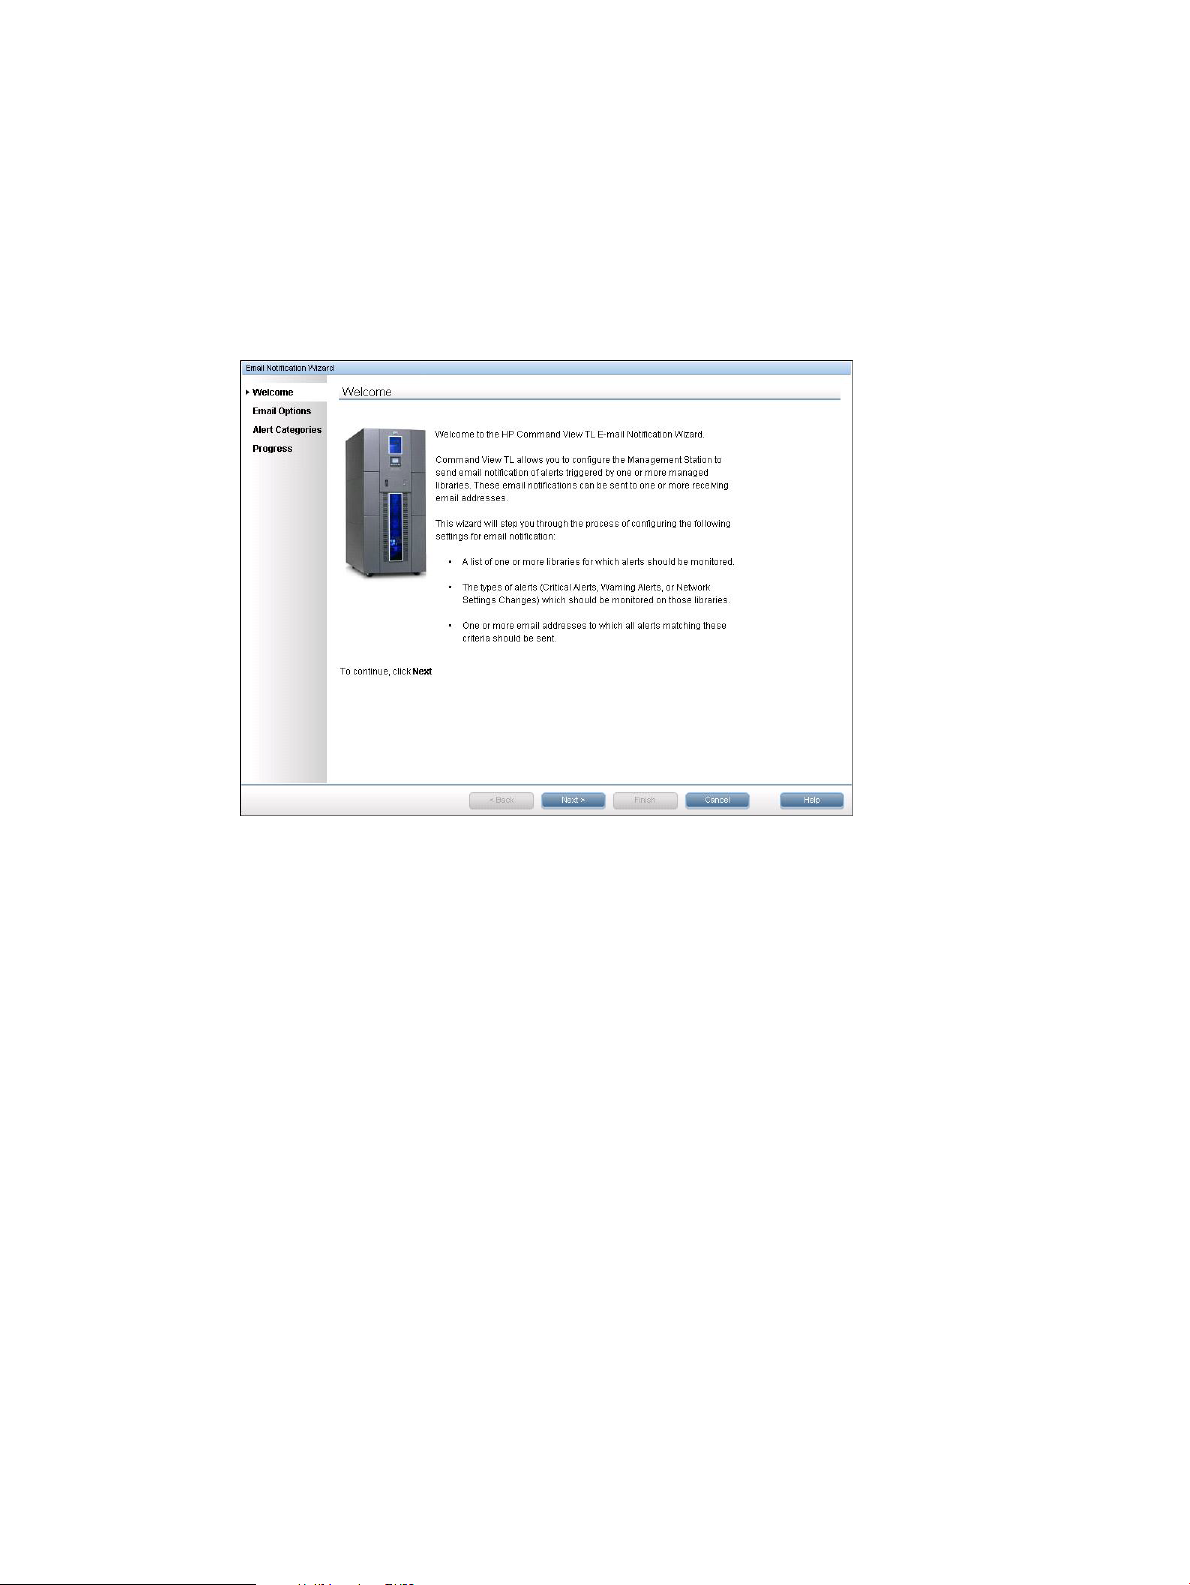
Configuring e-mail alerts
Command View TL has the ability to e-mail users when it receives certain events. You can configure
Command View TL to notify you when it receives any Warning or Critical event, as well as any
network changes. To enable e-mail notification, you first need to have an SMTP server configured.
If you do not already have SMTP configured, go to Changing the e-mail settings. Once you have
your SMTP settings configured, you can enable e-mail notification.
1. In the Launcher window, click the Administration tab. The current settings appear.
2. Click Actions→Enable E-mail Notification.
3. Click Next to begin the Wizard.
4. Check the libraries you wish to receive notifications about.
Configuring e-mail alerts 29
Page 30
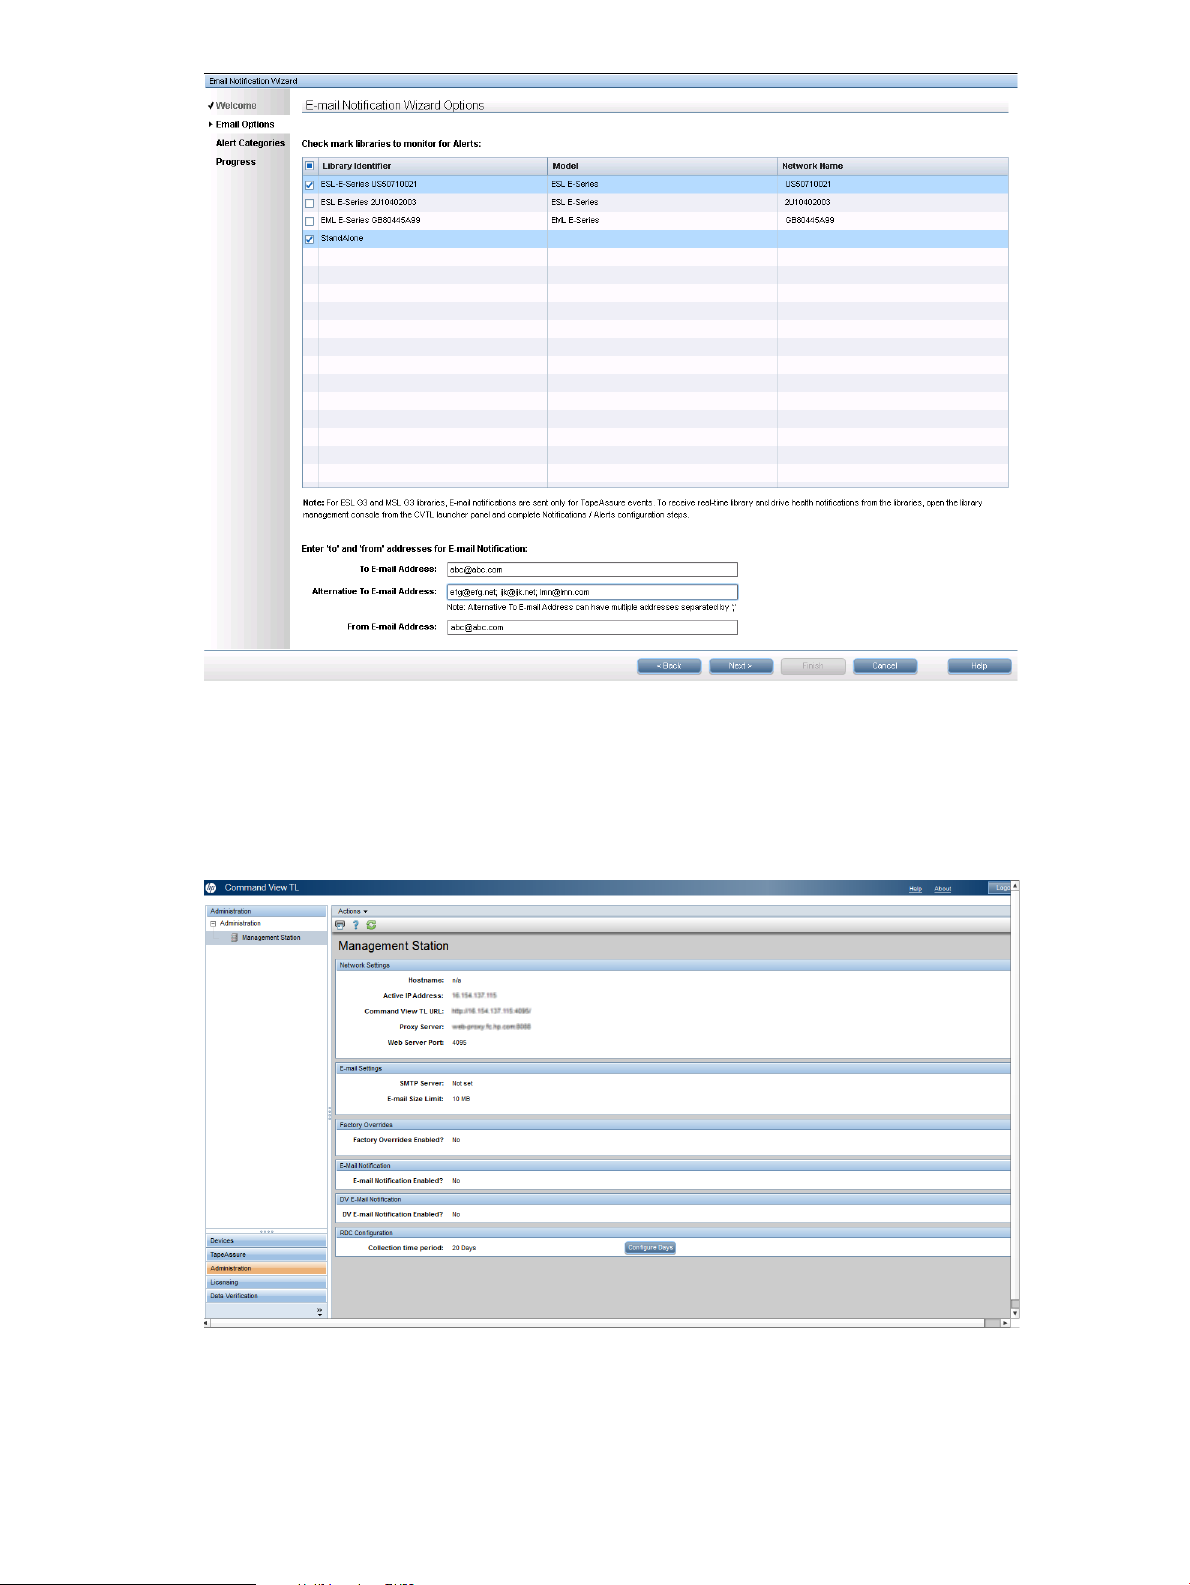
5. Enter the e-mail address that will receive the notifications. You may also enter additional e-mail
addresses in the Alternative To E-mail Address field.
6. Enter the e-mail address the notifications will be sent from. Click Next.
7. Choose the notifications you wish to receive. Click Next.
8. Click Finish to complete the wizard.
To disable the e-mail notification:
1. In the Launcher window, click the Administration tab. The current settings appear.
2. Click Actions→Disable E-mail Notification.
A confirmation dialog to disable the e-mail notifications appears.
30 Command View TL GUI
Page 31

3. Click Yes to disable e-mail notifications.
NOTE: For ESL G3 libraries, e-mail notifications are sent only for TapeAssure events. To receive
real-time library and drive health notifications from the libraries, open the library's own GUI from
the Command View TL launcher panel and complete the appropriate Notifications / Alerts
configuration steps.
Managing license keys
The License Key Summary window (on the Licensing tab) shows a summary of all the license keys
pertaining to the tape libraries that are installed on the system. You can add and delete license
key information from this window. The Interface Manager card, ESL G3, MSL G3, MSL 6480, and
Command View TL software use this information to enable any licensable features that have been
purchased.
The License Key Summary window tracks license keys for the following features:
• Command View TL (separate licenses for ESL, EML, ESL G3, and MSL6480 tape libraries)
• Secure Manager TL (separate licenses for ESL, EML, and ESL G3 tape libraries)
• Licensed Capacity Panel Upgrade for ESL E-Series
• Capacity upgrade for EML 71e
• HP 6000, 9000, or 12000 Virtual Library System capacity
• ESL G3 Automated Media Pool License
• ESL G3 Partitioning License
• ESL G3 E-SKM Encryption Key License
• ESL G3 100-slot capacity upgrade license
• ESL G3 Secure Manager License
• ESL G3 Control Path Failover License
• ESL G3 Data Path Failover License
• HP ESL G3 KMIP Key Manager Client license
• TapeAssure Advanced license
• 8uExtension
• LTFS — MSL G3 series
• HP Data Verification License for ESL G3
• HP StoreEver MSL6480 Data Path Failover License
• HP StoreEver MSL6480 Encryption Key License ESKM
• HP StoreEver MSL6480 Control Path Failover License
To manage your license keys, in the Launcher window, click the Licensing tab. A list of your current
license keys appears.
The first two columns of the License Key Summary window lists the library name and license name,
for each installed license.
Managing license keys 31
Page 32

The remaining columns display the following information for each installed license key:
• License Type—Can be one of the following:
Permanent license—Has no expiration date.◦
◦ Instant-on license—Allows you to use the feature free of charge up to the expiration date.
You must obtain a permanent license to continue using the feature after the expiration
date without experiencing a reminder window.
• Quantity (LTU)—Displays the quantity purchased of the specified license.
• Identifier—Displays the unique device identifier (library serial number) for that license key.
• Expiration Date—Displays the expiration date, if any, of the license key.
• License Key—Displays the actual license key. License keys are generally too long to fit in this
column. To see the entire license key, do one of the following to display the License Key
Properties dialog box:
◦ Double-click the license key.
◦ Select Actions→Properties.
Adding a license key
To add a new license key:
1. Obtain the license key from HP. See Using license keys (page 144) for instructions.
2. In the Launcher window, click the Licensing tab. A list of your current license keys appears.
3. To add a license key for EML, ESL-E, ESL G3, MSL G3, or MSL6480 library(s), select
Actions→Add New License Key from the License Key Summary page.
32 Command View TL GUI
Page 33

4. Click Browse to locate license keys in your file system or enter the license key in the provided
text box, and then click OK.
The new license key is added to the License Key Summary window.
If EML or ESL E-Series is selected then the Library Identifier will be disabled as it is not required.
The license information will be added to the license summary page.
Viewing the Management Station
The Management Station is the default screen displayed when you click the Administration tab.
The screen displays the following information:
• Network settings—hostname, active IP address, Command View TL URL, proxy server, and
WebServer port
• E-mail settings—SMTP server and e-mail size limit
• Factory Overrides—yes or no for whether they are enabled
• Email Notification—yes or no for whether they are enabled
• DV E-mail Notification—yes or no for whether they are enabled
• RDC Configuration—the collection time period
Changing the network settings of the management station
To edit the network settings of the management station:
1. In the Launcher window, click the Administration tab. The current settings appear.
2. Select Actions→Edit Network Settings to display the Network Settings dialog box.
3. Set the required proxy settings. If you choose to use proxy settings, enter the web proxy
hostname and web proxy port. If necessary, consult your network administrator for this
information.
NOTE: Command View TL uses proxy settings to retrieve software and firmware information
through the Web. Command View TL attempts to detect the management station proxy settings
at startup, but it does not use these proxy settings until instructed to do so.
4. Set the web server port. The default setting is 4095, which should not need to be changed.
If you do change this value, the new value does not take effect until the next time a GUI is
Viewing the Management Station 33
Page 34

started; the current GUI is unaffected. This value can be viewed in the content pane of the
Management Station tab.
5. Set the host name or active IP address for the management station. The active IP address is
the one used by the management station to communicate with clients and libraries.
NOTE: It is important to verify that the correct host name or IP address is set. On dual
networked servers, the installation process may have chosen the wrong IP address.
6. Click OK to save your changes.
NOTE: Changing the host name or active IP address terminates the current GUI session. To
restart the GUI session, enter the new active IP address in the address field of the browser.
Changing management station passwords
IMPORTANT: Each user has a password (see (page 22)). Default passwords are set at the factory.
For security reasons, you should always change these passwords.
To change the password for the Command View TL management station:
1. In the Launcher window, click the Administration tab.
2. Select Actions→Change password. The Change Password dialog box appears.
3. Enter the current password, new password, and confirm the new password. Also enter a
security question and answer that can be used to recover the password if you forget it in the
future.
34 Command View TL GUI
Page 35

4. Click OK.
5. If you want to change the password for additional users, close Command View TL, restart it,
and log into the library as a different user (see (page 22)).
Recovering a password
To recover an existing password for the Command View TL management station:
1. In the Command View TL log-in window, click I've forgotten the password.
2. In the Recover Password dialog, answer the security question. Click OK.
This will generate a new password for the user to login.
Changing the library settings
Library settings include the following items:
• Library name (editable)
• System date (editable)
• System time (editable)
• Synchronizing with NTP (editable)
• Time zone (editable)
• System contact name (editable)
• System contact phone number (editable)
• System contact pager number (editable)
• System contact e-mail address (editable)
• System location (editable)
• System asset number (editable)
To edit the library settings:
1. Double-click the EML or ESL E-Series library you want to manage. In the new Library window,
click the Configuration tab.
2. In the left panel, select Library Settings. The current settings appear in the right panel.
Recovering a password 35
Page 36

3. Do one of the following:
• To edit the library name, select Actions→Edit Library Name.
• To edit the system date and time, select Actions→Edit Library Date/Time.
Select either Set Clock Manually or Synchronize Clock with NTP Server.
When synchronizing with NTP servers, enter the IP addresses of up to three NTP servers.
Click Check to verify connectivity.
• To edit the contact information, select Actions→Edit Contact Information.
4. Make the required changes, and then click OK. The library settings are stored in the memory
of the Interface Manager card.
Changing the network settings of the Interface Manager card
Following are the network settings that pertain to the Interface Manager card of an EML or ESL
E-Series library.
• IPv4 network settings
Hostname (editable)◦
◦ Address configuration (editable)
◦ IP address (editable)
◦ Subnet mask (editable)
◦ Gateway (editable)
◦ DNS domain name (editable)
◦ DNS addresses (editable)
• IPv6 network settings
Hostname (editable)◦
◦ Domain name (editable)
◦ DNS servers (primary, secondary, and tertiary)
◦ Stateless addressing
◦ DHCP addressing
◦ Static addressing
• MAC Settings
MAC address (not editable)◦
◦ Link selections (not editable)
Only the network settings can be edited. To edit the network settings:
1. If necessary, obtain the required network settings from your network administrator.
2. In the Library window, click the Configuration tab.
3. Under Network Settings, choose the IP version for which you'll configure your network settings.
IPv4 addresses are the shorter, traditional addresses.
IPv6 addresses are the second generation, 128–bit addresses.
4. Select Actions→Edit Network Settings to display the Network Settings dialog box.
36 Command View TL GUI
Page 37

5. Make the changes as required, and then click OK.
RDC Configuration
The RDC Configuration panel of the Administration page allows you to configure the collection
time period for SMI-S. The default time period is seven days. To change the time period:
1. In the navigation panel select Administration.
2. Under RDC Configuration, click Configure Days. This opens a separate window.
3. Enter a number. The maximum number of days is 999999999.
4. Click OK. The screen refreshes to display the new time period.
Verifying connectivity
The Connectivity Check feature performs a quick check to verify that the management station can
communicate with the selected library.
NOTE: The Connectivity Check feature is available for ESL E-Series, EML, ESL G3, and MSL6480
libraries only.
To use the Connectivity Check feature:
1. In the Launcher window, select a library, and then select Actions→Connectivity Check. The
Please wait dialog box appears.
The Connectivity Check feature performs the test and displays the results. If a problem was
encountered, the dialog box provides information to help you troubleshoot and resolve the
problem.
2. When you are finished, click OK to close the dialog box. If a problem was encountered,
perform the troubleshooting steps as indicated, and then run the Connectivity Check feature
again.
RDC Configuration 37
Page 38

Getting information about an EML or ESL E-Series library
The Identity screen displays summary information and a photo of the currently selected library.
This screen is useful when you need to quickly find information pertaining to a library, such as the
number of drives or interface controllers it contains. Another use for the Identity screen is finding
the library serial number, which is required when ordering any of the optional, licensable features
of a library (see Advanced features in the GUI (page 144) for more information about additional
licensable features).
In the Library window, click the Identity menu.
Viewing the health summary
The health summary shows the status of every component in the library.
1. In the Library window, click the Status tab.
2. In the left panel, select Health Summary. A list of the health of each component appears in
the right panel.
• The first column of the Health Summary displays each component of the library in a
hierarchical structure. Each component is shown with a green, yellow, or red status symbol
that enables you to see if any components need attention.
• The second column describes the health of the component.
• The third column provides additional information that may be useful if there is a problem
with the component.
• The fourth column lists recent alerts.
NOTE: The Health Summary window is automatically updated whenever the status of the
library changes.
3. To display the properties of a component, do one of the following:
• In the right panel, double click a component.
• In the right panel, select a component then select Actions→Properties.
Viewing the physical connections
The Cabling View window shows the physical connection between devices.
1. In the Library window, click the Status tab.
2. In the left panel, click Cabling View. A list of the physical connections appears in the right
panel.
TIP: Verify that the list does not contain an Unconnected Devices node which would
indicate that the Interface manager card is unable to establish connectivity with any of the
library components.
• The first column shows the components in tree view.
• The second column shows the health of the component with an icon.
• The third column shows the serial number for the Interface Manager card, the World
Wide Node Name (WWNN) for the interface controllers, the World Wide Port Name
(WWPN) for the host ports, or a generic name for SCSI device ports.
38 Command View TL GUI
Page 39

Viewing the status of components
The Component Status function displays the current status of the following library components
individually:
• Library
• Library sensors (temperature, voltage, and fan speed readings)
• Robotics
• Drives
• Advanced LTO Drives
• Interface Controllers
• Interface Manager
1. In the Library window, click the Status tab.
2. In the left panel, select the component that you want to see the status of, either Library, Library
Sensors, Robotics, Drives, Interface Controllers, or Interface Manager. Relevant information
for that component shows in the right panel. The information displayed varies depending on
the component selected.
3. To display the properties of a component, do one of the following:
• In the right panel, double-click a component.
• In the right panel, select a component, and then select Actions→Properties.
The information displayed varies depending on the component selected.
Viewing the alert log
To view the alert log:
1. In the Library window, click the Status tab.
2. In the left panel, select Alert Log. A list of alerts appears in the right panel.
The following information shows for each alert.
Viewing the status of components 39
Page 40

TIP: Click a column title to sort by that column. Click the column title again to sort in the
reverse order.
• Timestamp—Time that the alert was recorded.
• Alert Description—Brief description of the alert.
• Source—Device that triggered the alert.
• Severity—Displays one of the following icons indicating the type of the alert:
◦ Critical—May prevent normal operations of the library and must be addressed
immediately
◦ Warning—Does not require immediate attention but should be addressed as soon
as possible
◦ Information—Presents information the user should be aware of but does not require
immediate attention
3. If the message is truncated, double-click an alert.
NOTE: Alerts may be triggered for certain drive and tape conditions when a support ticket is
requested by the user, or if proactive log retrieval is enabled. The drives are checked for these
conditions and associated alerts whenever a drive unloads a tape. The following list describes
these alert conditions:
• Warnings or errors generated from device analysis, which will show drive or tape problems
identified by looking at the drive logs.
• Temperature problems identified for either the drive or tape.
• Excessive drive usage, including load/unload life, head life, and reposition life.
• Write quality problems.
• Read quality problems.
• Excessive media usage, including read/write life and load/unload life.
For write/read quality and usage issues, the severity of the alert triggered will depend on the level
of the issue. The alert description will include any recommended service actions.
40 Command View TL GUI
Page 41

Changing the Interface Manager mode
In EML and ESL E-series libraries, the Interface Manager mode setting specifies how the FC interface
controllers are configured. In Automatic mode, the host port connection settings will be configured
the same across all FC interface controllers in the library. In Manual mode, the host port connection
settings for each FC interface controller can be configured differently. For example, one host port
can be configured for Fabric Attach and another can be configured for Direct Attach.
CAUTION: HP strongly recommends that you leave the Interface Manager mode set to the default
setting of Automatic.
If the Interface Manager mode has been changed to Manual and you want to change it back to
Automatic, the connection and speed properties must be the same on all the Interface controllers..
To change the Interface Manager mode:
1. In the Library window, click the Configuration tab.
2. In the left panel, click Interface Manager Mode. The current setting for the Interface Manager
Mode appears in the right panel.
3. Select Actions→Edit Interface Manager Mode to display the Interface Manager Mode dialog
box.
4. Change the mode as required, and then click OK.
5. If you are changing from Manual to Automatic mode, confirm that you want to reboot in the
Reboot Warning dialog box.
Changing the connection properties of the interface controllers
The connection properties for the FC interface controllers include the following.
• World Wide Name (not editable)
• Connection Type (editable)
• Port Mode (editable only if Interface Manager mode is set to manual)
• Hard AL-PA (editable only if Interface Manager mode is set to manual)
• Speed (Gbps) (editable)
Only the connection type and speed of the ports can be set manually. The remaining items are
configured automatically by the Interface Manager card.
IMPORTANT: When the Interface Manager mode is Automatic, if you make changes to one FC
host port, those changes are applied to all the FC host ports on all the FC interface controllers in
the library. When the Interface Manager mode is Manual, changes apply only to the selected FC
host port (see Changing the Interface Manager mode (page 41)).
To edit the FC host port settings:
1. In the Library window, click the Configuration tab.
2. In the left panel, select Interface Settings→Connection Properties. A list of connections appears
in the right panel.
3. In the right panel, select an FC host port, and then select Actions→Edit Port Connection Settings.
TIP: When the library's Interface Manager mode is Automatic, it does not matter which FC
host port is selected because the changes you make apply to all FC host ports.
The Port Connection Settings dialog box appears.
Changing the Interface Manager mode 41
Page 42

4. Set the Port Connection Type to one of the following:
• Fabric (SAN) Attach—Use this connection type when connecting all FC host ports to an
FC switch (default setting).
• Direct Attach—Use this connection type when connecting all FC host ports directly to a
Host Bus Adapter (HBA) on a backup server.
NOTE: It is a good idea to disconnect the FC port if they are set to fabric and connected
to a HBA directly until the configuration can be made.
5. Set the Port Speed.
6. Click OK to save the changes.
7. Confirm that you want to reboot in the Reboot Warning dialog box.
8. Save a new configuration.
Managing the interface controllers
The Interface Manager card retains the World Wide Names (WWN) of installed interface
controllers. The Interface Manager card makes sure that your interface controllers maintain the
same WWN, along with the host mapping configuration and partitioning configuration, in the
event that they require replacement. This enables your backup configuration to continue unchanged,
despite the replacement. Replacing an interface controller is done with the Hardware Replacement
wizard.
Replacing an interface controller
After replacing an interface controller in a library with the Hardware Replacement wizard, all of
the following should happen:
1. If version 5.7.xx or 5.6.xx of the firmware is detected in the replacement interface controller,
the Interface Manager card will immediately update the firmware in the interface controller.
2. The Interface Manager card sets the WWN of the replacement interface controller to match
the WWN of the controller that was replaced.
3. The Interface Manager card transfers the retained host mapping and partitioning configuration
data to the replacement interface controller.
TIP: With the Hardware Replacement wizard, you can replace more than one interface controller
at the same time.
42 Command View TL GUI
Page 43

To replace an interface controller:
CAUTION: If you need to replace an interface controller, refer to the appropriate library and
interface controller documentation for information on how to replace the hardware. Some interface
controllers are hot-pluggable. Refer to the interface controller documentation to see if your interface
controller is hot-pluggable.
1. Follow the instructions in the interface controller's replacement poster to remove and replace
the card.
CAUTION: You must connect the cables to the new interface controller exactly as they were
connected to the original interface controller. If you don't, the Interface Manager card will
not be able to reapply the settings.
2. In the Library window, click the Support tab.
3. In the left panel, select Hardware Replacement.
4. Select Actions→Launch Interface Controller Replacement Wizard.
5. Follow the instructions in the wizard.
6. Verify that the firmware revision in the Interface Controller does not need to be upgraded.
Clearing a WWN mismatch
Beginning with version 1.7, the Interface Manager card claims “ownership” of the interface
controllers installed in a library. The MAC address of the Interface Manager card is stored in the
memory of each interface controller, creating an association between the Interface Manager card
and the interface controllers. If an interface controller that was “owned” by an Interface Manager
card is transferred from one library to another, then the Interface Manager card in the new library
will detect a WWN mismatch. To clear this situation, and to associate the interface controller with
the current Interface Manager card:
1. In the Library window, click the Support tab.
2. In the left panel, select Hardware Replacement.
3. Select Actions→Clear WWN Mismatches. The following warning message appears:
Managing the interface controllers 43
Page 44

TIP: Moving a configured interface controller from one library to a previously empty slot in
another library may enable a duplicate WWN to exist in the SAN. The Interface Manager
card and Command View TL will highlight this possibility, but you will need to take additional
action as noted in the next step.
4. Verify that there are no other interface controllers with the same WWN in the SAN. To view
the WWN of your interface controllers, cancel out of the Clear WWN Mismatches dialog,
and then click the Configuration tab, and then select Connection Properties in the left panel.
See Changing the connection properties of the interface controllers (page 41) for more
information. After verifying that there are no duplicate WWNs in your SAN, repeat Step 1
to Step 3 to return to the Clear WWN Mismatches dialog.
NOTE: If you find a duplicate WWN, contact HP support.
5. Click OK. The dialog closes, and the interface controller is now “owned” by the Interface
Manager card.
6. Save a new configuration by selecting the Configuration tab, then the Actions→Save Current
Configuration option and following prompts.
Using TapeAssure
For EML, ESL E-series, ESL G3, and MSL6480 libraries that contain LTO tape drives, TapeAssure
data is collected by the primary management station for the library. The primary management
station is the first Command View TL management station to register the library. To make a particular
Command View TL management station the primary management station for an EML, ESL E-series,
ESL G3, and MSL6480 library, simply be the first Command View TL management station to register
that library.
To change the primary management station for a library:
1. Unregister the library from the current primary management station.
2. Register the library with the appropriate primary management station.
The new management station is the TapeAssure collector for that library. After this change,
all new TapeAssure data generated by the library will be sent to its new primary management
station.
To see the libraries for which your management station is the primary management station (and
TapeAssure data collector), go to the Launcher screen in Command View TL. The Status column
reports the primary management station for each library.
44 Command View TL GUI
Page 45

Configuring standalone drives for TapeAssure
To configure a backup server with standalone HP drives to send TapeAssure data to a Command
View TL management station, install and configure an application called the HP StoreEver
TapeAssure Service on the backup server. This application can be downloaded from http://
www.hp.com/go/tapeassure using the following steps:
1. Navigate to the correct download for the required operating system.
2. Download and install the software on your backup server.
3. Re-boot the server.
This is a necessary step to ensure the service has access to the tape drive, but only needs to
be done once at install time. The service starts automatically once the reboot is complete.
4. Configure the service by modifying the sta_service.cfg file.
a. Identify the server that will be running Command View TL.
b. Set up any specifics such as the rate at which tickets will be pulled.
Most changes to the configuration will be picked up automatically within five minutes though
the service can always be restarted to pick up all the configurations.
NOTE: If the Command View TL service is not active on the management station you have
specified, support tickets generated by the standalone drives will be stored on the backup server
and will be sent to Command View TL when the service becomes active.
Configuring MSL libraries for TapeAssure
To configure a MSL library to send TapeAssure data to a Command View TL management station:
1. Open the Remote Management Interface (RMI), web based management console for MSL
libraries.
2. Verify that the firmware on your library is at minimum firmware revision:
• 8096—9.90
• 4048—7.20
• 2024—4.90
• 1/8 G2—3.00
3. From the Configuration: Network Management display of the RMI, in the Command View TL
configuration section:
a. Enter the IPv4 address of the Command View TL management station you wish to use as
TapeAssure collector.
NOTE: The minimum firmware revisions listed above only support IPv4 management
stations. A future firmware release will enable support for IPv6 management stations.
b. Enter 8099 for the port number.
c. Submit the new network configuration.
The first TapeAssure data will not be sent to this newly registered Command View TL
management station until a tape has been written to or read from the library and then unloaded
from its drive.
NOTE: MSL libraries only generate TapeAssure data for LTO tape drives of generation LTO4
and later.
Viewing TapeAssure information
For Command View TL versions 2.5 and later, the TapeAssure tab provides a centralized view of
health, performance, and utilization data for both tape drives and tape cartridges. Summary data
Using TapeAssure 45
Page 46

for all tape drives and tape cartridges in every library managed by this management station can
be viewed on the various Drives and Tapes pages accessible from this tab.
NOTE: EML and ESL E-Series tape libraries shipped before November 2007 may require a RAM
upgrade to be TapeAssure capable. This upgrade is customer-installable and can be ordered as
HP part number 464581-001 from the HP Parts Store (http://www.hp.com/buy/parts) or PartSurfer
(http://partsurfer.hp.com). After replacing the part using the included instructions, remove and
re-add the library from the Command View TL Launcher window.
NOTE: Command View TL version 2.6 and later includes TapeAssure support for MSL G3 and
1/8 G2 tape drives (LTO Utrium 1840 and later) and Standalone SCSI and SAS tape drives (LTO
Ultrium 960 and later). MSL G3 and 1/8 G2 support is enabled through the remote management
interface of the library. The Standalone TapeAssure Service requires a Windows agent
downloadable from http://www.hp.com/go/tapeassure. Additional documentation can be found
at that website.
To access TapeAssure and the associated information:
1. In the Launcher window, click the TapeAssure tab.
2. In the left panel, under Drives, select Health, Performance, or Utilization. A list of the tape
drives in the libraries managed by this management station appears.
TIP: To change the order of the columns, drag the column header and drop it in the new location.
To find a specific tape drive or set of tape drives, enter the serial number or name of a tape drive
in the Filter field and click the filter icon to the right of the text box.
For example, to search for the serial number HU172404BF, enter h to find tape drives with serial
numbers that contain h (matching serial numbers such as HU172404BF, HU171801UB, and
HU272404BB. Continuing with the same query, when you enter u17, the list will narrow to drive
names containing hu17 (matching serial numbers such as HU172404BF and HU171801UB). When
you enter the 2 and click the filter icon (to the right of the text box), the list in this example will only
contain HU172404BF.
To clear the filter, click the Clear filter string icon.
Viewing the dashboard
The dashboard is the default screen when you select TapeAssure in the Navigation panel and
contains two tabs. The Health tab is open by default and displays the current state of the libraries
being managed by this CVTL management station and of the drives and tapes that are present in
those libraries; see “Viewing the Health tab” (page 46). The Libraries tab displays the allocation
details of the library capacity; see “Viewing the Library tab” (page 48).
The Actions menu at the top of the screen provides these options:
• Export Report to export the TapeAssure dashboard graphs and tabular data to a PDF file that
can be saved and printed
• Refresh to refresh the page with the most recent data
The toolbar at the top of the screen allows you to Refresh, Print, or Export to PDF.
Viewing the Health tab
The Health tab of the dashboard has four main parts:
• A pie chart containing the state of the licensed libraries, drives, and tapes. A red sector
indicates the number of libraries, drives, and tapes that are in the critical state, yellow indicates
the number that are in the warning state, and green indicates the number that are in the ready
state. If there is no health information available, that message is displayed instead of a pie
chart. The library health pie chart has an additional “unknown” state that means the data is
in the database but the library is not added to the management station. Beneath the pie charts
46 Command View TL GUI
Page 47

is a button that takes you to a summary of any specific libraries, drives, and tapes that need
attention (in critical or warning states). This information is only available for libraries with the
Advanced TapeAssure license.
• A table to the right of the pie charts lists the drives being polled by the hosts and the number
of hosts polling them. Clicking the linked number lists the hosts that are polling that drive.
• A table beneath the drives being polled table lists the hosts and the number of drives that each
one is polling. Clicking the linked number lists the drives being polled by each host. (This is
the same information as the table above it from the perspective of the hosts instead of drives.)
• The table across the bottom lists the most recent 100 alerts that have been received by the
management station.
Each of the tables contains a filter box to filter the rows based on the entered search criteria.
Using TapeAssure 47
Page 48

NOTE: The TapeAssure dashboard information can be viewed only for the libraries having a
TapeAssure Advanced license. If there are no libraries with the Advanced License, the following
message is displayed:
Insufficient data available to plot the graph or Command View TL
TapeAssure Advanced license is not available.
Please install the Command View TL TapeAssure Advanced license for the
appropriate tape libraries. To install a license, click 'Licensing' tab
on the left pane and add the Command View TL TapeAssure Advanced license.
NOTE: On initial installation of the Command View TL, you have a 60–day instant-on license
period and a subsequent 30–day grace period to install the TapeAssure Advanced license. For
both time periods, the reminder messages providing the time period expiration date are shown
on the dashboard. If you install TapeAssure Advanced licenses on all of the libraries, no reminder
messages are shown.
TapeAssure Advanced licenses are only available for MSL6480, ESL G3, Autoloader, and MSL
libraries. Therefore, on EML/ESL libraries, links to access details from the TapeAssure panels will
always be disabled.
Viewing libraries, drives, and tapes needing attention
This page, launched from the button on the Health tab of the TapeAssure dashboard, provides lists
of the libraries, drives, and tapes that need attention, meaning that they are in either the warning
or critical state.
Viewing the Library tab
The Libraries tab of the TapeAssure Dashboard shows the allocation details of each library’s slots
and drives capacity. It does not matter if the slots and drives are allocated to a partition or not or
if there are tapes present in the slots. The tab also lists all of the tapes and drives grouped by type
for all libraries with the Advanced TapeAssure license.
48 Command View TL GUI
Page 49

The Libraries tab of the dashboard has four main parts:
• Slots Allocation: A pie chart displaying the number of allocated (already assigned to a partition)
and unallocated (not assigned to a partition) slots for all of the libraries. Hovering over the
allocated portion of the chart displays the numbers of total slots, full slots (loaded with a tape
cartridge), empty slots (no tape cartridges loaded), and the percentage of slots allocated. For
a single library, the full or empty slots are for all the partitions of the selected library.
When you click the allocated portion of the pie chart, a window displays the number of
allocated slots for each library as both a bar graph and table. The details include the number
of full slots and empty slots. Click the linked library serial number to view the partition level
details for that library. Clicking the unallocated portion of the dashboard pie chart displays
the number of unallocated slots for each library; there is no partition level details.
Using TapeAssure 49
Page 50

• Drives Allocation: A pie chart displaying the number of allocated (already assigned to a
partition) and unallocated (not assigned to a partition) drives for all of the libraries. Hovering
over the allocated portion of the chart displays the numbers of total drives and the percentage
of drives allocated.
When you click the allocated portion of the pie chart, a window displays the number of
allocated drives for each library as both a bar graph and table. Click the linked library serial
number to view the partition level details for that library.
Clicking the unallocated portion of the dashboard pie chart displays the number of unallocated
drives for each library; there is no partition level details.
• Drives by type: A bar chart showing the type of drives on each library (LTO4, LTO5, LTO6,
older LTOs, and unknown), and the number of each type of drive.
• Tapes by type: A bar chart showing the type of tapes on each library (LTO4, LTO5, LTO6,
older LTOs, and unknown), and the number of each type of tape.
NOTE: The TapeAssure dashboard information can be viewed only for the libraries having a
TapeAssure Advanced license. If there are no libraries with the Advanced License, the following
message is displayed:
Insufficient data available to plot the graph or Command View TL
TapeAssure Advanced license is not available.
If the data is not available for a specific chart, the following message is displayed:
TapeAssure Data Not Available to plot [chart name].
For ESL G3 libraries, the drives and tapes must be in the partition to view the library TapeAssure
information.
50 Command View TL GUI
Page 51

Library TapeAssure views
Library TapeAssure offers three different tabular views.
• Overview tabular view — displays information for all the libraries for which the Library
TapeAssure information is available in the CVTL MS database.
• Partition tabular view — displays information for a selected library for which the Library
TapeAssure information is available in the CVTL MS database.
• Usage tabular view — displays information for all the libraries for which the Library TapeAssure
information is available in the CVTL MS database.
NOTE: Library TapeAssure features are supported for the MSL G3, ESL G3, and MSL 6480
libraries only.
Overview tabular view
The Library TapeAssure Overview tabular view displays information for all the libraries for which
the Library TapeAssure information is available in the CVTL MS database.
To launch the Overview Tabular Data, go to TapeAssure→Libraries→Overview and click on the
Overview node.
If there is no data, then a message is displayed stating:
Library Overview is not available or libraries are using an older
firmware. Please upgrade to an appropriate firmware for the tape
libraries.
Table 14 (page 51) shows the tool tips for the Overview tabular view dialog box.
Table 14 Overview tabular view tool tips for column headers
Tool TipColumn Header
The HP serial number of the library (for support use)Library SN
Description of the libraryLibrary Description
IP addressIP Address
Hostname of the libraryLibrary Hostname
Firmware revision of the libraryLibrary Firmware Revision
Number of storage slotsStorage Slots
Number of drivesLibrary Drives
Number of mail slotsMail slots
Using TapeAssure 51
Page 52

Table 14 Overview tabular view tool tips for column headers (continued)
Tool TipColumn Header
Number of frames (modules)Frames/Modules
Number of partitionsLibrary Partitions
The time at which the last sample was takenLast Sample Time
Partition tabular view
By default when the Overview tabular view is displayed the first library is highlighted and the
partition tabular view for the corresponding library is display below. By clicking on particular row
of the Overview table, the corresponding partition for the selected library gets displayed in the
partition table.
NOTE: If there is no partition available for the selected library, a message is displayed stating:
Partition data is not available for the selected library.
Table 15 (page 52) shows the tool tips for the Overview tabular view dialog box.
Table 15 Partition tabular view tool tips for column headers
Tool TipColumn Header
Serial number of the partitionPartition Serial Number
Partition number of the libraryLibrary Partition Number
Encryption configuration:Encryption Config
• Library managed (off) PLK Midrange Encryption Control
Token
• Library managed ESKM (HP Enterprise Secure Manager)
• Library managed KMIP (Key Management
Interoperability Protocol)
• Application managed
Control path failover configuration:Control Path Failover
• Basic (off) — The MSL tape libraries provide a basic
control path failover capability
• Advanced — The HP ESL G3 tape libraries provide an
advanced library control path failover
Number of drives in the partitionNumber of Drives
52 Command View TL GUI
Page 53

Table 15 Partition tabular view tool tips for column headers (continued)
Usage tabular view
The Library TapeAssure Usage tabular view displays information for all the libraries for which the
Library TapeAssure information is available in the CVTL MS database.
To launch the Usage Tabular Data, go to TapeAssure→Libraries→Usage and click on the Usage
node.
If there is no data, then a message is displayed stating:
Library Usage data is not available or libraries are using an older
firmware. Please upgrade firmware for the appropriate tape libraries.
Tool TipColumn Header
Number of slots in the partitionNumber of Slots
Number of mail slots in the partitionNumber of Mail Slots
Table 16 (page 53) shows the tool tips for the Usage tabular view dialog box.
Table 16 Usage tabular view tool tips for column headers
NOTE: Library TapeAssure features are supported for the MSL G3, ESL G3, and MSL 6480
libraries only.
Empty slots per library
The library empty slots data chart is displayed under the Libraries link in the TapeAssure tab. The
Library empty slots information is displayed in both a tabular and graphical view. The graphical
Tool TipColumn Header
The HP serial number of the library (for support use)Library SN
Description of the libraryLibrary Description
Hostname of the libraryLibrary Hostname
Total number of moves over the lifetime of the libraryMoves
Total number of power cycles in the libraryLibrary Power Cycles
Total time the library was powered onLibrary Total Power on Time
Power on time since the last power cycleLibrary Current Power on Time
The time at which the last sample was takenLast Sample Time
Using TapeAssure 53
Page 54

view will be shown as a bar chart for a particular tape library over a particular time period. The
Empty Slots graph shows the number of empty slots available per library.
Launching empty slots chart
A TapeAssure Advanced license is required to display the empty slots chart. If no TapeAssure
Advanced license is found, the following error message will be displayed:
Insufficient data available to plot the graph or Command View TL
TapeAssure Advanced license is not available.Please install the Command
View TL TapeAssure Advanced license for the appropriate tape libraries.
To install a license, click 'Licensing' tab on the left pane and add
the Command View TL TapeAssure Advanced license.
If there is no data available for a particular library or the library is using an older firmware version
the following message will be displayed:
The chart is not available for one of the following reasons:
There is not enough data for the selected time period.
The library is using an older firmware. Please upgrade firmware for the
appropriate tape libraries.
To launch empty slots chart:
1. From the left navigation tree, select TapeAssure→Libraries→Empty Slots.
The Empty Slots dialog box is displayed.
2. Specify the library serial number and time period.
a. Select a library from the drop down list.
b. Select a Sample Time from the list provided. By default Last Month is selected.
3. Click Plot Chart.
The Empty Slots chart is displayed.
54 Command View TL GUI
Page 55

Empty slot chart view
The empty slots information is displayed in both a tabular and graphical view. By default, data is
displayed in the graphical view. To see the data in the tabular view, click Go to Tabular View.
The graphical view displays the data where the Y-axis is the number of empty slots and the X-axis
is the Date/Time. The value of the Y-axis is dependant on the number of empty slots. The X-axis
display the date and time of the support ticket.
NOTE: Hovering over the data point’s data tip will show the empty slots and the date.
The date format is presented as mm/dd/yyyy and the time format is displayed as HH:MM AM/PM.
Slider and Zoom effect — A replica of the original chart is displayed as a miniature chart at the
top of the dialog. Sliders can be used to zoom in and out on a specific data range.
Empty slots tabular view
Tabular view data is displayed for all the days in which support ticket data is available.
Using TapeAssure 55
Page 56

NOTE: Data filtered in the tabular view will also filter data in the graphic view.
Select Sample Time — Select a sample time from the list provided or select a custom range by
entering the start and end dates; see “Choosing a sample time” (page 66).
NOTE: Library TapeAssure features are supported for the MSL G3, ESL G3, and MSL 6480
libraries only.
Moves per library
The moves per library data chart is displayed under the Libraries link in the TapeAssure tab. The
Library Moves information is displayed in both a tabular and graphical view. The data is shown
as a line chart for a particular tape library over a particular time period.
The Moves graph shows the number of moves (tapes moved from slot to drive or vice versa and
slot to slot) performed per library.
Launching moves chart
To launch the moves chart:
1. From the navigation tree, select TapeAssure→Libraries→Moves.
The Media Moves dialog box is displayed.
56 Command View TL GUI
Page 57

2. Specify the library serial number and time period.
a. Select a library from the drop down menu.
b. Select a Sample Time from the list provided. By default Last Month is selected.
NOTE: A TapeAssure Advanced license is required to display the chart. If no TapeAssure
Advanced license is found, the following error message will be displayed:
Insufficient data available to plot the graph or Command View TL
TapeAssure Advanced license is not available. Please install the
Command View TL TapeAssure Advanced license for the appropriate tape
libraries. To install a license, click 'Licensing' on the left pane
and add the Command View TL TapeAssure Advanced license.
If there is no data available for a particular library or the library is using an older firmware
version the following message will be displayed:
The chart is not available for one of the following reasons:
There is not enough data for the selected time period.
The library is using an older firmware. Please upgrade firmware for
the appropriate tape libraries.
3. Click Plot Chart.
The Moves chart is displayed.
Moves chart
The moves chart information is displayed in both a tabular and graphical view. By default, data
is displayed in the graphical view. To see the data in the tabular view, click Go to Tabular View.
The graphical view displays the data where the Y-axis is the number of moves and the X-axis is
the Date. The X-axis displays the date according to the zoom in and zoom out range.
The date is displayed as mm/dd/yy. When grouped by months the date is displayed as mm/yy
and when grouped by year the date is displayed as yyyy. Grouping is dependant on the amount
of data available. If no support tickets are available for a particular day, the data point will not
be plotted in the graph.
Using TapeAssure 57
Page 58

NOTE: Hovering over the data point’s data tip will show the moves count and the date. The date
is displayed as mm/dd/yyyy.
Slider and Zoom effect — A replica of the original chart is displayed as a miniature chart at the
top of the dialog. The slider can be used to zoom in and out on yearly, monthly, weekly, and daily
level. The minimum time period is one day. The end of the slider displays the dates relevant for
the period as they are changed.
Moves tabular view
Tabular view data is displayed for all the days in which support ticket data is available. Grouping
is not allowed in the tabular view. To view the data in the graphical view, click Back to Graphical
View.
58 Command View TL GUI
Page 59

Select Sample Time — Select a sample time from the list provided or select a custom range by
entering the start and end dates; see “Choosing a sample time” (page 66).
NOTE: Library TapeAssure features are supported for the MSL G3, ESL G3, and MSL 6480
libraries only.
Sorting and filtering
Sorting is string based or number based depending on the data type.
Filter is string based, similar to other TapeAssure tabular data viz: Drive Health, Media Health,
etc. While filtering on the Overview table, for a successful filter the first row from the filtered row
is automatically selected and the corresponding partition information is displayed below in the
partition table.
If the Export to PDF icon is clicked or the Export Report menu is selected after filtering, the report
would show only the filtered data. If there is no data to be shown after a filter then the Export to
PDF icon remains disabled.
Action menu drop down list
The Action menu bar is located at the top of the Overview dialog box. The Action drop down the
following options:
• Export Report — generates a report
• Refresh — refreshes table data
Application bar
The Application bar is located at the top of the Overview dialog box. The Application bar has the
following options:
Table 17 Application bar icons
Viewing drive health
To access health information for a specific drive:
1. In the Launcher window, click the TapeAssure tab.
2. In the Navigation panel under Drives, select Health. A list of the tape drives in the libraries
managed by this management station appears.
3. Click on the drive, then select Actions→Properties, or double click the row, to launch the drive
properties.
4. Click the Overall Health link to open the drive health graphs.
Click the Refresh icon to refresh the data.
Click on the Print icon to export data to a PDF.
Click the PDF icon to export data to PDF.
NOTE: When exporting to a PDF from the Overview
dialog, the library’s overview data for each library is
exported and the partition data is displayed below it.
Click the Help icon to navigate to the Help page.
Using TapeAssure 59
Page 60

The TapeAssure drive health tab lists:
• Serial Number—The serial number of the drive. This is a static value and will change if a drive
has been replaced. Use the serial number when contacting HP support.
• Overall Health – An Overall Health icon and a details link allow you to view the Drive Health
and Life graphs and tabular data.
• Drive Type—The drive type including generation and interface type.
• Library Serial Number—The HP serial number that uniquely identifies the library. Defined at
manufacture, this is the number to quote when contacting HP support.
• Write Quality—A measure of the amount of tape used to write high quality data to the last
loaded tape followed by the amount of data written to the tape since it was last loaded.
Even if the warning is reported, the data will still have been written at high quality (unless the
drive reported an error) though more tape was used than recommended by HP. Note that a
warning will normally trigger an alert.
If appropriate, maintenance recommendations are made, such as to clean the drive and/or
replace the tape.
• Read Quality—A measure of the ease with which data was read back from the most recently
loaded tape followed by the amount of data read from the tape since it was last loaded.
Even if the warning is given, the data will have been read back correctly (unless the drive
reported an error) though more error correction was required than recommended. Note that
a warning will normally trigger an alert
If appropriate, maintenance recommendations are made, such as to clean the drive and/or
replace the tape.
• Head Life (% Life Remaining)—The percentage of remaining head life based on the amount
of tape passed over the head compared with worst case life expectancy testing in a clean
environment.
If a life warning is shown, the drive should be replaced at the next maintenance period.
• Reposition Life (% Life Remaining)—The percentage of remaining reposition life based on the
number of changes in direction of the tape over the life of the drive compared with the worst
case life expectancy in a clean environment.
If a life warning is shown, the drive should be replaced at the next maintenance period.
60 Command View TL GUI
Page 61

• Load/Unload Life—The percentage of remaining drive load/unload life based on the number
of load/unload cycles over the life of the drive compared with worst case life expectancy
testing in a clean environment.
If a life warning is shown, the drive should be replaced at the next maintenance period.
• Service Action—A recommendation for service based on the health criteria. More than one
service action may apply; hover over the entry with the mouse to see a tool tip containing all
recommended service actions for the drive.
Viewing Drive Health and Life
The Drive Health and Life shows the recent health history of a particular drive. Library administrator
can view health related information including a graph showing what the drive health has been
across the last several backups. In addition, you can drill down into the recent health history of
any tapes used by that drive. This helps determine if there is a problem with the drive or with a
particular tape being used by that drive.
To view the Drive Health and Life:
1. In the Launcher window, click the TapeAssure tab.
2. In the Navigation panel under Drives, select Health. A list of all of the drives appears.
Alternatively, in the Navigation panel under Dashboard, select Drives and Tapes Needing
Attention. A list of all drives that need attention (in a critical or warning state) appears.
3. Click on the drive, then select Actions→Properties, or double click the row, to launch the drive
properties.
NOTE: Details links are only enabled for drives that belong to licensed libraries.
4. Click the Overall Health link to open the drive health graphs.
The Drive Health/Life window displays the following:
• Drive Serial Number
• Library Serial Number
• Overall Health – calculated based on the recent worst status of the drive health parameters
HeadLifeQual, LoadLifeQual, RepoLifeQual and WriteHealth
• Write Health/Read Health – based on the latest support ticket
Write Health tab
The Write Health tab shows the write health history of the drives for different tapes as both a graph
and a table.
Using TapeAssure 61
Page 62

On the graph, the red, yellow, and green bands represent the critical, warning, and healthy status,
respectively, of the drive write health. The X-axis represents the barcode/cartridge serial number
and the Y-axis represents the write health of drive.
The table displays the barcode/cartridge serial number, the date/time, and the write health of the
drives of the tapes.
Use the Sample Time to filter the write health history for all the tapes loaded onto a drive between
the specified time intervals. In addition, each barcode/cartridge serial number is a link to the tape
write health history.
To export the report as a PDF, click Export Report at the bottom of the graph. This will allow you
to save the graph locally or email it. You can also export only the graphs or the complete report.
Life tab
A set of parameters decide the life of a drive and they deteriorate over time due to wear and tear.
Each backup leads to the generation of a Support Ticket that contains information about the quality
of the backup. These life parameters keep reducing with each backup. The Life tab shows the trend
of deterioration of the life parameters and recommends the action to be taken before the drive
becomes unusable.
The following are the life parameters of a drive and are compared to the HP recommended
specification:
• DriveHeadLife – the remaining headlife of the drive
• DriveLoadLife – the remaining load/unload life of the drive
• DriveRepositionLife – the remaining reposition life of the drive
A simple regression is done on the historical data that the management station has collected over
a period of time for these life parameters. As a result, there is a trend line for each parameter. The
trend line with a greater slope value indicates that the parameter is deteriorating at a faster pace
than the others and determines the life of the drive (this parameter leads to the drive being unusable
faster than the other parameters). The screen displays the trend line of the parameter that is
degrading at the fastest pace. The trend line is then extrapolated to know when this parameter
62 Command View TL GUI
Page 63

would become 0 in time; based on this date, a set of recommendations are made for this drive.
There are three kinds of messages for the life of a drive:
• Drive is at the end of its recommended life – if any of the drive’s life parameters are already
less than or equal to 0 based on last sample date
• Drive is nearing the end of its recommended service life — when drive life trend data for
<drive serial number> indicates the drive will reach the end of its serviceable life within the
next six months
• Drive is within the recommended serviceable life — when drive life trend data for <drive serial
number> indicates the drive will not reach the end of its serviceable life within the next six
months
NOTE: All the analysis and recommendations are based on the date when the last support ticket
was received by the management station for a particular tape/drive.
Viewing drive performance
To access performance information for a specific drive:
1. In the Launcher window, click the TapeAssure tab.
2. In the Navigation panel under Drives, select Performance. A list of the tape drives in the
libraries managed by this management station appears.
3. Click on the drive, then select Actions→Properties.
4. To view the drive performance and utilization history of a particular drive, click the linked
serial number. See “Viewing drive performance and utilization history” (page 67).
Using TapeAssure 63
Page 64

The TapeAssure drive performance tab lists:
• Serial Number—The serial number of the drive. This is a static value and will change if a drive
has been replaced. Use the serial number when contacting HP support.
• Drive Type—The drive type including generation and interface type.
• Library SN (or Hostname)—The HP serial number that uniquely identifies the library. Defined
at manufacture, this is the number to quote when contacting HP support.
• Media Transfer Rate—The transfer rate of the data, after compression, transferred to/from the
tape since the last load.
• Estimated Host Transfer Rate—The estimated transfer rate of the host averaged over the data
transferred to/from the tape since the last load.
• Write Compression Ratio —The average write compression ratio of the data written to tape
since the last load.
• Read Compression Ratio—The average read compression ratio of the data read from tape
since the last load.
• Last Sample Time—The local time when the key data was written to the database.
64 Command View TL GUI
Page 65

Viewing drive utilization
To access utilization information for a specific drive:
1. In the Launcher window, click the TapeAssure tab.
2. In the Navigation panel under Drives, select Utilization. A list of the tape drives in the libraries
managed by this management station appears.
3. Click on the drive, then select Actions→Properties.
4. To view the drive performance and utilization history of a particular drive, click the linked
serial number. See “Viewing drive performance and utilization history” (page 67).
The TapeAssure drive utilization tab lists:
• Library SN (or Hostname)—For drives in libraries, this column displays the serial number of
that library. For standalone drives, this column shows the hostname of the server to which the
drive is attached. Such hostname entries are highlighted with an asterisk (*).
• Drive Type—The drive type including generation and interface type.
• Library Serial Number—The HP serial number that uniquely identifies the library. Defined at
manufacture, this is the number to quote when contacting HP support.
• Sample Size—The Interface Manager samples data from the drive by retrieving key statistics
from the drive. This occurs after a tape unload, or whenever a user generates a support ticket.
A sample refers to one instance of pulling the key statistics from the drive. The sample size is
the number of times the TapeAssure feature has retrieved these key statistics within the user
selected sample time.
• Utilization (%)—Measure of the time that the tape drive has been pulling tape divided by the
amount of time that the tape drive has been powered on. Use this for measuring utilization
from the hardware standpoint.
• Last Sample Time—The local time when the key data was written to the database.
When a management station is reconnected to the network after more than 24 hours offline, the
utilization panel display can be inaccurate. The TapeAssure data queued up on active drives and
libraries arrives in bulk. To display a more accurate utilization, select Actions→Choose Sample
Time, and choose the next longest time frame (7 days or more).
Using TapeAssure 65
Page 66

Choosing a sample time
To choose the time frame for the data samples:
1. Open the Select Sample Time window. This window can be opened from several places within
CVTL. The sample times available depend on which feature the window was opened from.
You will see one of the following windows:
66 Command View TL GUI
Page 67

2. Select the sample time for the data to be retrieved from the current date and time range.
• Last 24 Hours (not available for some features)
• Last 7 Days and Week (not available for some features)
• Last Month
• Last Three Months
• Last Six Months
• Last Year
• Custom Range: Provide a start date and end date; the start date and end date are
pre-populated with the previous month date and current date, respectively. The data will
be retrieved from 12:00 a.m. on the start date to 11:59 p.m. on the end date. The custom
range should be at least one month long.
3. Click OK.
Viewing drive performance and utilization history
The drive performance and utilization history panel displays the drive serial number, drive type,
library serial number, and sample time. The default sample time is one month. To view the drive
performance and utilization history of a drive, use one of the following procedures:
1. Navigate to the Drive Utilization or the Drive Performance tab.
2. Click the linked serial number. The Drive Performance and Utilization History page opens and
contains three tabs: Drive Performance, Drive Utilization, and Utilization Analysis.
Or:
1. Navigate to the Tape Utilization tab.
2. Click the linked serial number. The Tape Performance and Utilization History page opens and
contains three tabs: Tape Capacity, Tape Unloads, and Tape Performance.
3. On the Tape Capacity or the Tape Performance tab, click the drive serial number link. The
Drive Performance and Utilization History page opens and contains three tabs: Drive
Performance, Drive Utilization, and Utilization Analysis.
If the drive has not been utilized over the selected time period, no data is shown in the graphical
view.
Using TapeAssure 67
Page 68

Drive Performance tab
In the Drive Performance tab, information about drive performance over the last several backups
is shown. There are two bar graphs for each day representing the native transfer rate and the host
transfer rate.
The X-Axis displays the tape's serial number and date. The serial number is a link that launches
the Tape Performance and Utilization Dialog that defaults to the Tape Performance tab. The Y-Axis
displays the transfer rate in MB/s with values ranging from 0 to 400.
Hovering over or clicking a host transfer rate data point on the graph displays a tool tip that shows
the tape serial number, barcode, and the date and time. On the Host transfer rate graph it also
shows the estimated host rate in MB/sec and the compression ratio. On the Native transfer rate
graph it also shows the native transfer rate in MB/sec.
68 Command View TL GUI
Page 69

Beneath the graph, the following utilization data is shown in a table:
• Barcode/serial number
• Date/time
• Estimated host transfer rate
• Write compression ratio
• Read compression ratio
• Native transfer rate
Drive Utilization tab
In the Drive Utilization tab, the default time scale is Daily Average. The Daily Average scale shows
a bar graph of drive utilization per day over the selected period of time.
On the bar graph, the X-axis shows the days the drive is utilized and the Y-axis shows the drive
utilization percentage.
Using TapeAssure 69
Page 70

Hovering over a data point displays a tool tip with the date and percentage of time the drive was
accessing the tape.
Beneath the graph, the following utilization data is shown in a table:
• Date – when the drive is utilized
• Percentage Utilized – how much time is been spent by the drive to pull a tape
70 Command View TL GUI
Page 71

You can choose a new time frame for the data samples. See “Choosing a sample time” (page 66)
for details. To choose the time scale, click the Time Scale drop-down list on the Utilization tab and
select Per Support Ticket; information about how the drive is being utilized between two support
tickets is displayed in a line graph.
You can zoom into this graph to see yearly, monthly, weekly, and daily information.
The X-axis displays the time period; it shows the date accordingly as you zoom in and zoom out.
The Y-axis, the utilization percentage, starts from 0 to 100, with the interval of 20.
Hovering over a data point displays a tool tip with the utilization percentage (time spent pulling
a tape) and the date. The date is in MM/DD/YYYY HH:MM AM/PM format.
At the top of the main graph, a preview-graph is shown to help you visualize which part of the
total graph you are viewing by zooming. The slider will be placed below the preview-graph, which
can be used to zoom the graph yearly, monthly, weekly and daily. The date will change on the
X-axis accordingly. The minimum time period that can be zoomed in is one day. The end of the
slider displays the dates relevant for the period as they are being changed. The sliders will not
cross over.
Utilization Analysis tab
On the Utilization Analysis tab, you can select up to three drives to compare their utilization. To
generate the graph:
Using TapeAssure 71
Page 72

1. The Drive Selection section, the Select Drives table shows each library; click a library to see
the drives listed for it. Select the drives of interest and use the >> button to move them to the
Selected Drives table. You can remove a drive from the Selected Drives table using the <<
button.
2. In the Time Scale section, you select the filter criteria (known as the computational argument)
for use in the comparison. When you choose one of the following, additional selection criteria
are provided:
• Day of Week — select a start and end date, select the days of the week of interest, then
select the time period for each day.
72 Command View TL GUI
Page 73

• Daily Average — this is the default. You can select the start and end dates.
• Monthly Average — select the start and end month and the years.
• Quarterly Average — select the start and end quarters and the years.
3. Click Plot Chart. The utilization trends are shown for the selected drives in a line graph. Beneath
the line graph, the information is displayed in a table. You can change the computational
argument by clicking Change Selection above the graph.
Using TapeAssure 73
Page 74

4. To export the report as a PDF, click Export Report at the bottom of the graph. This will allow
you to save the graph locally or email it.
NOTE: Exporting the graph to a PDF converts the 3D bar graph to a 2D line graph.
Viewing the Performance Advisor graph
The Performance Advisor graph is a single view to get the entire picture of drive in terms of
performance and utilization for the given library and within the time frame. This helps to visualize
the status of drives regarding how they are performing and how they have been utilized for the
given time period. You can also get details for each drive and analyze details of performance and
utilization for each day for the given time interval.
To plot the Performance Advisor graph:
1. In the Launcher window, click the TapeAssure tab.
2. In the Navigation panel, select Performance Advisor.
3. Select the serial number of the library from the drop down box. Select the sample time from
the options provided, or create a custom range.
NOTE: The serial number of a library only appears in the drop down list if the TapeAssure
Advance License is available in the management station for that library.
4. Click Plot Chart. The Performance Advisor graph for the selected library appears. The
Performance Advisor graph appears if there is TapeAssure data available for the particular
library for the time interval selected.
The Performance Advisor graph measures performance along the X-axis and utilization along the
Y-axis. The graph is divided into four different zones:
• High Utilization – High Performance: the drives that are at 70% and above of utilization and
performance
• High Utilization – Low Performance: drives that are highly utilized but their performance is
low (less than 50% of the maximum speed of writing)
74 Command View TL GUI
Page 75

• Low Utilization – High performance: drives that have high performance but low utilization
(less than 50%)
• Low Utilization – Low Performance: drives that are neither utilized to their potential nor able
to perform to their maximum stipulated capacity
All drives which have utilization and performance values will be plotted as data points and listed
as the legend to the right of the graph. Hovering over each data point brings up a tool tip showing
how each drive performed in terms of utilization and performance in the give time interval; the
tool tip lists:
• Drive serial Number – the serial number of the drive. This is a static value and will change if
a drive has been replaced. Use this serial number when contacting HP support.
• Drive Type – the drive type including generation and interface type.
• Performance (%) – the performance of the drive over the time period calculated as a percentage
value.
• Host Transfer Rate – transfer rate of the host averaged over the data transferred to/from the
tape since the last load.
• Max Transfer Rate – the maximum specified native transfer rate of the drive.
• Utilization (%) – utilization of the drive over the time period calculate as a percentage value.
From the graph you can do several things:
• Change the sample time – click the Sample Time link; see “Choosing a sample time” (page 66)
for details on changing the sample time. You can also get there from Actions→Change sample
time or Actions→Change library and sample time.
• Return to the Performance Advisor selection page by clicking the Back to selection page link.
• Change the library by selecting a new library from the Library name drop down list, by
Actions→Change library, or by Actions→Change library and sample time.
NOTE: The performance advisor graph can be viewed only for the libraries having a TapeAssure
Advanced license. If there are no libraries with the Advanced License, the following message is
displayed:
Insufficient data available to plot the graph or Command View TL
TapeAssure Advanced license is not available.
Please install the Command View TL TapeAssure Advanced license for the
appropriate tape libraries. To install a license, click 'Licensing' tab
on the left pane and add the Command View TL TapeAssure Advanced license.
NOTE: For a chosen library in given time interval, two or more drives might have exactly same
utilization and performance values. In these cases, the data points will overlap. Click these points
to launch the top-most drive detailed graph, or click the library in the legend to launch the individual
drive detailed graph.
Viewing the Collection Status
The TapeAssure Collection Status displays the libraries that are registered with the Management
Station listed by library type. It also lists those libraries managed by other management stations.
To view the Collection Status:
1. In the Launcher window, click the TapeAssure tab.
2. In the Navigation panel, select Collection Status.
Using TapeAssure 75
Page 76

The Collection Status provides three help links for:
• Configuring ESL, EML, ESL G3, or MSL6480 libraries to send TapeAssure data to this
Management Station
• Configuring MSL libraries to send TapeAssure data to this Management Station
• Configuring Standalone Drives for TapeAssure
Viewing drive performance and utilization graph
The drive performance and utilization graph shows performance and utilization information for a
particular drive for each day during the time interval selected. The bar graph shows three bars for
each day: native transfer rate and host transfer rate (for performance), and utilization. Beneath
the graph, the data is shown in a table.
To plot the graph, click any data point in the Performance Advisor graph or click on any of the
legends listed on the right. The Drive Performance and Utilization graph is displayed.
76 Command View TL GUI
Page 77

Hovering over each bar provides the following information:
• Native transfer rate
Date – The date for which the native transfer rate is calculated.◦
◦ Native Transfer Rate – The transfer rate of the data, after compression, transferred to/from
the tape for that particular day.
• Host Transfer rate
Date – The date for which the host transfer rate is calculated.◦
◦ Estimated Host Transfer Rate – The estimated transfer rate of the host averaged over the
data transferred from the host for that particular day.
◦ Compression Ratio – The weighted average of write and read compression ratio of the
data written/read to tape for that particular day.
• Utilization
Date – The date for which the utilization is calculated.◦
◦ Percent time spent pulling tape – Measure of the time that the tape drive has been pulling
tape divided by the amount of time that the tape drive has been powered on. Use this
for measuring utilization from the hardware standpoint.
The tabular view lists all of the information above. It also provides a Sample Time link that launches
a window that allows you to select a different sample time to plot; see “Choosing a sample time”
(page 66) for details.
Click Export Report to export the graph as a PDF file either downloaded locally or sent by email.
Viewing detailed LTO drive information
The Drive Properties page contains detailed information about the identity, health, environment,
performance, and usage of a tape drive, along with detailed information about the last tape loaded
into the tape drive.
To open the Drive Properties page for a specific drive:
1. Select the TapeAssure tab.
2. In the Navigation panel under Drives, click Performance, Health, or Utilization to access a list
of the drives enrolled this management station.
3. Click on the drive, then select Actions→Properties.)
The default tab is whichever item was selected in the Navigation tree to list the drives. For
example, if you clicked on Performance, the Drive Properties page will open to the Performance
tab.
Using TapeAssure 77
Page 78

At the top of the dialog box, above the tabs, the following information appears:
Table 18 Viewing Drive Properties
DescriptionItem
The serial number of the drive.Drive Identification
The current status of the drive.Health
Serial Number
Last Loaded Tape
This information remains visible when any tab is selected.
4. Click the Overview tab.
The Overview page appears.
Figure 7 Drive Properties window Overview tab
The serial number of the drive. This is a static value and
will change if a drive has been replaced. Use the serial
number when contacting HP support.
The serial number and barcode of the last tape loaded
into the drive.
The time at which the last sample was taken.Last Sample Time
Information provided on the Overview page is explained in Table 19.
Table 19 Information available from the Drive Properties window Overview tab
Identification
Serial Number
Firmware Revision
Firmware Personality
78 Command View TL GUI
DescriptionItem
The drive type including generation and interface type.Drive Type
The serial number of the drive. This value will change
if a drive has been replaced. Use the serial number
when contacting HP support.
The version of drive firmware the drive is currently
operating with.
An identifier that distinguishes the firmware among
multiple possible variants.
Page 79

Table 19 Information available from the Drive Properties window Overview tab (continued)
DescriptionItem
Configuration
Data Compression
Media Removal
5. Click the Health tab.
The Health page appears.
Figure 8 Drive Properties window Health tab
Usually set by the backup application. If enabled, the
drive will perform hardware data compression. Refer
to the backup application to configure data compression
for backups.
Usually set by the backup application. If prevented then
the tape cannot be removed from the drive. Normally,
media removal is enabled after the backup is complete
but if the backup aborts it is possible that media removal
will still be prevented. Refer to HP support documentation
for resolution.
The negotiated SCSI data rate.Negotiated SCSI Burst Rate property
Information provided on the Health page is explained in Table 20 (page 79).
Table 20 Information available from the Drive Properties window Health tab
DescriptionItem
Read/Write health (last loaded tape)
Write Health
A measure of the amount of tape used to write high
quality data to the last loaded tape with the amount of
data written to the tape since it was last loaded.
Even if the warning is reported, the data will still have
been written at high quality (unless the drive reported
an error) but more tape was used than recommended
by HP. A warning will normally trigger an alert. If
Using TapeAssure 79
Page 80

Table 20 Information available from the Drive Properties window Health tab (continued)
DescriptionItem
appropriate, maintenance recommendations are made,
such as to clean the drive and/or replace the tape. HP
recommends the use of HP media for maximum
confidence.
Read Health
Drive Life
Head Life
Reposition Life
A measure of the ease with which data was read back
from the most recently loaded tape with the amount of
data read from the tape since it was last loaded.
Even if the warning is given, the data will have been
read back correctly (unless the drive reported an error)
but more error correction was required than
recommended. Note that a warning will normally trigger
an alert. If appropriate, maintenance recommendations
are made such as to clean the drive and/or replace the
tape. HP recommends the use of HP media for maximum
confidence.
An estimate of the percentage of remaining head life
based on the amount of tape passed over the head
compared with worst case life expectancy testing in a
clean environment. HP recommends HP media for
increased head life.
If a life warning is shown, the drive should be replaced
at the next maintenance period. HP recommends HP
media for increased head life.
An estimate of the percentage of remaining reposition
life based on the number of changes in direction of the
tape over the life of the drive compared with the worst
case life expectancy in a clean environment. HP
recommends HP media for increased reposition life.
If a life warning is shown, the drive should be replaced
at the next maintenance period. HP recommends HP
media for increased reposition life.
Load/Unload Life
Device Analysis
6. Click the Environment tab.
The Environment page appears.
80 Command View TL GUI
An estimate of the percentage of remaining drive
load/unload life based on the number of load/unload
cycles over the life of the drive compared with worst
case life expectancy testing in a clean environment. HP
recommends HP media for increased load/unload life.
If a life warning is shown, the drive should be replaced
at the next maintenance period. HP recommends HP
media for increased load/unload life.
The results of the last analysis of the drive.Result
Page 81

Figure 9 Advanced LTO Drive Properties Environment tab
Information provided on the Environment page is explained in Table 21 (page 81).
Table 21 Information available from the Drive Properties window Environment tab
DescriptionItem
Internal Temperature
Current Temperature
Max Temperature (since last power cycle)
The current temperature reported by the sensor located
on the drive controller board. The current temperature
value will be significantly higher than ambient
temperature but dependent on it, as well as drive usage
and air flow. The algorithm that assesses whether the
drive is in specification takes account of the location of
the sensor and uses that to estimate the thermal
conditions of the tape path.
If a warning is shown, the airflow for the drive should
be improved. If this cannot be corrected, contact HP
support. Note that a warning will normally trigger an
alert.
The maximum operational temperature reported by the
sensor located on the drive controller board since the
last power cycle with an assessment of whether the
maximum temperature of the tape path is within
specification. The maximum temperature value will be
significantly higher than ambient temperature but
dependent on it as well as drive usage and air flow.
The algorithm that assesses whether the drive is in
specification takes account of the location of the sensor
and uses that to estimate the thermal conditions of the
tape path.
If a warning is shown, the airflow for the drive should
be improved. If this cannot be corrected, contact HP
support. Note that a warning will normally trigger an
alert.
Using TapeAssure 81
Page 82

7. Click the Performance tab.
The Performance page appears.
Figure 10 Drive Properties window Performance tab
Information provided on the Performance page is explained in Table 22 (page 82).
Table 22 Information available from the Drive Properties window Performance tab
DescriptionItem
Data Transfer
Estimated Host Transfer Rate
Media Transfer Rate
Maximum Media Transfer Rate
Compression
Write Compression Ratio
Read Compression Ratio
The estimated transfer rate of the host averaged over
the data transferred to/from the tape since the last load.
The actual, measured native transfer rate with that drive
and tape.
The Maximum Media Transfer Rate is determined by
the drive type and represents the maximum native
transfer rate specified for that drive type.
The average write compression ratio of the data written
to tape since the last load.
The average read compression ratio of the data read
from tape since the last load.
8. Click the Usage tab.
The Usage page appears.
82 Command View TL GUI
Page 83

Figure 11 Drive Properties window Usage tab
Information provided on the Usage page is explained in Table 23 (page 83).
Table 23 Information available from the Drive Properties window Usage tab
DescriptionItem
Usage Statistics
Power On Time
Tape Pulled
Load/unload Cycles
Percent Tape Loaded
Duty Cycle
Total power on time of the drive since it was
manufactured.
Total tape pulled through the drive expressed in terms
of the equivalent number of full volume writes or reads.
Total number of tape loads for the drive since it was
new.
A comparison of the time the tape was in the drive with
the time since the time it was loaded and the following
tape load expressed as a percentage. For example, if
the time between the two tape loads was 4 hours and
this tape was in the drive for the first hour of that time
then the tape loaded percent will be 25%. Use this for
measuring utilization of the drive from the application
standpoint.
Duty cycle of the drive since the last tape load. This is
a comparison of the time the drive has been active with
the time since the last tape load expressed as a
percentage. For example, if the last tape load was 4
hours ago and the drive has been active for 3 hours
since then, the duty cycle will be 75%. Use this for
measuring utilization from the hardware standpoint.
Power Cycles
Number of drive power cycles since the drive was
manufactured.
Using TapeAssure 83
Page 84

Table 23 Information available from the Drive Properties window Usage tab (continued)
DescriptionItem
Cleans
Firmware Upgrades
9. Click the Last Loaded Tape tab.
The Last Loaded Tape page appears.
Figure 12 Drive Properties window Last Loaded Tape tab
Number of times the drive has been cleaned since it
was manufactured.
The number of times the drive has been updated with
firmware.
Information provided on the Last Loaded Tape page is explained in Table 24 (page 85).
84 Command View TL GUI
Page 85

Table 24 Information available from the Drive Properties window Last Loaded Tape tab
DescriptionItem
Identity
Barcode
Serial number
Capacity
The reference defined within the user environment to
identify the cartridge. This is the most useful reference
for normal use as it should be visible within the
application and is usually found on a printed label on
the front of the cartridge. It is different from the cartridge
serial number, which is defined at manufacture and
used by HP support. Click the hyperlink on the barcode
itself to access the LTO Tape Properties window for the
specific tape. See Table 26 (page 89).
The serial number that uniquely identifies the last
cartridge loaded in the drive and which is defined
during the manufacture of that cartridge. Reference this
number when contacting HP support. It can be found
on the bottom of the cartridge though it may be difficult
to read. The cartridge may also have a barcode, which
is defined within the user environment and not usable
by HP support.
The data format supported by the cartridge.Format
The native (post compression) capacity of the cartridge
in GB. The pre-compressed capacity is also given
assuming a 2:1 compression ratio, which is an estimate
for 'typical' data. The actual capacity of the cartridge
will vary depending on the compression ratio of the
data written.
The manufacturer of the cartridge.Vendor
Configuration
WORM
Encrypted Data
Health
Worst case data (entire tape)
Data written by last drive
Life
Read/Write Life
Indicates whether this is a WORM cartridge - Write
Once Read Many. Data written to these cartridges
cannot be overwritten or erased.
Indicates whether the cartridge contains encrypted data
or not.
The amount of tape used to write to the tape. This
measurement is averaged across the entire tape.
The amount of tape used to write high quality data to
the last loaded tape.
Even if a warning is reported, the data will still have
been written at high quality (unless the drive reported
an error). The warning lets you know that more tape
was used to write the data than is recommended by HP.
A warning will normally trigger an alert.
If appropriate, maintenance recommendations are
made, for example to clean the drive and/or replace
the tape.
An assessment of whether the cartridge read/write life
remaining is within specification followed by an estimate
of the remaining cartridge read/write life.
Based on the amount of tape pulled over drive heads
compared with HP recommended tape life (normally
expressed in terms of 'full volume equivalents' which is
Using TapeAssure 85
Page 86

Table 24 Information available from the Drive Properties window Last Loaded Tape tab
(continued)
DescriptionItem
the volume of data needed to completely fill a tape). If
a life warning is shown, the cartridge should be retired
at the next maintenance period. HP recommends HP
media for increased load/unload life.
An estimate of the percentage of remaining read/write
life of the cartridge. Based on the amount of tape pulled
over drive heads compared with HP recommended tape
life (normally expressed in terms of full volume
equivalents,which is the volume of data needed to
completely fill a tape). When this figure reaches 0%,
the cartridge should be retired.
Load/Unload Life
Usage
Native Capacity Remaining
Total Tape Pulled
Load/Unloads
An assessment of whether the cartridge load/unload
life remaining is within specification followed by an
estimate of the remaining load/unload life.
Based on the number of load/unload cycles compared
with HP recommendation. If a life warning is shown,
the cartridge should be retired at the next maintenance
period. HP recommends HP media for increased
load/unload life.
An estimate of the percentage or remaining load/unload
life of the cartridge based on the number of
loads/unloads compared with HP recommendation.
When this figure reaches 0%, the cartridge should be
retired.
The maximum capacity of the tape.Native Capacity
The amount of data stored on the tape.Native Capacity Used
The capacity remaining on the tape after the exclusion
of the used capacity.
The total tape pulled expressed in terms of the equivalent
number of full-volume writes or reads.
The number of load and unload operations the drive
has performed over the life of the drive.
Temperature
Maximum internal drive temperature
86 Command View TL GUI
The maximum operational temperature of the sensor
located on the controller board of the drive the tape
was loaded in followed by an assessment of whether
this temperature is within specification.
The temperature value will be significantly higher than
ambient temperature but dependent on it, as well as on
drive usage and air flow. The algorithm that assesses
whether the drive is in specification takes account of the
location of the sensor and uses that to estimate the
thermal conditions of the tape path. A warning reported
here should be considered as a warning that the
temperature of the tape path has exceeded
recommended limits and the airflow of the drive should
be investigated.
If a warning is shown, the airflow for the drive should
be improved. If this cannot be corrected, contact HP
support. Note that a warning will normally trigger an
alert for the drive at the time so the alert log can be
checked to identify the drive.
Page 87

Using the Tapes Content panel
The Content panel displays tape information and enables you to change the status of a tape by
performing the following procedure:
1. Select the TapeAssure tab.
2. In the Navigation panel under Data Tapes, click Content to access a list all of the tapes in the
libraries that are enrolled in the management station.
The Content panel displays the following information for each drive:
• Tape Status—The current status or availability of a tape. Possible values are Available,
Vaulted and Retired. Available tapes are those currently residing in a tape library and
available for use.
• Barcode—The external barcode on the tape cartridge.
• Tape Serial Number—The serial number that uniquely identifies the tape cartridge. Defined
by the tape manufacturer.
• Library SN (or Hostname)—For tapes in libraries, this column displays the serial number
of that library. For tapes being used by standalone drives, this column shows the hostname
of the server to which the drive is attached. Such hostname entries are highlighted with
an asterisk (*).
• Cartridge Type—The vendor ID and data format supported by the cartridge.
• Format—The data format supported by the cartridge.
• Partitioned—Indicates whether the cartridge has been partitioned or not.
• Partition 0 Native Capacity (Free/Total)— The maximum capacity of partition 0 of the
tape.
• Partition 1 Native Capacity (Free/Total)—The maximum capacity of partition 1 of the
tape.
• Encrypted Data—Indicates whether the cartridge contains encrypted data or not.
• WORM—Indicates whether this is a WORM cartridge—Write Once Read Many. Data
written to these cartridges cannot be overwritten or erased.
NOTE: In the Library SN column, an * marks hostnames with standalone drives. Other entries
are tape library serial numbers.
Using TapeAssure 87
Page 88

3. To search for a specific tape:
a. Select Actions→Search to display the Search dialog box.
b. Type or select the appropriate search criteria. For example, type the appropriate
information in the Tape Serial Number or Barcode field.
Use more than one of the criteria to further narrow the search. For example, select the
appropriate library from the Choose Library field and select Yes in the Choose Partitioned
field to display only partitioned tapes in the specified library.
Click OK.
4. You can change the status of tapes to Available, Vaulted, or Retired to indicate intent, and to
have Command View TL display the tapes closer to the top (available) or bottom (vaulted,
then retired) of the list. This will help make the list easier to use bacause the Available tapes,
the tapes you will work with most often, will remain at the top of the list. To change the status
of one or more tapes:
NOTE: The status of a vaulted or retired tape remains until you change it back manually, or
until a support ticket is created for that tape. At that point, the status is reset to Available.
5. To view properties of a specific tape, click on or check the box next to the tapes, then select
Actions→Properties.)
NOTE: Although you can choose more than one tape, the Properties action will display
information for the most recently-selected tape only .
The LTO Tape Properties dialog box appears, and displays the Health tab.
88 Command View TL GUI
Page 89

At the top of the dialog box, above the tabs, the following information appears:
Table 25 Information available from the LTO Tape Properties dialog box
DescriptionItem
Identifies the tape cartridge ID and media format.Tape identification
The current status of the drive.Health
Identifies the tape by serial number and barcode.Cartridge ID
Identifies the data format supported by the tape.Media Format
Last Used Drive
Identifies the most recent drive in which the tape was
used.
The time at which the last sample was taken.Last Sample Time
This information remains visible when any tab is selected.
6. Click the Overview tab to view the general information about the selected tape.
Table 26 Information available from the LTO Tape Properties window Overview tab
DescriptionItem
Status
Library Serial Number
Identity
For tapes in libraries, this column displays the serial
number of that library. For tapes being used by
standalone drives, this column shows the hostname of
the server to which the drive is attached. Such hostname
entries are highlighted with an asterisk (*).
Indicates whether the tape is in a drive or not.In Drive?
The external barcode on the tape cartridge.Barcode
Using TapeAssure 89
Page 90

Table 26 Information available from the LTO Tape Properties window Overview tab (continued)
DescriptionItem
Serial Number
Configuration
Encrypted Data
WORM
The serial number that uniquely identifies the tape
cartridge. Defined by the tape manufacturer.
Identifies the data format supported by the tape.Format
The manufacturer of the cartridge.Vendor
The maximum capacity of the tape.Capacity
Indicates whether the cartridge contains encrypted data
or not.
Indicates whether this is a WORM cartridge—Write
Once Read Many. Data written to these cartridges
cannot be overwritten or erased.
7. Click the Health tab to view the following information about the selected tape.
Table 27 Information available from the LTO Tape Properties window Health tab
Health
Effective Capacity (Average)
Effective Capacity (Worst Case)
Life
90 Command View TL GUI
DescriptionItem
The average quality of write operations for a tape,
based on one write pass of the tape (in either the
forward or reverse direction).
The lowest value for write operations of the tape, based
on one write pass.
Page 91

Table 27 Information available from the LTO Tape Properties window Health tab (continued)
DescriptionItem
Load/Unload Life
Read/Write Life
An assessment of whether the cartridge load/unload
life remaining is within specification followed by an
estimate of the remaining load/unload life.
Based on the number of load/unload cycles compared
with HP recommendation. If a life warning is shown,
the cartridge should be retired at the next maintenance
period. HP recommends HP media for increased
load/unload life.
An estimate of the percentage or remaining load/unload
life of the cartridge based on the number of
loads/unloads compared with HP recommendation.
When this figure reaches 0%, the cartridge should be
retired.
An assessment of whether the cartridge read/write life
remaining is within specification followed by an estimate
of the remaining cartridge read/write life.
Based on the amount of tape pulled over drive heads
compared with HP recommended tape life (normally
expressed in terms of 'full volume equivalents' which is
the volume of data needed to completely fill a tape). If
a life warning is shown, the cartridge should be retired
at the next maintenance period. HP recommends HP
media for increased load/unload life.
An estimate of the percentage of remaining read/write
life of the cartridge. Based on the amount of tape pulled
over drive heads compared with HP recommended tape
life (normally expressed in terms of full volume
equivalents,which is the volume of data needed to
completely fill a tape). When this figure reaches 0%,
the cartridge should be retired.
Maximum internal drive temperature
The maximum operational temperature of the sensor that
is located on the controller board of the drive in which
the tape was loaded, and whether that temperature is
within specifications.
8. Click the Performance tab to view the following information about the selected tape.
Using TapeAssure 91
Page 92

Table 28 Information available from the LTO Tape Properties window Performance tab
DescriptionItem
Data Transfer
Estimated Host Transfer Rate
Media Transfer Rate
Compression
Write Compression Ratio
Read Compression Ratio
The estimated transfer rate of the host averaged over
the data transferred to/from the tape since the last load.
The transfer rate of the data, after compression,
transferred to/from the tape since the last load.
The average write compression ratio of the data written
to tape since the last load.
The average read compression ratio of the data read
from tape since the last load.
The time at which the last sample was taken.Last Sample Time
9. Click the Usage tab to view the following information about the selected tape.
92 Command View TL GUI
Page 93

Table 29 Information available from the LTO Tape Properties window Usage tab
DescriptionItem
Usage
The maximum capacity of the tape.Native Capacity
The amount of data stored on the tape.Native Capacity Used
Load/Unloads
Load/Unload Life
Read/Write Life
The number of load and unload operations the drive
has performed over the life of the drive.
An assessment of whether the cartridge load/unload
life remaining is within specification followed by an
estimate of the remaining load/unload life.
Based on the number of load/unload cycles compared
with HP recommendation. If a life warning is shown,
the cartridge should be retired at the next maintenance
period. HP recommends HP media for increased
load/unload life.
An estimate of the percentage or remaining load/unload
life of the cartridge based on the number of
loads/unloads compared with HP recommendation.
When this figure reaches 0%, the cartridge should be
retired.
An assessment of whether the cartridge read/write life
remaining is within specification followed by an estimate
of the remaining cartridge read/write life.
Based on the amount of tape pulled over drive heads
compared with HP recommended tape life (normally
expressed in terms of 'full volume equivalents' which is
the volume of data needed to completely fill a tape). If
a life warning is shown, the cartridge should be retired
at the next maintenance period. HP recommends HP
media for increased load/unload life.
Using TapeAssure 93
Page 94

Table 29 Information available from the LTO Tape Properties window Usage tab (continued)
DescriptionItem
An estimate of the percentage of remaining read/write
life of the cartridge. Based on the amount of tape pulled
over drive heads compared with HP recommended tape
life (normally expressed in terms of full volume
equivalents,which is the volume of data needed to
completely fill a tape). When this figure reaches 0%,
the cartridge should be retired.
The time at which the last sample was taken.Last Sample Time
10. Click the Last Used Drive tab to view the following information about the selected tape.
Table 30 Information available from the LTO Tape Properties window Last Used Drive tab
Identity
Barcode
Serial number
Drive Type
Library Serial Number
Firmware Revision
94 Command View TL GUI
DescriptionItem
The external barcode on the tape cartridge. Click on
the barcode itself to access the LTO Tape Properties
window for the specific tape. See Table 26 (page 89).
The serial number that uniquely identifies the tape
cartridge. Defined by the tape manufacturer.
The type of drive last used, including generation and
interface type.
For tapes in libraries, this column displays the serial
number of that library. For tapes being used by
standalone drives, this column shows the hostname of
the server to which the drive is attached. Such hostname
entries are highlighted with an asterisk (*).
The version of drive firmware the drive is currently
operating with.
Page 95

Table 30 Information available from the LTO Tape Properties window Last Used Drive tab
(continued)
DescriptionItem
Firmware Personality
Configuration
Data Compression
Media Removal (application controller)
Read/Write health (last loaded tape)
Write Health
An identifier that distinguishes the firmware among
multiple possible variants.
Usually set by the backup application. If enabled, the
drive will perform hardware data compression. Refer
to the backup application to configure data compression
for backups.
Usually set by the backup application. If prevented then
the tape cannot be removed from the drive. Normally,
media removal is enabled after the backup is complete
but if the backup aborts it is possible that media removal
will still be prevented. Refer to HP support documentation
for resolution.
A measure of the amount of tape used to write high
quality data to the last loaded tape with the amount of
data written to the tape since it was last loaded.
Even if the warning is reported, the data will still have
been written at high quality (unless the drive reported
an error) but more tape was used than recommended
by HP. A warning will normally trigger an alert. If
appropriate, maintenance recommendations are made,
such as to clean the drive and/or replace the tape. HP
recommends the use of HP media for maximum
confidence.
Read Health
Drive Life
Head Life
Reposition Life
A measure of the ease with which data was read back
from the most recently loaded tape with the amount of
data read from the tape since it was last loaded.
Even if the warning is given, the data will have been
read back correctly (unless the drive reported an error)
but more error correction was required than
recommended. Note that a warning will normally trigger
an alert. If appropriate, maintenance recommendations
are made such as to clean the drive and/or replace the
tape. HP recommends the use of HP media for maximum
confidence.
An estimate of the percentage of remaining head life
based on the amount of tape passed over the head
compared with worst case life expectancy testing in a
clean environment. HP recommends HP media for
increased head life.
If a life warning is shown, the drive should be replaced
at the next maintenance period. HP recommends HP
media for increased head life.
An estimate of the percentage of remaining reposition
life based on the number of changes in direction of the
tape over the life of the drive compared with the worst
case life expectancy in a clean environment. HP
recommends HP media for increased reposition life.
If a life warning is shown, the drive should be replaced
at the next maintenance period. HP recommends HP
media for increased reposition life.
Using TapeAssure 95
Page 96

Table 30 Information available from the LTO Tape Properties window Last Used Drive tab
(continued)
DescriptionItem
Load/Unload Life
Usage Statistics
Power On Time
Tape Pulled
Load/Unload Cycles
Percent Tape Loaded
An estimate of the percentage of remaining drive
load/unload life based on the number of load/unload
cycles over the life of the drive compared with worst
case life expectancy testing in a clean environment. HP
recommends HP media for increased load/unload life.
If a life warning is shown, the drive should be replaced
at the next maintenance period. HP recommends HP
media for increased load/unload life.
Total power on time of the drive since it was
manufactured.
Total tape pulled through the drive expressed in terms
of the equivalent number of full volume writes or reads.
Total number of tape loads for the drive since it was
new.
A comparison of the time the tape was in the drive with
the time since the time it was loaded and the following
tape load expressed as a percentage. For example, if
the time between the two tape loads was 4 hours and
this tape was in the drive for the first hour of that time
then the tape loaded percent will be 25%. Use this for
measuring utilization of the drive from the application
standpoint.
Duty Cycles
Power Cycles
Cleans
Firmware Upgrades
Internal Temperature
Current Temperature
Duty cycle of the drive since the last tape load. This is
a comparison of the time the drive has been active with
the time since the last tape load expressed as a
percentage. For example, if the last tape load was 4
hours ago and the drive has been active for 3 hours
since then, the duty cycle will be 75%. Use this for
measuring utilization from the hardware standpoint.
Number of drive power cycles since the drive was
manufactured.
Number of times the drive has been cleaned since it
was manufactured.
The number of times the drive has been updated with
firmware.
The current temperature reported by the sensor located
on the drive controller board. The current temperature
value will be significantly higher than ambient
temperature but dependent on it, as well as drive usage
and air flow. The algorithm that assesses whether the
drive is in specification takes account of the location of
the sensor and uses that to estimate the thermal
conditions of the tape path.
If a warning is shown, the airflow for the drive should
be improved. If this cannot be corrected, contact HP
support. Note that a warning will normally trigger an
alert.
Max Temperature (since last power cycle)
96 Command View TL GUI
The maximum operational temperature reported by the
sensor located on the drive controller board since the
last power cycle with an assessment of whether the
Page 97

Table 30 Information available from the LTO Tape Properties window Last Used Drive tab
(continued)
11. Click Close to exit the Drive Properties window.
Viewing tape health
The TapeAssure tape health panel lists:
• Tape Status—The current status or availability of a tape. Possible values are Available, Vaulted
and Retired. Available tapes are those currently residing in a tape library and available for
use.
DescriptionItem
maximum temperature of the tape path is within
specification. The maximum temperature value will be
significantly higher than ambient temperature but
dependent on it as well as drive usage and air flow.
The algorithm that assesses whether the drive is in
specification takes account of the location of the sensor
and uses that to estimate the thermal conditions of the
tape path.
If a warning is shown, the airflow for the drive should
be improved. If this cannot be corrected, contact HP
support. Note that a warning will normally trigger an
alert.
• Barcode—The external barcode on the tape cartridge.
• Tape Serial Number—The serial number that uniquely identifies the tape cartridge. Defined
by the tape manufacturer.
• Library SN (or Hostname*)— For tapes in libraries, this column displays the serial number of
that library. For tapes being used by standalone drives, this column shows the hostname of
the server to which the drive is attached. Such hostname entries are highlighted with an asterisk
(*).
• Overall Health—An Overall Health icon and a details link allow you to view the Tape Health
and Life graphs and tabular data.
• Cartridge Type—The vendor ID and data format supported by the cartridge.
• Read/Write Life (%Life Remaining)—Remaining Read/Write life of the cartridge as a
percentage.
• Load/Unload Life (%Life Remaining)—Remaining Load/Unload life of the cartridge as a
percentage of its recommended life.
• Max Internal Temperature—Maximum temperature encountered by the cartridge during its
lifetime (while in a drive).
• Effective Capacity—A measure of the amount of tape used to write high quality data to the
tape over its lifetime. Even if a warning is reported, the data will still have been written at
high quality (unless the tape reported an error), though more tape was used to do so than
recommended by HP. Note that a warning will normally trigger an alert. If appropriate,
maintenance recommendations are made, such as checking for Write Quality problems with
drives, or retiring the tape.
• Service Action—A recommendation for service based on the health criteria. More than one
service action may apply; hover over the entry with the mouse to see a tool tip containing all
recommended service actions for the drive.
NOTE: In the Library SN column, an asterisk (*) marks hostnames with standalone drives. Other
entries are tape library serial numbers.
Using TapeAssure 97
Page 98

For information on searching for a specific tape, see “Searching for a specific tape” (page 107).
Viewing Tape Health and Life
The Tape Health and Life shows the recent health history of a particular tape. Library administrator
can view health related information including a graph showing what the tape health has been
across the last several backups over multiple drives. In addition, you can drill down into the recent
health history of any drives that used that tape. This helps determine if there is a problem with the
tape or with a particular drive that has been using it.
To view the Viewing Tape Health and Life:
1. In the Launcher window, click the TapeAssure tab.
2. In the Navigation panel under Data Tapes, select Health. A list of all of the tapes appears.
Alternatively, in the Navigation panel under Dashboard, select Drives and Tapes Needing
Attention. A list of all tapes that need attention (in a critical or warning state) appears.
3. Click on the tape, then select Actions→Properties, or double click the row, to launch the tape
properties.
4. Click the Overall Health link to open the tape health graphs.
The Tape Health/Life window displays the following:
• Tape Barcode/Serial Number
• Library Serial Number
• Overall Health – calculated based on the recent worst status of the tape health parameters
TapeRWLifeQual, Load/UnLoad Life, Max Internal Temperature, and Effective Capacity
• Effective Capacity/Max Internal Temperature – based on the last backup
Write Health tab
The Write Health tab shows the write health history of the tapes across the last several backups
and over multiple drives as both a graph and a table.
On the graph, the red, yellow, and green bands represent the critical, warning, and healthy status,
respectively, of the tape write health. The X-axis represents the drive serial number and the Y-axis
represents the effective capacity of the tape.
98 Command View TL GUI
Page 99

The table displays the drive serial number, the date/time, and the effective capacity of the tape.
Use the Sample Time to filter the write health history for the tape loaded onto multiple drives between
the specified time intervals. In addition, each drive serial number is a link to the drive write health
history.
To export the report as a PDF, click Export Report at the bottom of the graph. This will allow you
to save the graph locally or email it. You can also export only the graphs or the complete report.
Life tab
A set of parameters decide the life of a tape and they deteriorate over time due to wear and tear.
Each backup leads to the generation of a Support Ticket that contains information about the quality
of the backup. These life parameters keep reducing with each backup. The Life tab shows the trend
of deterioration of the life parameters and recommends the action to be taken before the tape
becomes unusable.
The following are the life parameters of a tape and are compared to the HP recommended
specification:
• TapeLoadLife – the remaining load/unload life of the cartridge as a percentage
• TapeReadWriteLife – the remaining read/write life of the cartridge as a percentage
A simple regression is done on the historical data that the management station has collected over
a period of time for these life parameters. As a result, there is a trend line for each parameter. The
trend line with a greater slope value indicates that the parameter is deteriorating at a faster pace
than the others and determines the life of the tape (this parameter leads to the tape being unusable
faster than the other parameters). The screen displays the trend line of the parameter that is
degrading at the fastest pace. The trend line is then extrapolated to know when this parameter
would become 0 in time; based on this date, a set of recommendations are made for this tape.
There are three kinds of messages for the life of a tape:
• Tape is at the end of its recommended life – if any of the tape’s life parameters are already
less than or equal to 0 based on last sample date
• Tape is nearing the end of its recommended service life — when tape life trend data for <tape
serial number> indicates the tape will reach the end of its serviceable life within the next six
months
• Tape is within the recommended serviceable life — when tape life trend data for <tape serial
number> indicates the tape will not reach the end of its serviceable life within the next six
months
Using TapeAssure 99
Page 100

NOTE: All the analysis and recommendations are based on the date when the last support ticket
was received by the management station for a particular tape/drive.
Viewing tape utilization
The TapeAssure tape utilization panel lists:
• Tape Status—The current status or availability of a tape. Possible values are Available, Vaulted,
and Retired. Available tapes are those currently residing in a tape library and available for
use.
• Barcode—The external barcode on the tape cartridge.
• Tape Serial Number—The serial number that uniquely identifies the tape cartridge. Defined
by the tape manufacturer.
• Library Serial Number—For tapes in libraries, this column displays the serial number of that
library. For tapes being used by standalone drives, this column shows the hostname of the
100 Command View TL GUI
 Loading...