

Page 1
GE Oil & Gas
An Automated High Precision Saturation/Dilution
Calibration System for Trace Moisture Sensors
The paper discusses the physical construction and
operating principles of this saturation/dilution type
calibration system for water vapor in a nitrogen
carrier gas used for the purpose of trace moisture
sensor calibration. The system generates known
moisture standards, allows for settling time, takes
readings from sensors, records sensor readings
and creates data tables. The data tables are either
loaded into “smart” probes with on-board
non-volatile memory and/or printed as data sheets
provided to customers so that calibration data may
be inputted into analyzer electronics. The system
is capable of calibrating 128 aluminum oxide
moisture sensor probes per week, over a range
of –80°C to +10°C dew/frost point temperature.
The system is traceable to the National Institute of
Standard and Technology (NIST). Each aluminum
oxide moisture probe has a dedicated channel for
reading the signal from the probe speeding data
acquisition time. A chilled mirror hygrometer is used
as a traceable transfer standard.
The heritage design, in operation since the early
1980’s, is upgraded with a modern data acquisition,
computer controls, data historian, human-machineinterface, and report generation based around
National Instruments LabView measurement
and automation software. The newly automated
system provides faster system throughput and
more diagnostic information about calibration
performance than the heritage systems. In
addition, the system can provide local and remote
operator alarms should errors in calibration system
operation be detected during the calibration run.
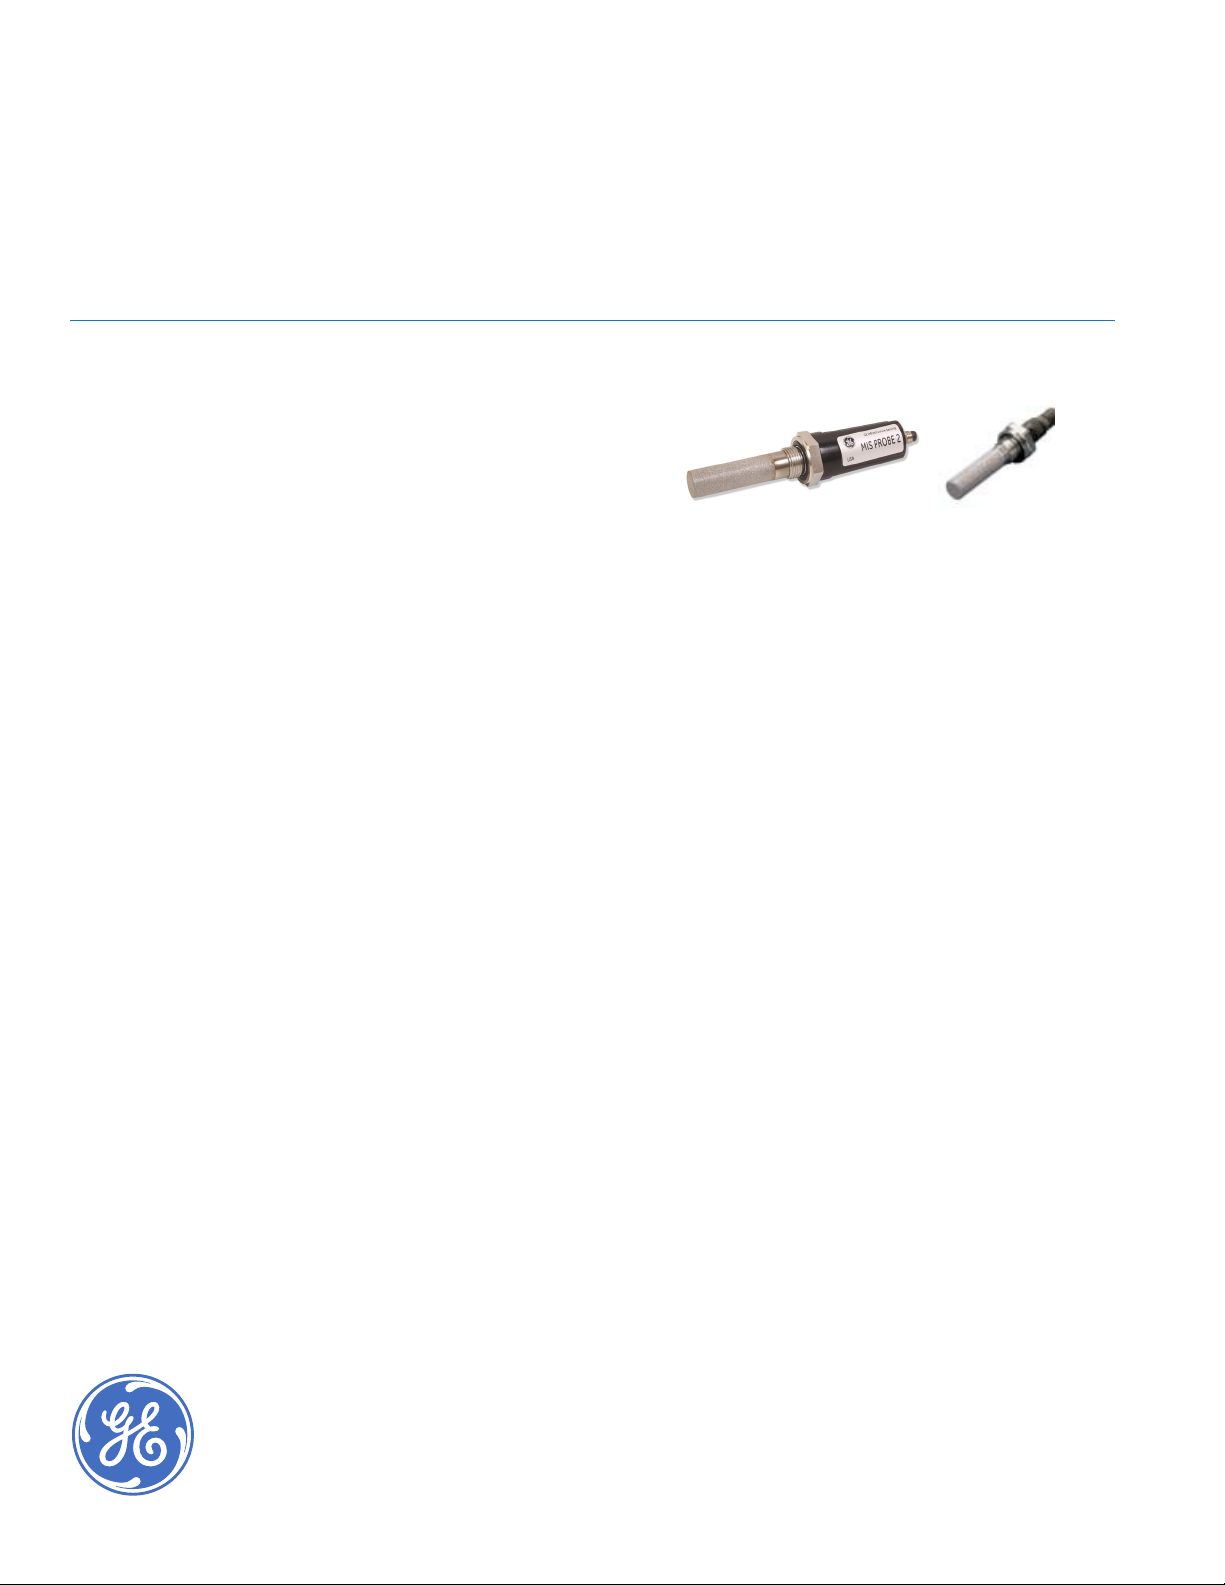
Various aluminum oxide moisture probes that can
be calibrated in the described system
Introduction
One of the major challenges, which every
manufacturer of measurement equipment must
face, is the calibration of the equipment against
a secondary standard on a production line basis
while maintaining strict quality control and quality
assurance. As the number of instruments or
devices, which must be calibrated increases, so
does the challenge. Every eort must be made to
assure consistent accuracy and repeatability of
calibration as throughput increases.
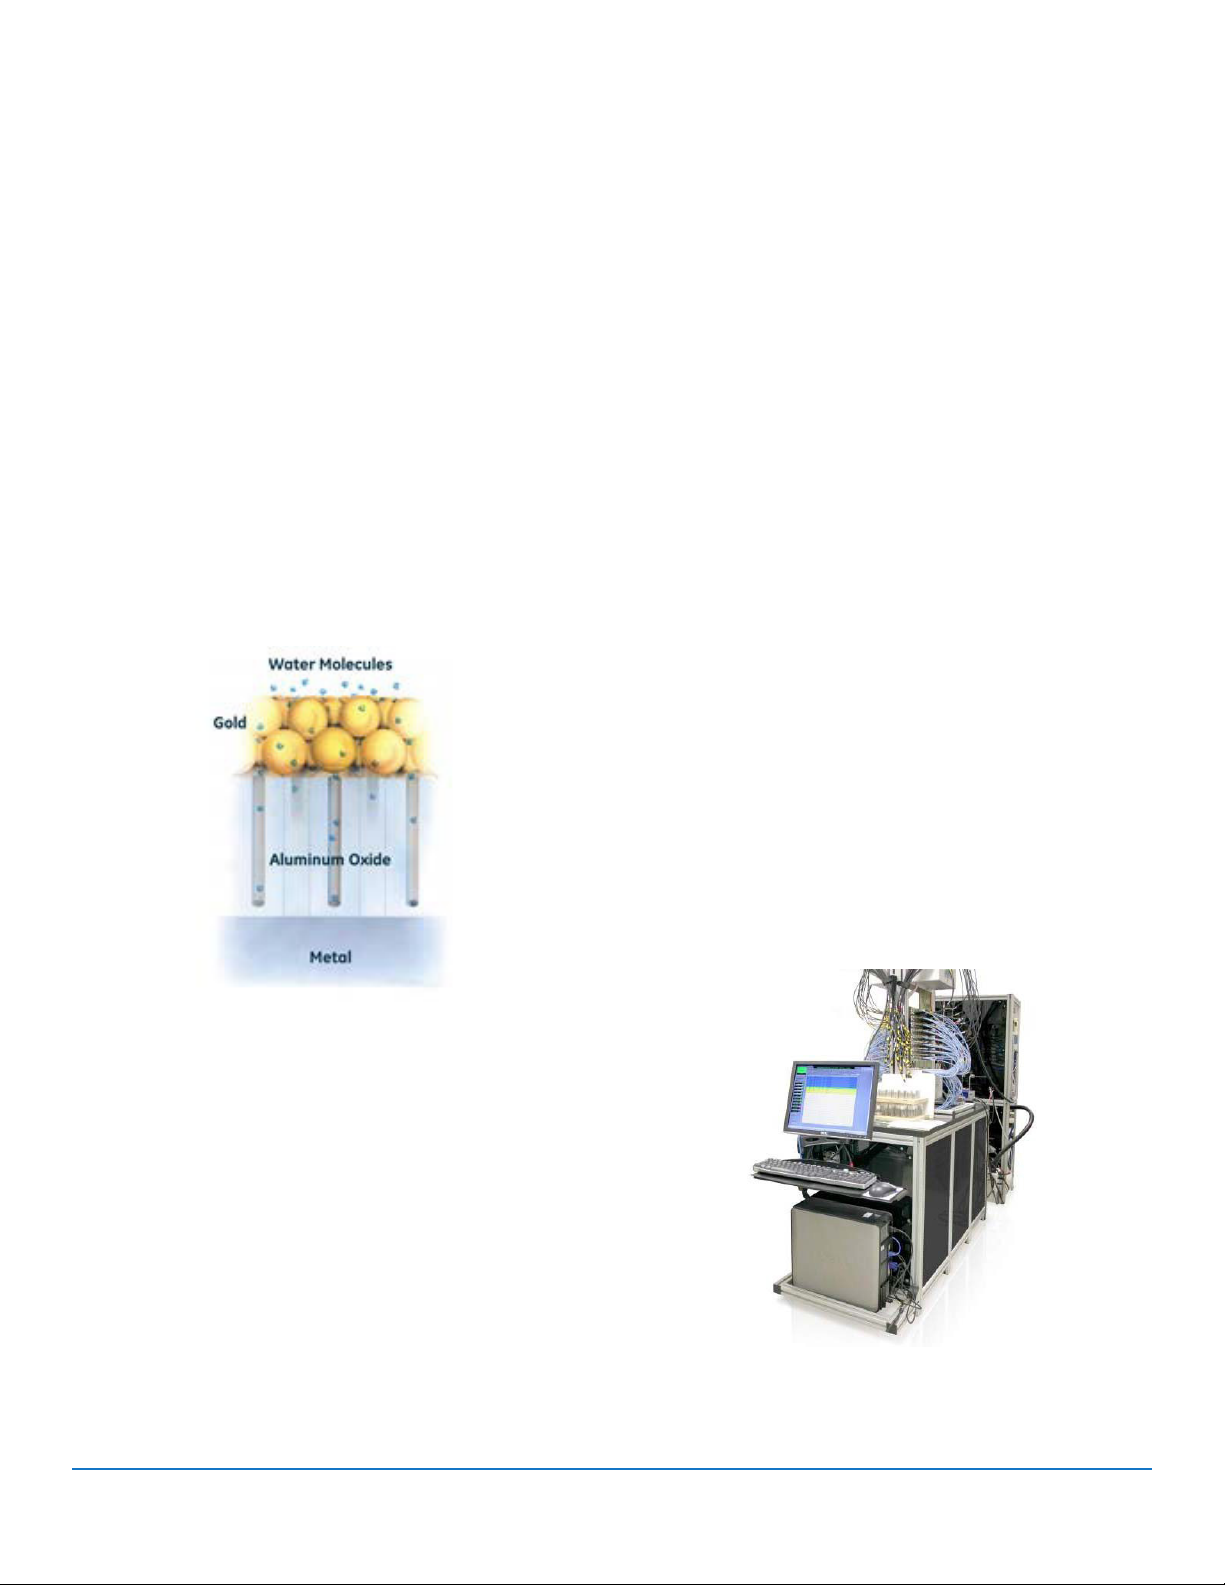
GE manufactures process-oriented hygrometers,
which use aluminum oxide moisture sensors.
The aluminum oxide moisture sensor’s basic
construction is shown in the graphic. The aluminum
oxide moisture sensor is a transducer, which
responds to the vapor pressure of water in the
medium to which it is exposed, either gas phase
or liquid phase. Water molecules diuse through
the porous gold layer of the sensor and into the
aluminum oxide dielectric layer of the sensor.
Because the water molecule is a polar molecule, it
adsorbs to the pore walls of the AlO2 layer, thereby
changing the dielectric of the sensor.
Page 2
The popularity of the aluminum oxide-based
hygrometer among process industries has
increased by several orders of magnitude since its
introduction in the 1960’s. Thus the development
of a sophisticated calibration system capable of
calibrating a large number of moisture probes in
a single run is required to meet customer demand
for new moisture probes and provide capacity for
customer return probes for periodic recalibration.
This transducer must be calibrated against a
secondary standard. The latest system design
upgrades the automation of the system to provide
faster thru-put, more data, better control, and
better data manipulation while keeping the basis
for the moisture generation calibration gas on
the proven double-dilution system. The system is
also scalable as a stand-alone system that can be
replicated easily and provided to global production
and service locations, thus providing customers with
regionally located turn-around for their service needs.
impedance. The volumetric mixing ratio of the gas/water
vapor mixture is then altered and the process is
repeated. The process of calibration consists of two
main sections.
1. Production of the carrier gas/water vapor mixture
2. Data acquisition, storage and reduction
Shown below is a block diagram of the calibration
system. Gaseous nitrogen is withdrawn from a large
tank of liquid nitrogen and transported via a single
section of electro-polished, orbital-welded 316SS
tubing into the calibration laboratory. Although the
theoretical frost point of the nitrogen at this point is
equivalent to the boiling point of nitrogen (-198°C),
due to trace moisture ingress from various sources
(transportation from the gas supplier, tank relling,
etc.), its frost point temperature is actually -85°C
or less at 85 to 95 psig (5.9 to 6.6 bar) pressure.
The pressure of the nitrogen is reduced to ambient
pressure, which further reduces the frost point
to approximately -95°C. The dry nitrogen then
travels through a chamber, which contains several
“standard” aluminum oxide moisture sensor probes.
These standard probes have been previously
calibrated in a laboratory, which is independent
of the facility being described here. They are
used to assure that the nitrogen entering the
calibration system does in fact contain a moisture
concentration, which is insignicant compared to
the nal mixture that is being generated. The dry
gas then enters the moisture generation system.
Aluminum Oxide Moisture
Sensor Construction
The Calibration System
The calibration system, against which GE aluminum
oxide moisture sensor probes are calibrated, operates
on the principal of saturation of a gas with water
vapor, and then dilution of that saturated gas with
dry gas to achieve a nal mixture containing a
known concentration of water vapor. Calibration of
the moisture sensor is accomplished by exposing
the probe to a generated carrier gas/water
vapor mixture and recording the probe’s electrical
2
Aluminum Oxide Moisture Probe
Calibration System
Page 3
Dry gas stream is here split into two parts. One
part remains dry while the other part is saturated
with water vapor by passing it through a large
packed tower containing distilled water. The
tower is maintained at a constant temperature
of 15.2°C and a constant pressure of 20.7 psia
(244Kpa). Temperature of saturation is monitored
by a laboratory thermometer, which has a NIST
traceable calibration and is accurate to within
±0.1°C. Pressure of saturation is monitored
by a pressure transducer regularly calibrated
against a pressure gauge with an NIST traceable
accuracy of ±0.05 psi. This gauge is also used
to calibrate transducers, which monitor the
pressure in the calibration tanks. The saturated
gas mixture will produce a gas mixture with a
dew point of 10°C ±0.1°C when the pressure is
reduced to one atmosphere.
The 10°C dew point gas exits the saturator section of
the calibration system and enters the dilution section.
To produce dew/frost point temperatures above
-50°C, only one dilution stage is necessary. Frost point
generation below -50°C requires two-stage dilution.
Each of the ve ow control valves used in the dilution
stage of the calibration system is of the thermal mass
type and the calibration of each is traceable to NIST.
Their rated accuracy is ± 2% of reading. These ow
control valves consist of two units, a ow sensor and
an automatic controller with control valve. Output
of the ow sensor goes to a comparator, which
automatically adjusts the control valve to deliver the
quantity of dry or wet gas required to produce the
desired nal mixture.
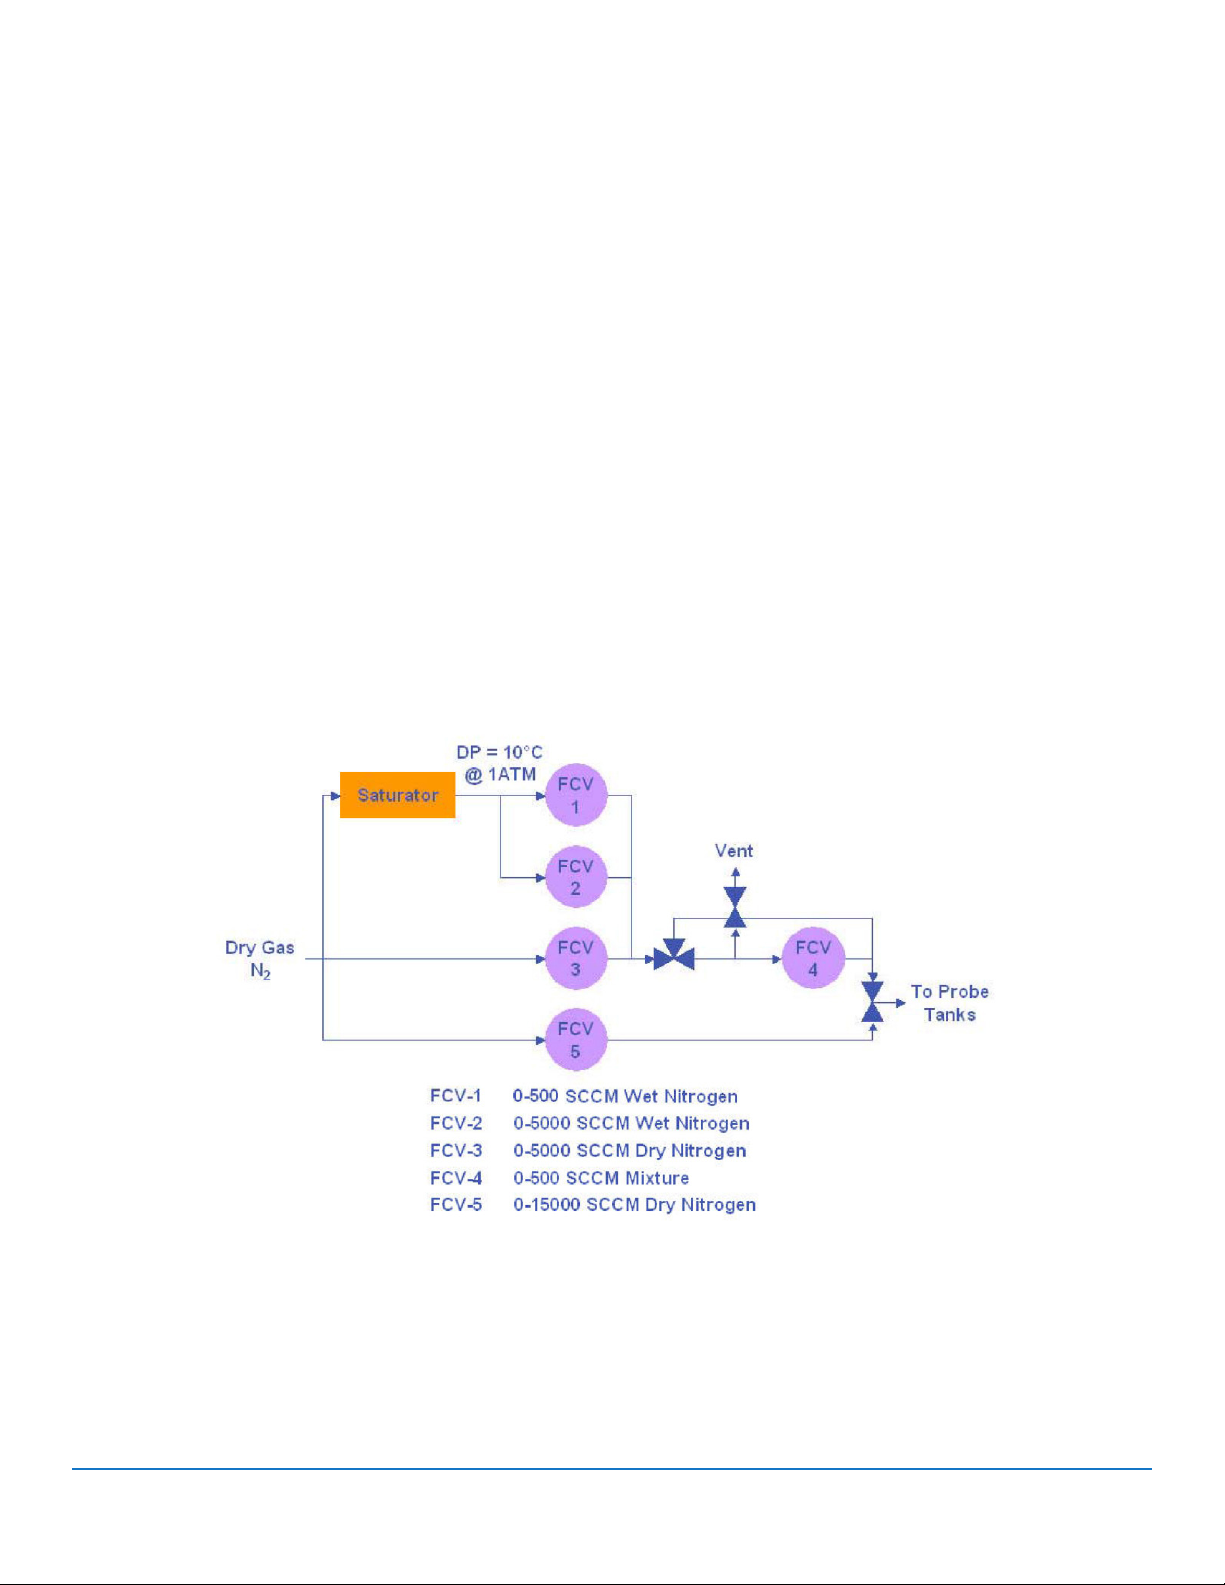
The diagram shows the ow mixing system principal
for the various combinations of “wet” and “dry” gas
owmeters used to generate carrier gas/water
vapor mixtures equivalent to various dew/frost point
temperatures. The table below shows the owrates for
the respective valves to achieve dew/frost set points.
Flow Block Diagram
3
Page 4
Flowrates & Accuracies for Generation of Dew/Frost Point Temperatures
Dew/Frost Point Flowmeter(s) in Use Flowrate (cc/min)
None
(System Dry-Down)
10°C FCV-2 4854 +/- 0.1
0°C
-10°C
-20°C
-30°C
-40°C
-50°C
-60°C
-70°C
-80°C
FCV-3
FCV-5
FCV-2
FCV-3
FCV-2
FCV-5
FCV-2
FCV-5
FCV-1
FCV-5
FCV-1
FCV-5
FCV-1
FCV-5
FCV-1
FCV-3
FCV-4
FCV-5
FCV-1
FCV-3
FCV-4
FCV-5
FCV-1
FCV-3
FCV-4
FCV-5
4900
15000
4854
4900
4029
15000
1380
15000
480
15000
159
15000
48
15000
159
4900
433
15000
48
4900
337
15000
48
4900
69
15000
Calculated Dew/Frost
Point Accuracy (°C)
-
+/- 0.2
+/- 0.3
+/- 0.3
+/- 0.3
+/- 0.3
+/- 0.4
+/- 0.3
+/- 0.4
+/- 0.4
The accuracy of the calibration system varies with
the generated dew point, as shown in the table.
These accuracy estimates were obtained from an
error analysis of the moisture mixing system, given
in the Appendix of this paper. The overall accuracy
of the calibration system is better than ±0.4°C
dew/frost point.
The outlet of the dilution stage of the calibration
system is routed to the calibration tank capable of
holding 128 probes. Each system can support up
to 3 calibration tanks providing an overall capacity
of 384 probes. Equilibrium conditions in each tank
during calibration are assured by random sampling
of the impedance of probes from each of the three
tanks. These probes are continuously monitored at
each generated dew/frost point temperature until
the change in impedance becomes within the error
of the A-D converter.
4
Chilled Mirror Hygrometer
Page 5
The nal check of the system is a condensation
type hygrometer (also known as a chilled
mirror hygrometer). This hygrometer is a Model
OPTICA/1311-XR manufactured by GE. The
condensation hygrometer is located at the end of
the calibration chain, downstream of the probe
tanks. The condensation hygrometer monitors
the entire system not only to conrm the water
vapor content of the generated mixture, but also
to compensate for the possibility of minute system
leaks, which can bias the generated volume ratio.
The condensation hygrometer has a specied
accuracy of +/- 0.15°C and a range of -80°C
to +20°C dew/frost point temperature. Typical
agreement of the condensation hygrometer with
the generated calibration mixture is shown in the
table below. The variation of these generated dew
points from those shown in the previous table
is within the accuracy tolerance of the specied
accuracy of the condensation hygrometer.
Typical Agreement Between Generated
Dew/Frost Point Temperatures & Chilled
Mirror Hygrometer Readings
D/F PT, Chilled Mirror
Generated D/F PT, °C
9.63 9.61
-0.33 -0.26
-10.31 -10.19
-20.30 -20.08
-30.29 -29.95
-40.28 -40.72
-50.33 -50.70
-60.23 -60.05
-70.21 -70.35
-80.16 -80.04
Hygrometer, °C
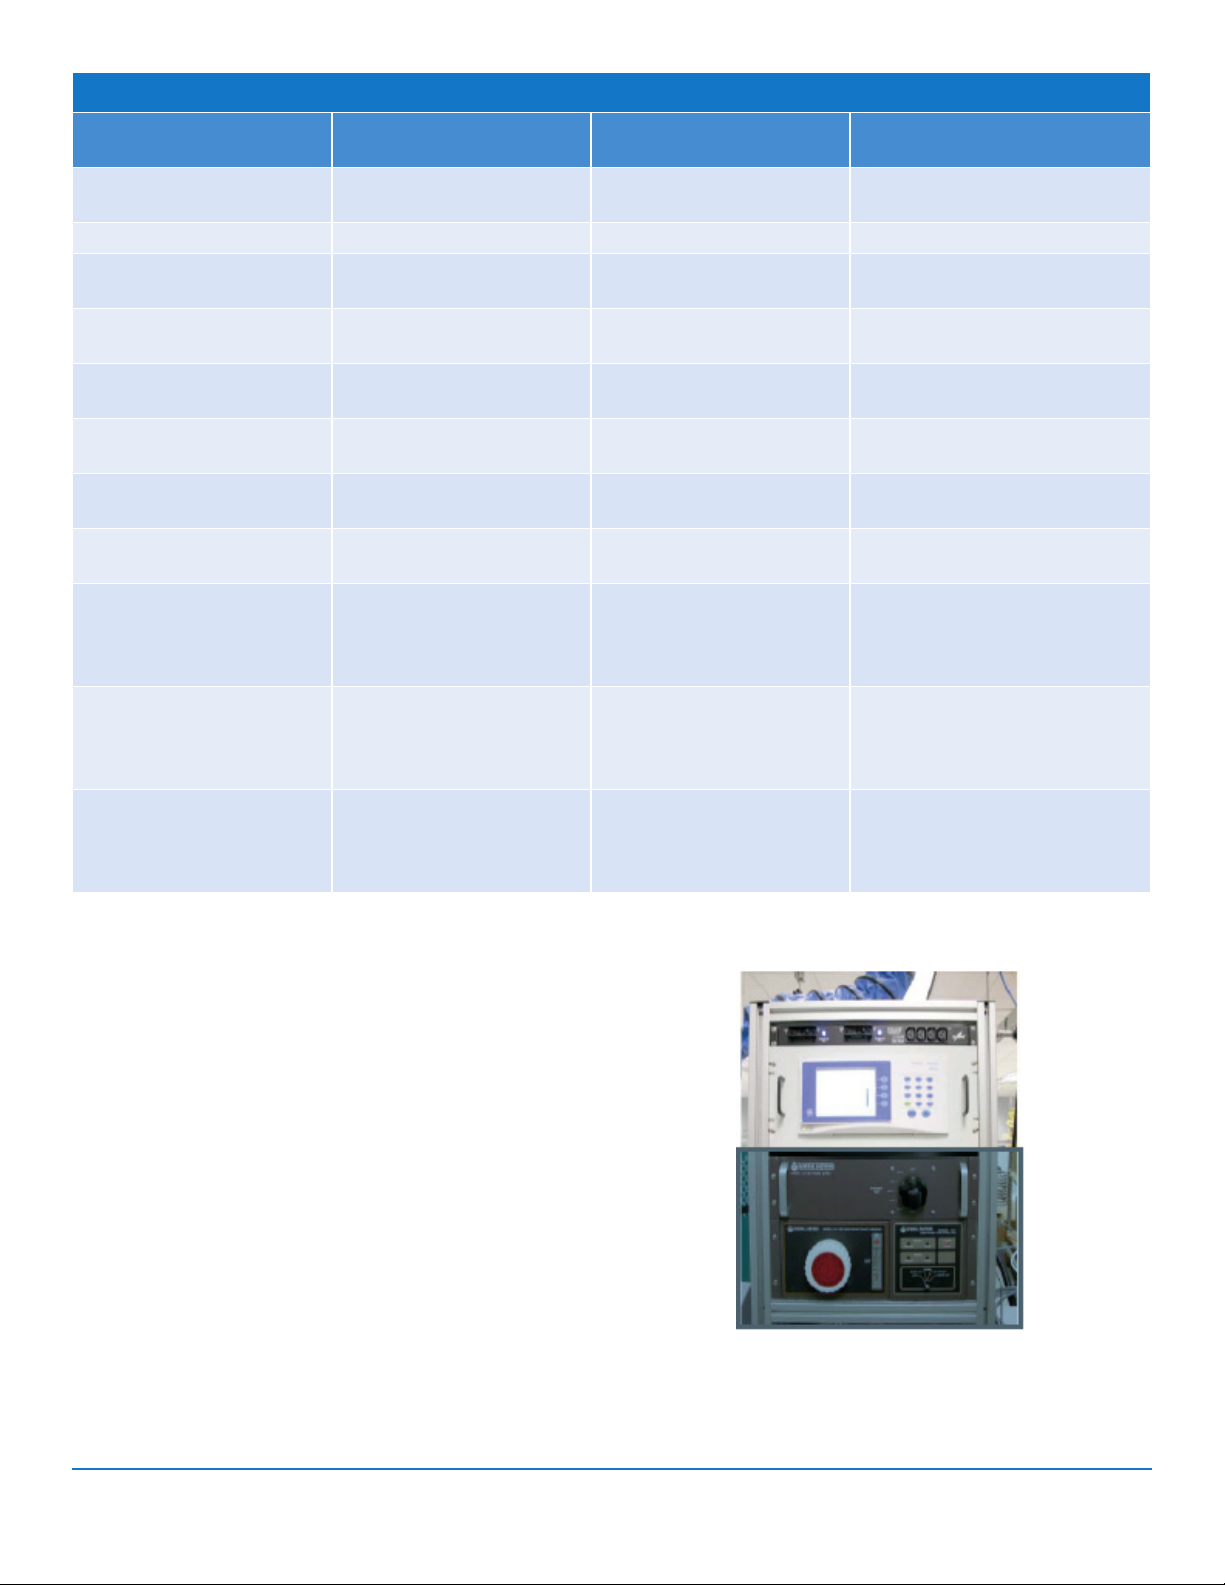
Moisture Calibration System
Singe Manifold
Block Diagram
Calibration system located in a temperature and relative humidity controlled environment
5
Page 6

Data Aquisition, Storage
and Reduction
Data acquisition, storage and reduction is
accomplished by collecting electronic impedance
data for individual moisture sensors through the use
of a direct reading of digital moisture probes, such
as MISP or VeriDri types and by direct reading of
analog moisture probes by means of master circuit
measurement electronics module with an available
channel for each slot in the calibration tank. The
electronics of this module consists of analog signal
processing and analog to digital conversion.
Impedance data for each sensor is accessed by
a dedicated reference hygrometer channel for
each probe on a continuous basis. Providing an
individual analog measurement for each probe is
a signicant improvement over the heritage system
that had limited analog measurement circuits and
required a complex multiplexing system to measure
all the various probes in the calibration bank. The
net benet to the system is faster measurement
processing and reduced overall calibration cycle time.
The analog signal processing segment contains
a unique self-calibration routine which is used to
assure that any drift in the analog section of the
system does not enter into the probe calibration
data. To accomplish self-calibration, the analog
electronics are commanded by the computer to
read several high accuracy impedance standards.
This data is fed back to the computer for testing
against standard data. If the test data is within a
predetermined maximum error band, it is accepted
by the computer, which then generates a calibration
curve. The calibration curve is automatically applied
to the actual probe impedance data. After the
analog data is collected and the calibration curve
applied, it is converted to digital information by the
A-D converter.
At completion of the calibration run, the digitized
impedance data is moved to a long-term storage
le. The data for at least the recent two calibration
data sets is stored in this le. Inventory and probe
suitability data is stored simultaneously.
The two data sets are used to calculate the actual
drift over the last calibration time periods (minimum
two month interval) and projected over the next
six month period. The criteria for drift is that the
calculated normalized drift rate must be less than
± 2°C dew/frost point over a six month period.
In addition, the calibration data is archived to
enable customers to access data about their
sensors from an enterprise server. The historical
data for a given sensor can be accessed and used
to determine the long-term drift characteristics for
a particular application.
Older hygrometer systems dating back into the
1960’s are based on analog electronics. Many of
these platforms are still in operation and moisture
recalibration services are still oered on the
aluminum oxide moisture probes for these units.
Those hygrometers using linear analog circuitry, a
curve is tted to the data points using the following
exponential equation:
Z-1 = AebT + C
where
Z is the sensor impedance
T is the dew point temperature
A, b, and C are constants determined from the t
Oset, span and electronic calibration factors are
calculated for the best curve t and a datasheet
for the instrument of interest is generated by the
calibration computer.
6
Page 7

Typical Calibration Data Sheet for a microprocessor-based hygrometer. For analog probes such as the
common “M-Series” moisture probe, the moisture probe is calibrated and shipped with a calibration
data sheet. The customer enters the 14-point calibration data into their hygrometer.
All current systems utilize microprocessor-based
electronics. For these microprocessor based hygrometers,
the Z-1 (sensor admittance) reading versus the dew/frost
point is tabulated and a data sheet with all the necessary
information for such instruments is generated.
A local pc-based computer is used to control the
calibration system and to collect the calibration data.
A National Instruments LabView interfaces with the
controllers, to view and print sensor data, and to collect
system diagnostics. The system is duplicated at GE
facilities in Boston, MA; Shannon, Ireland; Abu Dhabi,
UAE; Tokyo, Japan; and Changzhou, China.
While this paper is based on the primary
calibration systems designed at GE’s site in
Billerica, MA using NIST traceable calibration
reference standards, systems located in other
geographic locations are traceable to the
applicable ruling metrology authority. For
example, GE’s facility in Shannon, Ireland has their
moisture calibration system use standards that
are calibrated traceable to the National Physics
Laboratory (NPL) in the UK.
7
Page 8

Calibration System LabView Interface oering intuitive graphical control
and monitoring of the calibration run
Replication of this design, data collection, and system control globally makes it possible for the data and
system verication diagnostics to be stored on redundant servers in a global database.
8
Page 9

Conclusion
The GE primary calibration system is capable of
calibrating up to 384 aluminum oxide moisture
sensor probes per calibration run. Each run requires
seven days for completion, including a three and
one-half day dry down period.
The probes are normally calibrated at 10 dew/frost
points over the range from -80°C to +10°C, with an
accuracy of the generated gas/water vapor mixture
of better than +/-0.4°C (see Appendix).
Temperature, pressure and ow measurement devices
used in this system are all traceable to the National
Institute of Standards and Technology. Thus, this
calibration system meets the stated requirement, to
calibrate aluminum oxide moisture probes in quantity
on a production line basis, while maintaining rigorous
quality control and quality assurance criteria.
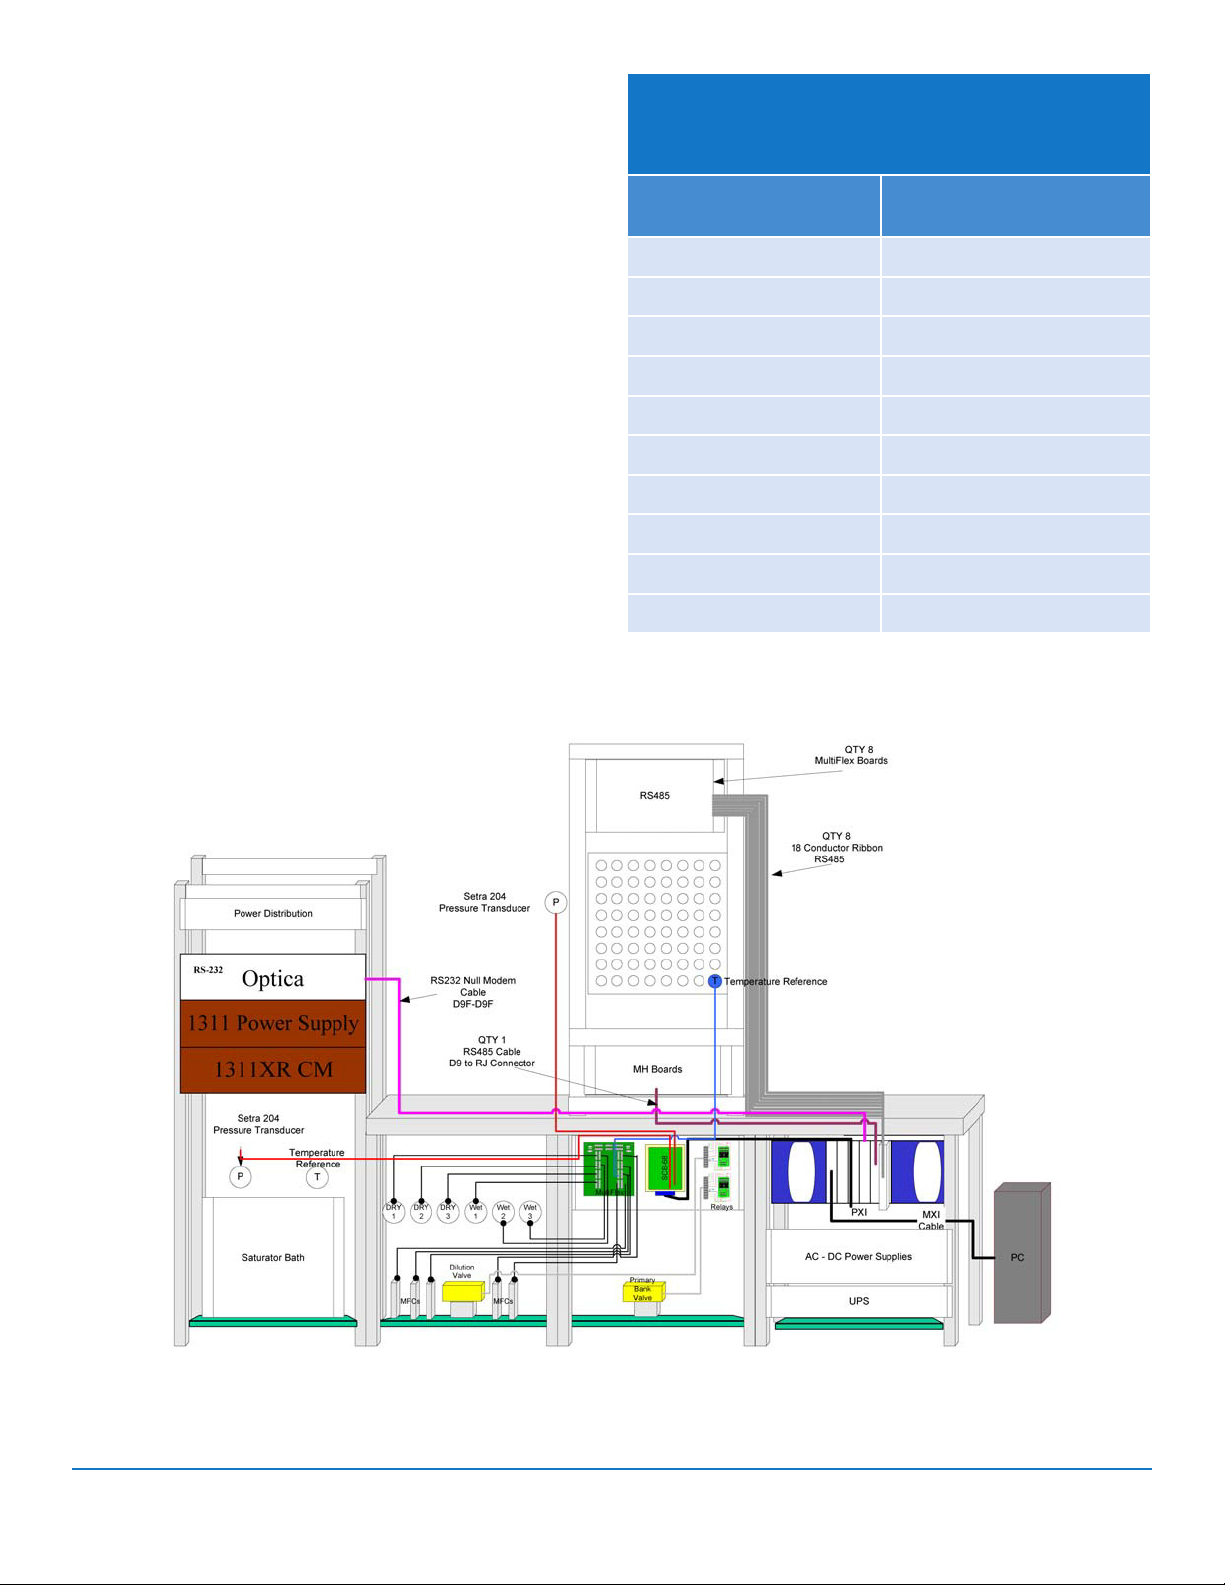
Overall Aluminum Oxide Moisture Probe Calibration System View
9
Page 10

Appendix
P
KW = Enhancement factor
The error analysis of moisture generator system is
divided into an analysis of gas saturation and an
analysis of gas dilution.
Saturator Section - The vapor pressure of water
generated by the saturator is given by the equation
=
P
ºS
x 6.112exp
K
W
KW = 1.0007 + 3.46 x 10⁻⁶ P
17.502 t
240.97+t
t
and the vapor pressure of water delivered to the
calibration banks is given by the equation
PS = P
º
S
x
T
P
º
T
where
PS = Vapor pressure of water in calibration chamber
P°S = Vapor pressure of water generated in saturator
at temperature
t = Temperature within the saturator
The absolute accuracy of the saturator, based on
the accuracy of NIST traceable thermometer
(+/- 0.10°C) and pressure gauge (+/- 0.05 psi), is
+/- 0.7% in PS, or +/- 0.11°C in dew point.
Dilution Section - The error in the dilution section
varies somewhat for dierent dew points, due to
the dierent ow rates and number of owmeters
employed. The vapor pressure of water generated
by dilution, PW, is given by
PW = P
F
W1
S
F
+ F
W1
x
D1
F
W2
F
+ F
W2
D2
where
PS = Vapor pressure output by the saturator
FW1 = Wet gas ow for rst dilution (FCV-1, FCV-2)
FD1 = Dry gas ow for rst dilution (FCV-3)
PT = Total pressure in calibration chamber
P°T = Total pressure in saturator
A complete expression for the error in the above equation can be calculated
Δ
P
W
=
P
W
2 2
P
Δ
S
P
S
+
F
D1
FD1+ F
Δ
W1
2
F
W1
F
W1
F
Δ
+
D1
F
D1
FW2 = Moist gas ow for second dilution (FCV-4)
FD2 = Dry gas ow for second dilution (FCV-5)
(1)
. It is given by
2 2
+
F
D2
FD2+ F
W2
Δ
2
F
W2
F
W2
F
Δ
+
D2
F
D2
1/2
2
The error in PS, +/- 0.7%, has been derived. The owmeter accuracy, specied by an independent calibration
in service, is +/- 2% of ow or +/- 0.5% full-scale ow, whichever is larger. The application of second
equation referenced to the data in Flowrates & Accuracies for Generation of Dew/Frost Point Temperatures
table yields errors for each dew point.
The errors in water vapor pressure vary from +/- 0.7% at the highest dew point up to +/- 6.8% at the lowest
dew point. These errors, converted to a dew point scale, are listed in Flowrates & Accuracies for Generation
of Dew/Frost Point Temperatures table. The dew point errors vary from +/- 0.1°C to +/- 0.40°C.
The systematic error in dew point due to moisture in the dry gas may be neglected at all dew points wetter
than -80°C. For the -80°C point the error is less than +0.4°C in dew point. This is based on a maximum -85°C
dew point at 90 psig in the dry gas supply line.
10
Page 11

Acknowledgments
REFERENCES
The author would like to acknowledge several persons
for their contributions to developing the calibration
system described herein. A partial list of those
people include James Figucia for LabView interface
work; Gene Berkowitz, Joe Ferro and Tony Kowal for
engineering eorts on GE hygrometers and probes;
Dave Spielman for manufacturing engineering eorts
to design, build and test the calibration system; Steve
Rehn for quality and calibration system expertise; and
Sean Donahue for quality leadership eorts.
1. Dietrich. C.F., “Uncertainty, calibration, and
Probability’, John Wiley, New York, 1973, p. 269.
2. Scelzo, Michael; Pierce, Ralph. “A High Precision
Saturation Dilution System for Water Vapor
in a Carrier Gas”. Proceedings of the 1985
International Symposium on Moisture & Humidity.
Instrument Society of America, Research
Triangle Park, NC. 1985. ISBN 0-87664-865-0.
*Trademarks of General Electric Company.
©2016 General Electric Company. All rights reserved.
03/2016
 Loading...