

Page 1

Moisture Image Series 1
Hygrometer
Programming Manual
Page 2
April 2004
Process Control Instruments
Moisture Image Series 1
Hygrometer
Programming Manual 910-108PB2
!ATTENTION!
This manual contains inst ructions for Serie s 1 unit s
equipped with controller card p/n 703-1250. This
controller card supports the PanaCom/PanaView
user interface software.
Page 3

June 2003
Warranty Each instrument manufactured by GE Panametrics is warranted to be
free from defects in material and workmanship. Liability under this
warranty is limited to restoring the instr ument to normal operation or
replacing the instrument, at the sole discretion of GE Panametrics. Fuses
and batteries are specif ically exclu ded from any liability. This warranty
is effective from the date of de livery to the original purch as er. If GE
Panametrics determines that the equipment was defective, the warranty
period is:
• one year for general electronic failures of the instrument
• one year f or mechanical failures o f the transducers
If GE Panametrics determines that the equipment was damaged by
misuse, improper installation, the use of unauthorized replacement parts,
or operating conditions outside the guidelines specified by GE
Panametrics, the repairs are not covered under this warranty.
The warranties set forth herein are exclusive and are in lieu of
all other warranties whether statutory, express or implied
(including warranties or merchantability and fitness for a
particular purpose, and warranties arising from course of
dealing or usage or trade).
Return Policy If a GE Panametrics instrument malfunctions within the warranty period,
the following procedure must be completed:
1. Notify GE Panametrics, giving full details of the problem, and
provide the model numbe r and s eri al numbe r of t he instr umen t. I f the
nature of the problem indicates the need for factory service, GE
Panametrics will issue a RETURN AUTHORIZATION NUMBER
(RAN), and shipping in str uc tions for the return of the i nst rume nt to a
service center will be p ro vided.
2. If GE Panametrics instructs you to send your instrument to a service
center, it must be shipped prepaid to the authorized repair station
indicated in the shipping instructions.
3. Upon receipt, GE Panametrics will evaluate the instrument to
determine the cause of the malfunction.
Then, one of the following courses of action will then be taken:
• If the damage is covered under the terms of the warranty, the
instrument will be repaired at no cost to the owner and returned.
• If GE Panametrics determines that the damag e is not covered under
the terms of the warranty, or if the warra nty has expired , an es timate
for the cost of the repairs at standard rates will be provided. Upon
receipt of the owner’s approval to proceed, the instrument will be
repaired and returned.
iii
Page 4

April 2004
Table of Contents
Chapter 1: Features and Capabilities
Introduction to the Moisture Image
Series 1 . . . . . . . . . . . . . . . . . . . . . . . . . . . . . . . . . . . . . . . . . . . . . . . . . . . . . . . . . . . . . . . . . . . . .1-1
Electronics Unit . . . . . . . . . . . . . . . . . . . . . . . . . . . . . . . . . . . . . . . . . . . . . . . . . . . . . . . . . . . . . . . 1 - 1
BASEEFA Certification . . . . . . . . . . . . . . . . . . . . . . . . . . . . . . . . . . . . . . . . . . . . . . . . . . . . . . . .1-3
CSA Certification . . . . . . . . . . . . . . . . . . . . . . . . . . . . . . . . . . . . . . . . . . . . . . . . . . . . . . . . . . . . .1- 3
Probes . . . . . . . . . . . . . . . . . . . . . . . . . . . . . . . . . . . . . . . . . . . . . . . . . . . . . . . . . . . . . . . . . . . . . .1-4
M Series and TF Series Moisture Probes . . . . . . . . . . . . . . . . . . . . . . . . . . . . . . . . . . . . . . . .1-4
Moisture Image Series Probe . . . . . . . . . . . . . . . . . . . . . . . . . . . . . . . . . . . . . . . . . . . . . . . . .1-6
Delta F Oxygen Cell . . . . . . . . . . . . . . . . . . . . . . . . . . . . . . . . . . . . . . . . . . . . . . . . . . . . . . . .1-7
Cabling. . . . . . . . . . . . . . . . . . . . . . . . . . . . . . . . . . . . . . . . . . . . . . . . . . . . . . . . . . . . . . . . . . . . . .1-8
M Series and TF Series Probes . . . . . . . . . . . . . . . . . . . . . . . . . . . . . . . . . . . . . . . . . . . . . . . .1-8
Moisture Image Series Probe . . . . . . . . . . . . . . . . . . . . . . . . . . . . . . . . . . . . . . . . . . . . . . . . .1-8
Delta F Oxygen Cells . . . . . . . . . . . . . . . . . . . . . . . . . . . . . . . . . . . . . . . . . . . . . . . . . . . . . . .1-8
Pressure Sensors . . . . . . . . . . . . . . . . . . . . . . . . . . . . . . . . . . . . . . . . . . . . . . . . . . . . . . . . . . .1-8
RS232 Communications Port . . . . . . . . . . . . . . . . . . . . . . . . . . . . . . . . . . . . . . . . . . . . . . . . .1-8
User Program. . . . . . . . . . . . . . . . . . . . . . . . . . . . . . . . . . . . . . . . . . . . . . . . . . . . . . . . . . . . . . . . .1-9
Chapter 2: Basic Programming
Introduction . . . . . . . . . . . . . . . . . . . . . . . . . . . . . . . . . . . . . . . . . . . . . . . . . . . . . . . . . . . . . . . . . . 2 -1
Getting Started. . . . . . . . . . . . . . . . . . . . . . . . . . . . . . . . . . . . . . . . . . . . . . . . . . . . . . . . . . . . . . . .2-2
Powering Up . . . . . . . . . . . . . . . . . . . . . . . . . . . . . . . . . . . . . . . . . . . . . . . . . . . . . . . . . . . . . .2-2
Enter i n g Da t a in t o the U s er P ro g ram . . . . . . . . . . . . . . . . . . . . . . . . . . . . . . . . . . . . . . . . . . .2-4
Screen and Key Functions. . . . . . . . . . . . . . . . . . . . . . . . . . . . . . . . . . . . . . . . . . . . . . . . . . . .2-5
Entering the Passcode . . . . . . . . . . . . . . . . . . . . . . . . . . . . . . . . . . . . . . . . . . . . . . . . . . . . . . .2-6
Getting On-Line Help . . . . . . . . . . . . . . . . . . . . . . . . . . . . . . . . . . . . . . . . . . . . . . . . . . . . . . .2-7
Verifying and Entering Setup Data . . . . . . . . . . . . . . . . . . . . . . . . . . . . . . . . . . . . . . . . . . . . . . . .2-8
Activating and Changing Probes. . . . . . . . . . . . . . . . . . . . . . . . . . . . . . . . . . . . . . . . . . . . . . .2-9
Entering Calibration Data . . . . . . . . . . . . . . . . . . . . . . . . . . . . . . . . . . . . . . . . . . . . . . . . . . .2-12
Entering High and Low Reference Values . . . . . . . . . . . . . . . . . . . . . . . . . . . . . . . . . . . . . .2-21
Displaying Measurements . . . . . . . . . . . . . . . . . . . . . . . . . . . . . . . . . . . . . . . . . . . . . . . . . . . . . .2-28
Setting Up the Matrix Format. . . . . . . . . . . . . . . . . . . . . . . . . . . . . . . . . . . . . . . . . . . . . . . .2-32
Setting Up the Line Graph . . . . . . . . . . . . . . . . . . . . . . . . . . . . . . . . . . . . . . . . . . . . . . . . . .2-35
Tagging the Inputs . . . . . . . . . . . . . . . . . . . . . . . . . . . . . . . . . . . . . . . . . . . . . . . . . . . . . . . .2-37
Adjusting the Contrast of the Screen. . . . . . . . . . . . . . . . . . . . . . . . . . . . . . . . . . . . . . . . . . . . . .2-40
Setting the Clock and Calendar . . . . . . . . . . . . . . . . . . . . . . . . . . . . . . . . . . . . . . . . . . . . . . . . . .2-41
v
Page 5

April 2004
Table of Contents (cont.)
Chapter 3: A d vanced Prog r amming
Introduction . . . . . . . . . . . . . . . . . . . . . . . . . . . . . . . . . . . . . . . . . . . . . . . . . . . . . . . . . . . . . . . . . 3-1
Setting Up the Recorders . . . . . . . . . . . . . . . . . . . . . . . . . . . . . . . . . . . . . . . . . . . . . . . . . . . . . . . 3-1
Selecting Measurement Mode and Units for Recorders . . . . . . . . . . . . . . . . . . . . . . . . . . . . 3-2
Setting the Range for Recorders . . . . . . . . . . . . . . . . . . . . . . . . . . . . . . . . . . . . . . . . . . . . . . 3-3
Setting Up the Alarms . . . . . . . . . . . . . . . . . . . . . . . . . . . . . . . . . . . . . . . . . . . . . . . . . . . . . . . . . 3-4
Selec t ing th e Measur ement Mo d e , Un i t s an d H ig h / L o w Va lu es fo r A la rm s . . . . . . . . . . . . 3-5
Entering the Setpoint and Deadband Values for Alarms. . . . . . . . . . . . . . . . . . . . . . . . . . . . 3-5
Using Automatic Calibration . . . . . . . . . . . . . . . . . . . . . . . . . . . . . . . . . . . . . . . . . . . . . . . . . . . . 3-7
Entering Constants and User Functions . . . . . . . . . . . . . . . . . . . . . . . . . . . . . . . . . . . . . . . . . . . . 3-9
Entering User Constants . . . . . . . . . . . . . . . . . . . . . . . . . . . . . . . . . . . . . . . . . . . . . . . . . . . 3-10
Specifying User Functions. . . . . . . . . . . . . . . . . . . . . . . . . . . . . . . . . . . . . . . . . . . . . . . . . . 3-11
Entering User-Defined Tables. . . . . . . . . . . . . . . . . . . . . . . . . . . . . . . . . . . . . . . . . . . . . . . 3-13
Entering Saturation Constants . . . . . . . . . . . . . . . . . . . . . . . . . . . . . . . . . . . . . . . . . . . . . . . 3-14
Using Computer Enhanced Response . . . . . . . . . . . . . . . . . . . . . . . . . . . . . . . . . . . . . . . . . . . . 3-15
Setting Up the Data Logger . . . . . . . . . . . . . . . . . . . . . . . . . . . . . . . . . . . . . . . . . . . . . . . . . . . . 3-1 7
Viewing the Data Logger Status . . . . . . . . . . . . . . . . . . . . . . . . . . . . . . . . . . . . . . . . . . . . . 3-18
Viewing Logged Data . . . . . . . . . . . . . . . . . . . . . . . . . . . . . . . . . . . . . . . . . . . . . . . . . . . . . 3-18
Removing Logged Data. . . . . . . . . . . . . . . . . . . . . . . . . . . . . . . . . . . . . . . . . . . . . . . . . . . . 3-18
Entering Data Logger Settings . . . . . . . . . . . . . . . . . . . . . . . . . . . . . . . . . . . . . . . . . . . . . . 3-19
Setting Up the RS232 Communications Port. . . . . . . . . . . . . . . . . . . . . . . . . . . . . . . . . . . . . . . 3-22
Configuring the Serial Port . . . . . . . . . . . . . . . . . . . . . . . . . . . . . . . . . . . . . . . . . . . . . . . . . 3-22
Description of a Sample Output . . . . . . . . . . . . . . . . . . . . . . . . . . . . . . . . . . . . . . . . . . . . . 3-24
Setting Error Processing. . . . . . . . . . . . . . . . . . . . . . . . . . . . . . . . . . . . . . . . . . . . . . . . . . . . . . . 3-28
Procedure for Setting Error Processing. . . . . . . . . . . . . . . . . . . . . . . . . . . . . . . . . . . . . . . . 3-28
Loading New Software . . . . . . . . . . . . . . . . . . . . . . . . . . . . . . . . . . . . . . . . . . . . . . . . . . . . . . . 3- 3 0
Chapter 4: Programming with PanaView
Introduction . . . . . . . . . . . . . . . . . . . . . . . . . . . . . . . . . . . . . . . . . . . . . . . . . . . . . . . . . . . . . . . . . 4-1
Changing Measurement Modes and Units. . . . . . . . . . . . . . . . . . . . . . . . . . . . . . . . . . . . . . . . . . 4-1
Open the Meter Display Window . . . . . . . . . . . . . . . . . . . . . . . . . . . . . . . . . . . . . . . . . . . . . 4-2
Change Meter Programming . . . . . . . . . . . . . . . . . . . . . . . . . . . . . . . . . . . . . . . . . . . . . . . . . 4-4
Changing a Matrix Display to a Graph . . . . . . . . . . . . . . . . . . . . . . . . . . . . . . . . . . . . . . . . . . . . 4-6
Changing Alarm Settings. . . . . . . . . . . . . . . . . . . . . . . . . . . . . . . . . . . . . . . . . . . . . . . . . . . . . . . 4-7
Changing Recorder Settings. . . . . . . . . . . . . . . . . . . . . . . . . . . . . . . . . . . . . . . . . . . . . . . . . . . . . 4- 9
Setting Recorder Values . . . . . . . . . . . . . . . . . . . . . . . . . . . . . . . . . . . . . . . . . . . . . . . . . . . . 4-9
Testing Recorder Outputs . . . . . . . . . . . . . . . . . . . . . . . . . . . . . . . . . . . . . . . . . . . . . . . . . . 4-10
Programming Error Handling . . . . . . . . . . . . . . . . . . . . . . . . . . . . . . . . . . . . . . . . . . . . . . . 4-11
Programming User Functions . . . . . . . . . . . . . . . . . . . . . . . . . . . . . . . . . . . . . . . . . . . . . . . . . . 4-12
Entering User Tables . . . . . . . . . . . . . . . . . . . . . . . . . . . . . . . . . . . . . . . . . . . . . . . . . . . . . . . . . 4 -1 4
Entering Saturation Constants . . . . . . . . . . . . . . . . . . . . . . . . . . . . . . . . . . . . . . . . . . . . . . . . . . 4-15
vi
Page 6

Chapter 1
Page 7

Features and Capabilities
Introduction to the Moisture Image Series 1 . . . . . . . . . . . . . . . . .1-1
Electronics Unit . . . . . . . . . . . . . . . . . . . . . . . . . . . . . . . . . . . . . . . .1-1
Probes. . . . . . . . . . . . . . . . . . . . . . . . . . . . . . . . . . . . . . . . . . . . . . . .1-4
Cabling . . . . . . . . . . . . . . . . . . . . . . . . . . . . . . . . . . . . . . . . . . . . . . .1-8
User Program . . . . . . . . . . . . . . . . . . . . . . . . . . . . . . . . . . . . . . . . . .1-9
Page 8

June 2003
Introduction to the Moisture Image Series 1
The GE Panametrics Moisture Image Seri es 1 is a microproc essor
based multi-cha nnel ana lyze r designe d to mea sure dissolve d moistur e
concentration in gas es and non-aqueous liquids, and dissolved
oxygen concentration in gases. It is a highly advanced industrial
analyzer whi ch is ve rs ati le and ad ap tab l e to ma ny ap pl ic ation s.
The Series 1 combines the use of hardware and software to make
various measur ements. The user conne cts the need ed input s (moi sture
probes, oxygen cells, pressure transducers, etc.) to the back panel of
the electronics unit using several types of cables. Typically , the user
installs moisture probes and oxygen cells into the process using a
sample system that is specifically designed for the application. The
sample system delivers a sa mple of the process to the probes. The
probes then se nd a signal to the Series 1 electronics unit, which
interprets the signa l and converts it into a measurement.
The complete analyzer, including electronics, cables, and
measurement probes, forms a “syste m” which is designed to monitor
the process accurately and reliably. The following sections discuss
each part of this “system.”
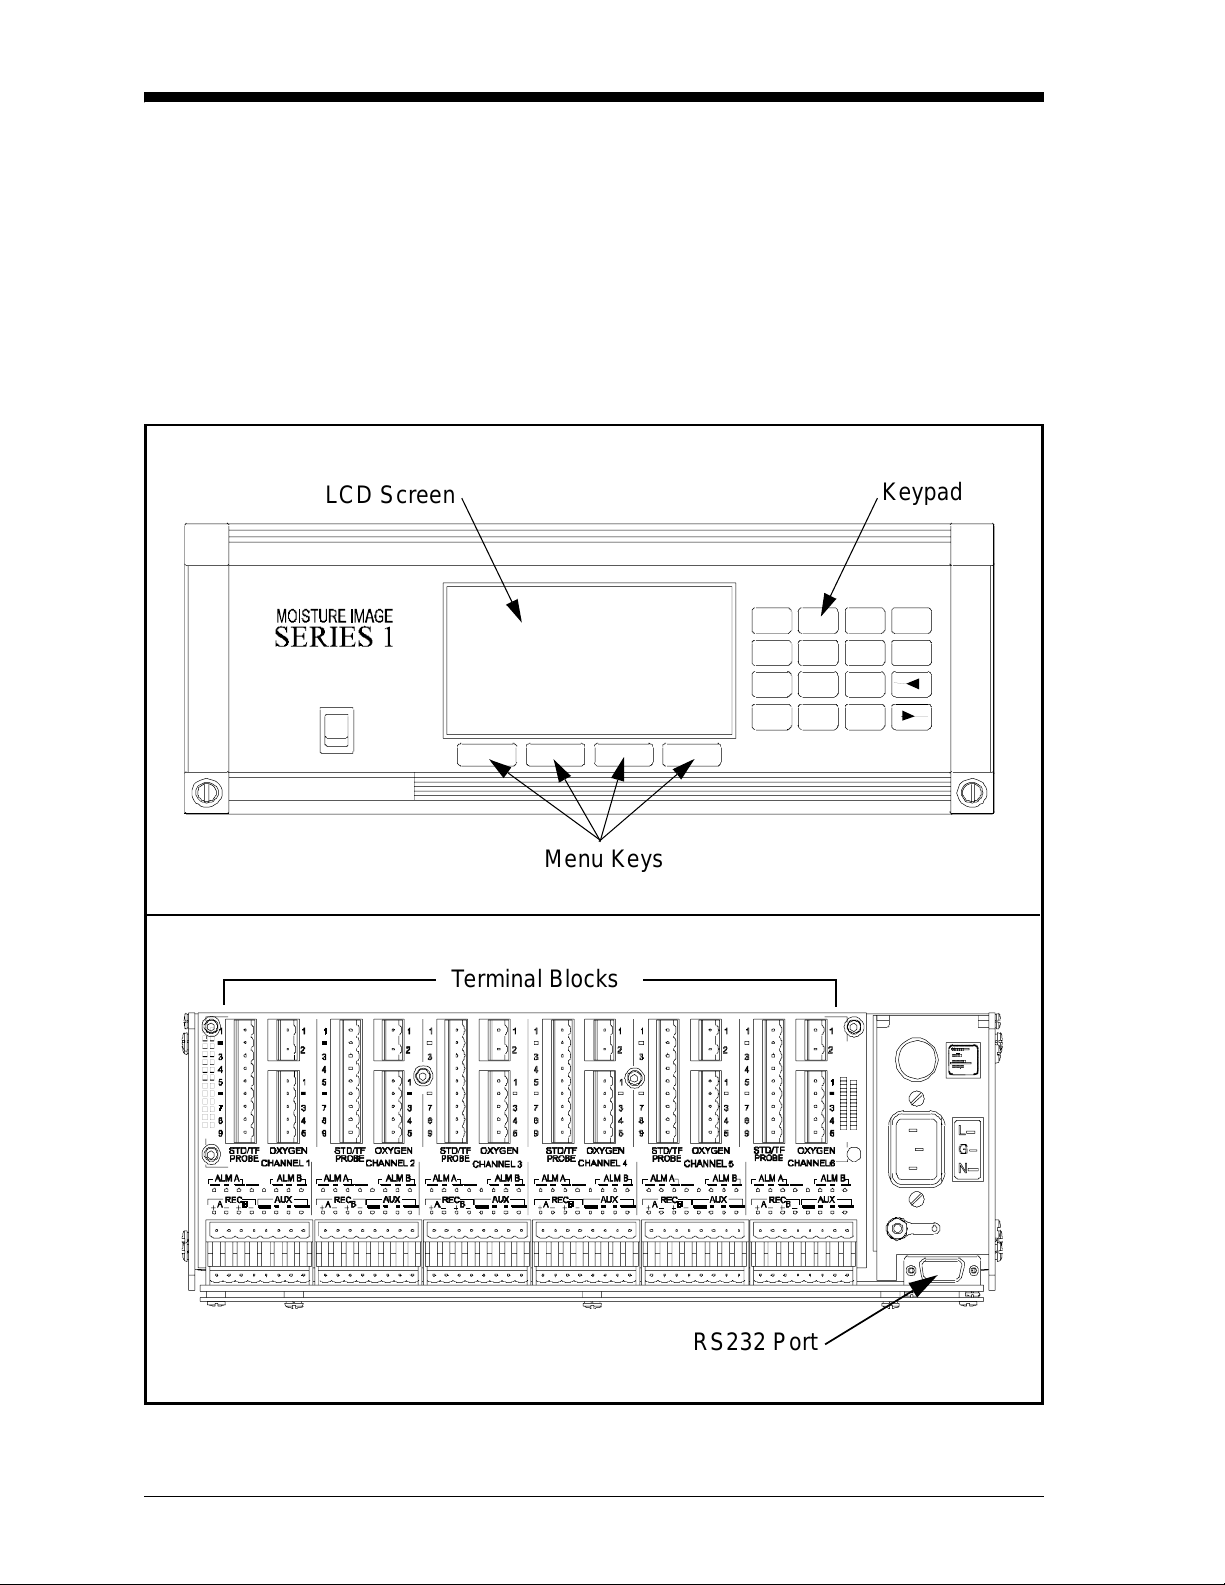
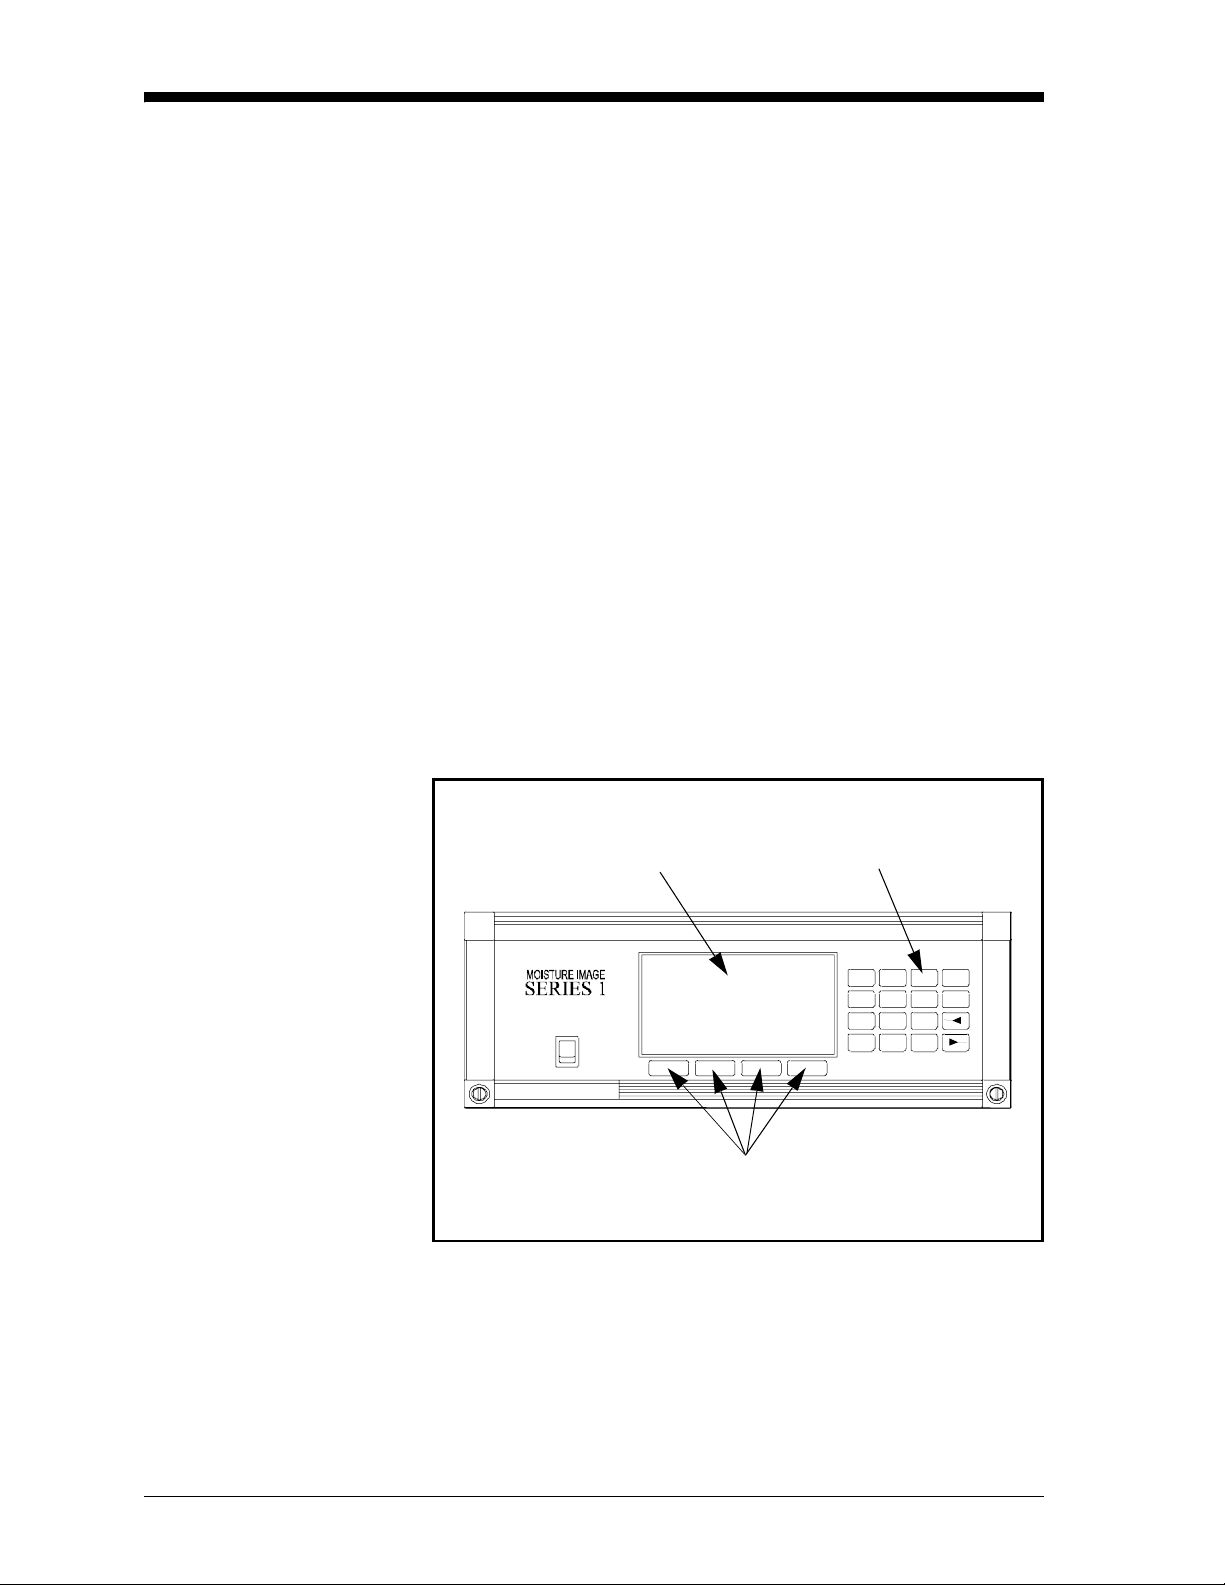
Electronics Unit The center of the “sys tem” is the el ectroni cs unit. The elect ronics unit
has many components, including terminal blocks for all connections,
an RS232 port, a Liquid Crystal Display (LCD), a keypad, and menu
keys. See Figure 1-1.
The back panel of the e lectro nics unit cont ai ns the ter minal bl ocks for
connecting moisture probes, oxygen cells, recorders, and optional
alarms (standard or hermetically sealed) for up to six channels. The
Series 1 also provides connections for two isolated outputs per
channel. Input connections for the M Series, TF Series, Moisture
Image Series and Delta F oxygen sensors are intrinsically safe.
As an optional feature, the Series 1 provides connections for two
auxiliary inputs ( not intr insi cally safe ) on each channe l. The auxil iary
inputs can accept signals f rom any 0/4 to 20-mA or 0 to 2-VDC
device, including other GE Panametrics analyzers.
The RS232 port enables the user to connect a remote terminal,
printer, or computer to the S eries 1. Using an optional Personal
Compute r (PC ) int erfa ce s oft ware p ack a g e, the user ca n als o set up
and operate one or more analyzers from a remote location, transfer
data for further analysis, and create data logs.
The front panel of the electronics unit has a Liquid Crystal Display
(LCD) to show da ta.The LCD is capable of displaying data in a line
graph, or a text matrix format.
Features and Capabilities 1-1
Page 9
April 2004
123
YES
12
2
3
Electronics Unit (cont.) The front panel a lso has a 16-key keypa d th at is used t o en ter data a nd
operate the S eries 1. There are four menu keys below the LCD, as
shown in Figure 1-1 below. The function of a menu key is indicated
directly above it on the LCD. The menu key functions chan ge as the
user makes menu selections.
The electron ics unit wi th al l thes e featu re s is avai l abl e in a rack
mount, bench mount, panel mount, weatherproof, or explosion-proof
versions.
LCD Screen
POWER
Menu Keys
Terminal Blocks
Keypad
4
7
5
8
0-
6NO
9
.
50
RS232 Port
Figure 1-1: The Serie s 1 Electronics Unit Features
1-2 Features and Capabilities
Page 10

June 2003
BASEEFA Certification Rack, bench, panel Series 1s s/n 2000 and above and WPF Series 1s
s/n 2300 and a bove are BASEEFA certified to supply intrinsically
safe levels. Installation requires that the Series 1 be mounted in a
general purpose area only. M Series, TF Series, and Moisture Image
Series probes and Delta F oxygen cells a re intrinsically safe when
connected to the Series 1, allowing f or sensor installation in IE C/
CENELEC zone 0 areas.
CSA Certification Newer versions of rack, bench, panel and WPF Series 1’s are
CSA-NR TL certified intrinsically safe. Install ation requires the
Series 1 be mounted in either a NEC CL.1, Div. 2, Group B, C or D
hazardous area or a general purpose area. M Series, TF Series, and
Moisture Image Series probes and Delta F oxygen cells are
intrinsically sa fe when connected to the Series 1, allowing for sensor
installati on in NEC CL.1, Div. 1, Groups A, B, C and D hazardous
areas.
Note: Refer to certification labels on your instrument and
installation drawing #752-138 to determine the applicable
level of certificat i on that yo ur meter ca r rie s.
Features and Capabilities 1-3
Page 11

June 2003
Probes Probe s are the part of the system that come into contact with the
process flow. The Series 1 uses various types of probes to fit the
needs of a wide range of applications.
The term “probe” includes devices such as moisture se nsors, pressure
transducers, and oxygen cells. Although you can supply your own
probes for certain measurements, GE Panametrics provides the
following standar d probes to make moisture, temperature, pressur e
and oxygen measurements:
• Moisture (M) Series - moisture and temperature (in gases and
liquids)
• Three Function (TF) Series and Moisture Image Series Probes -
moisture, temperature, and pressure (in gases and liqui ds)
• Delta-F Cells - oxygen measurement (in gases)
The most commonly used probes are discussed in more detail below.
M Series and TF Series Moisture Probes
The M Series and the TF Series probes are very similar. Both probes
use GE Panametrics aluminum oxide sensor s to measure moisture,
and thermistor beads to measure temperature (the thermistor is
optional). The TF Series, howe ver, also has an optional built-in
strain-gag e-ty p e pres su re tr ans d ucer. The sensor ass em b lies are
secured to a probe mount and are usually protected with a sintered
stainless-ste el shield (TF-9 probes do not have a shield). Othe r types
of shields are availabl e (refer to Figure 1-2 below and Figure 1-3 on
page 1-5).
When using an M Series probe, a separate pressure transmitter is
required if in-li ne pressure measurement is needed. The Series 1 can
use any pressure transmitte r with a 0/4 to 20 mA or 0 to 2-V output.
Alternativel y, the user can enter fixed values for temperature and
pressure into the Series 1 memory if the process conditions are
constant.
Figure 1-2: The M Serie s Probe
1-4 Features and Capabilities
Page 12

M Series and TF Series
Moisture Probes (cont.)
June 2003
Figure 1-3: The TF Series Probe
Although the M and the TF S eries probes may be installed directly in
the process line, more often these probes are inserted into a sample
system. The sample system protects the probes and enables the user to
easily remove the probes for calibrating, servicing and cle aning.
Sample systems also control the flow of the process stream so that it
is within the specifications of the measurement probe or cell.
The M and TF Series probes, when used with a BASEEFA-approved
Series 1, are intrinsically safe (see Chapter 3, Specifications, of the
Start up Guide for BASEEFA certification numbers) and designed to
meet the requirements of IEC/CENELEC zone 0 areas.
When operated with a CSA-NRTL approved Series 1, the M and TF
Series probes are intrinsically safe (see Chapter 3, Specifications, of
the Series 1 Startup Guide for CSA-NRTL certification numbers) and
designed to meet the requirements of NEC C1.1, Di v. 1, Groups A, B,
C and D hazardous areas.
The M and TF Series probes measure moisture conten t in a standa rd
range from –110°C to 20°C (–166°F to 68°F) dew/frost point
temperature and option ally from –110°C to 60°C (–166° F to 140°F).
Both probes optionally measure temperature in a range of –30°C to
70°C (–22°F to 158°F). The TF probe optionally measures pressure
from 30 to 300, 50 to 500, 100 to 1000, 300 to 3000, or 500 to 5000
PSIG.
Features and Capabilities 1-5
Page 13
June 2003
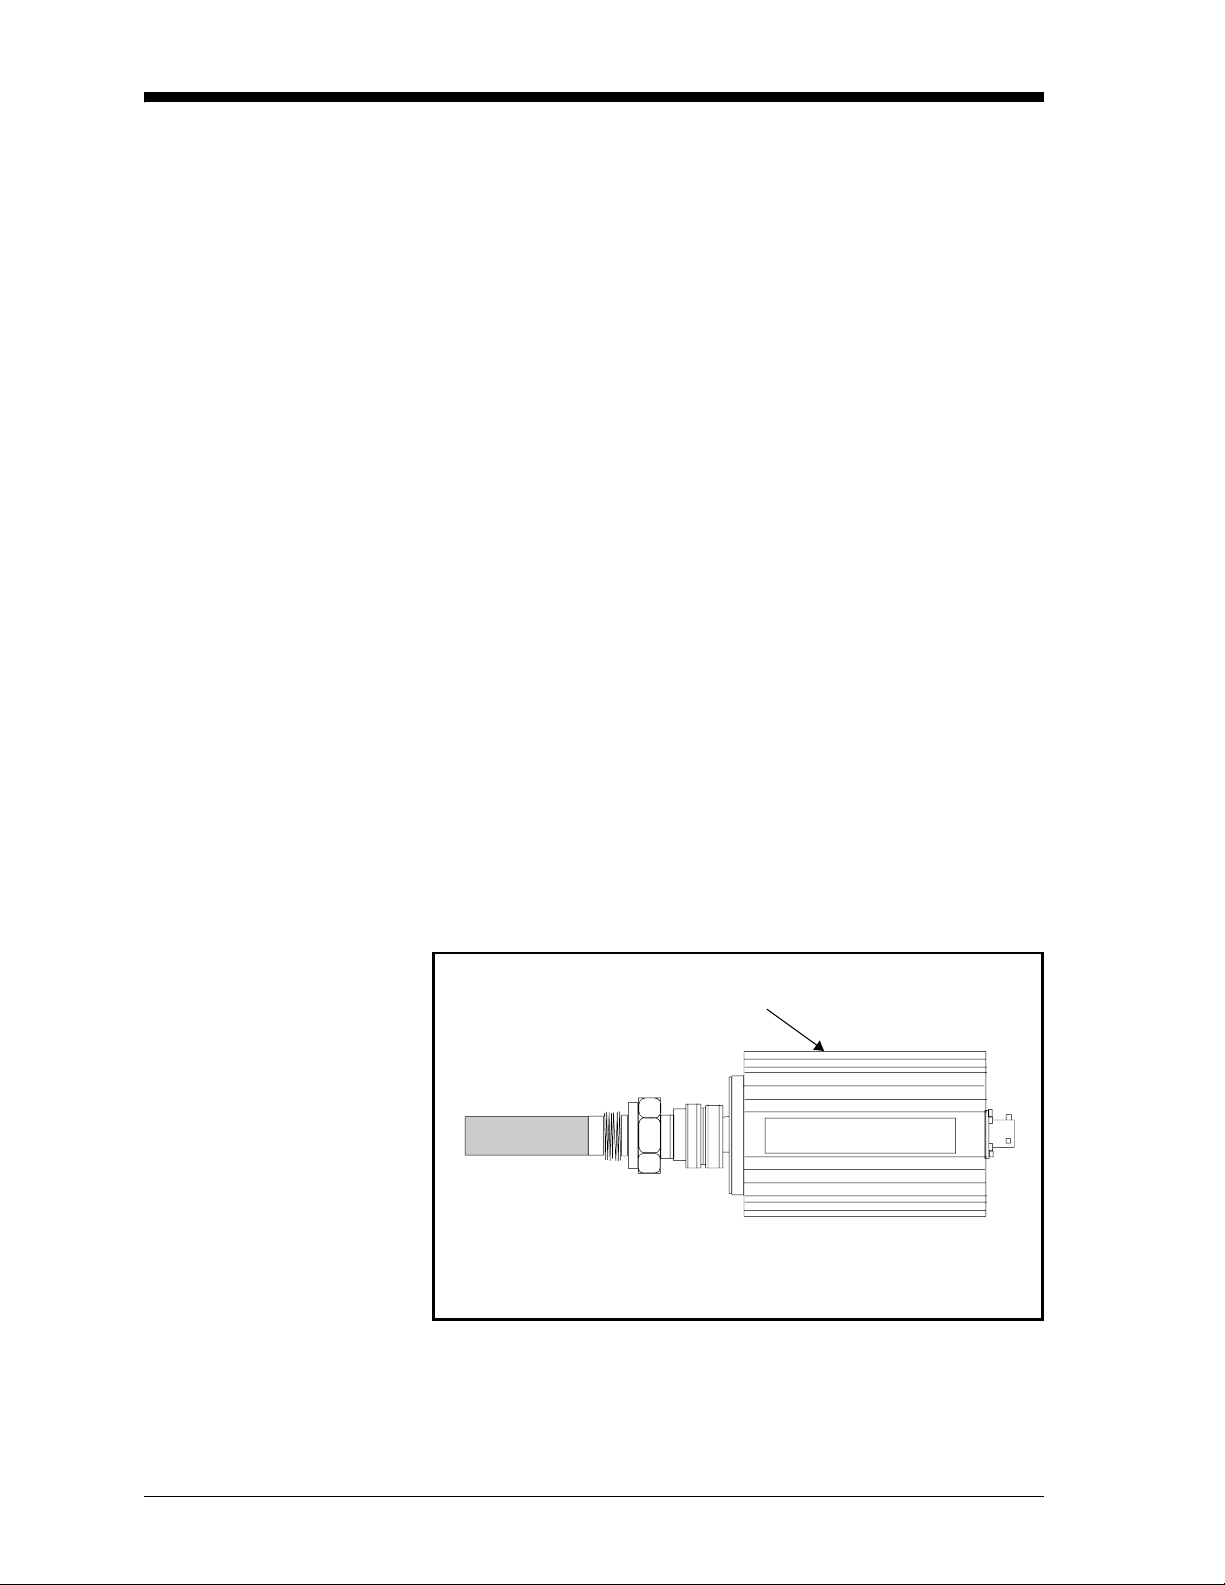
Moisture Image Series Probe
The Moisture Image Series Probe measures moisture, temperature
(optional), and pressure (optional). The Moistu re Image Ser ies Probe
has its own electronics module that consists of a built-in
microcontroller with 16-bit resolution (see Figure 1-4 below).
The electronics module stores the probe cali bration and refere nce data
in non-volatile memory; the refore, the user never needs to enter the
data by hand. The Moisture Image Series Probe also features
continuous compensation of its own analog circuitry to assure longterm electronic stability.
The Moisture Image Series Probe, when operated with a BASEEFAapproved Series 1, is intrinsically safe (see Cha pter 3, Specifications,
of the Startup Guide for BASEEFA certification numbers) and
designed to meet the require ments of IEC/CENELEC zone 0 areas.
The Moisture Image Series Probe, when operated with a CSA-NRTL
certified Series 1, is intrinsically safe (see Chapter 3, Specifications,
of the Series 1 St artup Guide for CSA-NRTL certification numbers)
and designed to meet the requirements of NEC C1.1, Div. 1, Groups
A, B, C and D hazardous areas.
The Moisture Image Series Probe measures moisture content in a
standard range from –110°C to 20°C (–166°F to 68°F) dew/frost
point temperature and optionally from –110°C to 60°C (–166°F to
140°F). Additionally, the Moisture Image Series Probe can be used to
measure temperature in a range of –30°C to 70°C (–22°F to 158°F)
and pressure from 30 to 300, 50 to 500, 100 to 1000, 300 to 3000, or
500-5000 PSIG.
Electronics Module
Figure 1-4: The Moisture Image Series Probe
1-6 Features and Capabilities
Page 14
June 2003
Delta F Oxygen Cell The Series 1 stand ard oxygen measurement probe is the Delta F Cell.
Overall oxygen content range is from 0 to 25%. You may choose
from seven standard oxygen r anges.The lowest standard ra nge is 0 to
1/10/100 ppm, and the highest st andar d range is 0 to 25% oxygen. An
ultra-low range sensor that covers 0-500 ppb
than 5 ppb is also available. The Series 1 also accepts oxygen inputs
from other GE Panametrics oxygen sens ors.
If your application has a high conc entration of acid-forming
components, GE P anametrics can supply a STAB-EL option for the
Delta F Cell. The STAB-EL option is specially designed to
effective ly neutralize these components from the sample gas stream.
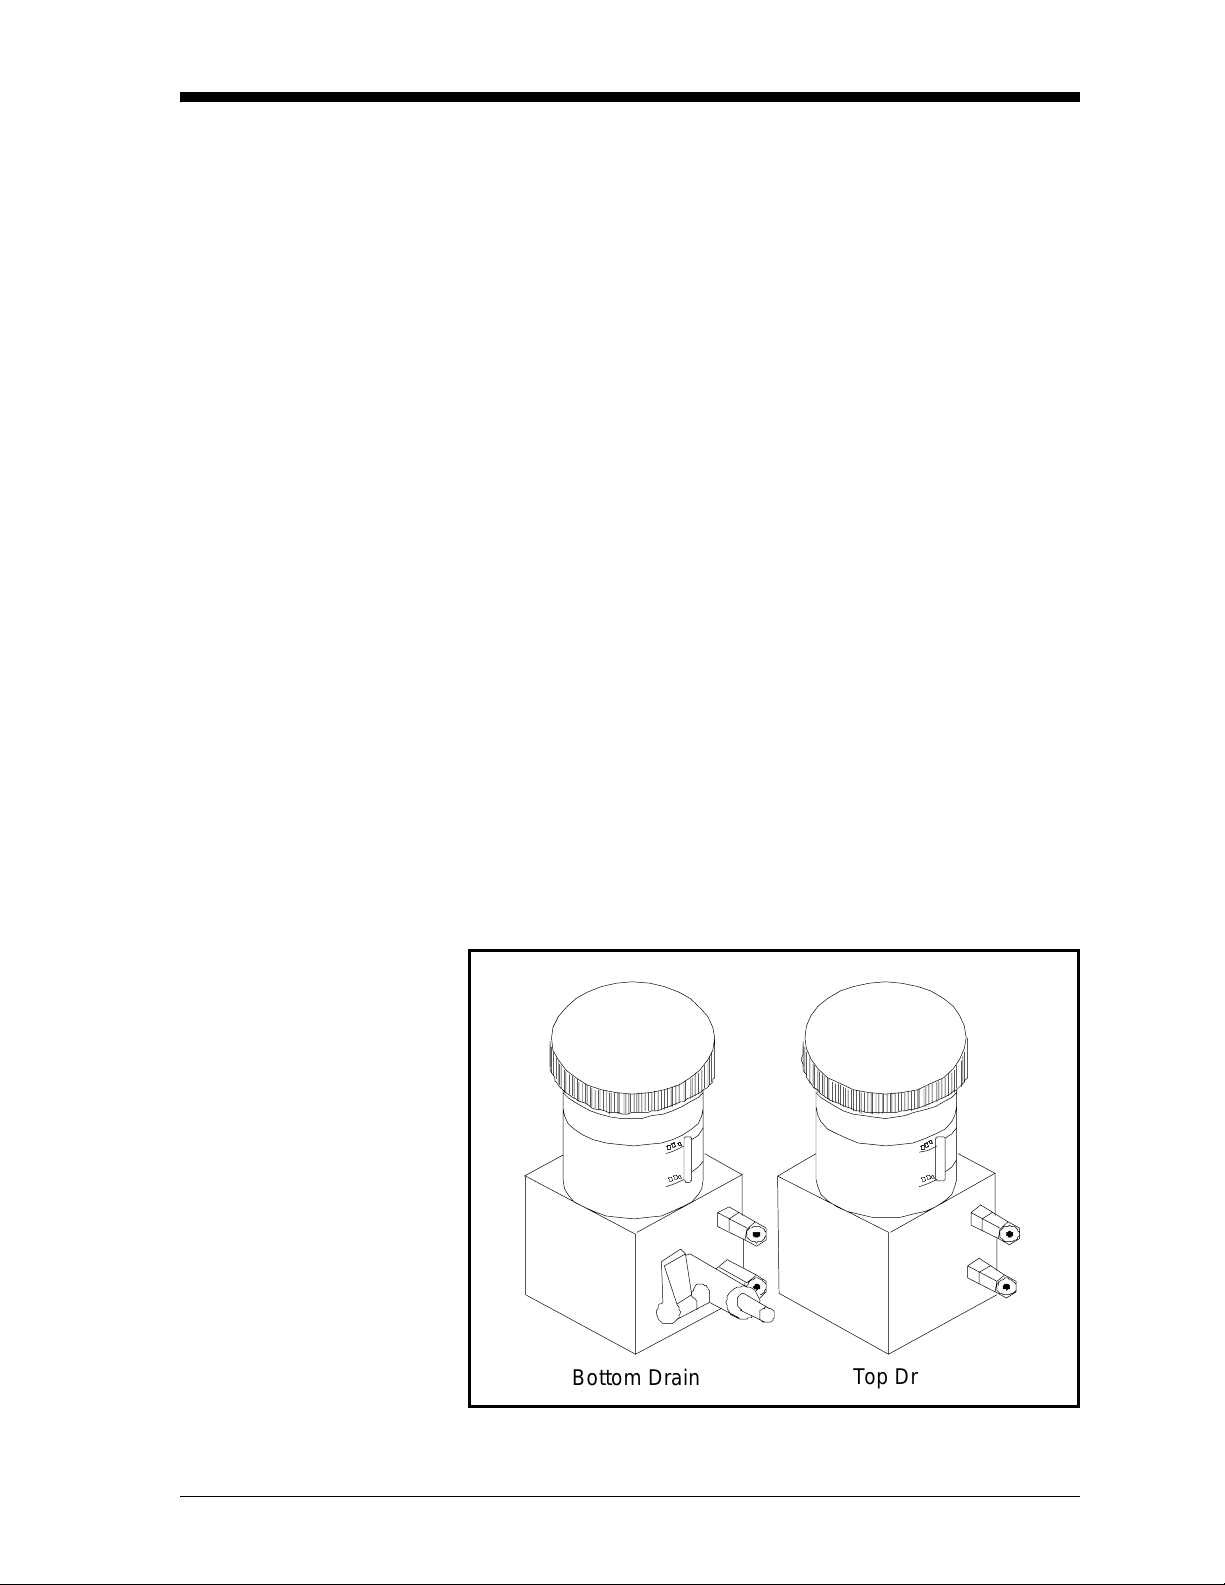
The Delta F Cell is available in a general purpose model with both a
top and bottom drain or only a top drain (see Figure 1-5 below) . The
Delta F Cell is usually inst alled in its own sample system.The Delta F
Cell is available with VCR® fittings, mounted in a NEMA-4X
enclosure for weatherproof/cor rosion resistant applications, or
mounted in a NEMA-7 enclosure for hazardous areas.
and is sensitive to le ss
v
The Delta F Cel l, when ope rat ed w i th a BASE E FA-approved
Series 1, is intrinsically safe (see Chapter 3, Specifications, of the
Start up Guide for BASEEFA certification numbers) and designed to
meet the requirements of IEC/CENELEC zone 0 areas.
The Delta F Cell, when used with a CSA-NRTL certified Series 1, is
intrinsically sa fe (see Chapter 3, Specifications, of the Series 1
Start up Guide for CSA-NRTL certification numbers) a nd designed to
meet the requirements of NEC C1.1, Div. 1, Groups A, B, C and D
hazardous areas.
Bottom Drain
Top Drain
Figure 1-5: Delta F Oxygen Cells - Bottom and Top Drain
Features and Capabilities 1-7
Page 15

April 2004
Cabling Each probe requires an interc onne cting cable. Cables differ
depending on the probe. The various cables are discussed below
under the appropr iate pr obe type . All of these cable assembl ies c an be
ordered from GE Panametrics.
M Series and TF Series Probes
Moisture Image Series Probe
The M and the TF Series probes are connected to the analyzer with a
special GE Panametrics shielded cable. Probes can be located up to
600 meters (2000 feet) from t he Series 1 (consult GE Panametrics for
distances up to 1200 meters). To measure pressure with a TF probe,
the maximum cable length is approximately 152 meters (500 feet).
Small electronic offsets, especially with longer cables, are possibl e
and should be corrected as described in Performing a MH C alibrati on
Test/Adjustment on page 1-20 of the Service Manual.
The Moisture Image Series Probe can be connected to the Series 1
with an unshie lded, twisted-pair cable. The probe may be located up
to 915 meters (3000 feet) from the analyz er using 22 AWG twisted
pair cable. (Consult GE Panametrics for longer cable lengths.)
Delta F Oxygen Cells The standard Delta F Cell is connected to the analyzer with a four-
wire shielded cable (22 AW G). With 22-AWG cable, oxygen cells
with a range from 0 to 1/10/100 ppm
located up to 90 meters (300 feet) away from the analyz er. All other
oxygen cells can be located up to 15 meters (50 feet) away. For
greater cable lengths, 20, 18 or 16 AWG wir e is required. Consult a
factory engineer when a longer length is required.
or 0 to 0.5/5/50 ppmv can be
v
Pressure Sensors The Series 1 accep ts either p res su re t rans du cer s or pr es sur e
transmitters. Most pressure transducers can be connect ed with a
standard four-wire shielded cable. Most pressure tr ansmitters are
connected using either a two or four-wire non-shielded cable and can
be either loop or self-power ed.
RS232 Communications Port
A personal computer or serial printer can be connected to the Series 1
RS232 communications port using a standard serial cable. A special
switch enabl es the u ser to co n fig u re the un it as Da ta Terminal
Equipment (DTE) or Data Communications Equipment (DCE). (See
Connecting a PC or Printer in Chapte r 1 of the Service Manual for
details on DTE/DCE configuration.)
1-8 Features and Capabilities
Page 16

June 2003
User Program The Series 1 has a user program that is accessed and controlled by the
keypad (to the right of the LCD screen) and the four menu keys
(located under the LCD screen).The user program enables the user to
enter the necessary pr obe data, set up the LCD screen, and control the
other operational features. The meter stores this data in bat terybacked RAM for up to five years, even if power is off.
The user program consists of the following four main menus:
• HELP - provides on-li ne he lp for t he various m enus wit hin the use r
program.
• SELECT - lets the user selec t the type of measur ement and units to
display.
• SETTINGS - enables the user to enter probe data and set up basic
functions suc h as recor de rs an d alarm s .
• OPTIONS - enables the user to set up the Series 1 screen to display
measurements in matrix or graphic format and perform advanced
functions.
The Settings Menu pro mpts the user to e nter a passcod e (see Entering
the Passcode in Chapter 2) .
All the functions and f eature s of the S eries 1 progr am are dis cussed in
Chapters 2 and 3, Basic Programming and Advanced Programming.
Features and Capabilities 1-9
Page 17

Chapter 2
Page 18

Basic Programming
Introduction . . . . . . . . . . . . . . . . . . . . . . . . . . . . . . . . . . . . . . . . . . .2-1
Getting Started . . . . . . . . . . . . . . . . . . . . . . . . . . . . . . . . . . . . . . . . .2-2
Ver ifying and Entering Setup Data . . . . . . . . . . . . . . . . . . . . . . . . .2-8
Displaying Measurements. . . . . . . . . . . . . . . . . . . . . . . . . . . . . . .2-28
Adjusting the Contrast of the Screen. . . . . . . . . . . . . . . . . . . . . .2-40
Setting the Clock and Calendar . . . . . . . . . . . . . . . . . . . . . . . . . .2-41
Page 19

June 2003
Introduction The Moisture Image Series 1 is a highly advanced and versatile
instrument. Because of this, operation ranges from basic to advanced
functions. This section is designed to provide a step-by-step guide to
basic operations. For information on other functions, refer to Chapter
3, Advanced Programming.
IMPORTAN T: You must install a switch or circuit breaker on the
input power line. For greatest safety, locate the
circ uit breaker or power switch near the electronics
console. To comply with the Low Voltage Directive,
you must install an external current protection
device.
The following sections cover basic programming functions:
• Getting Started - describes how to power up, gives a description of
the user program, and expla ins how to obtain on-line help.
• Verifying Setup Data - describes how to verify and, if neces sary,
enter setup data f or moistur e, p ressure, oxygen, and an y other input
devices.
• Displaying Measur e ments - expla ins how to displ ay measur ements
using differ ent screen formats.
• Adjusting the Contrast of the Screen - explains how to adjust the
screen for optimal viewing.
• Setting the Clock and Calendar - explains how to set the internal
clock and calendar.
Note: Because they are so essential, the instructions covered in the
Getting Star ted, Verifying and Entering Setup Data and
Displaying Measurement s sections are also inc lude d in the
Start up Guide. If you have read this material, you may skip
those sections of this chapter.
Basic Programming 2-1
Page 20

June 2003
Getting Started The purpose of this section is to give a brief description of the Series
1 user program and explain how to use its front pane l for viewing and
entering data. This section includes the following:
• powering up the meter
• entering data into the user program
• screen and key functions
• entering the passcode
• getting on-line help
Read the following sections c are fully to properly set up and operate
your instrument.
!WARNING!
TO ENSURE THE SAFE OPERATION OF THIS UNIT,
YOU MUST I N STALL A ND OPERAT E T H E SERIES 1
AS DESCRIBED IN THIS MANUAL. IN ADDITION, BE
SURE TO FOLLOW ALL APPLICABLE SAFETY
CODES AND REGULATIONS FOR INSTALLING
ELECTRICAL EQUIPMENT IN YOUR AREA.
Powering Up The Series 1 has a universal power supply that a utomatically adjusts
to line voltages from 90 to 260 VAC. After making electrical
connections (including grounding) as described in Chapter 1,
Installation, of the Start up Guide, pre ss the powe r switch to powe r up
the meter.
IMPORTAN T: .The AC power cord is the main disconnect device.
For compliance with the EU’s Low Voltage Directive
(IEC 1010), this unit requires an external power
disconnect device such as a switch or circuit breaker.
The disconnect device must be marke d as such,
clearly visible, directly accessible, and located
within 1.8 m (6 ft) of the unit.
2-2 Basic Programming
Page 21

Powering Up (cont.) Caution!
Do not op erate the De lta F oxy gen cell for ex t ended
peri ods of time at oxyg en concentrations th at are over
range. Trace and low percent range sensors may be
damaged if expose d t o high levels of ox y gen, such as
air, for l ong periods (>1 hour) while the Se ries 1 is on . If
exposure is unavoidable, either disconnect the oxygen
cell from the Ser ies 1 or equi p the sample system with a
valve that allows the cell t o be switched to purge gas .
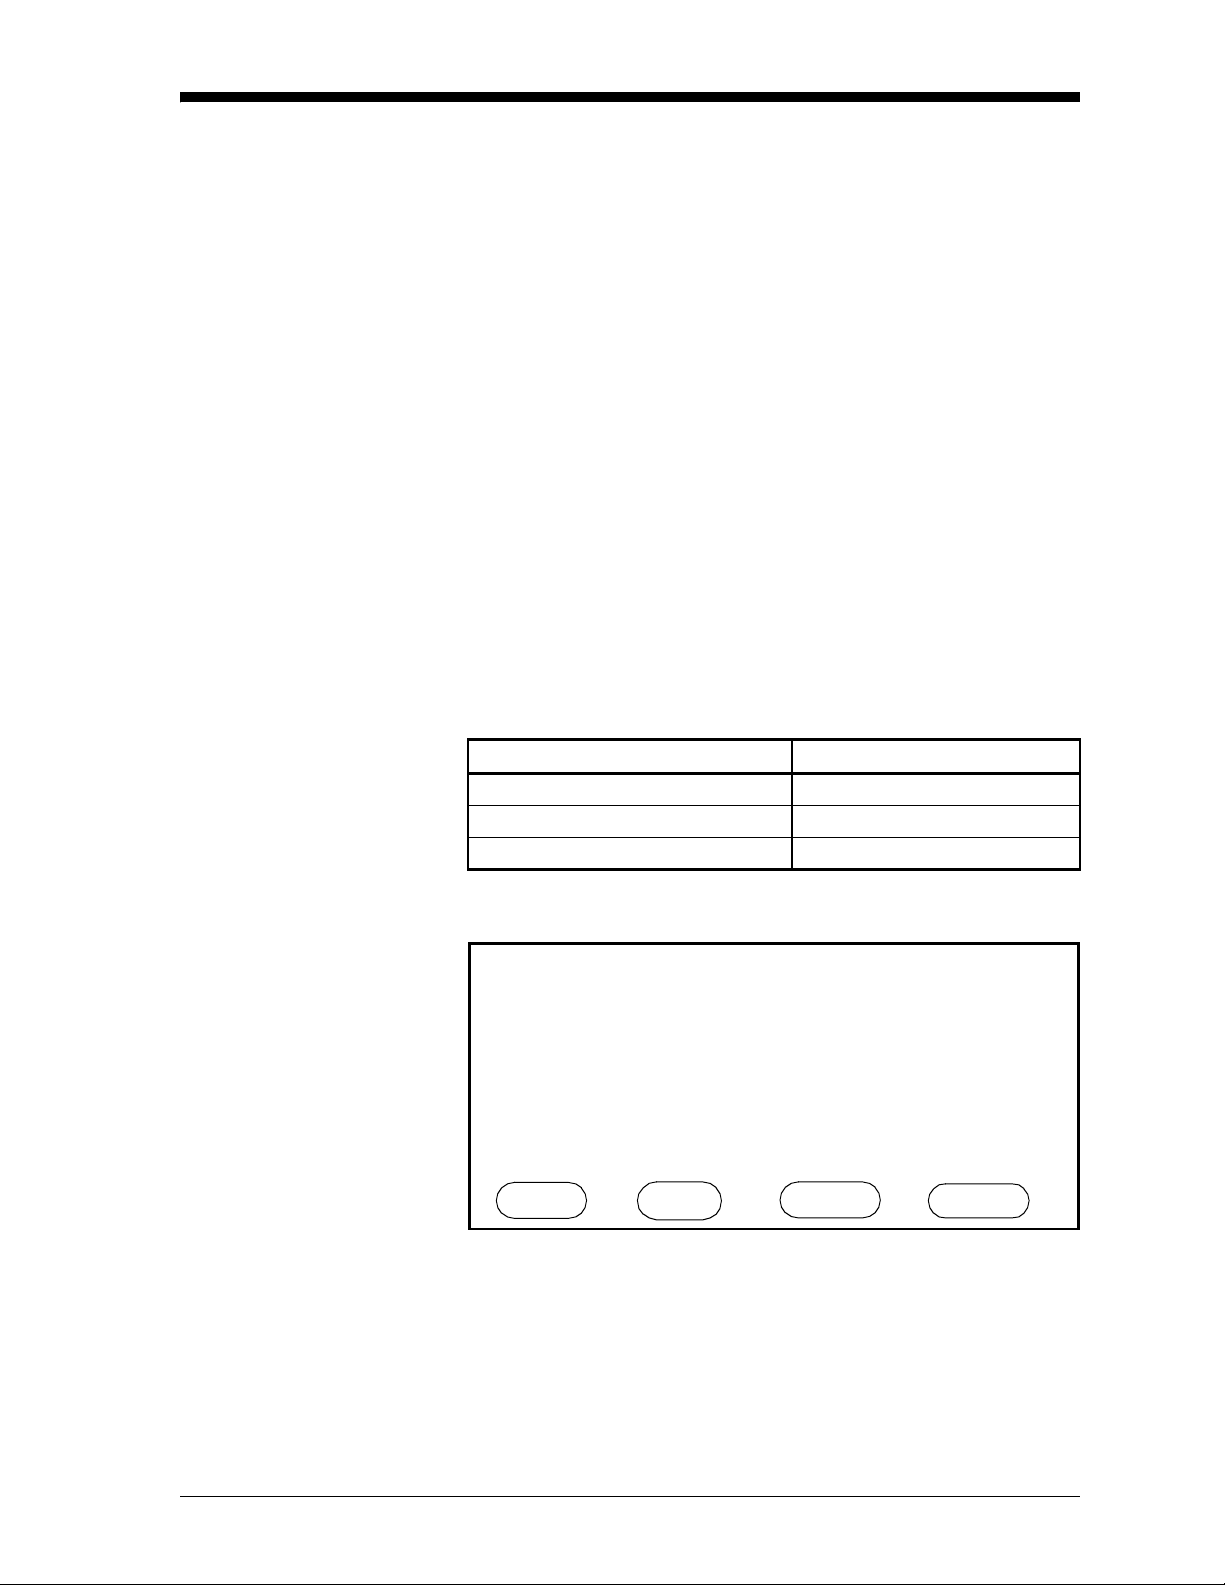
If the meter passes its self-test, the screen begins displaying
measurements in a matrix format similar to the one shown in
Figure 2-1 below.
June 2003
1 Dew Point
-18.0 ° C
2 Temperature
+35.9 °C
3 H
O
2
+0.535 ppm
v
4 Oxygen
48.3 ppb
v
5 Pressure
27.10 PSIg
X Unassigned
Main Menu 11:35 01/22/2000
pg: 1
HELP SELECT SETTINGS OPTIONS
Figure 2-1: Screen Matrix Format After Power Up
Basic Programming 2-3
Page 22
June 2003
123
YES
Entering Data into the User Program
The Series 1 has a user program that enables you to enter data to set
up alarms, recorders, a nd probes, as well as its other features.
The user program c onsists of the following four main menus (refer to
Figures 3-17 and 3-18, page s 3-31 and 3-32, for menu maps of the
user program):
• HELP - provides on-line help for the vari ous menus of the
user program.
• SELECT - lets you select the type of measurement a nd units to
display.
• SETTINGS - enables you to s et up r ecorde rs and al arms, as we ll as
enter probe data for basic operation. (To enter this menu you must
enter the passcode. See page 2-6.)
• OPTI ONS - enables you to set up the screen to display
measurements in text or graphical form. It is also used to perform
advanced functions .
You can use the screen, four menu keys, and the keypad to enter data
into the unit (see Figure 2-2 below).
Screen
POWER
Keypad
4
7
5
8
0-
6NO
9
.
Menu Keys
Figure 2-2: The Moisture Image Series 1 Front P anel
2-4 Basic Programming
Page 23
June 2003
Screen and Key Functions
The screen displays measur ements, up to four menu options, system
messages , and a pointer. The pointer acts as a measurement
indicator, as well as a guide during data entry.
While the unit displays measure ments in the matrix format, the
pointer moves sequenti ally from box to box to indicate measurement
updates. However, while in the user program, you can use the arrow
keys to move the pointer to the desired location for data entry.
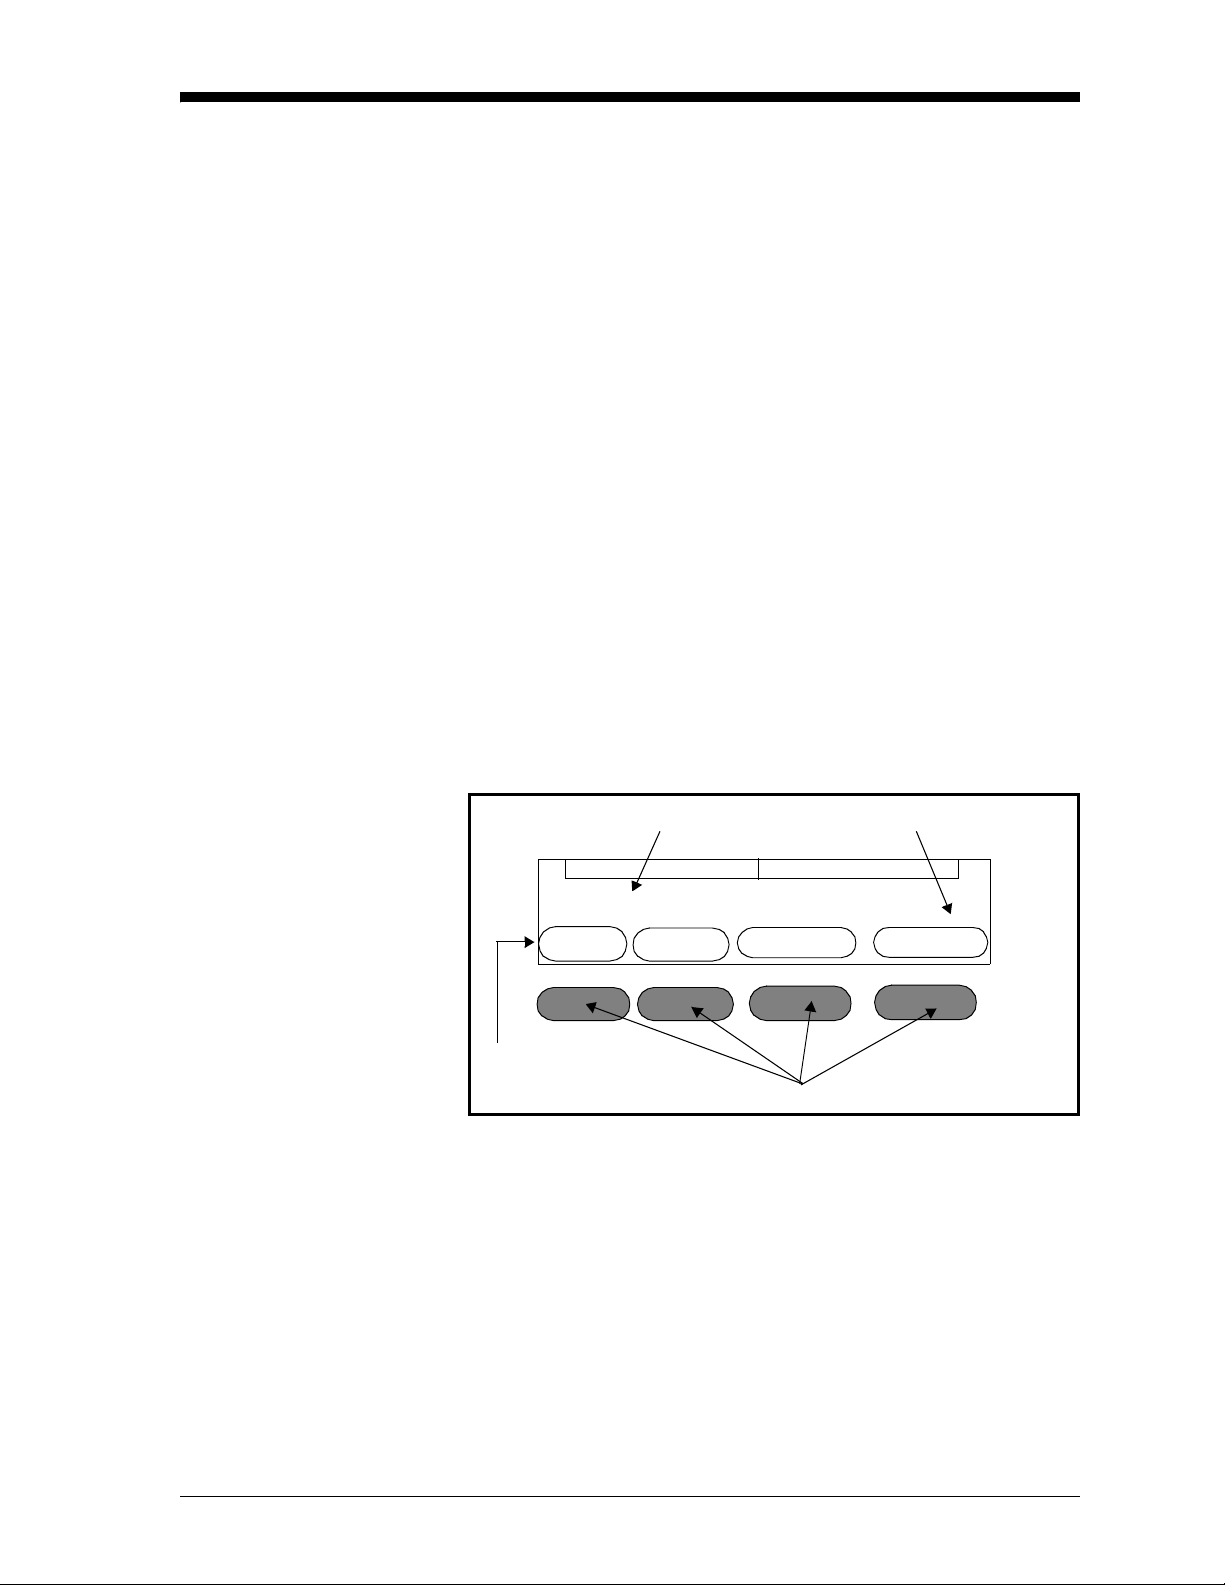
The menu options appear at the bottom of the screen. Below the
screen are the corresponding menu keys (refer to Figure 2-3). Each
menu key corr esponds to each of the menu options in the user
program. Up to four n ew menu options appea r each tim e you en t er a
menu.
The line above the menu options is the message line (see Figure 2-3
below). The message line displays the menu title, the time, and the
date. The message line also displays a list of selections de pending on
the menu option you enter.
The page indicator is located in between the message line and the
menu keys. Since the Series 1 is capable of displayi ng up to six pages
of data, the page indicator displays the currently selected pa ge.
Message Line
Main Menu 11:35 01/22/2000
HELP SELECT SETTINGS OPTIONS
Menu Options
Page Indicator
pg: 1
Menu Keys
Figure 2-3: Screen Components
Basic Programming 2-5
Page 24

June 2003
Screen and Key
Functions (cont.)
The keypad to the side of the screen consi sts of 16 keys, incl uding t he
[.] and [-] symbol s , two arrow k eys , and two respon s e key s: [YE S ]
and [NO]. The numeric keys are for numeric entry only; however , the
arrow and response keys have more than one function.
The arrow keys perform two functions:
• Use either arrow key to move the screen pointer to the desired
location for data entry.
• Use the left arrow key as a backspace during number entry.
The response keys perform thre e funct ions:
• Use either the [YES] or [NO] key to respond to questions.
• Use the [NO] key to erase data.
• Press [YES] to confirm a num ber entry or after e rasing data to
retrieve the previ ous number.
Entering the Passcode The Settings Menu is the only menu that requir es a passcode. The
passcode is a four-digit number that enables only author ized users to
enter setup data. The Series 1 pr ompts you to ente r the pa sscode whe n
you enter the Settings Menu. See the end of this chapter for your
default passcode.
2-6 Basic Programming
Page 25

June 2003
Getting On-Line Help The Series 1 offers on- line help screens that contain descriptions and
instructions for various topics. The first menu option in most of the
menus is HELP.
When you press the HELP menu ke y, the screen display gives a list of
help topics as shown in Figure 2-4. This list enables you to get help
for most subjects, regardless of the current menu. To select a topic,
use the arrow keys to move the pointer to the topic you want to view ,
then press [YES]. Use the NEXT and PREVIOUS menu options to
scroll from one page to another. The NEXT menu option brings you
to the following page and the PREV menu options brings you to the
previous page. Press DONE to exit and return to the current menu.
Select Topic, then press YES.
Alarms Entering Text
AutoCal Error Messages
Calibration Error Processing
Clock/Calendar Graphs
Cs Constant
Configuration Legends,Entering
Data Logging Logger,Capacity
Delta-F Tables Logger,Setting
Enhanced Response Logger,Viewing
Entering Numbers Main Menu
Help Topic Index Menu
ABOUT NE X T PREV DONE
Henry’s Law
Figure 2-4: HELP Screen
By pressing the ABOUT key, users can access the history of their
particular Series 1: its serial number, P CI number, software revision
number and date of manufa ctur e. Thi s informati on r emains part of the
HELP file and cannot be changed by the user.
Basic Programming 2-7
Page 26

April 2004
Verifying and Entering Setup Data
Before the Seri es 1 can make measur em en ts, it must ha ve the p ro per
setup data e ntered into its memory. GE Panametrics has entere d all or
most of the setup data for each probe before delivery; however, you
should verify that all the data is corr ect and entered into your unit.
Note: If you want to switch a probe from one channel to another,
you must re-e nter some or all of the setup data as descri bed in
this section.
Verifying setup data consists of three steps:
• Verify that probes are properly activated in the Probe
Configuration Menu as descri bed on page 2-9.
• Verify that calibration data for all necessary probes is properly
entered in th e System Calibration Menu as described on page 2-12.
• Verify tha t app lic ab le hig h and low ref e re nc e value s for the Series
1 measurement circuitry are properly entered into the Reference
Menu as described on page 2-21.
Caution!
All high and low reference v alues are fac t ory s et and
normally do not need adjustmen t . H ow ever, t he factory
may instru c t you to adjust th e high and low moistur e
reference values. If necessary, you should do so as
described in Performing an MH Calibration/Adjustment
Test on page 1-20 of the Service Manual.
Use the following sections to pr operly verify and enter setup data.
IMPORTAN T: While you are reviewing data, you should take the
time to record it on the Program Information List
supplied in Appendix A of the Startup Guide, or on a
separate sheet of paper.
2-8 Basic Programming
Page 27
April 2004
Activating and Changing Probes
Verifying Probe
Configuration Data
Although the probes are physica lly connected to the back of the
electronics unit, you must “tell” the electronics what type of
measurements the probe is capable of makin g. I n addition, if you
want to use a constant va lue rather than a live input, you must “tell”
the electronics that you are using a constant value.
If you do not activate probes, or if you activate them incorrectly, the
unit will display
No Probe o r other error messages.
Once you verify and/or change confi gur ation data, refer to Entering
Calibration Data on page 2-12.
IMPORTAN T: You should record this data on the Program
Information List supplied in Appendix A of the
Start up Guide, or on a separate shee t of paper, and
keep it in a safe place.
1. Enter the Probe Configurat ion Menu (for a menu map, refer to
Figure 3-19 on page 3-32). A screen similar to Figure 2-5 below
appears.
Table 2-1: Entering the Probe Configura tion Menu
Press th e Main Men u key: To enter the:
SETTINGS* Settings Menu
SYSTEM System Settings Menu
CONFIG Probe Configuration Menu
* The Settings Menu will prompt for a passcode (see page 2-6).
SYSTEM CONFIGURATION
Ch O2 HYG T P Aux1 Aux2
1
2
3
4
5
6
Probe Configuration Menu
HELP TAG ERRORS DONE
Figure 2-5: Probe Configuration Menu
Basic Programming 2-9
Page 28

April 2004
Activating and Changing
Probes (cont.)
Verify that the correct probe types have been a ctivated for each
channel. To do this, make sure a probe is activated for each
measurement it is capable of taking. For example, if a Moisture
Image Series Probe with the temperature and pressure functions is
connected to channel 1, “MIS” must be select ed in the hygrometry,
temperature, and pressure columns as shown in Figure 2-6 below.
If the optiona l auxiliary inputs are installed and active, you only need
to select whe ther the input is c urrent or voltage. If you do not select
current or voltage, the Series 1 defaults to current.
Note: If you are using an auxil iary input to measur e pressure,
activate Au1 (or Au2 depe nding on which input you ar e using )
in the pres sure column for the desired channel; then activate
curre nt or voltage in the Aux 1(or Aux 2) column.
In addition, if you connect a pressure transducer to the PRESS/
OTHER terminal bloc k, you must activate the TF probe in the
pressure col umn fo r that ch ann el .
If you need to change any data in the Probe Configuration Menu, see
the following sectio n, Ente ring or Changing Probe Configuration
Data. If the data is correct, refer to Tagging the Inputs on page 2-37.
SYSTEM CONFIGURATION
Ch O2 HYG T P Aux1 Aux2
1
2
3
4
5
6
Probe Configuration Menu
MIS MIS MIS
HELP TAG ERRORS DONE
Figure 2-6: MIS Probe Configuration on Channel 1
2-10 Basic Programming
Page 29

April 2004
Entering or Changing
Probe Configuration
Data
Figure 3-19 on page 3-32 for a menu map.
1. From the Probe Configuration Menu (Table 2-1 on page 2-9),
move the pointer to the channel and probe y ou want to select. The
arrow will move only to installed channels.
2. Press [YES].
3. The possible probe types appear on the message line at the bottom
of the screen. Table 2-2 on page 2-12 shows the available probe
types.
If you choose to enter a constant for moisture (Kh), temperature (Kt),
or pressure ( Kp), you must ente r a c onstant value in the User Const ant
Menu. See Entering Constants and User Functions on page 3-9 for
instructions.
4. Move the brac kets t o t he corre ct pr obe t ype, then pre ss [YES]. The
selected probe type displays.
5. Repeat Steps 1 through 4 for each channel.
6. T o exit, press the DONE menu key until Main Menu appears on
the message line.
Note: You can only sele ct probes for an installed channel.
If you are only using Moisture Image Series probes, pr oceed to
Displaying Measurements on page 2-28. If you are using any other
type of input device, pr oceed to Entering Calibration Data
on page 2-12.
Basic Programming 2-11
Page 30

April 2004
Entering or Changing
Probe Configuration
Data (cont.)
Table 2-2: Probe Types
Measurement Mode Probe Type
– (None)
OXY (Oxygen)
HYG (Hygrometry)
T (Temperature)
P (Pressure)
Aux1 (A u x iliar y 1)
Aux2 (A u x iliar y 2)
% (Percent)
ppM (Parts per Million)
ppB (Parts per Billion)
– (None)
MIS (MIS Probe)
TF (Three-Function Probe)
Mxx (M Series Probe)
Kh (Constant Dew Point)
– (None)
MIS (MIS probe)
TF (Three-Function probe)
Mxx (M-Series probe)
Kt (Constant Temperature)
– (None)
MIS (MIS probe)
TF (Three-Function probe)
Au1 (Auxiliary 1)
Au2 (Auxiliary 2)
Kp (Constant Pressure)
– (None)
I (Current)
V (Voltage)
– (None)
I (Current)
V (Voltage)
Entering Calibration Data
The Series 1 needs calibration data for moisture, oxyge n, and
pressure probes, as well as auxiliary inputs. GE Panametrics has
already entered cali bration data for probes; however, you should
verify this data befor e star tup. You will need to enter this data if you:
• sent the probes back to the factory for calibration
• use a different pr obe
• use a non-GE Panametrics input
T o enter, verify, or change calibration data for any probe type, enter
the System Calibration Menu as described in Table 2-3 below. (see
Figure 3-19 on page 3-32 for a menu map.)
.
Table 2-3: M o vi n g to th e System Ca l ibr ation Men u
Press th e M ai n M en u key: To enter the:
SETTINGS* Settings Menu
SYSTEM System Settings Menu
CALIB System Calibration Menu
*The Settings Menu will prompt for a passcod e (see page 2-6).
2-12 Basic Programming
Page 31

April 2004
Entering Calibration
Data (cont.)
Refer to the appropriate section that follows to verify or enter
calibration data for:
• Moisture Probes, page 2-13
• Delta F Oxygen Cell, page 2-15
• Pressure Sensor or Tr ansmitter , page 2-17
• Optional Auxiliary Input(s), page 2-19
Be sure you have t he Calibration Data Sheets that are supplied with
each GE Panametrics probe. Eac h Calibration Data Sheet consists of
a list of data points that you will need to ent er or verify. Each
Calibration Data Sheet lists its corresponding probe serial number, as
well as the preassigned channel number. Calibration Data Sheets are
usually packed inside the probe cases.
Once you verify and/or enter cal ibration data for each input, refer to
Entering High and Low Reference Values on page 2-21.
IMPORTAN T: Staple Calibration Data Sheets to the Program
Information List (Appe ndix A of the Startup Guide)
and stor e them in a safe place. If they are lost,
contact GE Panametrics for a duplicate . If you alter
any of the calibration data, make sure you make the
change on the Calibration Data Sheet .
Entering Moisture Probe
Calibration Data
You only need to enter calibration data for M and TF Series probes.
It is not necessary to enter calibration data for the Moisture Image
Series Probe unless you send the probe back to GE Panametric s for
calibration withou t its electronic s module. If this is the case, enter the
calibration data for the recalibrated pro be as described in this section.
The Series 1 will automatically download the new calibration data
into the Moisture Image Series Probe elec tronics module.
Note: You do not need to enter calibration data for the Moisture
Image Series Pr obe because it is stor e d i n the probe’s
electr onics module . The Moist ure Image Series Probe uploads
the calibration data int o the Series 1 memory when needed.
Use the procedure below to enter the following data:
• the probe serial number
• the number of data points
• the dew point and MH (or FH, dependi ng on the pr obe) readi ng for
each data point
Basic Programming 2-13
Page 32

April 2004
1
Entering Moisture Probe
Calibration Data (cont.)
Referring to the Calibration Data Sheets, enter calibration data
separately for each probe on the designated channel as described
below. Figure 3-19 on page 3-32 for a menu map.
Note: If you want to enter a constant value, refer to Entering
Constants on page 3-9. It is not necessary to enter the
calibration data if you are using a constant.
1. At the System Calibration Menu (see Table 2-3 on page 2-12),
press the PROBE menu key until the Moisture Probe Calibr ation
screen appears (see Figure 2-7 below) .
2. Use the CHANNEL menu key to cycle to t he desi red cha nnel. The
channel number is indicated in the top right-hand corner of the
screen.The scree n will only display installed channels.
Moisture Probe Calibration Ch
S/N: ND:
## MH DP/°C ## MH DP/°
01 09
02 10
03 11
04 12
05 13
06 14
07 15
08 16
System Calibration Menu Screen 1 of 1
HELP CHANNEL PROBE DONE
Figure 2-7: System Calibration Menu for Mois ture
3. Move the pointer to
S/N and press [YES].
4. Enter the probe serial number from the Calibration Data Sheet,
and press [ YES]. (The serial number is also scribed on the hex nut
of the moisture probe.) The pointer automatically jumps to
ND.
Press [YES] again.
5. Enter the number of data points indic ated on the Calibration Data
Sheet (typicall y 2-16 points for each pr obe), and pres s [YES]. The
pointer automatic ally jumps to the first data point.
6. Move the pointer to 1 and enter the MH (or FH) values and dew
point (in °C) for each data point. Make sure you press [ENT] after
you enter each value.
7. Repeat Step 6 for each data point.
8. Repeat Steps 2 through 7 to enter moisture probe calibration data
for the remaining channels.
To enter calibration data for other probes, refer to the following
sections. To exit, press the DONE menu key until Main Menu
appears on the message line. Then refer to E nter i ng High and Lo w
Reference Values on page 2-21.
2-14 Basic Programming
Page 33

April 2004
Entering Delta F Oxygen
Cell Calibration Data
Note: The information in thi s section appli es to Delta F oxygen cells
only. If you are us ing some other type of oxygen input, refer to
Entering Auxiliary Input Calibration Data on page 2-19.
Your Delta F cell has been factory calibrated using nitrogen as the
reference background ga s. If you want to use the oxygen cell with a
different ba ckground gas than the cell was calibrated for, refe r to the
section Background Gas Correction Factors for the Delta F Oxygen
Cell in Chapt e r 2 of the Service Manual to determine the correct
oxygen current multipl ier.
Use the procedure below to enter the following data:
• the probe serial number
• the zero and span rang e in m icro am p s (µA)
• the zero and span range in parts per million by volume (ppm
ppbr, or percent (%)
Note: Oxygen cells c an be ordered to measure in ppm or percent.
Select the proper oxygen cell units in the Probe Configuration
Menu. The units you select will automatically appear in the
second column.
)
v
Procedure for Entering Delta F Cell Calibration Data
Referring to the Calibration Data Sheets, enter calibration data
separately for each probe on the designated channel as described
below. Figure 3-19 on page 3-32 for a menu map.
IMPORTAN T: Staple Calibration Data Sheets to the Program
Information List (Appe ndix A of the Startup Guide)
and stor e them in a safe place. If they are lost,
contact GE Panametrics for a duplicate . If you alter
any of the calibration data, make sure you make the
change on the Calibration Data Sheet .
1. At the System Calibration Menu (see Table 2-3 on page 2-12),
press the PROBE menu key until the Oxygen Probe Calibration
screen appears. See Figure 2-8.
2. Use the CHANNEL menu key to cycle to the desired channel.
The channel number is indicate d in the top right- hand-corner of
the screen. The screen will only displa y installed channels.
3. Move the pointer to the
S/N line and press [YES].
Basic Programming 2-15
Page 34

June 2003
Entering Delta F Cell
Calibration Data (cont.)
4. Enter the probe serial number from the Calibration Data Sheet,
and press [YES].The serial number is also on the side of the
oxygen cell.
5. Move the pointer to the Zero
6. Enter the microamp (
7. Move the pointer to the Zero ppm (or %) line and press [YES].
8. Enter the zero range value, and press [ YES]. The range units will
be either ppm or %, depending on the cell type/model selected in
the Probe Configuratio n Menu.
9. Repeat Steps 5 through 8 to enter the microamp (
value for the span line.
IMPORTAN T: Leave the O2 Current Multiplier at 1.00 unless you
are using a background gas other than nitrogen. Se e
the section Background Gas Correction Factors for
the Delta F Oxygen Cell in Chapter 2 of the Service
Manual.
Repeat Steps 1 through 9 to enter oxygen calibration data for the
remaining channels.
µA) value and press [YES].
µA line and press [YES ].
µA) and range
Oxygen Probe Calibration Ch
S/N
µA ppm (or %)
Zero: ___ ___
Span: ___ ___
O2 Current Multiplier: 1:00
System Calibration Menu
HELP CHANNEL PROBE DONE
Figure 2-8: System C al i b ra ti o n M en u fo r Oxygen Cell
To enter calibration data for other probes, refer to Entering Moisture
Probe C alibration Data on page 2-13, Entering Pressure Calibration
Data on page 2-17, and Entering Auxiliary I nput Calibr ation Data on
page 2-19. To exit, press the DONE menu key until Main Menu
appears on the message line. Then refer to E nter i ng High and Lo w
Reference Values on page 2-21.
1
2-16 Basic Programming
Page 35

April 2004
Entering Pressure
Calibration Data
Use this section to enter pres sure calibration data for any type of
pressure sensor you a re using, even if t he pr essure sensor is c onnec ted
to an auxiliary input.
To enter pressure calibration data, you must enter
• the probe serial number
• the zero and span range in mV, current, or FP
• the zero and span range in PSIg
Referring to the C alibration Data Sheets supplied by GE Panametrics
or another manufacturer, enter calibration data separately f or each
probe on the designated channel a s descr ibed below. Figure 3-19 on
page 3-32 for a menu map.
IMPORTAN T: Staple Calibration Data Sheets to the Program
Information List (Appe ndix A of the Startup Guide)
and stor e them in a safe place. If they are lost,
contact GE Panametrics for a duplicate . If you alter
any of the calibration data, make sure you make the
change on the Calibration Data Sheet .
Note: If you want to enter a constant value, refer to Entering
Constants and User F unctions on page 3-9. It is not necessary
to enter the calibration data if you are using a constant.
1. At the System Calibration Menu (see Table 2-3 on page 2-12),
press the PROBE menu key until the Pressure Probe Calibration
screen appears. See Figure 2-9 below.
Pressure Probe Calibration Ch
S/N
mV Pressure, PSIg
Zero: ____ ____
Span: ____ ____
System Calibration Menu
HELP CHANNEL PROBE DONE
Figure 2-9: System Calibration Menu for Pressure
1
Basic Programming 2-17
Page 36

April 2004
Entering Delta F Cell
Calibration Data (cont.)
Note: If you are using an auxiliary input to measure pressure, the
first column will be in mA or Volts depending on how you
configured the auxiliary input in Activating and Changing
Probes as described on page 2-9.
2. Use the CHANNEL menu key to cycle to t he desi red cha nnel. The
channel number is indicated in the top right-hand corner of the
screen. The screen will only disp lay installed channels.
3. Move the pointer to
4. Enter the probe seria l number fr om the Cali bration Dat a Sheet and
press [YES].
5. Move the pointer to the
6. Enter the voltage or current value and press [YES].
7. Move the pointer to the
8. Enter the PSIg value and press [YES].
9. Use Steps 5 through 8 to enter the span values.
Repeat steps 1 through 9 to enter pressure calibration data for the
remaining channels.
S/N and press [YES].
Zero mV (mA ) line and press [YES].
Zero PSIg line and press [YES].
To enter calibration data for other probes, refer to Entering Moisture
Probe Cali bration Data on page 2-13, Entering Delta F Oxygen Cell
Calibration Data on page 2-15, and Entering Auxiliary Input
Calibration Data on page 2-19. To exit, press the DONE menu key
until Main Menu appears on the message line. Then refer to Entering
High and Low Reference Values on page 2-21.
2-18 Basic Programming
Page 37

April 2004
Entering Auxiliary Input
Calibration Data
Note: If you ar e using an auxiliary input to measur e pressure, enter
pressure calibration data as described in Entering Pressure
Calibration Data as descr ibed on page 2-17.
This section describes how to enter calibration data for an auxiliary
input (optional). If your device is not supplied by GE Panametrics,
you will have to obtain the calibration data in order to properly set up
the Series 1.
You will need to enter two to 16 data points. If the sensor is linear ,
you only need to enter two data points. Each data point requires a
voltage or current value depending on the probe configuration (see
page 2-9) and a corresponding scale value. Use the procedure below
to enter data.
Figure 3-19 on page 3-32 for a menu map.
IMPORTAN T: Enter the auxiliary calibration data on the Program
Information List (Appe ndix A of the Startup Guide)
and stor e it in a safe place. If it is lost, contact GE
Panametrics for a duplicate.
1. At the System Calibration Menu (see Table 2-3 on page 2-12),
press the PROBE menu key until the Auxiliary Input Calibration
screen appears . There is one s creen eac h for Auxiliary I nput 1 and
Auxiliary Input 2. Make sure you have the correct screen before
verifying or entering da ta (see Figure 2-10 below).
Aux 1 Probe Calibration
ND: Label:[No Label]
# mA (VDC)
01 08
02 09
03 10
04 11
05 12
06 13
07 14
15
System Calibration Menu
HELP CHANNEL PROBE DONE
Figure 2-10: System Calibration Menu for Auxiliary Inputs
[ Aux # ] ## mA [ Aux #]
Ch
1
Basic Programming 2-19
Page 38

April 2004
Entering Auxiliary Input
Calibration Data (cont.)
2. Use the CHANNEL menu key to cycle to t he desi red cha nnel. The
channel number is indicated in the top right-hand corner of the
screen. The screen will only disp lay installed channels.
3. Move the pointer to
4. Enter the number of data points and press [YES]. The Series 1
requires two to 16 calibration data points. If the sensor is linear
you only need to enter two data points.
5. The pointer will move to LABEL. Press [YES] to enter the Label
Entry menu and enter or change the Label (as described in
“Making Tags” on page 2-38).
6. Move the pointer to the Units (or [Aux]) col umn heading. Press
[YES] to edit the Units label used when displa ying the Auxiliary
Input (as described in “Making Tags” on page 2-38).
7. Move the pointer to the first data point in the
column and press [YES]. The unit s for thi s column will dep end on
the units you selected in Activating and Changing Probes on
page 2-9.
8. Enter the voltage or current value and press [YES].
9. Move the pointer to the
ND and press [YES].
mA (or VDC)
Units column and press [YES].
10. Enter the corresponding scale value and press [YES].
11. Use steps similar to 4 through 10 to enter the remaining data
point values.
Repeat steps 1 through 9 to enter auxiliary input calibration data for
the remaining channels .
To enter calibration data for moisture, temperature, and pressure,
refer to the preceding sec tions. To exit, press the DONE menu key
until
Main Menu appears on the message line. Then refer to Entering
High and Low Reference Values on page 2-21.
2-20 Basic Programming
Page 39

April 2004
Entering High and Low Reference Values
The last step in setup is entering high and low reference values. The
Series 1 requires reference values for its measurement circuitry for
moisture, oxyge n, and pressure inputs. The references are factory
calibratio n valu es that are s peci fi c to eac h cha n nel ca rd . Ref ere nc e
values are located on a label placed on the side or front of the unit.
Note: If you receiv e a channel card replacement or change the
instrument program, you need to re-enter the reference data
for that channel.
Table 2-4 shows the key sequences for e ntering the Reference M enu.
(Figure 3-19 on page 3-32 for a menu map.)
Table 2-4: Moving to the Reference Menu
Press th e M ai n M en u key: To enter the:
SETTINGS* Settings Menu
SERVICE System Service Menu
REFS Reference Menu
*The Settings Menu will prompt for a passcod e (see pag e 2-6).
Use the appropriate section that follows to verify or enter re ference
values for the probes.
Once you verify and/or enter reference data for each input, refer to
Displaying Measurements on page 2-28.
IMPORTAN T: You should record this data on the Program
Information List supplied in Appendix A of the
Startup Guide , or on a separate sheet of paper, and
keep it in a safe place.
Basic Programming 2-21
Page 40

April 2004
Entering Mo isture
Reference Values
Use the steps below to change the reference values for moisture
inputs. (Figure 3-19 on page 3-32 for a menu map.)
Caution!
If you modified the supplied cables or are not using GE
Panametrics-supplied cables for moisture probes, you
may be re quired to adj us t th e m ois t ure refere nc e data
as described in Performing an MH C alibration/
Adjustment Test on page 1-20 o f the Service Manual.
IMPORTAN T: You should record reference data on the Program
Information List supplied in Appendix A of the
Startup Guide , or on a separate sheet of paper, and
keep it in a safe place.
1. At the Reference Menu (see Table 2-4 on page 2-21), press the
PROBE menu key until the Moisture Reference Table appears
(see Figure 2-11 below) .
MOISTURE REFERENCE TABLE
Ch HIGH LOW
1
1
2
3
4
5
6
AutoCal Interval: (HH.MM) 01:00
Reference Menu
HELP INTERVAL PROBE DONE
Figure 2-1 1 : Reference Menu for Moisture
2. Compare the data on the screen to the refer ence data printe d on the
label placed on the side or front of the unit, or supplied with a
replacement channel card. If the data is incorrect, use the
procedure below to correct it. If the data is correct, do one of the
following:
• continue to enter reference values for oxygen cell and pressure
inputs as described in the following sections.
• press the DONE menu key until Main Menu appears on the
message line; then refer to Displaying Measurements on
page 2-28. When you exit, the Series 1 automatica lly calibrates
each channel.
2-22 Basic Programming
Page 41

April 2004
Entering Mo isture
Reference Values (cont.)
3. Move the pointer to HIGH for the desired channel, and press
[YES].
4. Enter the high reference value for tha t channel and press [YES].
5. The pointer automatically moves to
Press [YES ].
6. Enter the low reference value for that channel, and press [YES].
7. Repeat steps 3 through 6 to enter the high and low reference
values for the remaining channels.
Note: You may also enter the Auto-Cal Interval while in the
Reference Menu. Simply press the INTERVAL menu key and
enter the desir ed interval. See page 3-7 for more information.
T o enter reference values for oxygen cell and pressu re inputs, refer to
the following sections. To exit, press the DONE menu key until Main
Menu appears on the message line. Then refer to Displaying
Measurements on page 2-28. When you exit, the Series 1
automatically calibrates each channel.
LOW for the same channel.
Basic Programming 2-23
Page 42

April 2004
Entering Delta F Oxygen
Cell Reference Values
IMPORTAN T: The instructions in this section apply to entering
refe rence data for the Delta F oxygen cell only.
Use the steps below to change the reference values for oxygen cell
inputs. (Figure 3-19 on page 3-32 for a menu map.)
Caution!
Do not ad just oxygen c ell referen c e data unless
instructed to do so by the factory.
IMPORTAN T: You should record this data on the Program
Information List supplied in Appendix A of the
Startup Guide , or on a separate sheet of paper, and
keep it in a safe place.
1. At the Reference Menu (see Table 2-4 on page 2-21), press the
PROBE menu key until the Oxygen Cell Refe rence Table appears
(see Figure 2-12 below).
OXYGEN CELL REFERENCE TABLE
HIGH LOW
Ch Zero Span Zero Span
1
2
3
4
5
6
AutoCal Interval: (HH.MM): 01:00
Reference Menu 11:15 6/2/00
HELP INTERVAL PROBE DONE
Figure 2-12: Referenc e Menu for the Delta F Cell
2. Compare the data on the screen to the refer ence da ta printe d on the
label placed on the side or front of the unit. If the data is incor rect,
use the following procedure to correct it. If the data is correct, do
one of the following:
• continue to enter reference values for moisture and pressure
inputs as described in Entering Moisture Reference Value s on
page 2-22, and Entering Pressure Reference Values on
page 2-26.
• press the DONE menu key until Main Menu appears on the
message line; then refer to Displaying Measurements on
page 2-28. When you exit, the Ser i e s 1 automatically calibrates
each channel.
2-24 Basic Programming
Page 43

April 2004
Entering Delta F Oxygen
Cell Reference Values
(cont.)
3. Move the pointer to the Zero line for the high reference for the
desired channel and press [YES] .
4. Enter the zero value for the high reference for that channel and
press [YES]. The p oint er aut o ma tica l ly pr oceeds to the
for the high refere nc e fo r the same channel. Pre ss [Y ES] again.
5. Enter the span value for the high reference for that channel and
press [YES].
6. Move the pointer to the
desired channel and press [YES] .
7. Enter the zero value fo r the low reference for that chan n el an d
press [YES].
8. Move the pointer to the Span line for the low reference fo r the
desired channel and press [YES] .
9. Enter the span value fo r the lo w refere n ce for that channel and
press [YES].
Repeat steps 3 through 9 to enter the high and low reference values
for the remaining channels.
Zero line for the low reference for the
Span line
To enter refere nce va lue s for moi st ur e and pressu re input s , ref er to
Entering Moisture Reference Values on page 2-22 and Entering
Pressure Reference Values on page 2-26. To exi t, press the DONE
menu key until
to Displaying Measurements on page 2-28. When you exit, the
Series 1 automatically calibrates each channel.
Main Menu appears on the message line. Then refer
Basic Programming 2-25
Page 44

June 2003
Entering Pressure
Reference Values
Use the steps below to change the reference values for pressure
inputs. (Figure 3-19 on page 3-32 for a menu map.)
Caution!
Do not adjust pressure reference data unless instructed
to do so by the facto ry.
IMPORTAN T: You should record this data on the Program
Information List supplied in Appendix A of the
Start up Guide, or on a separate shee t of paper, and
keep it in a safe place.
1. At the Reference Menu (see Table 2-4 on page 2-21), press the
PROBE menu key until the Pressure Reference Table appears (see
Figure 2-13 below).
PRESSURE REFERENCE TABLE
Ch HIGH LOW
1
2
3
4
5
6
AutoCal Interval: (HH.MM): 01:00
Reference Menu 11:15 6/2/00
HELP INTERVAL PROBE DONE
Figure 2-13: Referenc e Menu for Pressure
2. Compare the data on the Series 1 screen to the reference data for
the pressure input. If the data is incorrect, use the following
procedure to correct it. I f the dat a is correct, do one of the
following:
• continue to enter reference values for moisture and oxygen
inputs as described in Entering Moisture Reference Value s on
page 2-22 and Entering the Delta F Oxygen Cell Referenc e
Values on page 2-24.
• press the DONE menu key until Main Menu appears on the
message line; then see Displaying Measurements on page 2-28.
When you exi t, the Ser ie s 1 automatically ca librat e s eac h
channel.
2-26 Basic Programming
Page 45

April 2004
Entering Pressure
Reference Values (cont.)
3. Move the pointer to HIGH for the desired channel and press
[YES].
4. Enter the high reference value for tha t channel and press [YES].
5. The pointer automatically moves to
Press [YES ].
6. Enter the low reference value for that channel and press [YES].
7. Repeat steps 3 through 6 to enter the high and low reference
values for the remaining channels.
T o enter reference values for moisture and oxygen inputs, refer to
Entering Moisture Reference Values on page 2-22, and Entering the
Delta F Oxygen Cell Refer ence Values on page 2-25. To exit, press
the DONE menu key until Main Menu appears on the message line.
Then refer to Displaying Measurements on page 2-28. When you exit,
the Series 1 automatically calibrates each channel.
LOW for the same channel.
Basic Programming 2-27
Page 46

June 2003
Displaying Measurements
The Series 1 can display measurements in a matrix format or a line
graph. The first time you power it up, the screen will display
measurements in the matrix format. The matrix format has six pages
and each page consists of six boxes as shown in Figure 2-14. You can
program each box to display any measurement for any channel.
1 Dew Point
-18.0 °C
2 Temperature
+35.9 °C
3 H
O
2
+0.535 ppm
v
4 Oxygen
48.3 ppb
v
5 Pressure
27.10 PSIG
X Unassigned
Main Menu 11:35 01/22/2000
HELP SELECT SETTINGS OPTIONS
pg: 1
Figure 2-14: Matrix Format Screen
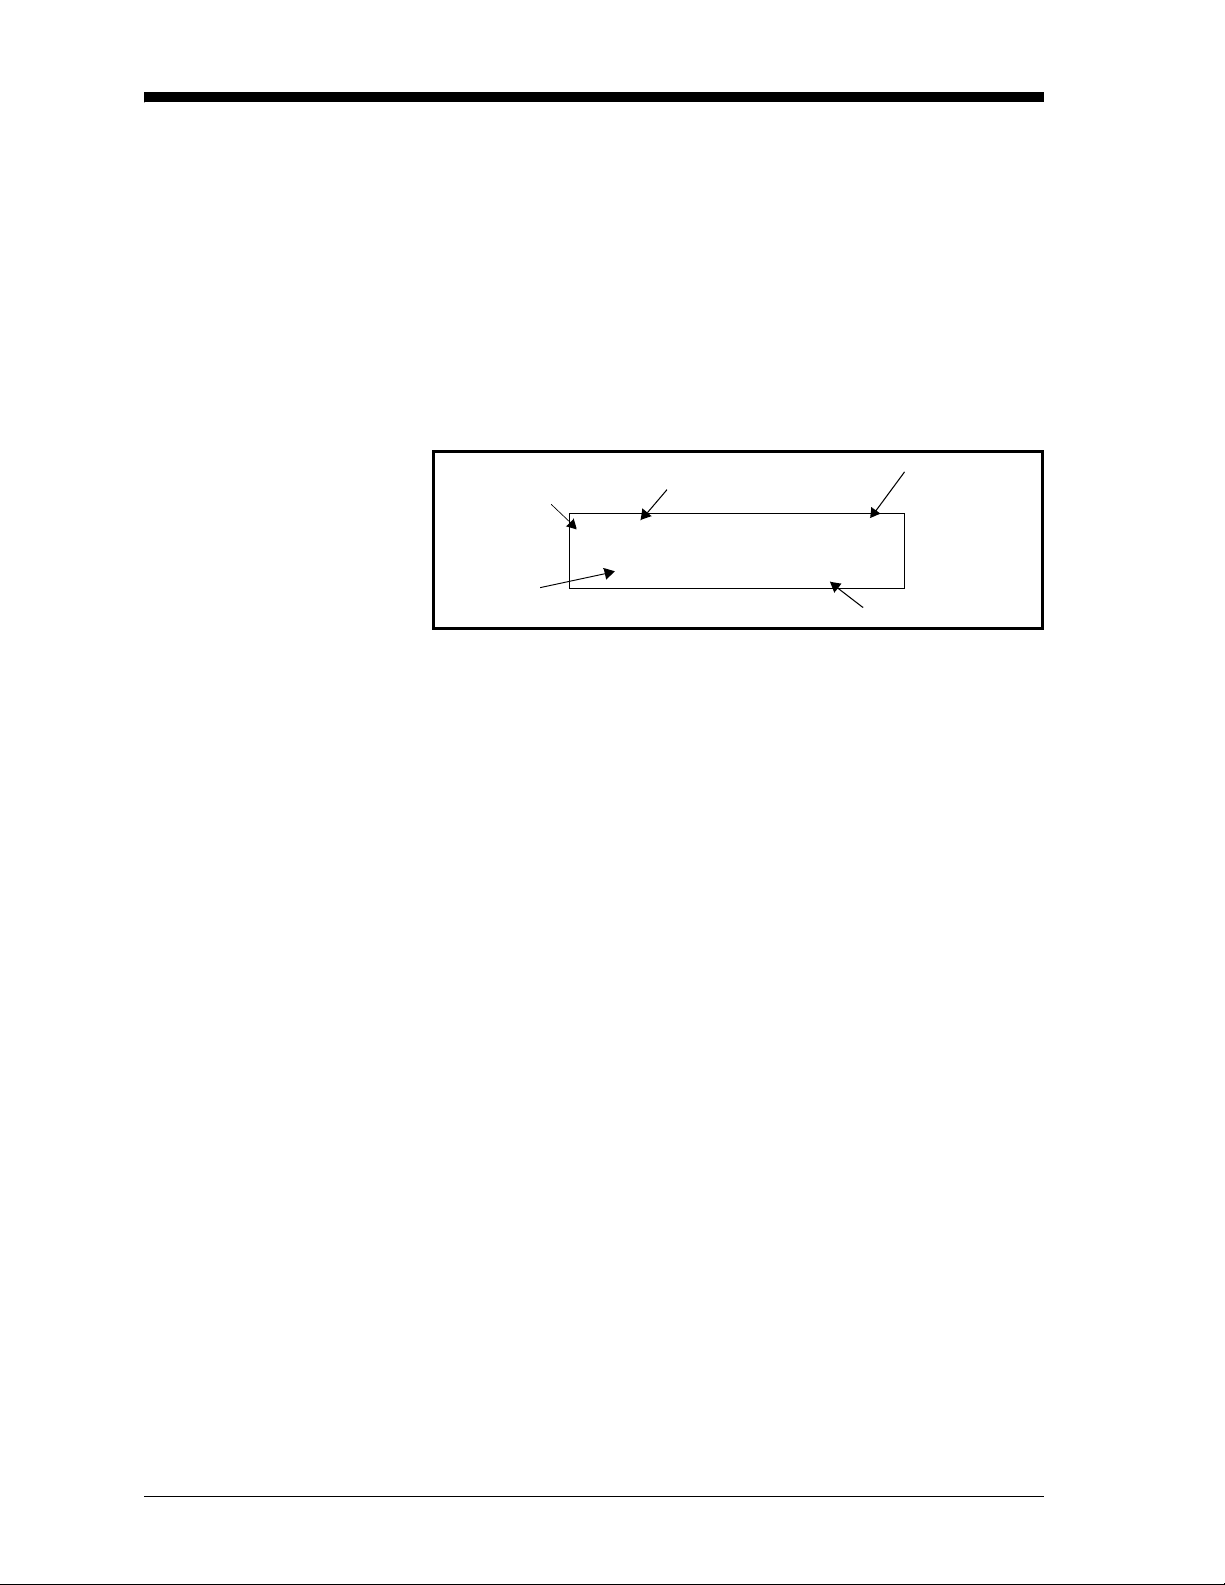
Each box in the matrix format is eithe r assigned or unassigned. An
assigned box displays a channel number , meas urement mode, units,
and a value. An unassigned box displays no data. See Figure 2-15 on
page 2-29 for examples of each type of box.
2-28 Basic Programming
Page 47

Displaying
Measurements (cont.)
June 2003
Measurement
Channel
Number
Mode
Units
5 Pressure
27.10 PSIG
Indicators
X Unassigned
Value
Unassigned Box
Figure 2-15: Assigned and Unassigned Boxes
The channel number is from 1 to 6, depending on how many channel
cards are installe d in the unit . Additional channel cards can be
purchased s eparately and inst alle d later (see Installing a Channel
Card on page 2-19 of the Service Manual).
The measurement mode is the parameter currently being measured.
There are a variety of units for each measure ment mode. Table 2-6 on
page 2-31 shows a list of the mea surement mo des and a d escript ion of
the units for each. The table also shows the measurement modes and
units as they are displayed on the screen. An example of a
measurement is shown in Figure 2-16 on the next page.
When select ing a measuremen t mo de , ple ase rem ember that some
measurement modes require mult iple inputs. For example, to display
ppm
, you need moisture and pressure inputs. Table 2-5 below shows
v
a list of measurement modes that require multiple inputs and what
you need to program them.
Table 2-5: Measurement Modes and Required Inputs
To measure: You need the following inputs:
RH Temperature and moisture
PPM
v
PPM
w
MCF/IG Moisture and pressure
MCF/NG Moisture and pressure
PPM
/NG Moisture and pressure
v
Moisture, temperature and saturation
Moisture and pressure
constant data
Basic Programming 2-29
Page 48
June 2003
Displaying
Measurements (cont.)
The shaded area in Figure 2-15 represents the indicator area. When
you program the Series 1 with constan ts or use Enhanced Respons e, a
symbol appears in this area. A “K” indicates a constant is being used
in the measurement and an “E” indicates the meter is using Enhanced
Response to determine the measurement. An example of a
measurement using a constant and Enhanced Response activated is
shown in Figure 2-16 below.
The value is e xpresse d i n the u nits select ed for a de sired mea surement
mode.
Channel
Number
Value
Figure 2-16: Examp l e o f a Displayed Measurement
Measurement
Mode
5 H
O
2
123.45 PPMw
E K
Indicators
Units
2-30 Basic Programming
Page 49

Table 2-6: Measurement Modes and Units for the Series 1
April 2004
Selected
Meas. Mode Description of Units
O
%= Percent Oxygen default Oxygen %
2
/ppM = Parts Per Million Oxygen ppm
O
2
Oxygen
O2/ppB = Parts Per Billion Oxygen ppb
Displayed
Meas. Mode
Displayed
Units
v
v
O2/µA = Microamps (Diagnostic Mode) Oxygen µA
/DVM = Digital Voltmeter (Diagn ostic Mode) Oxygen DVM VDC
O
2
DP/°C = Dew/Frost Point default Dew Point °C
DP/°F = Dew/Frost Point °F Dew Point °F
DP/K = Dew/Frost Point K (Kelvin) Dew Point K
%R.H. = Relative Humidity Rel. Humidity %
Oppm
2
O/MMSCF NG lbs
2
O (Nat. Gas) ppm
2
v
w
v
v
Hygrometry
H/ppMv = Parts pe r Million of Water by Volume H
H/ppMw = Parts per Million of Water by Weight (for liquids only) H2Oppm
H/ppBv = Parts per Billion of Water by Volume H2Oppb
MCF/I G = Pound s of Water pe r Mil lio n Std. Cu bi c Fe et in Id ea l Ga s H2O/MMSCF NG lbs
MCF/NG = Pounds of Water per Million Std. Cubic Feet in Natural Gas H
ppMv/NG = Part s Per Million by Volume in Natural Gas H
mmHg = Vapor Pressure Vapor Pressure mmHg
Pas = Vapor Pressure Vapor Pressure Pas
MH = MH* (Dia gnosti c Mo de ) H
OMH
2
H/DVM = Di gi tal Voltm et er (D ia gn os t i c Mo de ) Mois tur e DV M VDC
FH = FH* (Diagnostic Mode) MIS Probe FH
T/°C = Degrees Celsius default Temperature °C
Temperature
T/°F = Degrees Fahrenheit T emperature °F
T/K = Kelvin Temperature K
T/DVM = Di gital Voltmeter (Diagnostic Mode) Temp DVM VDC
PSIg = Pounds per Square Inch Gauge default Pressure PSIg
Bars = Bars Pressure Bars
mbs = Millibars Pressure mbs
mm/Hg = Millimeters of Mercury Pressure mmHg
Pressure
Pa(g) = Pascal, gauge Pressure Pas
kPas(g ) = KiloPa s ca l, ga ug e P re s su r e k P a s
P/mV = Pressure in millivolts Pressure mV
P/DVM = Digital Voltmeter (Diagnostic Mode) Pressure DVM VDC
FP = FP** (Diagnostic Mode) MIS Probe FP
Aux1/V = Vo lts default Aux1 VDC
Auxiliary 1
Aux1/I = Mi lli am ps Aux1 mA
Aux1/U ser = Function (Di s plays Aux Label) Aux1 (Aux Label) none
Aux2/V = Volts default AuxX VDC
Auxiliary 2
Aux2/I = Mi lli am ps Aux2 mA
Aux2/U ser = Function (Di s plays Aux Label) Aux2 (Aux Label) none
Volt Reference Vref = Volts default (Diagnostic Mode)
Signal Ground
Vgnd = Volts default (Diagnostic Mode) Signal Ground VDC
Voltage Referenc e
VDC
User
*The MH and FH values are the moisture sensors’ response values and are the values that are recorded during calibration.
**The FP value is the MIS Probe’s response val ue for pressure and is the value recorded during calibratio n.
Basic Programming 2-31
Page 50

April 2004
Setting Up the Matrix Format
Switching from a Line
Graph to the Matrix
Format
The matrix format consists of six pages that you can set up to display
any combination of channels , meas urement modes and measurement
units. For example, if you have a six channel unit, you can use each
page to display various measure ments pertaining to one channel or
you can use e ach page to display one measurement, such as dew
point, for all six channels.
This section describes how to:
• switch from a line graph to the matrix format
• set up boxes to display the desired val ues
• set the Series 1 to manually or automatically scroll through each
page
At the Main Menu, press the keys as shown in Table 2-7 below .
(Figure 3-18 on page 3-31 for a menu map.) The screen appears
similar to Figure 2-17 below. Press the DONE menu key until Main
Menu appears on the message line.
Table 2-7: Moving from Matrix Screen Menu to Main Menu
Press the fo llo wing menu keys: To enter the:
OPTIONS Option Menu
SCREEN Graph/Matrix Screen Menu
MATRIX* Matrix Screen Menu
*This menu key only appears if you are displaying a line graph.
1 Dew Point
-18.0 °C
2 Temperature
+35.9 °C
3 H
Matrix Screen Menu 11:35 01/22/2000
GRAPHS CYCLE CON TRAST DONE
2-32 Basic Programming
O
2
+0.535 ppm
Figure 2-17: Matrix Screen Menu
v
4 Oxygen
48.3 ppb
5 Pressure
27.10 PSIG
X Unassigned
v
pg: 1
Page 51

April 2004
Setting Up a Box Once you switch to the matrix format, you can assign the desired
channel, measure ment modes and units to any of the boxes. Figure 318 on page 3-31 for a menu map.
1. At the Main Menu, press the SELECT menu key. You are now in
the Select Menu.
2. Press the PAGE menu key. At the Displa y Page # prompt, enter
the page number and press [YES].
3. Press the MODE menu key. A list of measurement modes appears
on the message line (see Table 2-6 on page 2-31).
4. Press the PLACE menu key to m ove the larger pointer to the box
you want to change.
5. Move the brackets to the desir ed measurement mode and pres s the
UNITS menu key. A list of measurement units appea rs on the
message line.
Note: To clear (unassign) a box, pr ess [NO]. The Series 1 labels the
box X Unassigned (see Figure 2-1 7).
6. Move the brackets to the desired measurement units and press
[YES].
7. Enter the desired channel number.
Note: A “Channel Not Installed” message appe ars if you select a
channel wher e no channel card is installed. Select a different
channel. The meter will emit a buzzing sound.
Repeat the a bove steps for each desired box. To exi t , press the DONE
menu key until Main Menu appears on the message line.
Basic Programming 2-33
Page 52

June 2003
Manually or
Automatically Scrolling
Through Pages
You can set the S eries 1 to automatically scroll thr ough each page or
enable you to scroll through each page manuall y. Use the appropriate
section below to set up the scrolling procedure.
Figure 3-18 on page 3-31 for a menu map.
1. At the Main Menu, press the SELECT menu key. You are now in
the Select Menu.
2. Press the PAGE menu key. At the Display Page # prompt, enter
the page number and press [YES].
3. At the Main M enu, press the OPTIONS menu key.
4. Press the SCREEN menu key.
5. Press the CYCLE menu key.
6. Enter an interval between 0 and 5 minutes and press [YES].
Note: Enter 0:00 to turn the automatic scroll off.
7. Press the DONE menu key until Main Menu appears on the
message line.
After you e nter the i nterval , the Series 1 be gins sc roll ing t hrough each
page. It will automatically skip over pages that consist of all
unassigned boxes.
Note: When you press the SELECT menu key, the meter suspends
the automatic page scrolling so you can make changes to the
scre en. It will automatically begin scrolling when you return
to the Main Menu.
2-34 Basic Programming
Page 53

April 2004
Setting Up the Line Graph
Switching from the
Matrix Format to a Line
Graph
A line graph displa ys data for each channel using a point-to-point
graph. A line graph is useful for indicating trends or changes in
measurements. You can only choose one measurement mode, which
you can change at any time, for all channels. Only channels
programmed for the selected meas urement mode appear.
This section describes how to:
• switch from the ma trix form at to a line graph
• select the measurement units and mode
• select the X and Y axis scale
At the Main Menu, press the keys as shown in Table 2-8 below .
Figure 3-18 on page 3-31 for a menu map. The screen appear s similar
to Figure 2-18 below. Proceed to the appropriate section that follows
to change the mode, units or scale. If you do not want to change any
of the li ne graph setti ngs, press t he DONE menu ke y unt il Main Menu
appears on the message line.
Table 2-8: Moving from Graph Screen Menu to Main Menu
Press the fo llo wing menu keys: To enter the:
OPTIONS Option Menu
SCREEN Matrix Screen Menu
GRAPHS* Graph Screen Menu
*This menu key will not a ppear if your screen is a lre ady set up fo r the
graph format. If you switched your screen to display a line graph
earlier and are now returni ng to adjust the graph, press the MATRIX
menu key in its place. The screen will switch to the matrix format.
Press the DONE menu key once to exit the Matrix Screen Menu.
Then press the SCREEN menu key, and the GRAPHS menu key
should appear.
Dew Point, °C
+070.0
+050.0
+030.0
+010.0
-010.0
-030.0
00
02
04
06
08
10 m
Graph Screen Menu 11:35 01/22/2000
MATR IX SCALE CONTRA ST DONE
Figure 2-18: Graph Screen Me nu for a Line Graph
Basic Programming 2-35
Page 54

April 2004
Setting Up the X and Y
Axis for a Line Graph
Figure 3-18 on page 3-31 for a menu map.
1. At the Graph Screen Menu (see Table 2-7), press the SCALE
menu key, and then the SCALE X and Y axis menu key.
2. The Series 1 prompts f or the min imum Y axis. En ter th e minimum
value to be displayed, and press [YES].
3. The meter then prompts for the maximum Y axis. Enter the
maximum value to be displayed, and press [YES].
4. Press the X AXIS (horizontal axis) menu key.
5. Enter the time in mi nu tes , and pre ss [YE S] . The Seri es 1 acc ep ts
any value from 1 to 2160 minutes (36 hour s).
6. Press the DONE menu key until M ain Menu appears on the
message line.
2-36 Basic Programming
Page 55

April 2004
Selecting Measurement
Mode and Units for a
Line Graph
The line graph displays one measur ement mode for all channels
simultaneously. The meter def aults to dew point as the measurement
mode the first time you select the line graph; however, if you change
modes, the instrument will default to the last measurement mode
selected. Figure 3-18 on page 3-31 for a menu map.
1. At the Main Menu, press the SELECT menu key. You are now in
the Select Menu.
2. Press the MODE menu key. A list of measurement modes appears
on the message line (see Table 2-6 on page 2-31).
3. Select the desired measur ement mode, and press [YES].
4. Press the UNITS menu key. A list of units for the selected
measurement mode appears on the message line.
5. Select the desired unit s, a nd press [YES].
6. Press the DONE menu key until Main Menu appears on the
message line.
Note: You can rescale graph data at any time (without losing data)
by entering new X-axis and Y-axis values.
Tagging the Inputs The Series 1 enables users to assign tags to customize the display of
the input parameters in the matrix or graph formats. The instrument
accepts a se parate 16 character label for each i nput. To tag inputs, use
T abl e 2-9 to enter the Syste m Calibra tion Menu. (Figur e 3-19 on p age
3-32 for a menu map.)
Table 2-9: Moving from Label Entry Menu to Main Menu
Press th e fo l l o wi n g menu keys To enter the:
SETTINGS* Settings Menu
SYSTEM System Settings Me nu
CONFIG Probe Configuration Menu
*The Settings Menu will prompt for a passcode (see page 2-6).
Basic Programming 2-37
Page 56

April 2004
Making Tags Figure 3-19 on page 3-32 for a menu map.
Note: You should have already verified or entered the calibration
data for the input befor e making tags. Making your own tag of
any character length overrides the default GE Panametrics
tag for that parameter (i.e., “Dew Point,” “Temperature,”
“Pressure,” etc.)
1. From the Probe Configuration Menu (Table 2-1 on page 2-9),
move the pointer to the channel and probe y ou want to select. The
arrow will only move to installed channels.
2. Press the TAG menu key. The Label Entry Menu appears as
shown in Figure 2-19 below. The screen displays a table of the
character set avail able, an Edit Box and four menu options.
! “ # $ % &
0 1 2 3 4 5 6 7 8 9 : ; < = > ?
@ A B C D E F G H I J K L M N O
P Q R S T U V W X Y Z [
‘ a b c d e f g h i j k l m n o
p q r s t u v w x y z { | }
∋
°
Label Entry:
HELP NEXT ROW P REV ROW DONE
Figure 2-19: Label E ntry Menu
3. A flashing select pointe r appears in the upper left corner of the
character set. Use the NEXT ROW and PREV ROW menu keys to
move the pointer to the desired row.
4. Then use the arrow keys to move the pointer to the desired
character and pres s [YES ]. Th e sele ct ed ch ara ct er w ill appe ar in
the Edit Box. The upper left co rner of the character set contains
the space character.
5. Repeat steps 3 and 4 until you have entered all the characters for
the label.
'( ) * + , - . /
¥ ] ^ _
→ µ
Note: Use the numeric keys to enter numbers, decimal points, or
minus signs. To erase a character, press the [NO] key. The
character to the left of the Edit Cursor will be erased.
2-38 Basic Programming
Page 57

April 2004
Making Tags (cont.) 6. When you comple te ent ering the label, pr ess t he DONE menu key.
The Probe Configuration Menu screen appears again, this time
with a tag symbol appearing beside the tagged probe. When you
return to the Main Menu, the matrix will display the tag name in
the assigned channel.
Note: Tags do not appear for alarm or recorder outputs.
Basic Programming 2-39
Page 58

April 2004
Adjusting the Contrast of the Screen
T o adjust the screen contrast, pre ss the keys in Table 2-10 below. The
screen appears simila r to Figure 2-20. Figure 3-18 on page 3-31 for a
menu map.
Press the INCR menu key to increase the contrast. Press the DECR
menu key to de crease the contrast. Hold INCR or DECR down for
large changes or pr ess repe at ed ly for sma ll ch ang es .
T o exit, press the DONE menu key until Main Menu appears on the
message line.
Table 2-10: Moving from Contrast Adjust to Main Menu
Press the fo llo wing menu keys: To enter the:
OPTIONS Option Menu
SCREEN Screen Menu
CONTRAST Contrast Adjust Menu
1 Dew Point
-18.0 °C
2 Temperature
+35.9 °C
4 Oxygen
48.3 ppb
5 Pressure
27.10 PSI G
v
3 H
2
+0.535 ppm
O
v
X Unassigned
Contrast Adjust Menu 11:35 01/22/2000
pg: 1
HELP DECR INCR DONE
Figure 2-20: Contrast Adjust Menu
Note: The screen in Figure 2-20 above will appear in either the
matrix format or a line graph, depending on the screen setup.
2-40 Basic Programming
Page 59

April 2004
Setting the Clock and Calendar
Press the keys in Table 2-11 to reset the clock and calendar; then
follow the steps below. The screen appea rs similar to Figure 2-21
below. Figure 3-18 on page 3-31 for a menu map.
Table 2-11: Moving from System Service to Main Menu
Press the fo llo wing menu keys: To enter the:
SETTINGS Settings Menu
SERVICE System Service Menu
*The Settings Menu will prompt for a passcod e (see pag e 2-6).
Use the following steps to set the cloc k and calenda r:
1. Press the CLOCK menu key. The hours are highlighted.
2. Enter the digits for the month, day, year, hours (0-23), minutes,
and seconds. If you do not want to change a part of the time or
date, press the pointer to skip over it until you complete entering
the year.
3. T o exit, press the DONE menu key until Main Menu appears on
the message line.
1 Dew Point
-18.0 °C
2 Temperature
+35.9 °C
3 H
O
2
+0.535 ppm
v
4 Oxygen
48.3 ppb
v
5 Pressure
27.10 PSI G
X Unassigned
System Service Menu 11:35 01/22/2000
pg:1
HELP REFS CLOCK DONE
Figure 2-21: Setting the Clock/Calendar
Basic Programming 2-41
Page 60

Page 61

Your passcode is 2719.
Please remove this page and put it in a safe place for future reference.
Page 62

Chapter 3
Page 63

Advanced Programming
Introduction . . . . . . . . . . . . . . . . . . . . . . . . . . . . . . . . . . . . . . . . . . .3-1
Setting Up the Recorders . . . . . . . . . . . . . . . . . . . . . . . . . . . . . . . .3-1
Setting Up the Alarms . . . . . . . . . . . . . . . . . . . . . . . . . . . . . . . . . . .3-4
Using Automatic Calibration. . . . . . . . . . . . . . . . . . . . . . . . . . . . . .3-7
Entering Constants and User Functions . . . . . . . . . . . . . . . . . . . .3-9
Using Computer Enhanced Response. . . . . . . . . . . . . . . . . . . . .3-15
Setting Up the Data Logger. . . . . . . . . . . . . . . . . . . . . . . . . . . . . .3-17
Setting Up the RS232 Communications Port. . . . . . . . . . . . . . . .3-22
Setting Error Processing. . . . . . . . . . . . . . . . . . . . . . . . . . . . . . . .3-28
Loading New Software. . . . . . . . . . . . . . . . . . . . . . . . . . . . . . . . . .3-30
Page 64

April 2004
Introduction Now that the Series 1 is running and the screen is set up, you may
want to use the other operational f eatur es that are listed below:
• Setting Up the Recorders
• Setting Up the Alarms
• Using Automatic C alibration
• Entering Constants and User F unctions
• Using Enhanced Response
• Using Data Logging
• Setting Up the RS232 Communications Port
• Setting Error Processing
Setting Up the Recorders
The Series 1 has two recorder outputs for each channel: Recorder A
and Recorder B. To select the measurement mode, units and range for
each recorder, press the menu keys as shown in Table 3-1 below. The
screen appears simila r to Figure 3-1 on page 3-2. Figure 3-19 on page
3-32 for a menu map.
IMPORTAN T: Switch Blocks must be set to the appropriate
positions for output ranges. See Connecting the
Recorder Outputs in Chapter 1 of the Service
Manual.
To test or trim recorders, refer to Testing the Recorder Ou tput s or
Trimming Recorders in Chapter 2 of the Service Manual.
Table 3-1: Entering t he Recorder Settings Menu
Press the fo llo wing menu keys: To enter the:
SETTINGS* Settings Menu
OUTPUTS Output Settings Menu
RECORDER Recorder Settings Menu
* The Settings Menu will prompt for a passcode (see page 2-6).
Advanced Programming 3-1
Page 65

April 2004
Setting Up the
Recorders (cont.)
Recorder Outputs
Recorder A Recorder B
Mode:
Range:
Zero:
Span:
Recorder Setting Menu
SET CHANNEL TE ST DONE
Figure 3-1: Recorder Settings Menu
IMPORTAN T: You should record this data on the Program
Information List supplied in Appendix A of the
Start up Guide, or on a separate shee t of paper, and
keep it in a safe place.
Selecting Measurement Mode and Units for Recorders
Figure 3-19 on page 3-32 for a menu map.
1. At the Recorder Settings Menu (see Table 3-1 on page 3-1), use
the CHANNEL menu key to cycle to the desired channel. The
channel number is indicated in the top right-hand corner of the
screen. The screen will only disp lay installed channels.
2. Press the SET menu key. A box highlights Recorder A, and the
menu keys change to [RANGE], [MODE] and [A
3. Press the [A
recorder.
4. Press the MODE menu key . A list of availa ble measurement
modes appears on the message line. Refer to Table 2- 6 on page 231 for a list of measurement modes.
5. Move the brackets to the desir ed measurement mode and pres s the
UNITS menu key. A list of the available units ap pear s on the
message line.
Note: An arrow sign at either en d of the message line indicates
more choices.
B] menu key to move the box to the desired
B].
6. Move the brackets to the desired units and press [YES].
3-2 Advanced Programming
Page 66

June 2003
Setting the Range for Recorders
Figure 3-19 on page 3-32 for a menu map.
1. At the Recorder Settings Menu (see Table 3-1 on page 3-1), press
the SET menu key . The menu keys chang e to [RANGE], [MODE]
and [A
B].
2. Press the RANGE menu key . A list of the available output range s
appears on the message line.
3. Move the brackets to the desired output r ange and press [YES].
4. With the arrow key, move the pointer to the Zero line for the
desired recorder. Press [YES] to erase the present value.
5. Enter a new value and press [YES].
6. Move the pointer to Span for the desir ed recorder and press [YES]
to erase the curre nt val ue.
7. Enter a new value and press [YES].
8. Repeat steps 1 through 6 to set up the other recorder.
Repeat all of the above steps to set up recorders for the desired
channels.
T o exit, press the DONE menu key until Main Menu appears in the
message line.
Advanced Programming 3-3
Page 67

April 2004
Setting Up the Alarms The Series 1 has two optional alarms for each channel. To select the
measurement mode, units and set point values for each alarm, press
the keys shown in Table 3-2. A screen appears similar to Figure 3-2
below. Figure 3-19 on page 3-32 for a menu map.
To test alarms, ref er to Testing the Alarm Relays in Chapter 2,
Troubleshooting and Mainte nance, of th e Service Manual.
Table 3-2: Moving to Alarm Settings Menu
Press th e M ai n M en u key: To enter the:
SETTINGS* Settings Menu
OUTPUTS Output Settings Menu
ALARMS Alarm Settings Menu
*The Settings Menu will prompt for a passcode (see page 2-6).
ALARM SETPOINT
Alarm A Alarm B
Mode: OFF OFF
Trip: Above Above
Setpoint:
Deadband:
Status:
Alarm Settings Menu
SET CHANNEL TEST DONE
Figure 3-2: Alarm Settings Menu
Note: The first time you enter this menu, all alarm relays are OFF.
When an alarm value is not entered, the alarm relay is OFF.
+0.0000 +0.0000
+0.0000 +0.0000
Reset
Reset
Ch
1
3-4 Advanced Programming
Page 68

April 2004
Setting Up the Alarms
(cont.)
Selecting the Measurement Mode, Units and High/Low Values for Alarms
IMPORTAN T: You should record this data on the Program
Information List supplied in Appendix A of the
Start up Guide, or on a separate sheet of paper, and
keep it in a safe place.
Figure 3-19 on page 3-32 for a menu map.
1. At the Ala rm Setti ngs Menu (se e Table 3-2 on page 3-4), press the
CHANNEL key to scroll to the channel for the alarm you want to
set, and then press SET.
2. Press the [A
3. Press the MODE menu key . A list of modes appears on the
message line ( see Table 2-6 on page 2-31).
4. Move the brackets to the desired mode and press the UNI TS menu
key. A list of units appears on the message line.
5. Move the brackets to the desired units and press [YES].
6. Press the TRIP menu key. The pointer will move to the Trip line.
Use the pointer to select [Above] or [Below] and thus determine
whether the alarm is a High or Low alarm. Then press [YES] and
then the [DONE] key.
B] menu key to select the desired alarm.
Entering the Setpoint and Deadband Values for Alarms
Figure 3-19 on page 3-32 for a menu map.
IMPORTAN T: Select the measurement mode and units before you
enter the se tpoints. The meter changes the for mat for
the allowable number of digits , de pending on the
measurement units entered.
1. At the Alarm Settings Menu (see Table 3-2 on page 3-4), press the
CHANNEL key to scroll to the channel for the alarm you want to
set, and then press SET.
2. Press the [A
Note: If you have enter ed the Measurement Mode and Units, you
may enter the setpoint at this ste p. Th e pointer moves
automatically from the Trip to the Setpoint line.
3. Move the pointe r t o Set point: a nd press [ YES] to era se the exi sting
value.
B] key to se lect the desired alarm.
Advanced Programming 3-5
Page 69

June 2003
Entering the Setpoint
and Deadband Values
for Alarms (cont.)
4. Enter a new setpoint value, and press [YES] to confirm the new
value.
Note: If the alarm set point value is blank or invalid, the old value
will be restored.
The deadband allows use rs to set a programmable range of (normally
small) values beyo nd the setpoint, so that the Series 1 will not tri gger
an alarm unless the mea sured value goes outside the deadband range.
On a High alarm, the alarm will trip if the measurement is gr eater
than or equal t o the setpoin t. It wi ll no t RESET unti l the m easurement
is less tha n the setpoint minus the deadband. However, on a Low
alarm, the alarm will trip if the measurement is less than or equal to
the setpoint. It will not RESET until the measurement is greater than
the setpoint plus the deadband.
5. Move the pointer to the deadband line, and press [YES] to erase
the existing value.
6. Enter a new deadband value, and press [YES] to confi rm the new
value.
T o exit, press the DONE menu key until Main Menu appears on the
message line.
3-6 Advanced Programming
Page 70

April 2004
Using Automa tic Calibration
The Series 1 automaticall y calibr ates the moisture, pressur e, and
oxygen measurement circuitry (Auto-Cal) at a user selected interval.
Auto-Cal co mpensates for any drift in the electronic s. GE
Panametrics rec ommends settin g the Auto- Cal interva l to eight hou rs.
Set a smaller interval to Auto-Cal more frequently if the meter is
exposed to extreme temperat ures or weather conditions.
Note: If you are using only Moisture Image Series Probes to
measure moisture, you do not have to Auto-Cal.
T o set the Auto-Cal interval , pr ess the keys shown in Table 3-3. The
screen appears simila r to Figur e 3-3 below. Refer to Figure 3-19 on
page 3-32 for a menu map.
Table 3-3: Entering the Reference Menu
Press th e M ai n M en u key: To enter the:
SETTINGS* Settings Menu
SERVICE System Service Menu
REFS Reference Menu
* The Settings Menu will prompt for a passcode (see page 2-6).
MOISTURE REFERENCE TABLE
Ch HIGH LOW
1
2
3
4
5
6
AutoCal Interval: 96 minutes.
Reference Menu
HELP INTERVAL PROBE DONE
Figure 3-3: Setting the Auto-Cal Interval
Advanced Programming 3-7
Page 71

June 2003
Using Automa tic
Calibration (cont.)
T o set the Auto-Cal interval , do the following. (Figure 3-19 on page
3-32 for a menu map.)
Note: The Referenc e Menu has three tables: one each for moisture,
oxygen, and pressure re fe rences. You can use any one of these
Tables to set the Auto-Cal interval.
1. At the Reference Menu (see Table 3-3 on page 3-7), press the
INTERVAL menu key.
2. Using the numer ic keys, enter an Auto-Cal interv al between 0 and
24 hours and press [YES].
3. Press the DONE menu key. The meter begins Auto-Cal. Wait for
the Auto-Cal to complete and conti nue pressing the DONE menu
key until Main Menu appears on the message line.
The next time Auto-Cal occurs will depe nd on the length of the time
interval that was set. See the exampl e below.
EXAMPLE:
The Series 1 establishes a fixed sched ule, beginning at midnight,
using the interval spec ified to determine the times of subsequent
Auto-Cals. For example, if you enter a 1 hr., 30 min. time interval,
Auto-Cal will occur 16 times per day (1 day = 1440 minutes ÷ 90
minutes = 16). The fixed schedul e will be as follows:
1. 1:30 a.m. 9. 1:30 p.m.
2. 3:00 a.m. 10. 3:00 p.m
3. 4:30 a.m. 11. 4:30 p.m.
4. 6:00 a.m. 12. 6:00 p.m.
5. 7:30 a.m. 13. 7:30 p.m.
6. 9:00 a.m. 14. 9:00 p.m.
7. 10:30 a.m. 15. 10:30 p.m.
8. 12:00 p.m. (noon) 16. 12:00 a.m. (midnight)
If you set the 1 hr., 30 min. Auto-Cal interval a t 6:10 p.m., the next
Auto-Cal will oc cur at 7:30 p.m. (excluding the Auto-Cal performe d
when first leaving the Reference Menu).
3-8 Advanced Programming
Page 72

April 2004
Entering Constants and User Functions
The Series 1 allows you to enter two types of constants, a user
constant and a saturation c onstant, as well as user-def ined functions
and tables to manipulate data.
Note: Refer to the section Background Gas Current Mul tipliers for
the Delta F Oxygen Cell in Chapter 2 of t he Service Manual to
enter a curre nt multiplier for oxygen.
A user constan t is a fixed value for moisture, temperature, or
pressure entered into the meter instead of using a “live” input. For
example, if the pr oces s runs at a stead y pre ssure, you can enter the
constant pressure into the memory rather than using a pressure
transmitter. For special applications, you can also multi ply the
moisture ppm value by a constant value (K × ppm
).
v
A reverse video “K”symbols appears in the top-right-hand corner of
the box (in matrix format) for channels that are using a user constant
value. A symbol does not appear in the graph format.
The other type of constant is a saturation co n st ant. The Series 1
requires a sa turation constant in order to calculate ppm
in non-
w
aqueous liquids. If you do not know the saturation constant of the
liquid, conta ct GE Panametrics.
T o extend programming capability, user functions allow operators to
program up to four desired mathemati cal equations on each channel.
Users can assign any recor der output or alarm relays to user funct ions
on any channel. In addition, the y can use any para meter on any
channel to calcu lat e a differe n t para me te r.
Enter user constants , sa turation constants, and user-defined functions
and tables through the User Constant Menu. Use Table 3-4 below to
enter this menu. Figure 3-18 on page 3-31 for a menu map.
Table 3-4: Entering the User Constant Menu
Press th e M ai n M en u key: To enter the:
OPTIONS Option Menu
USER User Con stant Menu
Use the appropriate section that follows to make entries.
Advanced Programming 3-9
Page 73

April 2004
Entering User Constants The User Constant Menu enables you to enter constants for moisture
(Kh), temperature (Kt), and pressure (Kp). In addition, you can
multiply the ppm
The default multiplie r is 1. 000.
Note: In orde r for the constant to work properly, you should make
sure y ou also configure that channel for a constant as
described on page 2-11.
Use the following steps to enter use r consta nts. (Figure 3-18 on page
3-31 for a menu map.)
IMPORTAN T: You should record this data on the Program
1. After entering the User Const ant Menu (refer to Table 3-4 on
page 3-9), press the PAGE menu key until the Us er C onstant Table
appears as shown in Figure 3-4 below.
value by a specified constant for special purposes.
v
Information List supplied in Appendix A of the
Startup Guide , or on a separate sheet of paper, and
keep it in a safe place.
2. Move the pointer to the desired channel and constant to enter and
press [YES] to era se the pres en t va lue.
3. Enter the constant value and pre ss [YES].
4. To enter user functions, user tables or saturation constants, press
[PAGE] to proceed to t he followi ng p ages. To exit thi s menu, press
the DONE menu key until Main Menu appears in the message
line.
USER CONSTANT TABLE
Kh Kt Kp K
Ch °C °C Psig X PPMv
1
2
3
4
5
6
User Constant Menu
HELP - - - PAGE DONE
Figure 3-4: User Constant Menu
3-10 Advanced Pr ogram ming
Page 74

April 2004
Specifying User Functions
User functions enable opera tors to program up to four desired
mathematical equations on each channel. They can also use any
parameter on any channel to calculate a different param et er. Use
T able 3-5 to enter this menu, and press the PAGE menu key until the
screen is similar to Figure 3-5 below.
Table 3-5: Entering the User Function Menu
Press th e M ai n M en u key: To enter the:
OPTIONS Option Menu
USER User Con stant Menu
PAGE User Function Menu
SPECIFY USER FUNCTION Ch
1
Function: User 1
Decimal Places: 1
Units Symbol: TEST
Label: TT
Equation:
log (DP°/C-15.3)
Selecting Initial
Parameters
User Function Menu
HELP CHANNEL PAG E DONE
Figure 3-5: User Function Menu
1. Press the CHANNEL key to scroll to the desired channel, and the
PAGE key to scroll to the desired function (or blank page).
2. Move the pointer to the Function line. Press [YES] to remove the
function, type in a new entry, and press [YES] to confirm the
entry.
3. Move the pointer to the Decimal Places line. Press [YES] to erase
any current num ber, and enter the number of decimal places to the
right of the decimal point that you wish to appea r. Press [ YES] to
confirm the entry.
4. Move the pointer to the Unit s Symbol line. Press [YES] to remo ve
any entry, type in a new entry, and press [YES] to confir m the
entry.
5. Move the pointer to the Label line. P ress [YES] to remove the
function. Type in a new entry, and press [ YES] to confirm the
entry.
Advanced Programming 3-11
Page 75

April 2004
Entering the Equation 1. Move the pointer to the Equation box. Press [ YES] to enter the
function. The Math Entry Menu appears, a s shown in Figure 3-6.
EQUATION ENTRY User 1 - Ch
- + * / ^
) , ( abs exp
inv ln log sqrt Mode
TblA TblB TblC TblD TblE
Math Entry Menu
HELP NEXT ROW PREV ROW DONE
Figure 3-6: Math En tr y M enu
2. In the Math Entry Menu, use the NEXT ROW and PREV ROW
keys to scroll to the appropria te row. Then use the arrow key to
reach the desired symbol.
3. Once the key is on the symbol, press [YES] to enter the symbol
into the equation. Use the number keys to ente r numeric values.
(Press [NO] to remove any mistaken or unwanted symb ols or
numbers.)
4. To enter a particular m easured parameter into the equation, c lick
on the MODE symbol at the right of the third row. A list of
parameters will appea r. Scroll through the list until you reach the
desired parameter, and press [YES].
1
5. A list of units will then appear. Scroll through the list with the
arrow keys until you reach the desired units, and press [YES].
Note: If you wish to link a parameter fr om a particular channel, add
“(Ch#)” after you select the parame ter. For exampl e, “DP/
°C(2)” is the dewpoint in °C on channel 2.
6. Press the DONE key to confirm the equation. The meter will
return to the User Function Menu. However, if the user function
contains an e rror (for example, unbalanced parentheses or a
missing operator), the function will be labeled “INVALID.”
7. Press DONE to return t o the Option Menu, or re peat th e procedur e
to enter functions for other channels or pages.
3-12 Advanced Pr ogram ming
Page 76

April 2004
Entering User-Defined Tables
T o support user- defined functions, the Seri es 1 can hold up to five
tables (designate d as A through E) of non-linear or empirical data.
Users can enter up to 16 X-Y pairs in each table. The user functions
can supply an X value with Tbl(). The meter then inter polates the Y
value for a give n X, and substitute s i t for Tbl ( X) in t he functi on. (The
results are extrapo lated if the X value exceeds the bounds of the
table.)
To enter the User Function Table Menu, first enter the User Function
Menu, and press the PAGE menu key until a screen similar to
Figure 3-7 appears. Press the TABLE menu key to scroll through the
five tables.
USER TABLE Table
ND: Title:[No Title]
## X Y ## X Y
00 06
01 07
02 08
03 09
04 10
05 11
A
User Function Table Menu
HELP TABLE PAGE DONE
Figure 3-7: User Funct ion Table Menu
1. The pointer starts at the ND (number of data points) line. Press
[YES]. Enter the number of data points desired, and press [YES]
to confirm the entry.
2. The pointer moves to the T itle entry. Press [YES] and the Label
Entry Menu (shown in Chapter 2) appears.
Note: The title is for information purposes, and does not appear
anywhere else.
3. A flashing select pointe r appears in the upper left corner of the
character set. Use the NEXT ROW and PREV ROW keys to move
the pointer to the desired row. Then use the arrow keys to move
the pointer to the desired character. The upper left corner of the
character set contains the space character.
4. The pointer moves to the first row for X and Y data points. Press
[YES] and enter the data points desired.
5. Press [YES] to confirm each entry and proceed to the next point.
6. Repeat steps 4 and 5 until you have entered all the data points.
Then press the [DONE] menu key to return to the Option menu.
Advanced Programming 3-13
Page 77

April 2004
Entering Saturation Constants
T o enter a saturation constant, you must enter 1 to 6 data points to
represent a curve of Cs (satur ation constant) versus temperat ure. Use
the following steps to enter a curve for each channel. Figure 3-18 on
page 3-31 for a menu map.
IMPORTAN T: You should record this data on the Program
Information List supplied in Appendix A of the
Startup Guide , or on a separate sheet of paper, and
keep it in a safe place.
1. After entering the User Const ant Menu (refer to Table 3-4 on
page 3-9), press the PAGE menu key until a screen similar to
Figure 3-8 appears.
SATURATION CONSTANT TABLE Ch
1
# Temp°C Cs (ppmw)
1
2
3
4
5
6
Cs Constant Menu
HELP CHANNEL PAGE DONE
Figure 3-8: Cs Constant Menu
2. Use the CHANNEL menu key to cycle to the desired channel.
3. Use the arrow keys to go to the first data poin t for tempera ture and
press [YES].
4. Enter the temperature for the first data point and press [YES].
Then press the pointer to move to Cs.
5. Press [YES] to era se the cu rre n t valu e.
6. Enter the desired Cs value and press [YES].
7. Repeat steps 4 through 6 for all the data poin ts and for each
channel using a saturation c onsta nt.
T o e xit the Cs C onstant Menu, p ress the DONE m enu key unti l Main
Menu appears on the message line.
3-14 Advanced Pr ogram ming
Page 78

April 2004
Using Comp ut er Enhanced Respo nse
Enhanced Response uses a dynamic moistur e calibration technique
to extrapolate the moisture level to the end point when making
measurements in abrupt “dry down” conditions. The system response
time depends on the relative change in dew point and the number of
channels. For a change from ambient moisture levels to trace leve ls,
the unit can respond in three to five minutes for single-channel
operation.
The accuracy of enhanced response is ±2°C of the reading the sensor
would have read if it were allowed to reach equilibrium with the gas.
To ensure that computer enhanced software is as accurate as possible,
your application shoul d:
• have a reasonably constant f inal dew point and flow rate.
• have a minimum flow rate of one standard cubic foot per hour
(SCFH).
• operate at atmospheric pressur e (0 psig).
• have an actual moisture content a t or above a dew/frost point of
• MIS Probe: -85°C
• M Series or TF Series Probe: -110° C
T o activate and use enhan ced r esponse, see Figure 3-18 on page 3-31
for a menu map and complete the following steps.
1. Allow the sensor to reach equili brium at ambient moisture levels
before being e xposed to the dry gas. Exposing the sensor to dew
points of 5 to 10°C for 5 to 10 minutes will enable the sensor to
reach equilibri um.
2. Use Ta ble 3-6 below to activate the computer enhanced response.
Table 3-6: Activating the Enhanced Response Option
Press th e M ai n M en u key: To enter the:
OPTIONS Option Menu
USER User Con stant Menu
3. If necessary, press the PAGE menu key until the Enhanced
Response Menu appears (see Figure 3-9 on page 3-16).
Advanced Programming 3-15
Page 79

April 2004
Using Comp ut er
Enhanced Respo nse
(cont.)
ENHANCED RESPONSE TABLE
Ch Enhanced
1
2
3
4
5
6
Enhanced Response Menu
HELP ON/OFF PAG E DONE
Figure 3-9: Enhanced Response Menu
4. Use the arrow keys to scroll to the desire d channe l.
5. Press the ON/OFF menu ke y to tur n enha nced r esponse on ( yes) or
off (no).
6. Repeat steps 4 and 5 for each desired channel.
7. T o exit, press the DONE menu key until Main Menu appears on
the message line.
8. Expose the sensor to dry gas.
IMPORTAN T: You must enable enhanced response before you
expose the sensor to the dry gas. The meter must see
all of the dry down in order to make accurate
calculations.
When activating enhanced response for a channel, a reverse video
“E” symbol appears in the top-r ight-h and corner of the corresponding
box when displaying data in the matrix format. When the meter
determines the fina l value, the reverse video “E” changes to a regular
“E”. The “E” symbol does not appear in the graph format.
3-16 Advanced Pr ogram ming
Page 80

June 2003
Setting Up the Data Logger
The Series 1 has a data logging feature that enables you to internally
store and view data. Users can log up to 12 parameters on each of six
channels, and update the data at inte rvals as fast as 5 sec.
A 64-kbyte RAM holds logged data; users can also add an opti onal
PCMCIA card to store up to 1 Mbyte of data. The meter has a fixed
amount of memory; therefore, the number of parameters you select
and the more frequent t he time int erval, the shor ter t he log time. Once
you specify the log paramete rs, the meter displays a status screen that
lists the number of records, bytes free, bytes used, and the remaining
hours and minute s the log will run before the programmed End Time
(see Figure 3-10).
The meter assigns logged data a record and a header. The record
consists of the date, time, and corresponding logged values. The
header consists of the selected channels, the selected measurement
modes, and the time the log started. It is used to distinguish one log
from another.
The Series 1 can store logs in six slots. Thus, if you wish to create a
new log when all six slots are filled, you must remove one of the
existing logs.
DATA LOGGING STATUS
Storage: Extra
Bytes Used: 117012 Bytes Free: 137920
FILENAME STATUS TIME REMAINING
MON.LOG Finished 00000:00:00
TUES.LOG Running 00018:27:27
(New Log)
(New Log)
(New Log)
(New Log)
Data Logger Menu 15:16 06/15/99
HELP STORAGE FILE DONE
Figure 3-10: Data Logger Menu
Use the following sub-sect ion to view the data logger status, set up a
log, and view logged data.
Advanced Programming 3-17
Page 81

April 2004
Viewing t he D at a Logge r Status
Press the keys as shown in Table 3-7. The screen appears similar to
Figure 3-7 below. Figure 3-18 on page 3-31 for a menu map. Log
statuses include running, stopped, pending (wait ing to start) or
finished. The screen also displays whether internal or extra (PCMCIA
card) memory is in use, as well as the amount of memory availabl e.
Table 3-7: Entering the Data Logger Menu
Press th e M ai n M en u key: To enter the:
OPTIONS Option Menu
LOGGER Data Logger Menu
TUES.LOG VIEWING 06/15/00
TIME 1:User 1 1:DP/°C 1:FH
12:15:22 -4.8 +15.3 163.590
12:15:32 -4.7 +15.3 163.600
12:15:42 -4.8 +15.3 163.610
12:15:52 -4.6 +15.3 163.600
12:16:02 -4.7 +15.3 163.620
Data Logger Menu 15:16 06/15/99
HELP NEXT PREV DONE
Figure 3-11: The Data Logger Menu
Viewing Logged Data To view a specific file from the Data Logger Menu, mo ve the pointer
to that file, and then press [YES]. The screen appears similar to
Figure 3-1 1 above. Figure 3-18 on page 3-31 for a menu map.
Use the PREV and NEXT menu keys to view the next and previous
pages of logged data. To view other records, continue to press the
NEXT menu key until <end> appears at the end of the record. I f the
screen has more than three columns, use the pointer to scroll across
the columns.
T o exit, press the DONE menu key until Main Menu appears on the
message line.
Removing Logged Data To remove a log, select it with the arrow keys on the Data Logger
Menu. Press the [FILE] menu key, and then [REMOVE]. The screen
will ask “Are you sure?” Confirm the deletion by pressing [YES].
IMPORTAN T: Deleted logs cannot
be retrieved!
3-18 Advanced Pr ogram ming
Page 82

April 2004
Entering Data Logger Settings
Naming the Log and
Setting Up Start/End
Times or Cycles
Use the step s below to se lect the chan nels, measurement mod es and
units you want t o lo g, as well a s the log interval and whe ther th e log is
cyclic or has a definite start and end.
Note: If all six logs are filled, a log must be deleted to create room
for another.
Figure 3-18 on page 3-31 for a menu map.
1. At the Data Logger Menu (see Table 3-7 on page 3-18), select a
“New Log” file and press [YES] to enter the Label Entry Menu
shown in Figure 3-12 below.
( ) - 0 1 2 3 4 5 6 7 8 9 A B C
D E F G H I J K L M N O P Q R S
T U V W X Y Z [ ] _ { }
Label Entry:
HELP NEXT ROW PREV ROW DONE
Figure 3-12: Label E ntry Menu
2. Specify the log name. Use the NEXT ROW and PREV ROW
menu keys to sc roll t o th e desir ed line , and the n use the a rro w keys
to reach the desired letters, numbers or symbols. When you have
completed the label, press the DONE menu key. The Set D ata
Logger Menu now appears, as shown in Figure 3-13 below.
DATA LOGGING SETUP
Cyclic: N
Error Log: N
Start: 06/03/2000 15:28:56
End: 06/03/2000 18:00:00
Interval: 00:00 Status: Finished
Ch:Mode Ch:Mode Ch:Mode Ch:Mode
: :
: :
: :
Set Data Logger Menu 15:16 06/15/00
HELP START MODE DONE
:
:
:
Figure 3-13: Set Data Logger Menu
:
:
:
Advanced Programming 3-19
Page 83

April 2004
Naming the Log and
Setting Up Start/End
Times or Cycles (cont.)
3. Move the pointer to the CYCLIC row. You c an progr am a log as
cyclic (running con tinuously, with the newest data overwriti ng the
oldest afte r a c ertain number o f rec ords) or wi th a defin ite st art and
end. Press [YES] to program the log as cyc lic, or [NO] to sta rt and
end the log at spec ifie d times .
4. The pointer moves to the Error Log row. Press [YES] to have the
log record only errors, or [NO] to proceed to the Start/End times.
The program now varies, depending on your selection in step 3.
• If you pressed [NO], continue with step 5.
• If you pressed [YES], go to “Entering Settings for a Cyclic
Log” below.
5. To specify the start and end times, type in the dates using a
Month/Day/Year (MM:DD:YYYY) numeric f ormat (for exa mple,
12/29/1999) and the times in a 24-hour, minute and second
(HH:MM:SS) format (for example, 15:33:00). Press [YES] when
you have completed entering the data for each time.
6. The pointer then moves to the Interval row. Specify the log
interval in minutes and seco nds. (The interval can be as short as
5 sec.) Skip steps 7 through 9, and proceed to “Sele cting the
Channel, Measureme nt Mode and Units” on the next page.
Entering Settings for a
Cyclic Log
The screen now appears similar to Figure 3-14 bel ow.
DATA LOGGING SETUP
Cyclic: Y
Error Log: N
Start: 06/03/2003 15:28:56
Records: 0 Status: Stopped
Interval: 00.00
Time (ddd:hh:mm:ss) 000:00:00:00
Ch:Mode Ch:Mode Ch:Mode Ch:Mode
: :
: :
: :
Set Data Logger Menu 15:16 06/03/03
HELP START MODE DONE
Figure 3-14: Set Data Logger Menu for a Cyclic Log
7. T o specify the st art time, type in the dat e using a Month/Day/Year
(MM:DD:YYYY) numeric format (for example, 12/29/1999) and
the time in a 24-hour , minute and second (HH:MM:SS) format
(for example, 15:33:00). Press [YES] when you have completed
entering the data.
:
:
:
:
:
:
8. The pointer moves to the Records row. Specify the numbe r of
records you wish for the log.
3-20 Advanced Pr ogram ming
Page 84

June 2003
Entering Settings for a
Cyclic Log (cont.)
Selecting the Channel,
Measurement Mode and
Units
9. The pointer then moves to the Interval row. Specify the log
interval in minutes and sec onds. (The interval can be as short as 5
sec., or up to 99 min. and 59 sec.)
10.At the Time row, e nter the interval duration set — the amount of
time in days, hours, minutes and seconds to complete one
measurem ent cy cle. T hen proc eed to “Se l ecti n g the Ch an nel ,
Measurement Mode and Units” below.
Note: If a conflict exists bet ween the Time and the interval time, the
total Time overrules the selected interval time. To set the total
Ti me with only the record and interval settings, set the Time to
all zeroe s for days, hours, minutes and seconds
(000:00:00:00). If dividing the total Time by the number of
reco rds does not result in uniform intervals, the Series 1 uses
the large st interval that will fit within the total T ime , and
recalculates the total Time as the largest fitting interval times
the number of rec ords.
1. The entry for each log channel and mode appears as ___:____ if
blank. Use the arrow keys to move to the entry to change or enter
data. Press [NO] to erase a previous entry.
2. Press numeric keys 1 to 6 to select the desired channel.
3. Press the MODE menu key. A list of measurement modes appears
on the message line (see Table 2-6 on page 2-31).
Note: Notice the MODE menu key changes to UNIT. This menu key
switches back and forth depending on the parameters you are
selecting.
4. Move the brackets to the desired measurement mode.
5. Press the UNITS key. A list of units appears on the message line.
6. Select the desired units and press [YES].
Repeat steps 1 to 6 until you have selected the desired parameters.
Press the [START ] me n u key to acti v ate the log . Then p res s the
[DONE] menu key to return to the Data Logger Menu. If you wi sh to
check the parameters for a given log, press the [FILE] menu key in
the Data Logger Menu (Figure 3-10 on page 3-17) and then press the
[SETTINGS] menu key.
IMPORTAN T: You cannot change the log parameters once the log
has started!
Advanced Programming 3-21
Page 85

April 2004
Setting Up the RS232 Communications Port
Configuring the Serial Port
The Series 1 can transmit measurements to a serial printer or personal
computer using the RS232 communicati ons port. Before you can
transmit data, you must configure the serial port setti ngs as described
in this section. This section also includes a sample output and a brief
description of its conte nts.
To enter settings for the serial port, press the keys shown in
T able 3-8. (Figure 3-19 on page 3-32 for a menu map.) A screen
appears similar to Figure 3-15 below.
Table 3-8: Entering the Port Settings Me nu
Press th e M ai n M en u key: To enter the:
SETTINGS* Settings Menu
OUTPUTS Output Settings Menu
PORT Port Settings Menu
*The Settings Menu will prompt for a passcod e (see pag e 2-6).
CONFIGURE SERIAL PORT
Port Function: PanaLink
Baud Rate: 19200
Node ID: 16
Port Settings Menu
FUNCTION BAUD NODE ID DONE
Use the steps that follow to select the function, baud rate, report
format and interva l for the seria l port. Other serial p ort se ttings a re set
and cannot be changed. The fixed settings are as follows:
Figure 3-15: Port Settings Menu
• 8 bit word length
• no parity
• 1 stop bit
• flow control is not supported
3-22 Advanced Pr ogram ming
Page 86

April 2004
Selecting the Function,
Baud Rate and Node ID
or Matrix Interval
Figure 3-19 on page 3-32 for a menu map.
1. From the Port Settings Menu (see Table 3- 8 on page 3-22), press
the FUNCTION menu key to scroll through the available port
functions (for example, a printer or PanaLink softwar e), and stop
at the desired function.
Note: The third menu key alternates between NODE ID for the
PanaLink function and INTERVAL for the printer function.
2. Press the BAUD menu key .
3. Move the brackets to the desired baud rate and press [ YES].
We recommend that you do not set the baud rate below 2400. At
lower speeds, several seconds are required to transmit data.
Note: If you are using GE Panamet rics PanaLink softwar e, set the
baud rate to 19,200.
4. The next step will depend upon the function selected in Step 1.
a. If you selected PanaLink as the function, press the NODE ID
menu key. Unless you are instructed to change the ID number
by GE Panametrics, please leave the number at the default ID
of 16. Press [YES] to confirm the entry.
b. If you selected a printer as the funct io n , press the IN TE RVAL
menu key and enter, in minutes and seconds, the interval at
which you wish the meter to transmit matri x repor t data. Press
[YES] to confirm the entry.
5. Press the DONE menu key to return to the Output Settings Menu.
You have completed setting up the communications port . If you
selected the pr inter function, the met er will begin transmitting data at
the selected interva l. Refer to the following section for a description
of a sample output.
Advanced Programming 3-23
Page 87

June 2003
Description of a Sample Output
Figure 3-16 b elow shows what a record would l ook l ike f or the m atri x
format shown in Figure 3-8 on page 3-14. Each record consists of a
Message ID, da te, time, channel, mode/unit, data and a carriage
return.
Message ID
Date
Time
*D 01/22/00 11:50:07 1:DP/C=18.0 2:T/C=+35.9 3:H/ppMV=0.535
4:O/ppB = 48.3 5:PSIg/27. 10 <CR/LF>
Channel
Mode/Unit
Data
Carriage
Return
Figure 3-16: A Sample of One Record
Note: The length of the line depends on how many characters your
scre en or printer has per line, or the width of the page.
Message ID
Every record begins with the Message ID that consists of an asterisk
(*) and the report type. *D denotes a Display (Mat rix) report. The
Message ID is always followed by one ASCII space.
Date
The date of the report is shown in MM/DD/YY format. The Series 1
uses a zero as a column place holder, so the date will always be eight
characters long. The date is always followed by one ASCII space.
Time
The time of the report is shown in HH:MM:SS format. Time is in 24hour format. The Series 1 uses a zero as a column place holder, so the
time will always be eight characters long. The time is always
followed by one ASCII space.
Channel
The channel is a single digit from 1 to 6 and is the channel from
which the displayed measurement was read. The channel is always
followed by a colon (:).
Mode/Unit
The modes or units are represented by an abbreviation. Refer to
T able 3-9 on page 3-26 for abbreviations. The Mode/Unit is always
followed by an equals sign (=).
3-24 Advanced Pr ogram ming
Page 88

June 2003
Description of a Sample
Output (cont.)
Data
Data is the actual measurement. The number of digits and the position
of the decimal point, if any, will vary with the magnitude and type of
data (see Table 3-9 on page 3-26 for number formats for each mode/
units). Signed values will contain a leading plus (+) or minus (-) sign.
Unsigned values (percent oxygen, for example) have no sign. The
data is always followed by two ASCII spaces.
<CR/LF>
Every record is terminated with a carriage return/line feed pair
(ASCII 13 and 10 decimal, 0D and 0A hexadecimal).
Advanced Programming 3-25
Page 89

June 2003
Table 3-9: Print-Out Symbols and Abbrevia tions
Number
Mode/Unit
Format Measurement Mode
Oxygen
O% XXX.X Oxygen concentration in percent.
O/ppM XXXX.XX Oxygen concentration in parts per million.
O/ppB XXXXX Oxygen concentration in parts per billion.
O/A ±XXX.XXX Oxygen cell curr ent in microamperes.
O/DVM ±X.XXXX Oxygen circuit voltage in volts DC.
Moisture
DP/C ±XXX.X Dew point in degrees Celsius.
DP/F ±XXX.X Dew point in degree s Fahrenheit.
DP/K ±XXX.X Dew point in Kelvin.
%R.H. XXX.X Rela tive humidity in percent.
H/ppMv XXX.XXX Parts per million of water by volume.
H/ppBv XXXXX.X Parts per billion of wa ter by volume.
H/ppMw XXX.XXX Parts per million of water by weight.
MCF/IG X.XXXX Pounds of water per million standard cubic fee t of
an ideal gas.
MCF/NG X.XXXX Pounds of water per million standard cubic feet of
natural gas.
ppMv/NG XXX.XXX Parts per million of water by volume in
natural gas.
MH X.XXXX GE Panametrics moist ure calibration unit for M
and TF Series probes.
FH X.XXXX GE Panametrics moisture calibration unit for
Moisture Image Series probes.
H/DVM ±X.XXXX Moisture circuit voltage in volts DC.
Temperature
T/C ±XXX.X Temperature in degrees Celsius.
T/F ±XXX.X Temperature in degrees Fahrenheit.
T/K ±XXX.X Temperature in Kelvin.
T/DVM ± X.XXXX Temperature circuit voltage in volts DC.
Pressure
PSIg ±X.XXX Pressure in pounds per square inch gauge.
Bars X.XXXX Pressure in bars absolute.
mbs XXXX.X Pressure in millibars.
mm/Hg XXX.XXX Pressure in millimeters of mercury absolute.
Pas XXXXX Pressure in Pascals absolute.
3-26 Advanced Pr ogram ming
Page 90

June 2003
Table 3-9: Print-Out Symbols and Abbreviations (cont.)
Number
Mode/Unit
Format Measurement Mode
Pressure (Continued)
kPas XXX.XX Pressure in kiloPascals absolute.
P/mV ±XXX.XX Pressure transducer output in millivolts.
FP XXXX.XX GE Panametrics pressure calibration unit in
millivolts.
P/DVM X.XXXX Pressure circuit voltage in volts DC.
Auxiliary Inputs
Aux1/V ±X.XXXX Auxiliary input #1 in volts.
Aux1/I ±XX.XXX Auxiliary input #1 in milliamperes.
Aux1/F ±XX.XXXX Auxiliary input #1 in user-defined units.
Aux2/V ±X.XXXX Auxiliary input #2 in volts.
Aux2/I ±XX.XXX Auxiliary input #2 in milliamperes.
Aux/F ±XX.XXXX Auxiliary input #2 in user-defined units.
Other
Vref ±X. XXXX Channel card refer ence voltage.
Vgnd ±X.XXXX Channel card ground voltage.
Note: In the formats pr esented above, the plus/minus (±) sy mbol
indicates th at the d ata i s signed and will be preceded by a plus
(+) or minus (-) sign .
The number of decimal plac es indicate d is for nominal val ues.
The instrument will maintai n the number of digits by
“floating” the decimal point to the right as the magnitude of
the number incre ases. DO NOT “hard-code” the decimal
points when using data acquisition software.
Advanced Programming 3-27
Page 91

January 2004
Setting Error Processing
The Series 1 user program includes an Error Processing menu that
may be used to specify how the recorders/ analog outputs and the
alarms respond to Range, Signal and Calibration errors.
The meter categorizes ra ng e errors as Under Range if the input
signal goes below the probe calibration range or Over Range if the
input signal goes above the probe calibration range. However, signal
errors are always categorized as Over Range, while calibration
errors are always categorized as Under Range.
Note: See Chapter 2 in the Se rvice Manual for a detaile d descriptio n
of Range, Signal and Calibration Errors.
When an error condition occurs, the mete r displays an error message
on the screen and it drives the recorders/analog outputs and alarm
relays as indicated in Table 3-10 below.
Table 3-10: Error Ind ic ato r s
Screen Error
Error Type
Range Error
Signal Error “Mode” Fault!* Over Range Setting**
Calibration Error Cal Error Under Range Setting**
Message
Over Range Over Range Setting**
Under Range Under Range Setting**
Output & Alarm
Relay Response
* “Mode” indicates one of the available measurement modes
** currently programmed error processing setting (see next secti on)
Procedure for S etting Error Proce ssing
IMPORTAN T: The factory default setting for Error Messaging is
ON, but the factory default settin gs for both Under
Range and Over Range errors is
Ignore (this forces
the recorder/analog outputs to 0 mA or 0V).
The Series 1 user progra m allows you to turn Error Messaging either
ON or OFF. In addition, if Error Messaging is ON, you can program
separate Over Range and Under Range responses fo r all alarm relays
(if installed) an d recorde r/analog outputs. The error responses are
independently pr ogrammable for each channel.
Table 3-11 on the next page provides instructions for entering the
Error Processing Menu, and Figure 3-17 on the next page shows a
typical men u scre en . To suppress or activat e the Display Messages
function, move the pointer to the Display Messages line and use the
ACTION menu key to select ON (the default) or OFF.
If Display Messages is set to
ON, use the steps on t he next page to set
up error processing:
3-28 Advanced Pr ogram ming
Page 92

January 2004
1
Procedure for S etting
Error Processing (cont.)
Table 3-11: Entering the Error Processing Menu
Press th e M ai n M en u key: To enter the:
SETTINGS* Settings Menu
SYSTEM System Settings Me nu
CONFIG Probe Configuration Menu
ERRORS E rror Processing Menu
* The Settings Menu will prompt for a passcode (see page 2-6).
1. Press the keys shown in Table 3-11 above, and a screen similar to
that in Figure 3-17 below appears (see Figure 3-19 on page 3-32
for a complete menu map of the procedure).
ERROR PROCESSING CONFIGURATION Ch
Error: Under Range Over Range
Alarm A: Ignore TRIP
Alarm B: TRIP Ignore
Rcrd A: Ignore Ignore
Rcrd B: LOW HIGH
Display Messages: ON
Error Processing Menu
HELP CHANNEL ACTION DONE
Figure 3-17: Error Processing Menu
2. Use the
CHANNEL menu key to cycle to the desired channel.
3. Move the pointer to the desired range and output.
4. Press the
ACTION menu key repeatedly until the desired action
appears (the default setting fo r all ac ti ons is Ignore):
• Alarms: The available actions are Trip and Ignore. For the
Ignore option, the alarms remain in the state they were in at the
time a range error o ccurs.
• Recorders/Analog Outputs: The availabl e ac tio ns ar e: Ignore,
High, Low, Hold (last value), and Value (specified by user). For
the Ignore option, both the A and B analog output signals are
forced to 0 mA or 0 V when a range error occurs.
5. Repeat Steps 2-4 for both range s and for each output on the
desired channel(s) .
To exit Error Proc essing, pre ss the
DONE menu key until Main Menu
appears on the message line.
Advanced Programming 3-29
Page 93

April 2004
Loading New Software At some point, a new version of the MIS-1 operatin g softwa re may be
released or your existi ng software file may become corrupted. To
update your own system, use the following guidelines:
1. Record all of the setup, configuration, calibration and reference
information from the MIS-1, and tra nsfer required logs to a PC.
IMPORTAN T: All of the settings will be lost when the code is
updated. Any logs will also be erased.
2. Obtain the new software file (with a *.cod extension) and save the
file to your PC hard drive.
3. Set up the MIS-1 with an RS232 cable connected to a COM port
(most likely COM1) on a PC having a communications program
like Hyperterminal. (See Setting Up the RS232 Communications
Port in Chapter 3 of this manual, and Connecting a PC or Printer
in Chapter 1 of the Service Manual.)
4. Start the communications program on the PC and select the COM
port with the connection to the MIS- 1.
5. Set th e foll owing information:
Baud Rate = 19200
Data Bits = 8
Parity = none
Stop Bits = 1
Flow Control = none.
6. Turn on the power to the MIS-1.
7. Press and hold the 0 key.
Note: The display will indicate a message similar to
via RS232 (Y/N)?
Reload Flash
8. Press the YES key.
9. Choose the Transfer file menu and select Send File.
10. Select the XMODEM transfer protocol.
11. Select the file to send: the file that was saved to the PC hard drive.
The meter will reboot and load the new softwar e.
Note: Once the softw are is loaded into the MIS-1, it will be
necessary to reprogram the configuration data, refere nces,
reco rders, alarms, logs, etc (see the pre vious sections in this
manual).
After the reprogramming is complete, the MIS-1 is ready for
operation.
3-30 Advanced Pr ogram ming
Page 94

ABOUT
HELP
MIS-1 Help System
NEXT PREV DONE
HELP
Scrolling Mode Selection
HELP PLACEUNITS
or
(key toggles)
MODE
SELECT
Display Select Menu
MODE
PAGE DONE
Display Page #
DONE
Main Menu
SETTINGS
Settings Menu
(See Figure 3-18)
SCREEN
HELP
OPTIONS
Option Menu
LOGGER
USER
User Constant Menu
TABLE
PAGE
or
CHANNEL
or
ON/OFF
DONE
DONE
HELP
Data Logger Menu
STORAGE
FILE
June 20 03
DONE
GRAPHS
HELP
Matrix Scree n Men u
CONTRAST
CYCLE
Contrast Adjust Menu
INCR
DECR
If you are displaying data in
Matrix Format
or
Line Graph
DONE
MATRIX
DONE
Graph Scale Menu
X AXIS
HELP
HELP
Graph Screen Menu
CONTRAST
SCALE
HELP DECR
Y AXIS
Contrast Adjust Menu
DONE
DONE
HELP
DONE
INCR DONE
Set Data Logger Menu
START
or
STOP
REMOVE
DONEMODE
VIEW
DONESETTINGS
Adva nced Programm ing 3-31
Figure 3-18: Help, Select and Options Menu
Page 95

HELP
He lp Syste m
(See Figure 3-17) (See Figure 3-17)
SELECT
Display Select Menu
Main Me nu
SETTINGS
Settings Menu
OPTIONS
Option Menu
(See Figure 3-17)
June 20 03
SET
TRIP
RANGE
ALARMS
Alarm Setting Menu
TEST
CHANNEL
MODE
Set Recorder:
MODE
A
Output Settings Menu
BA
DONE
B
OUTPUTS
RECORDER
DONE
SET
DONE
PORT
DONE
FUNCT ION
Recorder Settings Menu
CHANNEL
TEST
HELP
ZRO/SPAN
Port Settings Menu
BAUD
INTERVAL
(printer)
NODE ID
(PanaLi nk)
DONE
Recorder Test Menu
TRIM
Recorder Tri m Menu
TRIM UP
TRIM DN
DONE
HELP
SYSTEM
System Settings Me nu
HELP
CALIB
System Calibration Menu
CHANNEL
PROBE
CONFIG
DONE
DONE
SERVICE
System Service Me nu
HELP
REFS
CLOCK
Reference Menu
HELP INTE RVAL PROBE
DONE
DONE
or
Probe Configuration Menu
TAG
HELP
Label Entry Menu
NEXT ROW
HELP
- - - -
DONE
PREV ROW
HELP
DONE
ERRORS
Error Processing Menu
CHANNEL
ACTION
DONE
DONE
DONE
DONE
Adva nced Programm ing 3-32
Figure 3-19: Settings Menu
Page 96

Chapter 4
Page 97

Programming with PanaView
Introduction . . . . . . . . . . . . . . . . . . . . . . . . . . . . . . . . . . . . . . . . . . .4-1
Changing Measurement Modes and Units. . . . . . . . . . . . . . . . . . .4-1
Changing a Matrix Display to a Graph . . . . . . . . . . . . . . . . . . . . . .4-6
Changing Alarm Settings . . . . . . . . . . . . . . . . . . . . . . . . . . . . . . . .4-7
Changing Recorder Settings. . . . . . . . . . . . . . . . . . . . . . . . . . . . . .4-9
Programming User Functions. . . . . . . . . . . . . . . . . . . . . . . . . . . .4-12
Entering User Tables . . . . . . . . . . . . . . . . . . . . . . . . . . . . . . . . . . .4-14
Entering Saturation Constants . . . . . . . . . . . . . . . . . . . . . . . . . . .4-15
Page 98

April 2004
Introduction The optional PanaView software package enabl es you to remotely
change the programming of the Series 1. In addition to displaying
meter measurements on your PC, you can vary the modes and displ ay
units on in dividual pages and cha nnels, and a dd, c hange or delete user
equations and user tables. For a complete explanation of PanaView’s
capabilities , se e the PanaView User’s Manual.
IMPORTAN T: Before attempting to display or c hange programming
via the PC, be sure to install PanaView as described
in Chapter 1 of the PanaView User’s Manual .
Changing Measurement Mo des and Units
PanaView enables you to actually change the measurements on the
matrix display. For example, through the PC, you can switch a
window on page 2 from its original programmin g of measuring
oxygen in parts-per -million on Channel 2 to new programming of
measuring pressure at psig on Channel 3 — or leave the window
entirely blank.
Programming with PanaView 4-1
Page 99

April 2004
Open the Meter Display Window
1. From the “File” menu, click on the “New Meter Browser” option.
2. From the network tree, click on the desire d communications port
(COM 1, etc.) and me te r.
3. From the expanded tree, click on the “Display” option. A list of
six display pa ges appears. Clicking on any page ope ns the list of
channels, modes (temperature, hygrometry, oxygen, etc.) a nd
display units currently assigned for tha t page.
4. Double-clickin g on any page opens the “Meter Display” window,
shown in Figure 4-1 on page 4-3. Each individual blue window
shows the mode and unit measured in the corresp onding window
on the Series 1 page, with the assigned channel num ber in the
upper left corner. A line below indicates which page the meter is
currently displaying.
5. To scroll to a particular page, click on the left or right pointer
buttons at the bottom of the window.
6. If you want to set a particular page as the page currently displayed
on the meter, scroll to that page and c lick on
[Set Active Page].
Note: While each window shows the sensor and units measur ed, yo u
must click on the “Text Display” option from the “Output”
menu, or view the Series 1 screen, to see the actual
measure ments at any given time.
4-2 Programming with PanaView
Page 100
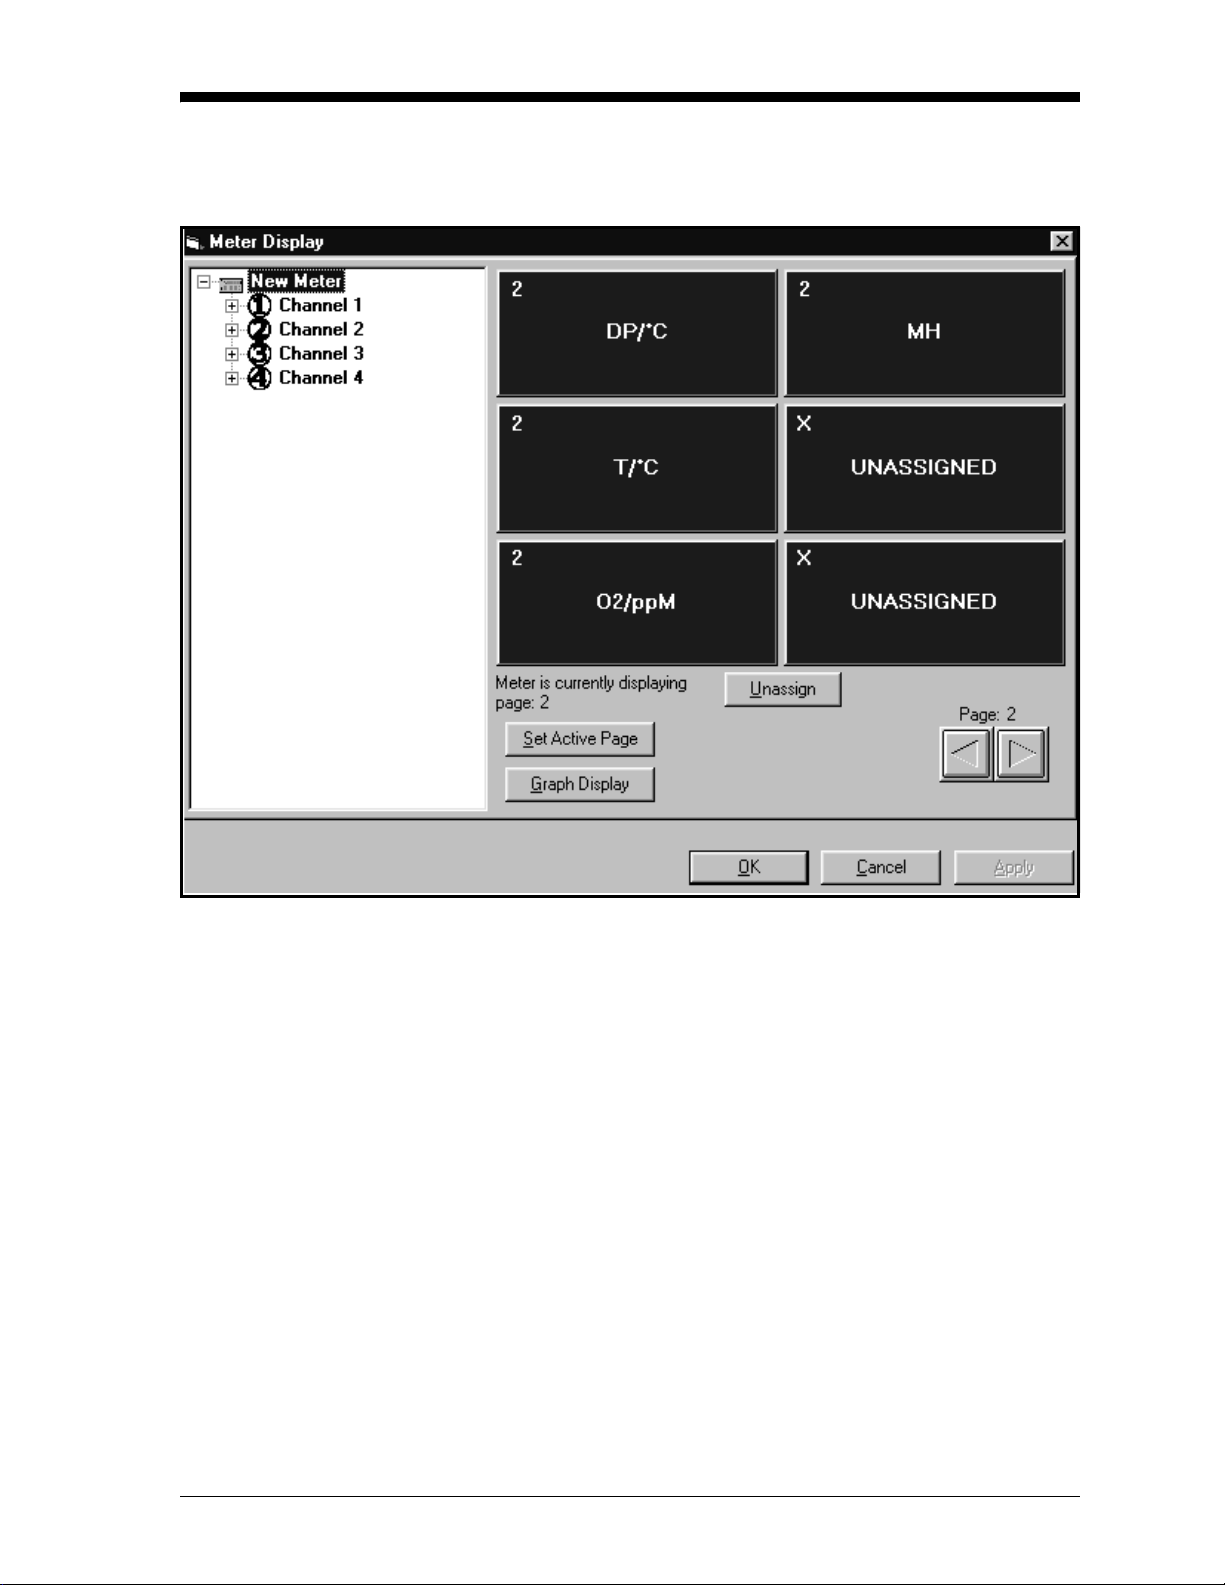
Open the Meter Display
Window (cont.)
April 2004
Figure 4-1: The Meter Display Window
Programming with PanaView 4-3
 Loading...