

Page 1

&%! $
'$!
' # &
"#% !& %%!
Page 2

Regulatory Requirement
This product complies with regulatory requirements of the following European
Directive 93/42/EEC concerning medical devices
This manual is a reference for the LOGIQ 500 PRO Series. It applies to all
versions of 6.0 software for the LOGIQ 500.
GE Medical Systems
GE Medical Systems: Telex 3797371
P.O. Box 414, Milwaukee, Wisconsin 53201 U.S.A.
(Asia, Pacific, Latin America, North America)
$% /+, &+ 1 -*() %
,#(. '+,*0 (+,!# (%$'" '
Page 3

Revision History
'$! $%!#)
REV DATE REASON FOR CHANGE
0 August 14, 2000 Initial Release
!& %
'$! $%!#)
&%!#) "&# %$
! ! % %$ %#&
%#&
%#&
%#&
%#&
Please verify that you are using the latest revision of this document. Information
pertaining to this document is maintained on GPC (GE Medical Systems Global
Product Configuration). If you need to know the latest revision, contact your
distributor, local GE Sales Representative or in the USA call the GE Ultrasound
Clinical Answer Center at 1-800-682-5327 or 262-524-5698.
%#&
%#&
%#&
%#&
%#&
( %#&
LOGIQ 500 Advanced Reference Manual
2276614–100 Rev . 0
Revision History A
Page 4

Revision History
This page left blank intentionally.
Revision History B
LOGIQ 500 Advanced Reference Manual
2276614–100 Rev . 0
Page 5

Regulatory Requirements
A
Regulatory Requirements
This product complies with the regulatory requirements of the
following:
S Council Directive 93/42/EEC concerning medical devices:
the label affixed to the product testifies compliance
to the Directive.
The location of the CE marking is shown on 2–24 of this
manual.
European registered place of business:
GE Medical Systems Europe
Quality Assurance Manager
BP 34
F 78533 BUC CEDEX France
Tel: +33 (0)1 30 70 40 40
.
For US
Only
S Medical Device Good Manufacturing Practice Manual
issued by the FDA (Food and Drug Administration,
Department of Health, USA).
S Underwriters’ Laboratories, Inc. (UL), an independent
testing laboratory.
S Canadian Standards Association (CSA).
S International Electrotechnical Commission (IEC),
international standards organizations, when applicable.
Caution: United States law restricts this device to sale or use by
or on the order of a physician.
S
General Electric Medical Systems
EN 46001 certified.
S The original document was written in English.
is ISO 9001 and
LOGIQ 500 Advanced Reference Manual
2276614–100 Rev . 0
Regulatory Req 1
Page 6

Regulatory Requirements
NOTE: This equipment generates, uses and can radiate radio frequency energy. The
equipment may cause radio frequency interference to other medical and
non-medical devices and radio communications. To provide reasonable
protection against such interference, this product complies with emissions limits
for a Group 1, Class A Medical Devices Directive as stated in EN 60601–1–2.
However, there is no guarantee that interference will not occur in a particular
installation.
NOTE: If this equipment is found to cause interference (which may be determined by
turning the equipment on and off), the user (or qualified service personnel)
should attempt to correct the problem by one or more of the following
measure(s):
– reorient or relocate the affected device(s)
– increase the separation between the equipment and the affected device
– power the equipment from a source different from that of the affected device
– consult the point of purchase or service representative for further
suggestions
NOTE: The manufacturer is not responsible for any interference caused by using other
than recommended interconnect cables or by unauthorized changes or
modifications to this equipment. Unauthorized changes or modifications could
void the users’ authority to operate the equipment.
NOTE: To comply with the regulations on electromagnetic interference for a Class A
FCC Device, all interconnect cables to peripheral devices must be shielded and
properly grounded. Use of cables not properly shielded and grounded may
result in the equipment causing radio frequency interference in violation of the
FCC regulations.
NOTE: Do not use devices which intentionally transmit RF Signals (cellular phones,
transceivers, or radio controlled products) in the vicinity of the equipment as it
may cause performance outside the published specifications. Keep the power
to these type devices turned off when near this equipment.
The medical staff in charge of this equipment is required to instruct technicians,
patients, and other people who may be around this equipment to fully comply
with the above requirement.
Regulatory Req 2
LOGIQ 500 Advanced Reference Manual
2276614–100 Rev . 0
Page 7

Table of Contents
Table of Contents
Front Matter
Title Page
Revision History
Regulatory Requirements Regulatory Req 1. . . . . . . . . . . . . . . . . . . . . .
Table of Contents Table of Contents 1. . . . . . . . . . . . . . . . . . . . . . . . . . . . . .
Introduction
System Features 1–2. . . . . . . . . . . . . . . . . . . . . . . . . . . . . . . . . . . . . . . . . .
LOGIQ 500’s Features 1–2. . . . . . . . . . . . . . . . . . . . . . . . . . . . . . . . . . . . . .
Manual Organization 1–4. . . . . . . . . . . . . . . . . . . . . . . . . . . . . . . . . . . . . .
Manual Content 1–4. . . . . . . . . . . . . . . . . . . . . . . . . . . . . . . . . . . . . . . . . . . . . .
Manual Layout 1–5. . . . . . . . . . . . . . . . . . . . . . . . . . . . . . . . . . . . . . . . . . . . . . .
Operator Controls
A. . . . . . . . . . . . . . . . . . . . . . . . . . . . . . . . . . . . . . . . .
Sub-Menu Displays 2–2. . . . . . . . . . . . . . . . . . . . . . . . . . . . . . . . . . . . . . .
B-Mode Top Menu 2–2. . . . . . . . . . . . . . . . . . . . . . . . . . . . . . . . . . . . . . . . . . .
CFM Top Menu 2–3. . . . . . . . . . . . . . . . . . . . . . . . . . . . . . . . . . . . . . . . . . . . . .
PWD Top Menu 2–4. . . . . . . . . . . . . . . . . . . . . . . . . . . . . . . . . . . . . . . . . . . . . .
CWD Top Menu 2–5. . . . . . . . . . . . . . . . . . . . . . . . . . . . . . . . . . . . . . . . . . . . . .
M-Mode Top Menu 2–6. . . . . . . . . . . . . . . . . . . . . . . . . . . . . . . . . . . . . . . . . . .
Preset Top Menu 2–6. . . . . . . . . . . . . . . . . . . . . . . . . . . . . . . . . . . . . . . . . . . . .
Set Up Top Menu 2–7. . . . . . . . . . . . . . . . . . . . . . . . . . . . . . . . . . . . . . . . . . . .
ECG Top Menu 2–7. . . . . . . . . . . . . . . . . . . . . . . . . . . . . . . . . . . . . . . . . . . . . .
Image Archive Option Top Menu 2–8. . . . . . . . . . . . . . . . . . . . . . . . . . . . . . .
Cine Top Menu 2–8. . . . . . . . . . . . . . . . . . . . . . . . . . . . . . . . . . . . . . . . . . . . . .
Auto Sequence Top Menu 2–8. . . . . . . . . . . . . . . . . . . . . . . . . . . . . . . . . . . . .
Probe Name Menu 2–9. . . . . . . . . . . . . . . . . . . . . . . . . . . . . . . . . . . . . . . . . . .
Body Pattern 2–9. . . . . . . . . . . . . . . . . . . . . . . . . . . . . . . . . . . . . . . . . . . . . . . .
Comment 2–9. . . . . . . . . . . . . . . . . . . . . . . . . . . . . . . . . . . . . . . . . . . . . . . . . . .
Measurement (GYN calculation menu) 2–10. . . . . . . . . . . . . . . . . . . . . . . . . .
Image Recall 2–10. . . . . . . . . . . . . . . . . . . . . . . . . . . . . . . . . . . . . . . . . . . . . . . .
Advanced Cardiac Measurement Option 2–11. . . . . . . . . . . . . . . . . . . . . . . .
LOGIQ 500 Advanced Reference Manual
2276614–100 Rev . 0
Table of Contents 1
Page 8

Table of Contents
Modes
3DvieW Mode (Option) 3–2. . . . . . . . . . . . . . . . . . . . . . . . . . . . . . . . . . . .
Overview 3–2. . . . . . . . . . . . . . . . . . . . . . . . . . . . . . . . . . . . . . . . . . . . . . . . . . .
Functionality in 3D-Mode 3–3. . . . . . . . . . . . . . . . . . . . . . . . . . . . . . . . . . . . . .
Functionality while MIP Image is Displayed 3–3. . . . . . . . . . . . . . . . . . . . . .
Mode Changes in 3D-Mode 3–3. . . . . . . . . . . . . . . . . . . . . . . . . . . . . . . . . . .
CFM Map 3–4. . . . . . . . . . . . . . . . . . . . . . . . . . . . . . . . . . . . . . . . . . . . . . . . . . .
Activating 3D-Mode 3–4. . . . . . . . . . . . . . . . . . . . . . . . . . . . . . . . . . . . . . . . . .
Creating a MIP Image Rendering 3–7. . . . . . . . . . . . . . . . . . . . . . . . . . . . . .
3D Option Techniques 3–9. . . . . . . . . . . . . . . . . . . . . . . . . . . . . . . . . . . . . . . .
3D-Surface Mode (Option) 3–11. . . . . . . . . . . . . . . . . . . . . . . . . . . . . . . . .
Overview 3–1 1. . . . . . . . . . . . . . . . . . . . . . . . . . . . . . . . . . . . . . . . . . . . . . . . . . .
Standard Procedure 3–12. . . . . . . . . . . . . . . . . . . . . . . . . . . . . . . . . . . . . . . . . .
Advanced Options
Realtime Doppler Calculations 4–3. . . . . . . . . . . . . . . . . . . . . . . . . . . . .
Realtime Doppler Calculations (option) 4–3. . . . . . . . . . . . . . . . . . . . . . . . .
Fetal Trend Management (software option) 4–8. . . . . . . . . . . . . . . . .
Overview 4–8. . . . . . . . . . . . . . . . . . . . . . . . . . . . . . . . . . . . . . . . . . . . . . . . . . .
Storing Patient Information 4–8. . . . . . . . . . . . . . . . . . . . . . . . . . . . . . . . . . . .
Growth Trending 4–13. . . . . . . . . . . . . . . . . . . . . . . . . . . . . . . . . . . . . . . . . . . . .
List ID Management 4–14. . . . . . . . . . . . . . . . . . . . . . . . . . . . . . . . . . . . . . . . . .
Data List Management 4–20. . . . . . . . . . . . . . . . . . . . . . . . . . . . . . . . . . . . . . .
OB–Multigestational (software option) 4–22. . . . . . . . . . . . . . . . . . . . .
Overview 4–22. . . . . . . . . . . . . . . . . . . . . . . . . . . . . . . . . . . . . . . . . . . . . . . . . . .
Patient Entry Menu 4–22. . . . . . . . . . . . . . . . . . . . . . . . . . . . . . . . . . . . . . . . . . .
Distinguishing Each Fetus 4–23. . . . . . . . . . . . . . . . . . . . . . . . . . . . . . . . . . . . .
Measurements/Calculations 4–23. . . . . . . . . . . . . . . . . . . . . . . . . . . . . . . . . . .
Change the Number of Fetuses 4–24. . . . . . . . . . . . . . . . . . . . . . . . . . . . . . . .
Report Page Layout 4–25. . . . . . . . . . . . . . . . . . . . . . . . . . . . . . . . . . . . . . . . . .
OB Graph 4–26. . . . . . . . . . . . . . . . . . . . . . . . . . . . . . . . . . . . . . . . . . . . . . . . . . .
Fetal Trend Management (Multigestational Option) 4–28. . . . . . . . . . . . . . .
Data Management Center (DMC) 4–30. . . . . . . . . . . . . . . . . . . . . . . . . . .
Overview 4–30. . . . . . . . . . . . . . . . . . . . . . . . . . . . . . . . . . . . . . . . . . . . . . . . . . .
Operational Setup 4–30. . . . . . . . . . . . . . . . . . . . . . . . . . . . . . . . . . . . . . . . . . . .
Transferring OB Data 4–31. . . . . . . . . . . . . . . . . . . . . . . . . . . . . . . . . . . . . . . . .
Error Messages 4–32. . . . . . . . . . . . . . . . . . . . . . . . . . . . . . . . . . . . . . . . . . . . . .
Patient Data Input 4–34. . . . . . . . . . . . . . . . . . . . . . . . . . . . . . . . . . . . . . . . . . . .
Table of Contents 2
LOGIQ 500 Advanced Reference Manual
2276614–100 Rev . 0
Page 9

Table of Contents
Advanced Cardiac Calculations (AMCAL option) 4–36. . . . . . . . . . . .
Overview 4–36. . . . . . . . . . . . . . . . . . . . . . . . . . . . . . . . . . . . . . . . . . . . . . . . . . .
Measurement Sequences 4–37. . . . . . . . . . . . . . . . . . . . . . . . . . . . . . . . . . . . .
Re-measurement 4–38. . . . . . . . . . . . . . . . . . . . . . . . . . . . . . . . . . . . . . . . . . . .
Automatic Determination of Systole and Diastole 4–40. . . . . . . . . . . . . . . . .
Auto Trace Measurements 4–41. . . . . . . . . . . . . . . . . . . . . . . . . . . . . . . . . . . .
Continuous M-Mode Measurements 4–42. . . . . . . . . . . . . . . . . . . . . . . . . . . .
Advanced Cardiac Calculations Measurement Menus 4–43. . . . . . . . . . . . .
Cardiac Measurements 4–62. . . . . . . . . . . . . . . . . . . . . . . . . . . . . . . . . . . . . . .
Customizing Measurement Sequences 4–62. . . . . . . . . . . . . . . . . . . . . . . . .
Auto Sequence Programming 4–65. . . . . . . . . . . . . . . . . . . . . . . . . . . . . . . . . .
Advanced Cardiac Specification Tables 4–66. . . . . . . . . . . . . . . . . . . . . . . . .
LV Calculation Formulas (Cubed Method) 4–66. . . . . . . . . . . . . . . . . . . . . . .
LV Calculation Formulas (Teichholz Method) 4–67. . . . . . . . . . . . . . . . . . . . .
LV Calculation Formulas (Bullet Method) 4–68. . . . . . . . . . . . . . . . . . . . . . . .
LV Calculation Formulas (LV SP-DISC Method) 4–68. . . . . . . . . . . . . . . . . .
LV Calculation Formulas (LV BP-DISC Method) 4–70. . . . . . . . . . . . . . . . . .
LV Calculation Formulas (Modified Simpson’s Rule Method) 4–72. . . . . . .
LV Calculation Formulas (Single Plane Ellipsoid Method) 4–72. . . . . . . . . .
LV Calculation Formulas (Bi Plane Ellipsoid Method) 4–73. . . . . . . . . . . . . .
LV Calculation Formulas (Gibson Method) 4–74. . . . . . . . . . . . . . . . . . . . . . .
B-Mode Analysis – Parasternal Long Axis 4–76. . . . . . . . . . . . . . . . . . . . . . .
B-Mode Analysis – Parasternal Short Axis (PSAX-AV) 4–77. . . . . . . . . . . .
B-Mode Analysis – Parasternal Short Axis (PSAX-MV) 4–78. . . . . . . . . . . .
B-Mode Analysis – Parasternal Short Axis (PSAX-PAP) 4–79. . . . . . . . . . .
B-Mode Analysis – Apical 4 Chamber (AP-4CH) 4–80. . . . . . . . . . . . . . . . .
B-Mode Analysis – Apical 2 Chamber (AP-2CH) 4–82. . . . . . . . . . . . . . . . .
M-Mode Analysis – Left/Right Ventricle (M-LV/RV) 4–83. . . . . . . . . . . . . . . .
M-Mode Analysis – Mitral Valve (M-MV) 4–84. . . . . . . . . . . . . . . . . . . . . . . . .
M-Mode Analysis – Aortic Valve (M-AV) 4–85. . . . . . . . . . . . . . . . . . . . . . . . .
M-Mode Analysis – Pulmonic Valve (M-PV) 4–86. . . . . . . . . . . . . . . . . . . . . .
M-Mode Analysis – Tricuspid Valve (M-TV) 4–87. . . . . . . . . . . . . . . . . . . . . .
Doppler Analysis – Mitral Valve (D-MV) 4–88. . . . . . . . . . . . . . . . . . . . . . . . .
Doppler Analysis – Aortic Valve (D-AV) 4–90. . . . . . . . . . . . . . . . . . . . . . . . .
Doppler Analysis – Pulmonic Valve (D-PV) 4–92. . . . . . . . . . . . . . . . . . . . . .
Doppler Analysis – Tricuspid Valve (D-TV) 4–94. . . . . . . . . . . . . . . . . . . . . . .
Advanced Cardiac Reports 4–96. . . . . . . . . . . . . . . . . . . . . . . . . . . . . . . . . . . .
Advanced Vascular (software option) 4–103. . . . . . . . . . . . . . . . . . . . . . .
Overview 4–103. . . . . . . . . . . . . . . . . . . . . . . . . . . . . . . . . . . . . . . . . . . . . . . . . . .
Menu Selections 4–103. . . . . . . . . . . . . . . . . . . . . . . . . . . . . . . . . . . . . . . . . . . . .
Report Page Layout 4–107. . . . . . . . . . . . . . . . . . . . . . . . . . . . . . . . . . . . . . . . . .
Venous Comments 4–110. . . . . . . . . . . . . . . . . . . . . . . . . . . . . . . . . . . . . . . . . . .
Vascular Calculation Formulas 4–112. . . . . . . . . . . . . . . . . . . . . . . . . . . . . . . . .
Urology Calculation (software option) 4–114. . . . . . . . . . . . . . . . . . . . . .
Urology Summary Report 4–114. . . . . . . . . . . . . . . . . . . . . . . . . . . . . . . . . . . . .
Stepper Volume Calculation 4–117. . . . . . . . . . . . . . . . . . . . . . . . . . . . . . . . . . .
LOGIQ 500 Advanced Reference Manual
2276614–100 Rev . 0
Table of Contents 3
Page 10

Table of Contents
User Maintenance
Quality Assurance 5–2. . . . . . . . . . . . . . . . . . . . . . . . . . . . . . . . . . . . . . . .
Introduction 5–2. . . . . . . . . . . . . . . . . . . . . . . . . . . . . . . . . . . . . . . . . . . . . . . . .
Typical Tests to Perform 5–3. . . . . . . . . . . . . . . . . . . . . . . . . . . . . . . . . . . . . .
Baselines 5–6. . . . . . . . . . . . . . . . . . . . . . . . . . . . . . . . . . . . . . . . . . . . . . . . . . .
Periodic Checks 5–6. . . . . . . . . . . . . . . . . . . . . . . . . . . . . . . . . . . . . . . . . . . . .
Results 5–7. . . . . . . . . . . . . . . . . . . . . . . . . . . . . . . . . . . . . . . . . . . . . . . . . . . . .
System Setup 5–8. . . . . . . . . . . . . . . . . . . . . . . . . . . . . . . . . . . . . . . . . . . . . . .
Test Procedures 5–8. . . . . . . . . . . . . . . . . . . . . . . . . . . . . . . . . . . . . . . . . . . . .
Setting up a Record Keeping System 5–17. . . . . . . . . . . . . . . . . . . . . . . . . . .
Acoustic Output
Bioeffects 6–2. . . . . . . . . . . . . . . . . . . . . . . . . . . . . . . . . . . . . . . . . . . . . . . .
Concerns Surrounding the Use of Diagnostic Ultrasound 6–2. . . . . . . . . .
Operator Awareness and Actions to Minimize Bioeffect 6–5. . . . . . . . . . .
Implementing ALARA Methods 6–9. . . . . . . . . . . . . . . . . . . . . . . . . . . . . . . .
Clinical instructions for fetal use 6–10. . . . . . . . . . . . . . . . . . . . . . . . . . . . . . . .
Efficacy of Fetal Doppler 6–13. . . . . . . . . . . . . . . . . . . . . . . . . . . . . . . . . . . . . .
Variance studies for fetal Doppler measurements 6–16. . . . . . . . . . . . . . . .
Training and User Assistance 6–17. . . . . . . . . . . . . . . . . . . . . . . . . . . . . . . . . .
FDA Acoustic Output Tables 6–18. . . . . . . . . . . . . . . . . . . . . . . . . . . . . . .
Maximum output summary 6–18. . . . . . . . . . . . . . . . . . . . . . . . . . . . . . . . . . . .
Maximum Thermal Indices 6–64. . . . . . . . . . . . . . . . . . . . . . . . . . . . . . . . . . . .
Key to Tables 6–106. . . . . . . . . . . . . . . . . . . . . . . . . . . . . . . . . . . . . . . . . . . . . . . .
Measurement Precision and Uncertainty 6–107. . . . . . . . . . . . . . . . . . . . . . . .
Acoustic Output Display Operation and Accuracy 6–107. . . . . . . . . . . . . . . .
Endnotes 6–108. . . . . . . . . . . . . . . . . . . . . . . . . . . . . . . . . . . . . . . . . . . . . . . . . . .
IEC Acoustic Output Tables 6–110. . . . . . . . . . . . . . . . . . . . . . . . . . . . . . .
Key to Tables 6–110. . . . . . . . . . . . . . . . . . . . . . . . . . . . . . . . . . . . . . . . . . . . . . . .
OB Tables
OB Tables 7–1. . . . . . . . . . . . . . . . . . . . . . . . . . . . . . . . . . . . . . . . . . . . . . . . . . .
Table of Contents 4
LOGIQ 500 Advanced Reference Manual
2276614–100 Rev . 0
Page 11

Table of Contents
Video Cassette Recorder
VCR Operating Instructions 8–2. . . . . . . . . . . . . . . . . . . . . . . . . . . . . . .
Operating Manuals 8–2. . . . . . . . . . . . . . . . . . . . . . . . . . . . . . . . . . . . . . . . . . .
Recording 8–2. . . . . . . . . . . . . . . . . . . . . . . . . . . . . . . . . . . . . . . . . . . . . . . . . . .
Cassette tapes 8–2. . . . . . . . . . . . . . . . . . . . . . . . . . . . . . . . . . . . . . . . . . . . . .
Heading VCR Playback function 8–2. . . . . . . . . . . . . . . . . . . . . . . . . . . . . . .
Introduction of VCR Features 8–3. . . . . . . . . . . . . . . . . . . . . . . . . . . . . . . . . .
Safety 8–5. . . . . . . . . . . . . . . . . . . . . . . . . . . . . . . . . . . . . . . . . . . . . . . . . . . . . .
Setting Up the VCR 8–7. . . . . . . . . . . . . . . . . . . . . . . . . . . . . . . . . . . . . . . . . .
Starting the VCR 8–14. . . . . . . . . . . . . . . . . . . . . . . . . . . . . . . . . . . . . . . . . . . . .
Recording/Playback/Image Search 8–28. . . . . . . . . . . . . . . . . . . . . . . . . . . . .
Troubleshooting 8–44. . . . . . . . . . . . . . . . . . . . . . . . . . . . . . . . . . . . . . . . . . . . .
DICOM
Storage/Print Option 9–2. . . . . . . . . . . . . . . . . . . . . . . . . . . . . . . . . . . . . .
Overview 9–2. . . . . . . . . . . . . . . . . . . . . . . . . . . . . . . . . . . . . . . . . . . . . . . . . . .
DICOM Presets 9–2. . . . . . . . . . . . . . . . . . . . . . . . . . . . . . . . . . . . . . . . . . . . . .
Menu Access 9–2. . . . . . . . . . . . . . . . . . . . . . . . . . . . . . . . . . . . . . . . . . . . . . . .
Patient Entry Menu 9–3. . . . . . . . . . . . . . . . . . . . . . . . . . . . . . . . . . . . . . . . . . .
Network Configuration 9–3. . . . . . . . . . . . . . . . . . . . . . . . . . . . . . . . . . . . . . . .
Record 1 and Record 2 Keys Device Assignments 9–6. . . . . . . . . . . . . . .
Printer Setup 9–6. . . . . . . . . . . . . . . . . . . . . . . . . . . . . . . . . . . . . . . . . . . . . . . .
Host Verification 9–8. . . . . . . . . . . . . . . . . . . . . . . . . . . . . . . . . . . . . . . . . . . . .
Image Transfer 9–10. . . . . . . . . . . . . . . . . . . . . . . . . . . . . . . . . . . . . . . . . . . . . .
Image Archive 9–15. . . . . . . . . . . . . . . . . . . . . . . . . . . . . . . . . . . . . . . . . . . . . . .
Multi Frame Transfer 9–17. . . . . . . . . . . . . . . . . . . . . . . . . . . . . . . . . . . . . . . . .
Worklist Option 9–19. . . . . . . . . . . . . . . . . . . . . . . . . . . . . . . . . . . . . . . . . . .
Overview 9–19. . . . . . . . . . . . . . . . . . . . . . . . . . . . . . . . . . . . . . . . . . . . . . . . . . .
New Patient Selection 9–19. . . . . . . . . . . . . . . . . . . . . . . . . . . . . . . . . . . . . . . .
Data Transferred 9–19. . . . . . . . . . . . . . . . . . . . . . . . . . . . . . . . . . . . . . . . . . . . .
Worklist (Schedule Menu) 9–20. . . . . . . . . . . . . . . . . . . . . . . . . . . . . . . . . . . . .
Index Index 1. . . . . . . . . . . . . . . . . . . . . . . . . . . . . . . . . . . . . . . . . . . . . . . . . . . .
LOGIQ 500 Advanced Reference Manual
2276614–100 Rev . 0
Table of Contents 5
Page 12

Table of Contents
This page left blank intentionally.
Table of Contents 6
LOGIQ 500 Advanced Reference Manual
2276614–100 Rev . 0
Page 13

Introduction
Introduction
System Features 1–2. . . . . . . . . . . . . . . . . . . . . . . . . . . . . . . . . . . . . . . . . . . . . . . . . . . . . . . . . .
LOGIQ 500’s Features 1–2. . . . . . . . . . . . . . . . . . . . . . . . . . . . . . . . . . . . . . . . . . . . .
Manual Organization 1–4. . . . . . . . . . . . . . . . . . . . . . . . . . . . . . . . . . . . . . . . . . . . . . . . . . . . . .
Manual Content 1–4. . . . . . . . . . . . . . . . . . . . . . . . . . . . . . . . . . . . . . . . . . . . . . . . . . . . .
Manual Layout 1–5. . . . . . . . . . . . . . . . . . . . . . . . . . . . . . . . . . . . . . . . . . . . . . . . . . . . . .
LOGIQ 500 Advanced Reference Manual
2276614–100 Rev . 0
1–1
Page 14

System Features
LOGIQ 500’s Features
The LOGIQ 500 digital Ultrasound System is a high
performance ultrasound imaging system, intended for general
purpose applications.
The system provides image generation in B-Mode, M-Mode,
Pulsed, CW and Color Flow Doppler and Color M-Mode with all
transducer types. Digital architecture allows maximum flexibility
of all scanning modes and transducer types, throughout the full
spectrum of operating frequencies.
All transducers are precise solid state array devices, allowing
electronically controlled imaging with Phased Array Sector,
Convex, Micro-convex and Steered Linear probes. Use of solid
state digital designs allows a wide variety of scan parameters to
be optimized including focusing, scan control, spatial resolution,
temporal resolution and contrast resolution. The result is
consistent generation of finely detailed anatomical resolution
with excellent dynamic contrast tissue range and penetration.
System Features
LOGIQ 500 also features newly integrated specialized
processing for Flow Data acquisition. Doppler information is
displayed with low noise and clean spectral content to optimize
measurements of important flow parameters. Selected probes
can operate in Multifrequency Mode in order to Optimize
Resolution in B-Mode and Sensitivity to flow in Doppler and
Color Flow Modes.
The system display processor is highly versatile to produce the
optimal set of imaging parameters and display formats without
compromising important diagnostic information. Comprehensive
graphical displays allow rapid and easy placement of Doppler
sample volumes. In Color Flow Mode, combined B-Mode and
Color Flow images can be steered independently so that optimal
positioning is available in both modes.
1–2
LOGIQ 500 Advanced Reference Manual
2276614–100 Rev . 0
Page 15

LOGIQ 500’s Features
Versatile, yet easy to use, the LOGIQ 500 system combines a
wide variety of state-of-the-art operator features without
complicating operation. The operator can customize all set-up
parameters for a given mode, probe or clinical application.
Operator controls have been placed in a logical clinical format
with both hard controls and menu-driven soft control
components. Three simultaneous probe connections allow
rapid switching electronically between probes without delaying
the examination.
The LOGIQ 500 System provides a total imaging solution for
today’s diverse ultrasound department needs, with investment
security through reliable upgrades, application enhancements,
and complete product support from GE.
Improved operator interface and system ergonomics
The LOGIQ 500 has been designed to streamline users’
workflow, especially by:
System Features
Creating intuitive user controls and prompts
Grouping controls by mode or functionality
Making the controls easy to recognize by touch
Assures users that with little effort and minimum time they can
produce a complete exam with consistently high quality images.
The sonographer can comfortably have full reach of all controls
making the system easy to learn in order to perform a quality
exam on any patient.
Improved sensitivity and resolution in each imaging mode
Benefits the user with improved acquisition and presentation of
images and biometric information.
LOGIQ 500 Advanced Reference Manual
2276614–100 Rev . 0
1–3
Page 16

Manual Organization
Manual Content
Manual Organization
The LOGIQ 500 Advanced Reference Manual is organized to
provide the information needed to start scanning right away.
Detailed information is also provided for more time-intensive
studies.
Introduction. System Features and Manual Organization
is detailed.
Operator Controls. Sub-Menu Displays are listed.
Modes. The 3DvieW and 3D-Surface Mode options are
detailed.
Advanced Options. Details the options in the different
exam categories.
Realtime Doppler Calculations
OB/GYN’s Fetal Trend Management
OB/GYN’s Multigestational Option
Advanced Cardiac Calculations
Advanced Vascular
Urology Calculations
User Maintenance. Provides information concerning
quality assurance.
Data Tables. Provides necessary data for reference.
Acoustic Output.
OB Tables.
Imaging/Recording Devices. Provides information
concerning interfacing with imaging/recording devices alone
or on a network.
VCR Operating Instructions.
DICOM.
1–4
LOGIQ 500 Advanced Reference Manual
2276614–100 Rev . 0
Page 17
Manual Organization
Manual Layout
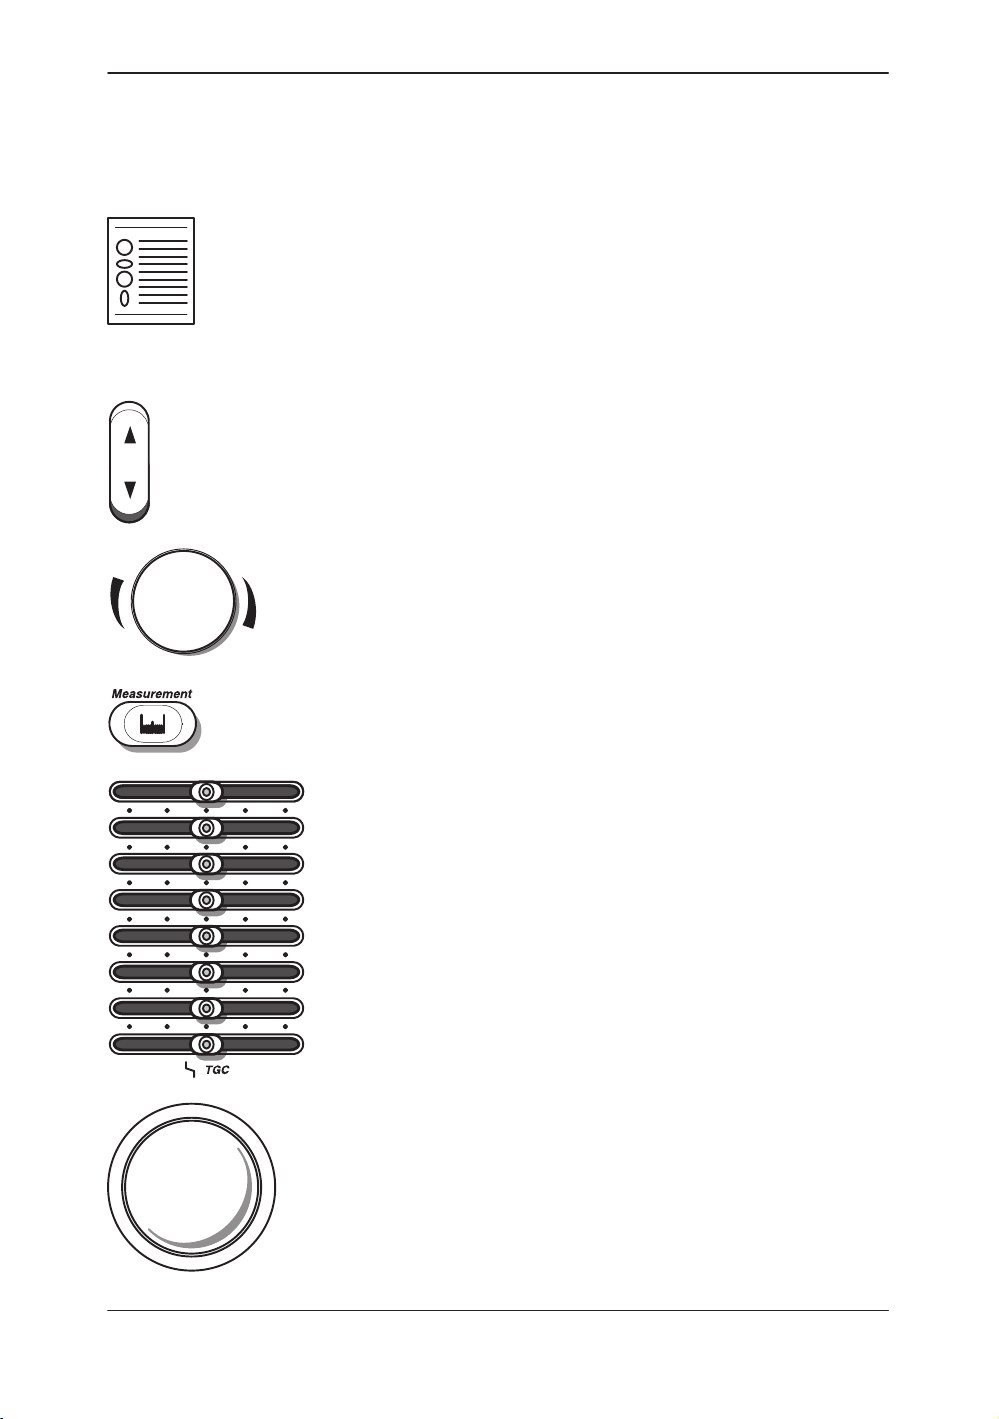
2-Column Layout The right column contains text; the left column contains headers
and graphics to highlight the text.
Graphics Graphics provide a visual guide to the text when possible.
Push the top or bottom of a rocker switch to get the desired
result.
Turn rotary knobs to the left (counterclockwise) and right
(clockwise).
Press a key to activate a function or change a parameter.
Move TGC slidepots to the left and right.
Move the Trackball around with the palm of a hand or
fingertips.
LOGIQ 500 Advanced Reference Manual
2276614–100 Rev . 0
1–5
Page 18

Manual Organization
This page left blank intentionally.
1–6
LOGIQ 500 Advanced Reference Manual
2276614–100 Rev . 0
Page 19

Operator Controls
Operator Controls
Sub-Menu Displays 2–2. . . . . . . . . . . . . . . . . . . . . . . . . . . . . . . . . . . . . . . . . . . . . .
B-Mode Top Menu 2–2. . . . . . . . . . . . . . . . . . . . . . . . . . . . . . . . . . . . . . . . . . . . . . . . . .
CFM Top Menu 2–3. . . . . . . . . . . . . . . . . . . . . . . . . . . . . . . . . . . . . . . . . . . . . . . . . . . . .
PWD Top Menu 2–4. . . . . . . . . . . . . . . . . . . . . . . . . . . . . . . . . . . . . . . . . . . . . . . . . . . . .
CWD Top Menu 2–5. . . . . . . . . . . . . . . . . . . . . . . . . . . . . . . . . . . . . . . . . . . . . . . . . . . . .
M-Mode Top Menu 2–6. . . . . . . . . . . . . . . . . . . . . . . . . . . . . . . . . . . . . . . . . . . . . . . . . .
Preset Top Menu 2–6. . . . . . . . . . . . . . . . . . . . . . . . . . . . . . . . . . . . . . . . . . . . . . . . . . . .
Set Up Top Menu 2–7. . . . . . . . . . . . . . . . . . . . . . . . . . . . . . . . . . . . . . . . . . . . . . . . . . .
ECG Top Menu 2–7. . . . . . . . . . . . . . . . . . . . . . . . . . . . . . . . . . . . . . . . . . . . . . . . . . . . .
Image Archive Option Top Menu 2–8. . . . . . . . . . . . . . . . . . . . . . . . . . . . . . . . . . . . . .
Cine Top Menu 2–8. . . . . . . . . . . . . . . . . . . . . . . . . . . . . . . . . . . . . . . . . . . . . . . . . . . . .
Auto Sequence Top Menu 2–8. . . . . . . . . . . . . . . . . . . . . . . . . . . . . . . . . . . . . . . . . . . .
Probe Name Menu 2–9. . . . . . . . . . . . . . . . . . . . . . . . . . . . . . . . . . . . . . . . . . . . . . . . . .
Body Pattern 2–9. . . . . . . . . . . . . . . . . . . . . . . . . . . . . . . . . . . . . . . . . . . . . . . . . . . . . . .
Comment 2–9. . . . . . . . . . . . . . . . . . . . . . . . . . . . . . . . . . . . . . . . . . . . . . . . . . . . . . . . . .
Measurement (GYN calculation menu) 2–10. . . . . . . . . . . . . . . . . . . . . . . . . . . . . . .
Image Recall 2–10. . . . . . . . . . . . . . . . . . . . . . . . . . . . . . . . . . . . . . . . . . . . . . . . . . . . .
Advanced Cardiac Measurement Option 2–11. . . . . . . . . . . . . . . . . . . . . . . . . . . . . .
LOGIQ 500 Advanced Reference Manual
2276614–100 Rev . 0
2–1
Page 20
Sub–Menu Displays
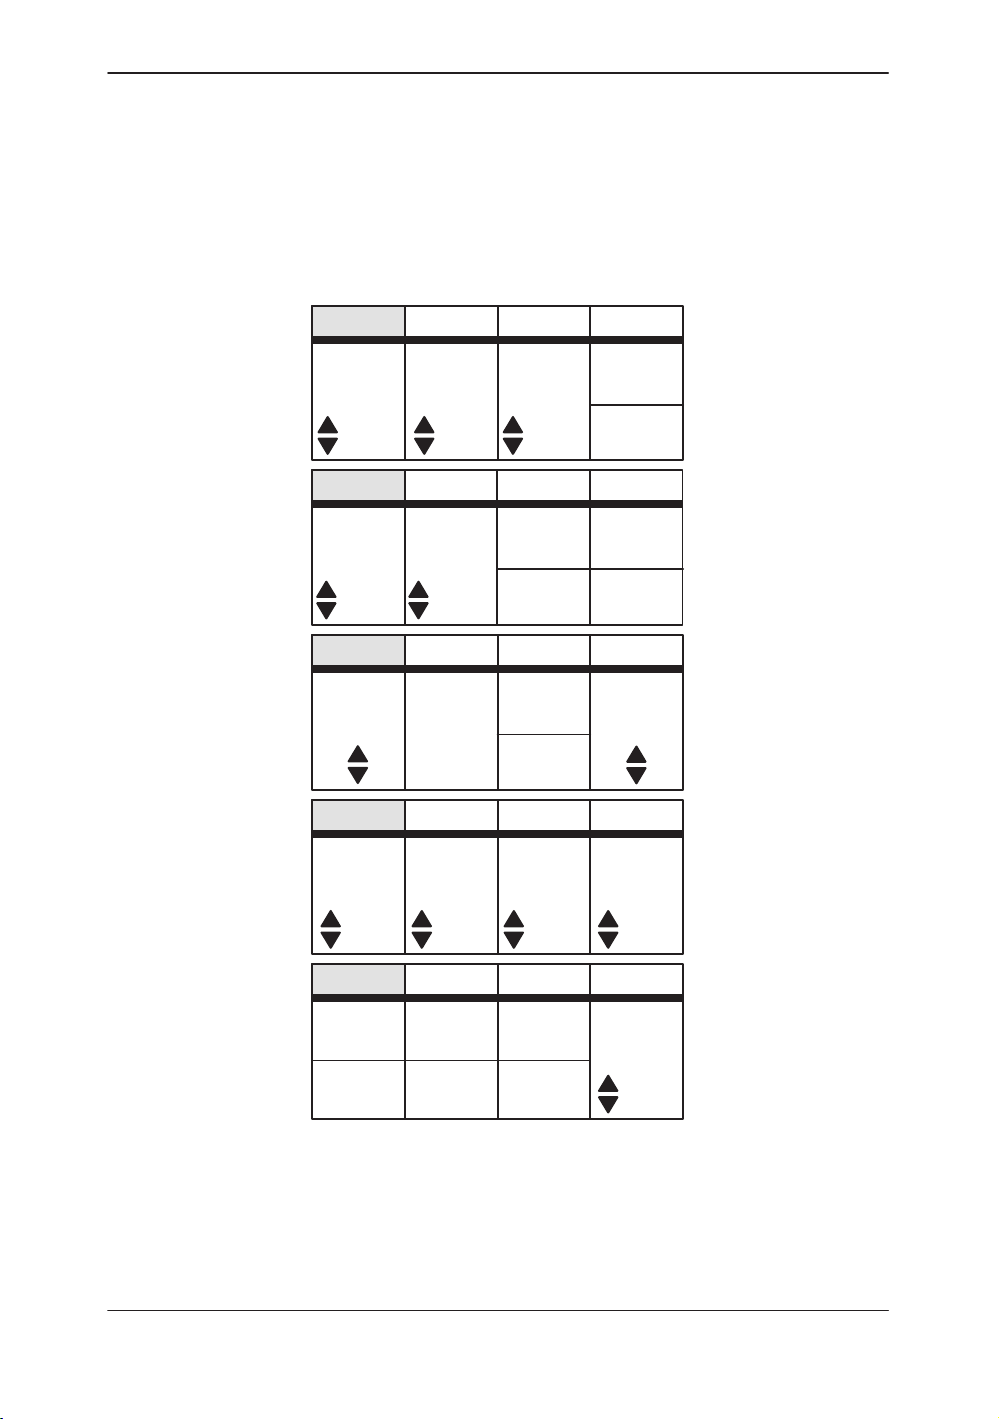
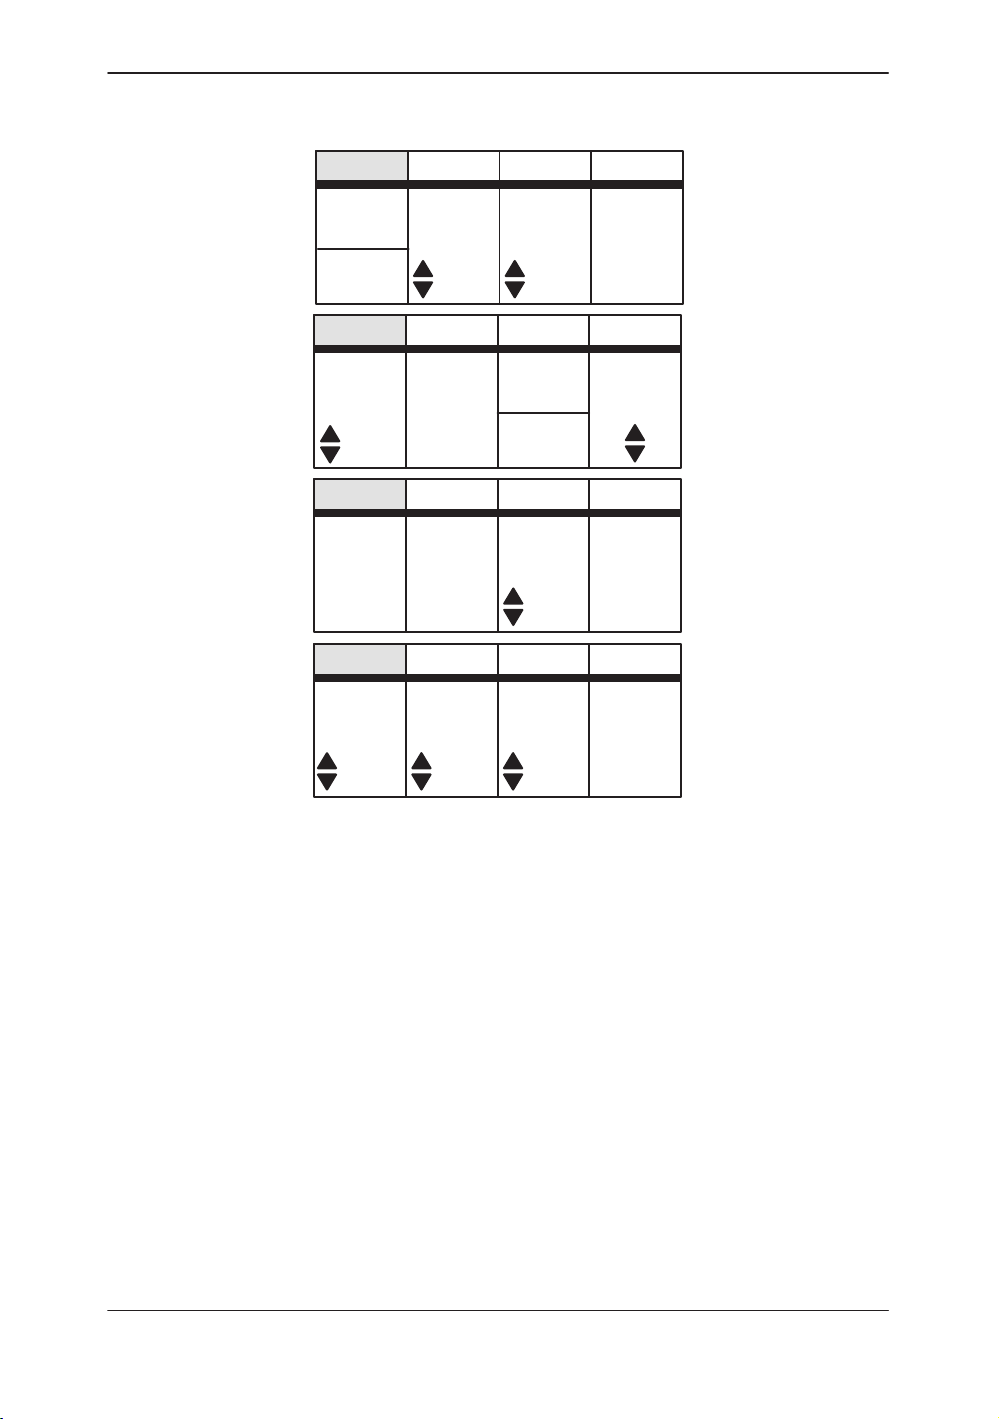
B-Mode Top Menu
Sub-Menu Displays
Dynamic
Range
48
Frame
Average
OFF 3 MHz
Focus
Positn
Biopsy
Zone
PresetB
Gray
Map
Set Up ECG
Focus
Number
B–2 2
ATO
Create
ATO
On/Off
PresetB Set Up ECG
Imaging
Freq
Image
Softner
Color
3D
Mode
PresetB Set Up ECG
Tag
Positn
Color
Tag
PresetB
Rotatn
Set Up ECG
RejectnImage
Edge
Enhance
2–2
SGL
Intermt
Scan
0DEG 40 MID
PresetB
Adjust
for Ref
Set Up ECG
IntervlTimer
Start
1.0s
Figure 2–1. B-Mode Sub-Menu (pages 1 through 5)
LOGIQ 500 Advanced Reference Manual
2276614–100 Rev . 0
Page 21
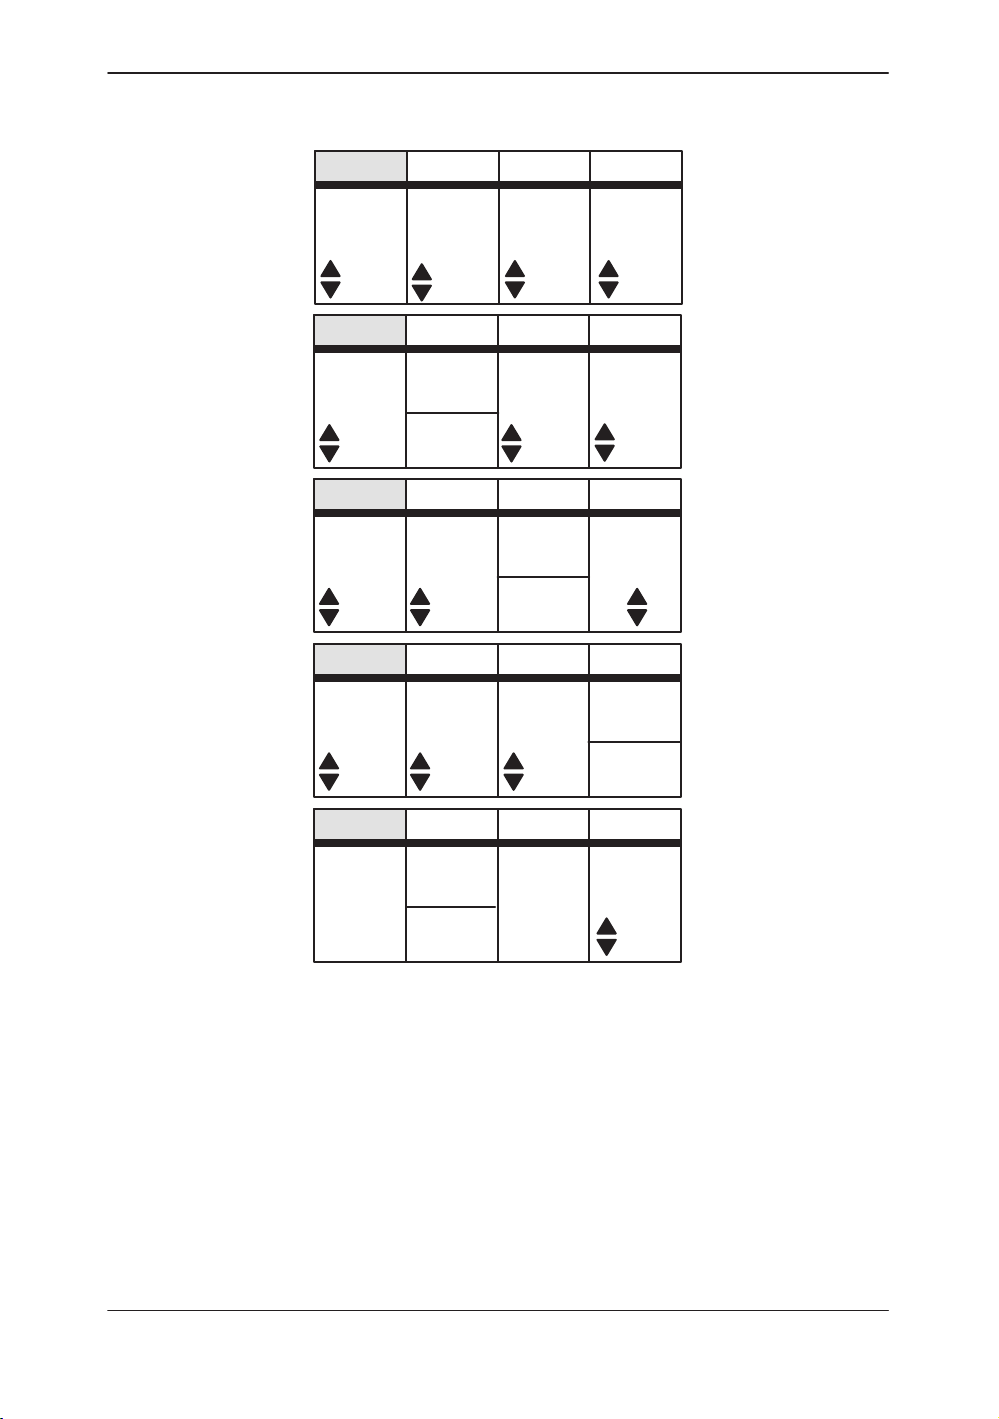
CFM Top Menu
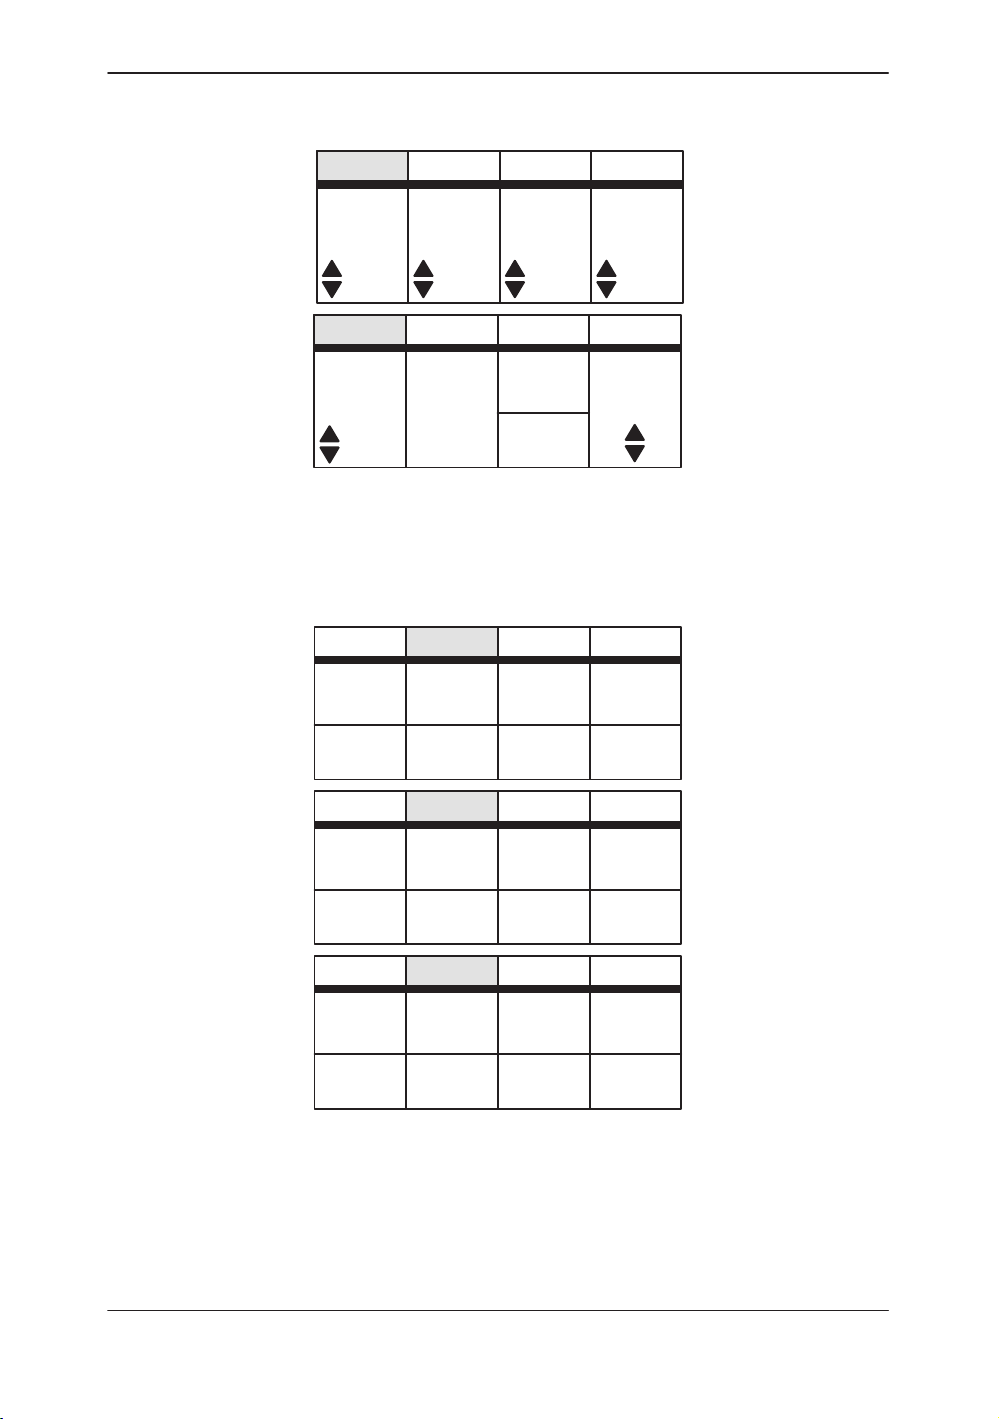
Sub–Menu Displays
CFM
Map
VT–1
Average
LOW
Packet
Size
MID
PresetCFM
Slant
Scan
PresetCFM
Penet.Frame
High
Resoltn
PresetCFM
Spatial
Filter
PresetCFM
Noise
Blanker
Set Up ECG
Diag.
Mode
0 Map LOW
Set Up ECG
Thrshld
CaptureDisplay
53 0.5
Set Up ECG
W.E.
Cancel
Color
OFF
Tag
Set Up ECG
Persist
ence
MR-FlowACE
MTI
Filter
Tag
Positn
OFF
PresetCFM
Adjust
Scan
for Ref
CFM
for Ref
Figure 2–2. CFM Sub-Menu (pages 1 through 5)
(Sub-Menu Page 4 is the CFM/PDI Enhancement Option)
LOGIQ 500 Advanced Reference Manual
2276614–100 Rev . 0
OFF
Set Up ECG
Timer
Start
OFF
3D
Mode
IntervlIntermnt
1.0s
2–3
Page 22
Sub–Menu Displays
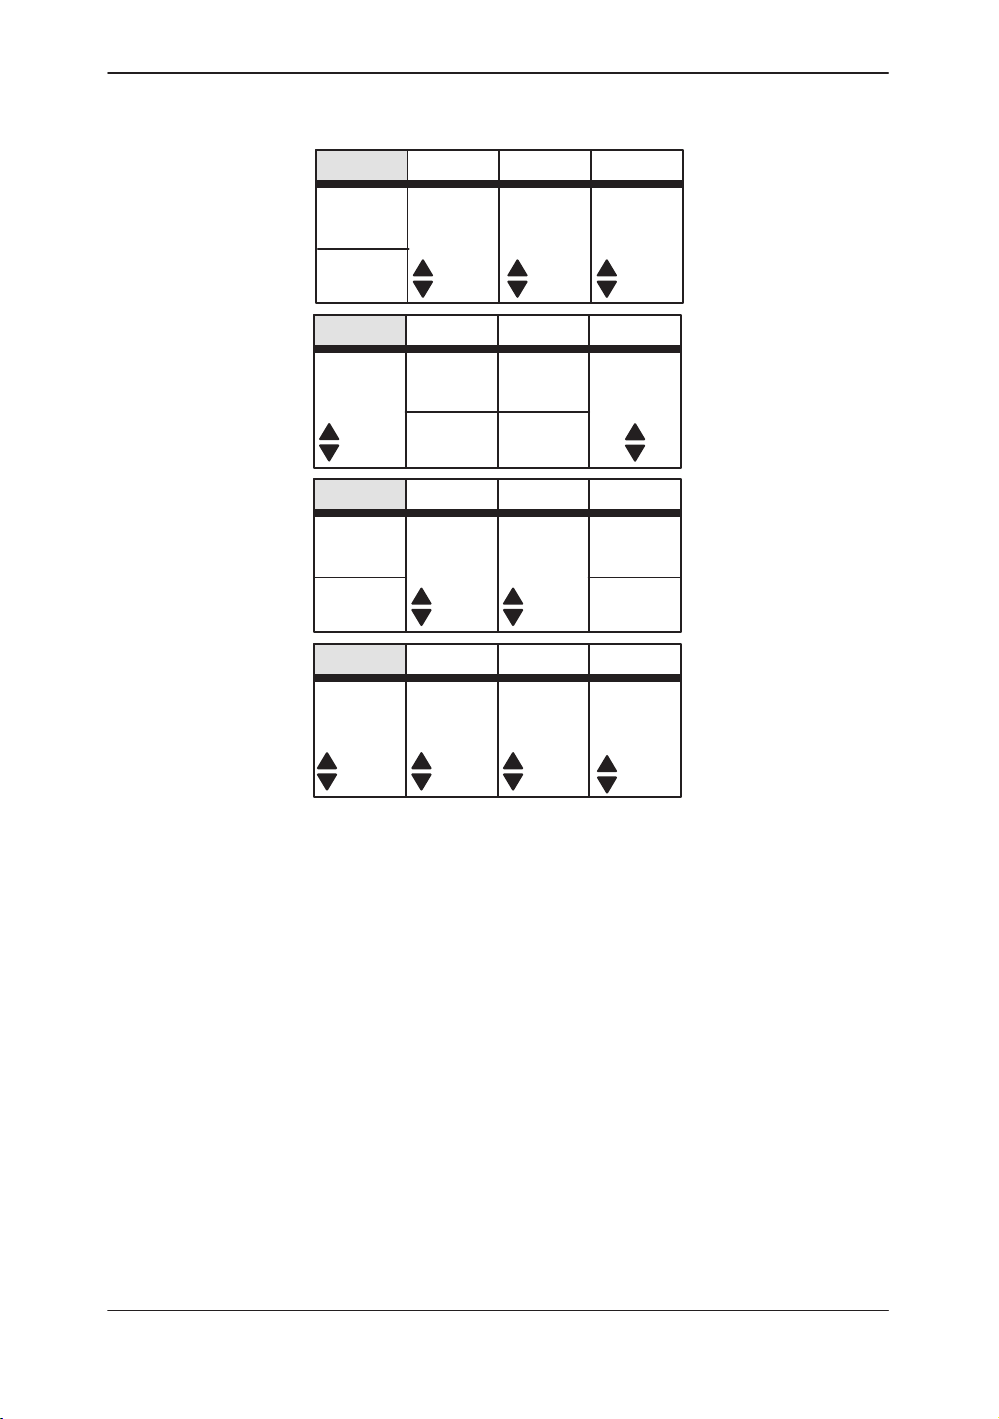
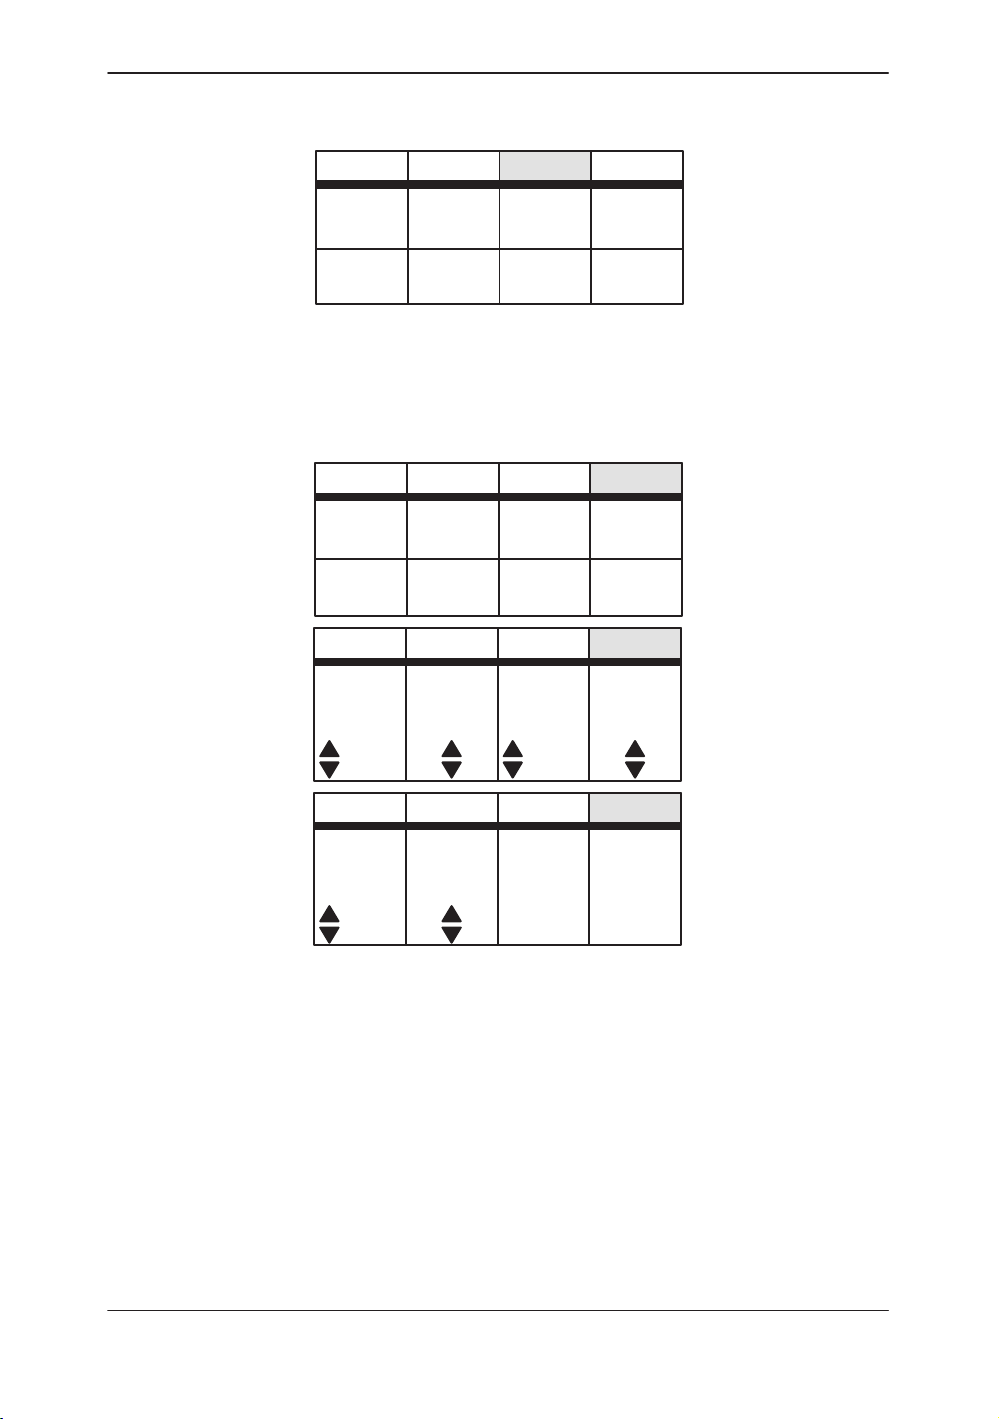
PWD Top Menu
ASO
Auto
Angle
Speed
Realtim
Trace
MID
PresetPWD
PresetPWD
PresetPWD
RejectnHPRF
PresetPWD
Set Up ECG
Slant
Scan
Wall
Filter
0 20.0 5
Set Up ECG
ColorPenet.Sweep
Color
Tag
Set Up ECG
CFM/PWD
Ratio
40
1/2
Set Up ECG
Calc
Dir.
Trace
Method
S.V.
Length
Tag
Positn
CFM
Shrink
Dynamic
Range
2–4
Compo
PEAKOFF
30
Figure 2–3. PWD Sub-Menu (pages 1 through 4)
LOGIQ 500 Advanced Reference Manual
2276614–100 Rev . 0
Page 23
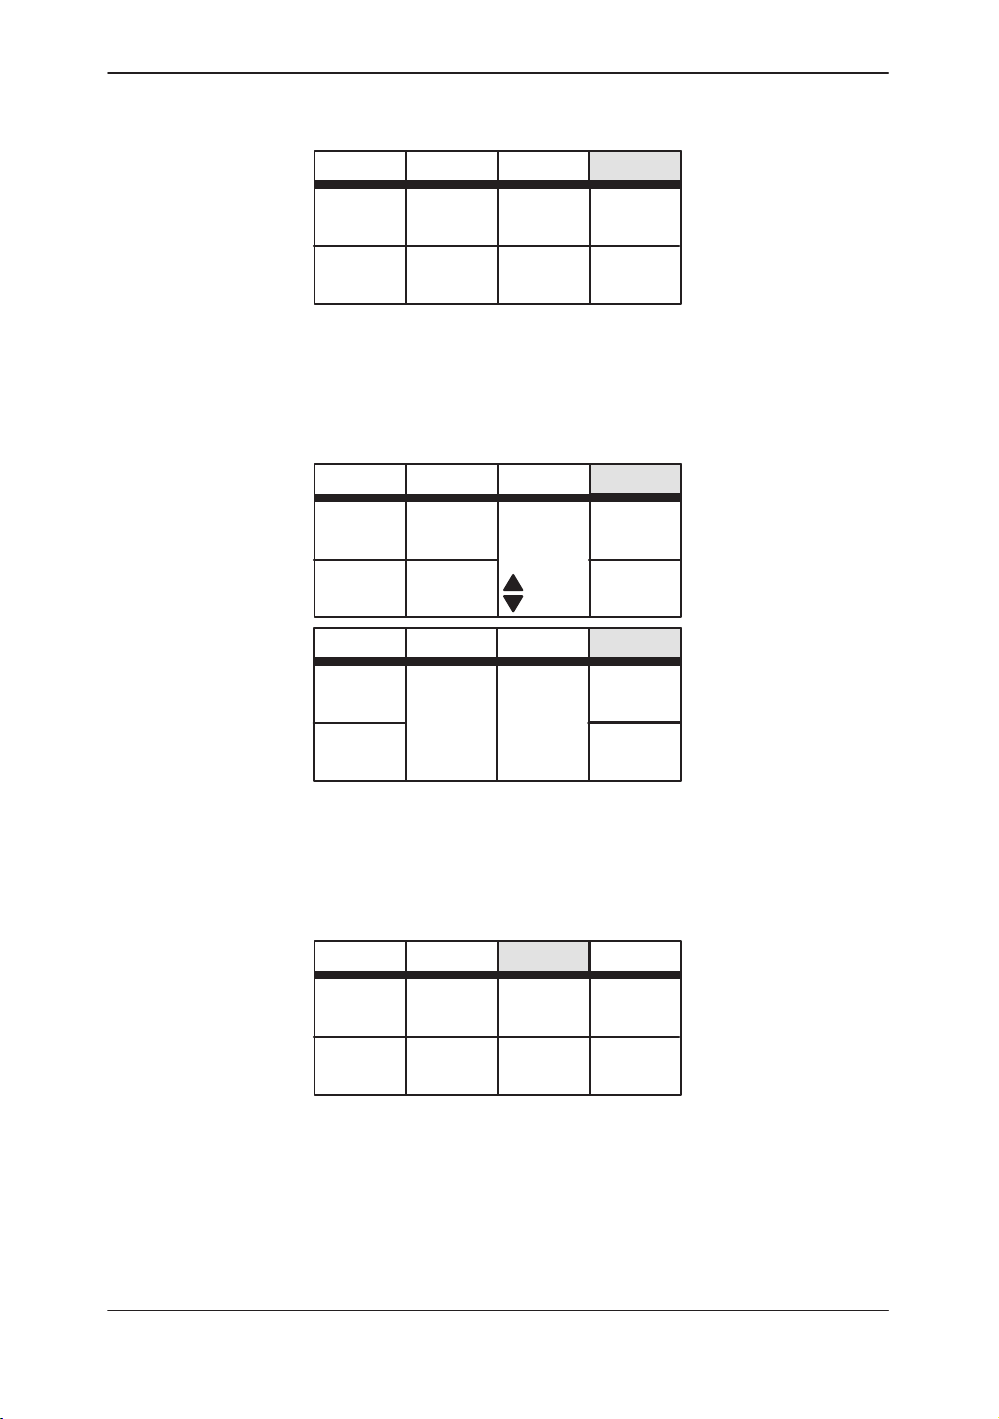
CWD Top Menu
Sub–Menu Displays
ASO
Auto
Angle
Speed
Realtim
Trace
MID
PresetCWD
PresetCWD
PresetCWD
PresetCWD
Slant
Scan
Calc
Dir.
Set Up ECG
Wall
Filter
0 20.0
Set Up ECG
ColorSweep
Color
Tag
Set Up ECG
Rejectn
40
Set Up ECG
Trace
Method
Tag
Positn
Dynamic
Range
Figure 2–4. CWD Sub-Menu (pages 1 through 4)
LOGIQ 500 Advanced Reference Manual
2276614–100 Rev . 0
Compo
PEAKOFF
2–5
Page 24
Sub–Menu Displays
M-Mode Top Menu
Preset Top Menu
Dynamic
Range
Speed
MID
PresetM
Map
48
PresetM
Set Up ECG
RejectnGray
M–2 40 MID
Edge
Enhance
Set Up ECG
ColorSweep
Color
Tag
Tag
Positn
Figure 2–5. M-Mode Sub-Menu (pages 1 and 2)
User
Preset–1
User
Preset–2
PresetB
User
Preset–3
User
Preset–4
Set Up ECG
User
Preset–5
User
Preset–6
User
Preset–7
User
Preset–8
2–6
Factory
Preset–1
Factory
Preset–2
PresetB
Factory
Preset–3
Factory
Preset–4
Set Up ECG
Factory
Preset–5
Factory
Preset–6
Factory
Preset–7
Factory
Preset–8
PresetB Set Up ECG
Recall
Preset
Figure 2–6. Preset Sub-Menu (pages 1 through 3)
LOGIQ 500 Advanced Reference Manual
2276614–100 Rev . 0
Page 25
Set Up Top Menu
Sub–Menu Displays
ECG Top Menu
Custom
Display
System
Paramtr
PresetB
Preset
Program
Set Up ECG
Save
Values
Utility
User
Define
Diag.
Figure 2–7. Set Up Sub-Menu (page 1 of 1)
Single
Dual
ECG
Gain
PresetB
Sync.
Selectn
Ref.
Scan
PresetB
ECG
Positn
Set Up ECG
R
Delay
ECG
Wave
PCG
Wave
Aux
Wave
Set Up ECG
PCG
Gain
PCG
Positn
10
PresetB
Aux
Gain
Aux
Positn
10
Figure 2–8. ECG Sub-Menu (pages 1 through 3)
LOGIQ 500 Advanced Reference Manual
2276614–100 Rev . 0
10
Set Up ECG
2–7
Page 26
Sub–Menu Displays
Image Archive Option Top Menu
Cine Top Menu
Archive
Patient
Search
Media
Search
DICOM
MO
Archive
HD
Storage
Au to Seq CINE
MO
Eject
DEFF
Format
Figure 2–9. Image Archive Sub-Menu (page 1 of 1)
Archive
Start
Frame
End
Frame
Archive Auto Seq CINE
Cine
Capture
Capture
Frame
DICOM
Review
Loop
Multpl
CINE
DICOM
Au to Seq CINE
1/1
Side
Change
Cine
Gauge
Loop
Speed
Figure 2–10. Cine Sub-Menu (pages 1 and 2)
Auto Sequence Top Menu
Archive Auto Seq CINE
Seq
1
Seq
2
Figure 2–11. Auto Sequence Sub-Menu (page 1 of 1)
2–8
DICOM
Seq
3
Seq
4
Seq
5
Seq
6
LOGIQ 500 Advanced Reference Manual
Seq
7
Seq
8
2276614–100 Rev . 0
Page 27

Probe Name Menu
Sub–Menu Displays
Body Pattern
Comment
C364
(1)
PresetB
L739
(2)
Set Up ECG
????
(3)
Figure 2–12. Probe Name Menu
Pattern
name–1
Pattern
name–2
Pattern
name–3
Pattern
name–4
Pattern
name–5
Pattern
name–6
Pattern
name–7
Pattern
name–8
Figure 2–13. Body Pattern Sub-Menu
Annotation
Annotation
Annotation
1
Annotation
2
Figure 2–14. Comment Library Sub-Menu
LOGIQ 500 Advanced Reference Manual
2276614–100 Rev . 0
3
4
Annotation
5
Annotation
6
Annotation
7
Annotation
8
2–9
Page 28

Sub–Menu Displays
Measurement (GYN calculation menu)
Image Recall
Lt Ov–L
Rt Ov–L
Lt Ov–H
Rt Ov–H
Lt Ov–W
Rt Ov–W
GYN
Report
Figure 2–15. Typical Measurement Sub-Menu
B
08:48
C,B
08:50
BM
08:51
C,BM
08:53
BD
08:54
C,BD
08:57
B
08:58
C,B/B
08:59
Figure 2–16. Image Recall Sub-Menu
NOTE: The number of images that can be saved for recall will
depend on the availability of the extended memory option.
2–10
LOGIQ 500 Advanced Reference Manual
2276614–100 Rev . 0
Page 29

Advanced Cardiac Measurement Option
LV
CUBEDLVBULLETLVSP–ELPLVGIBSON
Sub–Menu Displays
LV
TEICHLVSIMPSONLVBP–ELP
PLAX PSAX
PSAX
–AV
D–MV D–PV TRACE
D–AV D–TV Transf
Transf CALCS is only available with Realtime Doppler Calculation option installed
M–LV/RV M–AV M–TV
M–MV M–PV CARD
–MV
PSAX
–PAP
AP–4CH
AP–2CH CARD
CARD
Report
Report
AUTO
CALCs
Report
Figure 2–17. Advanced Cardiac Measurement Option Sub-Menu (pages 1 through 4)
LOGIQ 500 Advanced Reference Manual
2276614–100 Rev . 0
2–11
Page 30

Sub–Menu Displays
This page left blank intentionally.
2–12
LOGIQ 500 Advanced Reference Manual
2276614–100 Rev . 0
Page 31

Modes
Modes
3DvieW Mode (Option) 3–2. . . . . . . . . . . . . . . . . . . . . . . . . . . . . . . . . . . . . . . . . . . . . . . . . . . . .
Overview 3–2. . . . . . . . . . . . . . . . . . . . . . . . . . . . . . . . . . . . . . . . . . . . . . . . . . . . . . . . . .
Functionality in 3D-Mode 3–3. . . . . . . . . . . . . . . . . . . . . . . . . . . . . . . . . . . . . . . . . . . . .
Functionality while MIP Image is Displayed 3–3. . . . . . . . . . . . . . . . . . . . . . . . . . . . .
Mode Changes in 3D-Mode 3–3. . . . . . . . . . . . . . . . . . . . . . . . . . . . . . . . . . . . . . . . . .
CFM Map 3–4. . . . . . . . . . . . . . . . . . . . . . . . . . . . . . . . . . . . . . . . . . . . . . . . . . . . . . . . . .
Activating 3D-Mode 3–4. . . . . . . . . . . . . . . . . . . . . . . . . . . . . . . . . . . . . . . . . . . . . . . . .
Creating a MIP Image Rendering 3–7. . . . . . . . . . . . . . . . . . . . . . . . . . . . . . . . . . . . .
3D Option Techniques 3–9. . . . . . . . . . . . . . . . . . . . . . . . . . . . . . . . . . . . . . . . . . . . . . .
3D-Surface Mode (Option) 3–11. . . . . . . . . . . . . . . . . . . . . . . . . . . . . . . . . . . . . . . . . . . . . . . .
Overview 3–1 1. . . . . . . . . . . . . . . . . . . . . . . . . . . . . . . . . . . . . . . . . . . . . . . . . . . . . . . . .
Standard Procedure 3–12. . . . . . . . . . . . . . . . . . . . . . . . . . . . . . . . . . . . . . . . . . . . . . .
LOGIQ 500 Advanced Reference Manual
2276614–100 Rev . 0
3–1
Page 32

3DvieW Mode
Overview
3DvieW Mode
(Option)
A 3D image can be rendered or constructed from the cine data
collected during a normal scan by using a process called MIP
(Maximum/Minimum Intensity Projection).
When the scan data is properly collected MIP images can be
used to display vascular structure using the Advanced Velocity
Maps. MIP imaging is not a real-time function, but a
post-processing function.
CAUTION
CAUTION
This 3DvieW option is designed for qualitative information only
and has no provision for any measurement or computation
ability.
No specific reconstruction resolution or accuracy is provided or
claimed for this option.
Since positional information of the original scan is not available,
all measurement functions cannot be performed on a MIP
image. Information concerning the front or back of the MIP
image may be uncertain.
Caution should be taken when viewing the MIP image due to
the fact that the algorithm used in the MIP process may
produce a skewness to the MIP image displayed.
NOTE: Consider all of the above cautions when using MIP
images to evaluate a patient. MIP images should not be used
for quantitative information but a qualitative supplement to all
other diagnostic data collected for that patient.
3–2
LOGIQ 500 Advanced Reference Manual
2276614–100 Rev . 0
Page 33

Functionality in 3D-Mode
Because of the lack of positional information for the displayed
MIP image, the following functions are disabled while in
3D-Mode:
S Measurement Function
S Image Memory/Image Recall
S Biopsy Guideline Display
S Image Reverse
S Zoom Reference
S Dual Image Display
S ECG
S CWD Probes
S User Diagnostics
S 3D-Surface
3DvieW Mode
Functionality while MIP Image is Displayed
Additional disabled functions while 3D is displayed are:
S Cine Capture
S Cine Gauge Display
S Scale Marker Display
Mode Changes in 3D-Mode
Some scan modes are not allowed while collecting images in
3D-Mode. The following are the only modes that changes are
allowed:
S B-Mode > CFM-Mode
S CFM-Mode > B-Mode
S B-Mode > PDI-Mode
S PDI-Mode > B-Mode
NOTE: 3D images cannot be rendered in PDI-Mode.
.
LOGIQ 500 Advanced Reference Manual
2276614–100 Rev . 0
3–3
Page 34

3DvieW Mode
CFM Map
Activating 3D-Mode
CFM Map choices (1–6) used in 3D Mode are selected in the
Set Up/Custom Display page 15.
The symmetrical maps A1 thru A4 for the Advanced velocity
mode (option) are available for 3D Mode.
NOTE: The 3D Option presets are located on Set Up/Custom
Display pages 9 and 18.
3D-Mode must be activated prior to collecting the desired scan
data. To activate 3D-Mode:
2. While in normal B-Mode, display Sub-Menu page 2.
Press the Sub-Menu Select rocker switch, if
necessary, to display page 2.
3. Select 3D Mode so that the menu item is highlighted.
The message 3DvieW is displayed in the lower left
portion of the screen.
4. Scan as desired in B- or CFM-Mode.
NOTE: If 3D-Mode is enabled with the image left/right
orientation reversed, the system will not automatically switch to
normal orientation. The image stays in the reverse presentation
because the reverse function is not available.
3–4
LOGIQ 500 Advanced Reference Manual
2276614–100 Rev . 0
Page 35

Activating 3D-Mode (cont’d)
To avoid confusion with the rendered 3D image, ensure that:
The orientation mark on the probe and the displayed image
are properly aligned.
3DvieW Mode
Orientation
Marking
Orientation
Marking
Figure 3–1. Proper Probe Orientation
LOGIQ 500 Advanced Reference Manual
2276614–100 Rev . 0
3–5
Page 36

3DvieW Mode
Activating 3D-Mode (cont’d)
CAUTION
CAUTION
Cine Top Menu
When acquiring the image data, pull the probe from Start to
Finish. DO NOT PUSH THE PROBE.
Pushing the probe may cause the rendered image to appear
confusing or improper.
NOTE: 3D images cannot be rendered in PDI-Mode.
3D Mode select can also be found in the CFM, PDI and Cine
Sub-Menus.
When 3D-Mode is activated, Image memory will be cleared and
the message displayed is:
“Are you sure to erase all the image memory data? (y/n)”
When 3D-Mode is activated, one half of cine memory is
allocated for use by 3D-Mode.
Page 1 of 3
Archive
Start
Frame
DICOM
Review
Loop
Auto Seq CINE
Loop
Speed
Side
Change
3–6
End
Frame
Page 2 of 3
CINE
Capture
Capture
Frame
Page 3 of 3
Start
Frame
End
Frame
Multpl
CINE
DICOM
Swing
Speed
DICOM
Render
3D
Review
3D
Auto SeqArchive
Aspect
Auto SeqArchive
Project
Tech.
Figure 3–2. Cine Sub-Menus
Cine
Gauge
1/1
CINE
Ratio
3D
Mode
1/31/2
CINE
View
Directn
NormalMin
LOGIQ 500 Advanced Reference Manual
2276614–100 Rev . 0
Page 37

Creating a MIP Image Rendering
1. Perform a standard 2D scan in B- or CFM-Mode. The
images to be used for 3D construction will be stored in
Cine memory during scanning.
2. Press Freeze directly after the desired anatomy is
scanned. Remember that Cine memory is limited.
Activate Cine Gauge by rotating the Cine Scroll knob.
3. Display the Cine Sub-Menu page 3 by pressing the
Sub-Menu Select rocker switch. Rotate the Cine
Scroll knob to the position of the desired Start Frame,
as shown in Figure 3–3. Select Start Frame on the
Cine Sub-Menu page 3.
3DvieW Mode
Figure 3–3. Start Frame
4. Rotate the Cine Scroll knob to the position of the
desired End Frame as shown in Figure 3–4. Select
End Frame on the Cine Sub-Menu page 3.
Figure 3–4. End Frame
LOGIQ 500 Advanced Reference Manual
2276614–100 Rev . 0
3–7
Page 38

3DvieW Mode
Creating a MIP Image Rendering (cont’d)
The images in Cine Memory between the start and end frames
are the data that will be used for rendering the MIP image. See
Figure 3–5.
Figure 3–5. Images used for MIP
Images to be used for
MIP Image rendering
5. Select Render 3D from the Cine Sub-Menu page 3.
Depending on the parameters set in Custom Display pages 9
and 18, the system will take some time to use the selected data
to construct a set of composite images to be displayed as MIP
Image.
6. When the rendering or MIP Image construction is
complete, select Review 3D from the Cine Sub-Menu
page 3 to view the MIP image.
3–8
LOGIQ 500 Advanced Reference Manual
2276614–100 Rev . 0
Page 39

3D Option Techniques
Max/Normal
This technique takes the maximum intensity of each frame on
one projection line. No threshold is used.
3DvieW Mode
Min
Inverse
Gradient
Example:
compared to data in the second frame along that line. The
maximum is then compared to data in the third frame. The
maximum is compared to data in the fourth frame, etc.
This is available in B- or CFM-Modes.
This technique operates the same as Max/Normal. The
difference being the minimum intensity of each frame on one
projection line is used. No threshold is used.
This is available only in B-Mode.
This technique operates the same as Min. The value of the
result is inverted. No threshold is used.
This is available only in B-Mode.
Data in the first frame along a projection line is
This technique is a weighted projection method. A Threshold
value (Gradient Threshold) is used.
CFM-Mode (Gradient)
It is assumed that the anatomy of interest will have a higher
intensity level than the CFM Gradient Threshold.
For each frame the object region is filled with a fixed value
according to its frame number. The near frame takes a higher
fixed value, while the far frame takes a lower fixed value. The
value is changed by gradation.
After this process, a maximum intensity projection is made.
The result is an image with the near side of the object having
higher intensity and the far side having lower intensity.
LOGIQ 500 Advanced Reference Manual
2276614–100 Rev . 0
3–9
Page 40

3DvieW Mode
B-Mode (Gradient)
Shade
Almost opposite from CFM processing. It is assumed that the
anatomy of interest will have a lower intensity level than the B
Gradient Threshold.
The near frame takes a lower fixed value, while the far frame
takes a higher fixed value. The value is changed by gradation.
After this process, a minimum intensity projection is made. The
result is an image with the near side of the object having lower
intensity and the far side having higher intensity.
This technique is basically a maximum intensity projection.
However, this technique uses two thresholds:
Shade Object Threshold The value is higher than
the set threshold.
Shade Boundary Threshold The value, to be compared
to Object Threshold result,
is lower than the Boundary
Threshold.
3D Presets
Comparison will be made frame by frame after the above
thresholds have been met. If the two thresholds are satisfied,
no comparison will be made with the rest of the frame.
Using the Max/Normal method, lower intensity echoes in the
near frame will be masked by higher intensity echoes in the far
frame. The Shade Method makes it possible to show lower
intensity echoes in the near frame despite the fact that there
may be a higher echo projection in the far frame.
This is available in CFM-Mode only.
Presets in Set Up/Custom Display pages 9 and 18 allow for
choices in display and rendering technique.
All Parameters are not available in the soft menu.
Ensure that these presets are adjusted for the desired result.
3–10
LOGIQ 500 Advanced Reference Manual
2276614–100 Rev . 0
Page 41

Overview
3D–Surface Mode
3D-Surface Mode
(Option)
This option creates a projected image different from 3DvieW. It
uses images stored in Cine. The calculation used for the
projection is based on the transmission principle of light using
Volume-Rendering.
This function is available only in single B-Mode.
Refer to 3DvieW Mode section as needed.
CAUTION
CAUTION
This 3D-Surface option is designed for qualitative information
only and has no provision for any measurement or computation
ability.
No specific reconstruction resolution or accuracy is provided or
claimed for this option.
Since positional information of the original scan is not available,
all measurement functions cannot be performed on a
3D-Surface image.
NOTE: Consider all of the above cautions when using
3D-Surface images to evaluate a patient. 3D-Surface images
should not be used for quantitative information but a qualitative
supplement to all other diagnostic data collected for that patient.
LOGIQ 500 Advanced Reference Manual
2276614–100 Rev . 0
3–11
Page 42

3D–Surface Mode
Standard Procedure
1. To access 3D-Surface Mode, the system should be
active. Press 3D SURFACE from the Cine Sub-Menu
page 4. While in 3D-Surface Mode, measurements
cannot be performed. While 3D-Surface Mode is
active, “3D-Surface” is displayed on the bottom of the
screen.
Auto SeqArchive CINE
Opacity
AUTO
Zoom
Surface
3D
Surface
Start
Frame
End
Frame
DICOM
Surface
ROI
Display
Surface
Figure 3–6. Cine Sub-Menu page 4
2. Scan good images for 3D-Surface and press Freeze.
Cine is active.
3–12
LOGIQ 500 Advanced Reference Manual
2276614–100 Rev . 0
Page 43

Standard Procedure (cont’d)
To avoid confusion with the 3D-Surface image, ensure that:
The orientation mark on the probe and the displayed image
are properly aligned.
Orientation
Marking
3D–Surface Mode
Orientation
Marking
Figure 3–7. Proper Probe Orientation
CAUTION
LOGIQ 500 Advanced Reference Manual
2276614–100 Rev . 0
When acquiring the image data, pull the probe from Start to
Finish. DO NOT PUSH THE PROBE.
Pushing the probe may cause the 3D-Surface image to appear
confusing or improper.
3–13
Page 44

3D–Surface Mode
Standard Procedure (cont’d)
3. From the Cine Sub-Menu, set the START FRAME and
END FRAME for the desired images.
At this time, 3D-Surface utilizes all of Cine memory
(When 3DvieW is active, half of the memory is used for
3Dview and the other half is for Cine memory. With
3D-Surface, 3DvieW is not active, so all of Cine
memory is available.)
4. Select the Opacity setting. The available selections
are:
AUTO-1 The standard setting.
AUTO-2 Lower contrast image displayed than
AUTO-3 Higher contrast image displayed than
5. Press SURFACE ROI. The ROI box cursor is displayed
on the B-Mode image and the Cine Loop starts
automatically.
6. After reviewing the selected CINE images, use the
Trackball and Scan Area key to adjust the box cursor
to the desired size and position for the 3D-Surface
image.
AUTO-1.
AUTO-1.
7. To cancel the ROI box without rendering, press
SURFACE ROI. The SURFACE ROI sub-menu
selection is not highlighted, the ROI box cursor
disappears and the Cine Loop stops.
8. Pressing Set, the following message is displayed:
In progress, please wait.
After a while, a temporary 3D-Surface image is
displayed.
9. Depending on the probe movement used to collect the
images, adjust the length/width scale with the Ellipse
rocker switch.
10. Press Set, Clear or SURFACE ROI to fix the
3D-Surface Image.
3–14
LOGIQ 500 Advanced Reference Manual
2276614–100 Rev . 0
Page 45

Standard Procedure (cont’d)
3D–Surface Mode
.
Hints
S To zoom the 3D-Surface image, press ZOOM SURFACE.
S To return to the Cine image, select DISPLAY SURFACE.
The 3D-Surface image disappears.
S When the “Not Enough Memory” message is displayed on
the bottom of the screen, change the size of ROI to small
until this message disappears and then press SET.
S To exit 3D-Surface Mode, select 3D SURFACE.
Measurements will be available.
In 3D Mode, the 3D Surface image is not active.
3D-Surface image is not available based on a MIP (3DvieW)
image.
LOGIQ 500 Advanced Reference Manual
2276614–100 Rev . 0
3–15
Page 46

3D–Surface Mode
This page left blank intentionally.
3–16
LOGIQ 500 Advanced Reference Manual
2276614–100 Rev . 0
Page 47

Advanced Options
Advanced Options
Realtime Doppler Calculations 4–3. . . . . . . . . . . . . . . . . . . . . . . . . . . . . . . . . . . . . . . . . . . . .
Realtime Doppler Calculations (option) 4–3. . . . . . . . . . . . . . . . . . . . . . . . . . . . . . . .
Fetal Trend Management (software option) 4–8. . . . . . . . . . . . . . . . . . . . . . . . . . . . . . . . . .
Overview 4–8. . . . . . . . . . . . . . . . . . . . . . . . . . . . . . . . . . . . . . . . . . . . . . . . . . . . . . . . . .
Storing Patient Information 4–8. . . . . . . . . . . . . . . . . . . . . . . . . . . . . . . . . . . . . . . . . . .
Growth Trending 4–13. . . . . . . . . . . . . . . . . . . . . . . . . . . . . . . . . . . . . . . . . . . . . . . . . .
List ID Management 4–14. . . . . . . . . . . . . . . . . . . . . . . . . . . . . . . . . . . . . . . . . . . . . . .
Data List Management 4–20. . . . . . . . . . . . . . . . . . . . . . . . . . . . . . . . . . . . . . . . . . . .
OB–Multigestational (software option) 4–22. . . . . . . . . . . . . . . . . . . . . . . . . . . . . . . . . . . .
Overview 4–22. . . . . . . . . . . . . . . . . . . . . . . . . . . . . . . . . . . . . . . . . . . . . . . . . . . . . . . .
Patient Entry Menu 4–22. . . . . . . . . . . . . . . . . . . . . . . . . . . . . . . . . . . . . . . . . . . . . . . .
Distinguishing Each Fetus 4–23. . . . . . . . . . . . . . . . . . . . . . . . . . . . . . . . . . . . . . . . . .
Measurements/Calculations 4–23. . . . . . . . . . . . . . . . . . . . . . . . . . . . . . . . . . . . . . . .
Change the Number of Fetuses 4–24. . . . . . . . . . . . . . . . . . . . . . . . . . . . . . . . . . . . .
Report Page Layout 4–25. . . . . . . . . . . . . . . . . . . . . . . . . . . . . . . . . . . . . . . . . . . . . . .
OB Graph 4–26. . . . . . . . . . . . . . . . . . . . . . . . . . . . . . . . . . . . . . . . . . . . . . . . . . . . . . . .
Fetal Trend Management (Multigestational Option) 4–28. . . . . . . . . . . . . . . . . . . .
Data Management Center (DMC) 4–30. . . . . . . . . . . . . . . . . . . . . . . . . . . . . . . . . . . . . . . . .
Overview 4–30. . . . . . . . . . . . . . . . . . . . . . . . . . . . . . . . . . . . . . . . . . . . . . . . . . . . . . . .
Operational Setup 4–30. . . . . . . . . . . . . . . . . . . . . . . . . . . . . . . . . . . . . . . . . . . . . . . . .
Transferring OB Data 4–31. . . . . . . . . . . . . . . . . . . . . . . . . . . . . . . . . . . . . . . . . . . . . .
Error Messages 4–32. . . . . . . . . . . . . . . . . . . . . . . . . . . . . . . . . . . . . . . . . . . . . . . . . . .
Patient Data Input 4–34. . . . . . . . . . . . . . . . . . . . . . . . . . . . . . . . . . . . . . . . . . . . . . . . .
Advanced Cardiac Calculations (AMCAL option) 4–36. . . . . . . . . . . . . . . . . . . . . . . . . .
Overview 4–36. . . . . . . . . . . . . . . . . . . . . . . . . . . . . . . . . . . . . . . . . . . . . . . . . . . . . . . .
Measurement Sequences 4–37. . . . . . . . . . . . . . . . . . . . . . . . . . . . . . . . . . . . . . . . . .
Re-measurement 4–38. . . . . . . . . . . . . . . . . . . . . . . . . . . . . . . . . . . . . . . . . . . . . . . . .
Automatic Determination of Systole and Diastole 4–40. . . . . . . . . . . . . . . . . . . . . .
Auto Trace Measurements 4–41. . . . . . . . . . . . . . . . . . . . . . . . . . . . . . . . . . . . . . . . .
Continuous M-Mode Measurements 4–42. . . . . . . . . . . . . . . . . . . . . . . . . . . . . . . . .
Advanced Cardiac Calculations Measurement Menus 4–43. . . . . . . . . . . . . . . . . .
Cardiac Measurements 4–62. . . . . . . . . . . . . . . . . . . . . . . . . . . . . . . . . . . . . . . . . . . .
Customizing Measurement Sequences 4–62. . . . . . . . . . . . . . . . . . . . . . . . . . . . . .
Auto Sequence Programming 4–65. . . . . . . . . . . . . . . . . . . . . . . . . . . . . . . . . . . . . . .
Advanced Cardiac Specification Tables 4–66. . . . . . . . . . . . . . . . . . . . . . . . . . . . . .
LOGIQ 500 Advanced Reference Manual
2276614–100 Rev . 0
4–1
Page 48

Advanced Options
LV Calculation Formulas (Cubed Method) 4–66. . . . . . . . . . . . . . . . . . . . . . . . . . . .
LV Calculation Formulas (Teichholz Method) 4–67. . . . . . . . . . . . . . . . . . . . . . . . . .
LV Calculation Formulas (Bullet Method) 4–68. . . . . . . . . . . . . . . . . . . . . . . . . . . . .
LV Calculation Formulas (LV SP-DISC Method) 4–68. . . . . . . . . . . . . . . . . . . . . . .
LV Calculation Formulas (LV BP-DISC Method) 4–70. . . . . . . . . . . . . . . . . . . . . . .
LV Calculation Formulas (Modified Simpson’s Rule Method) 4–72. . . . . . . . . . . .
LV Calculation Formulas (Single Plane Ellipsoid Method) 4–72. . . . . . . . . . . . . . .
LV Calculation Formulas (Bi Plane Ellipsoid Method) 4–73. . . . . . . . . . . . . . . . . . .
LV Calculation Formulas (Gibson Method) 4–74. . . . . . . . . . . . . . . . . . . . . . . . . . . .
B-Mode Analysis – Parasternal Long Axis 4–76. . . . . . . . . . . . . . . . . . . . . . . . . . . .
B-Mode Analysis – Parasternal Short Axis (PSAX-AV) 4–77. . . . . . . . . . . . . . . . .
B-Mode Analysis – Parasternal Short Axis (PSAX-MV) 4–78. . . . . . . . . . . . . . . . .
B-Mode Analysis – Parasternal Short Axis (PSAX-PAP) 4–79. . . . . . . . . . . . . . . .
B-Mode Analysis – Apical 4 Chamber (AP-4CH) 4–80. . . . . . . . . . . . . . . . . . . . . .
B-Mode Analysis – Apical 2 Chamber (AP-2CH) 4–82. . . . . . . . . . . . . . . . . . . . . .
M-Mode Analysis – Left/Right Ventricle (M-LV/RV) 4–83. . . . . . . . . . . . . . . . . . . . .
M-Mode Analysis – Mitral Valve (M-MV) 4–84. . . . . . . . . . . . . . . . . . . . . . . . . . . . . .
M-Mode Analysis – Aortic Valve (M-AV) 4–85. . . . . . . . . . . . . . . . . . . . . . . . . . . . . .
M-Mode Analysis – Pulmonic Valve (M-PV) 4–86. . . . . . . . . . . . . . . . . . . . . . . . . . .
M-Mode Analysis – Tricuspid Valve (M-TV) 4–87. . . . . . . . . . . . . . . . . . . . . . . . . . .
Doppler Analysis – Mitral Valve (D-MV) 4–88. . . . . . . . . . . . . . . . . . . . . . . . . . . . . .
Doppler Analysis – Aortic Valve (D-AV) 4–90. . . . . . . . . . . . . . . . . . . . . . . . . . . . . .
Doppler Analysis – Pulmonic Valve (D-PV) 4–92. . . . . . . . . . . . . . . . . . . . . . . . . . .
Doppler Analysis – Tricuspid Valve (D-TV) 4–94. . . . . . . . . . . . . . . . . . . . . . . . . . . .
Advanced Cardiac Reports 4–96. . . . . . . . . . . . . . . . . . . . . . . . . . . . . . . . . . . . . . . . .
Advanced Vascular (software option) 4–103. . . . . . . . . . . . . . . . . . . . . . . . . . . . . . . . . . . .
Overview 4–103. . . . . . . . . . . . . . . . . . . . . . . . . . . . . . . . . . . . . . . . . . . . . . . . . . . . . . .
Menu Selections 4–103. . . . . . . . . . . . . . . . . . . . . . . . . . . . . . . . . . . . . . . . . . . . . . . . .
Report Page Layout 4–107. . . . . . . . . . . . . . . . . . . . . . . . . . . . . . . . . . . . . . . . . . . . . .
Venous Comments 4–110. . . . . . . . . . . . . . . . . . . . . . . . . . . . . . . . . . . . . . . . . . . . . . .
Vascular Calculation Formulas 4–112. . . . . . . . . . . . . . . . . . . . . . . . . . . . . . . . . . . . .
Urology Calculation (software option) 4–114. . . . . . . . . . . . . . . . . . . . . . . . . . . . . . . . . . .
Urology Summary Report 4–114. . . . . . . . . . . . . . . . . . . . . . . . . . . . . . . . . . . . . . . . .
Stepper Volume Calculation 4–117. . . . . . . . . . . . . . . . . . . . . . . . . . . . . . . . . . . . . . .
4–2
LOGIQ 500 Advanced Reference Manual
2276614–100 Rev . 0
Page 49

Realtime Doppler Calculations
Realtime Doppler Calculations (option)
The ultrasound system has the ability to automatically measure,
calculate and display specific parameters using the Doppler
Auto Trace in realtime. This applies to all exam categories
except GYN and Cardiology with AMCAL option.
Soft Menu Changes
Page 4 of the PWD soft menu contains 3 selections that affect
Realtime Doppler Calculations. These are:
Realtime Doppler Calculations
.
PresetPWD
Realtim
Trace
Figure 4–1. PWD Sub-Menu Page 4
S Realtime Trace: On, Off or Calc
S Calc Dir.: Forwd, Revrs or Combo
S Trace Method: Peak, Mean, Mode, Floor
Refer to the Doppler section of the Modes chapter in the Basic
User Manual for details.
NOTE: Trace method selection is important in the
determination of values used to calculate measurement
selections.
Calc
Dir.
Compo
Set Up ECG
Trace
Method
PEAKOFF
Dynamic
Range
30
LOGIQ 500 Advanced Reference Manual
2276614–100 Rev . 0
4–3
Page 50

Realtime Doppler Calculations
Soft Menu Changes (cont’d)
Example: “Mean” is the Trace Method selection.
S Enable Trace Auto and perform Doppler scan.
S TAMEAN and TAMAX (peak) are traced automatically .
S Freeze the image and select “Transf. CALCs”.
S Values are transferred to measurement area.
S Select PI and TAMAX value is used in calculations.
S Select other measurements like FV and TAMEAN is used in
the calculations.
Each measurement menu in all exam categories (except GYN
and Cardiology with AMCAL option) has a selection for:
.
S/D
Ratio
PI
Transf CALCS is only available with Realtime Doppler Calculation option installed
Figure 4–2. General Calculations Sub-Menu Page 2
S Trace Auto Turn Auto Trace on/off
S Transf. Calcs: Transfers automatic calculations
NOTE: Only OB or Vascular PI, RI and S/D (D/S) ratio are
transferred to the OB, Vascular or Carotid report pages.
A/B
Ratio
RI
HEART
RATE
currently displayed to the
Measurement results area.
TRACE
AUTO
Transf
CALCS
4–4
LOGIQ 500 Advanced Reference Manual
2276614–100 Rev . 0
Page 51

Setup
Realtime Doppler Calculations
The realtime measurement/calculation display is set with factory
defaults for each exam category. This display arrangement,
content and calculation method can be customized in Set Up/
Preset Program menu page 4 and Set Up/Custom Display
menu page 13.
See
the Preset Program section of Chapter 14 (Customizing
Your System) of the Basic User Manual for details on setting:
S Diastole Velocity for PI Vmin, Vd
S Diastole Velocity for RI Vmin, Vd
S Diastole Velocity for S/D (D/S) Vmin, Vd
S Averaging Number for D Realtime Calc. 1–5
S RI Calculation to bidirectional flow: Off, On
See the “D Realtime Calc” preset in Chapter 14 of the Basic
User Manual for details on customizing the appearance and
content of the realtime calculation display window.
Realtime Calc Window
This display appears in the upper left corner of the monitor. It
consists of 8 lines of information. If some values are not
detected, “????” will be displayed.
Example:
S “MEAN” is selected as the trace method. TAMEAN and
S If TAMAX, TAMEAN and TAMOD (mode) are selected to be
.
NOTE: It is important to remember the trace method selected
in the soft menu or Set Up/Custom Display menu page 13.
T AMAX are traced automatically.
displayed in the Realtime Doppler Calculation window,
“????” will be displayed as the value for TAMOD because it
was not traced.
LOGIQ 500 Advanced Reference Manual
2276614–100 Rev . 0
4–5
Page 52

Realtime Doppler Calculations
Display Modes
Enter the Doppler Realtime Calc mode by selecting Realtime
Trace = Calc from the PWD soft menu.
Ensure Realtime Trace = On in the measurement menu.
The Auto Trace display is available only in :
Display Format = Single D Format, Single B/D Format
Scan Mode = PD, B/PD, BCFM/PD or CWD Mode
Sweep Speed = Slow, Mid, Fast
Exit the Doppler Realtime Calc mode by turning Trace Auto
OFF in a measurement menu or selecting Realtime Trace = Off
in the PWD soft menu.
Doppler Trace Indicators
Each time end diastole is detected in the Realtime Doppler
Trace, a white or colored vertical line is placed on the display.
This indicates the area before and after the heart rate that is
used to calculate the displayed measurements/calculations.
Gray markers are used to indicate areas that are past or
beyond the current displayed calculations. This area can be
accessed after pressing Freeze and using the Cine function. If
end diastole cannot be detected, no markers are displayed.
4–6
LOGIQ 500 Advanced Reference Manual
2276614–100 Rev . 0
Page 53

Transferring Calcs
Realtime Doppler Calculations
Selecting Transf. CALCs copies data from the Realtime
Doppler Calculation window to the selected location on the
report page.
The following is an example of transferring calculations in the
OB exam category:
1. Select OB PI, OB RI and OB S/D (D/S) from the
Doppler Realtime Calculation : Submenu selection in
the Set Up/Preset Program menu page 7.
2. Turn on the Realtime Doppler Calculation selection in
the Softmenu.
3. The selected measurements will be displayed in the
upper left portion of the screen.
4. Press Freeze.
5. Choose “Select Location” from the Measurement
Softmenu.
6. Select “Transf. CALCS” to transfer the calculations to
the selected location on the report page.
The Transf. CALCs function is not available unless values are
displayed in the Doppler Realtime Display window.
NOTE: The Advanced Vascular Calculation Sub-Menu has an
option called Manual Calc. When Manual Calc is activated,
Auto Calc measurements will not be transferred to the Report
Page or result window.
LOGIQ 500 Advanced Reference Manual
2276614–100 Rev . 0
4–7
Page 54

Fetal Trend Management
Fetal Trend Management
Overview
Fetal Trend Management is an option to the LOGIQ 500 OB
Calculation package that enhances the user’s ability to monitor
the development of the fetus.
If patient data, measurements and calculations are saved
during the initial examination, this information can be compared
to results of follow up examinations. The OB Graph function
can be used to display the current data or combine the current
data with past data to show a fetal growth trend.
When previous measurement data is saved, all other
information, which is input at the Patient Entry Menu, is
retained. This information is automatically displayed in the
Patient Entry Menu on subsequent exams when the patient ID
is entered in the Patient Entry Menu.
(software option)
If the previous measurement data was saved on MOD, the
MOD must be inserted before inputting the patient ID in the
Patient Entry Menu.
Storing Patient Information
After an OB examination, the user can save the resultant
patient data to two different types of media.
The user can save the patient data to the system hard disk.
While this offers the convenience of not maintaining removable
media, the system hard disk’s storage capacity is very limited.
A Magnetic Optical Disk (MOD) would be the best storage
media. Although this removable disk must be maintained by
the user, it offers far greater storage capacity. Approximately
one year’s worth of information can be stored on one disk.
4–8
LOGIQ 500 Advanced Reference Manual
2276614–100 Rev . 0
Page 55

Data Storage Estimations
If the following standard assumptions are made:
Work days/week = 5
Patients/day = 30
Diagnosis/patient = 5
Measurements/patient = 5
then approximately one year’s worth of studies can be stored
on the hard drive.
When hard drive capacity is reached, the message “Data is full.
Delete needless data” is displayed.
However, the average MOD can store more than 30 years
worth of data using the same assumptions.
Media Selection Preset Parameter
The user must choose the type of media that will store the
patient OB information. This is done in the Set Up/Preset
Program sub-menu page 3. The parameter is:
Fetal Trend Management
Media Selection for Fetal Trend : HD MO
Select HD for the system hard drive (limited storage space) or
MOD for a removable magnetic optical disk (much greater
storage space).
LOGIQ 500 Advanced Reference Manual
2276614–100 Rev . 0
4–9
Page 56

Fetal Trend Management
Saving Data
Before the diagnosis is complete, ensure that all patient
information such as Name, ID, Ref MD and EDC has been
entered. If it has not, use the ID/Name key to enter this
necessary information. Select the OB Graph function from the
OB Calculation soft menu.
Five additional commands are displayed on the OB Graph that
relate to the Fetal Trend Management option as shown in
Figure 4–3. These commands are:
LIST–ID—Displays a list by patient ID number.
LIST DAT A —Displays data for a specified patient.
TREND–BOTH—Shows data points on the OB graph based on
current and past data.
TREND–PRESENT—Shows data points on the OB graph
based on current data only.
SAVE—Saves Patient information to specified media.
CHANGE GRAPH—Changes the measurement value graphed
(performs the same function as in the basic OB calculation
package).
Figure 4–3. OB Graph Display
4–10
LOGIQ 500 Advanced Reference Manual
2276614–100 Rev . 0
Page 57

Type of Data Saved
Save Command
Fetal Trend Management
The type of data that is recorded during the SAVE function is:
1. Date and Time
2. Patient Name and ID
3. Calculated EDC or EDD
4. Measurement Author’s Name
5. Measured or Calculated Data
NOTE: To avoid any trouble in searching later, it is better to
have all patient information entered before saving.
Use the Trackball to highlight the SAVE command and press
Set.
If patient information has been entered, the patient data,
measurements and calculations will be saved to the designated
media (HD or MOD).
If there are similar files in the data list (i.e. same ID but Name
and EDC are different), the system displays the Patient List
Menu (LIST-ID). The user will have to select the file to which
the data will be added.
If the user does not input the ID, the system displays the
List-Data Menu. The user will then have to input the ID.
If the user does not input other patient data, the system
displays the List-Data menu. The user will then have to input
the patient data.
If more than one candidate is available on the list, the system
first displays the Patient List Menu. The user then has to pick
the proper file in which the current data will be added.
LOGIQ 500 Advanced Reference Manual
2276614–100 Rev . 0
NOTE: If measurement averaging is turned on, only the
average value is saved. If measurement averaging is turned
off, only the last measured or calculated value is saved.
4–11
Page 58

Fetal Trend Management
Save Function Messages
If patient information has not been entered, the message
displayed is:
If a patient ID number is not entered, the message displayed is:
“Input patient’s information:”
“Input ID:”
NOTE: The ID number is necessary or the SAVE function
CANNOT be accomplished. It is possible to save data without
a patient name or EDC but the information displayed with the
LIST–DATA function is limited.
If all of the data is the same as a file on the data list, the
message displayed is:
“Overwrite existing data? ‘y’ ‘n’. ”
where ‘y’ replaces the archived file with the new file.
‘n’ causes the system to do nothing. This cancels the SAVE
function request.
If the storage media is full, especially in the case of the limited
capacity of the hard drive, the message displayed is:
“Data is full. Delete needless data.”
Eliminating needless data will help to conserve storage space.
4–12
LOGIQ 500 Advanced Reference Manual
2276614–100 Rev . 0
Page 59

Growth Trending
Fetal Trend Management
The default command after the OB Graph is displayed is
TREND–PRESENT. This will display an OB Graph for the
current author/measurement selected.
However, after additional examinations, the user can recall past
data and display it with the current data to show a trend in fetal
growth.
When the user selects the TREND–BOTH command from the
OB Graph display, the system automatically searches the
storage media and gets the data and displays the OB Trend
Graph as shown in Figure 4–4.
Figure 4–4. OB Trend Graph
The system will search for like data displayed on the OB Graph.
If Hadlock BPD is the data displayed, then the current patient’s
Hadlock BPD data is used with the past Hadlock BPD data to
display the trend on the graph.
If the user wants to trend different author/measurement data,
that graph must be displayed first before the TREND–BOTH
command is selected.
An asterisk (*) is used to show the present data point on the
graph while the pound sign (+) is used for all past data points.
LOGIQ 500 Advanced Reference Manual
2276614–100 Rev . 0
4–13
Page 60

Fetal Trend Management
List ID Management
The system allows the user to manage the data that was
previously stored using the Patient ID List.
Choose LIST–ID from the OB Graph display. The system
displays all data found on the storage media. The newest data
will have the first order number. The oldest data is displayed on
the last page as shown in Figure 4–5.
List ID Commands
Figure 4–5. LIST–ID Data Display
The commands at the bottom of the List–ID page allow the user
to perform the following functions:
CTRL, N—Displays the next page
CTRL, P—Displays the previous page
CTRL, A—Allows user to rearrange the order of the display list
CTRL, L—Displays the selected patients data list
CTRL, D—Deletes saved patient data
CTRL, S—Searches the ID List for desired patient information
CTRL, M—Allows user to modify patient data of a selected file
CTRL, K—Saves the current patient data
CTRL, C—Cancels the current process
CLEAR—Clears entered characters
4–14
LOGIQ 500 Advanced Reference Manual
2276614–100 Rev . 0
Page 61

Fetal Trend Management
Control, A Used to control the order in which the LIST–ID data is
displayed.
Press Ctrl, A simultaneously. The cursor moves to the number
window as shown in Figure 4–6.
PT NAME
PT ID
EDD (MM / DD / YY)
NUMBER :
NO
00001
A1234567890123
00002
B9876543210987
00003
C6754321897653
00015
Z3456188273653
Ctrl+N:Next Page
Ctrl+P:Prvs Page
Ctrl +A:Arrange
CLEAR:Clear entered characters
[PATIENT LIST MENU]
:
:
: 95/03/03
Arrange : 1–ID 2–Name 3–EDC +R–REV
ID
AAAAAAAAAAAAAAAAAAAAAAAAA
BBBBBBBBBBBBBBBBBBBBBBBBB
CCCCCCCCCCCCCCCCCCCCCCC
ZZZZZZZZZZZZZZZZZZZZZZZZZZZZ
Ctrl+L:Data List
Ctrl+D:Delete
Ctrl +S:Search
Operator Message Area
NAME EDC
PAGE :###/###
Ctrl+M:Modify
Ctrl+K:Save
Ctrl +C:Cancel
Figure 4–6. List Arrangement Selections
The following message is displayed:
“Arrange : 1–ID 2–Name 3–EDC +R–REV”
1 = Rearrange by ID number smallest to largest
1R = Rearrange by ID number largest to smallest
2 = Rearrange by name A to Z.
2R = Rearrange by name Z to A.
3 = Rearrange by EDD newest to oldest
3R = Rearrange by EDD oldest to newest.
95/09/15
95/09/23
95/09/28
95/09/13
“R” added to the number selection means reverse order.
Type in the number or number/letter for the list display
arrangement desired and press Return.
The temporary file sort for display begins. The time required
depends on the amount of information in the data base.
LOGIQ 500 Advanced Reference Manual
2276614–100 Rev . 0
4–15
Page 62

Fetal Trend Management
Control, D The Control, D function allows the user to delete specified files
from the LIST–ID data base (HD or MOD).
Press Ctrl, D simultaneously. The cursor moves to the number
window.
Type in the number from the list displayed on the screen and
press Return.
Before deleting any data, the following message is displayed:
“Are you sure to delete the data ? (y/n)”
where ‘y’ means to proceed with deleting the data.
‘n’ means do nothing.
The data selected is then deleted from the data base.
If the user is cleaning up the media, especially in the case of
the Hard Drive, the following can be entered instead of a
number:
# Select Delete selected file numbers
A-All Delete ALL files from the media data base.
P-Page Delete ALL files on the current page
displayed.
Control, K Operates like the SAVE command on the OB Graph display.
Pressing these two keys simultaneously from the PATIENT
LIST MENU display causes the system to save the current
patient data. See Storing Patient Information on
details.
4–8
for
4–16
LOGIQ 500 Advanced Reference Manual
2276614–100 Rev . 0
Page 63

Fetal Trend Management
Control, L The Control, L function allows the user to display the data list
for a selected patient file.
Press Ctrl, L simultaneously. The cursor moves to the number
window.
Type in the number from the list displayed on the screen and
press Return.
The data list for the patient selected is displayed on the screen
as shown in Figure 4–7.
PT NAME
PT ID
EDD (MM / DD / YY)
NUMBER :
List–Page :###/###
1 2 3 4 5 6 7 8
No GA MEAS1 MEAS2 MEAS3 MEAS4 MEAS5 MEAS6 MEAS7 MEAS8
UNIT1 UNIT2 UNIT3 UNIT4 UNIT5 UNIT6 UNIT7 UNIT8
AUTH1 AUTH2 AUTH3 AUTH4 AUTH5 AUTH6 AUTH7 AUTH8
123 ##W#D ###.# ###.# ###.# ###.# ###.# ###.# ###.# ###.#
123 ##W#D ###.# ###.# ###.# ###.# ###.# ###.# ###.# ###.#
123 ##W#D ###.# ###.# ###.# ###.# ###.# ###.# ###.# ###.#
123 ##W#D ###.# ###.# ###.# ###.# ###.# ###.# ###.# ###.#
123 ##W#D ###.# ###.# ###.# ###.# ###.# ###.# ###.# ###.#
Ctrl+N: Next Page
Ctrl+P: Prvs Page
Ctrl+F: Forward Page
[DATA LIST MENU]
: 12345678901234567890123456789
: 12345678901234
: 12 / 31 / 93
Meas–Page :###/###
Ctrl+G: Graph
Ctrl+D: Delete
Ctrl+B: Backward Page
Operator Message Area
Ctrl+K: Save
Ctrl +C: Cancel
Figure 4–7. Patient List-Data Menu
Page two of the Data List Menu shows the Number of studies,
Gestational Age (by LMP), Tech ID and Reference MD
information.
LOGIQ 500 Advanced Reference Manual
2276614–100 Rev . 0
4–17
Page 64

Fetal Trend Management
Control, M The Control, M function allows the user to modify the patient
data (Name, ID & EDD) on any file in the data base. This will
be helpful if the patient information was not entered EXACTLY
the same for each exam.
Press Ctrl, M simultaneously. The cursor moves to the number
window as shown in Figure 4–8.
Figure 4–8. Modified Data Entry
Type in the number from the list displayed on the screen and
press Return.
The selected patient information is displayed and the cursor
moves to the PT NAME window.
Use the Trackball to highlight the desired window and change
the necessary information with the alphanumeric keys. Once
the Return key is pressed while in the EDD window or the
Trackball is used to move the cursor outside of the patient
information area, the following message appears:
“ Are you sure to modify the previous data? (y/n) ”
where ‘y’ means modify the old data and save it. The cursor
moves to the PT Name window.
‘n’ means do nothing. The cursor moves to the PT Name
window.
If the desired modifications will create a file exactly like a
current existing file, the following message appears:
“Same data exists.”
4–18
LOGIQ 500 Advanced Reference Manual
2276614–100 Rev . 0
Page 65

Control, M (cont’d)
Fetal Trend Management
At this point the user may:
#C – Combine a selected number data file with the one
being modified. The file being modified will be added to the
file number selected.
Q – This will quit the sub mode operation and return to
the previous modification mode.
Control, S The Control, S function allows the user to quickly search the
NOTE: Caution should be used when modifying files so as not
to change/delete existing files or create false ones.
PATIENT LIST MENU data base for a specific patient file.
Press Ctrl, S simultaneously. The cursor moves to the PT
Name window as shown in Figure 4–9.
Figure 4–9. Search Data Entry
Use the Trackball to highlight the desired window and type the
necessary information with the alphanumeric keys. Once the
Return key is pressed while in the EDD window or the
Trackball is used to move the cursor outside of the patient
information area, the search functions begin.
When the search has ended, the list is displayed on the screen.
If the search ends in failure, the system may beep or the cursor
remains at the PT Name window and the following message is
displayed:
“No data exists. Input other information.”
At the end of the search, the patient information is placed in the
windows (Name, ID & EDD) of the file that most closely
matches the search criteria.
LOGIQ 500 Advanced Reference Manual
2276614–100 Rev . 0
4–19
Page 66

Fetal Trend Management
Data List Management
The LIST–DATA function allows the user to manage the
measurement/calculation data stored in a specific patient file.
Choose LIST–DATA from the OB Graph or the Control, L
function from the LIST–ID display. The system displays past
gestational age data for the same patient criteria displayed on
the OB Graph or for the information that was entered in the
List–ID display. Refer to Figure 4–10.
The measurement/calculation list order is based on gestational
age and cannot be rearranged.
PT NAME
PT ID
EDD (MM / DD / YY)
NUMBER :
List–Page :###/###
1 2 3 4 5 6 7 8
No GA MEAS1 MEAS2 MEAS3 MEAS4 MEAS5 MEAS6 MEAS7 MEAS8
UNIT1 UNIT2 UNIT3 UNIT4 UNIT5 UNIT6 UNIT7 UNIT8
AUTH1 AUTH2 AUTH3 AUTH4 AUTH5 AUTH6 AUTH7 AUTH8
123 ##W#D ###.# ###.# ###.# ###.# ###.# ###.# ###.# ###.#
123 ##W#D ###.# ###.# ###.# ###.# ###.# ###.# ###.# ###.#
123 ##W#D ###.# ###.# ###.# ###.# ###.# ###.# ###.# ###.#
[PATIENT DATA MENU]
: 12345678901234567890123456789
: 12345678901234
: 12 / 31 / 93
Meas–Page :###/###
123 ##W#D ###.# ###.# ###.# ###.# ###.# ###.# ###.# ###.#
123 ##W#D ###.# ###.# ###.# ###.# ###.# ###.# ###.# ###.#
Ctrl+N:Next Page
Ctrl+P:Prvs Page
Ctrl +A:Arrange
CLEAR:Clear entered characters
Data List Commands
Ctrl+L:Data List
Ctrl+D:Delete
Ctrl +S:Search
Operator Message Area
Ctrl+M:Modify
Ctrl+K:Save
Ctrl +C:Cancel
Figure 4–10. List-Data Menu
Some functions at the bottom of the data list screen operate the
same as those on the LIST–ID screen:
CTRL, N—Displays the next page
CTRL, P—Displays the previous page
CTRL, D—Deletes saved patient data.
CTRL, K—Saves the current patient data
CTRL, C—Cancels the current process
CLEAR—Clears entered characters
Functions specific to the LIST–ID display are:
CTRL, F—Moves to the right for the displayed page
CTRL, B—Moves to the left for the displayed page
CTRL, G—Displays the OB Graph
4–20
LOGIQ 500 Advanced Reference Manual
2276614–100 Rev . 0
Page 67

Fetal Trend Management
Control, F and Since only eight measurements/calculations can be displayed
Control, B on the screen at one time, Control F and Control B allow the
user to move to the right and left, respectively, to display
additional measurements/calculations.
Control, G Control, G enables the OB Graph function for the number of
files selected.
Press Ctrl, G simultaneously. The cursor moves to the number
window.
Type in the number from the list displayed on the screen and
press Return.
The selected OB Graph will be displayed and the
TREND–BOTH selection is highlighted.
LOGIQ 500 Advanced Reference Manual
2276614–100 Rev . 0
4–21
Page 68

OB–Multigestational
Overview
Patient Entry Menu
OB–Multigestational
(software option)
The LOGIQ 500 offers an optional calculation package that
allows the user to measure and report multiple fetus
development. The system is capable of reporting a maximum
of four fetuses.
If the Multigestational Option has been purchased, an extra
entry appears on the Patient Entry Menu to the right of
“RefMD:”. This entry is called “FETUS NUMBER:”. The factory
default number is one.
Entering Fetus Number
It is generally during the first exam that the user recognizes a
multiple gestation. If during the first exam more than one fetus
is imaged, the user can use the ID/Name key to return to the
Patient Entry Menu and enter the necessary number of fetuses.
For subsequent exams the user enters the correct number of
fetuses when the New Patient key is used.
NOTE: Data Management Center transfer function will not work
if the fetus number is greater than one. An error message will
appear:
“Multigestation data transfer is not supported”
DMC data transfer will function normally if the fetus number is
set to one.
4–22
LOGIQ 500 Advanced Reference Manual
2276614–100 Rev . 0
Page 69

Distinguishing Each Fetus
For measurements/calculations and report page displays, the
fetuses are labeled A, B, C and D.
Each fetus is distinguished on the report pages by its letter and
total number of fetuses. For example, a report page could be
noted as FETUS:A/3. This is fetus A from a total of 3.
Following this fetal number designation, the user can use
twelve characters to describe the position and twelve
characters to describe placenta location of the fetus. This is
displayed as:
POS: ############ PLAC: ############
Measurements/Calculations
During measurements/calculations, all measurements are
performed on fetus A first. The user then switches to fetus B
and performs the same measurements, etc.
OB–Multigestational
The user can switch between fetuses by pressing Blue Shift
and then N.
NOTE: A fetus change can be accomplished at anytime during
the exam. However, the Blue Shift, N function is NOT available
while a measurement cursor is active.
After changing to the next fetus, any measurements made will
be recorded and reported to the new designated fetus. Any
active measurement or calculation not completed will be
cancelled when the fetus number is changed.
LOGIQ 500 Advanced Reference Manual
2276614–100 Rev . 0
4–23
Page 70

OB–Multigestational
Change the Number of Fetuses
In the ID/Name function, the user can increase or decrease the
fetus number or cancel the Multigestational function. This
would need to be accomplished due to the demise of a fetus or
error in the definition of the fetus number.
Number Increase
If the fetus number has been increased on the Patient Entry
Menu, the message:
“Are you sure to change the number? (y/n)”
is displayed.
‘y’ will create the report pages for the new fetus.
‘n’ returns to the previous number.
If a fetus number increase is not available, the message: “Data
range over. Input proper data.” is displayed.
Number Decrease
If the fetus number has been decreased on the Patient Entry
Menu, the message:
“Are you sure to change the number? (y/n)”
is displayed.
‘y’ prompts the user to select which fetus to delete (A, B, C or
D).
‘n’ returns to the previous number.
The data of deleted fetuses is deleted for the measurement
result window and report pages. If the fetus number is reduced
to one, the multigestation function is cancelled.
After the decrease in fetus number, there is no need to adjust
the IDs (A, B, C or D) of the remaining fetuses. The same ID
for the remaining fetuses can be maintained and used.
4–24
LOGIQ 500 Advanced Reference Manual
2276614–100 Rev . 0
Page 71

Report Page Layout
OB–Multigestational
The Multigestational Option adds additional pages to the OB
Report displays.
Pages one and two of the Multigestational Option appear the
same as the Basic OB Reporting package; except, pages one
and two will be generated for each fetus. They will have the
fetus identifying information between the heading and
measurements. The fetal information displayed is:
“Fetus : $/% POS: ############ PLAC: ############”
$ = Fetal ID (A, B, C or D)
% = Total number of fetuses
The second to last page, depending on the number of fetuses,
is a summary of the measurements and calculations found on
page one. However, all fetuses (maximum of 4) are dipslayed
on this page. Since page one is different by region, page three
is also different by region selected (i.e. USA, European, Tokyo
University or Osaka University).
The last page, depending on the number of fetuses, is a
summary that compares all fetuses. The heading is different by
region. It contains the following:
Fetus Pos: Fetus position. This 12 character string is
common between pages 1, 2 and 4.
Fluid: An estimate of the amount of aminotic fluid.
Common between pages 2 and 4.
Biophys: Total biophysical profile score from page 2.
HR (BPM): Heart rate in beats per minute from page 2.
AFI (USA Only): Amniotic Fluid Index summary from page 2.
Placenta: Shows location fetus, grade and previa
(yes, no or partial)
Membrane: Shows location between fetus to fetus.
LOGIQ 500 Advanced Reference Manual
2276614–100 Rev . 0
4–25
Page 72

OB–Multigestational
OB Graph
With the Multigestational Option, the OB Graph selection
includes pages to display graphs for individual fetuses as well
as a graph to plot all fetuses simultaneously.
For individual fetus reports, the fetus is designated by fetus ID
and total number of fetuses (i.e. Fetus: A/3 or Fetus: B/2)
Change the fetus pages by moving the highlight cursor to ← or
and press Set.
Figure 4–11. OB Graph Multigestational Option (Osaka University Version)
4–26
LOGIQ 500 Advanced Reference Manual
2276614–100 Rev . 0
Page 73

OB Graph (cont’d)
OB–Multigestational
If all fetuses are displayed simultaneously, different symbols are
used to mark each fetus. The symbols are:
Fetus Present
A
B
C
D
*
Figure 4–12 OB Graph Multigestational Option (Osaka University Version)
Only gestational age, based on operator’s input, is displayed for
simultaneous plotting.
LOGIQ 500 Advanced Reference Manual
2276614–100 Rev . 0
4–27
Page 74

OB–Multigestational
Fetal Trend Management (Multigestational Option)
Fetal Trend Management with the Multigestational Option
operates much like the basic fetal trend package described
earlier. Figure 4–13 shows an example of the Multigestational
Fetal Trend Graph.
Figure 4–13. Fetal Trend Graph Multigestational Option (Hadlock-USA Version)
Save Function
The SAVE command on the trend graph display or Ctrl + K in the
Data List display will cause the system to compare the current fetus
combination between present and past data. If patient data and
fetus number are compatible, the data is saved.
If there is any mismatch in data, the message:
“Incompatible data. Do you save? (y/n)”
is displayed.
‘y’ = Saves data as it is
‘n’ = Cancel save function
4–28
LOGIQ 500 Advanced Reference Manual
2276614–100 Rev . 0
Page 75

Data List Menu
OB–Multigestational
The Data List Menu of fetal trend information is slightly different
with the Multigestational Option. Each fetus has it’s own display
page as shown in Figure 4–14.
Figure 4–14. Multigestational Data List Menu
LOGIQ 500 Advanced Reference Manual
2276614–100 Rev . 0
4–29
Page 76

Data Management Center (DMC)
Data Management Center (DMC)
Overview
The LOGIQ 500 is capable of interfacing with a personal
computer (PC). This interface is used to send OB, GYN and
Vascular measurement and calculation data from the
LOGIQ 500 to the PC for display, processing and evaluation.
Additionally, the LOGIQ 500 can accept patient data from a
personal computer (PC) and transfer it to the patient entry
menu.
Operational Setup
NOTE: Data Management Center transfer function will not work
if the fetus number is greater than one with the Multigestation
Option. An error message appears:
“Multigestation data transfer is not supported”
DMC data transfer will function normally if the fetus number is
set to one.
The PC must be connected to Port A or B of the LOGIQ 500
by an RS-232C interface cable. “Computer” must be selected
for Port A or B on the Set Up/System Parameters page 5.
The Record 1 or Record 2 keys must be assigned to the
computer selection. The Record 1 and Record 2 presets are
found on Set Up/Systems Parameters page 5.
4–30
LOGIQ 500 Advanced Reference Manual
2276614–100 Rev . 0
Page 77

Operational Setup (cont’d)
Figure 4–15. System Parameters Page 5
Data Management Center (DMC)
Transferring OB Data
Data transfer from the LOGIQ 500 to the DMC computer (PC)
will only occur while operating in the OB, GYN or Vascular
Exam categories.
The user should input all necessary information into the Patient
Entry Menu. Scan the patient. Measure and calculate all the
desired parameters.
Press Record 1 or Record 2, depending on the key assignment.
Communication with the PC will start by displaying the message:
“Communicating with computer now”.
NOTE: Normal system operation is suspended during the
transfer of data.
When all data has been transferred with no errors, the message
“Communication was completed” is displayed.
Refer to the DMC User Manual for processing exam data on the
PC.
LOGIQ 500 Advanced Reference Manual
2276614–100 Rev . 0
4–31
Page 78

Data Management Center (DMC)
Error Messages
If an anomaly occurs in the communication or transfer of data
between the LOGIQ 500 and the PC, an error message will
be displayed on the LOGIQ 500 screen. Possible error
messages are:
Message Possible Cause
Check Computer. No power. PC power is off. Interface cable broken or discon-
Check Computer. Bad condition. PC is busy. LOGIQ 500 senses the PC cannot
Check Computer. Abnormal response. LOGIQ 500 senses an abnormal response from
Check Computer. Checksum Error occurred. LOGIQ 500 senses an abnormal acknowledge-
Check Computer. No response. LOGIQ 500 senses no
Can’t send data to Computer in this category. User is trying to send data to the PC in an exam
System doesn’t have option. The OB calculation option for the LOGIQ 500 has
SYSTEM ERROR: CANNOT COMMUNICATE
WITH COMPUTER.
This function is not available. This function is not available in some situations.
nected.
accept data.
the PC.
ment from the PC after all data has been sent.
acknowledgement from the computer after all data
has been sent.
category other than OB, GYN or Vascular.
been turned off.
A LOGIQ 500 system error has occurred that will
not allow communication with the computer to begin.
Table 4–1. Data Management Center Error Messages
4–32
LOGIQ 500 Advanced Reference Manual
2276614–100 Rev . 0
Page 79

Error Messages (cont’d)
Data Management Center (DMC)
Hints
S Data transfer can only be accomplished in the OB, GYN
and Vascular Exam categories.
S Date is always transferred as Year–Month–Day. Time is
transferred as 24 hour time (i.e. 00:00 to 23:59).
S Gestational Age Data is always transferred in weeks and
days.
S The LOGIQ 500 can store three values of the same
measurement. Only the average of selected
measurements will be transferred.
S The system keyboard is locked out during the transfer of
data.
S Only the Record 1 or Record 2 keys can start the data
transfer.
S The following DMC items are not sent by the LOGIQ 500:
S Serial No.
S DateRep
S TimeRep
S RepPtName
S RefMDID
.
S History
S FetusPos
S FetusSex.
NOTE: Currently, the transfer of multi-fetus information is not
compatible with the DMC. If it is desired to use the DMC with
multiple fetuses, each fetus should be treated individually by
using a unique Patient ID number for each.
LOGIQ 500 Advanced Reference Manual
2276614–100 Rev . 0
4–33
Page 80

Data Management Center (DMC)
Patient Data Input
The PC (personal computer) can be used to read patient data
cards and transfer that data to the Patient Entry menu via the
DMC serial port connection.
Preparation
Connect the PC and LOGIQ 500 using an isolated RS232C
cable and serial ports equivalent to the DMC cabling.
Assign “Computer” to the proper LOGIQ 500 serial port in the
Setup/System Parameter Menu page 5.
Display the New Patient Entry Menu on the LOGIQ 500.
Send Data
On the PC, read the hospital ID card with patient data and
transfer that data to the LOGIQ 500. The transfer starts by
displaying the following message on the LOGIQ 500 monitor:
“Communicating with Computer now.”
When the reception is complete with no errors, the the following
message on the LOGIQ 500 monitor:
“Communication was Completed.”
The patient data received is then displayed on the Patient Entry
Menu.
4–34
LOGIQ 500 Advanced Reference Manual
2276614–100 Rev . 0
Page 81

Data Transferred
Error Messages
Data Management Center (DMC)
The data items transferred and accepted by the LOGIQ 500
are:
Patient Name
Patient ID Number
Patient Age
Patient Sex
Patient Birthday
Patient Height
Patient Weight
Patient Body Surface Area
Hints
Refer to Table 4–1 on
transfer.
If the New Patient Entry Menu is not displayed when the PC
tries to send data, the error message:
“Can’t receive data. Return to New Patient Menu.”
is displayed.
If data is omitted, only the items sent by the PC will be
displayed in the Patient Entry Menu.
If both age and birthday are transferred to the LOGIQ 500, the
system will use the birth date to calculate the age.
All LOGIQ 500 keys cannot be used while the data transfer is
in progress.
4–32
for error messages in patient data
LOGIQ 500 Advanced Reference Manual
2276614–100 Rev . 0
4–35
Page 82

Advanced Cardiac Calculations
Advanced Cardiac Calculations
Overview
This option provides additional measurement, calculation and
report capabilities to the Left-Ventricular calculations not found
in the basic cardiac option package.
Added to the basic package is the Gibson, Single Plane–DISC
and Bi-Plane–DISC methods of LV calculations. A page of
measurements is also added to the cardiac calculation menu.
This page varies with scan mode. Additional scan mode
measurement categories are:
B-Mode Parasternal Long Axis (PLAX), Parasternal
(AMCAL option)
Short Axis (PSAX) Aortic V alve, PSAX Mitral
Valve, PSAX Papillary Muscles, Apical 4
chamber, Apical 2 chamber
M-Mode Left/Right Ventricles, Mitral Valve, Aortic Valve,
Pulmonic V alve, Tricuspid Valve
D-Mode Mitral Valve, Aortic Valve, Pulmonic Valve,
Tricuspid Valve
The number and type of measurements vary for each
calculation. The formulas used are shown in the calculation
specification tables in this chapter.
4–36
LOGIQ 500 Advanced Reference Manual
2276614–100 Rev . 0
Page 83

Measurement Sequences
Each of the titles found in the first layer of the cardiac menu
consists of a sequence of measurements. The second layer
Sub-Menu consists of individual measurements/calculations
that can be performed in sequence or individually.
If the measurements are performed in sequence, the display
automatically returns to the first layer menu when all are
complete.
If the second layer Sub-Menu measurements are performed
individually, only those items measured are recorded on the
report page.
Sequence Philosophy
The primary philosophy of the cardiac calculation package is for
the user to select an item from the first menu layer. The system
then prompts the user to perform a series of measurements in
sequence. This measurement sequence can be modified by
the user if the factory sequence is not satisfactory.
Advanced Cardiac Calculations
Hints
This operation should not be confused with the Auto Sequence
top menu selection. Items programmed into an auto sequence
can consist of first layer sequences as well as individual
measurements. Together these form a sequence of
measurements and calculations that may be performed
automatically.
If a measurement in a sequence has already been made, it may
be skipped. The system will invoke the next measurement in
the sequence.
Pressing the top of the Ellipse rocker switch skips a
measurement in the sequence.
Pressing the bottom of the Ellipse rocker switch moves back to
measurements previously skipped.
Press the Clear key to quit a sequence at any time. The final
calculation result can not be obtained.
LOGIQ 500 Advanced Reference Manual
2276614–100 Rev . 0
4–37
Page 84

Advanced Cardiac Calculations
Re-measurement
Overview
Values obtained during Advanced Cardiac calculations or after
a calculation sequence has been completed can be
re-measured as long as those measurement results remain
displayed on the screen.
However, once the measured values are deleted from the
display by the CLEAR function or by scrolling off the top of the
measurement display area, re-measurement is not possible.
Operation Method
1. Complete the calculation or calculation sequence.
2. Measurements and resultant calculations will be
displayed in the designation area. Only those
measurements displayed are available for
re-measurement.
3. Press the Measurement key and the top of the Ellipse
rocker switch. The first measurement available to be
re-measured will be highlighted and the name is
duplicated at the bottom of the measurement display
area.
4–38
4. Use the Ellipse rocker switch to select the desired
value to re-measure.
Calculations and generic measurements are not
available to be re-measured and will be skipped in the
selection process.
NOTE: The re-measurement function is not available with the
Single Plane DISC and Bi-Plane DISC methods.
LOGIQ 500 Advanced Reference Manual
2276614–100 Rev . 0
Page 85

Operation Method (cont’d)
5. Perform the necessary measurement steps for the
If additional re-measurements need to be performed, repeat the
previous steps.
Advanced Cardiac Calculations
selected value using the Trackball and Set key.
When the Set key is pressed to complete the
re-measurement:
The resultant value of the selected item and all
related calculations will be recalculated and
displayed on the screen.
The new result will be entered on the report page.
The old measurement is deleted from the screen
and report page as it is replaced by the new value.
Hints
Each value of an M-Mode continuous sequence can be
remeasured separately.
If a measurement is selected from the soft-menu during the
re-measure process, the re-measurement process is cancelled
and the old value is restored.
After a re-measurement is complete (fixed), the old graphic is
erased and the same cursor symbols are used for the
remeasured value.
If two or more identical measurement items are displayed in the
calculation result area, only the last one supports
re-measurement.
The re-measurement of Heart Rate is always manual, even
though Auto Heart Rate is selected as a preset.
There is no automatic compare function for Systole/Diastole.
It is not possible to do re-measurements on VCR playback
values in Image Memory.
Re-measurement is not possible during a calculation sequence.
Only after the sequence is compiled.
Once cleared or erased, measurements cannot be recalled for
re-measurement.
LOGIQ 500 Advanced Reference Manual
2276614–100 Rev . 0
4–39
Page 86

Advanced Cardiac Calculations
Automatic Determination of Systole and Diastole
The system can be programmed to automatically determine the
cardiac phase as systole or diastole. The parameter in the
Setup/Preset Program Sub-Menu page 3 used to make this
selection is:
Diastole/Systole Determination : Manual Auto
The auto determination of systole/diastole can be fine tuned
using the following parameters also found in Set Up/Preset
Program page 3:
R Delay Time of End Systole Prior Edge : 0–2000msec
End Systole Period from Prior Edge : 0–2000msec
Automatic
If Auto is selected, the determination is made by comparing the
displayed B-Mode or M/D Mode image frames with the R-point
on the ECG wave. Therefore, ‘s’ for systole and ‘d’ for diastole
is added automatically to the measurement or calculation name.
If phase cannot automatically be determined, the system
displays the following message:
“Diastole (‘d’) or Systole (‘s’) ?”
Entering ‘d’ or ‘s’ are the only two acceptable inputs.
‘s’ Erases the message, recognizes the
phase as systole and adds a ‘s’ to the end
of the measurements or calculations.
‘d’ Erases the message, recognizes the
phase as diastole and adds a ‘d’ to the end
of the measurements or calculations.
The user will not be able to perform measurements of the
opposite phase until the next image change is made.
4–40
LOGIQ 500 Advanced Reference Manual
2276614–100 Rev . 0
Page 87

Automatic (cont’d)
Manual
Advanced Cardiac Calculations
When the measurement phase requested by the system is
different than the phase of the cursor position, the following
message is displayed:
“Display ######### image”
######### represents the phase opposite of the one just
completed.
Auto determination of systole/diastole is only available on a
frozen image. It cannot be done on a recalled image or one
from an external video input.
If Manual is selected, each measurement has a ‘s’ or ‘d’ at the
end of it’s name. The system will not determine the phase or
ask the operator to make that determination.
Auto Trace Measurements
Doppler measurement menus (D-AV, D-MV, D-PV and D-TV)
each have a selection called Auto Trace. When the user
selects Auto Trace, the start point and end point of a
measurement is set. After the end point is set, the system
traces the waveform and automatically calculates the values as
follows:
Ao Auto Trace: (Set start and end points for FVI-AV)
Calculates: FVI-AV, MaxPG, MeanPG, Ejection Time, AccT,
MV Auto Trace: (Set start and end points for FVI)
Calculates: FVI, MaxPG, MeanPG, Pressure Half Time, MV
PV Auto Trace: (Set start and end points for FVI-PV)
Calculates: FVI-PV, MaxPG, MeanPG, AccT, DecT, PFV,
TV Auto Trace: (Set start and end points for FVI)
Calculates: FVI, MaxPG, MeanPG, Pressure Half Time,
DecT, PFV and Mean-V
Area, AccT, DecT, PFV, Mean-V and Ejection
Time
Mean-V and Ejection Time
AccT, DecT, PFV, Mean-V and Ejection Time
LOGIQ 500 Advanced Reference Manual
2276614–100 Rev . 0
4–41
Page 88

Advanced Cardiac Calculations
Continuous M-Mode Measurements
When M-Mode measurements can be taken on the same
timeline, the system will support a continuous measurement of
all values along that line.
This can be done because the end point of one measurement is
the start point of the next measurement. After the end point of
the last measurement is set, keystrokes are reduced by not
having to set the next start point.
RVDd
IVSd
L VIDd
L VPWd
Figure 4–16. Continuous M-Mode Measurements
This type of M-Mode measurements is supported by M-LV/RV,
Teichholz, Cubed and Gibson menu selections.
After selecting the measurement sequence, use the Trackball
to position the first cursor and press Set. The name of the first
value appears; use the Trackball to position the cursor at the
end of the first measurement and press Set. This is the start
point of the next measurement. The name of the next
measurement appears; use the Trackball to position the end
point of the second measurement and press Set.
This process continues until all measurements are taken.
RV
IVS
LV
L VPW
4–42
LOGIQ 500 Advanced Reference Manual
2276614–100 Rev . 0
Page 89

Advanced Cardiac Calculations
Continuous M-Mode Measurements (cont’d)
Hints
The Ellipse rocker switch is used to skip measurements or
move back to measurements that were skipped.
Before the end point is set, uncompleted measurements can be
removed by pressing Clear once. That measurement can then
be started again.
Measurements can be taken in Zoom mode as long as the
magnification is not changed during the measurement process.
Measurements can be programmed not to appear in the
continuous measurement sequence in the Set Up/Preset
Program menu pages 5 and 6.
If the measurement is set to OFF in the Preset Program menus,
it will not appear in the continuous sequence. Additional Set
points will have to be made if measurements are skipped in the
continuous sequence.
Advanced Cardiac Calculations Measurement Menus
The illustrations that follow show the Advanced Cardiac
Calculation measurement Sub-Menus that are available with
the AMCAL option.
Each selection in the first layer of Sub-Menus will yield a
second layer of Sub-Menus. This second layer contains
measurements and calculations necessary to complete the
category or goal selected in the first layer.
The illustrations shown are those that result if the determination
of systole/diastole is set to Automatic and then Manual.
LOGIQ 500 Advanced Reference Manual
2276614–100 Rev . 0
4–43
Page 90

Advanced Cardiac Calculations
AMCAL Sub-Menus (First Layer)
4–44
Figure 4–17. First Layer Sub-Menus
LOGIQ 500 Advanced Reference Manual
2276614–100 Rev . 0
Page 91

Advanced Cardiac Calculations
AMCAL Sub-Menus (Second Layer)—Automatic Determination of
Systole/Diastole
Figure 4–18. Cubed, Teichholz and Gibson Sub-Menus
Figure 4–19. LV Bullet Sub-Menus
LOGIQ 500 Advanced Reference Manual
2276614–100 Rev . 0
4–45
Page 92

Advanced Cardiac Calculations
AMCAL Sub-Menus (Second Layer)—Automatic Determination of
Systole/Diastole (cont’d)
Figure 4–20. LV SP–DISC Sub-Menus
Figure 4–21. LV BP–DISC Sub-Menus
4–46
LOGIQ 500 Advanced Reference Manual
2276614–100 Rev . 0
Page 93

Advanced Cardiac Calculations
AMCAL Sub-Menus (Second Layer)—Automatic Determination of
Systole/Diastole (cont’d)
Figure 4–22. Modified Simpson’s Rule Sub-Menus
Figure 4–23. Single Plane Ellipsoid Sub-Menus
LOGIQ 500 Advanced Reference Manual
2276614–100 Rev . 0
4–47
Page 94

Advanced Cardiac Calculations
AMCAL Sub-Menus (Second Layer)—Automatic Determination of
Systole/Diastole (cont’d)
Figure 4–24. Biplane Ellipsoid Sub-Menus
Figure 4–25. PLAX Sub-Menus
4–48
LOGIQ 500 Advanced Reference Manual
2276614–100 Rev . 0
Page 95

Advanced Cardiac Calculations
AMCAL Sub-Menus (Second Layer)—Automatic Determination of
Systole/Diastole (cont’d)
Figure 4–26. PSAX-AV Sub-Menus
Figure 4–27. PSAX-MV Sub-Menus
Figure 4–28. PSAX-PAP Sub-Menus
LOGIQ 500 Advanced Reference Manual
2276614–100 Rev . 0
4–49
Page 96

Advanced Cardiac Calculations
AMCAL Sub-Menus (Second Layer)—Automatic Determination of
Systole/Diastole (cont’d)
Figure 4–29. AP-4CH Sub-Menus
Figure 4–30. AP-2CH Sub-Menus
4–50
LOGIQ 500 Advanced Reference Manual
2276614–100 Rev . 0
Page 97

Advanced Cardiac Calculations
AMCAL Sub-Menus (Second Layer)—Automatic Determination of
Systole/Diastole (cont’d)
Figure 4–31. M-LV/RV Sub-Menus
Figure 4–32. M-MV Sub-Menus
Figure 4–33. M-AV Sub-Menus
LOGIQ 500 Advanced Reference Manual
2276614–100 Rev . 0
4–51
Page 98

Advanced Cardiac Calculations
AMCAL Sub-Menus (Second Layer)—Automatic Determination of
Systole/Diastole (cont’d)
Figure 4–34. M-PV Sub-Menus
Figure 4–35. M-TV Sub-Menus
Figure 4–36. D-MV Sub-Menus
4–52
LOGIQ 500 Advanced Reference Manual
2276614–100 Rev . 0
Page 99

Advanced Cardiac Calculations
AMCAL Sub-Menus (Second Layer)—Automatic Determination of
Systole/Diastole (cont’d)
Figure 4–37. D-AV Sub-Menus
Figure 4–38. D-TV Sub-Menus
LOGIQ 500 Advanced Reference Manual
2276614–100 Rev . 0
4–53
Page 100

Advanced Cardiac Calculations
AMCAL Sub-Menus (Second Layer)—Automatic Determination of
Systole/Diastole (cont’d)
Figure 4–39. D-PV Sub-Menus
4–54
LOGIQ 500 Advanced Reference Manual
2276614–100 Rev . 0
 Loading...