

Page 1
Pilot’s Handbook
As Real As It Gets
Page 2

Information in this document is subject to change without notice. The names of companies, products,
people, characters, and/or data mentioned herein are fictitious, and are in no way intended to represent
any real individual, company, product, or event, unless otherwise noted. No part of this document may be
reproduced or transmitted in any form or by any means, electronic or mechanical, for any purpose,
without the express written permission of Microsoft Corporation. Microsoft may have patents or pending
patent applications, trademarks, copyrights, or other intellectual property except as expressly provided in
any written license agreement from Microsoft.
© 1983-1997 Microsoft Corporation. All rights reserved.
Microsoft, MS-DOS, SideWinder 3D Pro, Windows, and the Windows logo are either registered
trademarks or trademarks of Microsoft Corporation in the United States and/or other countries.
Microsoft Flight Simulator scenery designed for Microsoft Corporation by MicroScene, Inc. under
contract, and produced by the Microsoft Corporation.
Airport charts were reproduced with permission of Jeppesen Sanderson, Inc. © 1991, 1992, 1993, 1994,
1995, 1997 Jeppesen Sanderson, Inc.
FlightSafety International is a registered trademark of FlightSafety International, Inc.
This product is for entertainment purposes only and shall not be used for training purposes. It is not part
of an approved training program under the standards of the FAA or any other regulatory authority.
Document No. 000-61938
Page 3

Contents
Welcome to Microsoft Flight Simulator 98
Installing Flight Simulator......................................................1
Starting Flight Simulator ........................................................ 2
What’s New in Flight Simulator............................................. 2
Area Charts, Airport Diagrams, and Approach Charts
Atlanta .................................................................................... 8
Charlotte ............................................................................... 10
Chicago.................................................................................12
Cleveland..............................................................................15
Dallas....................................................................................17
Denver .................................................................................. 19
Detroit...................................................................................21
Hawaii................................................................................... 23
Houston.................................................................................28
Los Angeles.......................................................................... 30
Miami....................................................................................34
New Orleans.........................................................................36
New York ............................................................................. 38
San Diego ............................................................................. 41
San Francisco........................................................................ 43
Seattle ................................................................................... 45
Caribbean.............................................................................. 48
London.................................................................................. 57
Munich.................................................................................. 59
Paris...................................................................................... 61
Japan..................................................................................... 63
....................................
.................
1
6
Page 4

Page 5

Welcome to
Microsoft Flight Simulator 98
Welcome to Microsoft® Flight Simulator 98. Follow these simple
installation and starting instructions, and you’ll be ready for takeoff
before you know it.
Installing Flight Simulator
1. Turn on your computer and start Microsoft Windows 95 or
Windows NT Workstation 4.0.
2. Place the Flight Simulator CD-ROM in the disc holder (if
required), and insert it in your CD-ROM drive.
3. Follow the instructions when the installation screen appears.
NOTE If your CD-ROM drive does not support automatic
installation, follow these steps:
4. Click Start.
5. Point to Settings, and then click Control Panel.
6. Double-click Add/Remove Programs.
During Setup, you can select a
or
conserve hard disk space, choose the
Typical
performance, choose
are an advanced user and want to
select and configure components
yourself, choose
installation. If you need to
Custom
setup option. To optimize flying
Custom
Custom
Typical
. If you
.
7. Windows 95 or NT Workstation 4.0 displays the Add/Remove
Programs Properties dialog box.
8. On the Install/Uninstall tab, click Install.
Follow the instructions on your screen.
Microsoft Flight Simulator 98 — Pilot’s Guide
If you experience any performance
problems once you’re up in the air (for
example, slow response time or jerky
screen displays), check the “Using
Flight Simulator” section of Help for
suggestions on fine-tuning Flight
Simulator.
1
Page 6
Welcome to Microsoft Flight Simulator 98
Starting Flight Simulator
To start Flight Simulator automatically, place the Flight
•
Simulator CD-ROM in the disc holder (if required), and insert it
in your CD-ROM drive.
-or-
If you created a shortcut to Flight Simulator on your desktop,
•
double-click the icon.
-or-
Click the
•
, point to
Games
Flight Simulator 98
button, point to
Start
Flight Simulator
Programs
, and then click
.
, point to
Microsoft
What’s New in Flight Simulator 98
The best gets better with Flight Simulator 98. Here are some of the
exciting features and technological improvements you’ll find in
Flight Simulator 98.
Three New Aircraft
Your hangar of eight aircraft now includes a challenging Bell 206B
JetRanger III helicopter, the latest Cessna Skylane 182S, and the
Learjet 45. You’ll also find improved versions of Flight Simulator
veterans, including a Cessna Skylane RG, an Extra 300S, a Boeing
737-400, a Schweizer 2-32 sailplane, and a Sopwith Camel. The
flight models for these aircraft have been validated by experts,
including Cessna, Learjet, FlightSafety International, and Patty
Wagstaff. To find detailed information about each aircraft, click
Aircraft Handbooks
on the
Help
menu.
Improved Instrument Panels
New photorealistic panels put you in the pilot’s seat. Developed
from photographs of the actual cockpits, the new panels are easier to
read and feature more sophisticated avionics, autopilots, and other
systems. The panels scale automatically to match your screen
resolution, and on many panels you can display radios, detailed
engine controls, and other items in separate windows as you fly.
When you master the basic instruments in the Cessna Skylane 182S,
try to keep up with the latest electronic displays in the Learjet 45. If
you feel a bit overwhelmed, just point to an instrument or control to
see a pop-up label, or click an item to learn more about how it
works.
Microsoft Flight Simulator 98 — Pilot’s Guide
2
Page 7
Feel the Force
If you have a force-feedback joystick like the Microsoft
SideWinder
new level of realism in Microsoft Flight Simulator 98. You’ll feel
your wheels rolling down the runway and the stick shake in a stall,
sense trim forces as you change speeds and power settings, and
encounter other effects that make pulling Gs more than a game. To
set options for a force-feedback joystick, click
the
Options
Force Feedback Pro joystick, you can experience a
®
Custom Controls
menu and then click the
Forces
tab.
on
New Sights and Sounds
3-D acceleration using DirectX and other advanced graphics
technology make scenery pop to life. Flight Simulator supports the
latest graphics hardware to show you more detail and improved
performance. Even if you don’t have 3-D hardware, new mipmapping and image-smoothing techniques improve the out-thewindow view. Of course, what you see is just part of the picture.
New digitized sounds—from wind noise and tire squeals to whining
jet turbines and electronic warnings—immerse you in a realistic
flying environment. To set sound options, click
Options
menu and then click the
Display & Sound
Preferences
tab.
on the
Multiplayer
Multiplayer capability puts you in crowded skies via the Internet
Gaming Zone (http://www.zone.com), a network, or a direct
connection between two computers. Challenge other pilots to an
aerobatic competition on the Internet Gaming Zone. Join a fly-in on
a network. Chase other aircraft through an urban obstacle course.
Practice formation aerobatics for an airshow. Enter the traffic pattern
at a busy airport. Or put yourself in the control tower and try to keep
everyone else organized. To join or host a multiplayer session, click
Multiplayer
your screen.
on the
menu and follow the instructions on
Flights
Welcome to Microsoft Flight Simulator 98
More Airports and Scenery
Flight Simulator 98 gives you the globe. You can take off from more
than 3,000 airports worldwide—10 times more than in previous
versions. You’ll also find detailed scenery, including atlas data
(roads, rivers, lakes) for the U.S. and Europe and over 45 new
metropolitan areas, including more than 20 new U.S. cities and new
photorealistic scenery of Hong Kong. And if you like to fly low,
Microsoft Flight Simulator 98 — Pilot’s Guide
3
Page 8
Welcome to Microsoft Flight Simulator 98
watch out for thousands of new buildings, towers, antennas, and
other obstacles. To set scenery options, click
on the
ground traffic. Click
menu. You can also control dynamic scenery—air and
World
Dynamic Scenery
New Adventures
Try a cross-Channel hop from Paris to London or take command of
an airline flight from LAX to JFK. A logbook full of new
adventures will have you taking off on realistic flights with air
traffic control instructions, emergencies, and other surprises that test
your skills. To make sure you’re prepared before each flight, review
the Preflight Briefings. To see these topics, click
Briefings
on the
Flights
on the
menu.
menu. To fly an adventure, click
Help
Flight School
Whether you’re a novice or seasoned Flight Simulator pilot, you’ll
find more lessons to hone your flying skills. You can try
introductory flights to learn the basics of flying a specific aircraft, or
take advanced lessons on such skills as ILS approaches and holding
patterns. To review background information about aerodynamics,
aircraft systems, navigation, and other subjects, click
on the
Preflight Briefings that prepare you for each lesson. To see these
topics, click
click
menu. Before you take off, make sure you review the
Help
Preflight Briefings
Lessons
on the
Flights
on the
menu.
Scenery Complexity
on the
menu. To fly a lesson,
Help
World
Preflight
Pilot Training
menu.
Adventures
An Online Aviation Library
The updated online Help includes topics on subjects from
aerodynamics and advanced flying techniques to aircraft instruments
and systems, weather, navigation, regulations, and human factors.
Videos and animations bring key concepts to life, while more than
200,000 words of text take you deep into the real-world details of
flying. To explore Help, click
you need information about a specific aircraft, the Aircraft
Handbooks section of Help includes checklists, operating
procedures, and performance statistics. To see these handbooks,
click
Aircraft Handbooks
Microsoft Flight Simulator 98 — Pilot’s Guide
4
on the
Pilot Training
menu.
Help
on the
Help
menu. If
Page 9

Globe Trotting
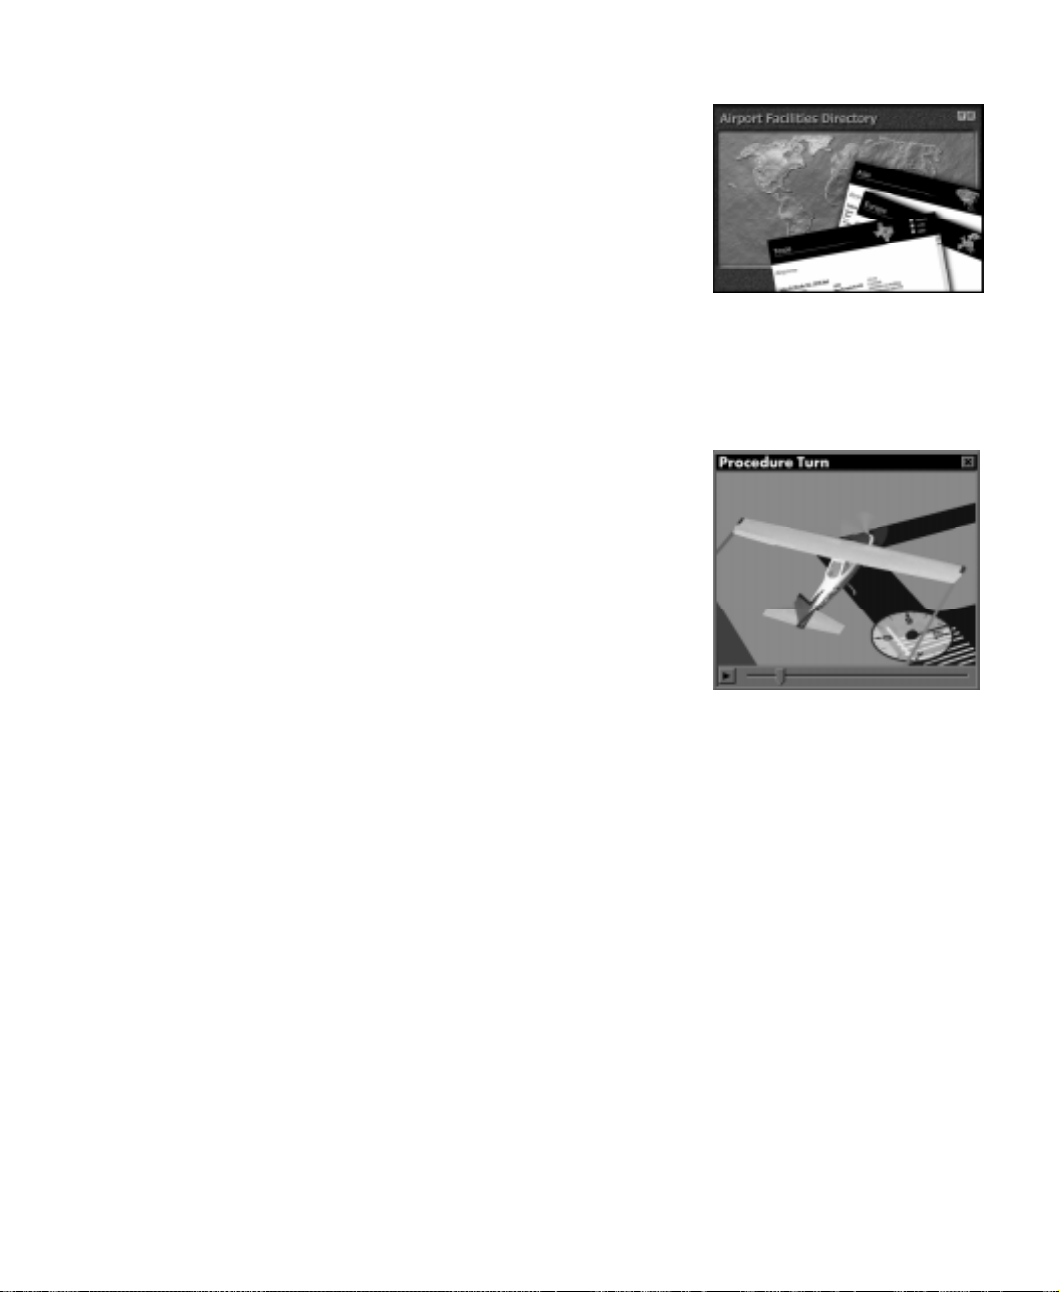
The improved Airport/Facility Directory (A/FD) and Go To features
help you enjoy the world of airports and scenery in Flight Simulator
98. The powerful search features in the A/FD make it easy to find
detailed information about the airports and navigation aids in the
Flight Simulator database. To use the A/FD, click
Directory
You can also start a flight quickly at any airport or at a specific
location and altitude. Just click
in the appropriate information.
on the
World
menu.
Go To
on the
Airport/Facility
menu and fill
World
Web Links
The latest information about Flight Simulator is just a mouse click
away. Links from the Help menu take you directly to the official
Microsoft Flight Simulator Web site at
http://www.microsoft.com/games/fsim. You’ll find articles about
flying and Flight Simulator, technical support, links to other sites
devoted to Flight Simulator, and more. To see these links, point to
Microsoft On The Web
on the
Help
menu.
Get Help Fast
Help includes tips, hints, and detailed procedures to help you get the
most out of Flight Simulator. Click
menu, or click
Help
customizing Flight Simulator, improving performance, changing the
weather, flying lessons and adventures, keyboard shortcuts, and so
forth. And don’t forget to check the back cover of this book for a list
of basic keyboard shortcuts.
to locate specific information about
Index
Using Flight Simulator
on the
Welcome to Microsoft Flight Simulator 98
Flight Simulator in the Classroom
Flight Simulator is a terrific tool to introduce students to aviation,
math, geography, physics, and related subjects. The Teacher’s
Activity Guide available on the Flight Simulator Web site has lesson
plans, student worksheets, and links to resources that educators can
use in the classroom. You can find the Teacher’s Activity Guide for
Flight Simulator at: http://www.microsoft.com/games/fsim/tag/tagintro.htm.
Microsoft Flight Simulator 98 — Pilot’s Guide
5
Page 10

Welcome to Microsoft Flight Simulator 98
Area Charts, Airport Diagrams,
and Approach Charts
This Pilot’s Handbook includes charts for some of the most
interesting areas you can visit in Flight Simulator 98. On the pages
that follow, you’ll find area charts to help you navigate around
major cities and geographic areas, plus a selection of airport
diagrams and instrument approach charts to help you find your way
to specific runways.
Airport/Facility Directory
Flight Simulator 98 includes an improved Airport/Facility Directory
(A/FD) with powerful search features to help you find information
about the airports and navigation aids in the Flight Simulator
database. For example, you can look up airports by their official
identifiers or names, or by searching global regions, countries, states
or provinces, or cities. For each airport you can find the field
elevation, latitude/longitude, runway numbers and lengths, and
information about instrument approaches. You can also look up the
location, frequency, and other information about each VOR and
NDB in the database.
To use the A/FD, click
menu. For more information about using the Airport/Facility
Directory, see the topic “Using the Airport/Facility Directory” in
online Help.
Microsoft Flight Simulator 98 — Pilot’s Guide
6
Airport/Facility Directory
on the
World
Page 11
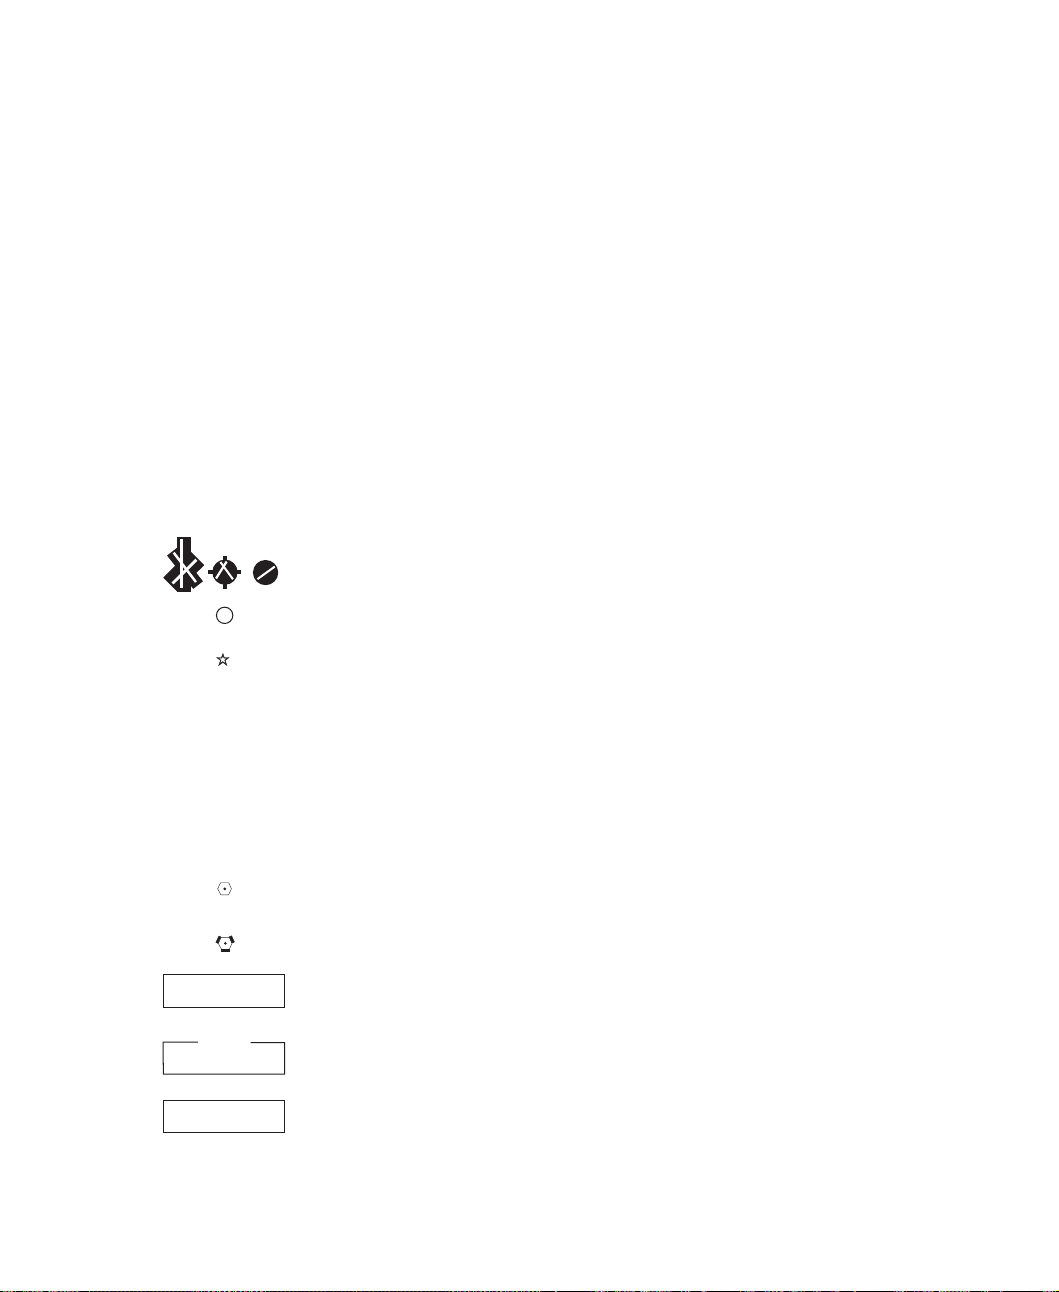
Chart Legend
The following charts are simplified versions of real navigation
charts. They include basic information to help you find airports,
navigation aids, and some visual checkpoints. The legend explains
the symbols on the charts.
You can quickly move your aircraft to any airport or to a specific
location defined by latitude and longitude. To do so, click the
command on the
Go To
information.
For detailed information about all the airports and navigation aids in
the Flight Simulator database, check the Airport/Facility Directory
(A/FD). To use the A/FD, click
menu. For more information about using the Airport/Facility
World
Directory, see the topic “Using the Airport/Facility Directory” in
Help.
Legend
Civil-Public use airport
menu and fill in the appropriate
World
Airport/Facility Directory
on the
Welcome to Microsoft Flight Simulator 98
R
NAME
CT 124.4
206
NAME
ATIS 118.0
NFCT
JOLIET
112.3
VOR (T)
KANKAKEE
111.6
KEDZI
248
Restricted/Private-Nonpublic use airport,
having emergency use or landmark value
Rotating light in operation, sunset to sunrise
Airport name
Control T ower (CT)-Primary frequency
Elevation in feet
Airport name
Automatic T erminal Inf ormation Ser viceCommunication radio frequency
Non-Federal Control Tower
VOR (VHF Omni Range)-Civilian
navigation board
VORTAC (VHF Omni Range T ACAN )-
Civilian and military navigation beacon
VOR-Navigation radio frequency
VOR(T)-Terminal VOR
NDB (Non-directional radio beacon) frequency
Microsoft Flight Simulator 98 — Pilot’s Guide
7
Page 12
Microsoft
Flight
Simulator
For use with
Microsoft Flight Simulator
®
05
®
0
5
NAUTICAL
MILES
STATUTE
MILES
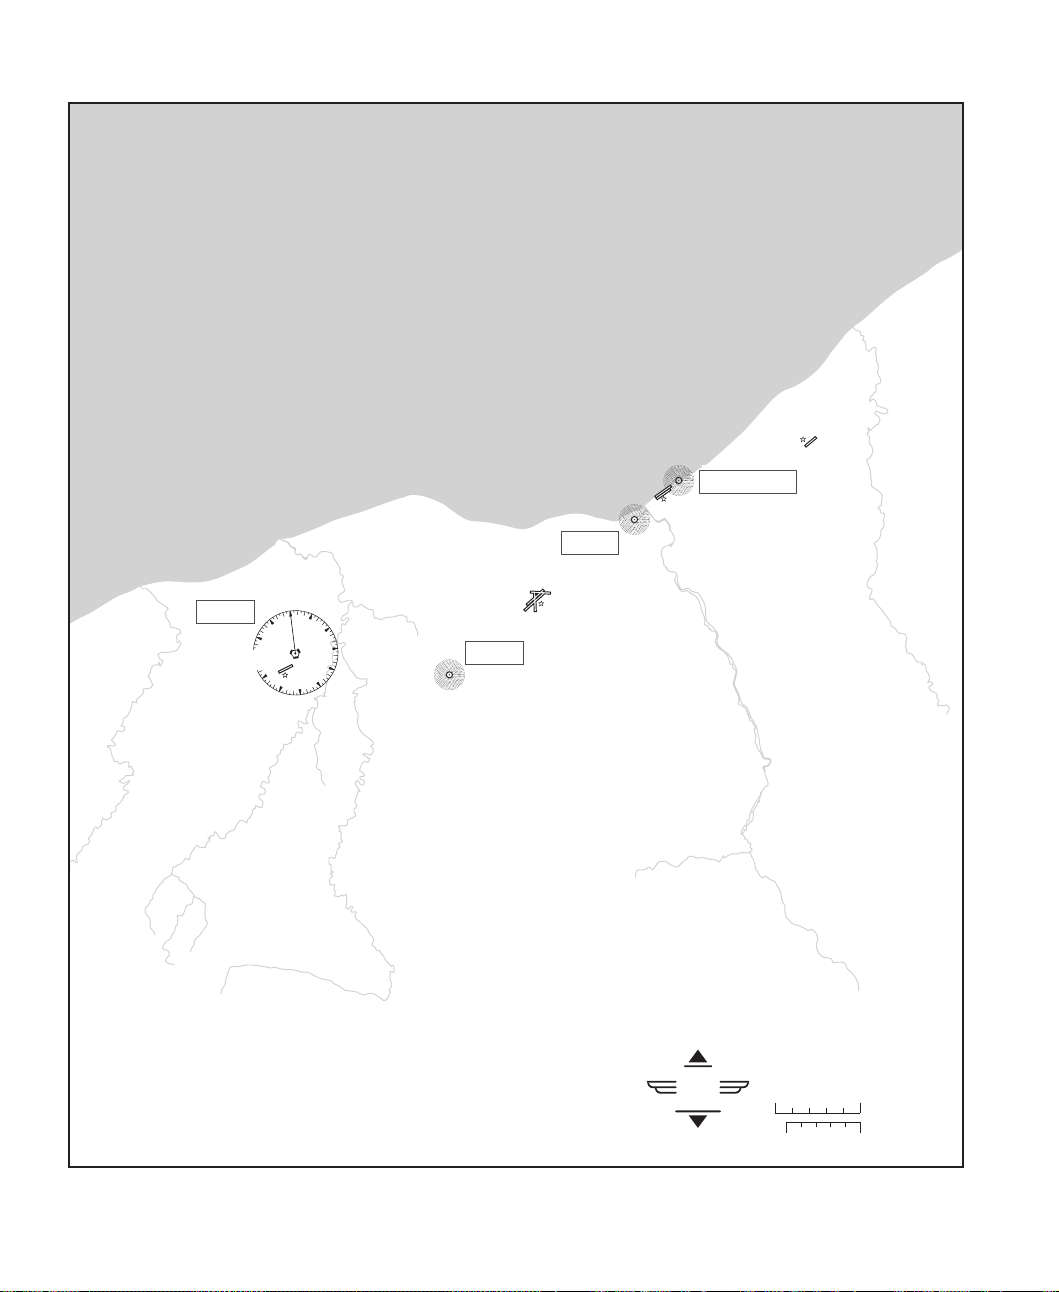
FLANC
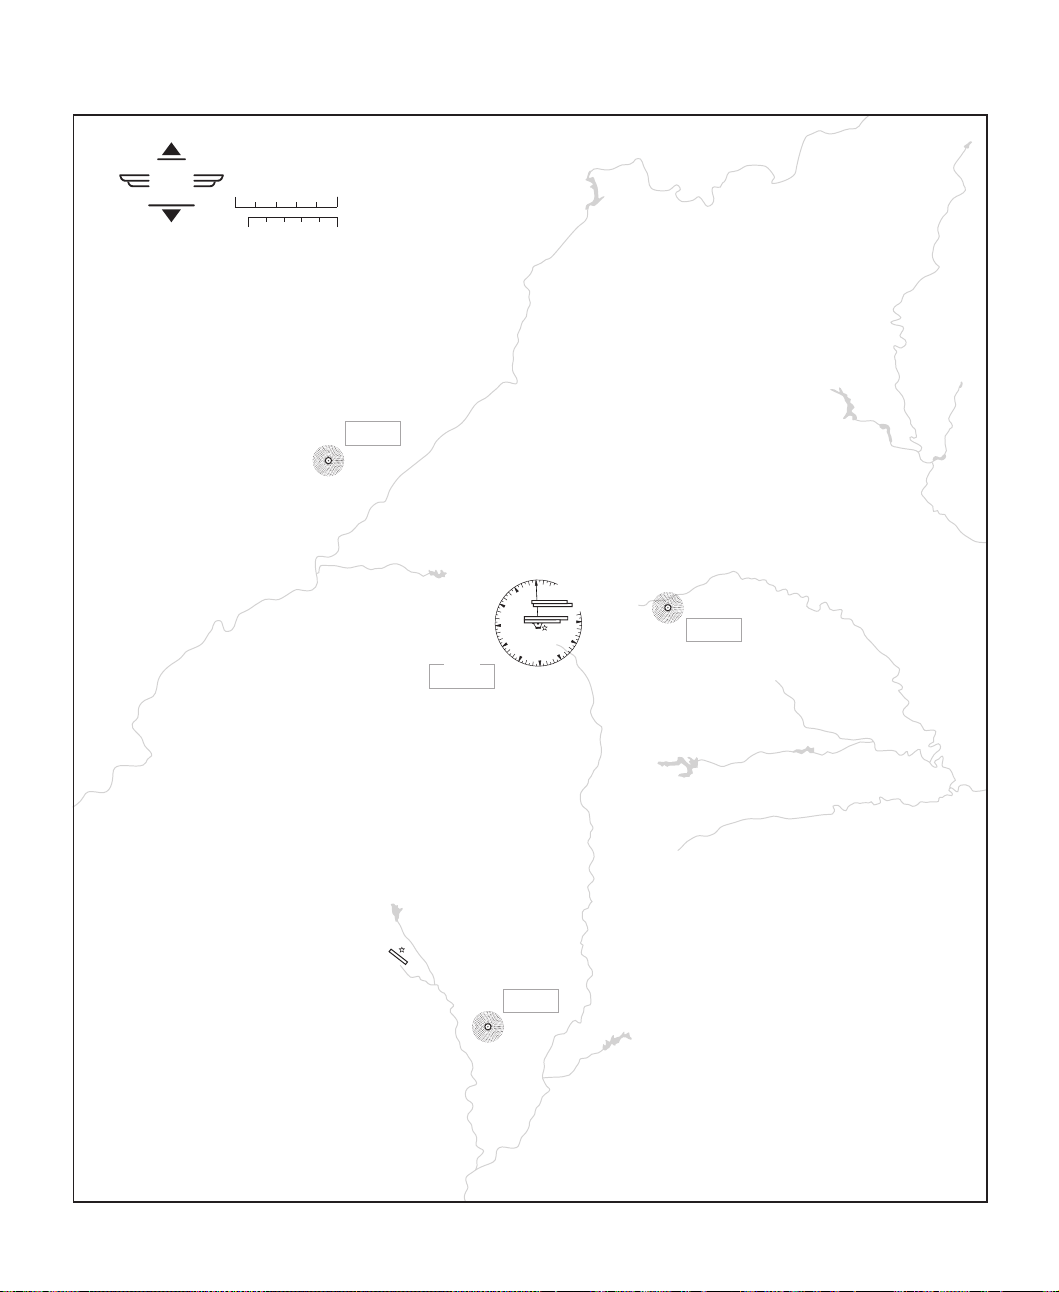
Atlanta
344
HARTSFIELD ATLANT A INTL
0
ATIS 119.65
33
1026
9
21
12
15
18
REDAN
266
VORTAC
ATLANTA
116.9
30
27
24
Microsoft Flight Simulator 98 — Pilot’s Guide
8
PEACHTREE-FALCON
808
PECAT
316
Page 13
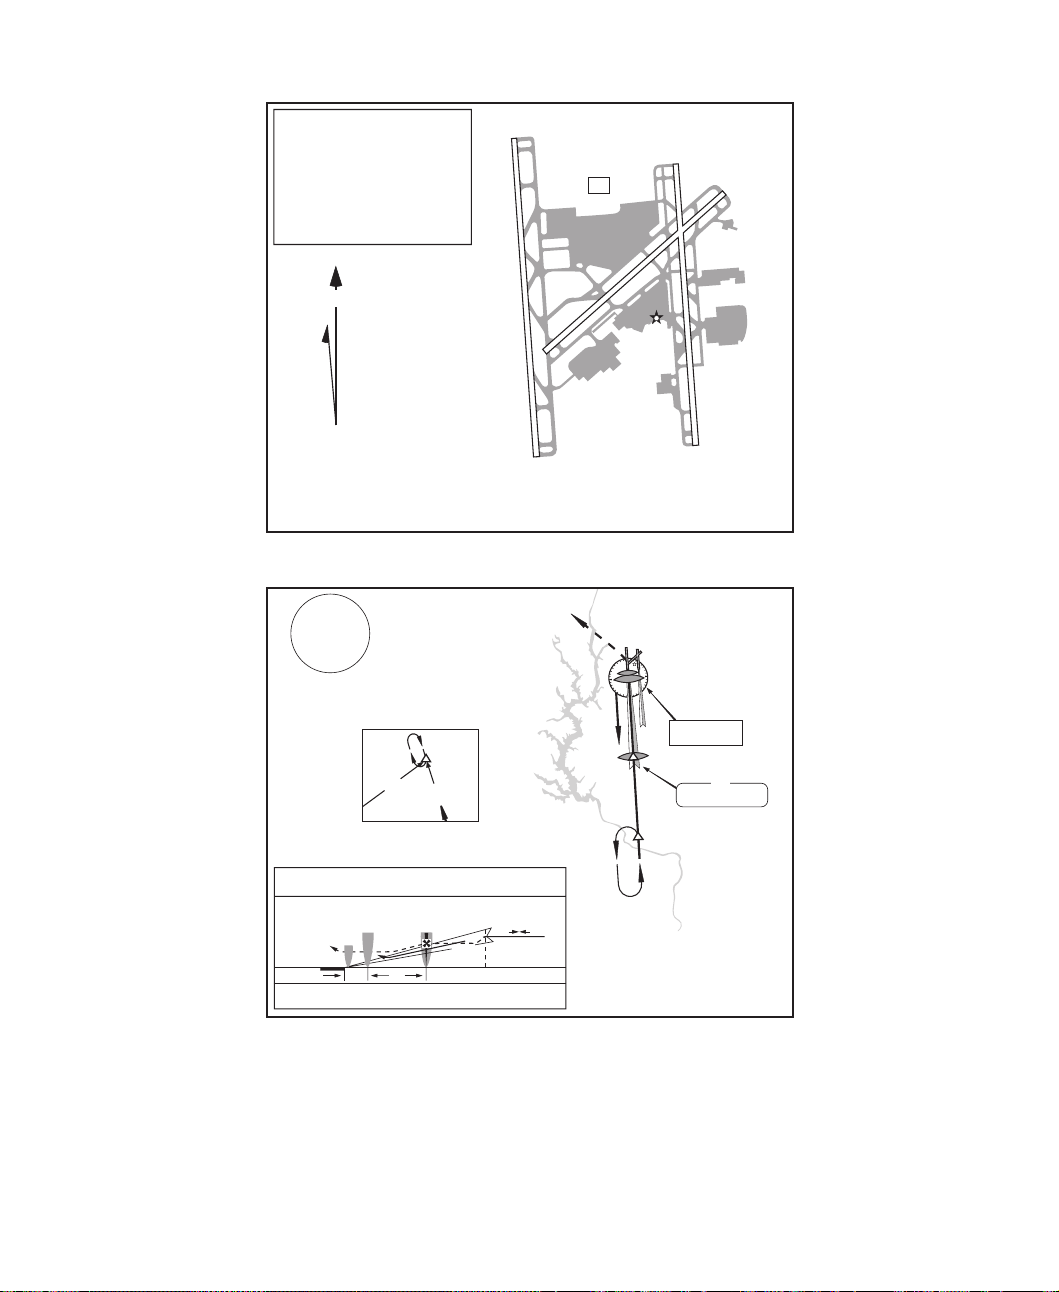
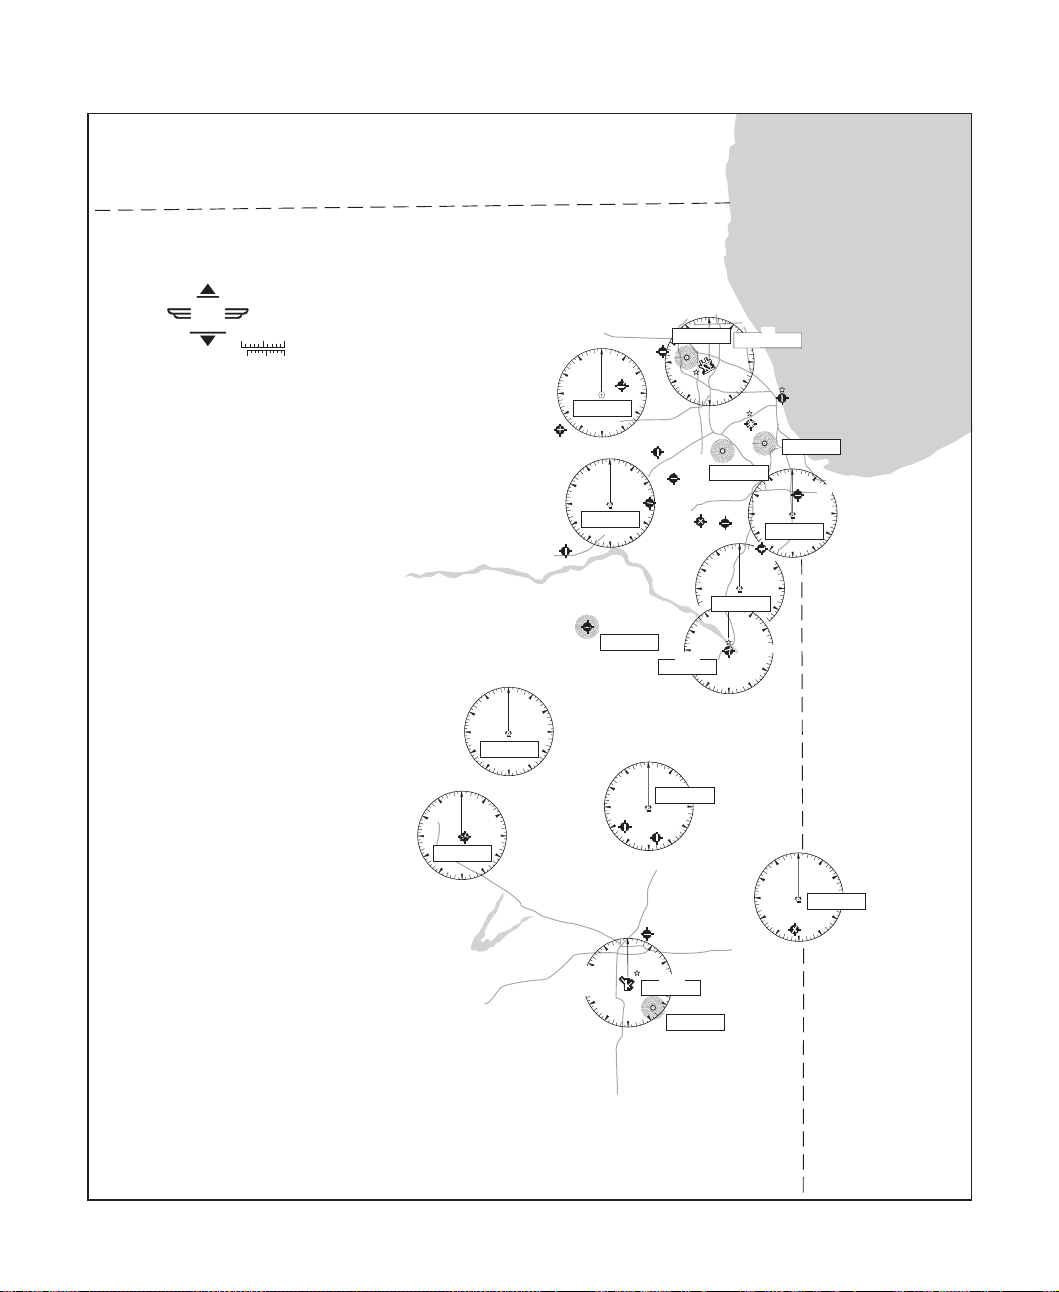
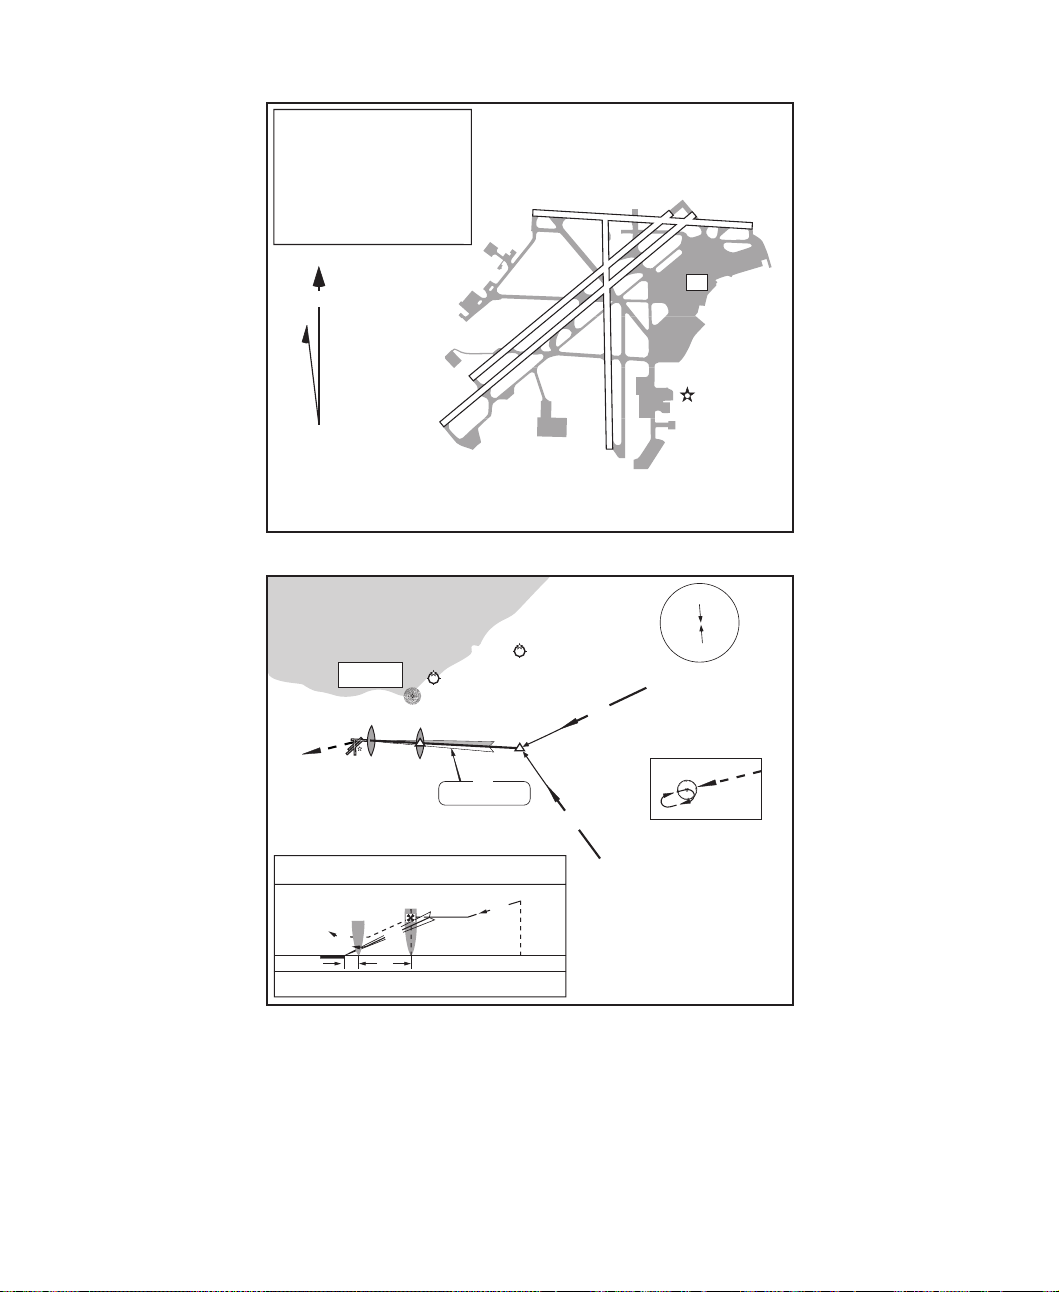
Atlanta
Elevation
Coordinates
1026
33°38.4'N
84°25.6'W
ATIS
119.65
8L
8R
N
VAR 3° W
9R9L
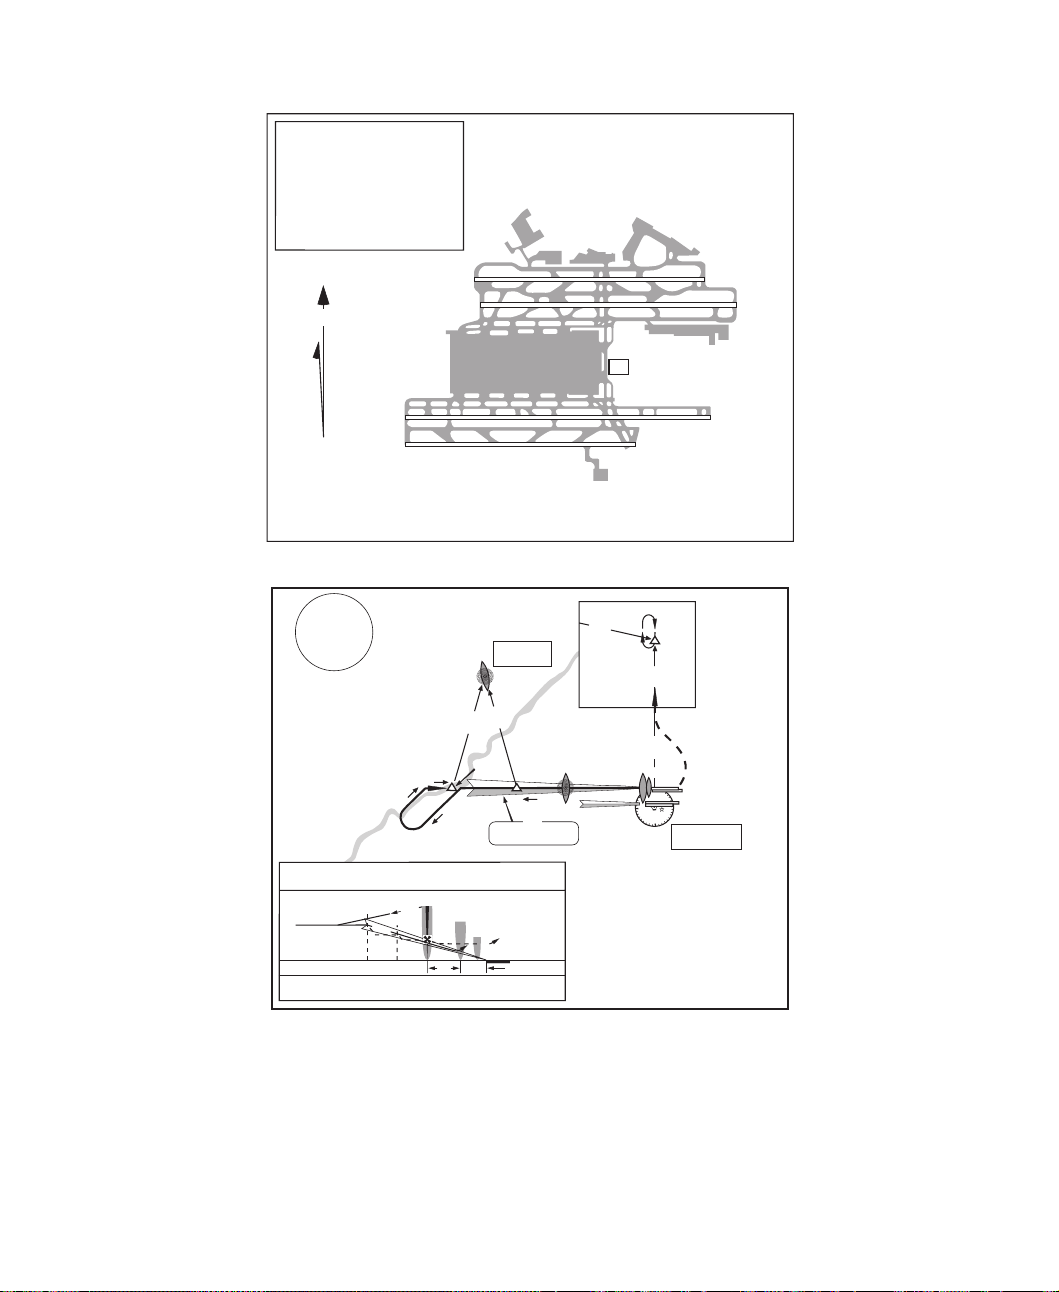
AIRPORT CHART
For use with
Microsoft Flight Simulator
3100'
MSA
AT LOM
047°
BAHRR
:
092°
3700'
REIFF
272°
2800'
APPROACH MINIMUMS
Straight in approach decision height (DH) 200'
5000'
MISSED APPROACH: Climb to 1500', then climbing LEFT turn to 3500'
outbound via ATL VOR R-360 to TROYS INT/D15.0 ATL and hold.
092°
LOM
4.8
227°
MM
9000 x 150
346°
018°
BAHRR
IM
M
0.4
FLANC
344
092° 109.3 IHFW
TDZE 8L 1015'
TDZE 8R 1024'
9000 x 150
10000 x 150
26R
26L
CT
11889 x 150
27L
27R
Atlanta, Georgia
The Hartsfield Atlanta International
RMG
115°
360°
D38.1
180°
TROYS
D15
360°
360°
MM
IM
ATLANTA
116.9
ILS Rwy 8L
Hartsfield
REIFF
ILS
TCH 59'
APT.1026'
272°
CATTA
115.4
MISSED
APCH FIX
Atlanta International
Microsoft Flight Simulator 98 — Pilot’s Guide
9
Page 14
LINCOLNTON
432
LINCOLN CO
875
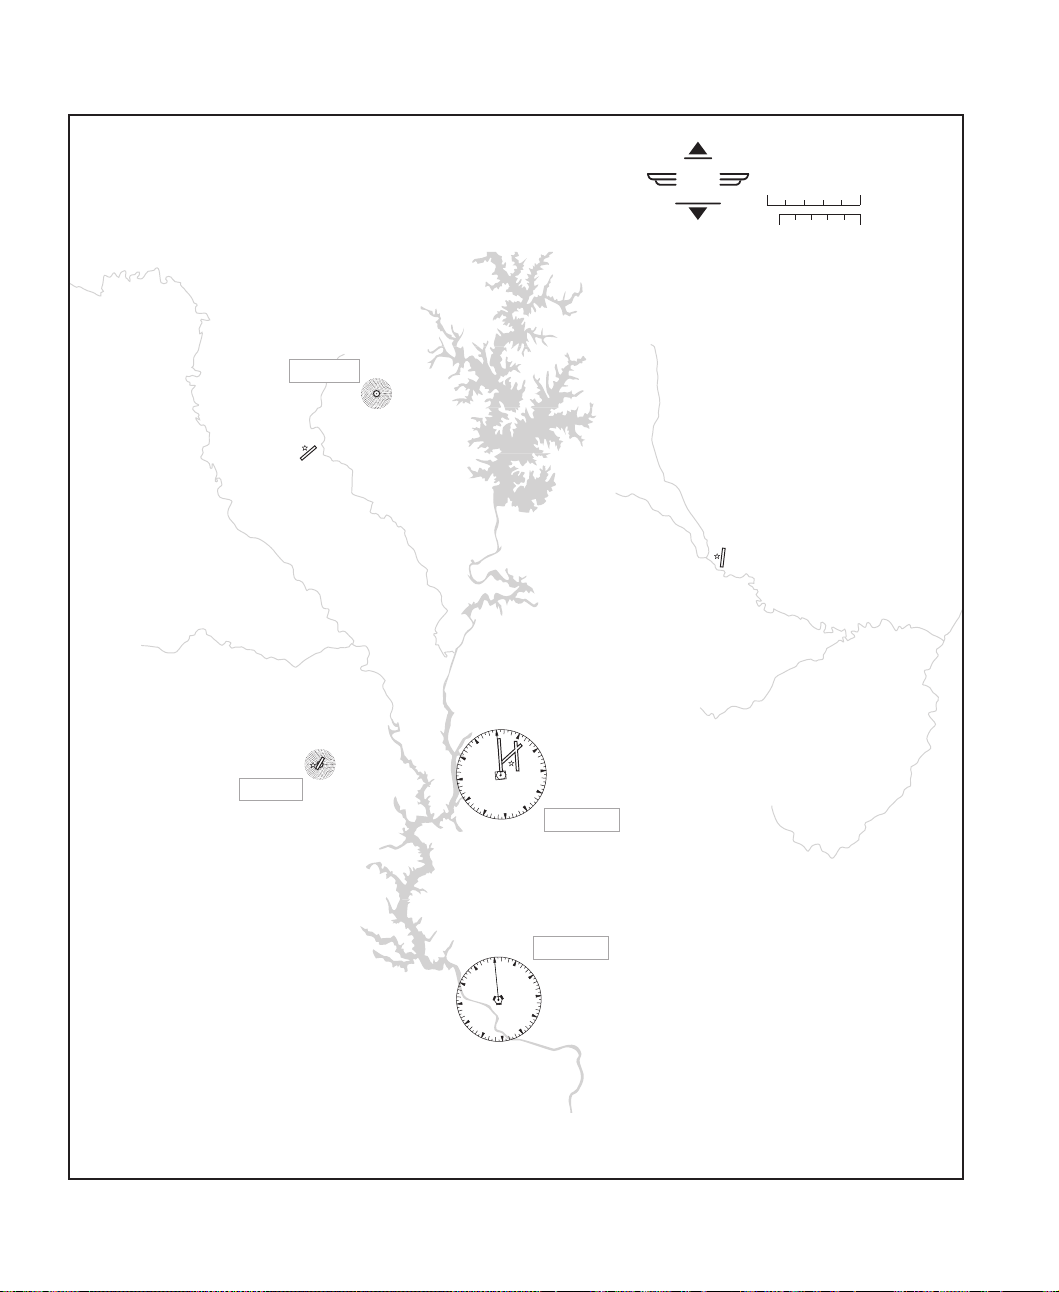
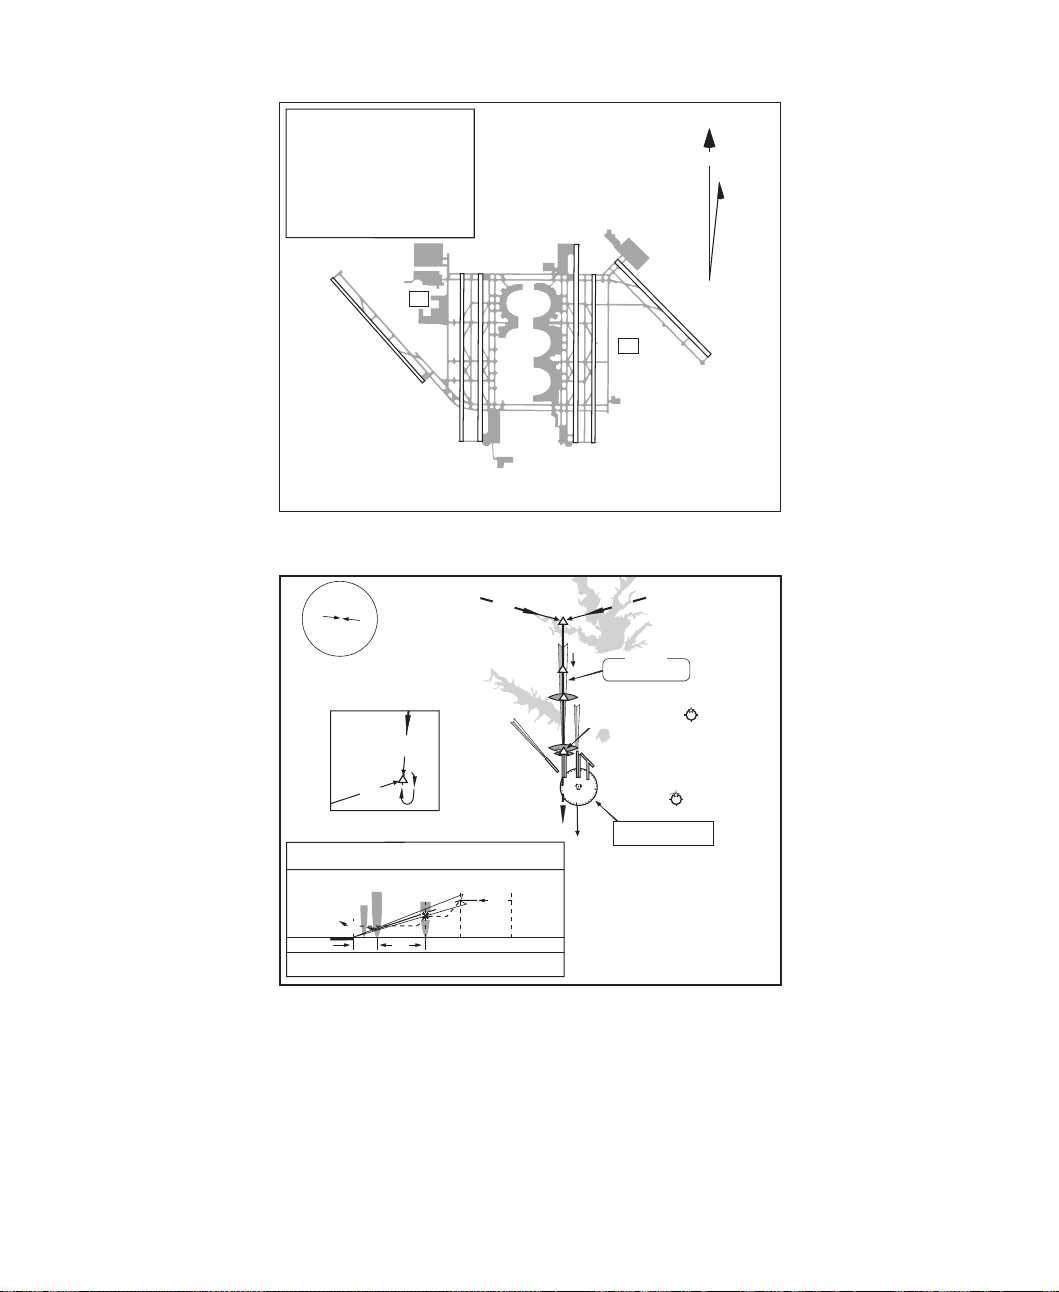
Charlotte
Microsoft
Flight
Simulator
For use with
Microsoft Flight Simulator
®
05
®
0
CONCORD REGIONAL
690
5
NAUTICAL
MILES
STATUTE
MILES
GASTONIA
797
STONIA
293
Microsoft Flight Simulator 98 — Pilot’s Guide
10
CHARLOTTE/DOUGLAS INTL
ATIS 121.15
0
3
33
30
27
24
21
33
30
27
24
21
749
6
9
12
CHARLOTTE
15
18
0
18
115.0
FORT MILL
112.4
3
6
9
12
15
Page 15
Charlotte
Elevation
Coordinates
749
35°12.9'N
18R
80°56.6'W
ATIS
121.15
10000 x 150
N
VAR 5° W
AIRPORT CHART
For use with
Microsoft Flight Simulator
3800'
MSA
CLT VOR
167°
347°
STANN
D29.5
059°
115.7
MISSED
APCH FIX
5.9
GLASI
112.4
112.4
347°
347°
FML
FML
2900'
MARJO
001°
SPA
APPROACH MINIMUMS
Straight in approach decision height (DH) 200'
TCH 55'
TDZE 708'
APT.749'
MISSED APPROACH: Climb to 1200' then climbing LEFT turn to 3600' via
314° heading and outbound FML VOR R-347 to STANN INT and hold.
:
MM
IM
0.4
36L
181° 001°
4600'
18L
CT
7501 x 150
5
23
8845 x 150
36R
Charlotte, North Carolina
Charlotte/Douglas International
314° hdg
IM
MM
to MARJO
181°
CHARLOTTE
115.0
GLASI
181°
MARJO
001°
ILS
001° 111.7 IDQG
ILS Rwy 36L
Charlotte/
Douglas International
Microsoft Flight Simulator 98 — Pilot’s Guide
11
Page 16
For use with
Microsoft Flight Simulator
®
Microsoft
Flight
®
Simulator
0510
NAUTICAL
MILES
STATUTE
0510
MILES
NOTAM
Notice to Airmen
For details, see Chicago Sectional
Aeronautical Chart.
If no ATIS is available, tune in the
control-tower frequency (CT) for
information.
30
27
24
27
24
0
33
BLOOMINGTON
108.2
21
18
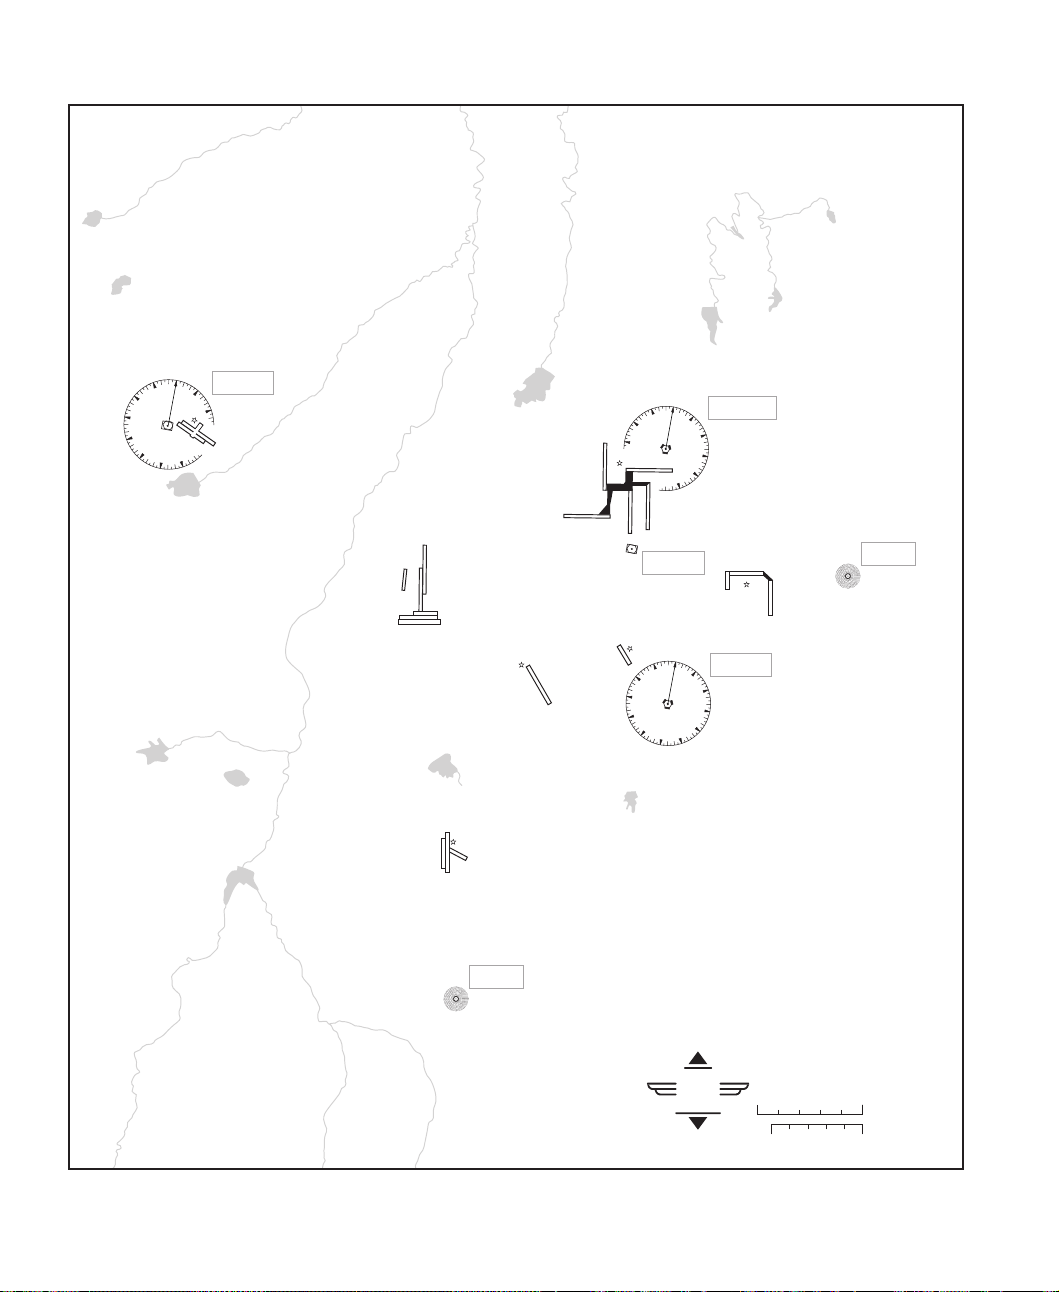
Chicago
0
33
30
PONTIAC
109.6
21
18
3
6
9
12
BLOOMINGTONNORMAL
15
875
WISCONSIN
ILLINOIS
AURORA
707
MORRIS
584
3
15
33
30
27
24
21
30
27
24
DWIGHT
632
6
9
12
GIBSON CITY
758
UNIV OF ILLINOIS
WILLARD
(CHAMPAIGN)
ATIS 124.85
754
DUPAGE
758
DU PAGE
33
21
30
27
24
0
108.4
18
JOLIET
33
21
0
112.3
18
30
27
24
SCHAUMBERG
797
3
6
12
15
3
15
DWIGHT
344
33
21
18
0
18
27
24
9
CLOW INT'L
670
6
JOLIET
582
12
NEW LENOXHOWELL
753
0
PAXTON
779
FRASCA
735
3
6
VORTAC
CHAMPAIGN
110.0
15
33
21
LEWIS
668
30
27
VOR (T)
KANKAKEE
24
111.6
3
ROBERTS
116.8
15
12
VEALS
DEANA
350
27
6
9
12
407
0
18
FRANKFORT
778
33
30
33
21
3
CHICAGO-O'HARE
9
12
15
ERMIN
332
30
27
24
0
SANGER
790
0
PEOTONE
3
113.2
GREATER KANKAKEE
629
15
18
30
27
24
VERMILLION CO.
696
Lake Michigan
VOR
113.9
CHICAGO-O'HARE INT'L
ATIS 135.4
668
MEIGS
ATIS 127.35
593
CHIGAGO-MIDWAY
ATIS 132.75
619
KEDZI
248
0
3
33
LANSING
616
CHICAGO HGTS
114.2
12
15
18
6
9
12
6
9
12
ILLINOIS
INDIANA
0
3
33
DANVILLE
111.0
21
15
18
9
6
12
Microsoft Flight Simulator 98 — Pilot’s Guide
12
Page 17
Chicago
(IAF)
BEMEN
14R
117°
CLEPT
2600
077°
(14.7)
297°
LODGE
CMI 13 DME
R-297
2600 to
LOM
130° (6)
R-234
CHAMPAIGN
110.0 CMI ---------
2600
044°
(11)
5299 X 150
(IAF)
1146
Chan 37
E
18
2
C
M
I
R-006
LOCALIZER 109.10
I-CMI ----------
MM
407 CM ---------
+
850
-
0
0
2
6
2
1
I
M
C
N
R
O
U
T
6500 X 150
6
0
1
VEALS
LR-142
1
0
E
0
2
(IAF)
LOM
LR-123
316°
F
MISSED APPROACH
Climb to 1200, then climbing
left, turn to 2700 via CMI
R-297 to Lodge Int and hold.
MM
0.5
N
o
OCTOE
P
D
T
M
2600
E
213°
(11.5)
EMTEE
2600
251°
(8.5)
2600 NoPT to
CMI LOM
270° heading
088°
(5.2) and LOC (8.8)
268°
136°
M
N
S
E
I
T
I
L
I
C
A
(IAF)
NEWMY
5 NM
LOM
2573
M
C
A
S
M
3000
University of Illinois-Willard (CMI)
Elevation
Coordinates
22R
ATIS
F
CT
8100 X 150
136°
316°
2600
2
5
ILS Rwy 32
754
40°02'N
88°17'W
124.85
N
VAR 1° W
Remain
within 10 NM
2600
GS 3.00°
TCH 52
L
13
C
13
R
13
3859 X 60
4
L
4
R
AIRPORT CHART
For use with
Microsoft Flight Simulator
L
R
14
9
L
13000 X 200
L
R
9
14
4
5509 X 150
6446 X 150
10003 X 150
7500 X 150
7967 X 150
F
CT
10141 X 150
5141 X 150
6521 X 150
31
L
18
22
5341 X 150
36
Elevation
R
22
L
22
Coordinates
ATIS
619
41°47'N
87°45'W
132.75
F
CT
N
VAR 1° W
31
R
31
C
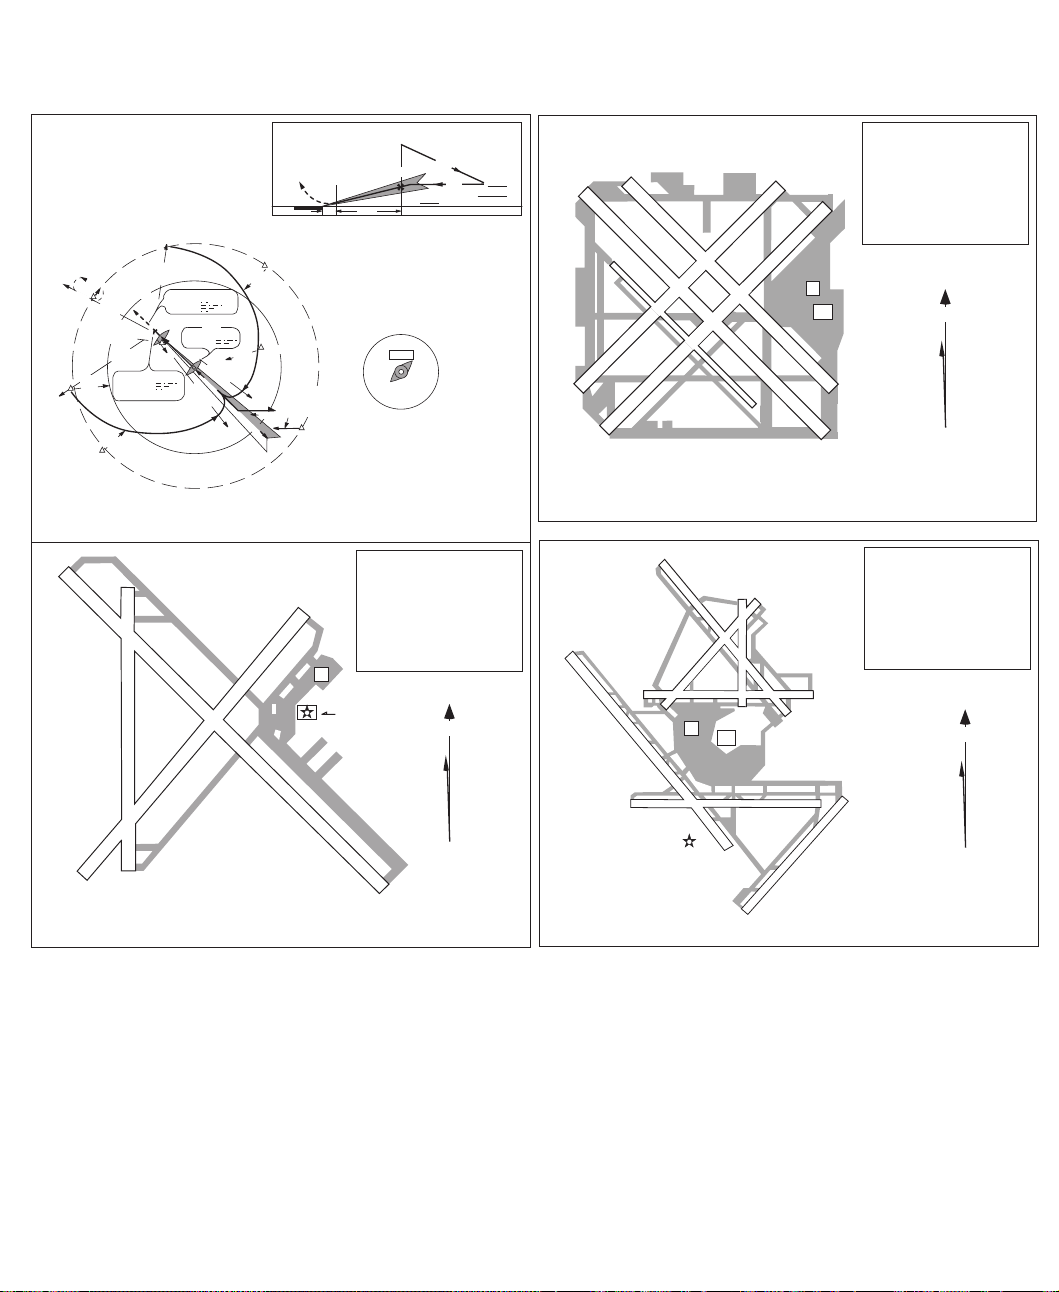
Chicago, Illinois
Chicago-Midway (MDW)
R
Coordinates
ATIS
R
27
32
R
L
22
Elevation
668
41°59'N
87°54'W
135.4
N
VAR 1° W
4L
36
AIRPORT CHART
For use with
Microsoft Flight Simulator
32L
Champaign-Urbana, Illinois
University of Illinois-Willard (CMI)
AIRPORT CHART
For use with
Microsoft Flight Simulator
32
L
8071 X 150
4
R
Chicago-O'Hare International Airport (ORD)
Chicago, Illinois
Microsoft Flight Simulator 98 — Pilot’s Guide
13
Page 18
Chicago
AIRPORT CHART
For use with
Microsoft Flight Simulator
Elevation
Coordinates
No ATIS or CT
F
CT
629
41°04'N
87°51'W
18
3899 X 150
36
Lake Michigan
Elevation
Coordinates
593
41°52'N
87°36'W
ATIS
127.35
N
VAR 2° W
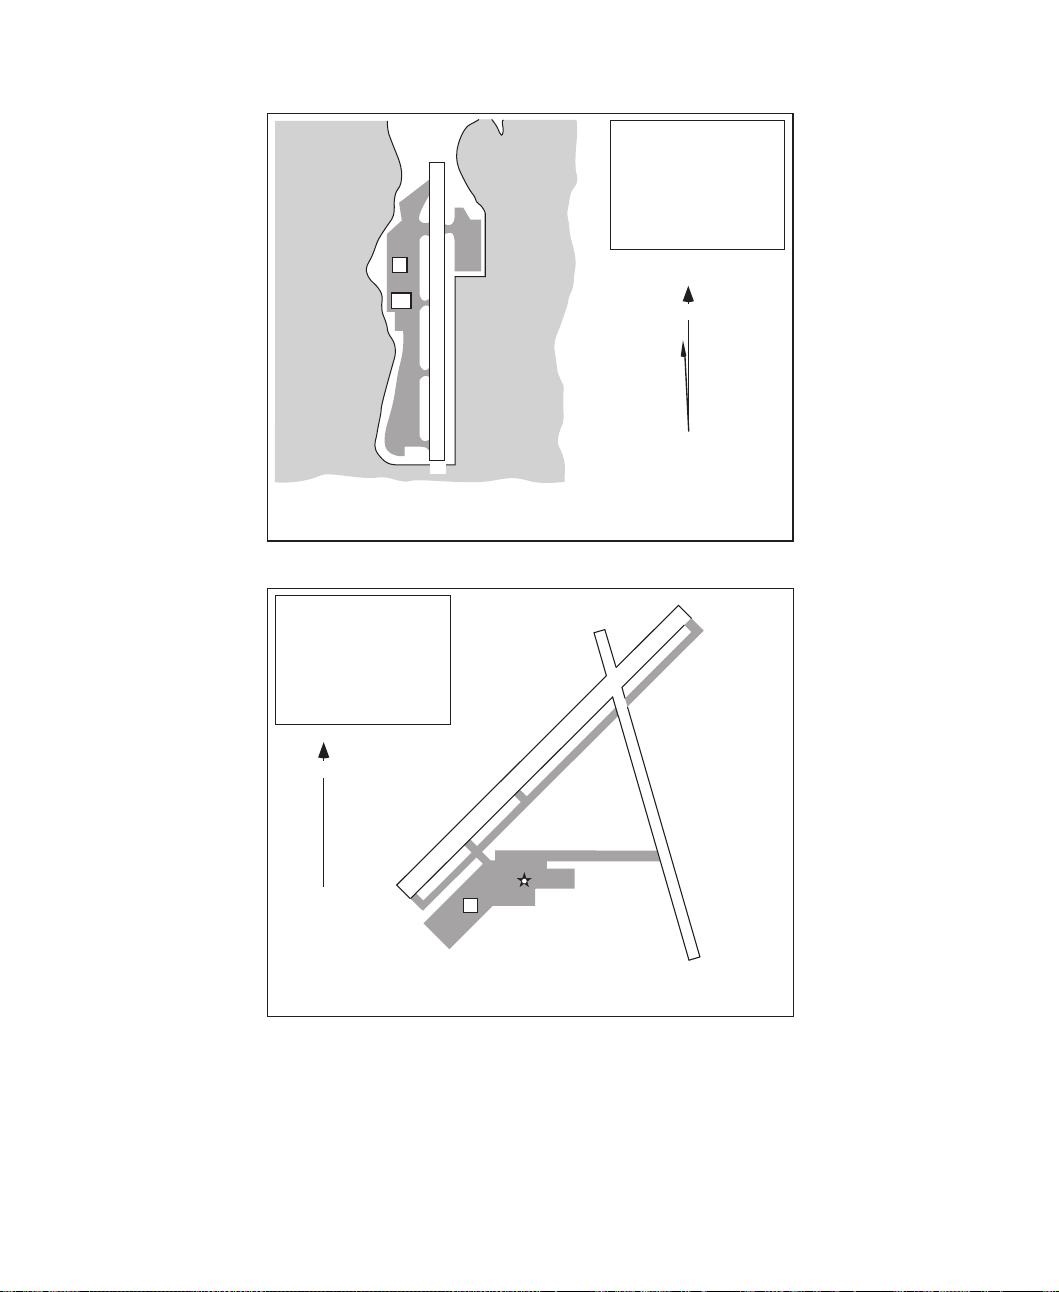
Chicago, Illinois
Merrill C. Meigs (CGX)
16
22
N
VAR 0°
AIRPORT CHART
For use with
Microsoft Flight Simulator
Microsoft Flight Simulator 98 — Pilot’s Guide
14
4400 X 75
5985 X 100
4
F
34
Kankakee, Illinois
Greater Kankakee (IKK)
Page 19
DRYER
113.6
30
LORAIN CO REGIONAL
794
27
24
Cleveland
Lake Erie
CUYAHOGA CO
879
BURKE-LAKEFRONT
BURKE-LAKEFRONT
ATIS 125.25
ENGEL
226
CLEVELAND-HOPKINS INTL
ATIS 127.85
0
3
33
6
9
12
15
21
18
792
HARRI
334
584
416
For use with
Flight
®
05
®
0
5
NAUTICAL
MILES
STATUTE
MILES
Microsoft
Simulator
Microsoft Flight Simulator
Microsoft Flight Simulator 98 — Pilot’s Guide
15
Page 20
Cleveland
Elevation
Coordinates
792
41°24.7'N
81°51.0'W
ATIS
127.85
N
VAR 7° W
AIRPORT CHART
For use with
Microsoft Flight Simulator
Lake Erie
ENGEL
226
MM
5L
5R
BURKE LAKEFRONT
PARMA
R
10
6015 x 150
18
23
23
CT
7096 x 150
8999 x 150
6410 x 150
36
Cleveland, Ohio
Cleveland-Hopkins International
180°
3100'
2600'
CUYAHOGA CO
247°
OPTOO
360°
L
28
MSA
DJB VOR
APPROACH MINIMUMS
Straight in approach decision height (DH) 250'
MM
M
TCH 42'
TDZE 792'
APT.792'
MISSED APPROACH: Climb to 1400' then climbing LEFT turn to 3000'
direct DJB VOR and hold.
Microsoft Flight Simulator 98 — Pilot’s Guide
16
0.6
DRYER
ILS
280° 110.7 IPXP
:
PARMA
280°
5.0
2700'
280°
OPTOO
330°
6000'
113.6
077°
257°
MISSED
APCH FIX
ILS Rwy 28
Cleveland-
Hopkins International
Page 21

NAS FT WORTH/
CARSWELL
ATIS 271.6
650
BOURLAND
870
FT WORTH ALLIANCE
ATIS 126.925
722
MUFIN
365
FT WORTH
MEACHAM
ATIS 120.7
710
LUCK
725
DENTON
642
DALLAS-FT WORTH INTL
ATIS 123.775
603
FT WORTH SPINKS
700
30
27
DALLAS-FT WORTH
24
117.0
21
ARLINGTON
631
Dallas
0
3
6
9
12
15
18
NAS DALLAS HENSLEY
ATIS 278.0
491
Microsoft
Flight
Simulator
ADDISON
ATIS 133.4
644
DALLAS LOVE
ATIS 120.15
487
For use with
Microsoft Flight Simulator
®
®
REDBIRD
ATIS 126.35
660
REDBIRD
05
0
287
LANCASTER
5
MC KINNEY
586
MESQUITE
239
NAUTICAL
MILES
STATUTE
MILES
248
MESQUITE
446
JECCA
388
Microsoft Flight Simulator 98 — Pilot’s Guide
17
Page 22
Dallas
Elevation
Coordinates
603
32°53.8'N
097°02.5'W
9300 x 150
2600'
MISSED
APCH FIX
D2.0
M
270°
DFW VOR
AQN
063°
110.6
:
MM
IM
0.5
123.775
CT
MSA
178°
DFW
117.0
BLITZ
D15
358°
HASTY
4.6
178°
18L
18R
31L
36L
36R
11338 x 150
11387 x 200
093°
LEGRE
YOHAN
174°
3000'
2300'
174°
ATIS
13R
AIRPORT CHART
For use with
Microsoft Flight Simulator
090°
3400'
APPROACH MINIMUMS
Straight in approach decision height (DH) 200'
TCH 55'
TDZE 18R 603'
TDZE 18L 596'
MISSED APPROACH: Climb to 3300' outbound via DFW VOR R-178 to
BLITZ INT and hold.
17R
13L
17C
13400 x 200
9000 x 200
CT
11388 x 150
35L
35C
Dallas-Fort Worth, Te xas
Dallas/Fort Worth International
174°
HASTY
D2.0
IM
178°
245°
ILS DME
074° 111.9 IVYN
DALLAS-FT WORTH
117.0
ADDISON
DALLAS-LOVE
YOHAN
LEGRE
MM
ILS Rwy 18R
Dallas/Fort Worth
International
N
VAR 6° E
31R
Microsoft Flight Simulator 98 — Pilot’s Guide
18
Page 23
Denver
0
33
30
27
24
21
18
JEFFCO
3
115.4
6
JEFFCO
ATIS 126.25
5670
15
DENVER INTL
ATIS 125.6
5431
0
33
30
27
MILE HIGH
3
114.7
6
9
12
15
STAPLETON INTL
(CLOSED)
BUCKLEY ANGB
5663
CENTENNIAL
ATIS 120.3
5883
CASSE
260
AURORA
5680
27
24
33
30
21
18
DENVER
117.9
FRONT RANGE
5500
0
3
15
Microsoft
Flight
Simulator
FALCON
116.3
6
9
12
For use with
Microsoft Flight Simulator
®
05
®
0
5
SKIPI
321
NAUTICAL
MILES
STATUTE
MILES
Microsoft Flight Simulator 98 — Pilot’s Guide
19
Page 24

Denver
Elevation
Coordinates
5431
39°51.5'N
104°40.0'W
ATIS
125.6
N
7
VAR 11° E
AIRPORT CHART
For use with
Microsoft Flight Simulator
9200'
DEN VOR
MSA
12000 x 150
16
12000 x 150
34
STAPLETON INTL
(CLOSED)
ILS DME
350° 108.5 IAQD
CT
25
DENVER
117.9
BUCKLEY
ANGB
12000 x 150
8
17R
12000 x 150
35L
17L
12000 x 150
35R
Denver, Colorado
Denver International
GILL
114.2
IM
MM
FRONT RANGE
DYMON
AURORA
148°
26
APPROACH MINIMUMS
Straight in approach decision height (DH) 200'
D21.4
CRUUP
11000'
CHOLA
9000'
350°
MISSED APPROACH: Climb to 8000' then RIGHT turn direct GLL VOR.
Microsoft Flight Simulator 98 — Pilot’s Guide
20
:
350°
7000'
148°
DYMON
VOR
4.0
MM
M
CENTENNIAL
IM
0.1
TCH 57'
TDZE 5431'
CHOLA
CRUUP
D21.4
350°
ILS Rwy 35L
Denver International
Page 25

Detroit
PONTIAC
0
111.0
3
33
30
27
24
0
3
33
30
27
24
15
21
18
6
9
12
15
21
18
SALEM
114.3
6
9
12
OAKLAND CO INTL
ATIS 125.45
980
CANTON-PLYMOUTHMETTETAL
696
OAKLAND/TROY
729
BIG BEAVER
652
BERZ MACOMB
610
DETROIT CITY
ATIS 133.0
626
BERZ
15
BERZ
215
Lake St Clair
MICHIGAN
ONTARIO
Microsoft
Flight
Simulator
WILLOW RUN
ATIS 127.45
716
30
27
For use with
Microsoft Flight Simulator
®
05
®
0
5
NAUTICAL
MILES
STATUTE
MILES
0
WINDSOR
ATIS 134.5
VOR/DME
DETROIT
0
3
33
24
21
18
113.4
6
9
DETROIT METRO
WAYNE CO
ATIS 133.675
640
GROSSE ILE
419
GROSSE ILE
591
UNITED STATES
CANADA
622
WINDSOR
113.8
30
27
3
33
24
21
6
9
12
15
18
Lake Erie
Microsoft Flight Simulator 98 — Pilot’s Guide
21
Page 26

Detroit
Elevation
Coordinates
640
42°12.9'N
83°20.9'W
ATIS
133.675
9L
N
VAR 6° W
3L
12001 x 200
9R
AIRPORT CHART
For use with
Microsoft Flight Simulator
WILLOW RUN
ILS DME
035° 110.7 IDTW
LANCE
D2.1
MM
IM
0.2
5.4
M
METTETALCANTON
REVUP
035°
TDZE 638'
140°
2400'
230°
2800'
APPROACH MINIMUMS
Straight in approach decision height (DH) 200'
LANCE
035°
7000'
MISSED APPROACH: Climb to 3000' via 030° heading then direct SVM
VOR and hold.
DET LOM
MISSED APCH FIX
294°
114°
SALEM
114.3
:
DALES
APPEY
5000'
4000'
JELLY
3000'
MSA
2600'
REVUP
035°
R
21
8700 x 200
CT
8500 x 200
3C
10000 x 150
8500 x 150
3R
Detroit, Michigan
Detroit Metro Wayne County
030° hdg
IM
MM
D2.1
GROSSE ILE
388
TCH 54'
JELLY
APPEY
DALES
APT.640'
MUN
Detroit Metro Wayne County
C
21
L
21
R
27
L
27
UNITED STATES
CANADA
ILS Rwy 3L
Microsoft Flight Simulator 98 — Pilot’s Guide
22
Page 27

Hawaii — Oahu Sightseeing Map
Rabbit
Island
MILE
KILOMETER
4
4
0
Microsoft Hawaii Sightseeing Map of Oahu
For use with Microsoft Hawaii Scenery Enhancement for
Microsoft Flight Simulator
0
®
®
Flight
Simulator
Microsoft
Laie Bay
Kahuku Point
Turtle Bay
COMSAT Satellite
Tracking Station
Twin Peaks
Sailplane area
Bird Rock
Koko Head
Hanauma Bay
Mokapuu Point
Coconut Island
Kaneohe
Chinaman's Hat
Bay
S
N
I
A
T
N
U
MO
U
A
L
O
O
K
Aloha Stadium
Downtown Honolulu
Aloha T ower
Royal Hawaiian Hotel
Hilton Rainbow Tower
Waikiki
Diamond Head
Pearl Harbor
Ford Island
Sunset Beach
Haleiwa
Waialua
Sailplane area
Kaena Point
Satellite Tracking Station
W
Kaala
A
I
4020 ft
1231 m
A
N
A
E
O
M
Makaha
USS Arizona Memorial
S
N
I
A
T
N
U
Microsoft Flight Simulator 98 — Pilot’s Guide
23
Page 28

Microsoft Flight Simulator 98 — Pilot’s Guide
Printed On: Distiller Colorlayer: ? Document Page: 24
Filename: 17316_04.doc Project: Visual User's Guide Template
BARKING SANDS
112.6
BARKING SANDS
PMRF
PORT ALLEN
NIIHAU
KAULA
0
Kure Atoll
27
Midway Islands
Kittery Isl.
18
MIDWAY
114.6
265.2
0
KAUAI
Pearl and Hermes Atoll
Southeast Island
Lisianski Island
Johnston Atoll
PRINCEVILLE
0
0
LIHUE
9
18
18
SOUTH KAUAI
115.4
Laysan Island
Maro Reef
La Perouse Pinnacle
Disappearing Island
LIHUE
113.5
BARBERS PT
113.1
Gardner Pinnacles
Johnson Atoll
111.8
388
Microsoft
Simulator
OAHU
18
Nihoa
Kaula
KANEOHE BAY
114.6
265
0
KANEOHE BAY
MCAF
0
BELLOWS AFB
HONOLULU/
HICKAM AFB
KOKO HEAD
113.9
117.7
Kauai
Niihau
Oahu
(closed)
LANAI
353
Kahoolawe
WHEELER
373
DILLINGHAM
WHEELER AAF
FORD ISL NALF
BARBERS PT NAS
EWABE
242
HONOLULU
114.8
Hawaii and Northwestern Hawaiian Islands
Tern Island
Necker Island
French Frigate Shoals
Flight
Lanai
27
LANAI
Molokai
Maui
Hawaii
Microsoft Hawaii Sectional
®
For use with Microsoft Hawaii Scenery Enhancement for
Microsoft Flight Simulator
®
0
10
NAUTICAL
MILES
STATUTE
10
0
MILES
MOLOKAI
116.1
0
KALAUPAP A
MOLOKAI
MOLOKAI
18
KAPALUAWEST MAUI
27
LANAI
9
18
KAHOOLAWE
Aircraft carrier
PUU WAA WAA RANCH (pvt)
KEAHOLE-KONA INTL
27
MAUI
114.3
0
KAHULUI
18
MAUI
VALLEY ISL
327
KONA
115.7
HANA
UPOLU
18
BRADSHAW
UPOLU POINT
0
0
18
WAIMEA-KOHALA
18
9
339
112.3
KAMUELA
BRADSHAW AAF
HAWAII
113.3
HILO
116.9
PAHOA
332
0
27
HILO INTL
18
Hawaii Sectional
Page 29

Hawaii Major Airports
11
8329 x 200
4
L
4
R
AIRPORT CHART
For use with
Microsoft Flight Simulator
Elevation
Coordinates
16
22°00'N
159°47'W
CT
126.2
Elevation
F
Coordinates
CT
R
8330 x 200
22
L
22
29
CT
8411 x 200
Barbers Point NAS
H
Helicopter Landing pads
F
33
21°18'N
158°04'W
132.65
N
VAR 11° E
Ewa, Hawaii
002°
079° 5.0
MM
1800
D1.8 IITO ILS
HILO
116.9 ITO
VEWES
D1.8 IITO ILS
GS 252' (214')
TCH 56'
TDZE 38'
APT. 38'
MISSED APPROACH: Climb to 450' then climbing RIGHT turn to 3000'
outbound via ITO VOR R-002 then direct ITO VOR and hold.
0.6
D7.8 IITO ILS
GS 1794' (1756')
MM
5.4
1800'
10 NM
(1762')
259°
from
VEWES
N
ILS DME
259° 110.7 IITO
079°
332
POA
184°
H
H
N
16
CT
H
VAR 11° E
8
21
9800 x 150
160°
1500'
250°
14,800'
2800'
340°
ITO VOR
(IAF)
VEWES
D7.8 IITO ILS
259°
124°
304°
ILS Rwy 26
Hilo International
Elevation
Coordinates
ATIS
38
19°43'N
155°03'W
126.4
MSA
26
AIRPORT CHART
For use with
Microsoft Flight Simulator
6006 x 150
34
VAR 11° E
Kekaha, Hawaii
Barking Sands PMRF
5600 x 150
F
3
AIRPORT CHART
For use with
Microsoft Flight Simulator
CT
Hilo, Hawaii
Hilo International
Microsoft Flight Simulator 98 — Pilot’s Guide
25
Page 30

EWABE
242 HN
BARBERS POINT NAS
260°
ILS DME
042° 110.5 IIUM
042°
357°
177°
CKH
113.9
222°
HICKAM AFB
305°
D6.1 IIUM ILS
ALANA
APPROACH MIMIMUMS
Straight in approach decision height (DH) 209'
15 NM
from
PERLY
MISSED APPROACH: Climb to 500' then climbing RIGHT turn to 3000'
via HNL VOR R-171 to ALANA INT/D13.9 HNL and hold.
1500'
(1491')
:
PERLY
D6.1 IIUM ILS
GS 1500' (1491')
MM
D2.1 IIUM ILS
GS 205' (196')
042°
4.0
TCH 55'
TDZE 9'
APT. 13'
0.5
N
VAR 11° E
12357 x 150
8
L
D2.1
IIUM ILS
(IAF)
PERLY
CT
4
R
Hawaii Major Airports
HONOLULU
114.8 HNL
MM
224° 4.1
3000
5200'
090°
171°
D13.9
351°
Honolulu International
6952 x 150
4
L
9000 x 150
D43.5
254°
278°
171°
Elevation
Coordinates
ATIS
3800'
360°
MKK
116.1
LNY
117.7
ILS Rwy 4R
F
180°
4200'
HNL VOR
13
21°19'N
157°56'W
127.9
R
22
22
26
MSA
L
R
120°
5500'
6800'
11,100'
350°
LNY
090°
to VYI NDB
024° 15.7
Elevation
Coordinates
ATIS
N
260°
MSA
VYI NDB
024° 110.1 IOGG
7000
CAMPS
54
20°53'N
156°26'W
128.6
270°
D22
ILS DME
IOGG LOC 024°
or OGG VOR R-204
DIPPS
5
159°
339°
204°
186°
4990 x 150
024°
VALLEY ISLAND
VYI NDB
5800'
(5775')
327 VYI
024°
7000 x 150
MAUI
114.3 OGG
to VYI NDB
198° 1.2
5800
APPROACH MINIMUMS: Straight in approach minimum descent
altitude (MDA) 700'.
Maintain 5800'
(5775') or above
until established
outbound for
procedure turn.
MISSED APPROACH: Climb to 3000' via 186° bearing from VYI NDB
to intercept the LNY VOR R-090 then inbound to DIPPS INT and hold.
F
NDB Rwy 20
Kahului
2200'
10 NM
(2175')
204°
TDZE 25'
APT. 54'
CT
20
23
R
8
AIRPORT CHART
For use with
Microsoft Flight Simulator
Microsoft Flight Simulator 98 — Pilot’s Guide
26
12000 x 200
L
26
Honolulu, Hawaii
Honolulu International
VAR 11° E
AIRPORT CHART
For use with
Microsoft Flight Simulator
2
Kahului, Hawaii
Kahului
Page 31

Hawaii Major Airports
Elevation
Coordinates
ATIS
AIRPORT CHART
For use with
Microsoft Flight Simulator
Elevation
Coordinates
ATIS
43
19°45'N
156°02'W
127.4
454
21°09'N
157°06'W
128.2
17
CT
17
F
21
Elevation
Coordinates
ATIS
153
21°58'N
159°20'W
127.2
N
11000 x 150
F
CT
Kailua-Kona, Hawaii
35
Keahole-Kona International
17
VAR 11° E
3
AIRPORT CHART
For use with
Microsoft Flight Simulator
Elevation
Coordinates
CT
F
23
ATIS
6500 x 150
N
13
28°12'N
177°23'W
126.2
VAR 11° E
35
6500 x 150
Lihue, Hawaii
Lihue
5
AIRPORT CHART
For use with
Microsoft Flight Simulator
35
3118 x 100
4494 x 100
N
VAR 11° E
Kaunakakai, Hawaii
Molokai
N
VAR 10° E
6
AIRPORT CHART
For use with
Microsoft Flight Simulator
F
CT
7900 x 200
24
Midway Island
Midway NAF
Microsoft Flight Simulator 98 — Pilot’s Guide
27
Page 32

WEISER
286
MAY
166
WEST HOUSTON
112
LAKESIDE
ANDRAU
269
SUGAR LAND/HULL
83
WEISER
140
249
HULL
388
SANDY POINT
HOOKS MEML
ATIS 124.95
152
ANDRAU
80
338
TOMBALL
408
30
27
HUMBLE
116.6
HOUSTON
SOUTHWEST
68
33
18
HOBBY
ATIS 124.6
47
24
0
3
6
HOUSTON INTCNTL
ATIS 124.05
98
15
33
30
21
18
0
VOR/DME
HOBBY
15
ELLINGTON
Houston
117.6
0
33
VORTAC
21
109.4
18
CLOVER
44
LA PORTE
24
3
ELLINGTON
ATIS 109.4
34
12
15
Microsoft
Flight
Simulator
BAYTOWN
33
SANJAC
347
HOUSTON-GULF
22
For use with
Microsoft Flight Simulator
®
®
05
0
HUMPHREY
275
5
27
24
30
NAUTICAL
MILES
STATUTE
MILES
33
21
ANAHUAC
413
CHAMBERS CO
22
TRINITY
113.6
0
3
6
9
12
15
18
Microsoft Flight Simulator 98 — Pilot’s Guide
28
VORTAC
SCHOLES
113.0
0
33
30
27
24
3
SCHOLES
07
9
21
12
15
18
Page 33

Houston
Elevation
Coordinates
98
29°58.8'N
95°20.4'W
N
124.05
VAR 5° E
8
L
R
14
14
6038 x 150
CT
ATIS
AIRPORT CHART
For use with
Microsoft Flight Simulator
2400'
290°
MSA
3100'
040°
IAH VOR
D1.7
IM
CLEEP
D28.1
DAS
278°
116.9
D22.1
IAH
016°
116.6
MISSED
APCH FIX
D1.7
:
NIXIN
MM
IM
M
0.2
2000'
264°
5.5
APPROACH MINIMUMS
Straight in approach decision height (DH) 200'
TCH 55'
TDZE 96'
MISSED APPROACH: Climb to 1000' then climbing RIGHT turn to 2300'
outbound via IAH VOR R-016 to CLEEP INT.
KERNS
3000'
HUMBLE
GRIEG
264°
116.6
9401 x 150
32
L
12001 x 150
016°
264° 109.7 IJYV
MM
4000'
26
9
32
R
9999 x 150
Houston, Texas
Houston Intercontinental
ILS
KERNS
GRIEG
NIXIN
326
023°
012°
117.6 HUB
ILS Rwy 26
Houston Intercontinental
27
Microsoft Flight Simulator 98 — Pilot’s Guide
29
Page 34

Los Angeles Area
Microsoft
Flight
Simulator
For use with
Microsoft Flight Simulator
®
5
0
®
510
0
10
NAUTICAL
MILES
STATUTE
MILES
Anacapa Islands
NOLF SAN NICOLAS ISLAND
504
SAN NICOLAS
203
CAMARILLO
ATIS 119.2
75
VOR/DME
CAMARILLO
115.8
Santa Barbara
Island
SANTA MONICA
LOS ANGELES
113.6
SAN CLEMENTE
350
VAN NUYS
113.1
VAN NUYS
ATIS 118.45
799
VOR/DME
110.8
SANTA MONICA
ATIS 119.15
175
LOS ANGELES INTL
ATIS 135.65
126
24
21
30
27
24
21
SAN CLEMENTE NALF
182
0
18
15
TORRANCEZAMPERINI
ATIS 125.6
101
33
18
LOS ANGELES
WHITEMAN
1002
BURBANK-GLENDALEPASADENA
ATIS 134.5
775
3
HAWTHORNE MUNI
ATIS 118.4
63
12
LONG BEACH
ATIS 127.75
57
VORTAC
SEAL BEACH
0
AVALON
CATALINA
1602
9
SAN CATALINA
12
15
Santa Catalina
Island
EL MONTE
ATIS 118.75
296
COMPTON
97
24
115.7
111.4
33
30
21
18
LA VERNEBRACKETT
ATIS 124.4
1011
24
21
POMONA
110.4
FULLERTON MUNI
0
ATIS 125.05
96
LOS ALAMITOS AAF
35
9
12
15
SANTA ANA
JOHN WAYNEORANGE CO
ATIS 126.0
54
0
33
ONTARIO INTL
ATIS 124.25
943
18
CHINO
ATIS 121.15
650
CORONA MUNI
533
SANTA ANA
TUSTIN MCAS
54
VORTAC
EL TORO
117.2
3
UPLAND-CABLE
1439
21
SANTA ANA
EL TORO MCAS
ATIS 117.2
383
SWAN LAKE
18
PARADISE
112.2
257
VOR
RIVERSIDE
0
112.4
RIVERSIDE MUNI
ATIS 128.8
816
12
15
Pacific Ocean
Microsoft Flight Simulator 98 — Pilot’s Guide
30
Page 35

Los Angeles Area
Elevation
Coordinates
No ATIS or CT
4
AIRPORT CHART
For use with
Microsoft Flight Simulator
Elevation
Coordinates
ATIS
1602
33°24'N
118°25'W
775
34°12'N
118°21'W
134.5
3240 X 100
15
22
N
F
VAR 15° E
Avalon, California
Catalina (AVX)
N
AIRPORT CHART
For use with
Microsoft Flight Simulator
VAR 14° E
6885 x 150
8
6032 x 150
F
CT
26
33
Burbank, California
Glendale-Pasadena (BUR)
Microsoft Flight Simulator 98 — Pilot’s Guide
31
Page 36

Los Angeles Area
VNY
113.1
095°
D17.3
ILS DME
2200'
(2080')
MERCE
D16.2
IOSS ILS
4000'
(3880')
4000
D16.0
060°
ROMEN
278 OS
299°
LONG
BEACH
249°
SANTA MONICA
249°
110.8 SMO
16.0
5000
ARBIE
D3.3 IOSS ILS
IM
MM
HAWTHORNE
MUNI
068°
249° 108.5 IOSS
SANTA
MONICA
D1.9
IOSS ILS
260°
LOS ANGELES
113.6 LAX
ZAMPERINI
APPROACH MINIMUMS
Straight in approach decision height (DH) 200'
TCH 55'
TDZE 120'
APT. 126'
MISSED APPROACH: Climb to 2000' via heading 249° and outbound
LAX VOR R-260 to RAFFS INT/D15.1 LAX VOR and hold.
Elevation
Coordinates
IM
D1.9 IOSS ILS
GS 221' (101')
:
MM
GS 324' (204')
M
0.5
126
33°57'N
ARBIE
D3.3 IOSS ILS
580'
4.8
ROMEN
D8.1 IOSS ILS
GS 2194' (2074')
249°
(460')
118°24.9'W
ATIS
6
R
135.65
6
L
8925 x 150
7
L
7
R
AIRPORT CHART
For use with
Microsoft Flight Simulator
(IAF)
PURMS
to Merce
150°
8.9
SAPPI
150°
4000
3.8
MERCE
D16.2 IOSS ILS
330°
4000
EL MONTE
249°
008°
12.2
SEAL BEACH
DENAY
D25.0 IOSS ILS
FULLERTON
115.7 SLI
5100'
050°
LOS ALAMITOS
DENAY
D25.0
IOSS ILS
8000'
(7880')
FIM
RAFFS
080°
D15.1
260°
113.6
FIX
LAX
112.5
MISSED APCH
148°
Los Angeles International (LAX)
R
24
L
10285 x 150
24
CT
12091 x 150
11096 x 200
F
Los Angeles, California
Los Angeles International (LAX)
165°
7700'
270°
MSA
2900'
LAX VOR
ILS Rwy 24R
N
VAR 14° E
R
25
L
25
Elevation
Coordinates
54
33°40.5'N
117°52.1'W
ATIS
126.0
AIRPORT CHART
For use with
Microsoft Flight Simulator
Elevation
Coordinates
175
34°01'N
118°27'W
ATIS
119.15
3
AIRPORT CHART
For use with
Microsoft Flight Simulator
1
L
R
L
19
19
N
CT
VAR 14° E
1
R
5700 x 150
2887 x 75
F
Santa Ana, California
John Wayne-Orange County (SNA)
CT
4987 X 150
F
N
VAR 14° E
Santa Monica, California
Santa Monica Municipal (SMO)
21
Microsoft Flight Simulator 98 — Pilot’s Guide
32
Page 37

Los Angeles Area
6000 to Umber Int
325° (14.6) and
053° (4.3)
LOCALIZER 111.3
I-VNY --
R-325
LR-333
MM
(7.8)
161°
161°
341°
4300
999
UMBER
VNY 15.4 DME
KADIE OM
VNY 7.6 DME
VAN NUYS
113.1 VNY -- -Chan 78
VNY
R-101
101°
L
R
16
16
4000 X 75
281°
Procedure
Turn NA
GS 3.90°
TCH 55*
E
N
R
O
U
T
1
0
N
M
AMTRA
VNY 20.2 DME
UMBER INT
VNY 15.4 DME
6000
E
F
A
C
I
L
I
T
I
E
S
KADIE OM
VNY 7.6 DME
4280
4300
*Displaced threshold
Elevation
Coordinates
ATIS
MISSED APPROACH
Climb to cross VNY 1.5 DME
or FIM R-101 at or below
1750, then climbing left turn to
4000 via VNY R-101 to AMTRA
Int and hold.
7.7 NM
A
S
6800
6000
MM
0.4
Y
N
2
V
5
N
M
9100
275°095°
4300
005° 185°
161°
M
ILS Rwy 16R
Van Nuys (VNY)
799
34°13'N
118°29'W
118.45
AIRPORT CHART
For use with
Microsoft Flight Simulator
CT
8001 X 150
F
34
L
34
R
N
VAR 14° E
Van Nuys, California
Van Nuys (VNY)
Microsoft Flight Simulator 98 — Pilot’s Guide
33
Page 38

Miami
OPA LOCKA
ATIS 125.9
120.7
PLANTATION
242
Microsoft
Flight
Simulator
For use with
Microsoft Flight Simulator
®
05
®
0
5
NAUTICAL
MILES
STATUTE
MILES
DOLPHIN
113.9
0
3
33
30
27
24
MIAMI INTL
ATIS 119.15
123
33
21
15
18
30
27
24
21
VIRGINIA KEY
0
3
117.1
6
9
12
15
18
Atlantic Ocean
Microsoft Flight Simulator 98 — Pilot’s Guide
34
Page 39

Miami
Elevation
Coordinates
11
25°47.6'N
80°17.4'W
ATIS
119.15
N
VAR 4° W
9R
AIRPORT CHART
For use with
Microsoft Flight Simulator
2100'
270°
090°
2900'
DHP VOR
MSA
KROME
9L
10502 x 200
12
9355 x 150
CT
090°
090° 110.3 IMFA
13000 x 150
155°
335°
BRBRA
MISSED
APCH FIX
COPRA
ILS DME
055°
D11.5
PJN
R
27
L
27
30
Miami, Florida
Miami International
242
Opa Locka
DOLPHIN
335°
LAWNN
113.9
MM
D1.9
270° hdg
090°
3000'
:
COPRA
1500'
LAWNN
D1.9
MM
3.8
TCH 51'
M
TDZE 10'
0.6
APPROACH MINIMUMS
Straight in approach decision height (DH) 200'
KROME
4000'
MISSED APPROACH: Climb to 800' then climbing LEFT turn to 3000' via
270° heading and outbound on DHP VOR R-335 to BRBRA INT/D11.5
DHP and hold.
ILS Rwy 9L
Miami International
Microsoft Flight Simulator 98 — Pilot’s Guide
35
Page 40

New Orleans
For use with
Microsoft Flight Simulator
Flight
®
05
®
0
LAKEFRONT
ATIS 124.9
09
NAUTICAL
MILES
STATUTE
MILES
5
FLORENVILLE
371
SLIDELL
256
Microsoft
Simulator
Lake Pontchartrain
RESERVE
0
3
33
30
27
24
21
18
110.8
6
9
12
15
KINTE
338
NEW ORLEANS INTL/
MOISANT
ATIS 127.55
06
Microsoft Flight Simulator 98 — Pilot’s Guide
36
HARVEY
114.1
30
NAS NEW ORLEANS JRB/
CALLENDER
ATIS 276.2
01
0
3
33
6
9
12
15
18
Page 41

New Orleans
Elevation
Coordinates
4
29°59.6'N
90°15.5'W
ATIS
127.55
N
VAR 2° E
AIRPORT CHART
For use with
Microsoft Flight Simulator
19
10
10080 x 150
3576 x 150
6
CT
24
7000 x 150
28
1
New Orleans, Louisiana
New Orleans International
Microsoft Flight Simulator 98 — Pilot’s Guide
37
Page 42

VORTAC
6
3
0
33
12
9
6
3
0
33
NAUTICAL
0510
For use with
Microsoft Flight Simulator
®
Flight
Microsoft
NOTAM
Notice to Airmen
For details, see New York Sectional
110.6
GARDNER
27
30
MILES
STATUTE
MILES
0510
®
Simulator
3
0
Aeronautical Chart.
If no ATIS is available, tune in the
control-tower frequency (CT) for
112.7
BOSTON
9
LOGAN INT'L
30
15
18
21
24
6
33
information.
(BOSTON)
9
30
12
ATIS 135.0
20
27
27
15
21
24
12
115.1
CHESTER
24
18
15
SOUTHBRIDGE
18
21
New York
VOR
114.5
12
9
6
3
MARTHA'S VINEYARD
0
18
21
12
114.9
24
MERIDEN
MARKHAM
103
27
15
33
12
NORWICH
21
110.0
18
ATIS 126.25
30
15
24
CHESTER
416
6
3
0
238
33
MERIDEN
CAPE COD
12
9
6
3
0
33
12
9
6
117.4
PUTNAM
3
0
33
30
697
BRADLEY INT'L
DANIELSON
27
ATIS 118.15
174
238
24
30
15
21
WINDHAM
247
3
0
27
VORTAC
18
6
3
0
33
9
6
HARTFORD-BRAINARD
ATIS 126.45
19
33
30
15
24
115.6
PROVIDENCE
9
30
HARTFORD
27
257
WATERBURY
WATERBURY-OXFORD
12
9
6
112.2
15
PAWLING
3
0
33
9
6
3
0
KINGSTON
33
27
30
727
DANBURY
ATIS 127.75
458
18
12
117.6
3
0
15
18
21
24
68
21
VOR
6
33
27
18
9
MADISON
30
108.8
BRIDGEPORT
110.4
9
30
0
3
24
12
TWEED-NEW HAVEN
ATIS 133.65
27
6
33
CARMEL
27
15
21
13
12
116.6
MARTHA'S VINEYARD
18
15
24
9
30
24
BLOCK ISLAND
BLOCK ISLAND STATE
109
18
3
21
0
12
SIKORSKY MEM
(BRIDGEPORT)
ATIS 119.15
24
27
15
18
21
WESTCHESTER CO.
439
216
3
0
6
33
15
10
VOR/DME
6
33
9
30
18
21
3
0
3
113.1
0
LA GUARDIA
Atlantic Ocean
12
9
113.6
15
HAMPTON
18
21
24
27
30
12
15
18
117.2
CALVERTON
21
24
27
LONG ISLAND
MacARTHUR
ATIS 128.45
99
12
9
6
117.2
DEER PARK
33
9
6
LA GUARDIA
33
30
REPUBLIC
30
3
0
22
ATIS 126.65
81
27
6
33
24
27
15
24
9
30
115.9
VORTAC
KENNEDY
275
18
BABYLON
21
12
JOHN F. KENNEDY INT'L
ATIS 128.72
27
13
24
15
373
CONDA
18
21
Microsoft Flight Simulator 98 — Pilot’s Guide
38
Page 43

New York
N
VAR 15° W
10
AIRPORT CHART
For use with
Microsoft Flight Simulator
Elevation
Coordinates
ATIS
N
VAR 16° W
AIRPORT CHART
For use with
Microsoft Flight Simulator
Elevation
Coordinates
109
41°10'N
71°35'W
No ATIS or CT
F
28
2501 X 100
Block Island, Rhode Island
Block Island State
20
42°22'N
71°00'W
135.0
F
R
15
L
F
CT
7860 X 150
4
L
9
4
R
R
22
L
22
15
2557 X 100
33
R
10081 X 150
10005 X 150
7000 X 150
Boston, Massachusetts
27
33
L
General Edward Lawrence Logan International (BOS)
0
1
1500 to Borst Int
I-MVY 5 DME
MVY R-057
1500
058° (4.2)
MARTHA'S VINEYARD
114.5 MVY ----------
Chan 92
LOCALIZER 108.7
I-MVY -------
Chan 24
6
AIRPORT CHART
For use with
Microsoft Flight Simulator
236° (6.6)
179
MM
R-180
270°
90°
15
1500 NoPT to
Choppy Int
260° heading (1.1)
and LOC (2.4)
CHOPY INT
I-MVY 11.6 DME
236°
1 min
056°
+
-
CLAMY
3297 X 50
5500 X 150
F
MISSED APPROACH
Climb to 800, then climbing left,
turn to 2500 via MVY R-180
to CLAMY Int.
056°
(IAF)
PEAKE
MVY R-056
R-323
Atlantic Ocean
R-308
R-270
NANTUCKET
116.2 ACK -------
33
CT
One Minute
BORST INT
Holding Pattern
I-MVY 5 DME
1407
056°
I-MVY 1 DME
1500 NoPT
323°
(24.4)
IAF
Chan 109
MM
0.6
3.4 NM
Y
V
M
A
S
2100
M
090°
1500
236°
1500
GS 3.00°
TCH 50
2
5
N
180°
M
1600
ILS Rwy 24
Martha's Vineyard (MVY)
Elevation
Coordinates
ATIS
24
68
41°24'N
70°37'W
126.25
N
VAR 16° W
Martha's Vineyard, Massachusetts
Martha's Vineyard (MVY)
Microsoft Flight Simulator 98 — Pilot’s Guide
39
Page 44

New York
Elevation
Coordinates
ATIS
N
VAR 14° W
AIRPORT CHART
For use with
Microsoft Flight Simulator
Elevation
Coordinates
ATIS
R
13
10
41°10'N
73°08'W
119.15
13
40°38'N
73°46'W
128.72
11
CT
6
F
4761 X 150
4677 X 150
24
29
Bridgeport, Connecticut
Igor I. Sikorsky Memorial (BDR)
L
13
F
10000 X 150
CT
R
22
L
22
31
R
N
VAR 13° W
AIRPORT CHART
For use with
Microsoft Flight Simulator
Microsoft Flight Simulator 98 — Pilot’s Guide
40
14572 X 150
11351 X 150
8400 X 150
31
L
4
R
4
L
New York, New York
John F. Kennedy International (JFK)
Page 45

SWAN LAKE
PARADISE
112.2
San Diego
For use with
Microsoft Flight Simulator
Microsoft
Simulator
BIG BEAR CITY
6748
RIALTO MUNI
0
3
RIVERSIDE MUNI
ATIS 128.8
816
15
PERRIS VALLEY
1413
1455
SAN BERNADINO INTL
1157
RIVERSIDE
FLABOB
764
30
27
MURRIETA
BEAR CREEK
1120
RIVERSIDE
MARCH AFB
ATIS 134.75
1538
0
18
15
REDLANDS MUNI
1571
HOMELAND
3
113.4
6
9
HEMET-RYAN
1512
12
MURRIETA
FRENCH VALLEY
1347
BANNING MUNI
2219
SAN JACINTO
227
PETIS
397
257
30
27
24
21
18
VOR
RIVERSIDE
112.4
®
Flight
®
PALM SPRINGS REGL
ATIS 118.25
462
30
27
5
0
510
0
YUCCA VALLEY
3224
0
33
3
12
18
15
PALM SPRINGS
BERMUDA DUNES
73
10
NAUTICAL
MILES
STATUTE
MILES
JOSHUA TREE
HI DESERT
2464
PALM SPRINGS
115.5
6
9
27
24
21
33
18
116.2
3
6
9
12
15
THERMAL
0
OCEANSIDE
115.3
Pacific Ocean
30
27
24
21
0
33
18
15
MISSION BAY
117.8
27
SAN DIEGO INTLLINDBERGH
ATIS 134.8
14
SAN DIEGO
NORTH ISLAND NAS
26
IMPERIAL BEACH NOLF
24
FALLBROOK
COMMUNITY
708
OCEANSIDE
CAMP PENDLETON MCAS
77
OCEANSIDE MUNI
28
CARLSBAD
McCLELLAN-PALOMAR
ATIS 120.15
328
SAN DIEGO
0
33
MIRAMAR NAS
TIJUANA
116.5
478
SAN DIEGO
MONTGOMERY
ATIS 126.9
423
12
27
30
BORREGO SPRINGS
BORREGO VALLEY
JULIAN
114.0
520
41
0
33
30
27
24
RAMONA
1393
SAN DIEGO
GILLESPIE
ATIS 125.45
385
POGGI
109.8
0
33
21
18
3
SAN DIEGO
BROWN MUNI
ATIS 132.35
524
TIJUANAGEN RODRIGUEZ INTL
ATIS 127.9
499
15
30
24
21
3
6
9
12
18
15
UNITED STATES
MEXICO
Microsoft Flight Simulator 98 — Pilot’s Guide
Page 46

San Diego
OCN
115.3
092°
(IAF)
GATTO
GS 1949' (1935')
092°
237°
2500
4.2
272°
4.6
MISSION BAY
117.8 MZB
LMM
D2.2 ISAN ILS
GS 346' (332')
M
D27.5
(IAF)
SARGS
D11.3 ISAN ILS
092°
D8.3
255°
162°
272°
047°
227°
GATTO
D6.8 ISAN ILS
ILS DME
092° 110.9 ISAN
APPROACH MINIMUMS
Straight in approach altitude (height) DA(H) 350' (336')
10 NM
from
GATTO
MISSED APPROACH
PGY VOR R-300, then continue climb to 5000' inbound via PGY VOR
R-300 to PGY VOR, then RIGHT turn outbound via PGY VOR R-270 to
intercept OCN VOR R-162 inbound to SARGS INT and hold.
:
D6.8 ISAN ILS
272°
2000'
(1986')
:
Climb to 3000' via heading 092° until intercepting
0.6
245 AN
NORTH
ISLAND
NAS
TCH
Displaced
threshold 85'
TDZE 14'
APT. 14'
MIRAMAR NAS
MONTGOMERY
BOING
300°
092°
270°
140°
4700'
230°
2100'
5200'
340°
MSA
AN LMM
GILLESPIE
POGGI
109.8 PGY
BROWN MUNI
ILS Rwy 9
San Diego International-
Lindbergh Field (SAN)
Elevation
Coordinates
14
32°44'N
117°11.4'W
ATIS
134.8
AIRPORT CHART
For use with
Microsoft Flight Simulator
N
9
9400 x 200
CT
F
VAR 13° E
27
San Diego, California
San Diego International-Lindbergh Field (SAN)
Microsoft Flight Simulator 98 — Pilot’s Guide
42
Page 47

0
33
24
30
27
21
MENDOCINO
18
112.3
15
3
6
9
12
27
24
VOR/DME
SANTA ROSA
113.0
21
30
27
24
POINT REYES
21
18
33
30
18
33
113.7
15
SAUSALITO
SAN FRANCISCO INT'L
ATIS 118.85
11
Pacific Ocean
NOTAM
Notice to Airmen
For details, see San Francisco Sectional
Aeronautical Chart.
If no ATIS is available, tune in the controltower frequency (CT) for information.
0
3
6
SONOMA CO.
125
9
12
15
0
HALF MOON BAY
67
3
6
9
30
12
27
24
116.2
21
VOR-DME
SAN FRANCISCO
115.8
27
24
HAMILTON ARMY
02
33
27
21
24
33
30
30
33
30
30
SAN CARLOS
02
27
24
WOODSIDE
113.9
21
18
PIGEON POINT
286
33
30
27
MAXWELL
110.0
21
18
27
24
21
0
3
SCAGGS ISLAND
9
112.1
12
15
3
0
33
0
33
15
27
PALO
ALTO
24
05
15
MONTEREY PENINSULA
253
San Francisco
0
3
6
9
30
WILLIAMS
114.4
18
6
BUCHANAN
ATIS 124.7
23
VORTAC
3
OAKLAND
116.8
OAKLAND INT'L
ATIS 128.5
06
9
HAYWARD
47
12
MOFFETT NAS
34
21
VOR-DME
SAN JOSE
18
114.1
0
15
15
3
27
6
24
9
21
12
27
24
21
LIVERMORE
397
0
3
SAN JOSE INT'L
ATIS 126.95
58
REID-HILLVIEW
133
12
WATSONVILLE
160
30
27
24
21
18
30
YUBA CO.
62
MARYSVILLE
18
30
SACRAMENTO
18
REIGA
374
33
OROVILLE
192
0
33
33
SALINAS
84
15
3
6
110.8
115.2
STOCKTON
METROPOLITAN
30
0
VORTAC
SALINAS
9
12
15
SACRAMENTO METROPOLITAN
25
0
3
SACRAMENTO EXECUTIVE
21
6
9
12
15
LODI
58
KINGDON
15
24
33
30
27
24
21
18
TRACY
192
3
6
9
117.3
12
Microsoft
Flight
Simulator
33
30
27
0
3
MANTECA
116.0
12
15
NALF CROW'S LANDING
165
27
24
For use with
Microsoft Flight Simulator
®
®
0510
0510
27
24
21
0
LINDEN
114.8
15
6
9
MODESTO CITY-CO.
97
MERCED-MACREADY
153
30
21
30
HANGTOWN
18
3
12
33
PANOCHE
112.6
18
33
115.5
6
15
NAUTICAL
MILES
STATUTE
MILES
0
PLACERVILLE
2583
15
27
24
0
3
12
3
12
COLUMBIA
2118
30
21
6
9
6
9
COLUMBIA
404
33
EL NIDO
114.6
18
0
15
Microsoft Flight Simulator 98 — Pilot’s Guide
43
Page 48

San Francisco
15
Elevation
3366 X 75
L
33
9
R
9
11
5453 X 150
6212 X150
CT
F
27
L
Coordinates
ATIS
27
R
6
37°43'N
122°13'W
128.5
N
AIRPORT CHART
For use with
Microsoft Flight Simulator
L
10
R
10
AIRPORT CHART
For use with
Microsoft Flight Simulator
10000 X 150
F
CT
11870 X 200
10600 X 200
1
R
CT
Oakland, California
29
R
19
7001 X 200
8901 X 200
1L
Oakland/Metropolitan
Oakland International (OAK)
Elevation
Coordinates
L
ATIS
19
28 28
L R
San Francisco, California
San Francisco International Airport (SFO)
VAR 16° E
11
37°37'N
122°22'W
118.85
N
VAR 16° E
Microsoft Flight Simulator 98 — Pilot’s Guide
44
Page 49

Seattle
For use with
Microsoft Flight Simulator
®
Microsoft
Flight
®
0
33
30
27
24
21
18
TATOOSH
112.2
3
6
9
12
15
CANADA
UNITED STATES
ELWHA
515
OLYMPIC MOUNTAINS
FAIRCHILD INT'L
(PORT ANGLELES)
Whidbey ATIS 134.15
288
30
VOR/DME
PAINE
27
110.6
SNOHOMISH COUNTY
24
(PAINE FIELD)
ATIS128.65
606
21
18
33
MARTHA LAKE
500
Simulator
0510
ARLINGTON
137
0
3
HARVEY
16
6
FIRST AIR
FLYING F. RANCH
9
50
12
15
NAUTICAL
MILES
STATUTE
0510
MILES
33
30
27
24
HOQUIAM
21
18
Pacific Ocean
117.7
27
24
ASTORIA
15
VOR
114.0
21
BOEING FIELD
PORT
ORCHARD
370
0
216
12
27
24
3
21
6
9
KING CO. INT'L
ATIS127.75
18
SEATTLETACOMA INT'L.
ATIS 118.0
429
VORTAC
SEATTLE
21
33
30
SPANAWAY
373
18
BREMERTON NATL
439
KITSAP
206
CARNEY
274
MASON CO
348
SANDERSON
0
3
6
9
12
269
VORTAC
OLYMPIA
113.4
27
24
TACOMA
NARROWS
292
GRAYE
33
30
OLYMPIA
CT 124.4
206
21
18
15
116.8
0
VORTAC
McCHORD
109.6
SHADY ACRES
445
12
15
0
3
RENTON
6
353
RENTON
29
9
AUBURN MUNI
57
12
3
6
PIERCE CO.-THUN FLD
9
534
NOTAM
Notice to Airmen
For details, see Seattle Sectional
Aeronautical Chart.
If no ATIS is available (at Olympia for
example), tune in the control-tower
0
33
30
18
3
6
9
12
15
frequency (CT) for information.
Microsoft Flight Simulator 98 — Pilot’s Guide
45
Page 50

Seattle
010°
Puget
Sound
N
VAR 20° E
AIRPORT CHART
For use with
Microsoft Flight Simulator
MISSED APPROACH
Climb to 1100, then climbing
right, turn to 2000 via 250°
heading and 010° bearing
to PA LOM and hold.
MM
114°
339°
1
0
159°
337° (8)
N
M
LOM/IAF
RITTS
396 PA ------
3000
PAINE
110.6 PAE ------
Chan 43
LOCALIZER 109.3
I-PAE ----
294°
339°
MM
0.5
7.3 NM
S
M
070°
A
3300
4500
LOM
2990
A
2
P
5
160°
8000
300°
within 10 NM
339°
159°
3000
N
M
ILS Rwy 16R
Remain
3000
GS 2.80°
TCH 56
CT
8
AIRPORT CHART
For use with
Microsoft Flight Simulator
35
17
5419 X 150
5001 X 150
Elevation
Coordinates
206
46°58'N
122°54'W
F
CT
124.4
N
26
VAR 19° E
Olympia, Washington
Olympia (OLM)
Snohomish County (Paine Field)
R
16
11
34
L
9010 X 150
4514 X 75
Elevation
Coordinates
606
47°55'N
122°17'W
ATIS
L
16
CT
F
3000 X 75
29
34
R
Everett, Washington
128.65
Snohomish County (Paine Field)
8
AIRPORT CHART
For use with
Microsoft Flight Simulator
13
3245 X 50
6349 X 150
31
William R. Fairchild International (CLM)
Elevation
Coordinates
288
48°07'N
123°30'W
No ATIS or CT
N
VAR 21° E
F
26
Port Angeles, Washington
Microsoft Flight Simulator 98 — Pilot’s Guide
46
Page 51

Seattle
R
13
AIRPORT CHART
For use with
Microsoft Flight Simulator
F
L
13
3710 X 100
10001 X 200
CT
R
16
9425 X 150
11900 X 150
Elevation
Coordinates
18
47°32'N
122°18'W
ATIS
127.75
N
31
R
VAR 20° E
31
L
Seattle, Washington
Boeing Field/King County International (BFI)
L
16
Elevation
Coordinates
ATIS
429
47°26'N
122°19'W
118.0
AIRPORT CHART
For use with
Microsoft Flight Simulator
N
CT
34
L
F
34
R
VAR 20° E
Seattle, Washington
Seattle-Tacoma International (SEA)
Microsoft Flight Simulator 98 — Pilot’s Guide
47
Page 52

Caribbean — Northern Area Sightseeing Map
NAUTICAL
MILES
STATUTE
MILES
01020
01020
Microsoft Caribbean
Sightseeing Map of
Northern Caribbean Islands
®
®
MAYAGUANA
TURKS
CAICOS
ISLANDS
Silver Bank
Mouchoir
Bank
DOMINICAN
REPUBLIC
Port-au-Prince
HAITI
Flight
Simulator
Microsoft
ABACO
Little Bahama Bank
GRAND
BAHAMA
BIMINI
FLORIDA
ELEUTHERA
Miami
Nassau
ANDROS
Key West
CAT
Cay Sal
SAN SALVADOR
Bank
SAMANA CAY
CROOKED
RUM CAY
LONG
EXUMA
B A H A M A S
Bahama Bank
Havana
GREAT INA GUA
ACKLINS
Guantanamo Bay
Kingston
JAMAICA
CUBA
Pedro Bank
CAYMAN ISLANDS
DRY TORTUGAS
Microsoft Flight Simulator 98 — Pilot’s Guide
48
Page 53

Caribbean — Southern Area Sightseeing Map
ANGUILLA
(UK)
VIRGIN
San Juan
PUERTO RICO
ST BARTHELEMY
ST MAARTEN (NL)
SABA (NL)
ISLANDS
(USA)
BARBUDA
ANTIGUA
ST KITTS
NEVIS
ST EUSTATIUS (NL)
Saba Bank
MONTSERRAT
DOMINICA
GUADELOUPE
MARTINIQUE
ST LUCIA
BARBADOS
ST VINCENT
GRENADA
ISLA LA BLANQUILLA (VEN)
BONAIRE
TOBAGO
TRINIDAD
ISLA DE MARGARITA (VEN)
ISLA LA ORCHILA (VEN)
VENEZUELA
DOMINICAN
REPUBLIC
Port-au-Prince
HAITI
Santo Domingo
NAUTICAL
MILES
STATUTE
MILES
01020
01020
Microsoft Caribbean
Sightseeing Map of
Southern Caribbean Islands
®
®
Flight
Simulator
Microsoft
NETHERLANDS
ANTILLES (NL)
CURACAO
ARUBA
Microsoft Flight Simulator 98 — Pilot’s Guide
49
Page 54

Caribbean Sectional — North
GREAT INAGUA
376
GREAT INAGUA
SAN SALVADOR
SAN SALVADOR
281
SPRING POINT
COLONEL HILL
PITTSTOWN POINT
MAYAGUANA
RUM CAY
9
EXUMA
112.2
GREAT EXUMA
STELLA MARIS
GEORGE TOWN
328
DEADMANS CAY
526
STELLA MARIS
DUNCAN
TOWN
NAUTICAL
MILES
STATUTE
MILES
01020
01020
For use with Microsoft Caribbean
Scenery Enhancement for
Microsoft Flight Simulator
®
®
Flight
Simulator
Microsoft
224
112.5
ELEUTHERA I
TREASURE CAY
112.9
233
361
MARSH HARBOUR
NORTH ELEUTHERA
MARSH HARBOUR
280
WALKER CAY
WALKER CAY
317
WEST END
FREEPORT
SPANISH CAY
113.2
COOK
TREASURE CAY
DEEP
0
209
365
27
WATER
CAY
WEST END
KEYES
MIAMI
18
GRAND
BAHAMA
18
FREEPORT
248
ANDREW
115.9
227
MONRY
SANDY POINT
MORES ISL
326
ISLANDS
204
0
OPA LOCKA WEST
GREAT HARBOUR
CISTERN CAY
SOUTH BIMINI
0
27
9
MIAMI
OPA LOCKA
27
DADE COLLIER
KENDALL-TAMIAMI
EVERGLADES
ROCK SOUND
GOVERNORS
HARBOR
27
9
0
BIG WHALE CAY
CHUB CAY
CHUB CAY
18
CAT CAY
BIMINI
AFB
18
HOMESTEAD
BISCAYNE BAY
HOMESTEAD
108.2
HOMESTEAD
348
ROCK SOUND
18
PARADISE I
18
NASSAU
302
SAN ANDROS
396
116.7
117.1
MARATHON
9
0
NEW BIGHT
ARTHURS TOWN
CAY
STANIEL
372
NEW PROVIDENCE
CONGO
C A BAIN
251
112.7
NASSAU
ANDROS
MARATHON
KEY WEST NAS
18
27
CUTLASS BAY
HAWKS
NEST
0
BLACK-POINT
TOWN
260
FARMERS CAY
KEY WEST
266
QEEZY
113.5
KEY WEST
332
FISH HOOK
Microsoft Flight Simulator 98 — Pilot’s Guide
50
Page 55

305
ISABELA
Caribbean Sectional — Cuba, Jamaica
278
BARACOA
BARACOA
MOA
212
ALEGRE
450
SANTA CLARA
382
390
CIEGO DE AVILA
SANTA CLARA
CIEGO DE AVILA
256
116.3
NUEVAS
9
0
0
27
9
18
27
IGNACIO AGRAMONTE
315
114.5
SIMONES
MOA
353
HOLGUIN
LAS
18
18
CAMAGUEY
TUNAS
296
TUNAS
114.1
370, 402
NICARO
HOLGUIN
0
300
GUANTANAMO
0
268
BAYAMO
9
MANZANILLO
GUANTANAMO
0
9
BAYAMO
18
18
GUANTANAMO
BAY NAS
27
18
27
ANTONIO MACEO
232
116.0
MANZANILLO
GERRARD
SMITH
NS GUANTANAMO BAY
339
113.3
SANTIAGO DE CUBA
114.6
276.2
0
PORT ANTONIO
BOSCOBEL
0
SANGSTER
18
27
248
115.7
MONTEGO BAY
NORMAN MANLEY
TINSON PEN
18
27
360
115.9
KINGSTON
VARDER
116.1
HAVANA
250
109.2
PLAYA BARACOA
272
112.3
339, 348
0
420
VARDER
0
9
VARADERO
27
9
PLAYA
BARACOA
18
18
18
VARDER
ZARAGO
JOSE MARTI
380
CAYABO
430
283
PINAR DEL RIO
212
CIENFUEGOS
296
BATANO
SAN JULIAN
CIENFUEGOS
CAYO LARGO
DEL SUR
NUEVA
GERONA
GERONA
465
LA COLOMA
353, 402
SAN JULIAN
CAYO LARGO DEL SUR
278, 412
230
LITTLE
CAYMAN
415
CAYMAN BRAC
OWEN
ROBERTS
GRAND CAYMAN
115.6
344
18
27
NAUTICAL
MILES
STATUTE
MILES
For use with Microsoft Caribbean
Scenery Enhancement for
®
Microsoft
01020
Microsoft Flight Simulator
01020
®
Flight
Simulator
0
Microsoft Flight Simulator 98 — Pilot’s Guide
51
Page 56

232
114.2
GRAND TURK
0
MIDDLE CAICOS
NORTH CAICOS
S. CAICOS
PINE CAY
PARROT CAY
W. CAICOS
PROVIDENCIALES
Caribbean Sectional — Haiti, Puerto Rico
NAUTICAL
MILES
STATUTE
MILES
01020
01020
For use with Microsoft Caribbean
Scenery Enhancement for
Microsoft Flight Simulator
®
®
Flight
Simulator
Microsoft
450
115.1
PUERTO PLATA
0
GRAND TURK
18
27
SALT CAY
260
S. CAICOS
387
PROVIDENCIALES
255
114.9
SANTIAGO
MONTE CRISTI
332
PORT DE PAIX
MONTE CRISTI
0
205
PORT DE
PAIX
300
DE MACORIS
SAN FRANCISCO
PUERTO PLATA
CIBAO
27
27
CAP HAITIEN
18
DAJABON
27
288
113.9
CAP HAITIEN
ANEGADA
360
BEEF ISLAND
0
108.6
ST THOMAS
PUNTA
0
27
ARROYO BARRIL
0
200
GUERRA
SAN ISIDRO
18
CONSTANZA
9
0
PORT-AU-PRINCE
JEREMIE
384
JEREMIE
VIRGIN
GORDA
BEEF ISL
9
C E KING
27
PUERTO RICO
(see enlargement)
CANA
LA ROMANA
9
LAS AMERICAS
HERRERA
BARAHONA
9
18
27
JACMEL
CAYES
9
0
18
325
LA ROMANA
410
HERRERA
CABO ROJO
27
213
JACMEL
350
CAYES
18
HAMILTON
27
112.7
PUNTA CANA
220
SAN ISIDRO
18
OBLEON
425
PUNTA CAUCEDO
113.2
PORT AU PRINCE
241
PESTE
400
114.7
CABO ROJO
270
115.3
ST CROIX
114.3
108.2
114.0
SAN JUAN
0
LUIS MUNOZ MARIN
0
DOMINICCI
27
DORADO
ARECIBO
9
0
HERNANDEZ
113.5
BORINQUEN
ISLA DE CULEBRA
ROOSEVELT ROADS NS
TORRES
330
PATTY
391
DORADO
18
DE HOSTOS
0
27
RODRIGUEZ
113.8
18
ROOSEVELT ROADS
HUMACAO
9
0
MERCEDITA
18
110.6
MAYAGUEZ
PATILLAS
SANTA ISABEL
109.0
PONCE
Microsoft Flight Simulator 98 — Pilot’s Guide
52
Page 57

Caribbean Sectional — Windward Islands
Microsoft
Flight
Simulator
GOLDEN ROCK
For use with Microsoft Caribbean
Scenery Enhancement for
®
Microsoft Flight Simulator
®
01020
01020
NAUTICAL
MILES
STATUTE
MILES
ST MAARTEN
113.0
308
PRINCESS
JULIANA
SABA
F D ROOSEVELT
GOLDEN ROCK
112.0
325
0
WALLBLAKE
GRAND CASE
ST BARTHELEMY
18
0
NEWCASTLE
LE RAIZET
402
GRAND BOURG
376
POINT SALINES
CODRINGTON
9
27
BLACKBURNE
BAILLIF
LES SAINTES
MELVILLE HALL
CANEFIELD
260
FORT DE FRANCE
113.3
314
E T JOSHUA
CANOUAN
302
WALLBLAKE
209
ST BARTHELEMY
338
COCOA POINT
0
V C BIRD
18
0
LE RAIZET
27
VIGIE
415
HEWANORRA
403
UNION
0
18
ST FRANCOIS
18
CANEFIELD
27
CANOUAN
9
BEQUIA
V C BIRD
114.5
351, 369
POINT A PITRE
115.1
300
GRANDE ANSE
MARIE GALANTE
MELVILLE HALL
0
LE LAMENTIN
18
VIGIE
9
18
E T JOSHUA
PT SALINES
117.1
362
273
HEWANORRA
112.4
G. ADAMS
305
ADAMS
112.7
0
9
18
345
CROWN POINT
0
PIARCO
27
18
CROWN POINT
323
PIARCO
116.9
382
Microsoft Flight Simulator 98 — Pilot’s Guide
53
Page 58

Caribbean Sectional — South
NAUTICAL
MILES
STATUTE
MILES
For use with Microsoft Caribbean
Scenery Enhancement for
®
Microsoft
01020
Microsoft Flight Simulator
01020
®
Flight
Simulator
116.7
CURACAO
112.5
ARUBA
343
0
0
BEATRIX
113.1
GRAN ROQUE
0
321
BONAIRE
CURACAO
0
27
18
REINA BEATRIX
0
27
113.8
9
27
FLAMINGO
PUNTA SAN JUAN
18
0
9
CAMEJO
206
114.1
MARGARITA
218
GILES
LA BLANQUILLA
LA ORCHILA
18
114.8
MAIQUETIA
112.9
PUERTO CUMAREBO
9
18
CHIRINOS
270
CARUPANO
DEL CARIBE
0
113.5
CABO CODERA
0
0
292
116.1
NO LEON
9
18
27
18
117.3
CORO
385
113.6
PARAGUANA
GUIRIA
GEN BERMUDEZ
18
A. DE SUCRE
0
27
ISLA DE COCHE
0
9
18
HIGUEROTE
ZULOAGA
SIMON BOLIVAR
MARACAY
GEN DE MIRANDA
PUNTA BRAVA
GEN SALOM
SAN FELIPE
117.7
PUERTO CABELLO
CHURUGUARA
EL
RIO DE AGUA
18
18
METROPOLITANO
LIBERTADOR
CUMANA
18
GEN ANZOATEGUI
27
HIGUEROTE
CARACAS
18
VALENCIA
230
SAN FELIPE
PEDERNALES
113.3
115.9
BARCELONA
353
115.2
318
SAN SEBASTIAN
LOMAS
HACIENDA LAS
LA BANANERA
EL LIBERTADOR
380
VALENCIA
113.9
Microsoft Flight Simulator 98 — Pilot’s Guide
54
Page 59

Caribbean Sectional — Major Airports
VAR 13° W
09
AIRPORT CHART
For use with
Microsoft Flight Simulator
Elevation
Coordinates
ATIS
08
N
8
19°17'N
81°21'W
120.2
F
CT
Elevation
Coordinates
CT
F
11,000 x 148
Bridgetown, Barbados
169
13°04'N
59°30'W
118.7
Grantley Adams Intl
Elevation
Coordinates
CT
27
10
AIRPORT CHART
For use with
Microsoft Flight Simulator
Elevation
Coordinates
56
19°54'N
75°13'W
126.2
210
22°58'N
N
VAR 06° W
F
CT
8000 x 200
Guantanamo Bay, Cuba
Guantanamo Bay NAS (Leeward Point Field)
23
28
82°25'W
ATIS
26
CT
132.5
CT
F
N
7000 x 151
13,123 x 148
VAR 01° W
N
AIRPORT CHART
For use with
Microsoft Flight Simulator
VAR 00° W
Grand Cayman, Cayman Is
Owen Roberts Intl
05
AIRPORT CHART
For use with
Microsoft Flight Simulator
Havana, Cuba
Jose Marti Intl
Microsoft Flight Simulator 98 — Pilot’s Guide
55
Page 60

Caribbean Sectional — Major Airports
09
AIRPORT CHART
For use with
Microsoft Flight Simulator
12
N
VAR 02° W
4800 x 100
N
VAR 03° W
Elevation
Coordinates
CT
F
CT
Elevation
Coordinates
CT
4
24°33'N
81°45'W
118.2
Key West, FL
Key West Intl
10
17°56'N
76°47'W
120.6
CT
27
09
AIRPORT CHART
For use with
Microsoft Flight Simulator
Elevation
Coordinates
ATIS
14
Elevation
Coordinates
10
25°03'N
77°28'W
CT
F
11,000 x 150
ATIS
118.7
N
8235 x 150
27
VAR 05° W
32
Nassau, Bahamas
Nassau Intl
10
18°26'N
66°00'W
125.8
10,002 x 200
F
26
N
VAR 11° W
8786 x 150
AIRPORT CHART
For use with
Microsoft Flight Simulator
Microsoft Flight Simulator 98 — Pilot’s Guide
56
F
30
Kingston, Jamaica
Norman Manley Intl
8
10
AIRPORT CHART
For use with
Microsoft Flight Simulator
CT
8016 x 150
28
San Juan, Puerto Rico
Luis Munoz Marin Intl
Page 61

ODIHAM
109.6
WYCOMBE AIR PARK
520
WOODLEY
352
BLACKBUSHE
116.2
BLACKBUSHE
329
33
30
27
24
21
30
27
0
18
WESTCOTT
335
HENTON
395
WHITE
WALTHAM
130
0
33
21
12
15
18
9
HALTON
372
3
6
15
MIDHURST
114.0
HEATHROW
OW389
FAIROAKS
109.85
27
9
FAIROAKS
12
FARNBOROUGH
237
33
30
27
24
21
33
30
27
24
21
DENHAM
249
BURNHAM
421
33
30
24
348
21
0
18
0
0
3
15
BOVINGDON
18
33
30
HEATHROW
ATIS 123.9
80
24
21
18
24
DUNSFOLD
172
6
9
12
LUTON
ATIS 120.57
526
113.75
3
HATFIELD (CLOSED)
6
254
9
12
15
CHILTERN
0
18
3
6
0
12
15
21
18
London
LEAVESDEN (CLOSED)
335
277
NORTHOLT
124
LONDON
6
113.6
9
15
OCKHAM
3
115.3
6
9
12
15
GATWICK
PANSHANGER
250
ELSTREE
334
HEATHROW
OE389
EPSOM
316
REDHILL
221
GATWICK
ATIS 128.47
196
365
LUTON
345
30
27
24
0
3
15
18
33
30
27
24
21
LONDON CITY
17
322
3
BIGGIN HILL
ATIS 121.87
600
15
33
21
BARKWAY
6
9
12
NORTH WEALD
321
0
STAPLEFORD
18
BIGGIN
115.1
6
9
12
0
3
18
116.25
3
15
15
STANSTED
ATIS 127.17
347
6
9
12
LAMBOURNE
6
9
12
115.6
STANSTED
359
ANDREWSFIELD
286
33
30
27
24
21
BROOKMANS PARK
0
21
18
BPK 117.5
3
6
9
12
15
LONDON CITY
0
33
30
27
24
21
343
MAYFIELD
117.9
GATWICK
338
18
30
27
24
REDHILL
For use with
Microsoft Flight Simulator
®
Microsoft
Flight
®
Simulator
0510
0510
NAUTICAL
MILES
STATUTE
MILES
NOTAM
Notice to Airmen
For details, see Southern England and Wales
Sectional (International Civil Aviation
Organization).
If no ATIS is available, tune in the control-tower
frequency (CT) for information.
Microsoft Flight Simulator 98 — Pilot’s Guide
57
Page 62

London
Elevation
Coordinates
600
51°19'N
00°02'E
ATIS
AIRPORT CHART
For use with
Microsoft Flight Simulator
Elevation
Coordinates
121.87
17
51°30'N
00°03'E
CT
118.4
Elevation
21
N
VAR 04° W
CT
5932 X 151
03
11
2677 X 79
29
London, UK
Biggin Hill
Coordinates
ATIS
8L
AIRPORT CHART
For use with
Microsoft Flight Simulator
Elevation
N
VAR 04° W
10
3934 X 98
28
Coordinates
ATIS
196
N
51°09'N
00°11'W
VAR 04° W
128.47
CT
26R
8415 X 148
10364 X 151
8R
26L
London, UK
Gatwick
80
27R
N
VAR 04° W
23
51°28'N
00°27'W
123.9
9L
12802 X 148
CT
AIRPORT CHART
For use with
Microsoft Flight Simulator
Microsoft Flight Simulator 98 — Pilot’s Guide
58
London, UK
London City
9R
AIRPORT CHART
For use with
Microsoft Flight Simulator
12000 X 148
CT
6450 X 148
27L
F
London, UK
Heathrow
Page 63

NAUTICAL
MILES
STATUTE
MILES
SCHÄRDING-
SUBEN
1073
Munich
For use with
Microsoft Flight Simulator
®
ARNBRUCK
1716
Microsoft
9
12
6
3
0
RODING
114.70 RDG
33
30
27
24
REGENSBURG-
OBERHUB
1298
GUNZENHAUSEN-
REUTBERG
1591
0510
®
Flight
Simulator
15
18
21
0510
DEGGENDORF
STRAUBING-
WALLMÜHLE
1046
NOTAM
Notice to Airmen
For details, see the Munich
Sectional (International Civil
Aviation Organization).
If no ATIS is available (at
Augsburg, for example), tune in
the control-tower frequency (CT)
356 SU
0
410 SI
6
3
33
30
for information.
SALZBURG
1411
9
12
15
18
EURACH
115.20 EUR
21
27
24
ST. JOHANN/TIROL
2198
RATTENBERG
ZELL AM SEE
2470
303 RTT
420 INN
313 AB
INNSBRUCK
ATIS 126.02
1900
FÜRSTENZELL
1345
9
12
MILLDORF
117.00 MDF
24
9
27
12
21
JESENWANG
CT 122.425
12
15
1861
15
21
112.30 MUN
24
18
3
0
33
18
12
15
18
21
OBERPFAFFENHOFEN
1946
448 LQ
6
SALZBURG
30
NEUBIBERG
113.80 SBG
27
1811
429 OBI
24
382 SBG
21
VOGTAREUTH
1535
15
18
VILSHOFEN
991
1030
EGGENFELDEN
1342
MÜHLDORF
1325
9
18
18
318 AGB
338 MNW
3
0
33
MUNICH
ATIS 118.37
1486
AUGSBURG
CT 118.22
1515
400 MSW
6
30
358 MNE
3
0
33
3
0
9
27
385 MSE
33
30
30
12
113.60 ERD
3
0
24
33
9
27
27
15
18
6
21
30
MAISACH
108.40 MAH
24
3
0
33
345 IGL
3
0
33
DONAUWÖRTH-
GENDERKINGEN
1312
9
12
6
6
15
117.15 MBG
MOOSBURG
21
30
27
24
LANDSHUT
1312
MIKE
426.5 MIQ
9
12
15
WALDA
112.80 WLD
21
30
27
24
NÖRDLINGEN
1378
375 NDG
AALEN-
HEIDENHEIM/ELCHI
NGEN
1916
GIENGEN/
BRENZ
1695
MINDELHEIM-
MATTSIES
1857
9
12
6
3
0
LEUTKIRCH-
UNTERZEIL
2099
33
15
18
KEMPTEN
109.60 KPT
21
30
27
24
Microsoft Flight Simulator 98 — Pilot’s Guide
59
Page 64

Munich
Elevation
Coordinates
1515
48°26'N
10°56'E
CT
7
AIRPORT CHART
For use with
Microsoft Flight Simulator
Elevation
Coordinates
118.22
F
1900
47°16'N
11°21'E
ATIS
126.02
4199 X 98
CT
Glider Area
N
25
VAR 0°
Augsburg, Germany
Augsburg
N
VAR 0°
Elevation
Coordinates
1861
48°11'N
11°08'E
CT
7
AIRPORT CHART
For use with
Microsoft Flight Simulator
Elevation
Coordinates
122.42
1486
48°21'N
11°47'E
ATIS
118.37
N
VAR 0°
CT
1460 X 39
F
25
Jesenwang, Germany
Jesenwang
R
13123 X 197
8
L
26
Glider strip
6562 X 148
8
AIRPORT CHART
For use with
Microsoft Flight Simulator
Microsoft Flight Simulator 98 — Pilot’s Guide
60
CT
F
Innsbruck, Austria
Innsbruck
26
AIRPORT CHART
For use with
Microsoft Flight Simulator
F
CT
L
26
8
R
13123 X 197
N
VAR 0°
Munich, Germany
Munich
Page 65

Paris
NIERGNIES
312
PERONNE-ST QUENTIN
For use with
Microsoft Flight Simulator
9
6
3
0
DIEPPE
33
30
27
PM 382
292
GI 339
GLISY
197
®
Flight
Microsoft
12
15
18
DPE 115.8
21
24
NAUTICAL
MILES
STATUTE
MILES
0510
0510
®
Simulator
12
6
3
0
33
CO 553.5
9
12
6
3
0
33
15
18
MTD 113.65
MONTDIDIER
21
30
24
27
9
12
6
3
0
BEAUVAIS
BVS 115.9
33
30
24
27
TILLE
358
BV 391
9
12
6
3
0
33
15
18
ROUEN
ROU 116.8
21
30
24
27
REIMS
30
27
PRUNAY
312
3
0
6
3
0
33
30
15
18
21
VALEE DE SEINE
512
15
18
(D)REM 112.3
21
24
9
12
6
3
0
33
9
6
33
30
9
12
CREIL
(D)CRL 109.2
24
27
PERSAN-
BEAUMONT
148
3
0
33
30
BOURSON
27
15
21
6
3
0
18
30
BSN 112.5
0
33
27
12
24
3
33
9
6
CHATILLON
(D)CTL 117.6
24
15
18
21
6
(D)CDG
PGS 117.05
CGN 115.35
0
33
RSO 364
PONTOISE
PON 111.6
27
CORMEILLES-
30
15
18
21
RSY 356
9
30
12
24
EN-VEXIN
325
EVREUX
27
CGZ 370
12
CH.-DE-GAULLE
ATIS 128.0
27
CGO 343
15
18
21
15
(D)EVX 112.4
21
24
3
0
15
387
(D)BT 108.8
24
BGW 334
18
6
33
15
LE BOURGET
21
ST ANDRE
DE L'EURE
489
30
ATIS 120.0
18
9
217
3
0
(D)CLM 112.9
COULOMMIERS
24
27
6
TH 302
33
TOUSSUS-
LE-NOBLE
0
TA 286.5
HOL 315
12
OYE 349
9
538
3
BRY 277
6
3
0
33
15
18
21
ORLY
ATIS 126.5
292
12
15
18
OLS 328
(D)OL 111.2
21
24
27
ORW 402
9
12
6
(D)RBT 114.7
RAMBOUILLET
33
30
24
27
9
12
6
3
0
EPERNON
EPR 115.65
33
30
24
27
3
0
33
30
MV 434
9
6
3
0
MELUN
33
30
27
15
18
21
15
18
21
9
12
6
15
CHARTRES
(D)CHW 115.2
21
30
24
27
9
12
6
3
0
33
TY 320
BARBEREY
394
9
12
BRAY
(D)BRY 114.1
24
27
12
15
18
MEL 109.8
21
24
EM 295.5
15
18
TROYES
TRO 116.0
21
30
24
27
JOIGNY
12
PIV 116.5
PITHIVIERS
24
728
15
18
21
15
18
21
9
6
3
0
33
30
27
OAN 385
CHATEAUDUN
433
9
12
6
3
0
33
18
30
CDN 359.5
27
CHATEAUDUN
(D)CDN (116.1)
24
15
18
21
Pas de Calais
(Straight of Dover)
LHO 346
OCTEVILLE
CT 119.15
312
9
12
6
3
0
33
15
18
DVL 110.2
DEAUVILLE
21
30
24
27
ST GATIEN
479
NOTAM
Notice to Airmen
For details, see the Northeastern France
Sectional (International Civil Aviation
Organization).
If no ATIS is available (at Le Havre, for
example), tune in the control-tower
Microsoft Flight Simulator 98 — Pilot’s Guide
AL 380
frequency (CT) for information.
ARNAGE
194
61
Page 66

Paris
Elevation
Coordinates
387
49°01'N
02°33'E
ATIS
128.0
9
AIRPORT CHART
For use with
Microsoft Flight Simulator
Elevation
Coordinates
217
48°58'N
02°27'E
ATIS
120.0
N
VAR 03° W
AIRPORT CHART
For use with
Microsoft Flight Simulator
7
9
11811 X 148
CT
3
10
27
F
9843 X 148
6053 X 148
8743 X 197
CT
11860 X 148
Charles de Gaulle
21
F
N
VAR 03° W
Paris, France
25
27
Paris, France
Le Bourget
Elevation
Coordinates
CT
28
AIRPORT CHART
For use with
Microsoft Flight Simulator
Elevation
Coordinates
ATIS
7
AIRPORT CHART
For use with
Microsoft Flight Simulator
312
49°32'N
00°05'E
119.15
05
292
48°44'N
02°23'E
126.5
11975 X 148
23
11
2461 GRASS
N
29
7536 X 131
F
CT
VAR 04° W
Le Havre, France
Octeville
N
VAR 03° W
R
20
25
CT
8
F
10892 X 148
2
L
7874 X 197
26
Paris, France
Orly
Microsoft Flight Simulator 98 — Pilot’s Guide
62
Page 67

T o Yokota
AFB
To Mt. Fuji
Microsoft
Flight
Simulator
Tokyo
Metro
Building
®
Microsoft Japan Sightseeing Map
®
of Tokyo Area
0
0
Shinjuku
National
Stadium
Japan — Tokyo Sightseeing Map
1
MILE
1
KILOMETER
T oky o Dome
Nippon Budokan
Hall
Imperial
Palace &
Gardens
Akasaka
Palace
Diet
Building
Sensoji T emple
e
iv
R
a
id
m
u
S
r
NHK
Yoyogi Sports
Center
T o Haneda
Tokyo
Tower
Ginza
R
a
in
b
o
w
Microsoft Flight Simulator 98 — Pilot’s Guide
63
Page 68

Japan — Inland Sea Sightseeing Map
Yodo
Osaka
Kobe
Akashi
Akashi Kaikyo
Bridge
Wakayama
River
To Osaka
Airport
Osaka
Osaka
Downtown
Castle
Osaka
To Kobe
Shitennoji
Temple
Himeji
Okayama
Honshu
Shodoshima
Seto Ohashi
Kurashiki
Fukuyama
Onomichi
Awajishima
Dai Naruto
Bridge
Takamatsu
Marugame
Bridge
In'noshima
Naruto
Omishima
Tokushima
Shikoku
Niihama
O-shima
Imabari
Matsuyama
MILES
KILOMETERS
010
010
Microsoft Japan Sightseeing Map of
Inland Sea Area
®
®
Flight
Simulator
Microsoft
Microsoft Flight Simulator 98 — Pilot’s Guide
64
Kure
Hiroshima
Miyajima
Iwakuni
Hiroshima
Yashirojima
Peace
Park
Atomic Dome
Hiroshimanishi
Airport
Page 69

Japan Area Sectionals
WAKKANAI
ISHIGAKI
NAHA
Japan - 3
KAGOSHIMA
FUKUOKA
KOCHI
Japan - 2
HIROSHIMA
OSAKA
NAGOYA
IWO JIMA
NIIGATA
TOKYO
AKITA
NEW TOKYO
HAKODATE
SENDAI
Japan - 1
True North
MISAWA
CHITOSE
KUSHIRO
Microsoft Flight Simulator 98 — Pilot’s Guide
65
Page 70

Japan — Sectional 1
REBUN
REBUN
116.2
Microsoft Flight Simulator 98 — Pilot’s Guide
66
9
27
27
9
18
RISHIRI
RISHIRI
114.6
OKUSHIRI
KOMATSU
0
27
112.0
232
WAKKANAI
18
WAKKANAI
115.3
SAPPORO
113.9
357
9
18
OKUSHIRI
115.2
9
KAMIISO
257
MATSUMAE
112.1
TOYAMA
115.8
0
27
FUKUI
MONBETSU
ASAHIKAWA
(military)
ASAHIKAWA
113.5
334
SAPPORO
0
9
18
27
CHITOSE
CHITOSE
116.9, 109.2
347
HAKODATE
OMINATO
0
9
18
27
SADO
SADO
369.5
TOYAMA
0
27
9
KOMATSU
18
FUKUI
400
NAGOYA
0
27
NAGANUMA
0
9
0
18
27
27
NEW CHITOSE
0
9
18
27
114.85
353
TOHOKU
AOMORI
AOMORI
114.1
AKITA
116.1
9
18
27
0
27
9
ASAHIKAWA
18
TOKACHI
239
376.5
9
0
18
27
HAKODATE
112.3
388
0
27
114.9
0
27
0
0
27
27
SHONAI
SHONAI
109.6
NIIGATA
HOTAKA
387
0
27
MATSUMOTO
NAGOYA
114.2
360
0
9
18
MONBETSU
110.0
9
18
MEMANBETSU
110.85
9
MUKAWA
116.4
18
9
OMINATO
18
0
9
27
9
27
27
18
MISAWA
115.4
HANAMAKI
9
9
AKITA
18
YUWA
113.7
0
9
18
27
ZAO-YAMADA
0
9
18
27
NIIGATA
115.5
253
9
MATSUMOTO
18
SHIZUHAMA
0
9
18
27
MEMANBETSU
AKAN
221
TOKACHI
0
9
18
27
OBIHIRO
Microsoft
Flight
Simulator
9
MISAWA
9
HACHINOHE
18
HACHINOHE
108.6
381
0
27
YAMAGATA
0
27
110.8
TOYOSAKA
203
UTSUNOMIYA
See Tokyo
Terminal
Control Area
(TCA) map
for details
117.6
YAIZU
344
0
9
NAKASHIBETSU
18
27
NAKASHIBETSU
0
9
KUSHIRO
18
27
KUSHIRO
YAMAGATA
0
27
NASU
114.8
112.5
194
OBIHIRO
109.65
325.5
For use with Microsoft Japan
Scenery Enhancement for
®
Microsoft Flight Simulator
®
01020
NAUTICAL
MILES
STATUTE
01020
MILES
0
9
MIYAKO
18
27
116.6
209
9
HANAMAKI
112.8
18
328
MATSUSHIMA
113.0
9
229
9
18
FUKUSHIMA
113.45
FUKUSHIMA
0
27
0
9
18
27
SENDAI
116.3
248
0
27
0
18
27
0
27
OSHIMA
OSHIMA
113.1
392, 214
114.3
9
MATSUSHIMA
18
KASUMINOME
SENDAI
9
18
0
NIKKO
389
27
115.6
265
True North
0
9
IWAKI
18
27
117.7
9
DAIGO
18
115.3
221
0
9
0
9
18
27
0
9
18
27
0
27
TATEYAMA
9
112.5, 108.8
18
27
9
18
9
TATEYAMA
18
373
9
18
9
0
27
18
27
0
9
0
9
0
27
0
9
18
27
0
27
Page 71

NIIGATA
SADO
KOMATSU
112.0
232
OKI
114.6
MIHO
116.7
284
9
18
OKI
27
IZUMO
IZUMO
114.1
IWAMI
115.05
TOYOTA
117.2
ASHIYA
108.6
232
FUKUOKA
114.5
203
TSUSHIMA
9
0
9
27
27
TSUSHIMA
TSUSHIMA
111.45
393
0
27
SADO
369.5
TOYAMA
115.8
KOMATSU
TAJIMA
TOTTORI
9
0
0
27
IWAKUNI
109.8
0
IWAMI
OZUKI
112.15
253
OZUKI
ASHIYA
0
IKI
18
SHIMO-
113.6
KAMIGOTO
367
18
NIIGATA
115.5
0
0
FUKUI
400
TAJIMA
110.45
0
27
OKAYAMA
18
MIHO
18
YONAGO
113.4
HONGO
117.9
HIROSHIMA-
NISHI
9
IWAK-
27
UNI
HOFU
9
0
27
0
0
9
18
27
IKISHIMA
113.2
355
FUKUE
253
9
27
9
27
MIYAZU
112.6
0
27
9
KUGA
114.3
0
18
27
27
OMURA
114.05
342.5
HOTAKA
18
18
9
TOTTORI
18
OKAYAMA
9
0
Japan — Sectional 2
0
0
UTSUNOMIYA
387
TOYAMA
FUKUI
112.25
OTSU
117.1
368
9
ITAMI
0
18
211
OSAKA
27
KANSAI
18
111.8
346
110.2
SHODO
114.4
115.9
0
0
27
KOHNAN
KIBI
111.0
9
0
18
HIROSHIMA
27
KANON
109.85
18
9
27
0
18
27
HOFU
9
113.0
UBE
27
9
110.8
18
UBE
TSUIKI
9
110.4
18
27
18
KITAKYUSHU
FUKUOKA
18
METABARU
9
0
27
NAGASAKI
9
18
27
NIKKO
389
See Tokyo
Terminal
Control Area
(TCA) map
for details
9
0
18
27
MATSUMOTO
117.6
NAGOYA
114.2
360
0
GIFU
GIFU
0
KANSAI
AWAJI
115.6
9
9
0
TOKUSHIMA
18
27
0
0
27
TAKAMATSU
117.5
9
0
27
MATSUYAMA
MUSASHI
117.7
9
0
27
TSUIKI
KOKURA
0
ISAHAYA
18
NAGASAKI
FUKUE
115.8
263
MATSUMOTO
HAMAMATSU
110.0, 114.7
27
AICHI
9
27
9
0
27
0
9
TAKAMATSU
FUTAGAMI
18
OITA
9
27
115.4
370
9
27
KUMAMOTO
112.8
195
116.6
0
0
27
109.2
9
NAGOYA
18
27
0
397
OSAKA
113.9
340
18
SHIGI
9
111.6
0
18
9
YAO
18
27
TOMO
0
18
116.4
0
18
9
27
27
KAGAWA
18
108.4
9
0
27
KOCHI
113.7
382
MATSUYAMA
116.3
18
OITA
112.1
259
NYUTABARU
18
KUMAMOTO
KAGOSHIMA
249
KAJIKI
115.7
201
KAGOSHIMA
113.3
390
9
0
YAIZU
344
0
9
27
AKENO
9
0
27
18
TOKUSHIMA
114.9
332.5
18
KOCHI
399
0
0
0
18
18
27
27
18
9
0
0
27
0
27
OSHIMA
9
0
27
9
18
HAMAMATSU
27
KOWA
113.5
325
18
AKENO
380
YAO
386
SHINODA
112.3
219
GOBOH
116.9
18
NANKISHIRAHAMA
9
18
27
SHIMIZU
115.2
363
9
9
27
27
9
9
0
18
27
9
0
TATEYAMA
18
112.5,108.8
9
27
18
9
9
0
18
TATEYAMA
18
27
9
0
18
27
OSHIMA
113.1
392, 214
18
SHIZUHAMA
For use with Microsoft Japan
Scenery Enhancement for
Microsoft Flight Simulator
9
0
18
27
NANKI
394
KOMATSUJIMA
113.55
352
NYUTABARU
115.0
MIYAZAKI
112.4
229
18
MIYAZAKI
KOKUBU
117.3
9
18
KANOYA
27
KANOYA
113.8
238
373
MIYAKEJIMA
9
0
27
Microsoft
Simulator
01020
010 20
KUSHIMOTO
112.9
267
9
0
18
TANEGASHIMA
27
9
0
18
27
YAKUSHIMA
117.8
238
MIYAKEJIMA
18
HACHIJOJIMA
®
Flight
®
NAUTICAL
MILES
STATUTE
MILES
True North
MISHIMA
110.6
TANEGASHIMA
116.2
333
YAKUSHIMA
117.0
HACHIJOJIMA
340
N34 E131
Microsoft Flight Simulator 98 — Pilot’s Guide
67
Page 72

Japan — Sectional 3
Microsoft
Flight
Simulator
N25 E131
MINAMIDAITO
N27 E142
CHICHIJIMA
257
N24 E141
IWO JIMA
109.8
360
N24 E153
MINAMI
TORISHIMA
108.6
343
0
9
FUKUE
27
18
FUKUE
115.8
263
For use with Microsoft Japan
Scenery Enhancement for Microsoft
®
Flight Simulator
®
01020
NAUTICAL
MILES
STATUTE
01020
MILES
0
27
0
27
KITADAITO
MINAMIDAITO
9
IWO JIMA
18
MINAMI
TORISHIMA
9
18
405
KAGOSHIMA
KAJIKI
115.7
201
True North
AGUNI
268
KUMEJIMA
KAGOSHIMA
113.3
390
TOKUNOSHIMA
NAHA
115.1
AGUNI
0
9
27
18
KUMEJIMA
116.7
MIYAZAKI
0
27
18
KANOYA
113.8
238
YAKUSHIMA
YAKUSHIMA
117.0
AMAMI
AMAMI
115.5
116.0
346
ERABU
113.1
398
YORON
112.25
IEJIMA
0
NAHA
27
OKINAWA
308
295
MIYAZAKI
27
18
9
KOKUBU
9
27
18
KANOYA
TANEGASHIMA
0
0
27
18
TANEGASHIMA
116.2
333
KIKAI
382
0
0
27
0
9
TOKUNO-
27
18
SHIMA
0
9
OKIERABU
27
18
0
9
27
18
YORON
KADENA
112.0
IE SHIMA
9
KADENA
9
FUTENMA
18
CHINEN
FUTENMA
110.50
112.4
229
117.3
9
18
9
18
KASARI
112.7
114.2
9
18
YONAGUNI
115.3
355
0
27
YONAGUNI
Microsoft Flight Simulator 98 — Pilot’s Guide
68
SHIMOJISHIMA
TARAMA
371
ISHIGAKI
9
18
SHIMOJISHIMA
117.1
250
0
9
27
18
HATERUMA
332
0
27
TARAMA
ISHIGAKI
117.7
349
9
MIYAKOJIMA
MIYAKOJIMA
18
117.5
340
Page 73

6
HYAKURI
CT 126.2
105
9
30
27
TACAN
12
HYAKURI
24
113.3
15
18
21
NAUTICAL
Ocean
Pacific
9
6
3
0
33
30
KASUMIGAURA
CT 126.2
82
6
3
0
33
MILES
STATUTE
MILES
Japan — Tokyo Terminal Control Area
12
9
6
3
0
33
NEW TOKYO INTL
NARITA
CT 118.2, 122.7
ATIS 128.25
9
6
3
342
NDB
KUZUMI
0
6
12
114.0
MORIYA
24
15
18
21
3
0
33
NDB
SHIMOFUSA
3
0
SHIMOFUSA
CT 126.2
98
206
6
33
30
112.7
SAKURA
27
VOR/DME
9
30
24
TACAN
27
12
15
18
AMI
116.0
VOR/DME
21
24
27
9
6
3
0
9
VOR/DME
30
27
33
12
15
117.0
SEKIYADO
24
VOR/DME
30
27
18
21
30
27
135
12
24
18
21
12
108.2
SHIMOFUSA
24
VORTAC
15
21
15
18
21
113.6
CHOSHI
24
NDB
18
15
18
21
256
YOKOSHIBA
117.3
NARITA
VOR/DME
385
NDB
ARAKAWA
NOTAM
Notice to Airmen
See Tokyo T erminal Control Area
chart for details.
Localizer frequencies will be
provided by ATIS at the selected
airport. Those frequencies agree
with Instrument
Approach Procedures.
Not all airports have ATIS or
control-tower (CT)
communications available.
115.7
ONJUKU
VORTAC
12
9
6
3
0
33
30
27
350
NDB
ONJUKU
114.5
VOR/DME
KISARAZU
12
9
KISARAZU
CT 126.2
NDB
KISARAZU
10
15
18
21
24
27
200
6
3
CT 118.1
12
24
ATIS 128.8
15
15
18
VOR/DME
21
0
109.4
HANEDA
33
30
12
9
6
115.0
15
KOHTOH
TOKYO INTL
VOR/DME
3
0
33
30
HANEDA
33
30
27
0510
0510
For use with Microsoft Japan Scenery Enhancement
for Microsoft Flight Simulator
®
®
Flight
Simulator
Microsoft
283
NDB
KUMAGAYA
337
228
NDB
OMIYA
CHOFU
366
NDB
SHIN-TACHIKAWA
12
15
TACHIKAWA
18
21
24
CT 118.0, 126.2
CT 126.2
TACAN
YOKOTA
0
3
IRUMA
CT 126.2
6
33
110.6
IRUMA
TACAN
299
12
9
30
YOKOTA
CT 120.3
ATIS 128.4
457
15
9
6
24
27
33
30
27
NDB
HANEDA
263
NDB
135
NDB
401
NDB
ZAMA
313
113.8
357
EDA
NDB
KASTNER
3
0
379
6
33
KASTNER
CT 122.5
30
ATSUGI
9
361
27
TACAN
12
ATSUGI
24
15
18
115.1
21
ATSUGI
CT 126.2
3
0
205
Microsoft Flight Simulator 98 — Pilot’s Guide
6
33
NDB
CHIGASAKI
12
9
15
18
116.2
VOR/DME
30
27
276
YOKOSUKA
21
24
NDB
YOKOSUKA
249
69
Page 74

Japan — Major Airports
Elevation
Coordinates
08
32°54.8'N
129°55.0'E
ATIS
128.4
14
AIRPORT CHART
For use with
Microsoft Flight Simulator
16
F
9843 x 197
N
VAR 06° W
F
Elevation
Coordinates
ATIS
CT
Nagasaki, Japan
32
46
35°15.1'N
136°55.7'E
126.4
18
3937 x 98
36
Nagasaki
Elevation
Coordinates
146
26°21.1'N
127°46.2'E
ATIS
124.2
N
VAR 04° W
5
L
AIRPORT CHART
For use with
Microsoft Flight Simulator
L
14
R
5997 x 148
14
R
23
L
23
12,100 x 300
12,100 x 200
F
CT
5
R
Okinawa I, Japan
Kadena AB
Elevation
F
CT
Coordinates
ATIS
39
34°47'N
135°27'E
128.6
8990 x 148
CT
AIRPORT CHART
For use with
Microsoft Flight Simulator
Microsoft Flight Simulator 98 — Pilot’s Guide
70
34
N
VAR 07° W
Nagoya, Japan
Nagoya
AIRPORT CHART
For use with
Microsoft Flight Simulator
9843 x 197
N
32
R
VAR 07° W
Osaka, Japan
32L
Osaka International
Page 75

Japan — Major Airports
8858 x 148
CT
AIRPORT CHART
For use with
Microsoft Flight Simulator
15
F
04
8202 X 148
R
18
36
L
18
9843 x 197
L
16
F
CT
36
R
22
10335 x 197
9843 x 197
19
CT
9843 x 197
01
Elevation
Coordinates
80
42°47'N
141°40'E
ATIS
128.6
N
VAR 09° W
Sapporo, Japan
Chitose/New Chitose
Elevation
Coordinates
ATIS
15
35°33'N
139°47'E
128.8
VAR 07° W
Elevation
16
Coordinates
135
35°46'N
140°24'E
CT
ATIS
128.25
N
13123 X 197
VAR 07° W
F
AIRPORT CHART
For use with
Microsoft Flight Simulator
34
(Narita) New Tokyo International
18
Elevation
Coordinates
Tokyo, Japan
457
35°44.7'N
139°21.1'E
ATIS
F
128.4
N
N
VAR 06° W
11,000 X 200
CT
AIRPORT CHART
For use with
Microsoft Flight Simulator
33
34
Tokyo, Japan
(Haneda) Tokyo International
AIRPORT CHART
For use with
Microsoft Flight Simulator
36
Tokyo, Japan
Yokota AB
Microsoft Flight Simulator 98 — Pilot’s Guide
71
Page 76

 Loading...