

Page 1
Energy studies with the
Fluke 1735 Power Logger
The rising cost of energy means that
optimal use of energy has become even
more critical.
The first step in managing energy is
understanding ‘how much and when’
energy is being used. To discover that, you
need a power logger. The logger captures
voltage, current, power, power factor and
energy, displays the measurements, and in
logging mode stores them over time.
Then, using software, you can graph
the measurements and highlight times
when extreme or unexpected energy
consumption is happening. For example,
if energy is being consumed at night or
at weekends, perhaps the HVAC system
needs to be re-programmed?
Once you have this kind of power and
energy profile, you can highlight potential
areas for energy savings.
Conduct the initial energy study at the
main utility power supply/service entrance.
Once you’ve measured overall power,
then conduct more focused studies
throughout the facility to profile individual
loads and estimate their effect on your
electricity bill.
Application Note
Recording current
and power with the
Fluke 1735
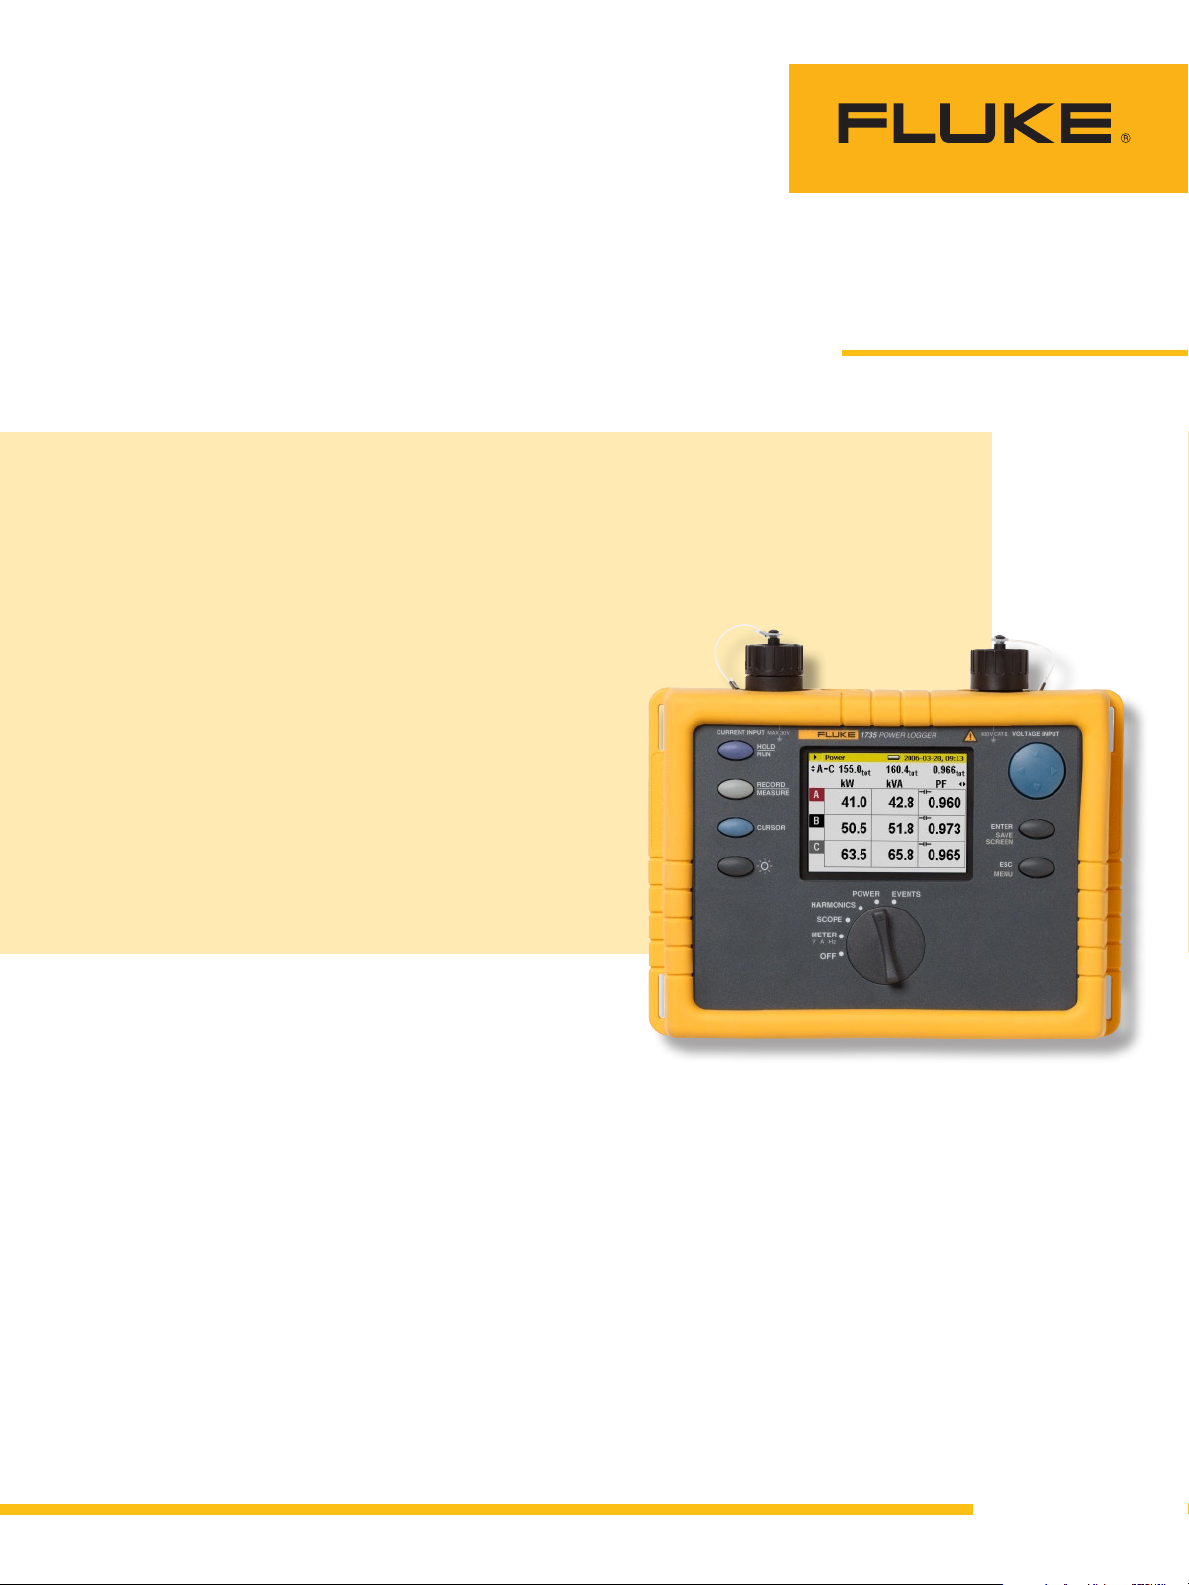
The compact, rugged Fluke 1735
Power Logger is an excellent tool
for performing energy studies.
It includes flexible current
•
probes for connecting around
multiple conductors or bus bars.
It has a PC interface and
•
software for downloading
measurements to a Windowsbased PC and creating professional reports for your
electrical plans.
From the Fluke Digital Library @ www.fluke.com/library
It measures voltage on three
•
phases and current on three
phases and neutral.
It records multiple parameters
•
that can help determine system
load, including voltage, current,
frequency, real power (kW),
apparent power (kVA), reactive
power (kVAR), power factor,
and energy (kWh).
Performing a load study with
the Fluke 1735 takes just
five steps:
1. Hook up to the feeders
or service.
2. Set power system parameters.
3. Set the recording time.
4. Start recording.
5. Download and review the
measurements.
Page 2
1. Hook up to the feeders or
service. Using proper personal
protective equipment, connect
the Fluke 1735 to 120 V line
power and secure the area so
no one will tamper with your
setup. For a 3-phase wye
system there will be eight
connections:
Three phase voltages
•
Neutral voltage
•
Three phase currents
•
Neutral current
•
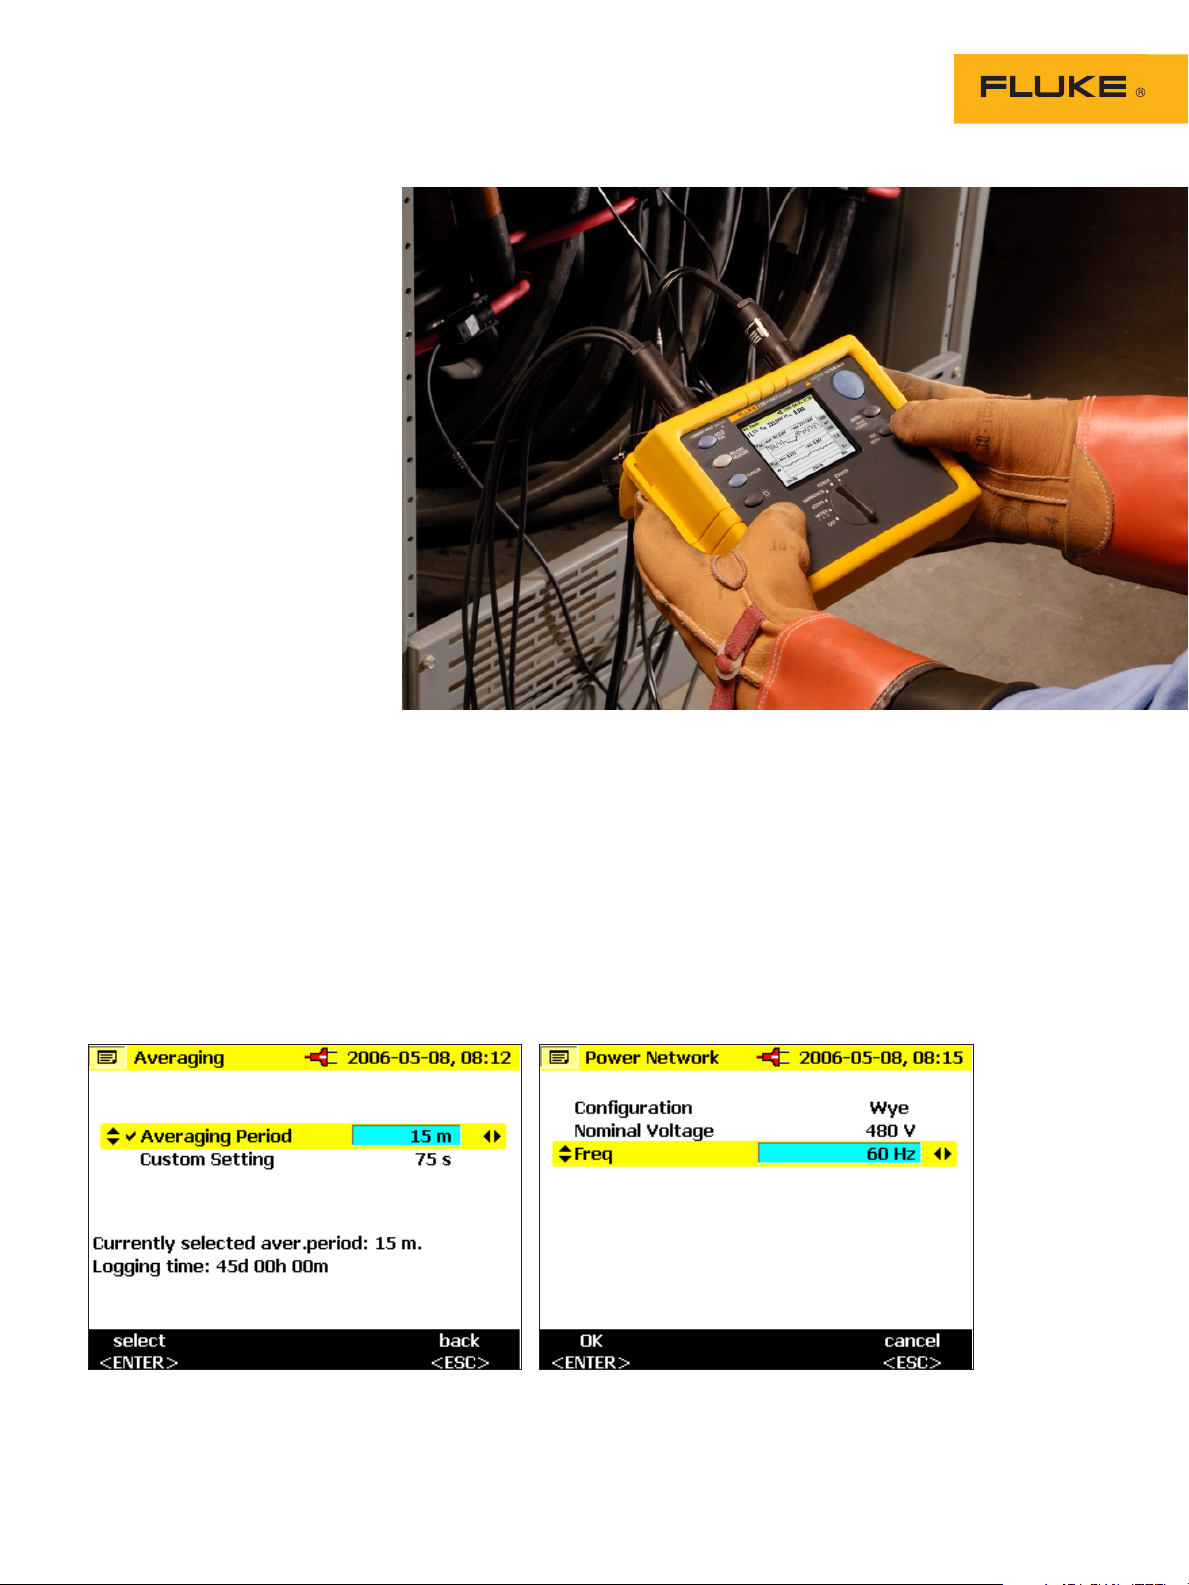
2. Set power system parame-
ters. Set the Network Topology
to wye or delta, to match the
system you are recording.
Verify the nominal voltage
(Mains Voltage) and line
frequency are correct.
3. Set the recording time. Set
the Fluke 1735 to 15-minute
averaging intervals and a
30-day recording duration.
4. Record the data. In the W
(power) position the Fluke
1735 will record a min, max,
and average of these values
every 15 minutes:
Power in Watts for each
•
phase and total
Reactive Power in VARs for
•
each phase and total
Apparent Power in VAs for
•
each phase and total
Power Factor for each phase
•
and average
Averages of Energy in kWh
•
and Reactive Energy in
kVARh
The trend screen will appear
and plot a new minimum,
maximum and average on the
display every fifteen minutes,
moving from left to right as
shown in Figure 3.
After 30 days, disconnect
the Fluke 1735 from the
source, take it to your computer, use the serial cable to
connect it, and download the
data into the Power Log Software included with the unit.
Figure 1 & 2. Sample setup screens for recording time and parameters.
2 Fluke Corporation Energy studies with the Fluke 1735 Power Logger
Page 3

5. Download and review the
measurements. For 30 days
of recording, with a measurement every 15 minutes, you
will have 2880 sets of measurements. Use Power Log
to graph this data, find the
average current or power on
each phase, compare the three
phases and report the largest
number. Figure 4 shows three
phase-current recordings,
zoomed in to show detail.
Power Log has a built-in
report generator that includes
graphs of current and real
power. Your report can range
from a single current or power
number to a full-blown document with graphs and tables.
But the ultimate goal is still
the same: Get an accurate
picture of the system load,
help design a safe upgraded
system and satisfy electrical
authorities.
Figure 3. An example of the recorder screen at the end of the
duration, verifying all data is being stored.
Figure 4. Power Log graphs showing detailed current records.
Why does power factor
matter?
Large utility customers (typically those with 100 kW+
loads) contract to buy their
power based on power factor
(the utility requires these big
customers to do this to ensure
they get paid an amount of
money that truly reflects the
cost of the infrastructure they
need to install to service the
customer). Usually the utility requires the customer
maintains a power factor of
0.95 or more (this will vary
depending on the contract),
if the customers power factor
goes below the agreed level
an additional charge is made
to the customer. So power
factor has a direct effect on
the customers bill.
What is power factor?
Power factor is the ratio of
working power or energy
(kilowatts or kW) to apparent or total power (kilovoltamperes or kVA) delivered by
the utility. It measures how
effectively total delivered
power is being used. A high
power factor signals effective
utilization of electrical power,
while a low power factor
indicates poor utilization of
electrical power. However,
this is not to be confused
with energy efficiency or conservation which applies only
to energy or kW. Improving
the efficiency of electrical
equipment reduces energy
consumption but does not
improve the power factor.
Figure 5. Power Log statistics view showing average current.
3 Fluke Corporation Energy studies with the Fluke 1735 Power Logger
What causes a low
power factor?
The main contributors to low
power factor are motors operated at less than full load.
This often occurs in cycle
processes such as saws, conveyors, compressors, grinders,
etc.—where a motor must be
sized for the heaviest loads.
HVAC fans often have a low
power factor due to running
at reduced load.
Page 4

The Fluke 1735: Three-phase
Harmonics and Event Recording
The Fluke 1735 is the ideal electrician’s tool for
recording and analyzing power and energy in
commercial and industrial facilities. In addition to
recording power parameters for load studies, the
Fluke 1735 also:
Shows voltage and current waveforms on its
•
integrated scope display
Measures and monitors harmonic distortion
•
caused by electronic loads
Captures voltage dips and swells caused by load
•
switching and faulty equipment
Included accessories:
Soft carrying case
•
4 flexible current probes
•
(15 A/150 A/3000 A)
Power Log Software
•
Voltage leads and clips
•
Color localization set
•
PC interface cable
•
Universal ac adapter
•
Printed English manual
•
Multi-language manual on CD-ROM
•
4 Fluke Corporation Energy studies with the Fluke 1735 Power Logger
Fluke. Keeping your world
up and running.
Fluke Corporation
PO Box 9090, Everett, WA 98206 U.S.A.
Fluke Europe B.V.
PO Box 1186, 5602 BD
Eindhoven, The Netherlands
For more information call:
In the U.S.A. (800) 443-5853 or
Fax (425) 446-5116
In Europe/M-East/Africa +31 (0) 40 2675 200 or
Fax +31 (0) 40 2675 222
In Canada (800)-36-FLUKE or
Fax (905) 890-6866
From other countries +1 (425) 446-5500 or
Fax +1 (425) 446-5116
Web access: http://www.fluke.com
©2008 Fluke Corporation.
Specifications subject to change without notice.
Printed in U.S.A. 8/2008 2584800 A-EN-N Rev E
Modification of this document is not permitted
without written permission from Fluke Corporation.
®
 Loading...