

Page 1
Model 491 Prep Cell
Instruction Manual
For Technical Service call your local Bio-Rad office or in the U.S. call 1-800-424-6723.
Page 2

Page 3

Note
To ensure the best performance from the Model 491 prep cell, become fully acquanted with these operating
instructions before using the cell to transfer samples. Bio-Rad recommends that you first read these instructions
carefully. Then assemble and disassemble the cell completely without transferring sample. After these preliminary steps, you should be ready to transfer a sample.
Bio-Rad also recommends that all Model 491 prep cell components and accessories be cleaned with a suitable
laboratory cleaner (such as Bio-Rad cleaning concentrate, catalog number 161-0722) and rinsed thoroughly
with distilled water, before use.
Model
Catalog No.
Date of Delivery
Serial No.
Invoice No.
Purchase Order No.
Warranty
Bio-Rad Laboratories’ Model 491 prep cell is war ranted against defects in ma terials and workmanship for 1
year from date of purchase. If any defects oc cur in the in strument during this warranty period, Bio-Rad
Laboratories will re pair or replace the defective parts free of charge. The following defects, how ever, are
specifically ex cluded.
1. Damage caused by improper operation, accident, or misuse.
2. Repair or modification done by anyone other than Bio-Rad Laboratories.
3. Use of fittings or other parts supplied by anyone other than Bio-Rad Laboratories.
Note: This warranty does not apply to platinum wire electrodes.
For any inquiry or request for repair service, contact Bio-Rad Laboratories after confirming the model and
serial number of your instrument.
Page 4

Table of Contents
Section 1 General Information .................................................................................1
1.1 Introduction ................................................................................................1
1.2 Accessory Equipment ................................................................................1
1.3 Specifications.............................................................................................2
1.4 Chemical Compatability .............................................................................2
1.5 Safety ........................................................................................................2
Section 2 Description of Major Components ..........................................................4
2.1 Model 491 Prep Cell Components .............................................................4
2.2 Lower and Upper Buffer Chamber .............................................................5
2.3 Cooling Core ..............................................................................................5
2.4 Gel Tube Assembly ....................................................................................6
2.5 Elution Chamber Base ...............................................................................6
2.6 Casting Stand ............................................................................................7
Section 3 Assembly and Operation .........................................................................8
3.1 Casting the Preparative Gel ........................................................................8
3.2 Preparing the Frits and Dialysis Membrane ...............................................10
3.3 Assembly of the Elution Chamber ............................................................10
3.4 Assembly of Upper and Lower Buffer Chambers ......................................12
3.5 Purge the Elution Chamber of Air Bubbles ...............................................14
3.6 Cooling the Gel ........................................................................................15
3.7 Loading the Sample .................................................................................16
3.8 Elution Rate, Detection, Collection, and Analysis ......................................16
Section 4 Optimizing Running Conditions for Preparative SDS-PAGE ................17
4.1 Gel Pore Size ...........................................................................................17
4.2 Optimization Procedures ..........................................................................18
4.3 Gel Length Determination for Preparative SDS-PAGE ...............................19
4.4 Gel Tube Size Selection ............................................................................19
4.5 Running Conditions ..................................................................................21
4.6 Elution Times for Proteins .........................................................................21
4.7 Examples of the SDS-PAGE Optimization Procedure ...............................22
Section 5 Disassembling and Cleaning .................................................................26
Section 6 Troubleshooting Guide ..........................................................................27
Section 7 Preparation of Electrophoresis Buffers and Acrylamide
Stock Solutions for SDS-PAGE .............................................................28
7.1 Separating (Resolving) Gel Buffer Stock ...................................................28
7.2 Stacking Gel Buffer Stock ........................................................................28
7.3 Sample Buffer (SDS-Reducing Buffer) Stock ............................................28
7.4 10x Electrode (Running) Buffer, pH 8.3 .....................................................29
7.5 30% Acrylamide Stock Solution ...............................................................29
Section 8 SDS-PAGE Gel Preparation ...................................................................30
8.1 Gel Recipes .............................................................................................30
8.2 Analytical Separating Gel..........................................................................31
8.3 Analytical Stacking Gel .............................................................................31
8.4 Preparative SDS-PAGE Separating and Stacking Gels ............................32
Page 5

Section 9 A Guide to Preparative Native-PAGE ....................................................33
9.1 Introduction ..............................................................................................33
9.2 How to Choose Native-PAGE Systems ....................................................33
9.3 Discontinuous Native-PAGE ..................................................................... 36
9.4 Continuous Native-PAGE .........................................................................39
9.5 References ...............................................................................................42
Section 10 Ordering Information..............................................................................43
Page 6

Section 1
General Information
1.1 Introduction
The Model 491 prep cell* is de signed to purify proteins or nucleic acids from complex mixtures by
contin uous-elu tion electrophoresis. Conventional gel elec trophoresis buffer sys tems and media are used
with the prep cell.
During a run, samples are electrophoresed through a cylindri cal gel. As molecules migrate through the gel
matrix, they separate into ring shaped bands. Individual bands migrate off the bottom of the gel where they
pass di rectly into the patented elution chamber for collection.
The elution chamber consists of a thin polyethylene frit. A dialysis membrane, directly underneath the elution
frit, traps proteins within the chamber. Elution buffer enters the chamber around the perimeter of a specially
designed gasket. The unique design of the gasket results in an even flow of buffer into the elution frit. Buffer
is drawn radially inward to an elution tube in the center of the cooling core. Purified molecules are drawn up
through the elution col lec tion tube at the cen ter of the cooling core by a peristaltic pump. The peristaltic
pump drives sepa rated pro teins through a UV monitor (optional) to a fraction col lector (Bio-Rad's Econo
system).
To assure that separated molecules migrate in compact, paral lel bands, temperature gradients across the
gel are minimized. The temperatures of the internal and exter nal surfaces of the gel are equalized by
continuously pumping lower electrophoresis buffer through the central cooling core by means of the buffer
recirculation pump.
™
Simple procedures are provided for determining optimal running conditions for most purifications. It is
recommended that these procedures be performed for each new sample to be purified before proceeding to
a preparative run with the Model 491 prep cell.
1.2 Accessory Equipment
Power supply — 500 volt
Warning: Use only power supplies with isolated ground such as Bio-Rad's PowerPac
PowerPac Universal
Buffer recirculation pump — (provided with the prep cell
Peristaltic pump (elution pump)*
Fraction collector*
UV monitor
Chart recorder**
* U.S. patent number 4,877,510
** The use of a reliable fraction collector is essential for the isolation of the de sired component of the sample. It may also be convenient
to monitor elution by UV ab sorbance. To simplify setup and operation of accessory equipment, we recom mend use of Econo system
low pressure chromatography components, in cluding peri staltic pump, fraction collector, UV monitor, and chart recorder.
™
HV or
1
Page 7

1.3 Specifications
Construction
Upper buffer chamber acrylic
Lower buffer chamber acrylic
Electrodes platinum, 0.010 inch diameter
Lid acrylic
Gel tube assembly glass/acrylic
Elution chamber base acrylic
Elution frit polyethylene
Support frit polyethylene
Cooling core glazed alumina
Elution tube borosilicate glass, 0.06” ID
Casting stand acrylic
Shipping weight 6 lb
Overall size 7 in. diameter x 14 in. high
Voltage limit 500 volts
Current limit 40 milliamperes
Power limit 20 watts
Cooling buffer flow rate 100 ml/min
Elution buffer flow rate 60 ml/hour
Upper electrophoresis buffer volume 300–600 ml
Elution buffer chamber volume 900 ml
Lower electrophoresis buffer volume 2–3 L
1.4 Chemical Compatibility
The Model 491 prep cell is not compatible with chlorinated hydrocarbons (e.g. chlo roform), aromatic
hydrocarbons (e.g. toluene, ben zene), or acetone. Their use will void all warranties.
1.5 Safety
Power to the Model 491 prep cell is to be supplied by an external DC power supply. This power
supply must be ground isolated in such a way that the DC voltage out put floats with respect to
ground. The recommended power sup ply for this instru ment is the PowerPac HV power supply.
The PowerPac universal power supply may also be used. The maximum speci fied operating
parameters for the Model 491 prep cell are:
500 VDC maximum operating voltage
40 mA maximum operating current
20 W maximum operating power limit
Current to the Model 491 prep cell, provided from the external power supply, enters the unit
through the lid assembly, providing a safety interlock to the user. Current flow to the cell is
broken when the lid assembly is removed. Do not attempt to cir cumvent this safety interlock,
and always turn the power supply off when working with the cell.
2
2
Page 8

The buffer recirculation pump is also ground isolated as should be any pump used with this cell. During
normal operation, the buffer in the lower buffer chamber is circulated through the cooling core and routed
back into the sys tem via the buffer recirculation pump. The buffer flowing through the tub ing and the pump
is electri cally active. For this reason handle the tubing carefully while the power supply is on. Do not touch
any exposed liquid when the power supply is on. Tube connections should be made with the power
supply turned off. Both the recir culation pump and the recommended power supplies are ground isolated by
design to minimize the potential shock hazard. However, working around high voltage equipment in a
laboratory environment is potentially dangerous. As a result it is the user’s responsibility to always excercise
care in setting up and running elec trophore sis instruments. If a liquid leak occurs, always turn off the power
supply be fore correcting the problem.
During operation, do not expose the cell to ambient temperatures above 50 ˚C.
Important
This Bio-Rad instrument is designed and certified to meet IEC1010-1* safety standards. Certified products are
safe to use when operated in accordance with the instruction manual. This instrument should not be modified
or altered in any way. Alteration of this instrument will:
• Void the manufacturer's warranty
• Void the IEC1010-1 safety certification
• Create a potential safety hazard
Bio-Rad is not responsible for any injury or damage caused by the use of this instrument for purposes other
than for which it is intended or by modifications of the instrument not performed by Bio-Rad or an authorized
agent.
*IEC1010-1 is an internationally accepted electrical safety standard for laboratory instruments.
3
3
Page 9
Section 2
Description of Major Components
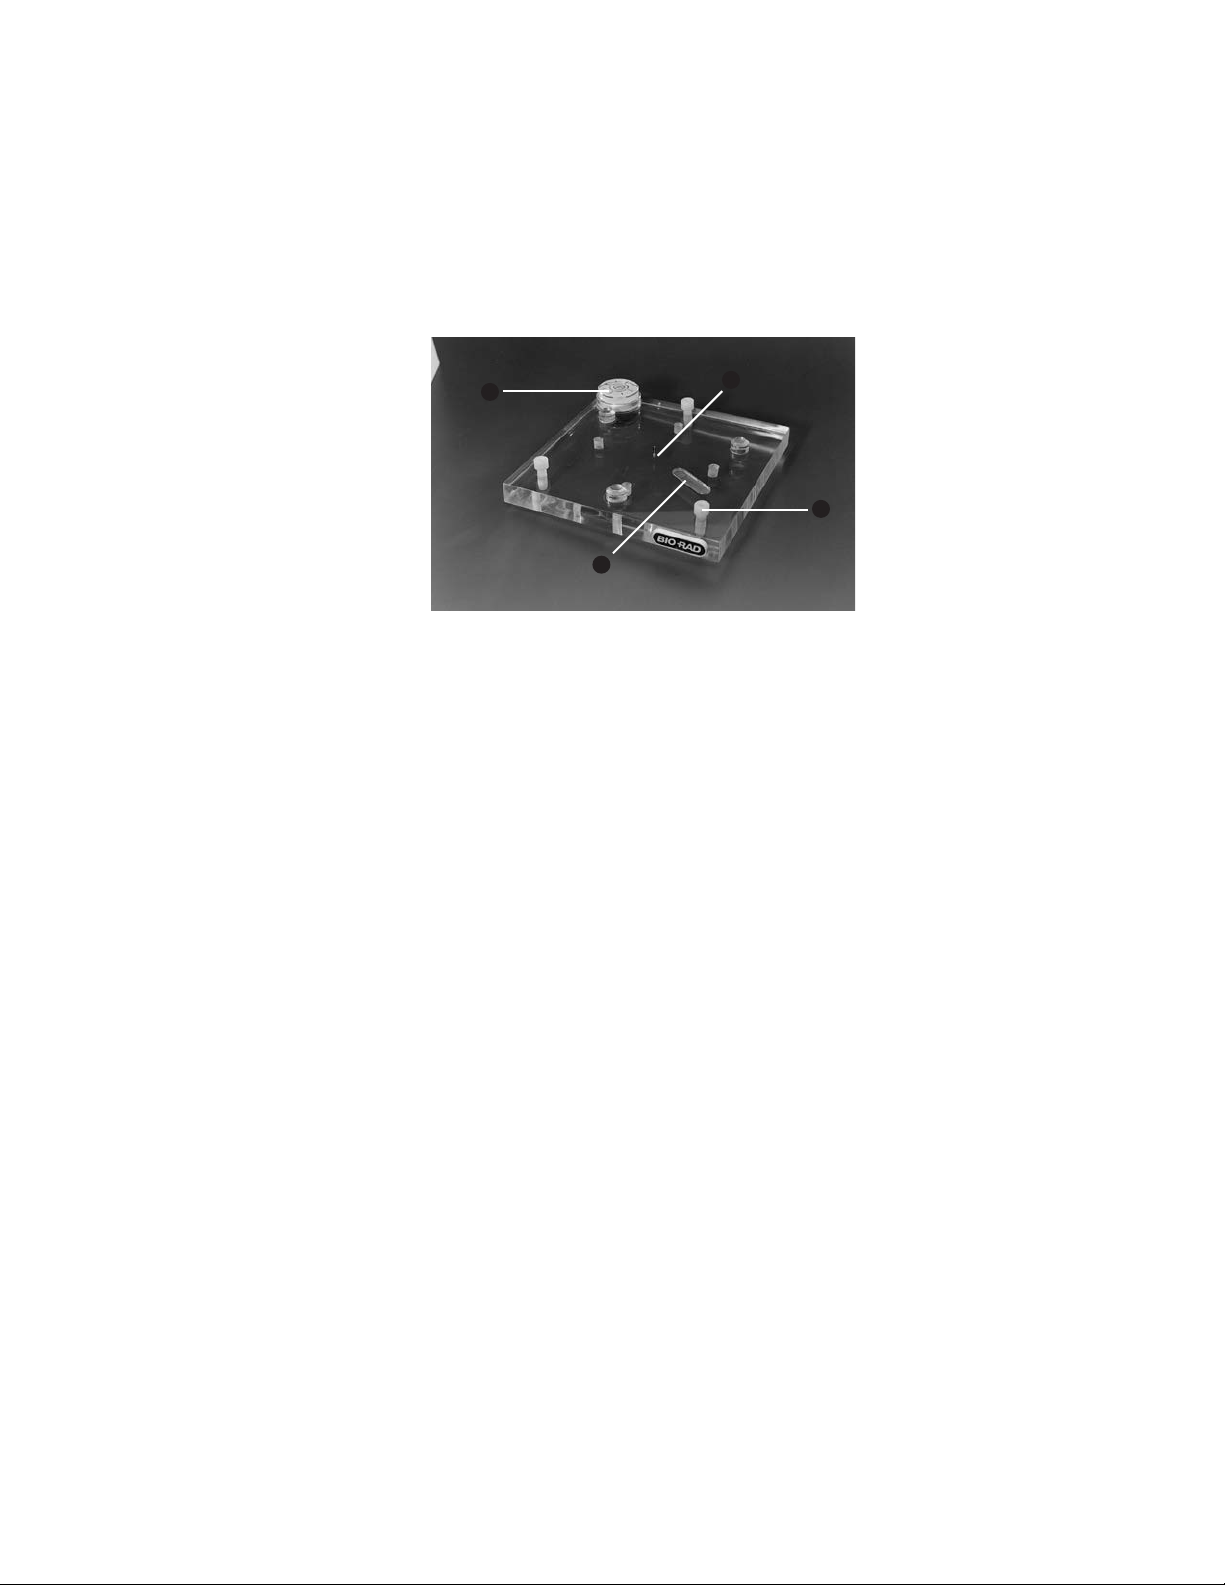
2.1 Model 491 Prep Cell Components
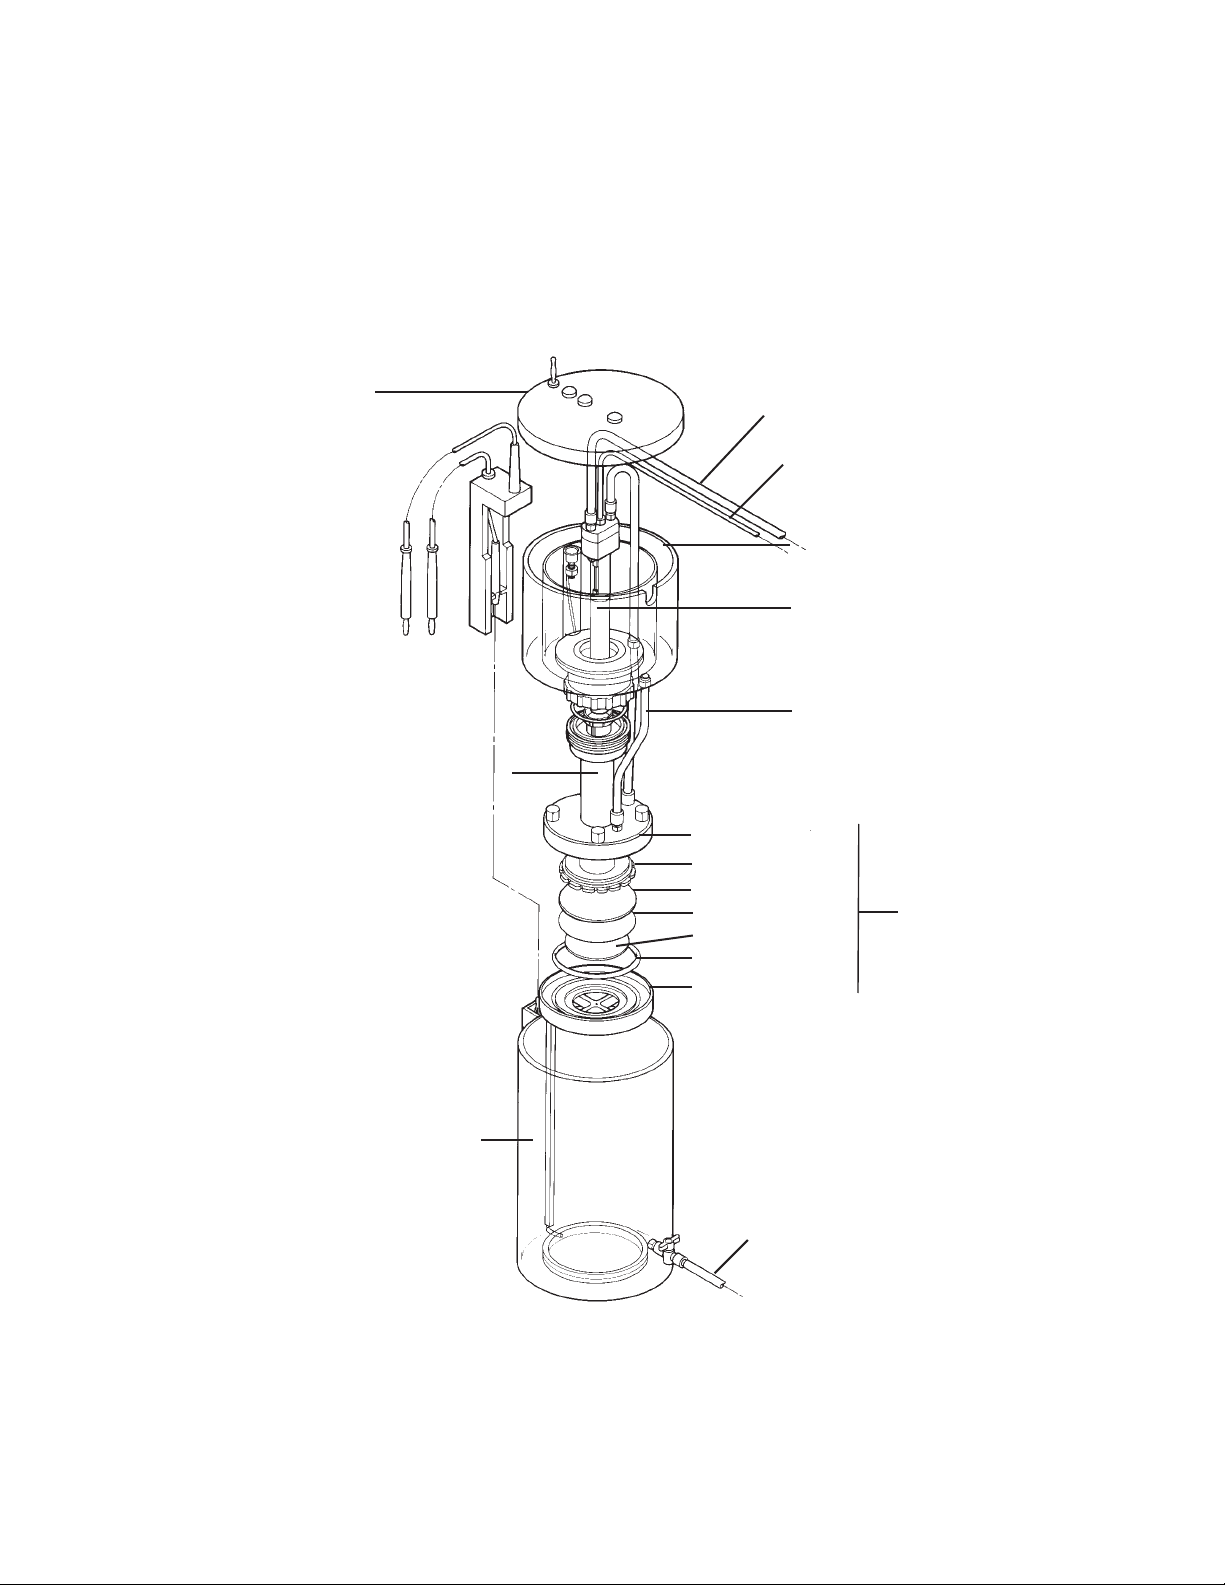
Lid & power cables
Cooling buffer outlet
Elution buffer outlet
Upper buffer chamber
Cooling core
Elution buffer feedline
Gel assembly tube
Lower buffer chamber
Fig. 1. Exploded view of the Model 491 prep cell.
Elution chamber cap
Fluted gasket
Elution frit
Dialysis membrane
Support frit
O-ring
Elution chamber base
Cooling buffer inlet
Elution chamber
4
4
Page 10
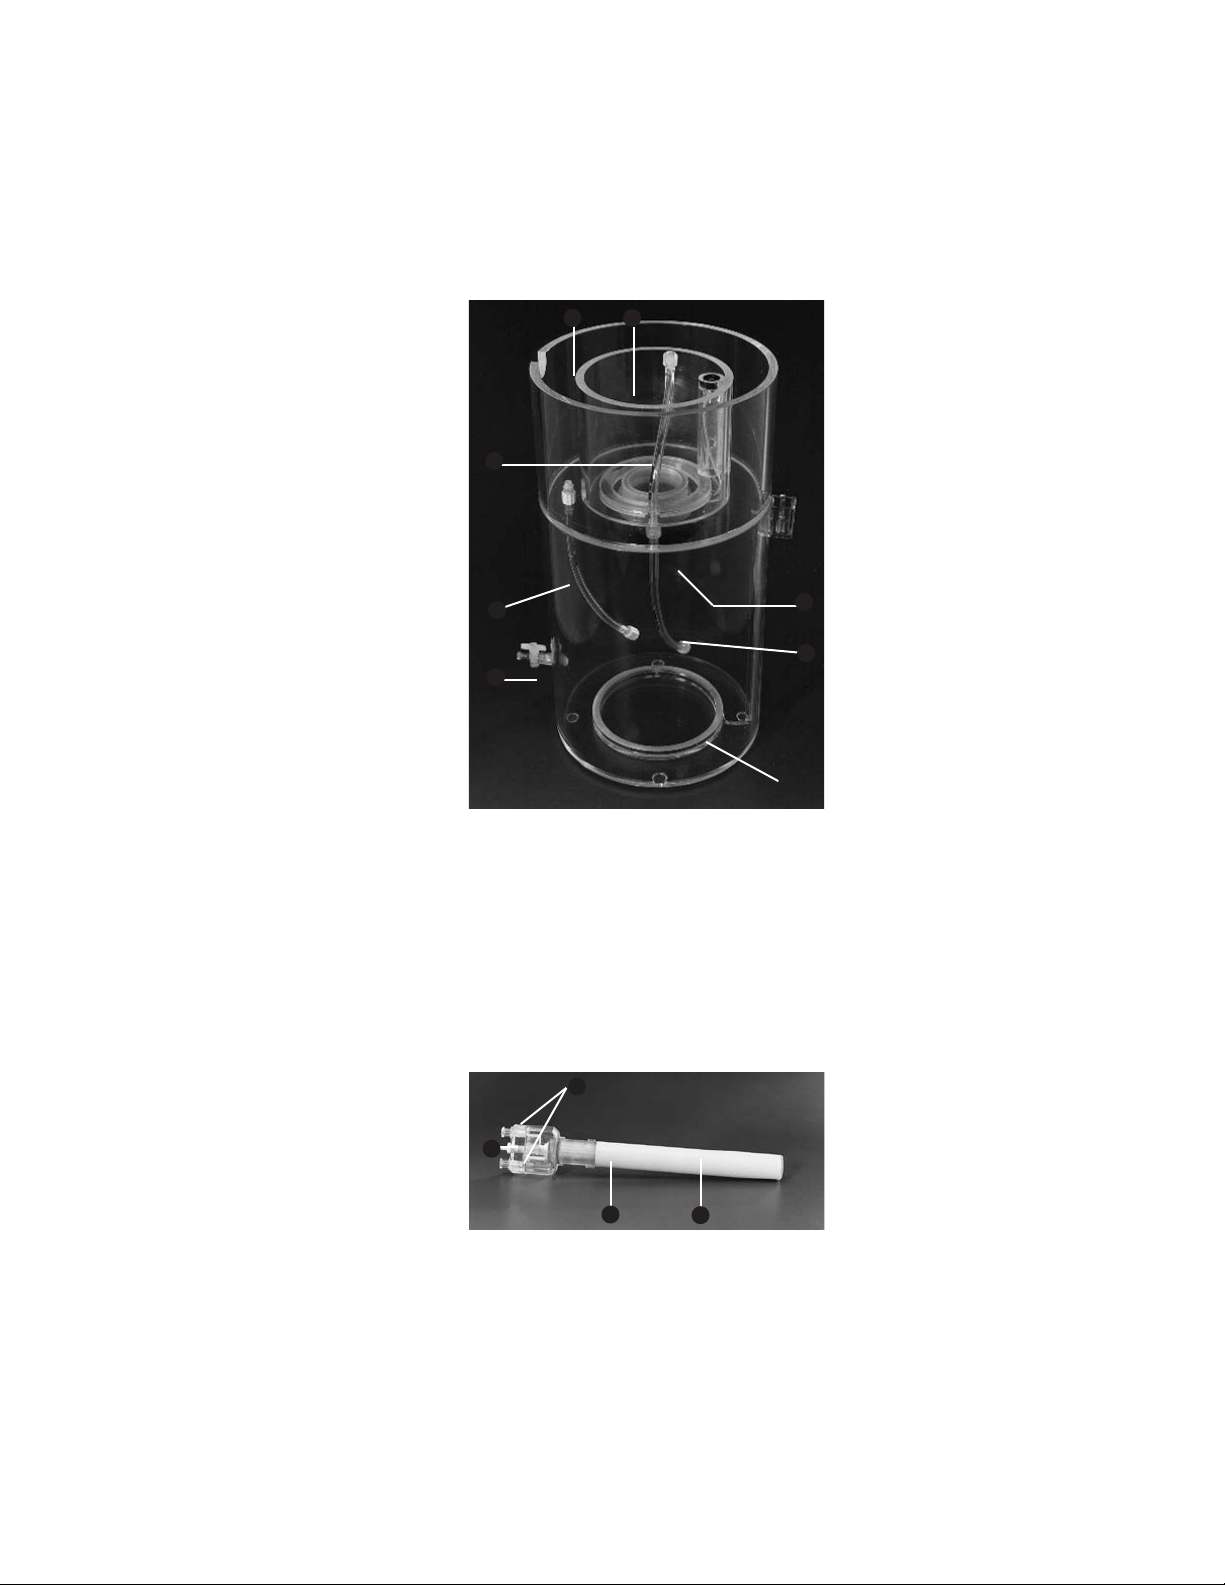
2.2 Lower and Upper Buffer Chamber
The lower buffer chamber forms a stable base for the unit. It houses the an ode and contains the lower
electrophoresis buffer. The upper buffer chamber holds the up per electrophoresis buffer and the elu tion
buffer, and houses the cathode.
43
6
8
1
Fig. 2. Upper and lower buffer chamber. Lower buffer chamber: Stopcock for lower elec trophoresis buffer inlet (1), and anode (2).
Upper buffer chamber: Elution buffer reservoir (3), upper electrophoresis buffer reservoir (4), ring nut (5), cooling buffer line (6), cooling
buffer feedline (7), and elution buffer feedline (8).
5
7
2
2.3 Cooling Core
The cooling core extends to the bottom of the graduated gel tube and houses the elu tion tube in its center.
Cooling is recommended during polymeriza tion as well as during electrophoresis.
1
2
3
Fig. 3. Cooling core. Cooling buffer ports (1), elution buffer outlet (2), cooling core place ment guides (3), and glazed ceramic cooling
core (4).
5
5
4
Page 11
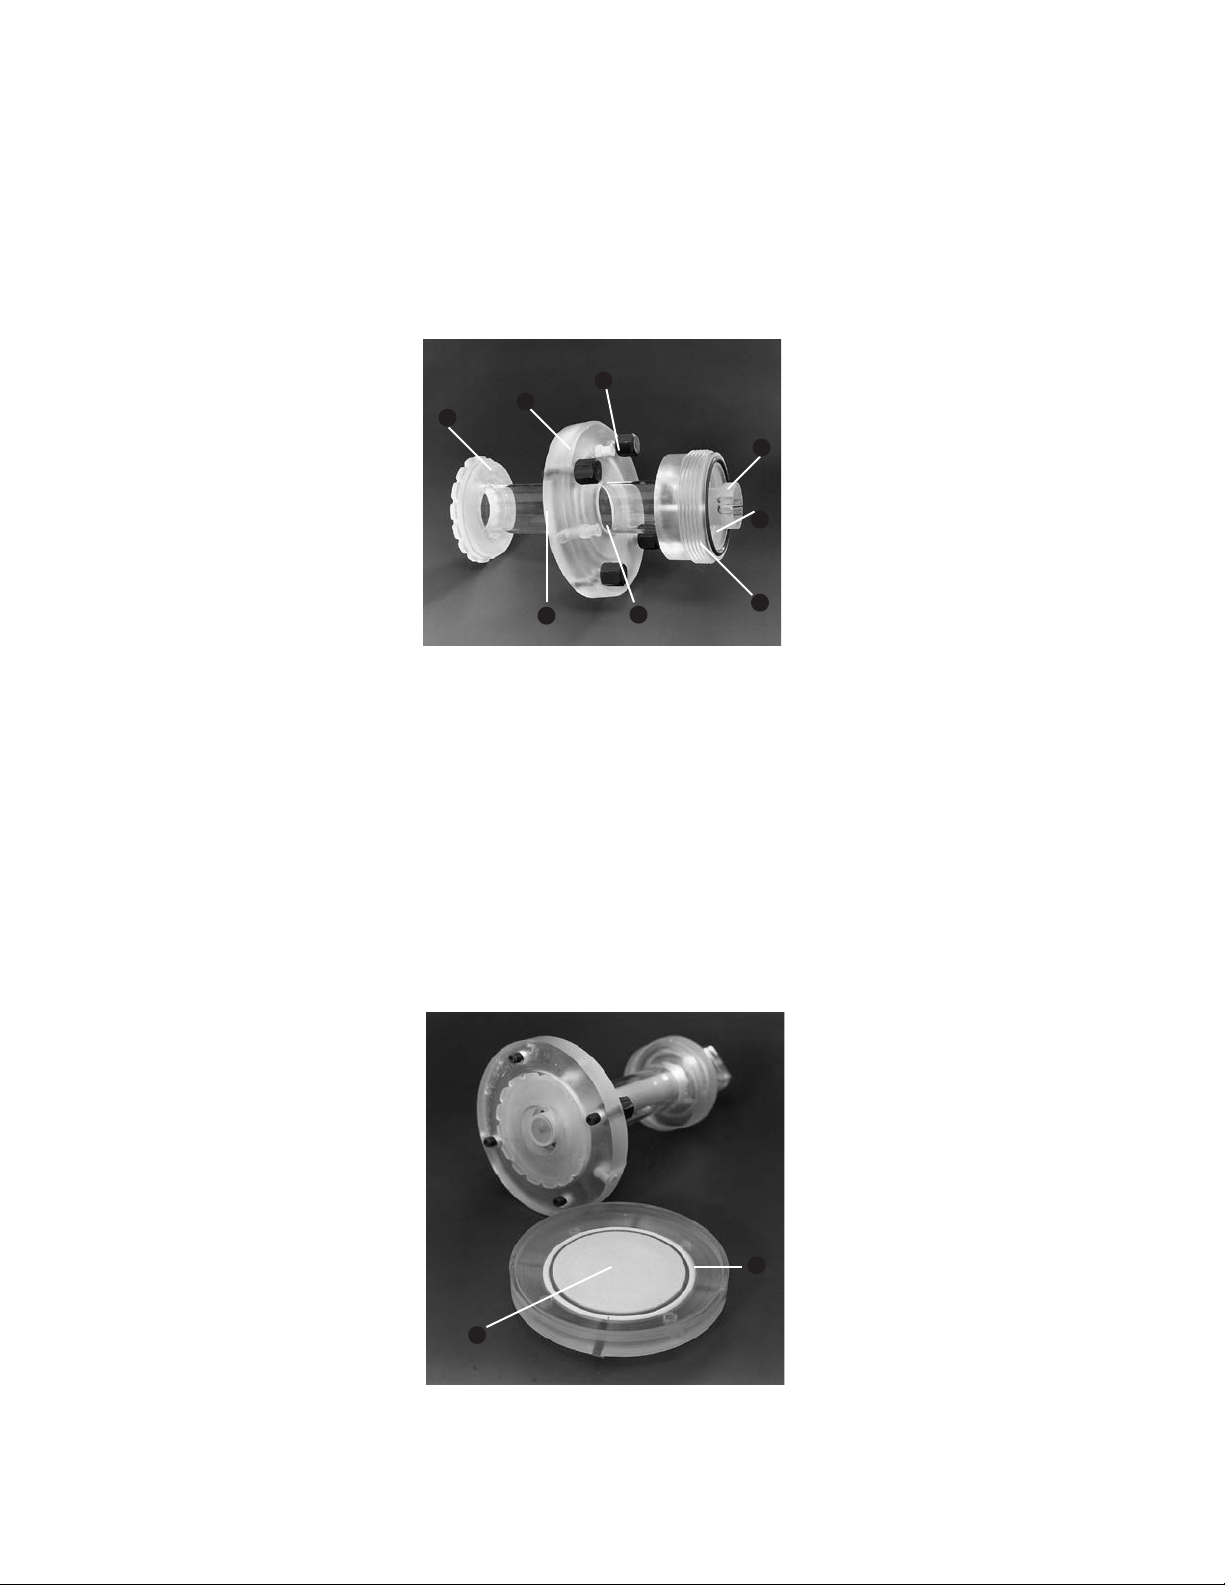
2.4 Gel Tube Assembly
The gel tube assembly holds both the gel and the cooling core. The elution chamber cap and the gasket
mounted on the graduated gel column make up the upper part of the elution chamber. Two gel tube
assemblies are provided with the Model 491 prep cell: 28 mm ID and 37 mm ID. See Section 4.4 for
selecting the appropriate gel tube size for specific applications.
5
7
4
1
8
3
Fig. 4. Gel tube assembly. Cooling core collar (1), upper reservoir attachment, i.e. threaded connector (2), graduated gel column (3),
elution chamber cap with thumb screws (4), elution buffer inlet port (5), cooling buffer port (6), gasket (7), and O-ring (8).
6
2
2.5 Elution Chamber Base
The elution chamber base with the support frit holds the elution frit and the dialysis membrane directly
be neath the gel. The dialysis membrane provided with the Model 491 prep cell has a molecular weight cut
off of 6,000 daltons. A continu ous flow of elution buffer is directed through the channels of the elution
chamber gasket to the perime ter of the elution frit. As bands mi grate off the gel, they are washed to the
center of the frit, up through the elution tube in the center of the cooling core, and out to the peristaltic
pump, UV de tector (optional), and fraction collector. (The tracking dye, bromophenol blue (M
pass through the dialysis membrane. The flow of elution buffer through the elution frit overcomes the force of
elec trophore sis in the down ward direction.)
691), does not
r
1
Fig. 5. Elution chamber base and tube assembly. Elution frit (1) and large O-ring (2).
6
6
2
Page 12
2.6 Casting Stand
Gels are cast with the gel tube assembly mounted directly on the casting stand. The casting stand ensures
that gels have perfectly flat lower surfaces. Inserting a spatula in the gel-release slot facilitates the removal of
the gel from the casting stand after polymerization by allowing air to enter beneath the gasket and the gel.
Fig. 6. Casting stand.
3
4
Leveling feet (1), center pin (2), leveling bubble (3), and gel re lease slot (4).
2
1
7
7
Page 13
Section 3
Assembly and Operation
3.1 Casting the Preparative Gel
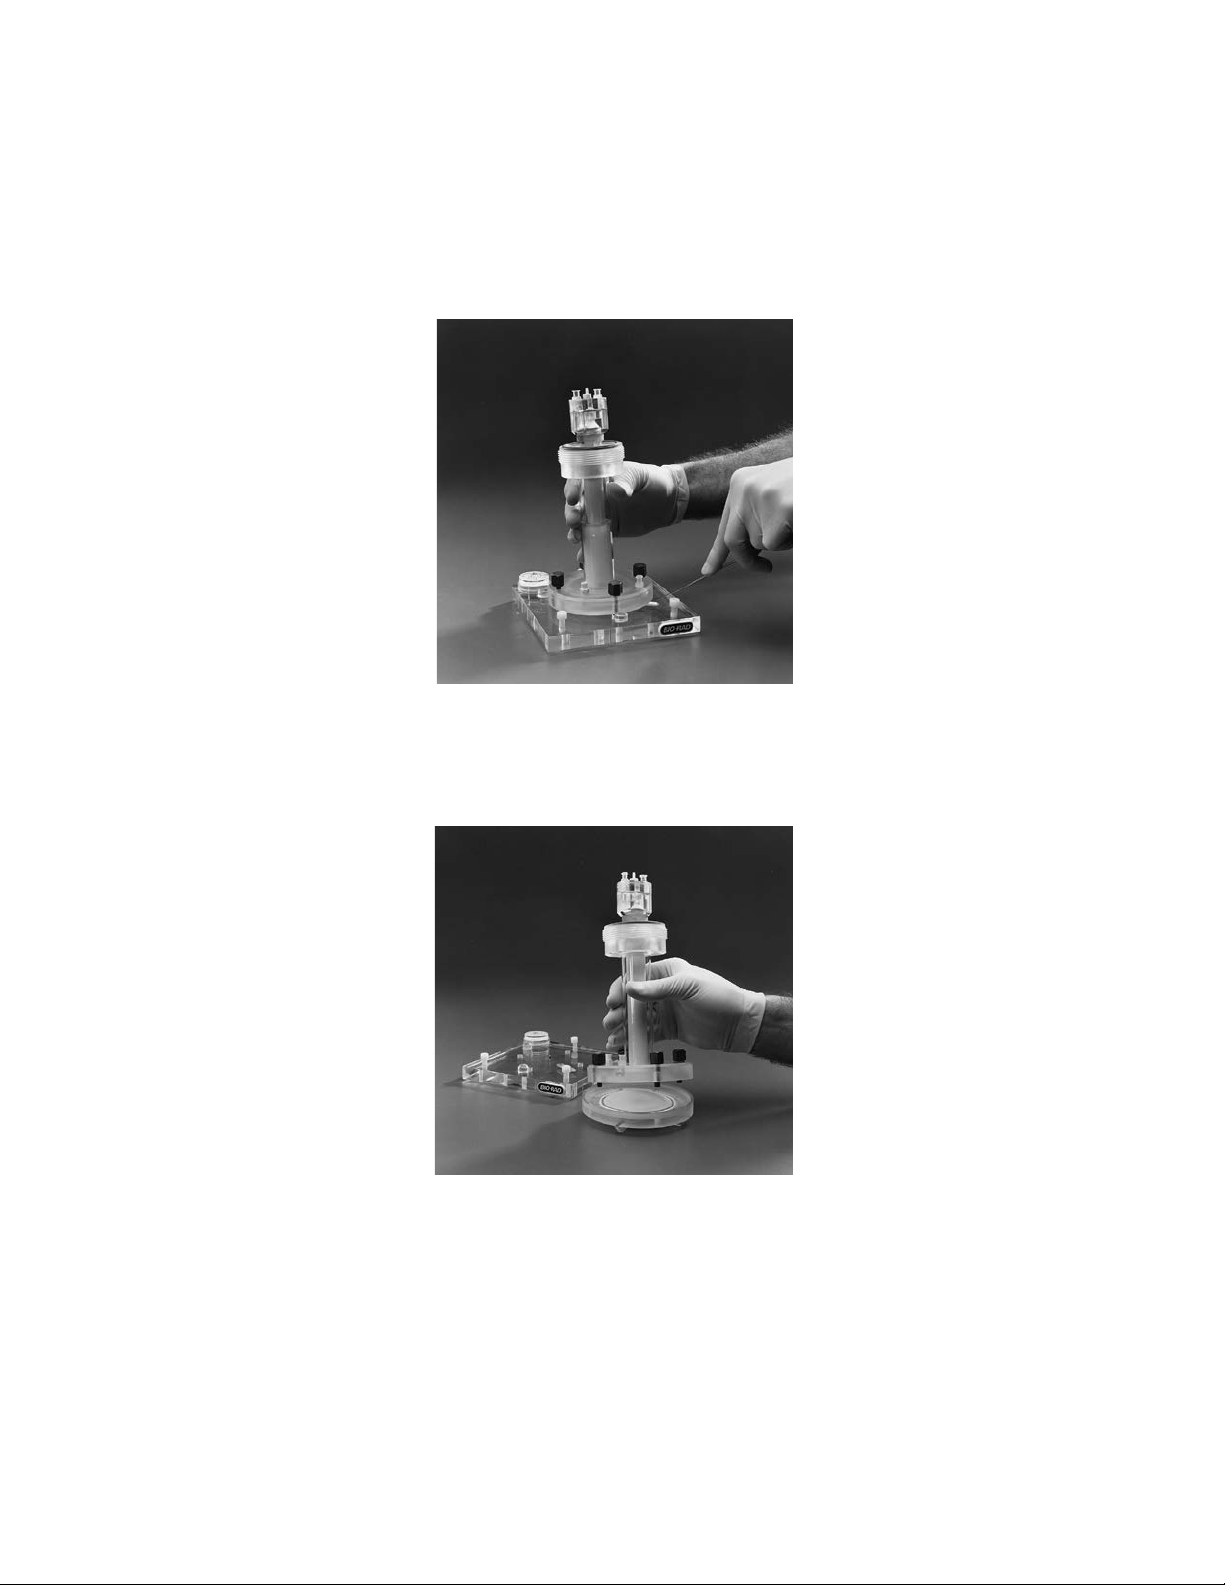
1. Place the gel tube assembly on the casting stand, aligning the four screws on the acrylic plate with the
holes in the casting stand. Secure the gel tube assembly with the four screws; hand tightening is
sufficient. Level the casting stand with the aid of the leveling bubble using the leveling legs.
2. Insert the cooling core so that the two placement guides slide through the grooves of the cooling core
collar in the gel tube assembly and the center pin on the casting stand is inserted in the elution tube of
the cooling core. Turn the core 90° until it locks into place. This will prevent any vertical or lateral
movement of the cooling core.
8
8
Page 14
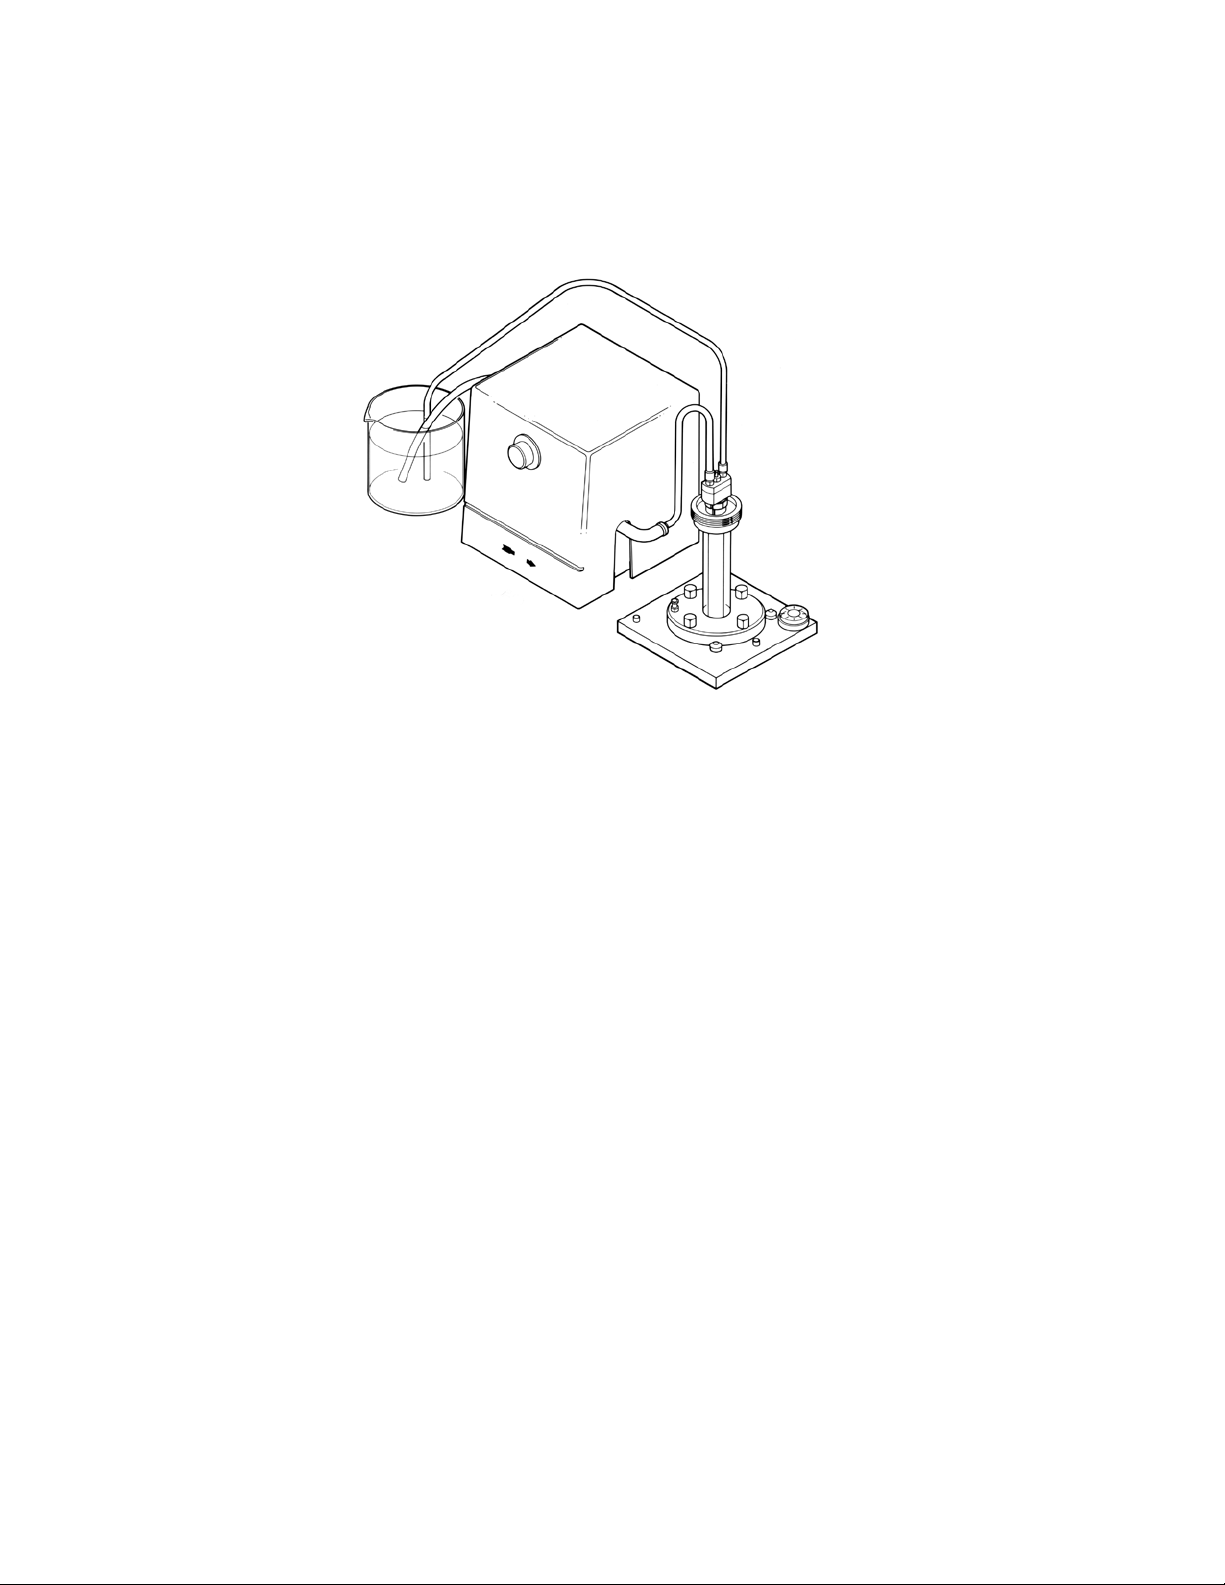
3. It is advisable to cool the gel during polymerization. Cooling prevents ex cess heat accumulation in the
interior of the reaction mixture and aids in the formation of uniform gels. To cool, pump room temperature
water (or buffer) from an external source through the cooling core. Ensure that cooling is in progress prior
to casting the gel.
Fig. 7. Diagram of cooling path during polymerization. Cooling of gels during poly merization is recommended. This is accomplished
by circulating room temperature buffer between a reservoir and the cooling finger using the buffer recirculation pump.
4. Prepare the acrylamide monomer solution. Refer to Section 4 for selecting the appropriate acrylamide
gel concentration for a given application. Sections 8 and 9 describe preparative gel for mulations for
SDS-PAGE and native-PAGE, repsectively.
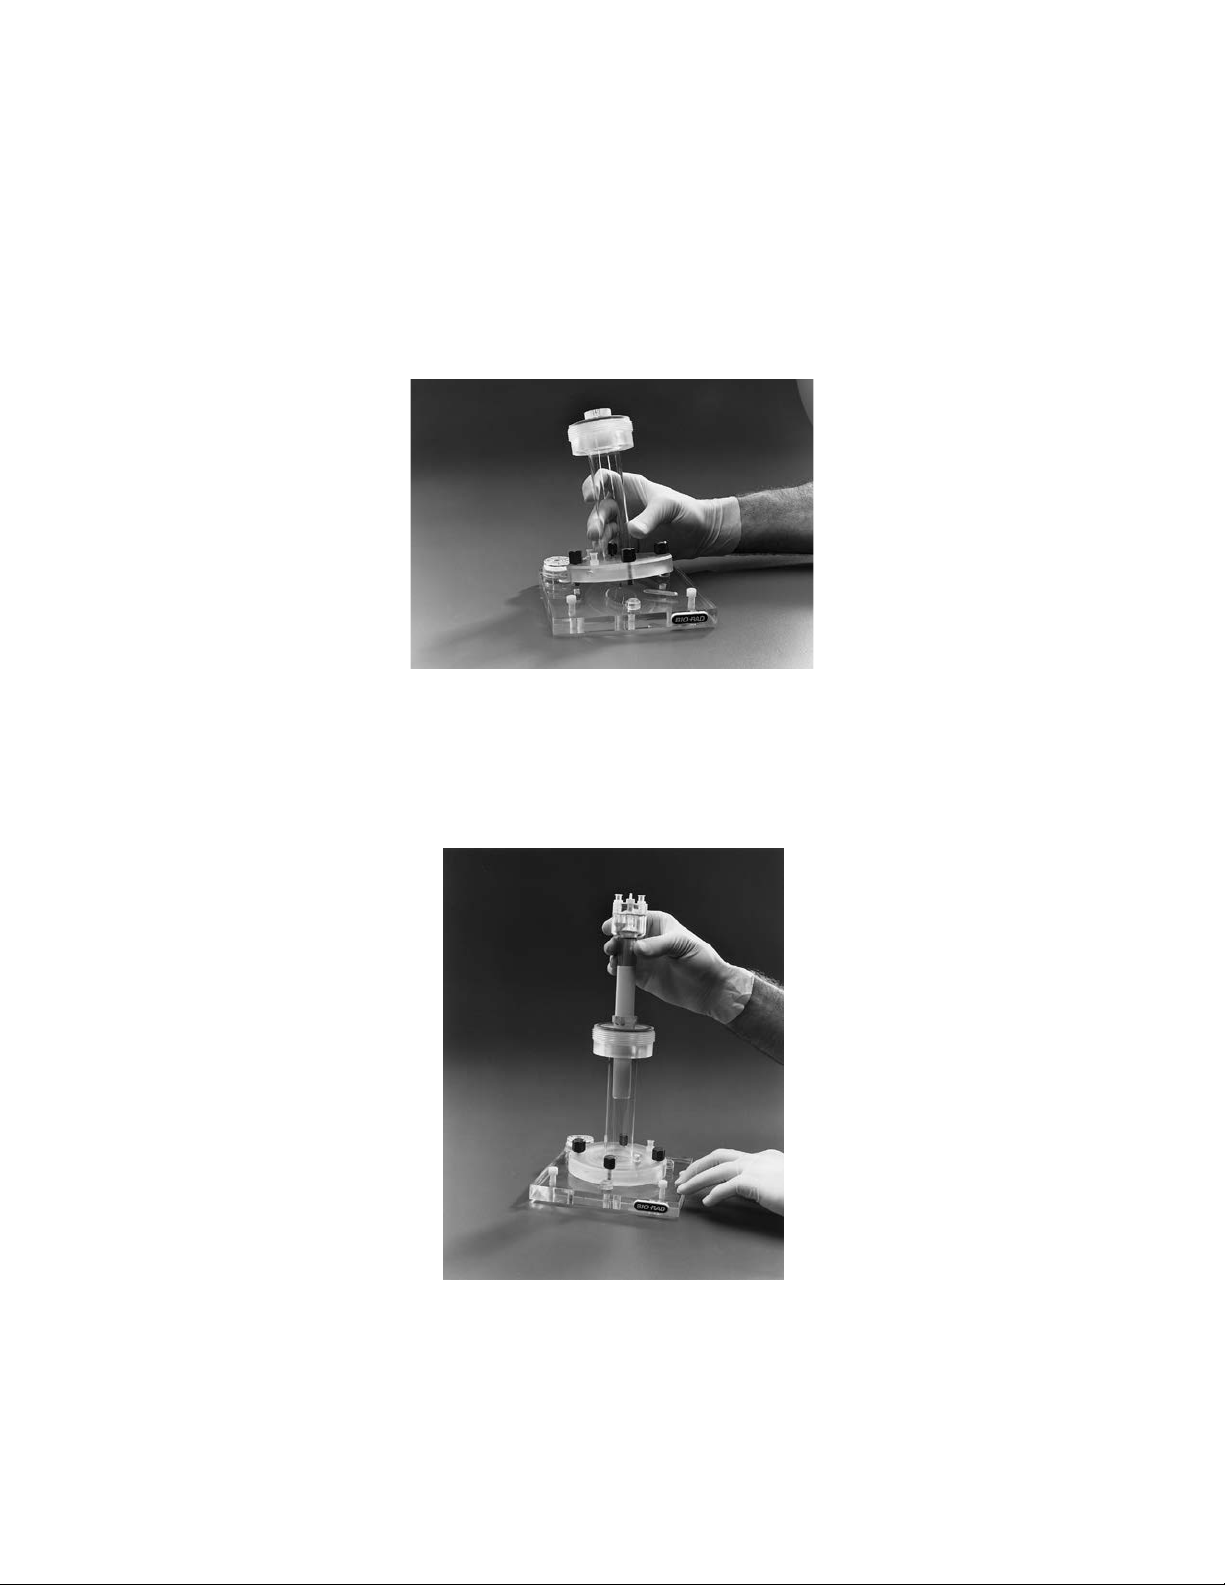
5. Pour the degassed monomer mixture into the gel tube through the gap be tween the cooling core and
the collar of the gel tube assembly. Avoid trap ping air bubbles in the gel. Gently tapping the casting
stand (with the gel tube assembly mounted to it) against the bench top will help to dislodge trapped air
bubbles. Visually inspect the gel for bubbles immediately after pouring the separating-gel solution into
the tube.
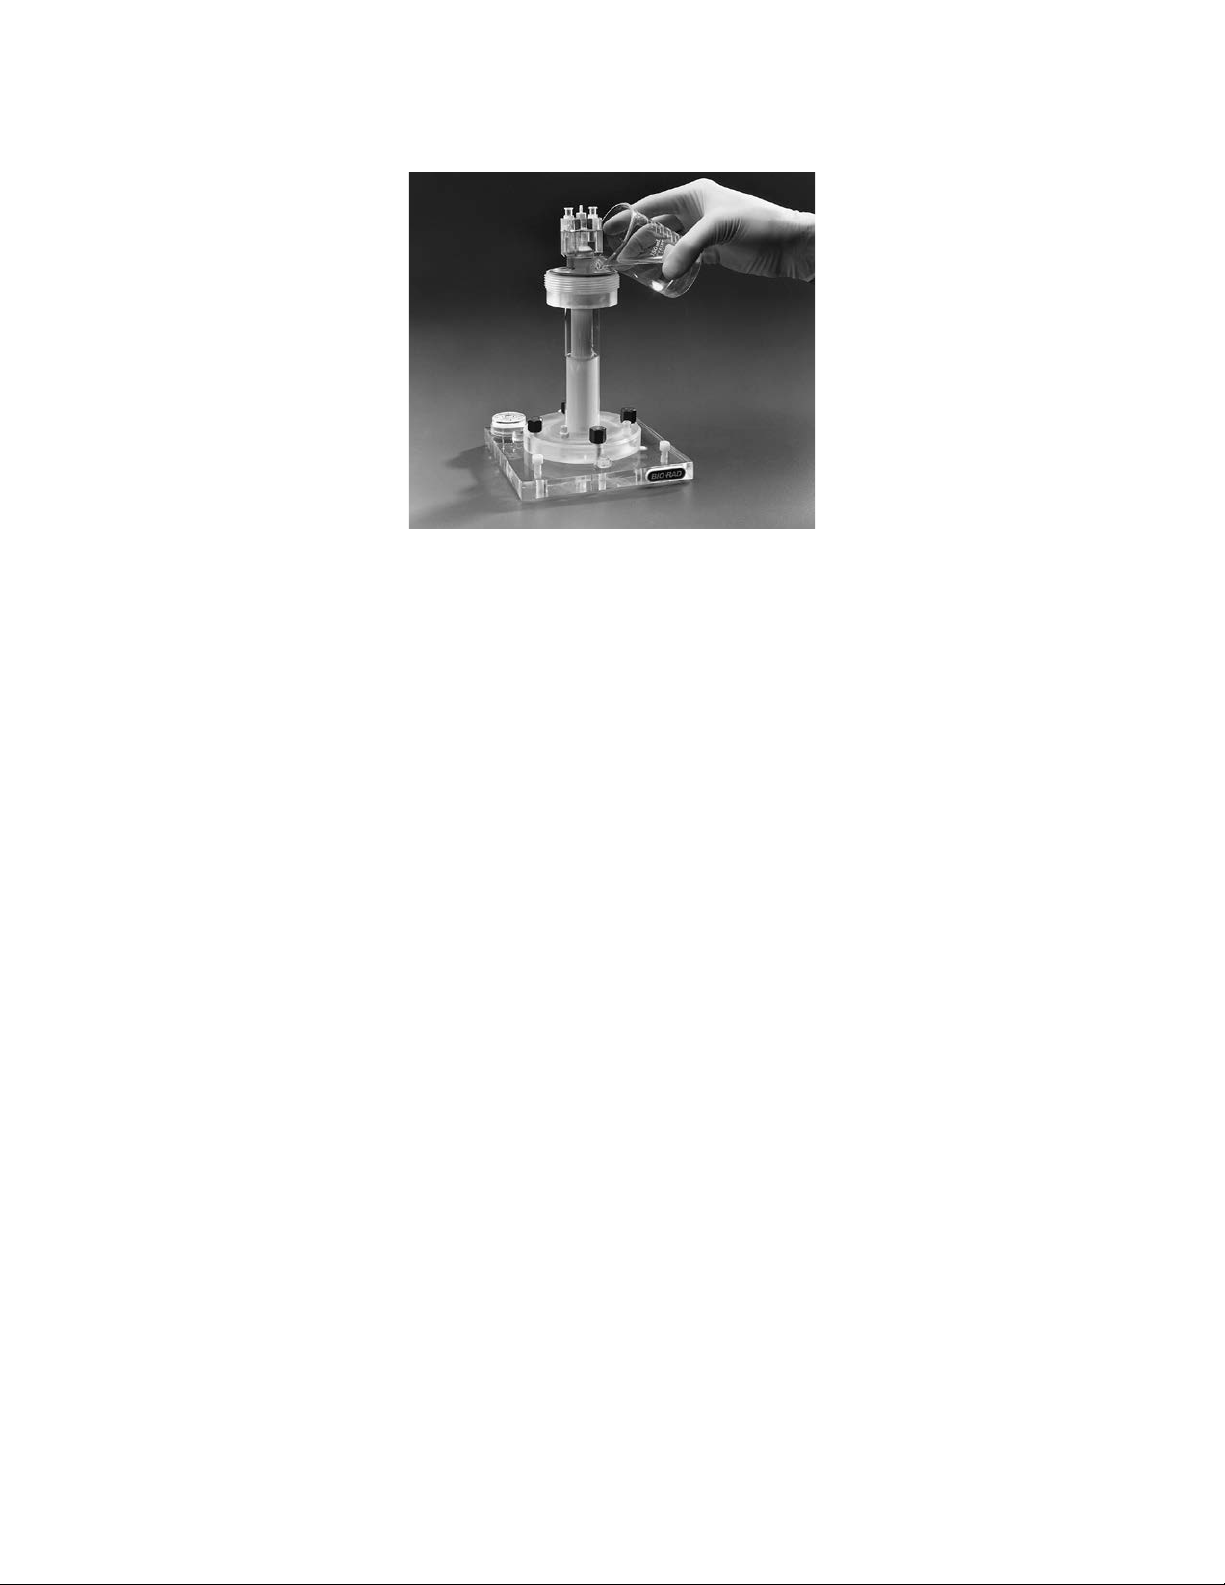
Carefully overlay the resolving gel with water-saturated 2-butanol or tert-amyl alco hol using the narrow
polytetrafluoroethylene (PTFE) tube affixed to a syringe (provided with the unit). Allow the resolving gel to
stand overnight for complete polymeriza tion (catalyst con centration in resolv ing gel is 0.025%
APS/0.025% TEMED). After 1–2 hours polymer ization, re place the alcohol overlay with gel buffer. In the
case of SDS-PAGE and Ornstein-Davis nondenaturing gels, this should be 0.375 M Tris/Cl, pH 8.8
buffer.
6. Very carefully decant or aspirate the buffer overlay. Cast the stacking gel, approx imately twice the
sample volume, on top of the resolving gel. Overlay the stacking gel monomer with water-saturated
2-butanol or tert-amyl alco hol. Allow the stack ing gel to polymerize for 1–2 hours.
9
9
Page 15
3.2 Preparing the Frits and Dialysis Membrane
Soak the elution manifold support frit, elution frit, and dialysis membrane in buffer. The frits must be completely wetted prior to use. To ensure removal of en trapped air in the pores of the frits, place the container
in which the frits are soaking in a vacuum chamber for approximately 10 minutes. Alternatively, the frits can
be soaked in buffer overnight to completely wet them. To maintain the wetting of the frits, store them in buffer.
The dialysis membrane provided with the Model 491 prep cell has a molecular weight cut off of 6,000 daltons.
Dialysis membranes with other pore sizes may be sub stituted for those pro vided. The dialysis membrane
must be soaked in buffer before use and stored in buffer or water between uses. If the membrane be comes
dry between runs, discard it. A properly stored dialysis membrane can be used at least for 5-6 runs. Prior
to each run, inspect the membrane care fully. Discard it if any holes or tears are detected.
3.3 Assembly of the Elution Chamber
1. Insert the soaked support frit into the base of the elution chamber. The stepped support frit is the
thicker of the two frits. Press the frit all the way into the base to form a flat surface on which to place
the dialysis membrane. Place the dialysis membrane on the support frit and the elution frit on the
dialysis membrane. Press the large elution O-ring in the groove around the perime ter of the base.
10
10
Page 16
2. Decant the stacking gel overlay, rinse the surface of the stacking gel with water, and loosen the four
screws holding the column to the casting stand. Carefully re move the gel tube assembly from the
casting stand. Insert a spat ula into the gel re lease slot and use it to gently pry the gel tube assembly off
the cast ing stand. Inspect the lower surface of the gel to make sure it is smooth. Trapped air bubbles
may cause a pitted gel surface which will result in un even elution of proteins from the gel. If a pitted or
otherwise uneven gel surface is observed, pour a new gel.
3. Place the gel tube assembly containing the gel on the elution chamber base. Align the four screws with
the holes in the elution chamber base and hand tighten them.
11
11
Page 17
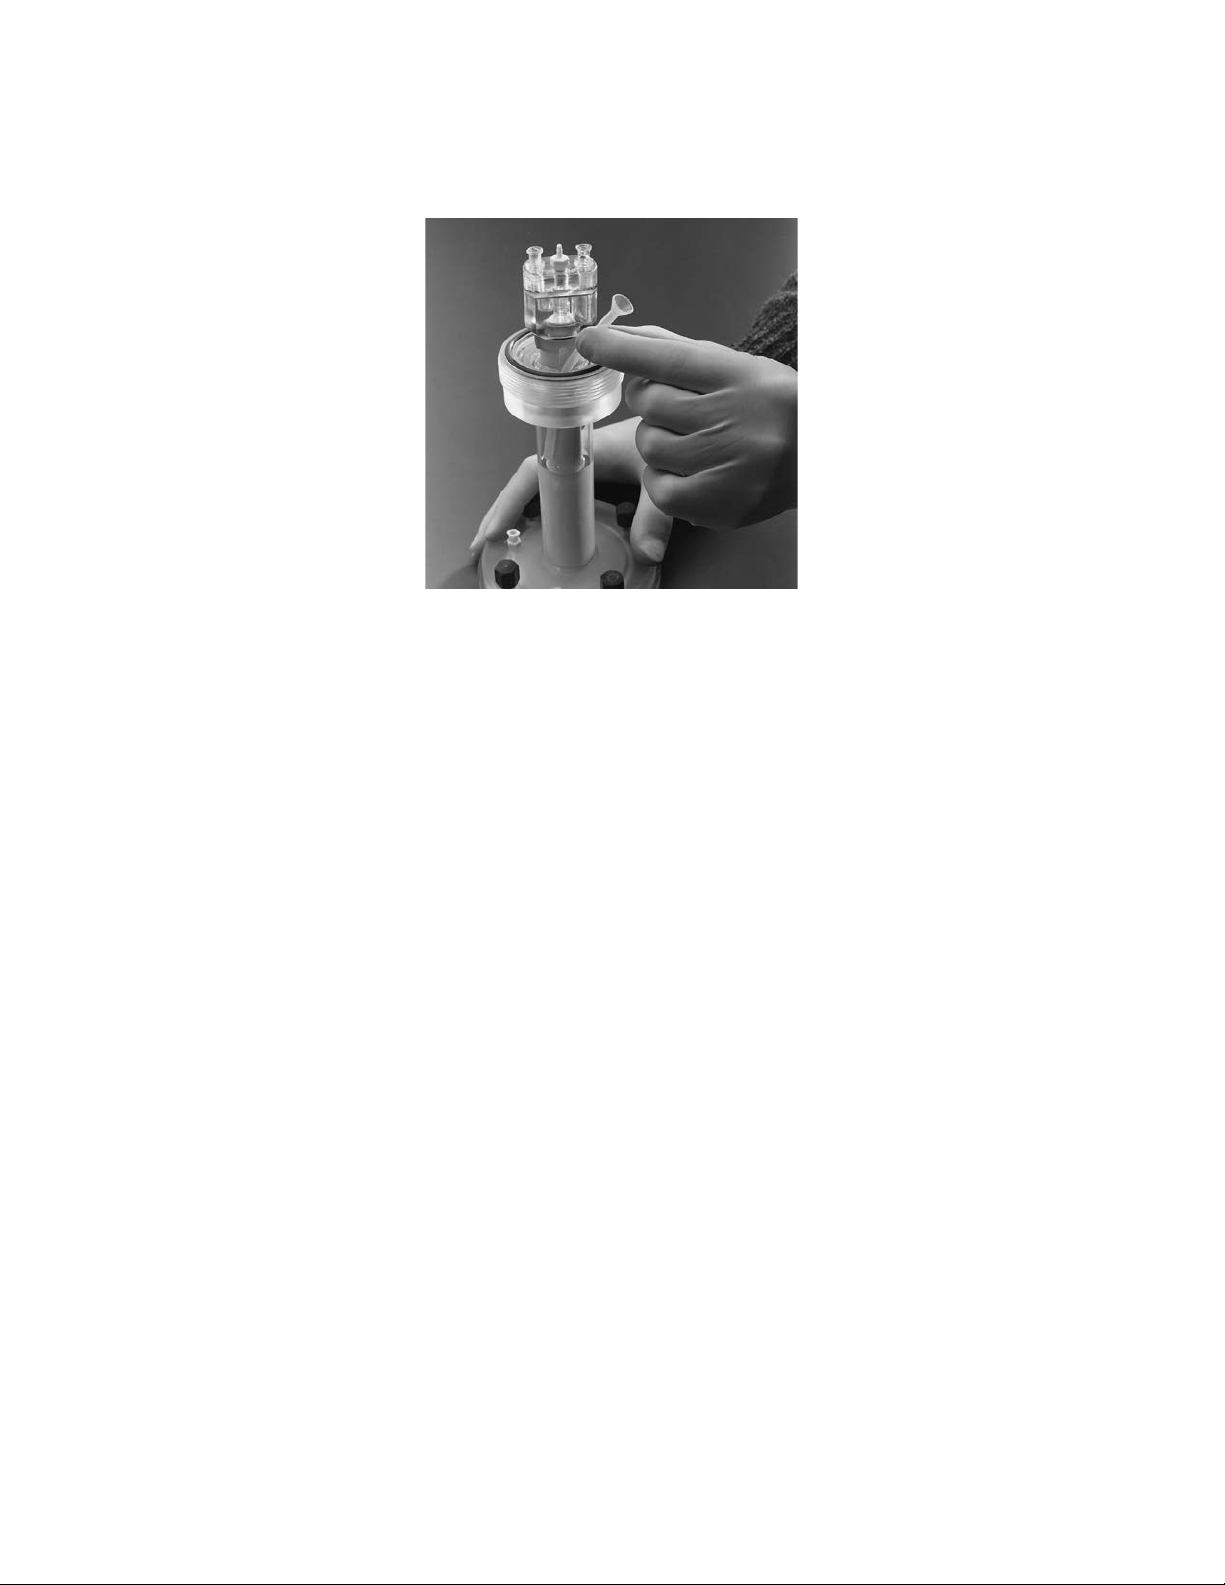
4. To simplify sample loading, the sample loading guide should be inserted into the space between the cooling
core and the gel tube at this time.
3.4 Assembly of Upper and Lower Buffer Chambers
1. Carefully place the upper buffer reservoir on the gel tube assembly and seat it firmly. Make sure the small
O-ring is properly seated in the threaded con nector.
The following connections should be made before the black ring nut is tightened. Align and connect the
elution buffer feedline (white cap) to the elution buffer reser voir and to the elution port (white port) on the
elution chamber. Then connect the recirculation buffer feedline (clear cap) to the port at the bottom of
the upper elec trophoresis buffer reservoir and to the recirculation buffer port on the elution chamber
(clear port).
2. Once the feedlines from the upper buffer chamber are aligned and secured to the connectors on the
elution chamber, hand tighten the black ring nut. This procedure will prevent attempting to turn the
chamber against the tightened nut. Connect the cooling buffer line (clear cap) already attached inside
the upper elec trophoresis reservoir with one of the two clear ports on the top of the cooling core to form
a small loop. Secure the second cooling buffer line (clear cap) to the other clear port on the cooling core;
this line connects to the inlet of the buffer recirculation pump. Connect the small diameter elution tubing
to the white elution buffer outlet in the center of the cooling core. Guide both the recirculating buffer line
and the elution tubing from the cooling core through the notch at the perimeter of the up per buffer
chamber.
12
12
Page 18

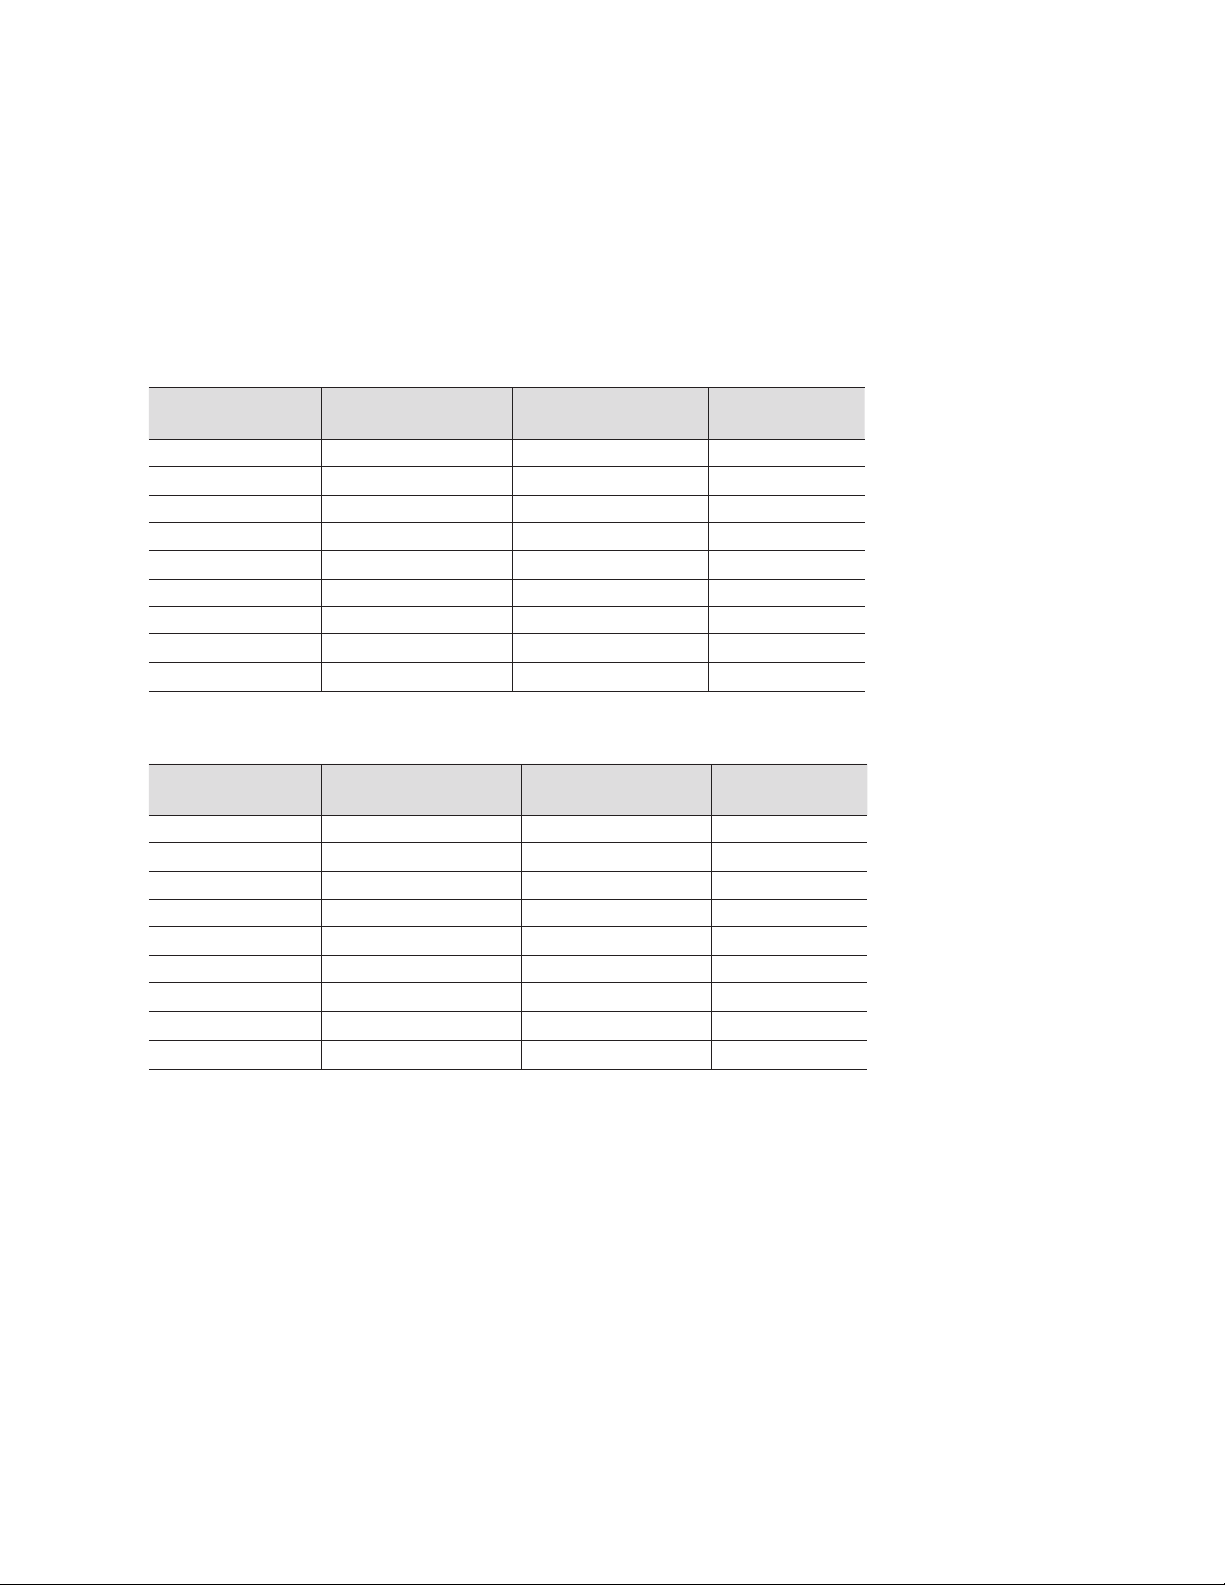
3. Fill the upper electrophoresis buffer reservoir (300–600 ml) and the elution buffer reservoir (750 ml) and
check that all the lines are properly connected. If leaking is ob served, check connections and reconnect
where necessary.
4. Thoroughly degas 1,500 ml electrophoresis/elution buffer. With the stop cock of the lower buffer tank closed,
fill the lower buffer reservoir with buffer to cover at least the height of gel. The level of lower electrophoresis
buffer should be at least 1–2 cm above the level of the gel poured within the tube. Place the whole gel tube
assembly into the lower buffer reservoir. See Sections 7 and 9 for buffer recipes.
13
13
Page 19

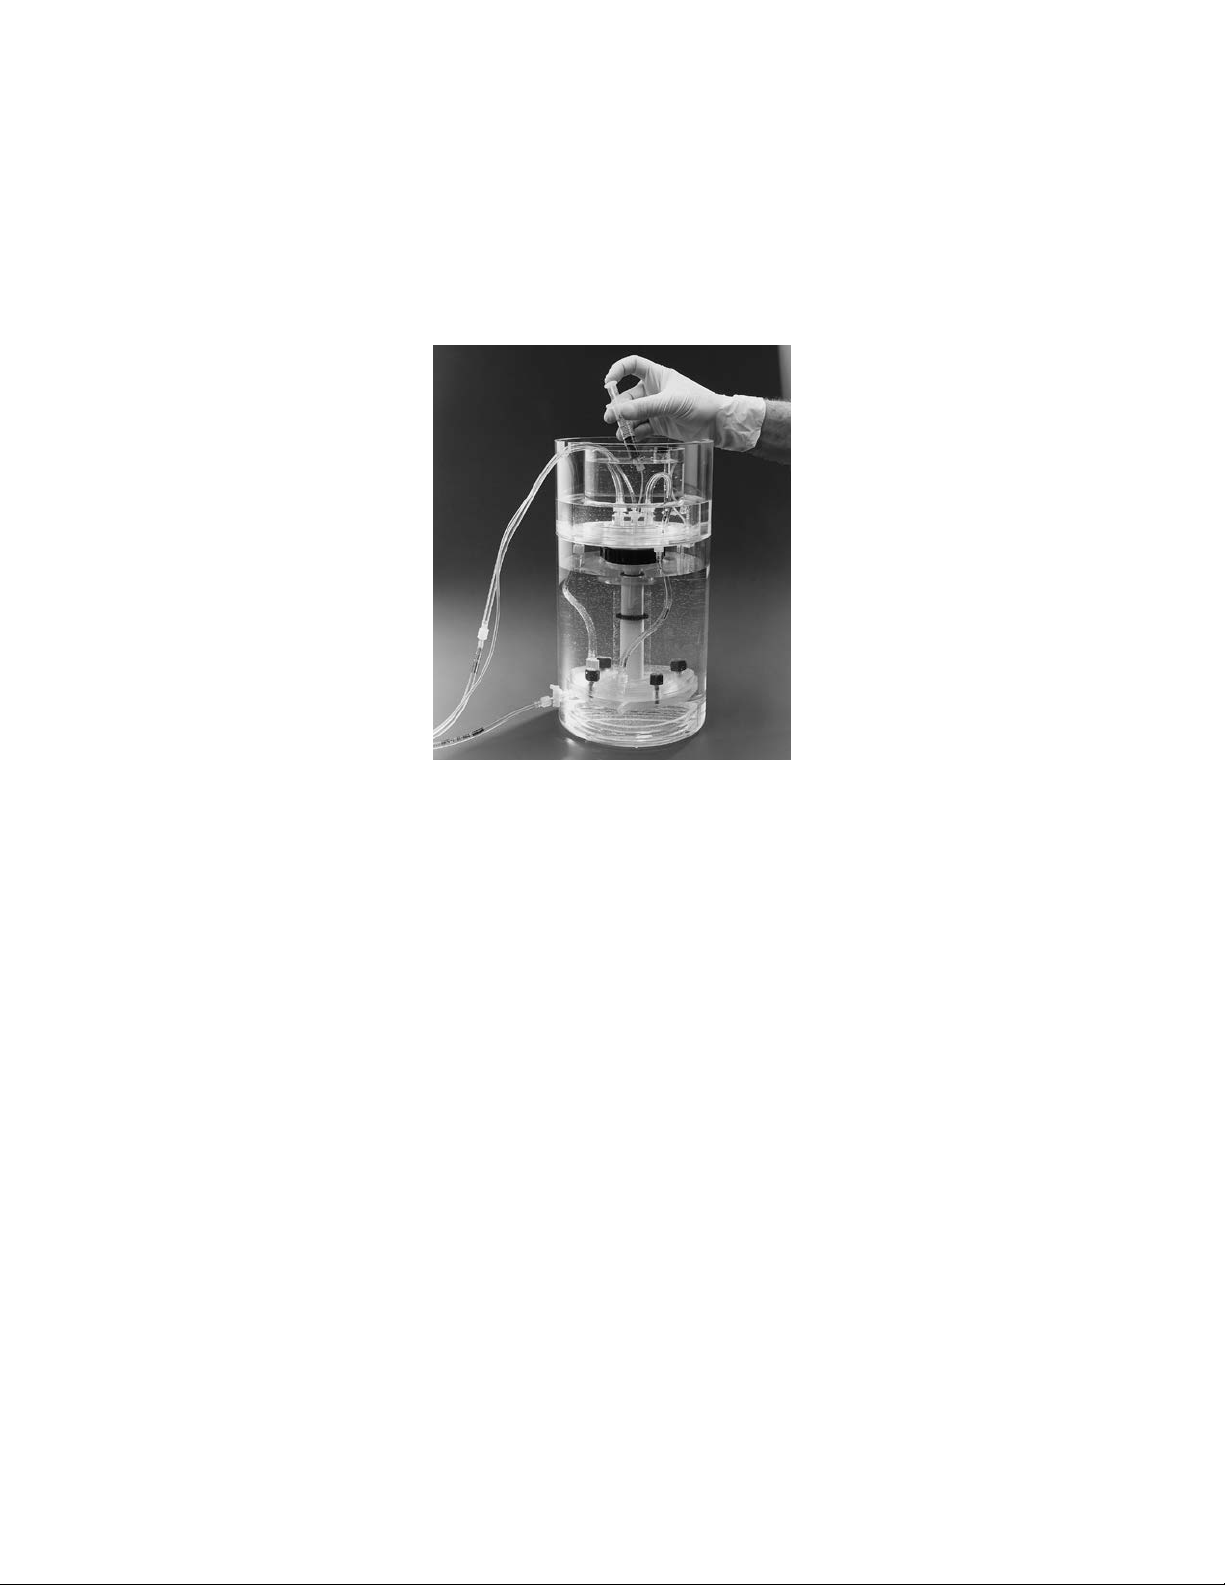
3.5 Purge the Elution Chamber of Air Bubbles
The elution chamber must be purged of air prior to running the cell. To do this, at tach a 50 ml syringe to the
elution buffer outlet tubing at the top of the cooling core. Gently pull elution buffer through the elution
chamber into the 50 ml syringe. To remove air bubbles trapped in the channels of the gray elu tion gasket,
gently push buffer (not air) back into the elution chamber with a full syringe. As you do this, you will see the
air bubbles trapped in the elution chamber exit through the port into the elution buffer reservoir. It may help
to lean the prep cell so that the feed line port on the elution chamber is up permost on the chamber making it
easier for bubbles to flow up and out into the elution buffer reservoir.
Release the syringe and attach the elution buffer out let tubing to a peristaltic pump. Set the elu tion pump
speed to 1 ml/min. Connect the outlet of the pump to a frac tion collector.
Fig. 8. Elution buffer pathway. Elution buffer is pulled from the elution buffer reservoir to the elution buffer port on the elution chamber
cap. The flow is directed through a series of channels in the gray elution chamber gasket to the perimeter of the elution frit. From there,
elution buffer and sep arated proteins emerging from the gel are drawn radially to the center of the elution frit and out through the elution
tube in the center of the cooling core. The elution tube is connected to a peristaltic pump, which drives the elution buffer to a detector
(optional) and a fraction collector.
14
14
Page 20

3.6 Cooling the Gel
First, determine which setting on the buffer recircu lation pump will provide a flow rate of ~100 ml/min. Next,
using the tubing pro vided with the Model 491 prep cell, connect the outlet of the buffer pump to the inlet
(stopcock) of the lower buffer chamber. Then connect the tubing exiting from the top of the cooling core to
the inlet of the buffer pump. Open the valve and set the pump speed at the maximal setting for a few
minutes to purge air from the lines. Then, reset the pump speed to 80–100 ml/min.
For separation of native proteins where colder temperatures are desirable a 2–3 me ter length of tubing can
be submerged in an ice bath, or an external re frigerator bath. The extra tubing should be placed in line
between the buffer recirculation pump outlet and the inlet to the lower buffer chamber. The Model 491 prep
cell can also be run in a cold room to keep fractions cold once they have been collected.
Fig. 9. Cooling pathway during electrophoresis. Heat generated in the gel during elec trophoresis is drawn off by means of both the
cooling core and the lower buffer cham ber. Electrophoresis buffer from the lower buffer chamber is pumped through the cooling core
which main tains an even cross sectional temperature within the gel.
15
15
Page 21
3.7 Loading the Sample
Care fully load the sample on the surface of the gel through the sample load ing guide with the sample
application syringe. Layer the sample under the electrophore sis buffer above the gel. Make sure the
stacking gel is not punc tured with the PTFE tubing.
Once the sample is loaded, place the lid on the cell and attach the cables to the power supply. Set the
power supply to the appropriate setting and begin elec trophoresis.
3.8 Elution Rate, Detection, Collection, and Analysis
Elution Rate
For the highest yield of purified protein we recommend an elution buffer flow rate of 0.75–1.0 ml/min.
Fractions of 2.5 ml usually provide sufficient separation. Fraction collec tion should begin after the ion/dye
front has eluted. For preparative SDS-PAGE, Table 5 shows the approximate elution times of purified
proteins for gels run with the opti mum %T and proper power condi tions. Refer to Section 9 for nativePAGE.
Detection
Elution of molecules can be monitored with an ultraviolet detector and chart recorder. However, with
preparative PAGE, a UV monitor does not usually provide an adequate representation of the fractionation.
The elution profile on the chart recorder tracing cannot replace electrophoretic analysis of indi vidual fractions
for determining the distribution of proteins and the level of contamination in each fraction. The ion front will
be seen on the UV chart recording as a high-absorbance peak or it will be in the fractions containing the
sample-buffer dye. Individual peaks can sometimes be seen on a chart recording, but in many instances the
sample will yield a broad, poorly defined trace registering slightly above baseline. See Figure 13 for an
example of an elution profile for a starting sample containing only three pro tein bands.
Collection and Analysis
To determine which fractions contain the protein of interest, individual prep cell frac tions must be analyzed
by slab gel electrophoresis. It is recommended that an analysis be performed by running every fifth or tenth
fraction past the ion front (i.e., fractions collected every 15 to 30 minutes) in mini gels. When the region with
the protein of interest is identified, every fraction within that region should be analyzed to determine the level
of contamination.
Fractions containing the puri fied protein can be pooled and concentrated as required for further analysis.
16
16
Page 22

Section 4
Optimizing Running Conditions for Preparative SDS-PAGE
The Model 491 prep cell is designed for separating a single component from its nearest con taminant. The
conditions required to achieve optimum resolution may be different than those of analytical electrophoresis. In
analytical SDS-PAGE, optimum reso lu tion is needed over a wide molecular weight range, whereas in
preparative SDS-PAGE the protein of interest needs to be separated from its nearest contaminant after
traveling the entire length of the gel.
The three variables to be considered for optimum resolution in preparative SDS-PAGE are:
4.1 Gel pore size
4.3 Gel length
4.4 Gel tube diameter
4.1 Gel Pore Size (Determining Optimum %T)
Since each protein purification is unique, it is important to first optimize the run ning conditions for each
application on an analytical level prior to prepara tive fractionation. In general, the best purification will be
achieved if the sample is at least partially purified prior to a preparative run. Any op timization procedure
should be carried out using the same protein sample as will be ap plied to the Model 491 prep cell.
The most important parameter in preparative SDS-PAGE is the pore size of the gel. The gel pore size is a
function of the acrylamide monomer concentra tion (%T) used to cast a gel. The monomer concentration
which best re solves two protein bands will vary de pending on the molecular weights of the pro teins of
interest. Changing the gel com position from the optimal concentration, by increasing or decreasing the
monomer concentra tion, will ultimately decrease reso lution.
By convention, polyacrylamide gels are characterized by the figures (%T/%C), where %T is the weight
percentage of total monomer including crosslinker (in g/100 ml), and %C is the proportion of crosslinker as a
percentage of total monomer. For both the analytical gels and the preparative gels use 2.67% N,
N’-methylene-bis-acry lamide crosslinker (premixed acrylamide:bis in the ra tio 37.5:1 can also be used). The
total monomer concentra tion for optimal resolution is re ferred to as optimal %T.
The pore size providing the optimum resolution for most proteins is that which results in a relative mobility (Rf)
value be tween 0.55–0.6. Optimal reso lu tion is not achieved with monomer concentra tions other than the
optimum value.
Rf values for specific proteins are obtained from the mini-gels that were run to op timize conditions for the
Model 491 prep cell. To calculate Rf values for specific proteins use this formula:
Distance that the protein of interest migrated
Rf =
Distance that the tracking dye migrated
The Rf value obtained from a mini gel can be used to estimate when a protein will elute from the Model 491
prep cell when the same concentra tion of acrylamide is used in both the mini gel and the preparative gel.
For those samples in which the molecular weight difference between the pro tein of interest and its nearest
contaminant is ≥10%, the optimum %T can be selected from Figure 10 in the following section. For those
samples in which the molecular weight difference be tween the protein of interest and its nearest contaminant is
≤10%, consult Section 4.3.
17
17
Page 23

4.2 Optimization Procedures
A. Simplified Optimization Procedure
When the difference in the molecular weights of the protein of interest and its near est contaminant is 10% or
greater, select the monomer con centra tion (optimum %T) which corresponds to the size of the protein of interest
from the plot below. In most cases the %T so ob tained will provide adequate resolution for the purified protein.
For gel length and gel tube size determination refer to Sections 4.3 and 4.4.
Optimum %T
Molecular weight of the protein of interest (kD)
Fig. 10. Model 491 prep cell SDS-PAGE gel optimization curve. In cases where the difference in molecular weight between the
protein of interest and its nearest con taminant is 10% or greater, the appropriate acrylamide concentration to purify the protein of
interest from it nearest contaminant can be determined using this standard curve.
B. Detailed Optimization Procedure
For samples where the molecular weight of the molecule of interest differs from its nearest contaminant by less
than 10%, we recommend the following procedure. Preliminary optimization is done using mini-slab gels, thus
elim inating lengthy and wasteful trial runs on the Model 491 prep cell.
The detailed optimization procedure involves running a series of analyt ical mini-gels covering a range of %T (in
1–2%T increments). Table 1 gives recom mended ranges of monomer concentrations for various protein molecular
weights. Use Figure 10 to obtain a midpoint for the range of gels to cast.
18
18
Page 24

Table 1. Recommended monomer concentrations.
Size Range %T Range
15–30 kD 6–10%
30–50 kD 9–12%
50–70 kD 7–10%
70–100 kD 5–9%
100-200 kD 4–8%
The procedure goes as follows:
1. Cast 3–4 polyacrylamide mini-slab gels in the range suggested in Table 1 (and Figure 10).
2. Load a sufficient amount of protein for detection by silver staining (~100 ng/lane). Load at least one lane
with 10 µl prestained high or low molecular weight standards and one lane with SDS-PAGE silver stain
standards (optional).
3. Choose one of the prestained molecular weight standards which migrates closest to the molecular
weight of the proteins of interest to monitor the gel run. Start elec trophoresis and continue until the
prestained marker protein has either run off the end of the gel or, where the proteins of in terest are
smaller than the marker, until the standard protein has reached a designated location near the end of the
gel.
4. When electrophoresis is complete, silver stain the gels and dry them.
5. Measure the distance between the protein bands of interest (protein to be purified and its nearest
contaminant) in each gel. (Net distance is measured; i.e., measure the distance between the bottom of
the upper band and the top of the lower band.)
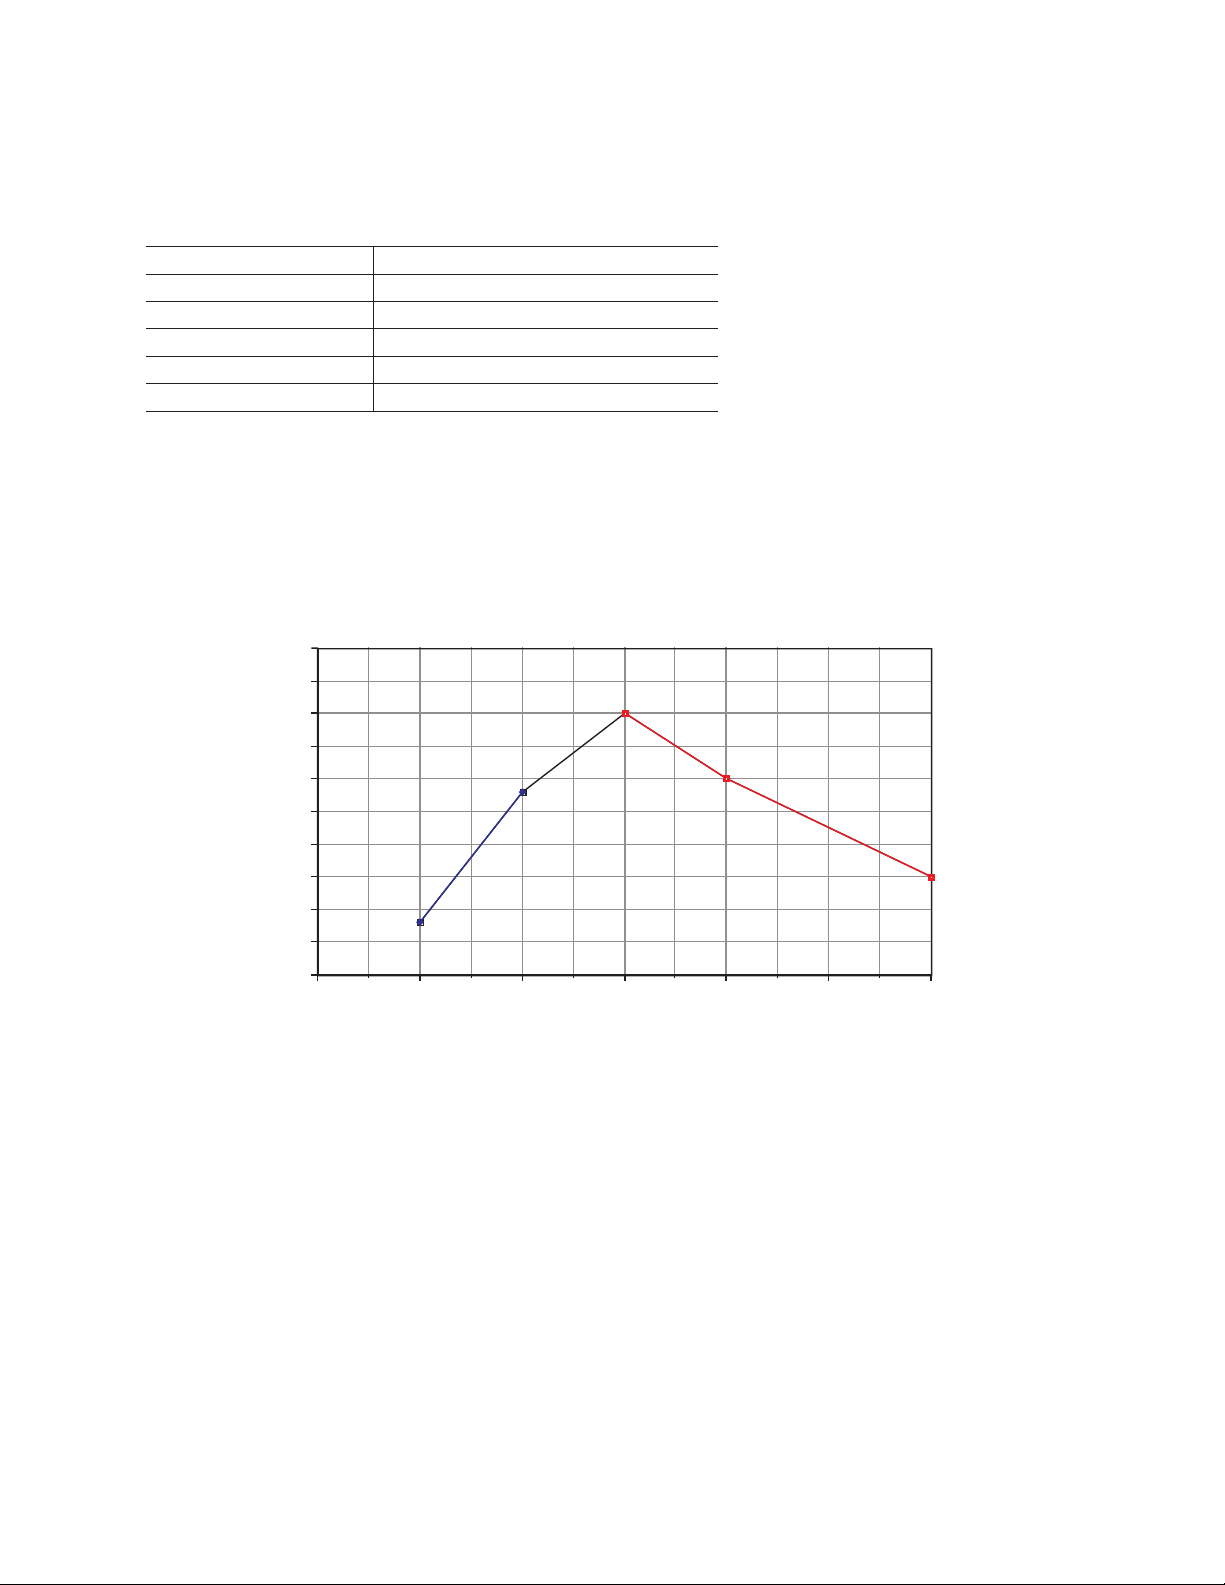
6. Plot the distance between bands versus %T and determine optimal %T from the cusp (or breakpoint) of
the graph. This is the optimal %T for use in the preparative gel tube. Resolution de creases at either side
of optimal %T. Please see Section 4.7 for examples.
4.3 Gel Length Determination for Preparative SDS-PAGE
Gel length is used to increase the resolution between proteins. However, longer gels are accompanied by an
increase in band diffusion. The minimal gel length depends on the differ ence in molecular weight be tween the
protein of interest and its nearest con taminant. The size difference be tween these two proteins (∆MW) is in versely
related to the gel length. Small size differences require longer gels to produce the best resolu tion. The sample
load, i.e. the amount of the protein of interest and its nearest contaminant, also affects resolution. Resolution
can be improved by either decreasing the sample load or increasing the gel length. Refer to Table 2 to select
the gel length for optimizing resolution and recovery of the protein of in ter est.
4.4 Gel Tube Size Selection
Both the protein load and the molecular weight difference between the pro tein of interest and its nearest
contaminant must be considered when se lect ing the size of the gel tube. Two different gel tubes are provided:
a 28 mm (internal diameter) gel tube which forms a gel with a 3.6 cm2 gel upper surface and a 37 mm (internal
diam eter) gel tube with an 8.2 cm2 gel surface area. Resolution between proteins with very small molecular
weight differences will improve approximately 1.5-fold for identical protein loads when the 37 mm column is
used instead of the 28 mm. This increase in resolution is accompanied by a higher dilution factor due to the
larger volume elution chamber.
19
19
Page 25
The larger gel surface of the 37 mm tube also allows for greater sample loads than does the 28 mm tube.
Tighter bands can be maintained by distributing the protein over a larger area.
Refer to Table 2 to determine the correct tube size and gel length for your purifica tion scheme.
The following guidelines are established for optimizing resolution and re covery of the protein of interest with
the least amount of dilution. The rec ommended protein loads in Table 2 refer to the amount of protein of
inter est and its nearest contami nant, not the total protein load. The tables also provide the monomer
volumes re quired for the recom mended gel length.
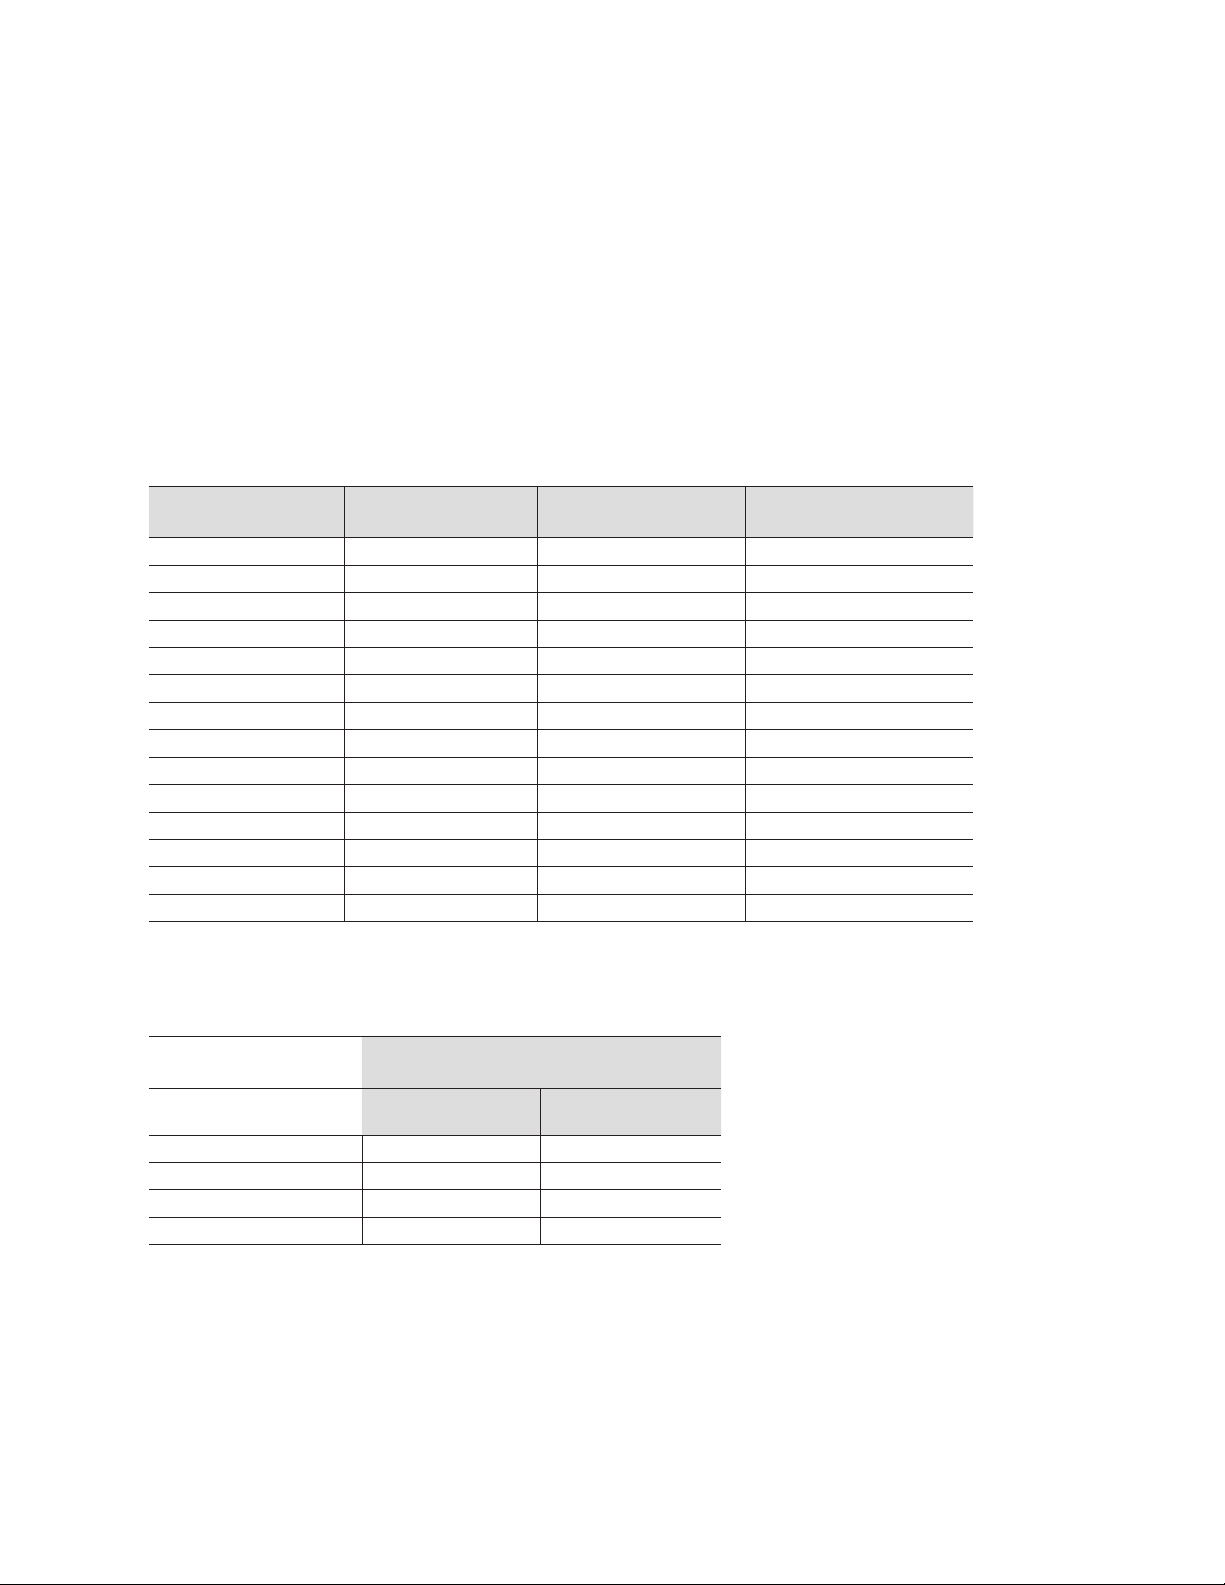
Table 2. Small gel tube (28 mm ID).
∆MW
(a)
>15% <1 mg 20 ml 4–6 cm
>15% 1–2 mg 20–40 ml 4–6 cm
>15% >2 mg proceed to table 3 –
10–15% <0.75 mg 20 ml 4–6 cm
10–15% 0.75–1.5 mg 20–40 ml 6–10 cm
10–15% >1.5 mg proceed to table 3 –
2–10% <0.5 mg 20 ml 4–6 cm
2–10% 0.5–1 mg 20–40 ml 6–10 cm
2–10% >1 mg proceed to table 3 –
Protein Load
(b)
Monomer Volume
(c)
Gel Length
Table 3. Large gel tube (37 mm ID).
∆MW
(a)
>15% <2 mg 50 ml 6 cm
>15% 2–4 mg 50–100 ml 6–10 cm
>15% >4 mg 100 ml 10 cm (d)
10–15% <1.5 mg 50 ml 6 cm
10–15% 1.5–3 mg 50–100 ml 6–8 cm
10–15% >3 mg 80 ml 10 cm (d)
2–10% 1 mg 50 ml 6 cm
2–10% 1–2 mg 50–100 ml 6–10 cm
2–10% >2mg 110 ml 10 cm (d)
Protein Load
(b)
Monomer Volume
(c)
Gel Length
(a) ∆MW refers to the percentage difference in size between the protein of interest and its near est con taminant.
(b) Protein load refers to the combined amount of the protein of interest and its nearest contam i nant and is
independent of the total protein load.
(c) The monomer volume recommended is based on using the optimum %T as established from analyti cal
gels.
(d) Loads greater than the recommended amounts may lead to corresponding loss of resolution.
20
20
Page 26

4.5 Running Conditions
We recommend running SDS-PAGE gels in the Model 491 prep cell using 12 W constant power. Values for
voltage and current should correspond to the settings listed in Table 4. Different running conditions apply for
native-PAGE (Section 9).
Table 4. Running conditions for preparative SDS-PAGE.
12 W Constant Power
Small gel tube (28 mm ID) 40–50 mA/240–300 V
Large gel tube (37 mm ID) 50–60 mA/200–400 V
4.6 Elution Times for Proteins
Elution times for proteins run through SDS-PAGE gels at 12 W constant power are estimated in Table 5. When
SDS-PAGE is carried out at the optimum %T, the relative mobility (Rf) for the protein of interest will be about
0.55–0.6. This corresponds to a velocity of ap proxi mately half that of the ion front, regardless of the size of the
pro teins. Therefore, the elution times for preparative SDS-PAGE are af fected by gel length and gel tube size
only and can be predicted. The elution times for both the ion/dye front and the puri fied protein are pro vided in
Table 5.
Table 5. Elution times at optimal %T.
Gel Length ,cm Elution Time for Proteins
(Rf~0.55), hr
28 mm gel tube
5 3.5 2.0
6 4.5 2.25
7 5.25 2.75
8 5.75 3.0
9 6.5 3.5
10 7.25 3.75
37 mm gel tube
5 6.0 3.0
6 6.75 3.5
7 7.75 4.0
8 8.5 4.5
9 10.0 5.25
10 11.0 5.5
*The elution times are approx imate and will vary somewhat depending on the exact run conditions.
Elution Time for Ion Front
(Rf=1), hr
21
21
Page 27

4.7 Examples of the SDS-PAGE Optimization Procedure
The following two examples demonstrate optimization protocols for separat ing two closely spaced proteins
on the Model 491 prep cell. In each example, a series of mini-slab gels were run to determine the best
acrylamide concentration to use in the preparative gel.
Example 1:
Purification of the Subunits of Phycocyanin
Phycocyanin, purified by ion exchange chromatography, contains two natu rally col ored blue protein subunits
of ~18.5 kD and ~21 kD and a third, uncol ored, 23 kD sub unit. In this case, since the subunits of
phycocyanin are well separated in size, it is possible to purify all three in a single run.
Five analytical mini slab gels, 12%, 14%, 16%, 18%, and 20%T/2.67%C, were cast to determine the %T
that would provide maximal separation of the two largest sub units. The migration of the blue protein bands
could be monitored directly without the use of prestained SDS-PAGE standards. Gels were run under
standard SDS-PAGE conditions until the faster running protein (18.5 kD) was 5 mm from the bot tom of the
gels. The gels were silver stained and dried, and the dis tances between the two blue phycocyanin bands
were mea sured and plotted versus %T. An optimal %T of approximately 14% for re solving these two
proteins was indicated by the breakpoint, or cusp, of this curve. Refer to Figure 11.
Phycocyanin: optimal %T for ~18,500 Da and ~21,000 Da
Distance between protein bands, mm
%T
Fig. 11. Analytical SDS-PAGE for determining optimum %T for purifica tion of 18.5 kD and 21 kD phycocyanin protein subunit
bands.The break point of the curve is con sidered the monomer concentration for optimal separation. In this case a 14% monomer
concen tration is indicated.
22
22
Page 28
To confirm the procedure, the Model 491 prep cell was run using the same %T range as the analytical gels.
17161514131211
Preparative runs of phycocyanin - resolution vs. %T
Preparative run conditions are shown in Table 6.
Table 6. Preparative run conditions.
Gel Composition 12%–17% T/2.67% bis
Gel Height 5.5 cm
Gel Size 25 mm ID
Sample Load 1 mg total protein
Running Conditions 40 mA constant current (~250–350 V)
Running Time ~5 hr
For each run the resolution (R = peak separation/average peak width) was de ter mined. The results of the
preparative runs shown in Figure 12 show how the op timal %T produces maximum resolution. The same
optimum %T of 14% as with the mini gel method was found. This plot demonstrates loss of resolution at
non-optimal gel concentrations. Reconstruction experiments with addition of irrelevant proteins showed
that regardless of the complexity of the sample of which phycocyanin was a part, an optimal %T of 14%
best resolved its two largest protein subunits.
Preparative runs of phycocyanin — resolution vs. %T
1.00
0.95
0.90
0.85
0.80
0.75
0.70
Resolution
0.65
0.60
0.55
0.50
Fig. 12. Confirmation of optimum %T for preparative SDS-PAGE to sepa rate two phycocyanin protein subunits (~18.5 kD and
~21 kD). As in chromatog raphy, resolu tion of two adjacent compo nents is defined as the ratio of peak separation to the mean peak
width as suming the peaks are Gaussian in shape (i.e., R=peak separation/average peak width).
%T
23
23
Page 29

A
Ionic
contaminants
10 20 30
1 hr 2 hr 3 hr 4 hr 5 hr
kD
18.5 kd
21 kd
23 kd
kD
kD
B
9 10 11 12 13 14 15 16 17 18 19 20 21 22 23 24 25 26 27 28 29 30 31 32
Fig. 13. Elution profile and SDS-PAGE analysis. A, Elution profile. Chromatographically purified phycocyanin was separated into
three sub units (18.5 kD, 21 kD, and 23 kD) by preparative SDS-PAGE in the Model 491 prep cell. B, Aliquots from the Model 491 prep
cell fractions 9-32 containing the separated protein subunits of phyco cyanin were analyzed by SDS-PAGE gels (14%T) and silver
stained. Starting material was run in the extreme left and right lanes. The low molecular weight subunit (18.5 kD) eluted in the Model
491 prep cell fractions 9–17, the mid-sized subunit (21 kD) in fractions 18–29 and the largest subunit (23 kD) eluted in fractions 29–32.
kD
23
21
18.5
Example 2:
Purification of a 98 kD Subunit from a 96 kD Subunit of Keyhole Limpet Hemocyanin
Keyhole limpet hemocyanin analyzed on SDS-PAGE gels shows several bands cov ering a broad range of
molecular weights. See Figure 15A. Among these are two proteins of approximately 96 kD and 98 kD
representing a differ ence in molecular weight of approximately 2%. To determine the optimal %T for
resolving these two proteins, four analytical gels of 5%, 6%, 8%, and 10%T/2.67%C were cast.
Hemocyanin was electrophoresed on each gel along with two lanes of prestained SDS-PAGE standards.
The prestained standards were used to monitor the position of the proteins of interest. Runs were con tinued
until the prestained BSA marker (~80 kD) of the prestained standards had just run off the gel. The gels were
silver stained and dried, and the dis tance between the two hemocyanin bands (96 kD and 98 kD) was measured and plotted versus %T. An optimal %T of approximately 7% is indi cated for resolving these two
proteins. See Figure 14.
24
24
Page 30

%T
Keyhole limpet hemocyanin: separation of 96kd and 98kd proteins
Keyhole limpet hemocyanin: separation of 96 kD and 98 kD proteins
2.0
1.9
1.8
1.7
1.6
1.5
1.4
1.3
1.2
1.1
1.0
0.9
0.8
0.7
0.6
Distance between protein bands, mm
0.5
1110987654
Fig. 14. Determination of optimal %T for 96 kD and 98 kD key hole limpet he mo cyanin proteins. The breakpoint of the curve is
con sidered the monomer concentration for optimal separation. In this case a 7%T/2.67%C monomer concentration is indicated.
Based on optimal %T data obtained from analytical mini-gels, subsequent prepara tive run conditions were
as shown in Table 7.
Table 7. Preparative run conditions based on optimal %T data obtained from analytical mini-gels.
Gel Composition 7% T/2.67% C
Gel Height 10 cm
Gel Size 28 mm
Sample Load 1 mg total protein
Running Conditions 40 mA constant current (250-350 V)
Running Time 8–10 hr
B
kD
98
96
kD
98
96
A
110
111
112
113
114
Fig. 15. Crude keyhole limpet hemocyanin (KLH) analyzed by SDS-PAGE. A, The locations of the 96 kD and the 98 kD bands are
indicated. B, SDS-PAGE analysis of aliquots taken from Model 491 prep cell fractions. The Model 491 prep cell separated the two
subunits of keyhole limpet hemo cyanin into two consecutive sets of six 2.5 ml nonoverlapping fractions. Crude KLH was run in about
every fourth lane. The 96 kD protein eluted in frac tions 110–115. The 98 kD protein eluted in fractions 116–117. There was no overlap.
115
25
25
116
117
118
119
120
121
Page 31

Section 5
Disassembling and Cleaning
1. Turn off the power supply, disconnect the cables from the power supply, and re move the lid. Turn off
both the elution and cooling pumps.
2. Disconnect the elution buffer tubing from the cooling core. Close the valve of the cooling buffer outlet on
the lower reservoir and disconnect the cooling pump tubing from the lower reservoir and the cooling
core.
3. Remove the upper reservoir with the gel tube assembly from the lower buffer chamber and pour off the
remaining buffer from both the elution and upper elec trophoresis buffer reservoirs. Disconnect the elution
buffer feedline and cooling buffer feedline from the elution chamber cap. Disconnect the cooling buffer
line from the cooling core and unscrew the black ring nut. Remove the upper reservoir from the gel tube
assembly.
4. Loosen the screws in the elution chamber cap and remove the gel tube assembly from the elution
chamber base. Rinse the support frits and the elu tion frit with deionized water and place them in a
container of buffer. Inspect the dialysis mem brane for tears. If the dialysis membrane is intact, rinse it in
deionized water and place it in a container with buffer.
5. Unlock and turn the cooling core several times to loosen it from the gel. Holding the gel tube in one
hand and the neck of the cooling core in the other, carefully pull out the cooling core. The gel may be
pulled up along with the cooling core. Use a soft implement to remove the gel from the gel tube. Wash
the gel tube and the cooling core with Bio-Rad Cleaning Concentrate (catalog number 161-0722). A
bottle brush may be used to remove residual polyacrylamide from the gel tube and cooling core. Do not
scratch or other wise abrade the interior surface of the glass tube or the glazing of the cooling core.
Insure that the collar of the gel tube assembly is free of residual polyacry lamide.
6. Decant the buffer from the lower reservoir. Rinse the Model 491 prep cell com ponents in deionized
water and dry them in air.
26
26
Page 32

Section 6
Troubleshooting Guide
Problem Cause Solution
1. Sample requires a long
time to en ter the gel.
a. High salt concentration in the
sample.
a. Remove salts by dialysis,
desalting column, etc.
2. Poor resolution.
3. No detectable proteins
in collected fractions.
4. Elution buffer floods
down into lower buffer
chamber.
5. Air pockets between gel
and gel tube.
a. Sample overloaded.
b. Incorrect %T.
c. Incorrect gel length or gel tube
size.
d. Inadequate cooling.
a. Proteins too dilute and UV
detect ion not sufficient.
b. Insufficient protein load.
c. %T too high and proteins remain
in gel or diffuse to un detectable
level.
d. %T too low, protein mi grates
with ion front.
a. O-ring or dialysis membrane in
elu- tion chamber missing or
damaged.
a. Mechanical stress.
b. It is normal for a gel to pull
slightly away from the wall.
c. Polymerization too fast.
a. Decrease sample load.
b. Refer to section 4.
c. Check Table 2.
d. Cooling flow rate should be 100
ml/min.
a. Use silver stained SDS-PAGE gels
to analyze indi vidual prep cell
frac tions.
b. Increase total protein loaded.
c. Decrease %T. See detailed
optimization procedure, section
4.2.
d. Increase %T. See detailed
optimization procedure in
Section 4.
a. Check to see if O-ring and dialysis
membrane are in place and not
dam aged.
a. Reduce handling of the gel during
polymerization.
b. Refractive phenomena often
accen tuate the appear ance of
these regions. They will not affect
protein resolu tion.
c. Check catalyst concentra tion.
6. Running conditions
outside recom mended
range.
d. Heat of polymerization not
dissi pated.
a. Buffer concentration or pH are
in correct.
27
27
d. Cool gel during polymer ization.
a. Make fresh buffer.
Page 33

Section 7
Preparation of Electrophoresis Buffers and Acrylamide Stock
Solutions for SDS-PAGE
The Model 491 prep cell has three buffer reservoirs: one for the lower electrophoresis buffer (~3 liters), one
for upper electrophoresis buffer (~600 milliliters) and one for the elu tion buffer (~900 milliliters). For SDSPAGE all three reservoirs contain the same buffer (Laemmli buffer system). It is recommended that 6.0 liters
of buffer be pre pared for each preparative run. Premixed liquid acry lamide (concentrated solution) and
premixed electrophoresis buffers (10x) are available. (See product information Section.)
7.1 Separating (Resolving) Gel Buffer Stock
1.5 M Tris-HCl pH 8.8
Dissolve 27.23 grams Tris base in approximately 100 ml deionized water.
Adjust to pH 8.8 with 6 N HCl.
Make to 150 ml with deionized water and store at 4 ˚C.
7.2 Stacking Gel Buffer Stock
0.5 M Tris-HCl, pH 6.8
Dissolve 6 grams Tris base in approximately 60 ml deionized water.
Adjust to pH 6.8 with 6 N HCl.
Make to 100 ml with deionized water and store at 4 ˚C.
7.3 Sample Buffer (SDS-Reducing Buffer)
Deionized water 3.8 ml
0.5 M Tris-HCl, pH 6.8 1.0 ml
Glycerol 0.8 ml
10% (w/v) SDS* 1.6 ml
0.5% bromophenol blue (optional) 0.4 ml
Total volume 7.6 ml
Add 50 µl beta-mercapto-ethanol to 950 µl of sample buffer prior to use. Dilute the sample at least 1:4 with
sample buffer, and heat at 95˚C for 4 min.
*To make a 10% SDS solution: Dissolve 10 g of SDS in deionized water with gentle stirring and bring to 100
ml with water.
SDS reducing buffer is 0.06 M Tris-HCl, pH 6.8, 2% SDS, 5% beta-mercapto-ethanol, 10% glycerol and
0.025% bromophenol blue.
Very dilute samples can often be adequately reduced with a two-fold dilution (1:1) with sample buffer.
28
28
Page 34

7.4 10x Electrode (Running) Buffer, pH 8.3
(Makes 1 L)
Tris base 30.3 g
Glycine 144.0 g
SDS 10.0 g
Dissolve and adjust to 1,000 ml with deionized water. DO NOT adjust pH with acid or base.
To make 6 L of 1x electrophoresis buffer (0.025 M Tris, 0.192 M glycine, 0.1% SDS, pH 8.3) for the prep cell,
dilute 600 ml of 10x stock with 5,400 ml deionized wa ter.
7.5 30% Acrylamide Stock Solution
Acrylamide/bis (N,N'-bis-methylene-acry lamide)
(30%T/2.67%C)
Acrylamide 146.0 g
Bis 4.0 g
Dissolve in about 350 ml deionized water then adjust to 500 ml with deion ized wa ter. Filter and store at 4°C
in the dark.
(Preweighed acrylamide/bis 37.5:1 mixture or 40% acrylamide/bis stock so lution can be substituted.
Calculate the volume of a 40% stock solution re quired to make the desired gel in Section 8.2).
Caution: Acrylamide monomer is a neurotoxin.
Avoid breathing acrylamide dust, do not pipet acrylamide solutions by mouth, and wear gloves when
handling acrylamide powder or solutions con taining it. For dis posal of unused acrylamide, add bisacrylamide (if none is present), induce polymer ization, and discard the solidified gel.
29
29
Page 35
Section 8
SDS-PAGE Gel Preparation
8.1 Gel Recipes
Table 8 can be used to prepare both analytical and preparative Tris-HCl acry lamide gels. Sections 8.2–8.3
provide detailed formulas for calculating specific gel percentages and volumes. Acrylamide/bis stock solution
of 30% (37.5:1) are used. The amounts listed for the components in Table 8 are based on a total vol ume of
10 ml. Determine the total volume needed and multiply each component by the appro priate number. As long
as SDS is included in the sample buffer and the upper elec trophore sis running buffer it can be left out of the
gels during their preparation.
Table 8. Gel preparation reference.
(Acrylamide Monomer)
%T
4 6.15 2.50 1.33
5 5.80 2.50 1.67
6 5.45 2.50 2.00
7 5.15 2.50 2.33
8 4.80 2.50 2.67
9 4.45 2.50 3.00
10 4.15 2.50 3.33
11 3.80 2.50 3.67
12 3.45 2.50 4.00
13 3.15 2.50 4.33
14 2.80 2.50 4.67
15 2.45 2.50 5.00
16 2.15 2.50 5.33
17 1.80 2.50 5.67
ddi H2O,
ml
Gel buffer solution*,
ml
Acrylamide/bis Solution
30% stock (37.5:1), ml
*Resolving Gel buffer - 1.5 M Tris-HCl, pH 8.8
*Stacking Gel buffer - 0.5 M Tris/HCl, pH 6.8
Table 9. Catalyst preparation reference.
Catalyst
10% APS*
(µl)
Analytical resolving gel 50 5
Stacking Gel 50 10
Preparative resolving gel 25 2.5
Stacking gel 50 10
**Note: Amounts are per 10 ml gel volume. Different amounts of catalyst are added for analytical and preparative gels. To make 10%
APS, dissolve 100 mg in 1 ml of deionized water.
TEMED*
(µl)
30
30
Page 36

8.2 Analytical Separating Gels
Table 10. Calculating %T (0.375 M Tris, pH 8.8).
Separating Monomer Concentration = %T = %x
Acrylamide/bis (30% T/2.67%C Stock) c ml
Deionized water d ml
1.5 M Tris HCI, pH 8.8 2.5 ml
10% ammonium persulfate (fresh daily) 50 µl
TEMED 5 µl
Total monomer 10 ml (volume needed for 2 mini gels
Determine c ml and d ml for 10 ml of total monomer:
c ml: Calculate the volume of 30% acrylamide/bis stock
required for 10 ml of the desired total monomer concentration
with the following formula:
c ml = (%x)(10 ml)/(30%) = (x)(0.333) ml
d ml: Calculate the volume of water required at the
desired total monomer concentration with the
following formula:
d ml = 10 ml – 2.5 ml – 50 µl – 5 µl – c ml = 7.445 ml – c ml
Important: One can prepare any desired volume of monomer solution by mul tiplying the 10 ml recipe by the
appropriate multiplying factor.
8.3 Analytical Stacking Gel
Table 11. 4%T/2.67%C (0.125 M Tris, pH 6.8).
Stacking Monomer Concentration = 40% T/2.67% C
Acrylamide/bis (30% T/2.67%C stock) 1.33 ml
0.5 M Tris HCI, pH 6.8 6.10 ml
Deionized water 2.5 ml
10% ammonium persulfate (fresh daily) 50 µl
TEMED 10 µl
Total monomer 10 ml (volume needed for 2 stacking gels
31
31
Page 37

8.4 Preparative SDS-PAGE Separating and Stacking Gels
(The following calculations are based on the preparation of a full length sepa rating gel of ~11 cm with a ~2.5
cm stacking gel in the 28 mm ID gel tube)
Table 12. Calculating %T.
Monomer
Concentration
Acrylamide/bis (30% T/2.67%C
stock solution)
Deionized water d ml 6.2 ml
0.5 M Tris HCI, pH 8.8 10.0 ml –
1.5 M Tris HCI, pH 6.8 – 2.5 ml
10 % ammonium persulfate 100 µl 50.0 µl
TEMED 10 µl 10.0 µl
Total monomer 40 ml 10.0 ml
c ml: Calculate the volume of acrylamide/bis stock required for the desired total monomer
concentration with the following formula:
c ml = (x%) (40 ml)/% acrylamide stock solution
d ml: Calculate the volume of water required for the desired total monomer concentration with the
following formula:
Separating Gel
%x = %T
c ml 1.3 ml
Stacking Gel
4% T
d ml = 40 ml – 10 ml – 100 µl – 10 µl – c ml = 29.89 ml – c ml
The volume of the stacking gel should be one-and-one-half to twice the sam ple volume to be
electrophoresed. Large sample volumes will require large stacking gels, which will limit the length of the
resolving gel.
32
32
Page 38

Section 9
A Guide to Preparative Native-PAGE
9.1 Introduction
Conventional gel elec trophoresis buffer sys tems and media are used with the Model 491 prep cell to separate
in di vidual components from their nearest con tami nants. This guide describes a method for selec ting the best
nondenaturing PAGE system to isolate a particu lar protein with the Model 491 prep cell.
Native-PAGE Theory
Preparative native-PAGE is a technique for high yield purification of bio logi cally active molecules. In contrast to
SDS-PAGE where proteins migrate ac cording to size only, the mobili ties of proteins in native-PAGE systems
de pend on both their charges and sizes. There is no single electrophoresis buffer sys tem that will opti mally
purify all native proteins. When selecting conditions for the purification of a native pro tein there are some basic
pa rameters to con sider: the pI of the pro tein under investigation, and the pH of the electrophore sis buffer
system.
In preparative native-PAGE, the most important consideration for op timum reso lution of a protein is the pH of
the electrophoresis buffer. The pH of the elec trophoresis buffer sys tem must be within the pH range over which
the protein under study is stable and re tains its biological ac tivity. In addition, the pH of the chosen buffer system
must impart sufficient charge to the pro tein for it to move through the gel at a reasonable rate during the run.
Changes in pH alter the charges (and shapes) of proteins and there fore will af fect the migration rates and
resolution patterns of proteins in the sample. For exam ple, a buffer with an alkaline pH value relative to the pI
of a particu lar protein will impart net negative charge to the pro tein. In such a buffer sys tem, the protein migrates
towards the positive electrode (anode). Electrophoresis buffers with acidic pH values relative to the pI of a
protein impart net positive charge to the protein so that it migrates towards the neg a tive electrode (cathode).
A buffer with a pH value identical to the pI of a pro tein results in net neutral charge on the protein and it will not
move at all in an electric field.
In native-PAGE, protein mobilities are best modified by the buffers pH. Electrophoresis buffers with pH values
close to the pI of the protein of interest will theoreti cally provide the best resolution. However, the resultant
migration rate may be too slow for elution from the prepara tive gel column. Conversely, buffers with pH values
farther away from the pI of the protein of interest re sult in faster mi gration rates, but, with a loss of resolution.
The choice of pH be comes a com promise between separation and speed.
Once the native protein is purified, an enzyme assay or immunoblot can be used to identify the specific location
of the protein in a slab-gel or in the fractions collected from the Model 491 Prep Cell. Analysis by SDS-PAGE
can be used to confirm the resolution and purity. Silver stained SDS-PAGE gels will demonstrate the presence
of any contami nating pro teins.
9.2 How to Choose Native-PAGE Systems
Discontinuous Buffer Systems
The discontinuous buffer system of Ornstein-Davis (Tris/chloride/glycine) should be the first nonde naturing gel
system tried (Ornstein 1964). Detailed protocols are pro vided in Section 9.3 for using this system. In discontinuous
systems, the buffer used in the stacking gel, resolving gel and in the electrode chambers differs in ionic
concentration and pH. An ad vantage of discontinuous systems for dilute protein so lutions is the use of stacking
gels to concentrate the sample. However, the stacking phenomena encountered in discontinuous systems can
cause aggrega tion of some pro teins and this can severely in terfere with reso lu tion. Section 9.2 presents an
alternative to using discontinuous buffer systems.
33
33
Page 39

Continuous Buffer Systems
The pH attained in the resolving gel of the Ornstein-Davis system ap proaches pH 9.5, which may be outside
the range of stability for some pro teins. Alternative dis continuous buffer systems derived for preparative work
can be found in an arti cle by Chrambach and Jovin (Chrambach and Jovin 1984). The electrophore sis
buffers described in this article span the pH range from 3–10. Protocols for using these discon tinuous buffers
are analagous to those listed in Section 3 for the Ornstein-Davis buffer system.
If discontinuous systems cannot be used because of stacking-induced ag grega tion, a continuous buffer
system will be required. In continuous systems the same buffer is used in the upper and lower elec trode
chambers and in the gel. McLellan describes various continu ous buffer systems from pH 3.8–10.2 that can
be tried (Mclellan 1982). See Section 9.4 for preparation of these continu ous buffers.
For in-depth discussions of electrophoresis and the distinctions between contin uous and discontinuous
systems, the Hames, Andrews, and Allen references in Section 9.5.
Optimizing Conditions for Preparative Native-PAGE
Conditions for purification of native proteins with the Model 491 prep cell should first be optimized on a small
scale using mini-slab gels. It is recommended that the proce dures described in this guide be repeated for
each new sample to be purified. Any op timization proce dure should be carried out using the same crude or
partially purified protein sample as will be ap plied to the Model 491 prep cell. Figure 16 presents an overview
of the optimization procedure.
Isolating individual proteins by preparative native-PAGE can be simplified by par tially purifying the sample
using preparative isoelectric focusing or chromatogra phy before electrophoresis in the Model 491 prep cell.
34
343535
Page 40

Determine the pI of the protein
under investigation. Isoelectric
focusing is recommended for
this purpose.
Determine the pH
range where the
protein retains its
biological activity.
YES
Is the pI of the protein below pH 8.5?
YES
Run the sample containing
the protein to be purified on
mini-slab gels using the
discontinuous system of
Ornstein and Davis. See
Section 3.
Does the protein precipitate
at the interface of the
stacking gel and resolving
gel?
NO
YES
Is the protein stable at
pH 9.5?
NO
NO
Ornstein-Davis buffer system
(pH 9.5) should not be used
because:
1. The protein of interest will
denature due to high pH.
2. Or, the protein of interest
will carry so little net charge
that it will not migrate
through the gel.
3. Or, the protein of interest
will carry a positive charge.
A. Use a different
discontinuous system of
appropriate pH. (See
Chrambach and Jovin
1984)
or
B. Select a continuous buffer
system (McLellan1982) of
appropriate pH. See
Section 4.
Ornstein-Davis system can
be used. For reagent
preparation and running
conditions refer to Section 3.
Fig. 16. Selecting a native electrophoresis buffer system.
Page 41

9.3 Discontinuous Native-PAGE
Acrylamide Concentration – Gel Pore Size
By convention, polyacrylamide gels are characterized by the figures (%T/%C), where %T is the weight
percentage of total monomer including crosslinker (in g/100 ml) and %C is the proportion of crosslinker as a
percentage of total monomer. For both the analytical gels and the preparative gels use 2.67% N, N’-methylenebis acry lamide crosslinker (premixed acrylamide:bis in the ra tio 37.5:1 can also be used). The total monomer
concentra tion determines the pore size of the gel and is re ferred to as %T.
The mobilities of native proteins can be modified by changing the pore size of the gel. This change in pore size
is accomplished by changing the amount of acry lamide (%T) in the gel. As the pore size changes, the change
in mobility differs for each protein in the sample mix. The result is that the separation pattern can be altered by
changing the acry lamide concentration.
The optimum gel concentration for preparative work is determined empiri cally as the one that best separates
the protein of interest from its contami nants. In native preparative PAGE, gels with large pores are preferred
be cause of the relatively high migration rates they allow. For discontinuous na tive PAGE in the Model 491 prep
cell, gels be tween 4% and 10%T/2.67%C provide op timal resolution. Gel lengths of 4–5 cm are sufficient to
resolve most pro teins. Determination of the optimum acry lamide concentration is accom plished using mini-slab
gels as follows.
Acrylamide Concentration – Optimization Procedure
Selection of the optimum gel concentration begins with running the sample in a series of analytical mini-gels
composed of 4%, 6%, 8%, and 10% acry lamide. When the marker dye reaches the bottoms of the gels, the
runs are terminated and the gels are stained. In each gel, the separation of the pro tein of interest relative to its
contaminants is assessed. The gel with the lowest acrylamide concentra tion that gives the best resolution is
the one to use for native preparative PAGE.
A graphical way to determine the optimum acrylamide concentration from these analytical gels is by comparing
the relative mobilities (Rf) of the protein of interest and its nearest contaminant. (To calculate Rf values see
Section 3.7.) To achieve this, plot the relative mobilities of the protein of interest and its nearest contami nant,
as measured in each gel, against acry lamide percentage. From this graph, choose the lowest acrylamide
con centration that gives the greatest difference in Rf be tween these two proteins. This is the %T to use for
preparative native-PAGE in the Model 491 prep cell.
Polyacrylamide Gel Recipes
A. Prepare a 30% Acrylamide Stock Solution
Acrylamide/bis (30%T/2.67%C)
Acrylamide - 146.0 g
N,N’-bis-methylene-acry lamide (Bis) - 4.0 g
Dissolve in 350 ml deionized water then adjust to 500 ml with deion ized wa ter. Filter and store at 4°C in the
dark.
(Preweighed Acrylamide/bis 37.5:1 mixture or 30% acrylamide/bis stock so lu tion can be substituted.
Caution: Acrylamide monomer is a neurotoxin.
Avoid breathing acrylamide dust, do not pipet acrylamide solutions by mouth, and wear gloves when handling
acrylamide powder or solutions con taining it. For dis posal of unused acrylamide, add bis-acrylamide to create
a gel, induce polymer ization, and discard the solidified gel.
36
36
Page 42

Preparing Ornstein-Davis Native Electrophoresis Buffer Solutions
A. Resolving (Separating) Gel Buffer (1.5 M Tris-HCl pH 8.8)
Dissolve 27.23 grams Tris base in approximately 80 ml deionized water.
Adjust to pH 8.8 with 6 N HCl.
Make to 150 ml with deionized water and store at 4˚C.
B. Stacking Gel Buffer (0.5 M Tris-HCl, pH 6.8)
Dissolve 6 grams Tris base in approximately 60 ml deionized water.
Adjust to pH 6.8 with 6 N HCl.
Make to 100 ml with deionized water and store at 4 ˚C.
C. Sample Buffer (0.0625 M Tris-Cl, pH 6.8, 10% Glycerol, 0.025% Bromophenol Blue)
Deionized water - 5.8 ml
0.5 M Tris-HCl, pH 6.8 - 1.0 ml
Glycerol - 0.8 ml
0.5% Bromophenol blue (optional) - 0.4 ml
Total volume - 8.0 ml
D. 10x Electrode Running Buffer, pH 8.3 (Makes 1 L)
Tris base - 30.3 g
Glycine - 144.0 g
Dissolve and adjust to 1000 ml with deionized water. DO NOT adjust pH with acid or base.
E. To make 1x Electrode Running Buffer (6 L; 0.025 M Tris, 0.192 M Glycine, pH 8.3)
Dilute 600 ml 10x electrophoresis buffer (pH 8.3) with 5,400 ml deionized wa ter. Do not adjust
pH with acid or base.
37
37
Page 43

Prepare Ornstein-Davis Acrylamide Gels
Use the following table to prepare acry lamide gels (both analytical and prepar ative). The amounts listed for the
components in the table below are based on a total vol ume of 10 ml. Determine the total vol ume needed and
multiply each component by the appro priate number.
Table 13. Reference table for the preparation of acrylamide gels (10 ml volume).
%T Deionized H2O,
ml
4 6.15 2.50 1.33
5 5.80 2.50 1.67
6 5.55 2.50 2.00
7 5.15 2.50 2.33
8 4.80 2.50 2.67
9 4.45 2.50 3.00
10 4.15 2.50 3.33
*Resolving Gel buffer - 1.5 M Tris-HCl 8.8
*Stacking Gel buffer - 0.5 M Tris-HCl 6.8
Gel Buffer*,
ml
Bis-acrylamide solution
30% stock (37.5:1), ml
Prior to pouring a gel, induce acrylamide polymerization by adding the follow ing catalyst solutions. Amounts
are per 10 ml gel volume.
Table 14. Reference table for the preparation catalyst solutions.
Catalyst
10% APS**
(µl)
Analytical Resolving Gel 50 5
Stacking Gel 50 10
Preparative Resolving Gel 25 2.5
Stacking Gel 50 10
**Note: To slow the rate of polymerizaton and avoid temperature induced in consistencies in then gel, different amounts of catalyst are
used for preparative gels and analytical gels. To make 10% APS, dissolve 100 mg in 1 ml of deion ized water.
TEMED**
(µl)
Consult Sections 3 and 4 in this manual for an in-depth discussion about casting preparative gels, sample
loading and running conditions.
Running Conditions for Discontinuous Native-PAGE Using the Prep Cell
A. Run the Model 491 prep cell at 12 W con stant power. Cooling the lower buffer and (or) running the
gel in the cold room will help to maintain the biological activity of some proteins.
B. An elution flow rate of 0.75–1.0 ml/minute is recommended. Fractions should be collected following
elution of the ion front.
C. Protein migration rates of 1.0–2.0 cm/hour correspond to ap proximate elu tion times of 3–6 hr for a
5 cm gel.
38
38
Page 44

D. The migration rates of proteins run in Ornstein-Davis gels at 12 W con stant power will approximate those
shown in Table 15.
Table 15. Approximate migration rates of proteins run in Ornstein-Davis gels at 12 W constant power.
Rf Migration Rate
1.0 30 mn/cm gel
0.8 40 mn/cm gel
0.6 50 mn/cm gel
0.45 60 mn/cm gel
Rf values for specific proteins are obtained from the mini-gels that were run to optimize conditions for the
Model 491 prep cell. To calculate Rf values for specific proteins use this formula:
Distance that the protein of interest migrated
Rf =
Distance that the tracking dye migrated
The Rf value obtained from a mini gel can be used to estimate when a protein will elute from the Model 491
prep cell when the same concentra tion of acrylamide is used in both the mini gel and the preparative gel. Rf
values below 0.45 may result in excessive band broadening and loss of resolution.
9.4 Continuous Native-PAGE
Selection of Continuous Buffer Systems
In continuous systems the same buffer is used in the elec trode chambers and in the gels. Since stacking
gels are not com monly em ployed, proteins mi grate in bands at least as tall as the ap plied sam ple. Therefore,
the sample volume must be kept at a minimum. The mobilities of proteins in continuous systems are
dictated primarily by pH rather than by sieving through the poly acrylamide gel. For this reason, 6%
polyacry lamide gels are recom mended for most appli cations. For very large proteins 4% or 5% gels may be
used.
1. Use Table 16 to prepare electrophoresis buffers within the operating pH range of the protein under
investi gation. Make sure the acidic and basic components used are compatible with the protein under
in vestiga tion.
2. It is difficult to predict the migration rate of pro teins in native buffer sys tems without preliminary analysis.
For a chosen buffer system, determine if the protein of interest is neg a tively or posi tively charged.
a. If the pI of the protein of interest is < pH of the buffer system, the protein is negatively charged and
will migrate to the anode.
b. If the pI of the protein of interest is > pH of the buffer system, the protein is positively charged and
will migrate towards the cathode. In this case make sure to reverse the elec trodes to the power
supply to ensure migration into the gel.
3. Prepare 6%T/2.67%C mini-gels with the selected buffers. See Section 9.3 for preparation of a 6%
acrylamide gel. Electrophoresis is carried out at ap proximately 200 V for about one hour.
4. Mini-gels should be silver stained to determine the level of contamination of the protein of interest. The
buffer system of the gel showing the best reso lu tion and exhibiting a migration rate for the protein of
in terest of approximately 0.5 mm/minute is ideal for the preparative gel.
Buffers used for continuous systems are not limited to those listed in the fol low ing section. Virtually any
buffer can be used if it proves appropri ate for the pro tein un der inves tigation.
39
39
Page 45
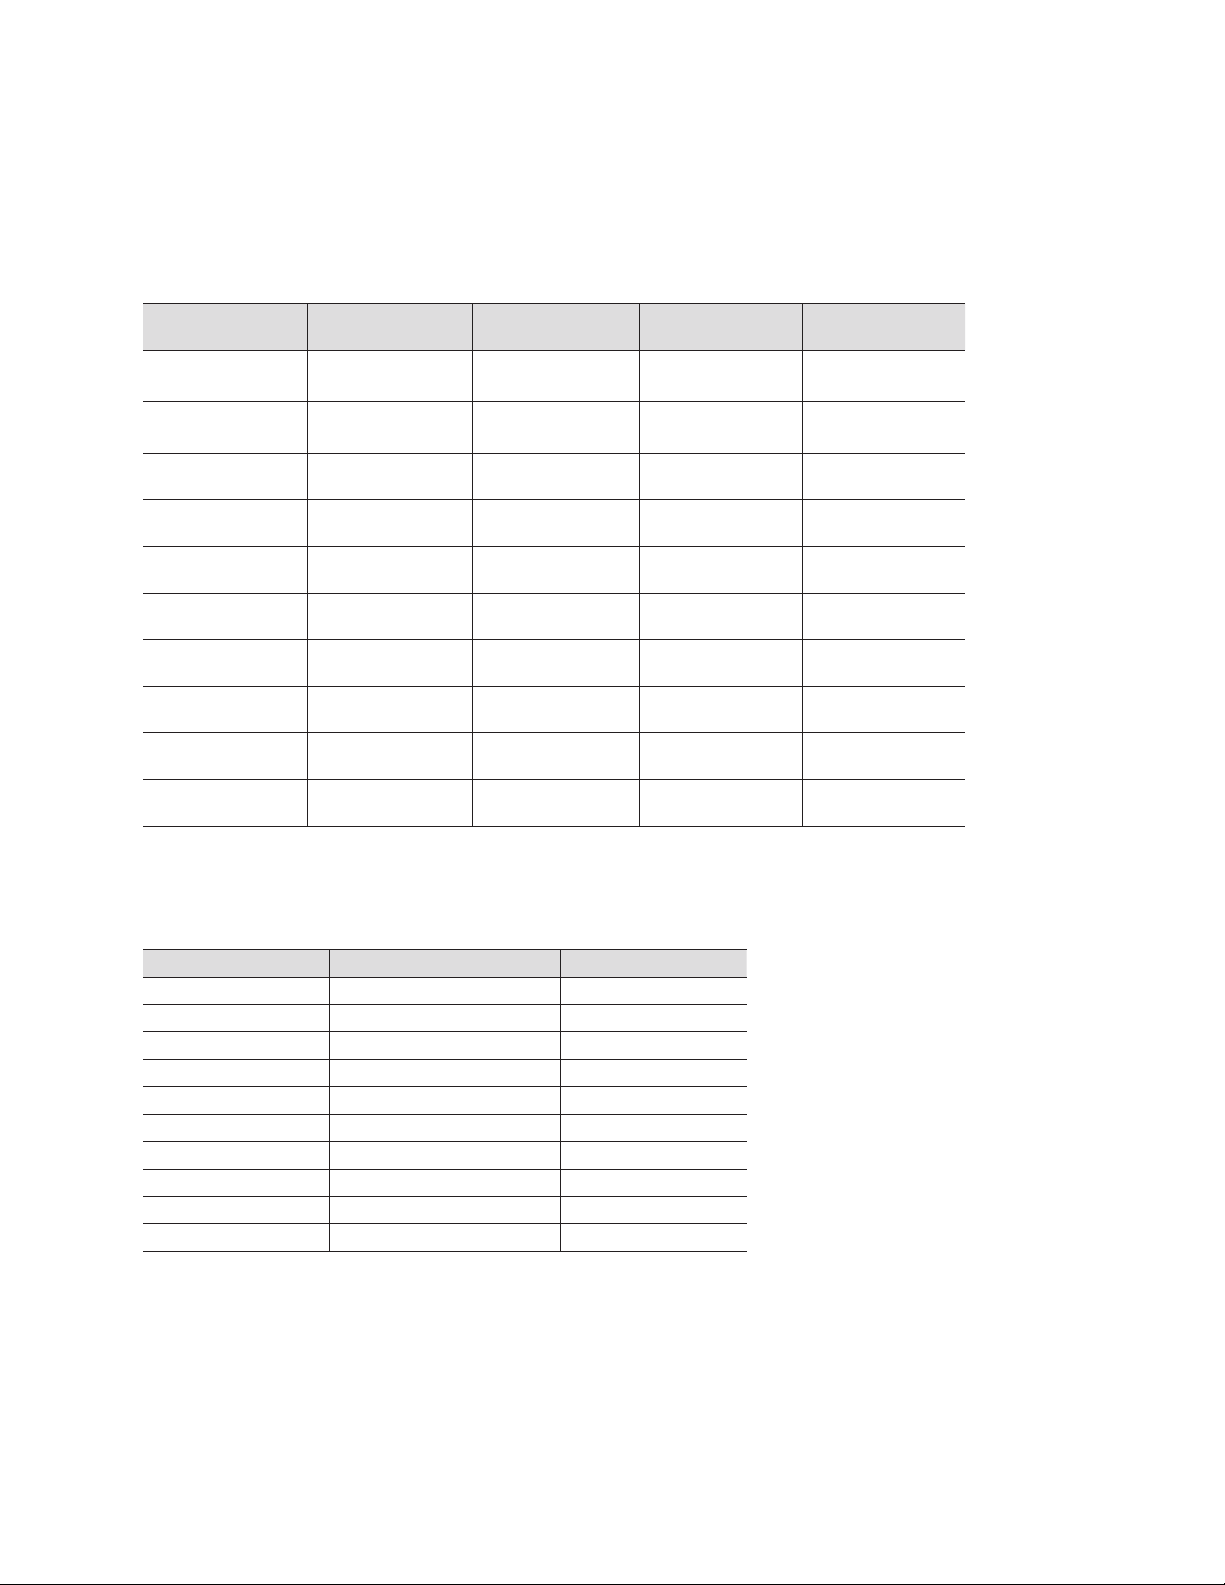
Continuous Electrophoresis Buffers
McLellan describes various continuous buffer systems from pH 3.8 to pH 10.2.3 (McLellan 1982). Use the
table below to prepare 1 liter of 5x continuous nondenatur ing PAGE buffer. DO NOT ad just pH with acid or
base. If the final pH is out side the the listed range dis card the buffer and remake.
Table 16. Nondenaturing PAGE buffer preparation.
Buffer pH ± 0.1
3.8
4.4
4.8
6.1
6.6
7.4
8.1
8.7
9.4
10.2
Basic Component
and MW
Beta-Alanine
89.09 mw
Beta-Alanine
89.09 mw
GABA
103.1 mw
Histidine
155.2 mw
Histidine
155.2 mw
Imidazole
68.08
Tris
121.14 mw
Tris
121.14 mw
Tris
121.14 mw
Ammonia
14.8 M
5x Solution
g/L or ml/L
13.36 g/L
35.64 g/L
41.24 g/L
23.28 g/L
19.4 g/L
14.64 g/L
19.38 g/L
30.29 g/L
36.34 g/L
12.5 ml/mL
Acidic Component
and MW
Lactic Acid
85% soln.
Acetic Acid
17.4 M
Acetic Acid
17.4 M
MES
195.2 mw
MPOS
209.3 mw
HEPES
238.33 mw
EPPS
252.2 mw
Boric Acid
61.83 mw
CAPS
221.3 mw
CAPS
221.3 mw
5x Solutions
ml/L or g/L
7.45 ml/L
11.5 ml/L
5.75 g/L
29.5 g/L
31.4 g/L
41.7 g/L
37.85 g/L
7.73 g/L
44.26 g/L
22.13 g/L
To make 1 L of 1x electrophoresis buffer, dilute 200 ml of 5x buffer with 800 ml deionized water. The final
concentrations of buffer should be as shown in Table 17.
Table 17. Final concentrations.
Buffer pH Basic Component Acidic Component
3.8 30 mM Beta-Alanine 20 mM Lactic Acid
4.4 80 mM Beta-Alanine 40 mM Acetic Acid
4.8 80 mM GABA 20 mM Acetic Acid
6.1 30 mM Histidine 30 mM MES
6.6 25 mM Histidine 30 mM MOPS
7.4 43 mM Imidazole 35 mM HEPES
8.1 32 mM Tris 30 mM EPPS
8.7 50 mM Tris 25 mM Boric Acid
9.4 60 mM Tris 40 mM CAPS
10.2 37 mM Ammonia 20 mM CAPS
40
40
Page 46

Prepare Resolving Gels
As protein mobilities are best modified by pH, continuous nondenaturing PAGE systems use relatively large
pore size gels. Generally 4–6 cm long gels are suffi cient for optimum resolution in the prep cell.
For 10 ml acrylamide monomer solution
Table 18. Acrylamide monomer solution per 10ml of gel volume.
%T Deionized H2O,
ml
4 6.65 2.00 1.33
5 6.30 2.00 1.67
6 5.85 2.00 2.00
*In continuous systems the same buffer is used in the upper and lower elec trode chambers and in the gels.
Prior to pouring a gel, induce acrylamide polymerization by adding the follow ing catalyst solutions. Amounts
are per 10 ml gel volume. To cast a prepara tive gel refer to Sections 3 and 4 in this manual.
Table 19. Catalyst quantity recommendation by type of gel.
Continuous Buffer*,
ml
Catalyst
Acrylamide/bis solution
30% stock (37.5:1), ml
10% APS**
(µl)
Analytical Resolving Gel 5 5
Stacking Gel 50 10
Preparative Resolving Gel 25 2.5
Stacking Gel 50 10
**Note: Below pH 6, TEMED becomes less effective as a catalyst. Between pH 4 and pH 6, increasing the concentration of TEMED
5-fold to 10-fold will poly merize the gel.
TEMED**
(µl)
Sample Preparation
Sample buffer for continuous native-PAGE is a dilution of the electrophore sis buffer. Tracking dyes are
generally not used. The concentration of the sample buffer is generally 1/10 that of the running buffer.
Glycerol is added to the sample buffer to a final concentration of 20%.
Important: Keep the protein sample as concentrated as possible since there are no stacking gels used with
these buffer systems. Bands will be at least as wide as the sam ple that is loaded onto the preparative gel.
Running Conditions for the Model 491 Prep Cell
For continuous buffer systems, run the gels at 5 W constant power (approximately 10 mA and 500 volts).
Cooling the lower buffer and (or) run ning the Model 491 prep cell in the cold room may help to maintain the
biological ac tivity of some proteins. Refer to Section 3.6 in this manual for de tails about cooling the
apparatus.
The elution buffer flow rate for the Model 491 prep cell should be set to 0.75–1.0 ml/min. Native proteins
migrate at individual velocities dependent on the pH of the buffer system used. Therefore, it is difficult to
predict exactly in which frac tions the protein of interest will elute. An enzyme assay or im munoblot can be
used to identify the specific location of the protein in a slab-gel or in the fractions collected from the prep
cell. Analysis by SDS-PAGE can be used to confirm the resolution and purity.
For a complete discussion regarding operating the Model 491 prep cell and details about sample collection
and analysis, refer to Sections 3 and 4.
41
41
Page 47

9.5 References
Allen RC et al. (1984). Gel Electrophoresis and Isoelectric Focusing of Proteins: Selected Techniques. (New York: de
Gruyter).
Andrews AT (1986). Electrophoresis: Theory, Techniques and Biochemical and Clinical Applications (Oxford: Clarendon
Press).
Chrambach A and Jovin T (1983). Selected buffer systems for moving boundary electrophoresis on gels at various pH
values, presented in a simplified manner. Electrophoresis 4, 190–204.
Hames BD (1990). Gel Electrophoresis of Proteins: A Practical Approach. D. Rickwood and BD Hames ed. (New York:
Oxford University Press).
McLellan T (1982). Electrophoresis buffers for polyacrylamide gels at various ph. Anal Biochem 126, 94-99.
Ornstein L (1964). Disc electrophoresis. I. Background and theory. Ann N Y Acad Sci 121, 321-349.
42
42
Page 48

Section 10
Ordering Information
Catalog
Number Product Description
170-2925 Model 491 Prep Cell, without buffer recirculation pump
170-2926 Model 491 Prep Cell, with buffer recirculation pump (100/120VAC)
170-2927 Model 491 Prep Cell, with buffer recirculation pump (220/240VAC)
170-2929 Buffer Recirculation Pump, 120/100 VAC
170-2930 Buffer Recirculation Pump, 220/240 VAC
Replacement Accessories
170-2932 Small Gel Tube Assembly, 28 mm ID
170-2933 Large Gel Tube Assembly, 37 mm ID
170-2934 Cooling Finger Assembly, includes feedline connectors
170-2935 Buffer Circulation Tubing Kit, includes stop cock with tubing and connectors, elu-
tion buffer circulation lines and connectors (3), and electrophoresis/cooling buffer
circulation lines and connec tors (3).
170-2936 O-ring Kit, upper and lower, 2
170-2937 Dialysis Membranes, 5
170-2938 Frit Kit, includes support frit and elution frit
170-2939 Sample Application/Overlay Buffer Kit, includes sample loading guide and syringe
with PTFE tubing.
170-2940 Thumb Screws, 4
170-2941 Elution Manifold Base
170-2942 Lower Buffer Chamber
170-2943 Upper Buffer Chamber
170-2944 Casting Stand
170-2969 Lid and Safety Cable Duplex
Auxiliary Instruments
®
170-2950 Rotofor
170-2951 Rotofor Preparative IEF Cell, 220/240 VAC
165-5056 PowerPac HV Power Supply, 100–120/220–240 V
164-5070 PowerPac Universal Power Supply, 100-120/220–240 V
731-8101 Econo System, complete, with Model 1325 Chart Recorder, 100/120 VAC
731-8100 Econo System, without Chart Recorder, 100/120 VAC
731-8102 Econo System, without Chart Recorder, 220/240 VAC
731-8140 Econo-Pump, Model EP-1, 100/120 VAC
731-8142 Econo-Pump, Model EP-1, 220/240 VAC
731-8160 Econo UV Monitor, Model EM-1, 100/120 VAC
731-8162 Econo UV Monitor, Model EM-1, 220/240 VAC
731-8122 Fraction Collector, Model 2110, 100/120VAC
731-8120 Fraction Collector, Model 2110, 220/240VAC
731-8190 Chart Recorder, Model 1325, 100/120 VAC
731-8192 Chart Recorder, Model 1325, 220/240 VAC
Preparative IEF Cell, 100/120 VAC
43
43
Page 49

Electrophoresis Chemicals
Catalog Quantity/
Number Product Description Package
Premixed Electrophoresis Buffers
161-0732 10x Tris/Glycine/SDS Buffer 1 L
161-0755 10x Tris/Glycine/SDS Buffer 6 x 1 L
Premixed Acrylamide/bis
161-0122 37.5:1 mixture, (2.67% C) 30 g
161-0125 37.5:1 mixture, (2.67% C) 150 g
30% Acrylamide/bis Solutions
161-0158 37.5:1 mixture, (2.67% C) 500 ml
161-0159 37.5:1 mixture, (2.67% C) 2 x 500 ml
161-0100 Acrylamide, 99.9% 100 g
161-0101 Acrylamide, 99.9% 500 g
161-0107 Acrylamide, 99.9% 1 kg
161-0103 Acrylamide, 99.9% 2 kg
161-0122 Preweighed Acrylamide/bis, 37.5:1 mixture 30 g
161-0125 Preweighed Acrylamide/bis, 37.5:1 mixture 150 g
161-0200 Bis (N,N'-Methylene-bis acrylamide) 5 g
161-0201 Bis (N,N'-Methylene-bis acrylamide) 50 g
161-0716 Tris 500 g
161-0719 Tris 1 kg
161-0717 Glycine 250 g
161-0718 Glycine 1 kg
161-0300 SDS (Sodium dodecylsulfate) 25 g
161-0301 SDS (Sodium dodecylsulfate) 100 g
161-0302 SDS (Sodium dodecylsulfate) 1 kg
161-0700 Ammonium Persulfate 10 g
161-0610 Dithiothreitol 1 g
161-0611 Dithiothreitol 5 g
161-0710 2-mercaptoethanol 25 ml
161-0800 TEMED 5 ml
161-0801 TEMED 50 ml
162-0100 Agarose, Standard Low -m
162-0102 Agarose, Standard Low -mr 500 g
161-0363 Precision Plus Protein Unstained Standards, 1 ml
161-0374 Precision Plus Dual Color Standards, 500 ul
161-0310 IEF Standards (pH 4 to 10)
161-0443 Silver Stain Kit, includes 1 bottle oxidizer concentrate,
1 bottle silver reagent concentrate; and 4 bottles
developer enough to stain approximately 24 gels. 1 kit
161-0400 Coomassie Blue R-250 10 g
161-0404 Bromophenol Blue 10 g
161-0407 Triton X-100 500 ml
161-0460 CHAPS 1 g
161-0465 CHAPSO 1 g
161-0730 Urea 250 g
161-0731 Urea 1 kg
142-6424 AG 501-X8 Ion Exchange Resin 1 lb
100 g
r
44
444546
Page 50

Page 51

Page 52

Bio-Rad
Laboratories, Inc.
Life Science
Group
Web site ww w.bio-rad.com USA 800 424 6723 Australia 61 2 9914 2800 Austria 01 877 89 01 Belgium 09 385 55 11 Brazil 5 5 11 3065 7550
Canada 905 364 3435 China 86 21 6169 8500 Czech Republic 420 241 430 532 Denm ark 44 52 10 00 Finland 09 804 22 0 0
France 01 47 95 69 65 Germany 089 31 884 0 Greece 30 210 9532 22 0 Hong Kong 852 278 9 3300 Hungary 36 1 45 9 6100 India 91 124 4029300
Israel 03 963 60 50 Italy 39 02 216 091 Japan 81 3 6361 7000 Korea 82 2 3473 4460 Mexi co 52 555 488 7670 The Netherlands 0318 540666
New Zealand 64 9 415 2280 N orway 23 38 41 30 Poland 48 22 3 31 99 99 Portugal 351 21 472 7700 Russia 7 495 721 14 04
Singapore 65 6415 3188 South Africa 27 861 246 723 Spain 34 91 590 52 00 Swede n 08 555 12700 Switzerland 026 674 55 05
Taiwan 886 2 2578 7189 Thailand 1800 88 22 88 United Kingdom 020 8328 2000
Sig 1213M1702925 Rev D US/EG
 Loading...