

Page 1

ViewCheck on ATCA-9405
Installation and Use
P/N: 6806800S51E
September 2014
Page 2

©
Copyright 2014 Artesyn Embedded Technologies, Inc.
All rights reserved.
Trademarks
Artesyn Embedded Technologies, Artesyn and the Artesyn Embedded Technologies logo are trademarks and service marks of
Artesyn Embedded Technologies, Inc.© 2014 Artesyn Embedded Technologies, Inc. All other product or service names are the
property of their respective owners.
Intel® is a trademark or registered trademark of Intel Corporation or its subsidiaries in the United States and other countries.
Java™ and all other Java-based marks are trademarks or registered trademarks of Oracle America, Inc. in the U.S. and other countries.
Microsoft®, Windows® and Windows Me® are registered trademarks of Microsoft Corporation; and Windows XP™ is a trademark of
Microsoft Corporation.
PICMG®, CompactPCI®, AdvancedTCA™ and the PICMG, CompactPCI and AdvancedTCA logos are registered trademarks of the PCI
Industrial Computer Manufacturers Group.
UNIX® is a registered trademark of The Open Group in the United States and other countries.
Notice
While reasonable efforts have been made to assure the accuracy of this document, Artesyn assumes no liability resulting from any
omissions in this document, or from the use of the information obtained therein. Artesyn reserves the right to revise this document
and to make changes from time to time in the content hereof without obligation of Artesyn to notify any person of such revision or
changes.
Electronic versions of this material may be read online, downloaded for personal use, or referenced in another document as a URL to
an Artesyn website. The text itself may not be published commercially in print or electronic form, edited, translated, or otherwise
altered without the permission of Artesyn.
It is possible that this publication may contain reference to or information about Artesyn products (machines and programs),
programming, or services that are not available in your country. Such references or information must not be construed to mean that
Artesyn intends to announce such Artesyn products, programming, or services in your country.
Limited and Restricted Rights Legend
If the documentation contained herein is supplied, directly or indirectly, to the U.S. Government, the following notice shall apply
unless otherwise agreed to in writing by Artesyn.
Use, duplication, or disclosure by the Government is subject to restrictions as set forth in subparagraph (b)(3) of the Rights in
Technical Data clause at DFARS 252.227-7013 (Nov. 1995) and of the Rights in Noncommercial Computer Software and
Documentation clause at DFARS 252.227-7014 (Jun. 1995).
Contact Address
Artesyn Embedded Technologies Artesyn Embedded Technologies
Marketing Communications
2900 S. Diablo Way, Suite 190
Tempe, Arizona 85282
Lilienthalstr. 17-19
85579 Neubiberg/Munich
Germany
Page 3

Contents
Contents
About this Manual . . . . . . . . . . . . . . . . . . . . . . . . . . . . . . . . . . . . . . . . . . . . . . . . . . . . . . . . . . . . . . . . . . . . . . . . 9
1 Introduction . . . . . . . . . . . . . . . . . . . . . . . . . . . . . . . . . . . . . . . . . . . . . . . . . . . . . . . . . . . . . . . . . . . . . . . . . 13
1.1 Overview . . . . . . . . . . . . . . . . . . . . . . . . . . . . . . . . . . . . . . . . . . . . . . . . . . . . . . . . . . . . . . . . . . . . . . . . . . 13
1.2 ViewCheck Access Methods . . . . . . . . . . . . . . . . . . . . . . . . . . . . . . . . . . . . . . . . . . . . . . . . . . . . . . . . . 13
1.2.1 CLI . . . . . . . . . . . . . . . . . . . . . . . . . . . . . . . . . . . . . . . . . . . . . . . . . . . . . . . . . . . . . . . . . . . . . . . . . 14
1.2.2 XML . . . . . . . . . . . . . . . . . . . . . . . . . . . . . . . . . . . . . . . . . . . . . . . . . . . . . . . . . . . . . . . . . . . . . . . . 14
2 Concepts of ViewCheck . . . . . . . . . . . . . . . . . . . . . . . . . . . . . . . . . . . . . . . . . . . . . . . . . . . . . . . . . . . . . . . 17
2.1 Overview . . . . . . . . . . . . . . . . . . . . . . . . . . . . . . . . . . . . . . . . . . . . . . . . . . . . . . . . . . . . . . . . . . . . . . . . . . 17
2.2 Test Identification . . . . . . . . . . . . . . . . . . . . . . . . . . . . . . . . . . . . . . . . . . . . . . . . . . . . . . . . . . . . . . . . . . 17
2.3 Device Category . . . . . . . . . . . . . . . . . . . . . . . . . . . . . . . . . . . . . . . . . . . . . . . . . . . . . . . . . . . . . . . . . . . . 17
2.4 Test ID . . . . . . . . . . . . . . . . . . . . . . . . . . . . . . . . . . . . . . . . . . . . . . . . . . . . . . . . . . . . . . . . . . . . . . . . . . . . 17
2.5 Device Instance . . . . . . . . . . . . . . . . . . . . . . . . . . . . . . . . . . . . . . . . . . . . . . . . . . . . . . . . . . . . . . . . . . . . 18
2.6 Monitor ID . . . . . . . . . . . . . . . . . . . . . . . . . . . . . . . . . . . . . . . . . . . . . . . . . . . . . . . . . . . . . . . . . . . . . . . . . 18
2.7 Error ID . . . . . . . . . . . . . . . . . . . . . . . . . . . . . . . . . . . . . . . . . . . . . . . . . . . . . . . . . . . . . . . . . . . . . . . . . . . . 19
3 Installation of ViewCheck . . . . . . . . . . . . . . . . . . . . . . . . . . . . . . . . . . . . . . . . . . . . . . . . . . . . . . . . . . . . . 21
3.1 Overview . . . . . . . . . . . . . . . . . . . . . . . . . . . . . . . . . . . . . . . . . . . . . . . . . . . . . . . . . . . . . . . . . . . . . . . . . . 21
3.2 ViewCheck RPM Image . . . . . . . . . . . . . . . . . . . . . . . . . . . . . . . . . . . . . . . . . . . . . . . . . . . . . . . . . . . . . . 21
3.3 BSF Service RPM . . . . . . . . . . . . . . . . . . . . . . . . . . . . . . . . . . . . . . . . . . . . . . . . . . . . . . . . . . . . . . . . . . . . 23
3.4 ViewCheck Service OS Image . . . . . . . . . . . . . . . . . . . . . . . . . . . . . . . . . . . . . . . . . . . . . . . . . . . . . . . . 25
3.5 Access and Execution of a Test Using CLI . . . . . . . . . . . . . . . . . . . . . . . . . . . . . . . . . . . . . . . . . . . . . . 27
3.6 Access and Execution of a Test Using XML . . . . . . . . . . . . . . . . . . . . . . . . . . . . . . . . . . . . . . . . . . . . . 33
3.6.1 Authenticate . . . . . . . . . . . . . . . . . . . . . . . . . . . . . . . . . . . . . . . . . . . . . . . . . . . . . . . . . . . . . . . . 33
3.6.2 Configure . . . . . . . . . . . . . . . . . . . . . . . . . . . . . . . . . . . . . . . . . . . . . . . . . . . . . . . . . . . . . . . . . . . 34
3.6.3 GetClassList . . . . . . . . . . . . . . . . . . . . . . . . . . . . . . . . . . . . . . . . . . . . . . . . . . . . . . . . . . . . . . . . . 35
3.6.4 DescribeClass. . . . . . . . . . . . . . . . . . . . . . . . . . . . . . . . . . . . . . . . . . . . . . . . . . . . . . . . . . . . . . . . 36
3.6.5 InvokeMethod . . . . . . . . . . . . . . . . . . . . . . . . . . . . . . . . . . . . . . . . . . . . . . . . . . . . . . . . . . . . . . . 41
3.7 ViewCheck Service LOG Information . . . . . . . . . . . . . . . . . . . . . . . . . . . . . . . . . . . . . . . . . . . . . . . . . . 43
3.8 ViewCheck TestLog Information . . . . . . . . . . . . . . . . . . . . . . . . . . . . . . . . . . . . . . . . . . . . . . . . . . . . . . 43
ViewCheck on ATCA-9405 Installation and Use (6806800S51E)
3
Page 4

Contents
Contents
Contents
4 Commands Execution. . . . . . . . . . . . . . . . . . . . . . . . . . . . . . . . . . . . . . . . . . . . . . . . . . . . . . . . . . . . . . . . . 45
4.1 Overview . . . . . . . . . . . . . . . . . . . . . . . . . . . . . . . . . . . . . . . . . . . . . . . . . . . . . . . . . . . . . . . . . . . . . . . . . . 45
4.2 Generic Commands . . . . . . . . . . . . . . . . . . . . . . . . . . . . . . . . . . . . . . . . . . . . . . . . . . . . . . . . . . . . . . . . . 45
4.2.1 configure-error-strings . . . . . . . . . . . . . . . . . . . . . . . . . . . . . . . . . . . . . . . . . . . . . . . . . . . . . . . 45
4.2.2 configure-log-path . . . . . . . . . . . . . . . . . . . . . . . . . . . . . . . . . . . . . . . . . . . . . . . . . . . . . . . . . . . 46
4.2.3 device-category. . . . . . . . . . . . . . . . . . . . . . . . . . . . . . . . . . . . . . . . . . . . . . . . . . . . . . . . . . . . . . 47
4.2.4 diag-service . . . . . . . . . . . . . . . . . . . . . . . . . . . . . . . . . . . . . . . . . . . . . . . . . . . . . . . . . . . . . . . . . 47
4.2.5 hw-inventory-list. . . . . . . . . . . . . . . . . . . . . . . . . . . . . . . . . . . . . . . . . . . . . . . . . . . . . . . . . . . . . 48
4.2.6 list-all-tests. . . . . . . . . . . . . . . . . . . . . . . . . . . . . . . . . . . . . . . . . . . . . . . . . . . . . . . . . . . . . . . . . . 49
4.2.7 list-device-instances. . . . . . . . . . . . . . . . . . . . . . . . . . . . . . . . . . . . . . . . . . . . . . . . . . . . . . . . . . 49
4.2.8 purge-all-log . . . . . . . . . . . . . . . . . . . . . . . . . . . . . . . . . . . . . . . . . . . . . . . . . . . . . . . . . . . . . . . . 50
4.2.9 purge-log . . . . . . . . . . . . . . . . . . . . . . . . . . . . . . . . . . . . . . . . . . . . . . . . . . . . . . . . . . . . . . . . . . . 50
4.2.10 set-log-level . . . . . . . . . . . . . . . . . . . . . . . . . . . . . . . . . . . . . . . . . . . . . . . . . . . . . . . . . . . . . . . . . 52
4.2.11 show-all-monitors. . . . . . . . . . . . . . . . . . . . . . . . . . . . . . . . . . . . . . . . . . . . . . . . . . . . . . . . . . . . 53
4.2.12 show-all-test-status . . . . . . . . . . . . . . . . . . . . . . . . . . . . . . . . . . . . . . . . . . . . . . . . . . . . . . . . . . 53
4.2.13 show-diag-scan-result . . . . . . . . . . . . . . . . . . . . . . . . . . . . . . . . . . . . . . . . . . . . . . . . . . . . . . . . 54
4.2.14 show-log-content . . . . . . . . . . . . . . . . . . . . . . . . . . . . . . . . . . . . . . . . . . . . . . . . . . . . . . . . . . . . 54
4.2.15 show-log-info. . . . . . . . . . . . . . . . . . . . . . . . . . . . . . . . . . . . . . . . . . . . . . . . . . . . . . . . . . . . . . . . 55
4.2.16 show-log-level . . . . . . . . . . . . . . . . . . . . . . . . . . . . . . . . . . . . . . . . . . . . . . . . . . . . . . . . . . . . . . . 56
4.2.17 show-running-mode. . . . . . . . . . . . . . . . . . . . . . . . . . . . . . . . . . . . . . . . . . . . . . . . . . . . . . . . . . 56
4.2.18 show-systemerror-log . . . . . . . . . . . . . . . . . . . . . . . . . . . . . . . . . . . . . . . . . . . . . . . . . . . . . . . . 57
4.2.19 start-all-monitors . . . . . . . . . . . . . . . . . . . . . . . . . . . . . . . . . . . . . . . . . . . . . . . . . . . . . . . . . . . . 57
4.2.20 start-diag-scan. . . . . . . . . . . . . . . . . . . . . . . . . . . . . . . . . . . . . . . . . . . . . . . . . . . . . . . . . . . . . . . 58
4.2.21 stop-all-monitors . . . . . . . . . . . . . . . . . . . . . . . . . . . . . . . . . . . . . . . . . . . . . . . . . . . . . . . . . . . . 59
4.2.22 stop-diag-scan. . . . . . . . . . . . . . . . . . . . . . . . . . . . . . . . . . . . . . . . . . . . . . . . . . . . . . . . . . . . . . . 60
4.2.23 switch-mode . . . . . . . . . . . . . . . . . . . . . . . . . . . . . . . . . . . . . . . . . . . . . . . . . . . . . . . . . . . . . . . . 60
4.2.24 version. . . . . . . . . . . . . . . . . . . . . . . . . . . . . . . . . . . . . . . . . . . . . . . . . . . . . . . . . . . . . . . . . . . . . . 62
4.3 Test Management and Control Commands . . . . . . . . . . . . . . . . . . . . . . . . . . . . . . . . . . . . . . . . . . . . 63
4.3.1 start-test. . . . . . . . . . . . . . . . . . . . . . . . . . . . . . . . . . . . . . . . . . . . . . . . . . . . . . . . . . . . . . . . . . . . 63
4.3.2 show-test-help . . . . . . . . . . . . . . . . . . . . . . . . . . . . . . . . . . . . . . . . . . . . . . . . . . . . . . . . . . . . . . 64
4.3.3 list-tests . . . . . . . . . . . . . . . . . . . . . . . . . . . . . . . . . . . . . . . . . . . . . . . . . . . . . . . . . . . . . . . . . . . . 65
4.3.4 show-test-status . . . . . . . . . . . . . . . . . . . . . . . . . . . . . . . . . . . . . . . . . . . . . . . . . . . . . . . . . . . . . 65
4.3.5 show-test-result . . . . . . . . . . . . . . . . . . . . . . . . . . . . . . . . . . . . . . . . . . . . . . . . . . . . . . . . . . . . . 66
4.3.6 stop-test . . . . . . . . . . . . . . . . . . . . . . . . . . . . . . . . . . . . . . . . . . . . . . . . . . . . . . . . . . . . . . . . . . . . 67
4.4 Monitoring Commands . . . . . . . . . . . . . . . . . . . . . . . . . . . . . . . . . . . . . . . . . . . . . . . . . . . . . . . . . . . . . 69
4
ViewCheck on ATCA-9405 Installation and Use (6806800S51E)
Page 5

Contents
4.4.1 show-monitor-id . . . . . . . . . . . . . . . . . . . . . . . . . . . . . . . . . . . . . . . . . . . . . . . . . . . . . . . . . . . . . 69
4.4.2 show-poll-interval. . . . . . . . . . . . . . . . . . . . . . . . . . . . . . . . . . . . . . . . . . . . . . . . . . . . . . . . . . . . 70
4.4.3 start-monitor . . . . . . . . . . . . . . . . . . . . . . . . . . . . . . . . . . . . . . . . . . . . . . . . . . . . . . . . . . . . . . . . 71
4.4.4 set-poll-interval . . . . . . . . . . . . . . . . . . . . . . . . . . . . . . . . . . . . . . . . . . . . . . . . . . . . . . . . . . . . . . 72
4.4.5 set-poll-interval-default. . . . . . . . . . . . . . . . . . . . . . . . . . . . . . . . . . . . . . . . . . . . . . . . . . . . . . . 73
4.4.6 stop-monitor . . . . . . . . . . . . . . . . . . . . . . . . . . . . . . . . . . . . . . . . . . . . . . . . . . . . . . . . . . . . . . . . 74
4.4.7 set-rate . . . . . . . . . . . . . . . . . . . . . . . . . . . . . . . . . . . . . . . . . . . . . . . . . . . . . . . . . . . . . . . . . . . . . 75
4.4.8 show-rate . . . . . . . . . . . . . . . . . . . . . . . . . . . . . . . . . . . . . . . . . . . . . . . . . . . . . . . . . . . . . . . . . . . 76
4.4.9 show-networkcounter-log . . . . . . . . . . . . . . . . . . . . . . . . . . . . . . . . . . . . . . . . . . . . . . . . . . . . 77
4.4.10 show-networkerror-log . . . . . . . . . . . . . . . . . . . . . . . . . . . . . . . . . . . . . . . . . . . . . . . . . . . . . . . 78
4.4.11 exit. . . . . . . . . . . . . . . . . . . . . . . . . . . . . . . . . . . . . . . . . . . . . . . . . . . . . . . . . . . . . . . . . . . . . . . . . 78
4.5 InService Monitoring Specifics . . . . . . . . . . . . . . . . . . . . . . . . . . . . . . . . . . . . . . . . . . . . . . . . . . . . . . . 78
4.5.1 Monitoring HW Device Status . . . . . . . . . . . . . . . . . . . . . . . . . . . . . . . . . . . . . . . . . . . . . . . . . 79
4.5.2 Monitoring Device Critical Errors . . . . . . . . . . . . . . . . . . . . . . . . . . . . . . . . . . . . . . . . . . . . . . . 80
4.6 OOSD Tests . . . . . . . . . . . . . . . . . . . . . . . . . . . . . . . . . . . . . . . . . . . . . . . . . . . . . . . . . . . . . . . . . . . . . . . . 80
4.6.1 CPU . . . . . . . . . . . . . . . . . . . . . . . . . . . . . . . . . . . . . . . . . . . . . . . . . . . . . . . . . . . . . . . . . . . . . . . . 81
4.6.2 HDD. . . . . . . . . . . . . . . . . . . . . . . . . . . . . . . . . . . . . . . . . . . . . . . . . . . . . . . . . . . . . . . . . . . . . . . . 82
4.6.3 Memory . . . . . . . . . . . . . . . . . . . . . . . . . . . . . . . . . . . . . . . . . . . . . . . . . . . . . . . . . . . . . . . . . . . . 82
4.6.4 OS . . . . . . . . . . . . . . . . . . . . . . . . . . . . . . . . . . . . . . . . . . . . . . . . . . . . . . . . . . . . . . . . . . . . . . . . . 82
4.6.5 PCI . . . . . . . . . . . . . . . . . . . . . . . . . . . . . . . . . . . . . . . . . . . . . . . . . . . . . . . . . . . . . . . . . . . . . . . . . 83
4.6.6 IPMC . . . . . . . . . . . . . . . . . . . . . . . . . . . . . . . . . . . . . . . . . . . . . . . . . . . . . . . . . . . . . . . . . . . . . . . 83
4.6.7 NETWORK. . . . . . . . . . . . . . . . . . . . . . . . . . . . . . . . . . . . . . . . . . . . . . . . . . . . . . . . . . . . . . . . . . . 83
4.6.8 FPGA . . . . . . . . . . . . . . . . . . . . . . . . . . . . . . . . . . . . . . . . . . . . . . . . . . . . . . . . . . . . . . . . . . . . . . . 84
4.6.9 I2C . . . . . . . . . . . . . . . . . . . . . . . . . . . . . . . . . . . . . . . . . . . . . . . . . . . . . . . . . . . . . . . . . . . . . . . . . 85
4.6.10 USB . . . . . . . . . . . . . . . . . . . . . . . . . . . . . . . . . . . . . . . . . . . . . . . . . . . . . . . . . . . . . . . . . . . . . . . . 85
4.6.11 RTC . . . . . . . . . . . . . . . . . . . . . . . . . . . . . . . . . . . . . . . . . . . . . . . . . . . . . . . . . . . . . . . . . . . . . . . . 85
A Related Documentation . . . . . . . . . . . . . . . . . . . . . . . . . . . . . . . . . . . . . . . . . . . . . . . . . . . . . . . . . . . . . . . 87
A.1 Artesyn Embedded Technologies - Embedded Computing Documentation . . . . . . . . . . . . . . . . 87
ViewCheck on ATCA-9405 Installation and Use (6806800S51E)
5
Page 6

Contents
Contents
Contents
6
ViewCheck on ATCA-9405 Installation and Use (6806800S51E)
Page 7

List of Tables
Table 3-1 RPM Files . . . . . . . . . . . . . . . . . . . . . . . . . . . . . . . . . . . . . . . . . . . . . . . . . . . . . . . . . . . . . . . . . . . . . 22
Table 3-2 ViewCheck Service OS Image Files on SP and PP . . . . . . . . . . . . . . . . . . . . . . . . . . . . . . . . . . . . 25
Table 4-1 configure-error-strings . . . . . . . . . . . . . . . . . . . . . . . . . . . . . . . . . . . . . . . . . . . . . . . . . . . . . . . . . 45
Table 4-2 configure-log-path . . . . . . . . . . . . . . . . . . . . . . . . . . . . . . . . . . . . . . . . . . . . . . . . . . . . . . . . . . . . . 46
Table 4-3 diag-service . . . . . . . . . . . . . . . . . . . . . . . . . . . . . . . . . . . . . . . . . . . . . . . . . . . . . . . . . . . . . . . . . . . 48
Table 4-4 purge-log . . . . . . . . . . . . . . . . . . . . . . . . . . . . . . . . . . . . . . . . . . . . . . . . . . . . . . . . . . . . . . . . . . . . . 51
Table 4-5 set-log-level Values . . . . . . . . . . . . . . . . . . . . . . . . . . . . . . . . . . . . . . . . . . . . . . . . . . . . . . . . . . . . . 52
Table 4-6 set-log-level Arguments . . . . . . . . . . . . . . . . . . . . . . . . . . . . . . . . . . . . . . . . . . . . . . . . . . . . . . . . 52
Table 4-7 show-log-content . . . . . . . . . . . . . . . . . . . . . . . . . . . . . . . . . . . . . . . . . . . . . . . . . . . . . . . . . . . . . . 55
Table 4-8 start-all-monitors . . . . . . . . . . . . . . . . . . . . . . . . . . . . . . . . . . . . . . . . . . . . . . . . . . . . . . . . . . . . . . 57
Table 4-9 start-diag-scan . . . . . . . . . . . . . . . . . . . . . . . . . . . . . . . . . . . . . . . . . . . . . . . . . . . . . . . . . . . . . . . . 58
Table 4-10 stop-all-monitors . . . . . . . . . . . . . . . . . . . . . . . . . . . . . . . . . . . . . . . . . . . . . . . . . . . . . . . . . . . . . . 59
Table 4-11 switch-mode Arguments . . . . . . . . . . . . . . . . . . . . . . . . . . . . . . . . . . . . . . . . . . . . . . . . . . . . . . . . 61
Table 4-12 start-test . . . . . . . . . . . . . . . . . . . . . . . . . . . . . . . . . . . . . . . . . . . . . . . . . . . . . . . . . . . . . . . . . . . . . . 64
Table 4-13 show-test-help . . . . . . . . . . . . . . . . . . . . . . . . . . . . . . . . . . . . . . . . . . . . . . . . . . . . . . . . . . . . . . . . 65
Table 4-14 show-test-status . . . . . . . . . . . . . . . . . . . . . . . . . . . . . . . . . . . . . . . . . . . . . . . . . . . . . . . . . . . . . . . 66
Table 4-15 show-test-result . . . . . . . . . . . . . . . . . . . . . . . . . . . . . . . . . . . . . . . . . . . . . . . . . . . . . . . . . . . . . . . 67
Table 4-16 stop-test . . . . . . . . . . . . . . . . . . . . . . . . . . . . . . . . . . . . . . . . . . . . . . . . . . . . . . . . . . . . . . . . . . . . . . 68
Table 4-17 show-poll-interval . . . . . . . . . . . . . . . . . . . . . . . . . . . . . . . . . . . . . . . . . . . . . . . . . . . . . . . . . . . . . . 70
Table 4-18 start-monitor . . . . . . . . . . . . . . . . . . . . . . . . . . . . . . . . . . . . . . . . . . . . . . . . . . . . . . . . . . . . . . . . . . 71
Table 4-19 set-poll-interval . . . . . . . . . . . . . . . . . . . . . . . . . . . . . . . . . . . . . . . . . . . . . . . . . . . . . . . . . . . . . . . . 72
Table 4-20 set-poll-interval-default . . . . . . . . . . . . . . . . . . . . . . . . . . . . . . . . . . . . . . . . . . . . . . . . . . . . . . . . . 74
Table 4-21 stop-monitor . . . . . . . . . . . . . . . . . . . . . . . . . . . . . . . . . . . . . . . . . . . . . . . . . . . . . . . . . . . . . . . . . . 75
Table 4-22 set-rate . . . . . . . . . . . . . . . . . . . . . . . . . . . . . . . . . . . . . . . . . . . . . . . . . . . . . . . . . . . . . . . . . . . . . . . 76
Table 4-23 show-rate . . . . . . . . . . . . . . . . . . . . . . . . . . . . . . . . . . . . . . . . . . . . . . . . . . . . . . . . . . . . . . . . . . . . . 77
Table 4-24 Monitors . . . . . . . . . . . . . . . . . . . . . . . . . . . . . . . . . . . . . . . . . . . . . . . . . . . . . . . . . . . . . . . . . . . . . . 79
Table A-1 Artesyn Embedded Technologies - Embedded Computing Publications . . . . . . . . . . . . . . . 87
ViewCheck on ATCA-9405 Installation and Use (6806800S51E)
7
Page 8

List of Tables
8
ViewCheck on ATCA-9405 Installation and Use (6806800S51E)
Page 9

About this Manual
Overview of Contents
This guide provides detailed information about installation, configuration, and how to work
with ViewCheck. The following table gives the list of chapters described in this document.
Chapter Description
About this Manual Lists all conventions and abbreviations used in this manual and
Introduction Provides detailed overview and features of ViewCheck.
Concepts of ViewCheck Describes the concepts of ViewCheck.
Installation of ViewCheck Provides instructions to install ViewCheck.
Commands Execution Describes about the various tests that can be executed in
outlines the revision history.
ViewCheck.
Appendix A, Related
Documentation
Abbreviations
The following tables lists the abbreviations used throughout the document.
Abbreviation Definition
ATCA Advanced Telecom Computing Architecture
BSF Blade Services Framework. A derivative of System Services
CLI Command Line Interface
Client The applications used to Access ViewCheck via the various
HW Hardware
INSM In Service Monitoring. Functional module in ViewCheck
Lists the relevant manuals and provides additional information.
Framework.
Interfaces (CLI and XML)
framework handling the monitoring functionality of
various critical parameters in the blade.
ViewCheck on ATCA-9405 Installation and Use (6806800S51E)
9
Page 10

About this Manual
Abbreviation Definition
OOSD Online Out of service Diagnostics. Functional module in
PP Packet Processor
SP Service Processor
XML Extensible Markup Language
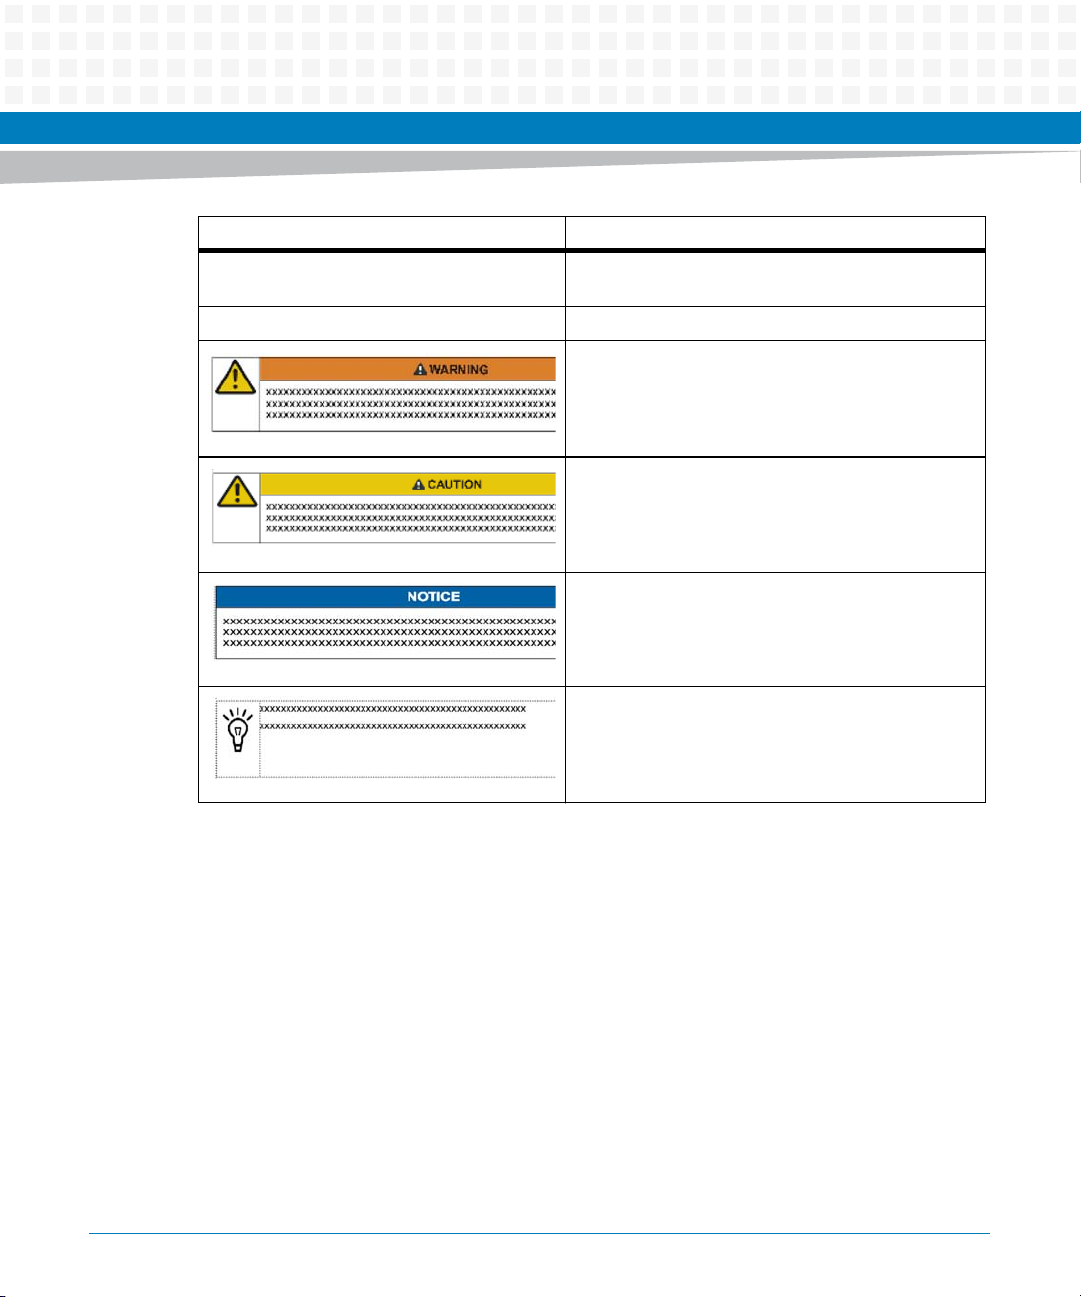
Conventions
The following table describes the conventions used throughout this manual.
Notation Description
0x00000000 Typical notation for hexadecimal numbers (digits are
About this Manual
ViewCheck framework that manages Test Management
requests related to Out of Service Diagnostics.
0 through F), for example used for addresses and
offsets
10
0b0000 Same for binary numbers (digits are 0 and 1)
bold Used to emphasize a word
Screen Used for on-screen output and code related elements
or commands in body text
Courier + Bold Used to characterize user input and to separate it
from system output
Reference Used for references and for table and figure
descriptions
File > Exit Notation for selecting a submenu
<text> Notation for variables and keys
[text] Notation for software buttons to click on the screen
and parameter description
... Repeated item for example node 1, node 2, ..., node
12
.
.
.
ViewCheck on ATCA-9405 Installation and Use (6806800S51E)
Omission of information from example/command
that is not necessary at the time being
Page 11
About this Manual
Notation Description
.. Ranges, for example: 0..4 means one of the integers
0,1,2,3, and 4 (used in registers)
| Logical OR
Indicates a hazardous situation which, if not avoided,
could result in death or serious injury
Indicates a hazardous situation which, if not avoided,
may result in minor or moderate injury
Indicates a property damage message
ViewCheck on ATCA-9405 Installation and Use (6806800S51E)
No danger encountered. Pay attention to important
information
11
Page 12

About this Manual
Summary of Changes
Part Number Date Description
6806800S51A October, 2013 Initial version.
About this Manual
6806800S51B
6806800S51C May, 2014 R2.6 Release
6806800S51D May, 2014 Added notice in sections Orion License RPM
6806800S51E September, 2014 Added show-all-test-status on page 53,show-
March, 2014 Updated the sections Overview on page 21,
ViewCheck RPM Image on page 21 and BSF
Service RPM on page 23.
Added new commands in Generic
Commands on page 45, a test in Memory on
page 82 and section FPGA on page 84.
Updated ViewCheck Service OS Image on
page 25 and OOSD Tests on page 80.
Re-branded to Artesyn template.
Installation, Overview, ViewCheck RPM Image,
and BSF Service RPM.
log-level on page 56, switch-mode on page
60, ViewCheck TestLog Information on page
43, and SfpDetectionTest command.
12
ViewCheck on ATCA-9405 Installation and Use (6806800S51E)
Page 13

Introduction
1.1 Overview
ViewCheck is a comprehensive software service that can be used to diagnose, manage, and
monitor Artesyn ATCA blades. The diagnostic utilities of ViewCheck help in identifying,
detecting, and locating hardware issues on a blade. ViewCheck also provides mechanism to
monitor status of Storage devices, Ethernet counters and errors.
ViewCheck can be accessed locally using Command Line Interface (CLI) and Extensible Markup
Language (XML) interfaces provided via Blade Services Framework (BSF) service.
ViewCheck can provide both:
InService Diagnostics
In this mode, the diagnostics service can run while the blades are instantiated with
customer applications and providing service.
ViewCheck can monitor key hardware parameters like Network Counters, and Network
errors. In addition, watching for kernel critical errors logged by various hardware devices
and device drivers.
Chapter 1
Out of Service Diagnostics
In this mode, a service OS is provided with various Out of Service Diagnostics tests and
utilities. This Service OS has to be loaded and diagnostics utilities can be executed. To
execute these tests, CLI /XML access is provided.
Both InService and Out of Service are provided as binary images. For more information on
Binary images and installation procedures, refer Installation of ViewCheck on page 21.
For more information on commands supported for InService and OOS, refer Commands
Execution on page 45.
ViewCheck on ATCA-9405 is supported on P2020 service processor (SP) and two Cavium
OCTEON II packet processors (PP). Procedure to install and accessing ViewCheck on SP and PP
are different and is detailed in Installation of ViewCheck on page 21.
1.2 ViewCheck Access Methods
This section explains the different methods to access ViewCheck services on the Artesyn ATCA
blades.
ViewCheck on ATCA-9405 Installation and Use (6806800S51E)
13
Page 14

Introduction
You can access ViewCheck using the following interfaces:
CLI
XML
Using these interfaces, you can
Initiate a diagnostic test
Query available diagnostic tests
Query status of a particular diagnostic test
Start and stop monitoring
Stop a diagnostic test
Generate Hardware inventory.
1.2.1 CLI
CLI is one of the interfaces provided to access the ViewCheck capabilities on the blade. Using
CLI, you can start, stop, and query kind of primitives at this prompt. The ViewCheck CLI can be
accessed via a console using SSH.
BSF, a proprietary service of Artesyn, is used to provide the CLI access to ViewCheck service.
BSF binaries are provided along with the ViewCheck binaries.
For more information on BSF RPMs and Installation procedures, refer Installation of ViewCheck
on page 21.
1.2.2 XML
XML is also one of the primary interfaces to access ViewCheck capabilities on the blade. XML
interface supports methods, classes, and event notification mechanism. Using XML, you can
start, stop, query, and configure the parameters related to tests and monitors. XML interface
can be accessed in the same manner as CLI and is provided by BSF.
14
ViewCheck on ATCA-9405 Installation and Use (6806800S51E)
Page 15

Introduction
In addition, XML notifications are generated with following details:
State changes about the diagnostic test under execution
Pre-determined monitor exceeding set Threshold value
Occurrence of any pre-determined hardware device error/warning generated by the
device driver (or) the kernel on the blade.
ViewCheck on ATCA-9405 Installation and Use (6806800S51E)
15
Page 16

Introduction
16
ViewCheck on ATCA-9405 Installation and Use (6806800S51E)
Page 17

Concepts of ViewCheck
2.1 Overview
Terminology and keywords used extensively in ViewCheck services and available via the
commands are explained briefly here.
2.2 Test Identification
Unique Test identification is based on following triple key:
< Device Category, Test ID, Device Instance >
2.3 Device Category
The Device Category is an enumerated value, reused from similar enumeration already defined
in HPI-B Standard specification.
Chapter 2
Expresses commonly known device categories like Storage, Network, Serial, CPU, Memory,
and so on, which are available on all blades irrespective of function and architecture. This
category is used in commands as one of the key fields to identify uniquely a particular test.
Device Category allows for:
Grouping of test cases per category for display and statistical purposes
Allows reuse of Test IDs across device categories
2.4 Test ID
Test ID is an integer value that uniquely identifies the actual test that could be invoked or
executed on a Hardware Device Instance, which belongs to a specific device category available
on the blade.
Following are the examples of tests that can be executed on the devices:
Ping Flood test
Network connectivity test in case of Network Device Category
Each of these tests would be associated with a unique Test Identifier (Test ID).
ViewCheck on ATCA-9405 Installation and Use (6806800S51E)
17
Page 18

Concepts of ViewCheck
These Test IDs start with value of ’0’ and would increase linearly for various sub-tests in a device
category.
Some tests may be applicable to all device instances in a particular device category. The
combination of <Device category, Test ID, Device Instance> would be unique
and shall provide capability to control, execute, and manage the test on a device instance in a
device category. With this mechanism, same test can be simultaneously started or triggered
on multiple device instances under that device category, thus providing parallel execution of
tests.
2.5 Device Instance
Hardware devices uniquely identified and recognized by the drivers and OS on the blade are
treated as device instances. A device instance can belong to a particular device category. Tests
can be invoked and executed on this device instance. OS and Driver support to access the
device is assumed to be readily available.
For example, device instances eth0, eth1, or eth2 are used to identify unique devices in
networking devices category. Device instances use the standard nomenclature already
defined by the OS (for instance Linux) on the blade.
A diagnostic test identified by triple < Device Category, Test ID, device
Instance> would be invoked (or) executed on the unique device instance.
The Enumerations mentioned below are used extensively in the context of InService
Monitoring.
2.6 Monitor ID
ViewCheck service monitors pre-identified parameters for hardware devices. These
parameters are Network Device counters, Network Device errors and so on. To periodically poll
and check these parameters, the ViewCheck service uses CLI and XML configuration. For each
parameter of interest, a Monitor ID is an enumerated constant that uniquely represents the
Monitoring entity. This value shall be used by the ViewCheck to control monitoring and also
while reporting events via XML on these monitors.
18
ViewCheck on ATCA-9405 Installation and Use (6806800S51E)
Page 19

2.7 Error ID
This is an attempt to provide identification to list the pre-determined hardware device
errors/warnings generated by the device driver (or) the kernel on the blade. These critical and
error messages are an indication of abnormal behavior on part of the kernel or the hardware
device on the blade. ViewCheck functionality attempts to detect all such errors and would
provide suitable information to external high-level software intelligence to act upon.
The list of messages that constitute these errors is not standardized by the hardware device
Vendor (nor) the Linux Kernel Community. Error ID attempts to standardize all such messages
on Artesyn supported blades. These messages would be OS and driver specific. Mostly, the
same ERROR ID would be associated with the same category of error, across blades and OSs.
For more information on commands, refer to Commands Execution on page 45.
Concepts of ViewCheck
ViewCheck on ATCA-9405 Installation and Use (6806800S51E)
19
Page 20

Concepts of ViewCheck
20
ViewCheck on ATCA-9405 Installation and Use (6806800S51E)
Page 21

Installation of ViewCheck
3.1 Overview
This section explains the ViewCheck release modules and installation procedures to install and
run ViewCheck service on the Artesyn ATCA blade.
ViewCheck service is released as a set of two distinct images.
ViewCheck RPM Image
This RPM contains all ViewCheck services. BSF service RPMs are also distributed along with
the ViewCheck RPMs. BSF service RPMs provide access to CLI and XML.
If user wants to move to a newly available ViewCheck and BSF RPMs, the current set of RPMs
should be uninstalled before installing the new RPMs. For more information, see ViewCheck
RPM Image and BSF Service RPM.
Chapter 3
ViewCheck Service OS image
You can download this image from SWORDS. This also contains the ViewCheck OOS image
for PPs.
3.2 ViewCheck RPM Image
The ViewCheck RPM Image functionally comprises Diagnostics Framework, specific test cases,
and test suites. The ViewCheck RPM always uses same OS variant and compile time
environment based on the BBS release of the target blade. For ATCA-9405 Service Processor
(SP) blade, the ViewCheck RPM is created for PNE 4.1 environment.
This ViewCheck Service RPM contains:
Diagnostics Core - Daemon
Static Test Suite Configuration files for the Specific Blade
Start/Stop Scripts for Diagnostics Core
ViewCheck on ATCA-9405 Installation and Use (6806800S51E)
21
Page 22
Installation of ViewCheck
Using the following command, you can install the ViewCheck RPM Image:
rpm -iv --nodeps diagnostics<RELEASE>_<BUILD>.<DIST>.<OS>.9405sp.rpm
After installing the ViewCheck RPM, ViewCheck service should be started explicitly using
command, /opt/diagnostics/etc/init.d/diagcore start.
Using the following command, you can remove the ViewCheck RPM Image:
rpm -e diagnostics-<RELEASE>_<BUILD>.<DIST>.<OS>.9405sp.rpm
You need to stop the Diagnostics Core service, before performing un-installation using the
/opt/diagnostics/etc/init.d/diagcore stop script.
The following table provides details of the files that are created on the blade once the
ViewCheck RPM is installed.
Table 3-1 RPM Files
File Name Path Descriptions
diagcored /opt/diagnostics/bin/ ViewCheck Core - Daemon
diagconfig.xml
diaguserconf.xml
diagcore /opt/diagnostics/etc/init.d/ Script to Start/Stop ViewCheck Core
libdiagintf.so on 9405_SP: /lib/
<TestScripts>.sh /opt/diagnostics/tools/diagt
EmrDiag_Debug.log /opt/diagnostics/var/log/dia
22
/opt/diagnostics/etc/diag/ ViewCheck configuration file and user
configuration file.
Interface library between ViewCheck
on 9405_PP: /lib/ and /lib64/
estscripts/
g/service/
ViewCheck on ATCA-9405 Installation and Use (6806800S51E)
core daemon and BSF application.
Tes t scripts
ViewCheck daemon service log
Page 23

Table 3-1 RPM Files (continued)
File Name Path Descriptions
diagLib_log,
diagCore_log,
diagResults_log,
diagTestRaw_log,
diagShowCmds_log
/etc/logrotate.d Configuration files required for log
rotation of service logs
Installation of ViewCheck
Testutilities /opt/diagnostics/tools/diagt
estutils/
3.3 BSF Service RPM
BSF service is distributed as a package contains 3 RPMs namely eMIND, BSFCore, and
Diagnostics Transport layer service. Following are the list of RPM:
ssf_main_rel-<BLADE>-<DIST>-<RELEASEBUILD>.<ARCH>.rpm
ssf_csim_rel-<BLADE>-<DIST>-<RELEASEBUILD>.<ARCH>.rpm
ssf_diagnosticsTLS_rel-<BLADE>-<DIST>-<RELEASEBUILD>.<ARCH>.rpm
You should install BSF RPMs in the following sequence:
1. ssf_main
2. ssf_csim
3. ssf_diagnosticsTLS
Utilities and Tools used by ViewCheck
application
ViewCheck on ATCA-9405 Installation and Use (6806800S51E)
23
Page 24
Installation of ViewCheck
You can install the BSF using the following RPM commands:
rpm -iv --nodeps --force ssf_main_rel-<BLADE>-<DIST>-
<RELEASEBUILD>.<ARCH>.rpm
rpm -iv --nodeps --force ssf_csim_rel-<BLADE>-<DIST>-
<RELEASEBUILD>.<ARCH>.rpm
rpm -iv --nodeps --force ssf_diagnosticsTLS_rel-<BLADE>-<DIST>-
<RELEASEBUILD>.<ARCH>.rpm
After installing the BSF RPMs, BSF services should be started explicitly using command,
/opt/ssf/etc/config/S99SsfBsfRun.sh start.
You can uninstall the BSF using the following RPM commands:
rpm -e ssf_diagnosticsTLS_rel-<BLADE>-<DIST>-
<RELEASEBUILD>.<ARCH>.rpm
rpm -e ssf_csim_rel-<BLADE>-<DIST>-<RELEASEBUILD>.<ARCH>.rpm
rpm -e ssf_main_rel-<BLADE>-<DIST>-<RELEASEBUILD>.<ARCH>.rpm
After the installation, the BSF binary files are installed at the /opt/ssf location.
The BSF applications can be started, stopped and restarted using below script.
sh /opt/ssf/etc/config/S99SsfBsfRun.sh start/stop/restart
You need to stop the BSF services, before performing uninstallation using below script.
/opt/ssf/etc/config/S99SsfBsfRun.sh stop
The order of removal of RPMs is a reverse procedure to that of installation.
24
ViewCheck on ATCA-9405 Installation and Use (6806800S51E)
Page 25
3.4 ViewCheck Service OS Image
The ViewCheck Service OS Image enables you to boot into ViewCheck specific OS and execute
the OOSD tests. The ViewCheck service is not completely dependent on the blade BBS
environment. For compatibility purpose, it may use the same OS or Kernel variant that are used
by the blade BBS service. For ATCA-9405 SP, the ViewCheck service OS is created with PNE
4.x3.x4.13.0 as the OS. For 9405 PP the OOSD image is build from cavium SDK. The 9405 PP
OOSD image is packaged along with 9405 SP OOSD image. So there is a single ViewCheck OS
image for ATCA-9405 blade.
The ViewCheck service OS along with the ViewCheck RPM, test suites, and test procedures are
distributed as an ISO file that contains:
ViewCheck OS as Ram Disk image that can be Net bootable
ViewCheck OS image can be Net bootable and installable on selected Flash Partition,
provided User Flash is available on the blade
Installation of ViewCheck
The following table provides details of the files that are distributed as part of this image once
the ViewCheck service OS is installed.
Table 3-2 ViewCheck Service OS Image Files on SP and PP
File Name Remarks
diagnostics-RELEASEBUILD.windriver4.1.linux.atca940
5sp.gz
Net bootable Ram Disk image with
ViewCheck RPM, Orion License RPM, and BSF
services package.
ViewCheck OOS image for PP with ViewCheck RPM
and BSF service packages.
ViewCheck on ATCA-9405 Installation and Use (6806800S51E)
25
Page 26
Installation of ViewCheck
Installing the ViewCheck Service OS image on SP
Before installing the ViewCheck service OS Image, you should have the knowledge of
configuring TFTP Server, configuring ATCA-9405 for Network Booting and Booting ATCA-9405
using a ramdisk. For more information, refer to the section 2.3 in Blade Services Software on
ATCA-9405 PR guide.
1. Once the blade is configured to boot with ramdisk image, it will have ViewCheck
and Blade Services Framework installed.
2. SP should also have the interfaces to PP1 and PP2 configured so that a
communication can be established between SP and PP's.
Installing the ViewCheck Service OS image on PP
The following procedure is to boot the ViewCheck OOS image on PP. For more information,
refer to section 2.6.5 in Blade Services Software on ATCA-9405 Programmer’s Reference Guide.
26
Before installing ViewCheck Service OS image on PP, make sure that vlans are configured
appropriately to reach Octeons.
1. On SP, go to /opt/diagnostics/etc/diag/ location and execute the
runlinux scripts.
For installing ViewCheck Service OS image on PP1, execute ./runlinux 1
command.
For installing ViewCheck Service OS image on PP2, execute ./runlinux 2
command.
Installing ViewCheck Service OS Image on USB
The ViewCheck service OS image can be installed on any external USB drive using flashprep
and flashinstall tools available on the board.
Use the flashrc tool available on the board to install the ViewCheck service OS image on USB
device.
ViewCheck on ATCA-9405 Installation and Use (6806800S51E)
Page 27
Installation of ViewCheck
For more information on installation, refer section 2.6.5 in Blade Services Software on ATCA-9405
Programmer’s Reference Guide.
Before installing on USB, the image needs to be converted into tar.bz2 format using
mk_atca_9405_sp_bzip2_format.sh script provided along with this release.
Example
./mk_atca_9405_sp_bzip2_format.sh <ViewCheck service image>
For this, any Linux PC can be used.
3.5 Access and Execution of a Test Using CLI
You can access ViewCheck CLI using the following procedure:
1. Establish the secure shell using SSH or Putty.
2. Start the Tel ne t connection from an already established secure shell.
telnet localhost 11001
Trying :1...
telnet: connect to address ::1: Connection refused
Trying 127.0.0.1...
Connected to localhost.localdomain (127.0.0.1).
Escape character is '^]'.
Welcome to Emerson's SSF CLI
3. Type your username and password.
ViewCheck on ATCA-9405 Installation and Use (6806800S51E)
27
Page 28

Installation of ViewCheck
Username: Admin
Password:
Access granted
>enable
#configure terminal
BSF(config)#
By default, the administrator user name and password are "Admin".
4. Select Virtual Execution Environment as below:
On SP, use the virExecEnv SP_VEE0 options in the virExecEnv
BSF(config)#virExecEnv virExecEnv SP_VEE0
BSF(VEE-SP_VEE0)#diagnostic
BSF(diag-SP_VEE0)#
28
On PP, use the OCTEON1_VEE0/OCTEON1_VEE1 options in the virExecEnv
BSF(config)#virExecEnv OCTEON1_VEE0
BSF(VEE-OCTEON1_VEE0)#diagnostic
BSF(diag-OCTEON1_VEE0)#
After logging into the ViewCheck CLI, you can list all the supported commands by typing '?'
on the CLI console.
BSF(diag-SP_VEE0)#?
configure-error-strings User configurable error strings, notified
by ViewCheck when reported by the device.
configure-log-path Configures the log path where the resluts
are stored.
device-category Configure deviceCategory
diag-service Diag operation(start/stop/restart).
exit Exit from diagnostic
hw-inventory-list Provides the Inventory of Hardware (Type,
Vendor ID, Major Number, Minor Number and
any associated Details) as detected by the
Diagnostics Application.
ViewCheck on ATCA-9405 Installation and Use (6806800S51E)
Page 29

Installation of ViewCheck
list-all-tests Displays all the supported tests on the
Board.
purge-all-log All log files are Zipped and stored away.
purge-log Purge specific log file.
reload User can issue this command when there
are updates to the User XML.
set-log-level Sets the Log Level of Diagnostic
Application.
show-all-monitors Displays all the supported Monitors on
the Board.
show-diag-scan-result Displays the last run result of Diagscan.
show-log-content Displays the content of log files related
to Rawlogs and ResultsLog of ViewCheck.
show-log-info List all Log files of Diagnostics
Application.
show-running-mode Displays the current running mode of
ViewCheck.
show-systemerror-log show system error log.
start-all-monitors Starts all the supported Monitors
available on the board or related to a
device category.
start-diag-scan Executes the Diagnostics tests supported
on the Board.
stop-all-monitors Stops all the supported Monitors
available on the board or related to a
device category.
stop-diag-scan stop the diag scan tests.
version Displays versions of BBS,ViewCheck and
BBS installed on the Board.
You can enter into device category mode by giving the command device-category on CLI
and view the list of commands supported only at device category level.
ViewCheck on ATCA-9405 Installation and Use (6806800S51E)
29
Page 30

Installation of ViewCheck
BSF(diag-SP_VEE0)#device-category ?
deviceCategory> other, processor, hardDisk, memory, os,
pciBus, pciExpressBus, scsiBus, sataBus,
clock, firmware, cpld, fpga,
networkinterface, digitalsignalprocessor,
networkprocessingunit, interface, systemBus,
flash, serial, i2cBus, spiBus, usbBus, ipmc, all
BSF(diag-SP_VEE0)# device-category networkinterface
BSF(diag-SP_VEE0-networkinterface)#?
exit Exit from deviceCategory
list-device-instances List all the possible device
instances in present
deviceCategory.
list-tests User can use this command to get
information on the available
Diagnostic tests with details like
tests and sub tests associated,
along with Test
IDs.
set-lower-threshold-info Set the Lower Threshold value for
the Monitor
set-rate set the rate of change value for
network monitors
set-poll-interval-default Set Poll Interval to default value
set-poll-interval Set the Poll Interval
set-threshold-default Set Threshold to default value
set-upper-threshold-info Set the Upper Threshold value for
the Monitor
show-lower-threshold-info Show Lower Threshold info.
show-monitor-id List all monitors for the
deviceCategory.
show-networkcounter-log show network counters log
show-networkerror-log show network errors log
show-poll-interval Show Poll Interval
show-rate show the rate of change value for
network monitors
show-test-help Brief help on the usage of the
Specific Test referred by Test ID.
30
ViewCheck on ATCA-9405 Installation and Use (6806800S51E)
Page 31

Installation of ViewCheck
show-test-result Show test result
show-test-status Show test status
show-upper-threshold-info Show upper threshold info.
start-monitor Start a monitor
start-test Start a test
stop-monitor Stop a monitor
stop-test Stop a test
After logging into the CLI, user can start, stop, and query a test from the CLI.
Below is an example of FloodPingTest in the network interface device category. In network
interface category mode, test ID 1. For more information, refer to NETWORK on page 83.
You can view the details of the test by giving show-test-help command
A list of device Instances supported under a device category can be viewed by giving list-
device-instances. To start the test, user can run start-test command with testId,
deviceInstance and arguments as input to the command. The arguments can be
neglected for tests that does not take any arguments as input.
After test execution, the results can be viewed by show-test-result command, which
displays test result and a raw log generated by that test.
BSF(diag-SP_VEE0-networkinterface)#list-device-instances
nwcontlr(131), eth0(62),eth1(63),eth2(64)
BSF(diag-SP_VEE0-networkinterface)#show-test-result testId 1
deviceInstance 63
Test Result: PASSED
Test Started Invocation Id: 7
Test Start Time: Mon Nov 26 09:31:22 2012
Test Stop Time: Mon Nov 26 09:31:23 2012
Test Log File:
/opt/diagnostics/var/log/diag/testlog/NETWORK_eth1.log
Using CLI, you can list all the Inservice diagnostics monitors in a device category. By default, all
monitors start when ViewCheck application is initialized. User can use start-monitor and stopmonitor commands to start and stop any monitor.
ViewCheck on ATCA-9405 Installation and Use (6806800S51E)
31
Page 32

Installation of ViewCheck
BSF(diag-SP_VEE0-networkinterface)#show-monitor-id
Mon Nov 26 09:36:06 2012
DeviceCategory: NETWORK
Monitor Name: NETWORK ERRORS VALUES
MonitorId: 1020
DeviceInstance:
eth0 eth1
Monitor Name: NETWORK COUNTERS VALUES
MonitorId: 1021
DeviceInstance:
eth0 eth1
BSF(diag-SP_VEE0-networkinterface)#start-monitor monitorId 1020
deviceInstance 63
MONITOR IS ALREADY STARTED
32
BSF(diag-SP_VEE0-networkinterface)#stop-monitor monitorId 1020
deviceInstance 63
MONITOR IS STOPPED
BSF(diag-SP_VEE0-networkinterface)#start-monitor monitorId 1020
deviceInstance 63
MONITOR IS STARTED
To exit from the ViewCheck CLI:
BSF(diag-SP_VEE0)#exit
BSF(VEE-vee0)#exit
BSF(config)#exit
#exit
ViewCheck on ATCA-9405 Installation and Use (6806800S51E)
Page 33

Installation of ViewCheck
3.6 Access and Execution of a Test Using XML
You can access ViewCheck XML interface similar to ViewCheck CLI.
1. Establish the secure shell using SSH or Putty.
2. Start the Telnet connection from an already established secure shell.
telnet localhost 15550
Trying 127.0.0.1...
Connected to localhost.localdomain (127.0.0.1).
Escape character is '^]'.
3.6.1 Authenticate
After a connection with the XML Agent is established, the only command which should be
executed is Authenticate. This command is for evaluating user credentials.
The Authentication command contains user name and password for verification.
Successful authentication is indicated by the success response, otherwise an error message is
returned.
You need to send the user credentials to XML Agent using the command Authenticate. The
XML Agent forwards the authentication request to the BSF system, which validates the user
credentials and allows the XML client to access it, if the validation is successful.
Request:
In the below request the user credentials “Admin” and "Admin” are created by default in
the BSF. But, user may supply user credentials by creating them using the "CreateObject"
command as shown in the section GetClassList.
<Script><Authenticate><User>Admin</User><Password>Admin</Passwo
rd></Authenticate></Script>]]>]]>
Response:
The below response is received if the authentication is successful.
<?xml version="1.0"?><Response><Success/></Response>]]>]]>
The following response is received if authentication fails.
<?xml
version="1.0"?><Response><Error><ErrorCode>1</ErrorCode><Type>O
peration not allowed</Type><Description>Authentication
error</Description><CustomError/></Error></Response>]]>]]>
ViewCheck on ATCA-9405 Installation and Use (6806800S51E)
33
Page 34

Installation of ViewCheck
3.6.2 Configure
This command configures the XML protocol for the indentation and the events to
enable/disable state. There are two configuration options available:
IndentOutput option controls the indentation of the XML response produced by the
MINDAgent. Its default value is ’0’, which means, by default, output indentation is off.
Request:
Below command request sets the indentation to 4:
<Script><Configure><IndentOutput>4</IndentOutput></Configure></
Script>]]>]]>
Response:
<?xml version="1.0"?>
<Response>
<Success/>
</Response>]]>]]>
34
EnableEvents option enables or disables events that reach XML interface from the BSF
framework. Successful execution is indicated by the success response. Otherwise, an error
message is returned.
The values for the command is true/false. True option enables the events and false option
disables the events.
Request:
<?xmlversion ="1.0"?>
<Script>
<Configure>
<EnableEvents>true</EnableEvents>
</Configure>
</Script>]]>]]>
Response:
<?xml version="1.0"?><Response><Success/></Response>]]>]]>
ViewCheck on ATCA-9405 Installation and Use (6806800S51E)
Page 35

3.6.3 GetClassList
This command is used to retrieve all BSF classes.
Request:
<Script ><GetClassList /></Script >]]>]]>
Response:
The response message received from the XML Agent is shown below. The response
contains all the BSF classes including the BSF framework classes along with the application
defined classes.
<Response>
<Classes>
<Class>session</Class>
<Class>shell</Class>
<Class>mode</Class>
<Class>command</Class>
<Class>user</Class>
<Class>group</Class>
<Class>membership</Class>
<Class>ACManager</Class>
<Class>shutdown</Class>
<Class>usmuser</Class>
<Class>traphost</Class>
<Class>cppscript</Class>
<Class>classlock</Class>
<Class>globallock</Class>
<Class>CommunityMO</Class>
<Class>SystemMO</Class>
<Class>SNMPAgentConfig</Class>
<Class>EventReceiver</Class>
<Class>EventFilter</Class>
<Class>agent</Class>
<Class>logsink</Class>
<Class>logfilter</Class>
<Class>acl</Class>
<Class>aclclass</Class>
<Class>aclmember</Class>
<Class>aclmoid</Class>
<Class>aclclassrange</Class>
Installation of ViewCheck
ViewCheck on ATCA-9405 Installation and Use (6806800S51E)
35
Page 36

Installation of ViewCheck
<Class>aceclass</Class>
<Class>acemember</Class>
<Class>acemoid</Class>
<Class>aceclassrange</Class>
<Class>virExecEnv</Class>
<Class>interface</Class>
<Class>service</Class>
<Class>diagnostic</Class>
<Class>deviceCategory</Class>
</Classes>
</Response>]]>]]>
ViewCheck software uses classes, diagnostics and device category to start, stop and query
the status of tests and monitors.
3.6.4 DescribeClass
DescribeClass XML command retrieves the description and properties of a BSF class such as
class creatability, class deletability, class writability, attributes, attributes description, attribute
types and so on. It returns class description on success or an error.
Request:
The below XML request gets the description of class 'shelf' in the BSF system.
<?xmlversion ="1.0"?>
<Script version ="2">
<DescribeClass>
<Class>diagnostic</Class>
</DescribeClass>
</Script>]]>]]>
<?xml version="1.0"?>
Response:
The below XML response shows the different details of the class 'shelf' in the BSF system.
<Response>
<ClassDesc>
<Class>diagnostic</Class>
36
ViewCheck on ATCA-9405 Installation and Use (6806800S51E)
Page 37

Installation of ViewCheck
<Id>1201</Id>
<Description>In Diagnostic mode, user can configure and perform
Diagnostic related tests, monitoring &
updating.</Description>
<IsSingleton>false</IsSingleton>
<IsCreatable>true</IsCreatable>
<IsDeletable>true</IsDeletable>
<IsWritable>false</IsWritable>
<MOIDDesc>
<Name>diagnosticMoid</Name>
<Id>1201</Id>
<Description/>
<MOIDItemDesc>
<Ref>
<ClassId>1102</ClassId>
<MOIDId>1102</MOIDId>
</Ref>
</MOIDItemDesc>
</MOIDDesc>
<MethodDesc>
<Name>hwInventoryList</Name>
<Id>10</Id>
<Description>Provides the Inventory of Hardware (Type, Vendor
ID, Major Number, Minor Number and any associated Details) as
detected by the Diagnostics Application. </Description>
<IsStatic>false</IsStatic>
<ArgDesc>
<Name>outputResult</Name>
<Id>0</Id>
<Description/>
<TypeDesc>
<Name/>
<Description/>
</TypeDesc>
<IsInput>false</IsInput>
<IsOutput>true</IsOutput>
<IsOptional>false</IsOptional>
</ArgDesc>
ViewCheck on ATCA-9405 Installation and Use (6806800S51E)
37
Page 38

Installation of ViewCheck
</MethodDesc>
<MethodDesc>
<Name>reload</Name>
<Id>20</Id>
<Description>User can issue this command when there are
updates to the User XML .</Description>
<IsStatic>false</IsStatic>
<ArgDesc>
<Name>commandStatus</Name>
<Id>0</Id>
<Description/>
<TypeDesc>
<Name/>
<Description/>
</TypeDesc>
<IsInput>false</IsInput>
<IsOutput>true</IsOutput>
<IsOptional>true</IsOptional>
</ArgDesc>
</MethodDesc>
<MethodDesc>
<Name>setLogLevel</Name>
<Id>30</Id>
<Description>Sets the Log Level of Diagnostic
Application.</Description>
<IsStatic>false</IsStatic>
<ArgDesc>
<Name>logLevelValue</Name>
<Id>0</Id>
<Description>Valid log levels (3-Critical, 2-Normal, 1Info)</Description>
<TypeDesc>
<Name>Integer</Name>
<Description>Integer number in range (-2^32)/2 to (2^32)/2 1</Description>
</TypeDesc>
<IsInput>true</IsInput>
<IsOutput>false</IsOutput>
38
ViewCheck on ATCA-9405 Installation and Use (6806800S51E)
Page 39

Installation of ViewCheck
<IsOptional>false</IsOptional>
</ArgDesc>
<ArgDesc>
<Name>commandStatus</Name>
<Id>1</Id>
<Description/>
<TypeDesc>
<Name/>
<Description/>
</TypeDesc>
<IsInput>false</IsInput>
<IsOutput>true</IsOutput>
<IsOptional>true</IsOptional>
</ArgDesc>
</MethodDesc>
<MethodDesc>
<Name>showLogInfo</Name>
<Id>40</Id>
<Description>List all Log files of Diagnostics
Application.</Description>
<IsStatic>false</IsStatic>
<ArgDesc>
<Name>outputResult</Name>
<Id>0</Id>
<Description/>
<TypeDesc>
<Name/>
<Description/>
</TypeDesc>
<IsInput>false</IsInput>
<IsOutput>true</IsOutput>
<IsOptional>false</IsOptional>
</ArgDesc>
</MethodDesc>
<MethodDesc>
<Name>purgeLog</Name>
<Id>50</Id>
<Description>Purge specific log file.</Description>
ViewCheck on ATCA-9405 Installation and Use (6806800S51E)
39
Page 40

Installation of ViewCheck
<IsStatic>false</IsStatic>
<ArgDesc>
<Name>logFileName</Name>
<Id>0</Id>
<Description>log file name</Description>
<TypeDesc>
<Name/>
<Description>file name</Description>
</TypeDesc>
<IsInput>true</IsInput>
<IsOutput>false</IsOutput>
<IsOptional>false</IsOptional>
</ArgDesc>
<ArgDesc>
<Name>commandStatus</Name>
<Id>1</Id>
<Description/>
<TypeDesc>
<Name/>
<Description/>
</TypeDesc>
<IsInput>false</IsInput>
<IsOutput>true</IsOutput>
<IsOptional>true</IsOptional>
</ArgDesc>
</MethodDesc>
<MethodDesc>
<Name>purgeAllLog</Name>
<Id>60</Id>
<Description>All log files are Zipped and stored
away.</Description>
<IsStatic>false</IsStatic>
<ArgDesc>
<Name>commandStatus</Name>
<Id>0</Id>
<Description/>
<TypeDesc>
<Name/>
40
ViewCheck on ATCA-9405 Installation and Use (6806800S51E)
Page 41

Installation of ViewCheck
<Description/>
</TypeDesc>
<IsInput>false</IsInput>
<IsOutput>true</IsOutput>
<IsOptional>true</IsOptional>
</ArgDesc>
</MethodDesc>
<MethodDesc>
<Name>showSystemErrorLog</Name>
<Id>70</Id>
<Description>show system error log</Description>
<IsStatic>false</IsStatic>
<ArgDesc>
<Name>outputResult</Name>
<Id>0</Id>
<Description/>
<TypeDesc>
<Name/>
<Description/>
</TypeDesc>
<IsInput>false</IsInput>
<IsOutput>true</IsOutput>
<IsOptional>false</IsOptional>
</ArgDesc>
</MethodDesc>
</ClassDesc>
</Response>]]>]]>
3.6.5 InvokeMethod
InvokeMethod XML command calls the method of an BSF Object. BSF methods are defined
with method parameters such as input, output and input-output.
ViewCheck on ATCA-9405 Installation and Use (6806800S51E)
41
Page 42

Installation of ViewCheck
BSF Object method can be invoked with a list of input or input-output arguments. This
command returns a list of output or input-output arguments. The input arguments means it is
only an input and will not be displayed in the output. But in the case of input-output
arguments, both input and output will be displayed in the output.
Diagnostics and device category classes have different instances: SP_VEE0,
OCTEON1_VEE0, and OCTEON1_VEE1 for service and packet processors respectively. The
examples given below are with respect to service processor. In case, you want to execute
any commands on PP, use either OCTEON1_VEE0 or OCTEON1_VEE1 as instance.
Request:
The below example invokes the method class 'diagnostic' with instance "SP_VEE0". Upon
execution of this method by the class instance, response will be sent in the output/inputoutput arguments.
Request
=======
<Script>
<InvokeMethod>
<Object>
<Class>diagnostic</Class>
<Name>SP_VEE0</Name>
</Object>
<Method>setLogLevel</Method>
<Argument>
<Name>logLevelValue</Name>
<Value>1</Value>
</Argument>
</InvokeMethod>
</Script>]]>]]>
42
Response:
InvokeMethod command returns the below response after executing the above
example command.
<?xml version="1.0"?>
<Response>
<Arguments>
ViewCheck on ATCA-9405 Installation and Use (6806800S51E)
Page 43

Installation of ViewCheck
<Argument>
<Name>commandStatus</Name>
<Value>Set Log Level Success</Value>
</Argument>
</Arguments>
</Response>]]>]]>
To exit from the ViewCheck XML:
<Script>
<Command name="Exit"/>
<Script>]]>]]>
3.7 ViewCheck Service LOG Information
ViewCheck service logs are generated in EmrDiag_Debug.log file and is located at
/opt/diagnostics/var/log/diag/service/
The Test result logs and raw logs generated by various tests are available at
/opt/diagnostics/var/log/diag/testlog/
3.8 ViewCheck TestLog Information
ViewCheck internally retains data related to tests invoked by the user. If the number of tests
invoked by the user exceed 1000, all this information is saved in the
Emr_TestResultsMib.txt file and the internal storage is erased.
ViewCheck on ATCA-9405 Installation and Use (6806800S51E)
43
Page 44

Installation of ViewCheck
44
ViewCheck on ATCA-9405 Installation and Use (6806800S51E)
Page 45

Commands Execution
4.1 Overview
CLI and XML are the primary ways to access ViewCheck capabilities on the blade. These
mechanisms allows you to perform activities such as start, stop and query on the ViewCheck
software. Using CLI and XML you can also set the parameters for monitoring.
Commands are classified into:
Generic commands
Commands for test management and control
Commands for monitoring
4.2 Generic Commands
Chapter 4
Following are the general functional commands provided by the ViewCheck service.
The command syntaxes for XML interface is given for the diagnostic class with instance as
vee0. This instance varies depending on the blade.
4.2.1 configure-error-strings
configure-error-strings command allows to add user-defined kernel error strings to
the diagnostics database.
Syntax for CLI
configure-error-strings errorStrings <string>
The following table provides the configure-error-strings command arguments.
Table 4-1 configure-error-strings
Argument Data Type Description
String String Kernel error string to be added to the diagnostics
database.
ViewCheck on ATCA-9405 Installation and Use (6806800S51E)
45
Page 46

Commands Execution
Syntax for XML
<Script>
<InvokeMethod>
<Object>
<Class>diagnostic</Class>
<Name>SP_VEE0</Name>
</Object>
<Method>configureErrStrings</Method>
<Argument>
<Name>Error String</Name>
<Value>{error String}</Value>
</Argument>
</InvokeMethod>
</Script>]]>]]>
4.2.2 configure-log-path
46
configure-log-path command allows to configure the location of diagnostics logs. You
can also specify the maximum size of logs. Once the log size reaches the user specified limit, a
trap is sent to the user. Specifying log size is optional and by default, its value is 1GB.
Syntax for CLI
configure-log-path logpath <PATH> logSize <size>
The following table provides the configure-log-path command arguments.
Table 4-2 configure-log-path
Argument Data Type Description
logpath String Location of the log path where diagnostics should place
the log files.
size String Optional parameter, size of the log path. For example,
10M, 2G, 100K, 1048576.
Syntax for XML
<Script>
<InvokeMethod>
<Object>
ViewCheck on ATCA-9405 Installation and Use (6806800S51E)
Page 47

<Class>diagnostic</Class>
<Name>SP_VEE0</Name>
</Object>
<Method>configureLogPath</Method>
<Argument>
<Name>logpath</Name>
<Value>{logPath String}</Value>
</Argument>
</InvokeMethod>
</Script>]]>]]>
4.2.3 device-category
device-category command allows to configure the available device categories.
Syntax
device-category <Dev category>
Commands Execution
Expected Output
The CLI prompt will show the device category that you have selected.
This command is valid only in CLI.
4.2.4 diag-service
diag-service command allows to start/stop/restart/status the diagnostics service.
Syntax for CLI
diag-service operation <restart/start/stop/status>
ViewCheck on ATCA-9405 Installation and Use (6806800S51E)
47
Page 48

Commands Execution
The following table provides the diag-service command arguments.
Table 4-3 diag-service
Argument Data Type Description
operation String Requested operation to the diagnostics core.
Syntax for XML
<Script>
<InvokeMethod>
<Object>
<Class>diagnostic</Class>
<Name>SP_VEE0</Name>
</Object>
<Method>diagService</Method>
<Argument>
<Name>operation</Name>
<Value>{operation String}</Value>
</Argument>
</InvokeMethod>
</Script>]]>]]>
4.2.5 hw-inventory-list
hw-inventory-list command provides the detailed information of hardware
components available on the blade. The command displays the Hardware Type, Vendor ID,
Major Number, Minor Number and any other associated details that are identified by the
ViewCheck.
Syntax for CLI
hw-inventory-list
Syntax for XML
<Script>
<InvokeMethod>
<Object>
<Class>diagnostic</Class>
<Name>SP_VEE0</Name>
48
ViewCheck on ATCA-9405 Installation and Use (6806800S51E)
Page 49

</Object>
<Method>hwInventoryList</Method>
</InvokeMethod>
</Script>]]>]]>
4.2.6 list-all-tests
list-all-tests command lists all the tests available on the board.
Syntax for CLI
list-all-tests
Syntax for XML
<Script>
<InvokeMethod>
<Object>
<Class>diagnostic</Class>
<Name>SP_VEE0</Name>
</Object>
<Method>showListAllTests</Method>
</InvokeMethod>
</Script>]]>]]>
Commands Execution
4.2.7 list-device-instances
list-device-instances command lists all possible device instances in present device
category.
Syntax for CLI
list-device-instances
Syntax for XML
<Script>
<InvokeMethod>
<Object>
<Class>deviceCategory</Class>
<Name>SP_VEE0-{Dev Cat}</Name>
ViewCheck on ATCA-9405 Installation and Use (6806800S51E)
49
Page 50

Commands Execution
</Object>
<Method>listInstances</Method>
</InvokeMethod>
</Script>]]>]]>
This command will be deprecated in future.
4.2.8 purge-all-log
purge-all-log command allows to zip all LOG files and store away.
Syntax for CLI
purge-all-log
Syntax for XML
<Script>
<InvokeMethod>
<Object>
<Class>diagnostic</Class>
<Name>SP_VEE0</Name>
</Object>
<Method>purgeAllLog</Method>
</InvokeMethod>
</Script>]]>]]>
4.2.9 purge-log
purge-log command deletes the LOG files generated by ViewCheck software.
Syntax for CLI
purge-log logFileName <logfile Name>
50
ViewCheck on ATCA-9405 Installation and Use (6806800S51E)
Page 51

Commands Execution
The following table provides the purge-log command arguments.
Table 4-4 purge-log
Argument Data Type Description
logfile Name String Type the name of the Log file that you want to delete or
clear
Syntax for XML
<Script>
<InvokeMethod>
<Object>
<Class>diagnostic</Class>
<Name>SP_VEE0</Name>
</Object>
<Method>purgeLog</Method>
<Argument>
<Name>logFileName</Name>
<Value>{Name of the log file}</Value>
</Argument>
</InvokeMethod>
</Script>]]>]]>
Example
BSF(diag-SP_VEE0)#purge-log logFileName NETWORK_base1.log
Purge Log Success
You can purge only raw log files. The raw log file naming convention is in the form of *.log.
ViewCheck on ATCA-9405 Installation and Use (6806800S51E)
51
Page 52

Commands Execution
4.2.10 set-log-level
set-log-level command sets the current log level of ViewCheck to value X. This is an
internal Debug command to be used mainly for generating detailed debug log information.
The valid log level values are listed in the following table:
Table 4-5 set-log-level Values
Values Description
1-Info All logs are logged. Even functions like entry and exit are also logged.
2- Normal Details of function flows are logged.
3- Critical High level errors are logged.
Syntax for CLI
set-log-level logLevelValue <x>
The following table lists the set-log-level command arguments.
Table 4-6 set-log-level Arguments
Argument Data Type Description
X Integer Possible values are 3, 2, 1 (3-Critical, 2-Normal, 1-Info)
Syntax for XML
<Script>
<InvokeMethod>
<Object>
<Class>diagnostic</Class>
<Name>SP_VEE0</Name>
</Object>
<Method>setLogLevel</Method>
<Argument>
<Name>logLevelValue</Name>
52
ViewCheck on ATCA-9405 Installation and Use (6806800S51E)
Page 53

<Value>1</Value>
</Argument>
</InvokeMethod>
</Script>]]>]]>
Example
BSF(diag-SP_VEE0)#set-log-level logLevelValue 2
Set Log Level Success
4.2.11 show-all-monitors
show-all-monitors command lists all the monitors available on the board.
Syntax for CLI
show-all-monitors
Syntax for XML
<Script>
<InvokeMethod>
<Object>
<Class>diagnostic</Class>
<Name>SP_VEE0</Name>
</Object>
<Method>showAllMonitors</Method>
</InvokeMethod>
</Script>]]>]]>
Commands Execution
4.2.12 show-all-test-status
show-all-test-status command allows you to view the current status of all tests
available on the blade.
Syntax for CLI
show-all-test-status
ViewCheck on ATCA-9405 Installation and Use (6806800S51E)
53
Page 54

Commands Execution
Syntax for XML
<Script>
<InvokeMethod>
<Object>
<Class>diagnostic</Class>
<Name>SP_VEE0</Name>
</Object>
<Method>ShowAllTestStatus</Method>
</InvokeMethod>
</Script>]]>]]>
4.2.13 show-diag-scan-result
show-diag-scan-result command shows result of the last diag-scan command.
Syntax for CLI
show-diag-scan-result
Syntax for XML
<Script>
<InvokeMethod>
<Object>
<Class>diagnostic</Class>
<Name>SP_VEE0</Name>
</Object>
<Method>showDiagScanResult</Method>
</InvokeMethod>
</Script>]]>]]>
4.2.14 show-log-content
show-log-content command displays the content of the mentioned log file.
Syntax for CLI
show-log-content logfilename <logfile Name>
54
ViewCheck on ATCA-9405 Installation and Use (6806800S51E)
Page 55

Commands Execution
The following table provides the show-log-content command arguments.
Table 4-7 show-log-content
Argument Data Type Description
logfile Name String Name of the log file to be displayed.
Syntax for XML
<Script>
<InvokeMethod>
<Object>
<Class>diagnostic</Class>
<Name>SP_VEE0</Name>
</Object>
<Method>showLogContent</Method>
<Argument>
<Name>logFileName</Name>
<Value>{logfilename String}</Value>
</Argument>
</InvokeMethod>
</Script>]]>]]>
4.2.15 show-log-info
show-log-info command provides the details of the various LOG files along with the
diagnostics data.
Syntax for CLI
show-log-info
Syntax for XML
<Script>
<InvokeMethod>
<Object>
<Class>diagnostic</Class>
<Name>SP_VEE0</Name>
ViewCheck on ATCA-9405 Installation and Use (6806800S51E)
55
Page 56

Commands Execution
</Object>
<Method>showLogInfo</Method>
</InvokeMethod>
</Script>]]>]]>
4.2.16 show-log-level
show-log-level command displays the current logging level of ViewCheck.
Syntax for CLI
show-log-level
Syntax for XML
<Script>
<InvokeMethod>
<Object>
<Class>diagnostic</Class>
<Name>SP_VEE0</Name>
</Object>
<Method>showLogLevel</Method>
</InvokeMethod>
</Script>]]>]]>]
4.2.17 show-running-mode
show-running-mode command displays the running mode of the diagnostics (INSM or
OOSD).
Syntax for CLI
show-running-mode
Syntax for XML
<Script>
<InvokeMethod>
<Object>
<Class>diagnostic</Class>
<Name>SP_VEE0</Name>
56
ViewCheck on ATCA-9405 Installation and Use (6806800S51E)
Page 57

</Object>
<Method>showRunningMode</Method>
</InvokeMethod>
</Script>]]>]]>
4.2.18 show-systemerror-log
show-systemerror-log command displays the kernel critical and error messages
captured by ViewCheck application.
Syntax for CLI
show-systemerror-log
Syntax for XML
<Script>
<InvokeMethod>
<Object>
<Class>diagnostic</Class>
<Name>SP_VEE0</Name>
</Object>
<Method>showSystemErrorLog</Method>
</InvokeMethod>
</Script>]]>]]>
Commands Execution
4.2.19 start-all-monitors
start-all-monitors command starts all the monitors of the mentioned device category.
Syntax for CLI
start-all-monitors device-category <Dev category>
The following table provides the start-all-monitors command arguments.
Table 4-8 start-all-monitors
Argument Data Type Description
Dev category String Name of the device category.
ViewCheck on ATCA-9405 Installation and Use (6806800S51E)
57
Page 58

Commands Execution
Syntax for XML
<Script>
<InvokeMethod>
<Object>
<Class>diagnostic</Class>
<Name>SP_VEE0</Name>
</Object>
<Method>startAllMonitors</Method>
<Argument>
<Name>device-category</Name>
<Value>{Dev category String}</Value>
</Argument>
</InvokeMethod>
</Script>]]>]]>
4.2.20 start-diag-scan
58
start-diag-scan starts the diag-scan on the specified device categories.
Syntax for CLI
start-diag-scan deviceCategory <Dev category-1>,…,<Dev category-N>
Iterations <Itr-num> haltOnError <halt-string> timeout <timeoutval>
Iterations, haltonError, and timeout are optional arguments.
The following table provides the start-diag-scan command arguments.
Table 4-9 start-diag-scan
Argument Data Type Description
Dev category1-N String Separate device categories using comma ’,’.
Itr-num Integer Enter the number of times that diag-scan has to run. By
default value is "1".
Maximum number of iterations that user can specify is
1000.
ViewCheck on ATCA-9405 Installation and Use (6806800S51E)
Page 59

Commands Execution
Table 4-9 start-diag-scan (continued)
Argument Data Type Description
halt-string String Type "Yes" or "No".
haltOnError specifies whether to continue or stop
with test case execution on the occurrence of any error.
By default, value is "No".
timeout-val Integer Enter the maximum time period to be taken by each test
to execute.
Syntax for XML
<Script>
<InvokeMethod>
<Object>
<Class>diagnostic</Class>
<Name>SP_VEE0</Name>
</Object>
<Method>startDiagScan</Method>
<Argument>
<Name>device-category</Name>
<Value>{Dev category String}</Value>
</Argument>
</InvokeMethod>
</Script>]]>]]>
4.2.21 stop-all-monitors
stop-all-monitors command stops all the monitors of the mentioned device category.
Syntax for CLI
stop-all-monitors device-category <Dev category>
The following table provides the stop-all-monitors command arguments.
Table 4-10 stop-all-monitors
Argument Data Type Description
Dev category String Name of the device category.
ViewCheck on ATCA-9405 Installation and Use (6806800S51E)
59
Page 60

Commands Execution
Syntax for XML
<Script>
<InvokeMethod>
<Object>
<Class>diagnostic</Class>
<Name>SP_VEE0</Name>
</Object>
<Method>stopAllMonitors</Method>
<Argument>
<Name>device-category</Name>
<Value>{Dev category String}</Value>
</Argument>
</InvokeMethod>
</Script>]]>]]>
4.2.22 stop-diag-scan
stop-diag-scan stops the currently running diag-scan command.
Syntax for CLI
stop-diag-scan
Syntax for XML
<Script>
<InvokeMethod>
<Object>
<Class>diagnostic</Class>
<Name>SP_VEE0</Name>
</Object>
<Method>stopDiagScan</Method>
</InvokeMethod>
</Script>]]>]]>
4.2.23 switch-mode
switch-mode command allows to switch ViewCheck from OOS mode to InService mode and
vice versa.
60
ViewCheck on ATCA-9405 Installation and Use (6806800S51E)
Page 61

Commands Execution
Syntax for CLI
switch-mode modeVal <x>
The following table lists the switch-mode command arguments.
Table 4-11 switch-mode Arguments
Argument Data Type Description
X string Possible values are insm and oosd. Parameter given for
the command is case-insensitive.
Syntax for XML
<Script>
<InvokeMethod>
<Object>
<Class>diagnostic</Class>
<Name>SP_VEE0</Name>
</Object>
<Method>switchMode</Method>
<Argument>
<Name>modeVal</Name>
<Value>oosd</Value>
</Argument>
</InvokeMethod>
</Script>]]>]]>
Example
BSF(diag-SP_VEE0)#switch-mode modeVal insm
Mode of ViewCheck is successfully changed to INSM
ViewCheck on ATCA-9405 Installation and Use (6806800S51E)
61
Page 62

Commands Execution
It is recommended to not to run following test cases in OOS mode:
OctBootTest
OctDDR2MemTest
OctRCStressTest
In order to execute these tests, user has to install ViewCheck OOS image on the blade.
4.2.24 version
version command displays the RPM versions of all the ViewCheck packages installed.
Syntax for CLI
version
Syntax for XML
<Script>
<InvokeMethod>
<Object>
<Class>diagnostic</Class>
<Name>SP_VEE0</Name>
</Object>
<Method>showVersion</Method>
</InvokeMethod>
</Script>]]>]]>
62
ViewCheck on ATCA-9405 Installation and Use (6806800S51E)
Page 63

Commands Execution
4.3 Test Management and Control Commands
The following list of CLI commands are used for test management and control of diagnostic
tests.
Execute all test management and control commands only after entering a specific device
category.
4.3.1 start-test
start-test command allows you to start and run a particular diagnostic test.
Syntax for CLI
start-test testId <Test ID> deviceInstance <Dev Instance> arguments
-t <timeout-val> -Iterations <Itr-num> -Halt-onerror <halt-string>
Syntax for XML
<Script>
<InvokeMethod>
<Object>
<Class>deviceCategory</Class>
<Name>SP_VEE0-{Dev Cat}</Name>
</Object>
<Method>startTest</Method>
<Argument>
<Name>deviceInstance</Name>
<Value>Dev Instance</Value>
</Argument>
<Argument>
<Name>testId</Name>
<Value>Test ID</Value>
</Argument>
<Argument>
<Name>arguments</Name>
ViewCheck on ATCA-9405 Installation and Use (6806800S51E)
63
Page 64

Commands Execution
<Value>Param1</Value>
</Argument>
</InvokeMethod>
</Script>]]>]]>
Iterations, haltonError, and timout are optional arguments.
The following table lists the start-test command arguments.
Table 4-12 start-test
Argument Data Type Description
Test ID Integer Type the unique ID of a particular test that you want to
Dev Instance Enum Use list-device-instances CLI command to get the
start
equivalent Enumerated value of supported Device
Instance
timeout-val Integer Timeout value for the test
Itr-num Integer Number of iterations of the test
halt-string String "Yes" or "No" value. if "Yes", the test halts on error. if "No",
4.3.2 show-test-help
show-test-help command provides the brief information on how to use a particular test.
This command provides information such as how to start, stop, and query the specified test ID.
Syntax for CLI
show-test-help testId <Test ID>
Syntax for XML
<Script>
<InvokeMethod>
<Object>
<Class>deviceCategory</Class>
<Name>SP_VEE0-{dev Cat}</Name>
</Object>
<Method>showTestHelp</Method>
the test does not halts
64
ViewCheck on ATCA-9405 Installation and Use (6806800S51E)
Page 65

<Argument>
<Name>testId</Name>
<Value>Test ID</Value>
</Argument>
</InvokeMethod>
</Script>]]>]]>
The following table lists the show-test-help command arguments.
Table 4-13 show-test-help
Argument Data Type Description
Test ID Integer Type the unique ID of a particular test to get the details
4.3.3 list-tests
Commands Execution
of it
list-tests command provides a supported list of diagnostics tests on the blade with
associated test IDs.
Syntax for CLI
list-tests
Syntax for XML
<Script>
<InvokeMethod>
<Object>
<Class>deviceCategory</Class>
<Name>SP_VEE0-{dev Cat}</Name>
</Object>
<Method>showTestList</Method>
</InvokeMethod>
</Script>]]>]]>
4.3.4 show-test-status
show-test-status command allows you to view the status of a particular test. The status
of a test can be In Progress, Test Execution Completed, Test Stopped, and Test Timed Out.
ViewCheck on ATCA-9405 Installation and Use (6806800S51E)
65
Page 66

Commands Execution
Syntax for CLI
show-test-status testId <Test ID> deviceInstance <Dev Instance>
Syntax for XML
<Script>
<InvokeMethod>
<Object>
<Class>deviceCategory</Class>
<Name>SP_VEE0-{Dev Cat}</Name>
</Object>
<Method>showTestStatus</Method>
<Argument>
<Name>deviceInstance</Name>
<Value>Dev Instance</Value>
</Argument>
<Argument>
<Name>testId</Name>
<Value>Test ID</Value>
</Argument>
</InvokeMethod>
</Script>]]>]]>
The following table lists the show-test-status command arguments.
Table 4-14 show-test-status
Argument Data Type Description
Test ID Integer Type the unique ID of a particular test that you want to
Dev Instance Enum Use list-device-instances CLI command to get the
4.3.5 show-test-result
show-test-result command allows you to view the latest result of a particular test. This
command displays the start and end time of the test, the test status such as Passed, Failed,
Aborted, and Timed Out, and additional test arguments.
66
view the status
equivalent enumerated value of supported Device
Instance
ViewCheck on ATCA-9405 Installation and Use (6806800S51E)
Page 67

Commands Execution
Syntax for CLI
show-test-result testId <Test ID> deviceInstance <Dev Instance>
Syntax for XML
<Script>
<InvokeMethod>
<Object>
<Class>deviceCategory</Class>
<Name>SP_VEE0-{Dev Cat}</Name>
</Object>
<Method>showTestResult</Method>
<Argument>
<Name>deviceInstance</Name>
<Value>Dev Instance</Value>
</Argument>
<Argument>
<Name>testId</Name>
<Value>Test ID</Value>
</Argument>
</InvokeMethod>
</Script>]]>]]>
Table 4-15 show-test-result
Argument Data Type Description
Test ID Integer Type the unique ID of a particular test that you want to
view the latest result
Dev Instance Enum Use list-device-instances CLI command to get the
equivalent enumerated value of supported Device
Instance
4.3.6 stop-test
stop-test command allows you to stop or cancel any running diagnostic test.
Syntax for CLI
stop-test testId <Test ID> deviceInstance <Dev Instance>
ViewCheck on ATCA-9405 Installation and Use (6806800S51E)
67
Page 68

Commands Execution
Syntax for XML
<Script>
<InvokeMethod>
<Object>
<Class>deviceCategory</Class>
<Name>SP_VEE0-{Dev Cat}</Name>
</Object>
<Method>stopTest</Method>
<Argument>
<Name>deviceInstance</Name>
<Value>Dev Instance</Value>
</Argument>
<Argument>
<Name>testId</Name>
<Value>Test ID</Value>
</Argument>
</InvokeMethod>
</Script>]]>]]>
68
The following table provides the Stop-test command arguments.
Table 4-16 stop-test
Argument Data Type Description
Test ID Integer Type the unique ID of the Test that you want to stop
Dev Instance Enum Use list-device-instances CLI command to get the
equivalent enumerated value of supported Device
Instance
ViewCheck on ATCA-9405 Installation and Use (6806800S51E)
Page 69

4.4 Monitoring Commands
The following list of commands are used for management of the InService Monitoring
functionality of ViewCheck.
Execute all commands related to monitors only after entering the specific device category
mode.
4.4.1 show-monitor-id
show-monitor-id command displays the list of parameters that are monitored using the
InService Diagnostic. This command displays default monitor ID values of the parameters also.
Commands Execution
Syntax for CLI
show-monitor-id
Syntax for XML
<Script>
<InvokeMethod>
<Object>
<Class>deviceCategory</Class>
<Name>SP_VEE0-{Dev Cat}</Name>
</Object>
<Method>showMonitorId</Method>
</InvokeMethod>
</Script>]]>]]>
This command displays a list of monitors, if supported, only in that particular device
category.
ViewCheck on ATCA-9405 Installation and Use (6806800S51E)
69
Page 70

Commands Execution
4.4.2 show-poll-interval
show-poll-interval command displays list of default Poll intervals that are associated
with the monitors. The Poll interval values are in seconds.
Syntax for CLI
show-poll-interval monitorId <Monitor ID> deviceInstance <Dev
Instance>
Syntax for XML
<Script>
<InvokeMethod>
<Object>
<Class>deviceCategory</Class>
<Name>SP_VEE0-{Dev Cat}</Name>
</Object>
<Method>showPollInterval</Method>
<Argument>
<Name>deviceInstance</Name>
<Value>Dev Instance</Value>
</Argument>
<Argument>
<Name>monitorId</Name>
<Value>Monitor ID</Value>
</Argument>
</InvokeMethod>
</Script>]]>]]>
70
The following table provides the show-poll-interval command arguments.
Table 4-17 show-poll-interval
Argument Data Type Description
Monitor ID Integer Type the unique ID of the Monitor of which you want to
view its default Poll interval values, if any
Dev Instance Enum Use list-device-instances CLI command to get the
equivalent enumerated value of supported Device
Instance
ViewCheck on ATCA-9405 Installation and Use (6806800S51E)
Page 71

4.4.3 start-monitor
start-monitor command allows you to trigger a specific monitor to start monitoring if it
is not already initiated by default.
Syntax for CLI
start-monitor monitorId <Monitor ID> deviceInstance <Dev Instance>
Syntax for XML
<Script>
<InvokeMethod>
<Object>
<Class>deviceCategory</Class>
<Name>SP_VEE0-{Dev Cat}</Name>
</Object>
<Method>startMonitor</Method>
<Argument>
<Name>deviceInstance</Name>
<Value>Dev Instance</Value>
</Argument>
<Argument>
<Name>monitorId</Name>
<Value>Monitor ID</Value>
</Argument>
</InvokeMethod>
</Script>]]>]]>
Commands Execution
The following table provides the Start-monitor command arguments.
Table 4-18 start-monitor
Argument Data Type Description
Monitor ID Integer Type the unique ID of the Monitor that you want to start
Dev Instance Enum Use list-device-instances CLI command to get the
equivalent enumerated value of supported Device
Instance
ViewCheck on ATCA-9405 Installation and Use (6806800S51E)
71
Page 72

Commands Execution
4.4.4 set-poll-interval
set-poll-interval command is used to set the Poll interval value for monitors.
Syntax for CLI
set-poll-interval monitorId <Monitor ID> deviceInstance <Dev
Instance> pollInterval <PollIntervaLvalue>
Syntax for XML
<Script>
<InvokeMethod>
<Object>
<Class>deviceCategory</Class>
<Name>SP_VEE0-{Dev Cat}</Name>
</Object>
<Method>setPollInterval</Method>
<Argument>
<Name>deviceInstance</Name>
<Value>Dev Instance</Value>
</Argument>
<Argument>
<Name>monitorId</Name>
<Value>Monitor ID</Value>
</Argument>
<Argument>
<Name>pollInterval</Name>
<Value>PollInterval Value</Value>
</Argument>
</InvokeMethod>
</Script>]]>]]>
72
The following table provides the set-poll-interval command arguments.
Table 4-19 set-poll-interval
Argument Data Type Description
Monitor ID Integer Type the unique ID of the Monitor for which you want to
set the Poll interval value
ViewCheck on ATCA-9405 Installation and Use (6806800S51E)
Page 73

Table 4-19 set-poll-interval
Argument Data Type Description
Dev Instance Enum Use list-device-instances CLI command to get the
equivalent enumerated value of supported Device
Instance
PollInterval Value Integer Type the Poll interval value for the specified monitor ID
4.4.5 set-poll-interval-default
set-poll-interval-default command is used to reset the Poll interval value to default
value of a particular monitor.
Syntax for CLI
set-poll-interval-default monitorId <Monitor ID> deviceInstance
<Dev Instance>
Commands Execution
Syntax for XML
<Script>
<InvokeMethod>
<Object>
<Class>deviceCategory</Class>
<Name>SP_VEE0-{Dev Cat}</Name>
</Object>
<Method>setPollIntervalDefault</Method>
<Argument>
<Name>deviceInstance</Name>
<Value>Dev Instance</Value>
</Argument>
<Argument>
<Name>monitorId</Name>
<Value>Monitor ID</Value>
</Argument>
</InvokeMethod>
</Script>]]>]]>
ViewCheck on ATCA-9405 Installation and Use (6806800S51E)
73
Page 74

Commands Execution
The following table provides the set-poll-interval-default command arguments.
Table 4-20 set-poll-interval-default
Argument Data Type Description
Monitor ID Integer Type the unique ID of the Monitor for which you want to
Dev Instance Enum Use list-device-instances CLI command to get the
4.4.6 stop-monitor
stop-monitor command allows you to trigger a specific monitor to stop monitoring, which
is already in service.
reset the Poll interval value to default value
equivalent enumerated value of supported Device
Instance
Syntax for CLI
stop-monitor monitorId <Monitor ID> deviceInstance <Dev Instance>
Syntax for XML
<Script>
<InvokeMethod>
<Object>
<Class>deviceCategory</Class>
<Name>SP_VEE0-{Dev Cat}</Name>
</Object>
<Method>stopMonitor</Method>
<Argument>
<Name>deviceInstance</Name>
<Value>Dev Instance</Value>
</Argument>
<Argument>
<Name>monitorId</Name>
<Value>Monitor ID</Value>
</Argument>
</InvokeMethod>
</Script>]]>]]>
74
ViewCheck on ATCA-9405 Installation and Use (6806800S51E)
Page 75

The following table provides the stop-monitor command arguments.
Table 4-21 stop-monitor
Argument Data Type Description
Monitor ID Integer Type the unique ID of the Monitor that you want to stop
Dev Instance Enum Use list-device-instances CLI command to get the
4.4.7 set-rate
set-rate command sets the rate of change value for network monitors.
Syntax for CLI
set-rate monitorId <Monitor Id> deviceInstance <Dev Instance> rate
<Rate>
Commands Execution
monitoring
equivalent enumerated value of supported Device
Instance
Syntax for XML
<Script>
<InvokeMethod>
<Object>
<Class>deviceCategory</Class>
<Name>SP_VEE0-{Dev Cat}</Name>
</Object>
<Method>setRate</Method>
<Argument>
<Name>deviceInstance</Name>
<Value>Dev Instance</Value>
</Argument>
<Argument>
<Name>monitorId</Name>
<Value>Monitor ID</Value>
</Argument>
<Argument>
<Name>rate</Name>
ViewCheck on ATCA-9405 Installation and Use (6806800S51E)
75
Page 76

Commands Execution
<Value>Rate</Value>
</Argument>
</InvokeMethod>
</Script>]]>]]>
The following table provides the set-rate command arguments.
Table 4-22 set-rate
Argument Data Type Description
Monitor ID Integer Type the unique ID of the Monitor for which rate of
Dev Instance Enum Use list-device-instances CLI command to get the
Rate Integer Rate of change value
change value is to be set
equivalent enumerated value of supported Device
Instance
4.4.8 show-rate
show-rate command shows the rate of change value of network monitors.
Syntax for CLI
show-rate monitorId <Monitor Id> deviceInstance <Dev Instance>
Syntax for XML
<Script>
<InvokeMethod>
<Object>
<Class>deviceCategory</Class>
<Name>SP_VEE0-{Dev Cat}</Name>
</Object>
<Method>showRate</Method>
<Argument>
<Name>deviceInstance</Name>
<Value>Dev Instance</Value>
</Argument>
<Argument>
<Name>monitorId</Name>
76
ViewCheck on ATCA-9405 Installation and Use (6806800S51E)
Page 77

Commands Execution
<Value>Monitor ID</Value>
</Argument>
</InvokeMethod>
</Script>]]>]]>
The following table provides the show-rate command arguments.
Table 4-23 show-rate
Argument Data Type Description
Monitor ID Integer Type the unique ID of the Monitor of which rate of
change value is to be shown
Dev Instance Enum Use list-device-instances CLI command to get the
equivalent enumerated value of supported Device
Instance
4.4.9 show-networkcounter-log
show-networkcounter-log command displays the list of network counters on devices
that have crossed the maximum rate value. For more information on command, rate, refer
show-rate on page 76.
Syntax for CLI
show-networkcounter-log
Syntax for XML
<Script>
<InvokeMethod>
<Object>
<Class>deviceCategory</Class>
<Name>SP_VEE0-{Dev Cat}</Name>
</Object>
<Method>showNetworkCounterLog</Method>
</InvokeMethod>
</Script>]]>]]>
ViewCheck on ATCA-9405 Installation and Use (6806800S51E)
77
Page 78

Commands Execution
4.4.10 show-networkerror-log
show-networkerror-log command displays the list of network counters on devices that
have crossed the maximum rate value. For more information on command, rate, refer show-
rate on page 76.
Syntax for CLI
show-networkerror-log
Syntax for XML
<Script>
<InvokeMethod>
<Object>
<Class>deviceCategory</Class>
<Name>SP_VEE0-{Dev cat}</Name>
</Object>
<Method>showNetworkErrorLog</Method>
</InvokeMethod>
</Script>]]>]]>
4.4.11 exit
exit command allows you to exit from the ViewCheck CLI.
Syntax for CLI
exit
Syntax for XML
<Script>
<Command name="Exit"/>
<Script>]]>]]>
4.5 InService Monitoring Specifics
The In Service Monitoring of ViewCheck provides functionality to:
Monitor HW Device Status
Monitor Device Critical Errors
78
ViewCheck on ATCA-9405 Installation and Use (6806800S51E)
Page 79

The functionality and access methods provided are briefly described in this section.
Note: Currently monitors are supported only on Service Processor.
4.5.1 Monitoring HW Device Status
In Service Monitoring also periodically polls for various devices status on the blade. They are
Storage Device HDD Health Status
Network Devices Counters Statistics
Network Devices Error Statistics
Each of the above is identified by a unique Monitor ID. For more information about Monitor ID,
refer Monitor ID on page 18.
Commands Execution
The default Poll Interval for monitoring each of the Monitor ID is set to 10 Seconds. Commands
are provided to edit the default settings.
For more information on the commands provided for InService Monitoring, refer Monitoring
Commands on page 69.
The following table provides list of Monitor IDs and Device Instances for each of the Monitors
being monitored on ATCA-9405.
Table 4-24 Monitors
Monitor
Monitor Description
HDD Health Status 1010 sda1 and sda2 Monitors the Health Status of the
Network Errors 1020 eth0(62),eth1(63),eth2(
ID Valid Device Instances Remarks
sda1 to sda partitions on the
HDD and reports.
Monitors the various Error
64)
counters for each of the Network
Device Instances and provides an
error counter exceeds the rate of
change.
ViewCheck on ATCA-9405 Installation and Use (6806800S51E)
79
Page 80

Commands Execution
Table 4-24 Monitors (continued)
Monitor
Monitor Description
Network Counters 1021 eth0(62),eth1(63),eth2(
ID Valid Device Instances Remarks
64)
4.5.2 Monitoring Device Critical Errors
Under Linux OS, the Device Drivers LOG abnormal behavior and potential errors occurring in
the Hardware device with KERN_ERR or KERN_CRIT category. These notifications are
considered as potential errors as they could manifest into latent faults in the live system.
As part of monitoring the Device Critical errors, all such Kernel CRITICAL and Kernel ERROR
notifications have been extracted from the PNE Kernel (4.1) driver sources and represented in
the form of a database.
Monitors the various counters for
each of the Network Device
Instances
The In Service Monitoring Module of ViewCheck would watch out for the occurrence of these
notifications and on detection would send a notification to XML.
The Device Errors are captured and are identified uniquely by ERROR ID. For definition of
ERROR ID, refer Error ID on page 19.
4.6 OOSD Tests
OOSD Tests are used to monitor and manage the performance of the hardware components of
blades. You can execute these tests only when blades are offline, that is blades are not
providing any service. Details of the test is supported on SP or PP or both is mentioned with the
test name.
Before starting any PP related OOSD diagnostics test, make sure that VLAN interface
(example, eth1.21) reaching octeon is properly configured with an IP.
80
ViewCheck on ATCA-9405 Installation and Use (6806800S51E)
Page 81

4.6.1 CPU
CpuBurnTest (SP): CPUBurnTest constantly cycles FPU intensive functions.The resultant
OctBootTest (SP): This test boots the PPs into U-Boot. If the correct U-Boot prompt is
OctDDR2MemTest (SP): This test executes the hw-ddr2 memory test on Octeons with
Commands Execution
calculations are constantly checked for data integrity. If the test detects erroneous data,
the test fails.
detected, the test is passed.
ECC check. This includes below set of memory tests:
– Marching Rows
– Random Data Test
– Random XOR Test
– Self Address Test
– March C-Solid Bits Test
– March C-Checkerboard Test
– Walking Ones Left Test
– Walking Ones Right Test
– Walking Zeroes Left Test
– Walking Zeroes Right Test
– Random XOR Test
The OctDDR2Test (SP) tests memory up to 7692 Megabytes.
It does not check the memory range where boot loader and the test program itself resides.
OctRCStressTest (SP): This test executes the hw-rc stress test on Octeon cores for 2
minutes. This test tries to simultaneously run as much of it internal machinery as possible
by performing BIST status check of all cores.
CpuBenchMark: Tests different arithmetic operations and gives the results.
ViewCheck on ATCA-9405 Installation and Use (6806800S51E)
81
Page 82

Commands Execution
4.6.2 HDD
DiskBadBlksTest (SP): Searches for bad blocks on a device (usually a disk partition).
DiskCntlrTest (SP & PP): Verifies the random data written to disks remains unchanged. It
verifies only IDE and SCSI controllers that are associated with mounted file systems. Disk
controllers associated with read-only mounted file systems are not verified.
4.6.3 Memory
MemCntlrTest (SP & PP): Randomly writes to areas of memory, then reads the memory
back to ensure the written values remain unchanged.
RandomMemoryTest (SP & PP): Performs stress testing on the memory subsystem. This
test is effective in finding intermittent and non-deterministic faults. The problems in other
hardware areas such as overheating CPU, out-of-specification power supply, and so on can
cause memory faults.
MemBandwidth: Measures the ability to copy, read, and writer data over a varying set of
MemLatency: Measures the time taken by the memory to respond with the data for read-
4.6.4 OS
MemSepTest (SP & PP): Ensures that user space programs cannot read and write to areas
SupervisorInstrTest (SP): Ensures that the enforcement of the property that privileged
DmesgCheckTest (SP & PP): Checks for user given keywords in the kernel dmesg logs.
sizes.
request.
of memory utilized by items such as Video RAM and kernel code.
instructions should only be in supervisor mode is still in effect. The set of privileged
instructions tested to confirm this is architecture dependent.
82
ViewCheck on ATCA-9405 Installation and Use (6806800S51E)
Page 83

4.6.5 PCI
PCIScanTest (SP): Enumerates all active PCI devices in the blade and ensures board default
configuration is active. This test need to be executed under supervisory mode.
Executing this test in user mode may result in failure of test.
4.6.6 IPMC
IPMITest (SP): Executes basic IPMI commands and ensures the basic IPMI controller, IPMI
bus functionalities are working properly by reading the response back.
IPMCSENSOREVENTTest (SP): Verifies IPMC Event generation.
Commands Execution
4.6.7 NETWORK
EthLinkTest (SP & PP): Verifies Ethernet device (for example: eth0, eth1, eth2, etc...) link
status (active/inactive) and also captures various statistics of Ethernet device.
FloodPingTest (SP & PP): Uses the ICMP protocol’s mandatory ECHO_REQUEST
datagram to elicit an ICMP_ECHO_RESPONSE from a host or gateway.
EthStatsTest (SP): Tests basic network packet consistency that is checks network Rx, Tx
errors, generates a warning if errors are less than or equal to 100 and marks the test as fail
if number of errors are more than 100.
NetworkCntlrTest (SP): Verifies random data transmitted and also the data received for
each configured network device. It verifies only Ethernet and token ring devices that are
configured and active. The asynchronous devices are not verified.
SfpDetectionTest(SP): Enumerates all SFP modules connected to SFP ports of blade and
their operational speeds.
SwitchTempTest (SP): Gets the temperature (in degrees Celsius and can be negative) of
the Ethernet switch. Obtained temperature value will be compared with the minimum and
maximum values of the chipset given in the specification.
ViewCheck on ATCA-9405 Installation and Use (6806800S51E)
83
Page 84

Commands Execution
NwMemAcessTest (SP): Accesses various memory areas (listed below), accessible by the
device and performs Pattern read/write operations (incremental values, random values
and 0xAA, 0x55) on the memory area. This test ensures the device is able to access those
memories for read and write operations. Frequent failures of this test can be treated as
malfunctioning hardware.
Applicable memory types:
– Buffer DRAM
– MAC table memory
– VLAN table memory
NwCntlrRegAcessTest (SP): Tests the ability to read and write into device registers that
are accessible by writing various patterns ( 0xAA_0x55, Random value, Bit Toggle,
incremental) in to them. This test ensures the accessibility of registers by Switch. Frequent
failures of this test can be treated as malfunctioning hardware.
TcamSelfTest (SP): Invokes the built-in self test of the Ternary Content Addressable
Memory (TCAM) on both policy control lists and router sections. This test does not restore
data relevant TCAM area. This test ensures TCAM accessible to the switch. Frequent
failures of this test can be treated malfunctioning hardware.
The TcamSelfTest is destructive test and cannot be run during presence of network traffic.
Board reboot is required after every run of this test.
NetworkThroughputServ: Starts the server for network throughput testing.
NetworkThroughput: Tests the network throughput.
NetworkTxBenchMark (SP): Checks the transmission rate of interface
4.6.8 FPGA
CPLDTest (SP): This test checks the accessibility of the CPLD device by performing write
and read operations on scratch registers of CPLD device.
FPGATest (SP): This test checks the accessibility of the FPGA device, by performing write
and read operation on scratch registers of FPGA device.
84
ViewCheck on ATCA-9405 Installation and Use (6806800S51E)
Page 85

4.6.9 I2C
I2CProbeTest (SP): Mod-probes an i2c module and checks for default i2c devices on
4.6.10 USB
USBTest (SP): Accesses to USB partition repeatedly, reads and verifies the data.
4.6.11 RTC
RTCTest (SP): Checks for proper functioning of real time clock.
Commands Execution
board.
ViewCheck on ATCA-9405 Installation and Use (6806800S51E)
85
Page 86

Commands Execution
86
ViewCheck on ATCA-9405 Installation and Use (6806800S51E)
Page 87

Appendix A
A Related Documentation
A.1 Artesyn Embedded Technologies - Embedded
Computing Documentation
The publications listed below are referenced in this manual. You can obtain electronic copies of
Artesyn Embedded Technologies - Embedded Computing publications by contacting your
local Artesyn sales office. For released products, you can also visit our Web site for the latest
copies of our product documentation.
1. Go to www.artesyn.com/computing/support/product/technical-documentation.php.
2. Under FILTER OPTIONS, click the Document types drop-down list box to select the type of
document you are looking for.
3. In the Search text box, type the product name and click GO.
Table A-1 Artesyn Embedded Technologies - Embedded Computing Publications
Document Title Publication Number
ATCA-9405 BBS Programmer’s Reference 6806800R18F
ViewCheck on ATCA-9405 Installation and Use (6806800S51E)
87
Page 88

Related Documentation
88
ViewCheck on ATCA-9405 Installation and Use (6806800S51E)
Page 89

Page 90

Artesyn Embedded Technologies, Artesyn and the Artesyn Embedded Technologies logo are trademarks and service marks of Artesyn Embedded Technologies, Inc.
All other product or service names are the property of their respective owners.
©
2014 Artesyn Embedded Technologies, Inc.
 Loading...