

2 W Filterless Class-D
FEATURES
Filterless Class-D amplifier with built-in output stage
2 W into 4 Ω and 1.4 W into 8 Ω at 5.0 V supply with <10% THD
85% efficiency at 5.0 V, 1.4 W into 8 Ω speaker
Better than 98 dB SNR (signal-to-noise ratio)
Available in 16-lead, 3 mm × 3 mm LFCSP
Single-supply operation from 2.5 V to 5.0 V
20 nA ultralow shutdown current
Short-circuit and thermal protection
Pop-and-click suppression
Built-in resistors reduce board component count
Default fixed 18 dB gain and user-adjustable
APPLICATIONS
Notebooks and PCs
Mobile phones
MP3 players
Portable gaming
Portable electronics
Educational toys
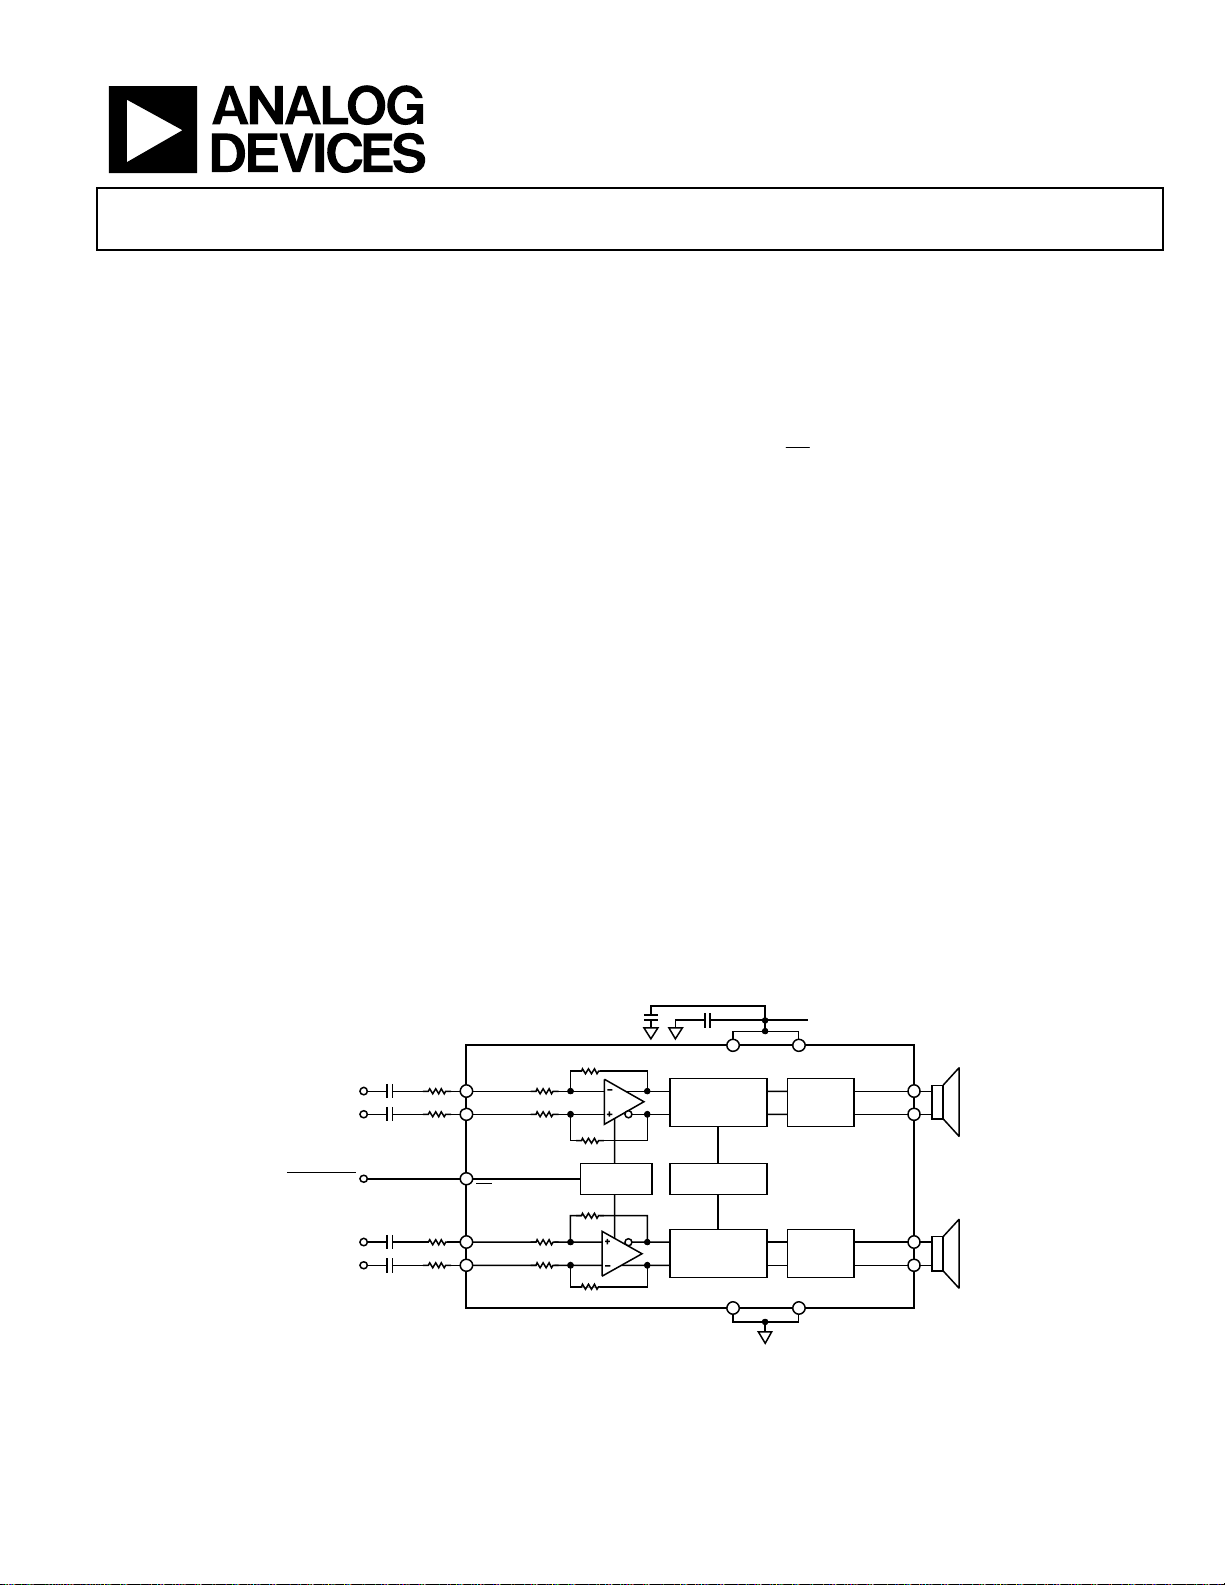
GENERAL DESCRIPTION
The SSM2304 is a fully integrated, high efficiency, Class-D stereo
audio amplifier. It is designed to maximize performance for
portable applications. The application circuit requires a minimum of external components and operates from a single 2.5 V
to 5.0 V supply. It is capable of delivering 2 W of continuous
output power with less than 10% THD + N driving a 4 Ω load
from a 5.0 V supply.
Stereo Audio Amplifier
SSM2304
The SSM2304 features a high efficiency, low noise modulation
scheme. It operates with 85% efficiency at 1.4 W into 8 Ω from a
5.0 V supply and has a signal-to-noise ratio (SNR) that is better
than 98 dB. PDM modulation is used to provide lower EMIradiated emissions compared with other Class-D architectures.
The SSM2304 has a micropower shutdown mode with a typical
shutdown current of 20 nA. Shutdown is enabled by applying a
logic low to the
The architecture of the device allows it to achieve a very low level
of pop and click. This minimizes voltage glitches at the output
during turn-on and turn-off, thus reducing audible noise on
activation and deactivation.
The fully differential input of the SSM2304 provides excellent
rejection of common-mode noise on the input. Input coupling
capacitors can be omitted if the dc input common-mode voltage
is approximately V
The SSM2304 also has excellent rejection of power supply noise,
including noise caused by GSM transmission bursts and RF
rectification.
The SSM2304 has a preset gain of 18 dB, which can be reduced
by using external resistors.
The SSM2304 is specified over the commercial temperature range
(−40°C to +85°C). It has built-in thermal shutdown and output
short-circuit protection. It is available in a 16-lead, 3 mm × 3 mm
lead-frame chip scale package (LFCSP).
SD
pin.
/2.
DD
FUNCTIONAL BLOCK DIAGRAM
Rext
Rext
Rext
Rext
SSM2304
INR+
INR–
SD
INL+
INL–
1
RIGHT IN+
RIGHT IN–
SHUTDOWN
LEFT IN+
LEFT IN–
GAIN = 300kΩ/ (47kΩ + Rext)
Rev. 0
Information furnished by Analog Devices is believed to be accurate and reliable. However, no
responsibility is assumed by Anal og Devices for its use, nor for any infringements of patents or ot her
rights of third parties that may result from its use. Specifications subject to change without notice. No
license is granted by implication or otherwise under any patent or patent rights of Analog Devices.
Trademarks and registered trademarks are the property of their respective owners.
22nF
1
22nF
1
22nF
1
22nF
1
INPUT CAPS ARE OPTIONAL I F INPUT DC COM MON-MODE
VOLTAGE IS APPRO XIMATELY V
47kΩ
47kΩ
47kΩ
47kΩ
DD
300kΩ
300kΩ
300kΩ
300kΩ
/2.
10µF
BIAS
Figure 1.
VBATT
0.1µF
MODULATOR
INTERNAL
OSCILLAT OR
MODULATOR
One Technology Way, P.O. Box 9106, Norwood, MA 02062-9106, U.S.A.
Tel: 781.329.4700 www.analog.com
Fax: 781.461.3113 ©2006 Analog Devices, Inc. All rights reserved.
2.5V TO 5. 0V
VDDVDD
FET
DRIVER
FET
DRIVER
GNDGND
OUTR+
OUTR–
OUTL+
OUTL–
06162-001

SSM2304
TABLE OF CONTENTS
Features .............................................................................................. 1
Applications....................................................................................... 1
General Description......................................................................... 1
Functional Block Diagram .............................................................. 1
Revision History ............................................................................... 2
Specifications..................................................................................... 3
Absolute Maximum Ratings............................................................ 4
Thermal Resistance ...................................................................... 4
ESD Caution.................................................................................. 4
Pin Configuration and Function Descriptions............................. 5
Typical Performance Characteristics ............................................. 6
Typical Applicat i o n C i rc uits.......................................................... 12
Application Notes ........................................................................... 13
Overview...................................................................................... 13
Gain Selection............................................................................. 13
Pop-and-Click Suppression ...................................................... 13
EMI Noise.................................................................................... 13
Layout .......................................................................................... 14
Input Capacitor Selection.......................................................... 14
Proper Power Supply Decoupling ............................................ 14
Evaluation Board Information...................................................... 15
Introduction................................................................................ 15
Board Description...................................................................... 15
Getting Started............................................................................ 18
What to Test ................................................................................ 18
PCB Layout Guidelines.............................................................. 19
Outline Dimensions ....................................................................... 20
Ordering Guide .......................................................................... 20
REVISION HISTORY
12/06—Revision 0: Initial Version
Rev. 0 | Page 2 of 20
SSM2304
SPECIFICATIONS
VDD = 5.0 V; TA = 25oC; RL = 4 Ω, 8 Ω; gain = 18 dB; unless otherwise noted.
Table 1.
Parameter Symbol Conditions Min Typ Max Unit
DEVICE CHARACTERISTICS
Output Power P
O
R
R
R
R
R
R
R
R
R
R
R
Efficiency η P
P
Total Harmonic Distortion + Noise THD + N PO = 2 W into 4 Ω each channel, f = 1 kHz, VDD = 5.0 V 0.2 %
P
Input Common-Mode Voltage Range V
CM
Common-Mode Rejection Ratio CMRR
Channel Separation
Average Switching Frequency f
Differential Output Offset Voltage V
X
TAL K
SW
OOS
POWER SUPPLY
Supply Voltage Range V
DD
Power Supply Rejection Ratio PSRR VDD = 2.5 V to 5.0 V, 70 85 dB
PSRR
Supply Current I
SY
V
V
Shutdown Current I
SD
GAIN
Closed-Loop Gain Av Rext = 0 18 dB
Differential Input Impedance Z
IN
SHUTDOWN CONTROL
Input Voltage High V
Input Voltage Low V
Turn-On Time t
Turn-Off Time t
Output Impedance Z
IH
IL
WU
SD
OUT
NOISE PERFORMANCE
Output Voltage Noise e
n
Signal-to-Noise Ratio SNR P
RL = 4 Ω, THD = 1%, f = 1 kHz, 20 kHz BW, VDD = 5.0 V 1.8 W
= 8 Ω, THD = 1%, f = 1 kHz, 20 kHz BW, VDD = 5.0 V 1.4 W
L
= 4 Ω, THD = 1%, f = 1 kHz, 20 kHz BW, VDD = 3.6 V 0.9 W
L
= 8 Ω, THD = 1%, f = 1 kHz, 20 kHz BW, VDD = 3.6 V 0.615 W
L
= 4 Ω, THD = 1%, f = 1 kHz, 20 kHz BW, VDD = 2.5 V 0.35 W
L
= 8 Ω, THD = 1%, f = 1 kHz, 20 kHz BW, VDD = 2.5 V 0.275 W
L
= 4 Ω, THD = 10%, f = 1 kHz, 20 kHz BW, VDD = 5.0 V 2.4 W
L
= 8 Ω, THD = 10%, f = 1 kHz, 20 kHz BW, VDD = 5.0 V 1.53 W
L
= 4 Ω, THD = 10%, f = 1 kHz, 20 kHz BW, VDD = 3.6 V 1.1 W
L
= 8 Ω, THD = 10%, f = 1 kHz, 20 kHz BW, VDD = 3.6 V 0.77 W
L
= 4 Ω, THD = 10%, f = 1 kHz, 20 kHz BW, VDD = 2.5 V 0.45 W
L
= 8 Ω, THD = 10%, f = 1 kHz, 20 kHz BW, VDD = 2.5 V 0.35 W
L
= 2 W, 4 Ω, VDD = 5.0 V 75 %
OUT
= 1.4 W, 8 Ω, VDD = 5.0 V 85 %
OUT
= 1 W into 8 Ω each channel, f = 1 kHz, VDD = 3.6 V 0.25 %
O
1.0 VDD − 1 V
GSMVCM
= 2.5 V ± 100 mV at 217 Hz 60 dB
PO = 100 mW , f = 1 kHz 78 dB
1.8 MHz
2.0 mV
Guaranteed from PSRR test 2.5 5.0 V
GSM
V
= 100 mV rms at 217 Hz, inputs ac GND,
RIPPLE
= 0.01 μF, input referred
C
IN
68 dB
VIN = 0 V, no load, VDD = 5.0 V 7.0 mA
= 0 V, no load, VDD = 3.6 V 6.5 mA
IN
= 0 V, no load, VDD = 2.5 V 5.2 mA
IN
SD
= GND
SD
= VDD
20 nA
47 kΩ
ISY ≥ 1 mA 1.2 V
ISY ≤ 300 nA 0.5 V
SD
rising edge from GND to V
SD
falling edge from VDD to GND
SD
= GND
DD
VDD = 3.6 V, f = 20 Hz to 20 kHz, inputs are ac
grounded, A
= 2.0 W, RL = 4 Ω 102 dB
OUT
= 6 dB, RL = 4 Ω, A weighting
V
30 ms
5 μs
>100 kΩ
22 μV
Rev. 0 | Page 3 of 20
SSM2304
ABSOLUTE MAXIMUM RATINGS
Absolute maximum ratings apply at 25°C, unless otherwise noted.
Table 2.
Parameter Rating
Supply Voltage 6 V
Input Voltage V
Common-Mode Input Voltage V
ESD Susceptibility 4 kV
Storage Temperature Range −65°C to +150°C
Operating Temperature Range −40°C to +85°C
Junction Temperature Range −65°C to +165°C
Lead Temperature Range
(Soldering, 60 sec)
DD
DD
300°C
Stresses above those listed under Absolute Maximum Ratings
may cause permanent damage to the device. This is a stress
rating only; functional operation of the device at these or any
other conditions above those indicated in the operational
section of this specification is not implied. Exposure to absolute
maximum rating conditions for extended periods may affect
device reliability.
THERMAL RESISTANCE
θJA is specified for the worst-case conditions, that is, a device
soldered in a circuit board for surface-mount packages.
Table 3. Thermal Resistance
Package Type θ
16-lead, 3 mm × 3 mm LFCSP 44 31.5 °C/W
θ
JA
Unit
JC
ESD CAUTION
Rev. 0 | Page 4 of 20
SSM2304
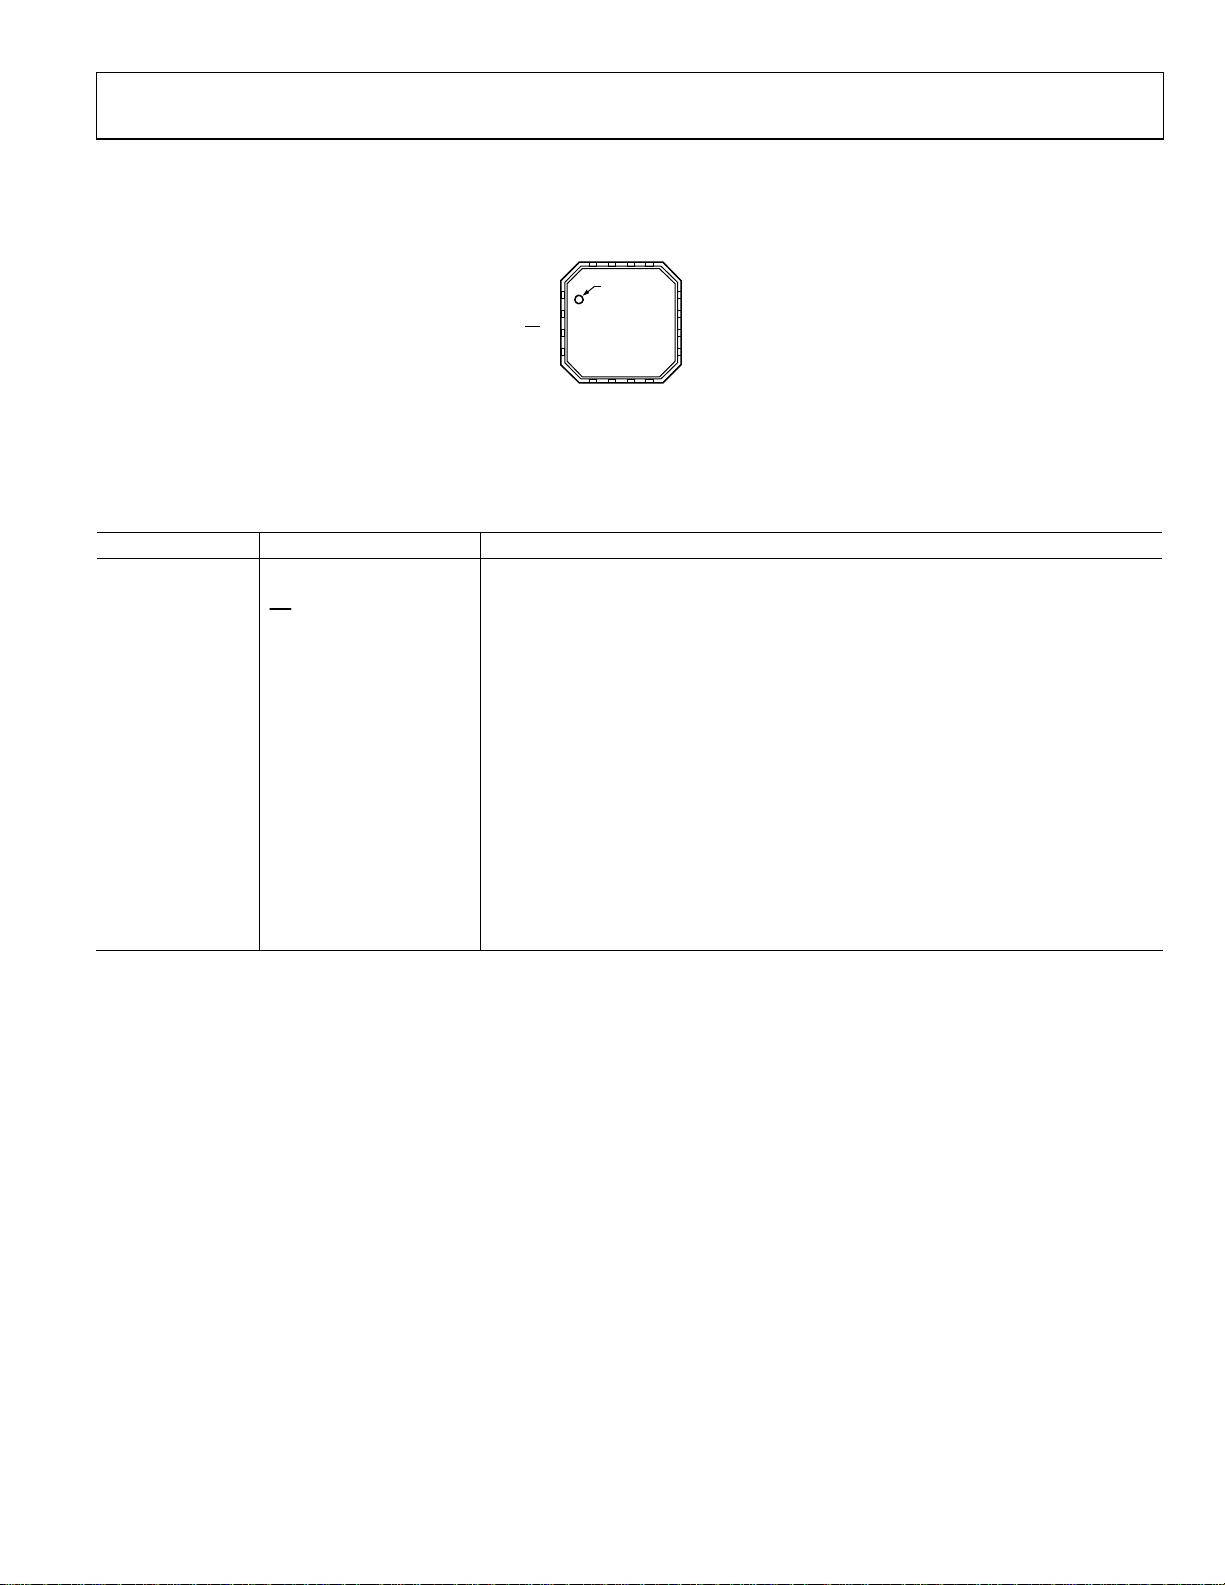
PIN CONFIGURATION AND FUNCTION DESCRIPTIONS
ND
VDD
GND
G
VDD
14
13
16
15
PIN 1
INDICATOR
1OUTL+
2OUTL–
SSM2304
3SD
TOP VIEW
(Not to Scale)
4INL+
5
6
NC
INL–
NC = NO CONNECT
Figure 2. SSM2304 LFCSP Pin Configuration
Table 4. Pin Function Descriptions
Pin No. Mnemonic Description
1 OUTL+ Inverting Output for Left Channel.
2 OUTL− Noninverting Output for Left Channel.
3
SD
Shutdown Input. Active low digital input.
4 INL+ Noninverting Input for Left Channel.
5 INL− Inverting Input for Left Channel.
6 NC No Connect.
7 NC No Connect.
8 INR− Inverting Input for Right Channel.
9 INR+ Noninverting Input for Right Channel.
10 NC No Connect
11 OUTR− Noninverting Output for Right Channel.
12 OUTR+
Inverting Output for Right Channel.
13 GND Ground for Output Amplifiers.
14 VDD Power Supply for Output Amplifiers.
15 VDD Power Supply for Output Amplifiers.
16 GND Ground for Output Amplifiers.
12 OUTR+
11 OU TR–
10 NC
9INR+
8
7
NC
INR–
6162-002
Rev. 0 | Page 5 of 20
SSM2304
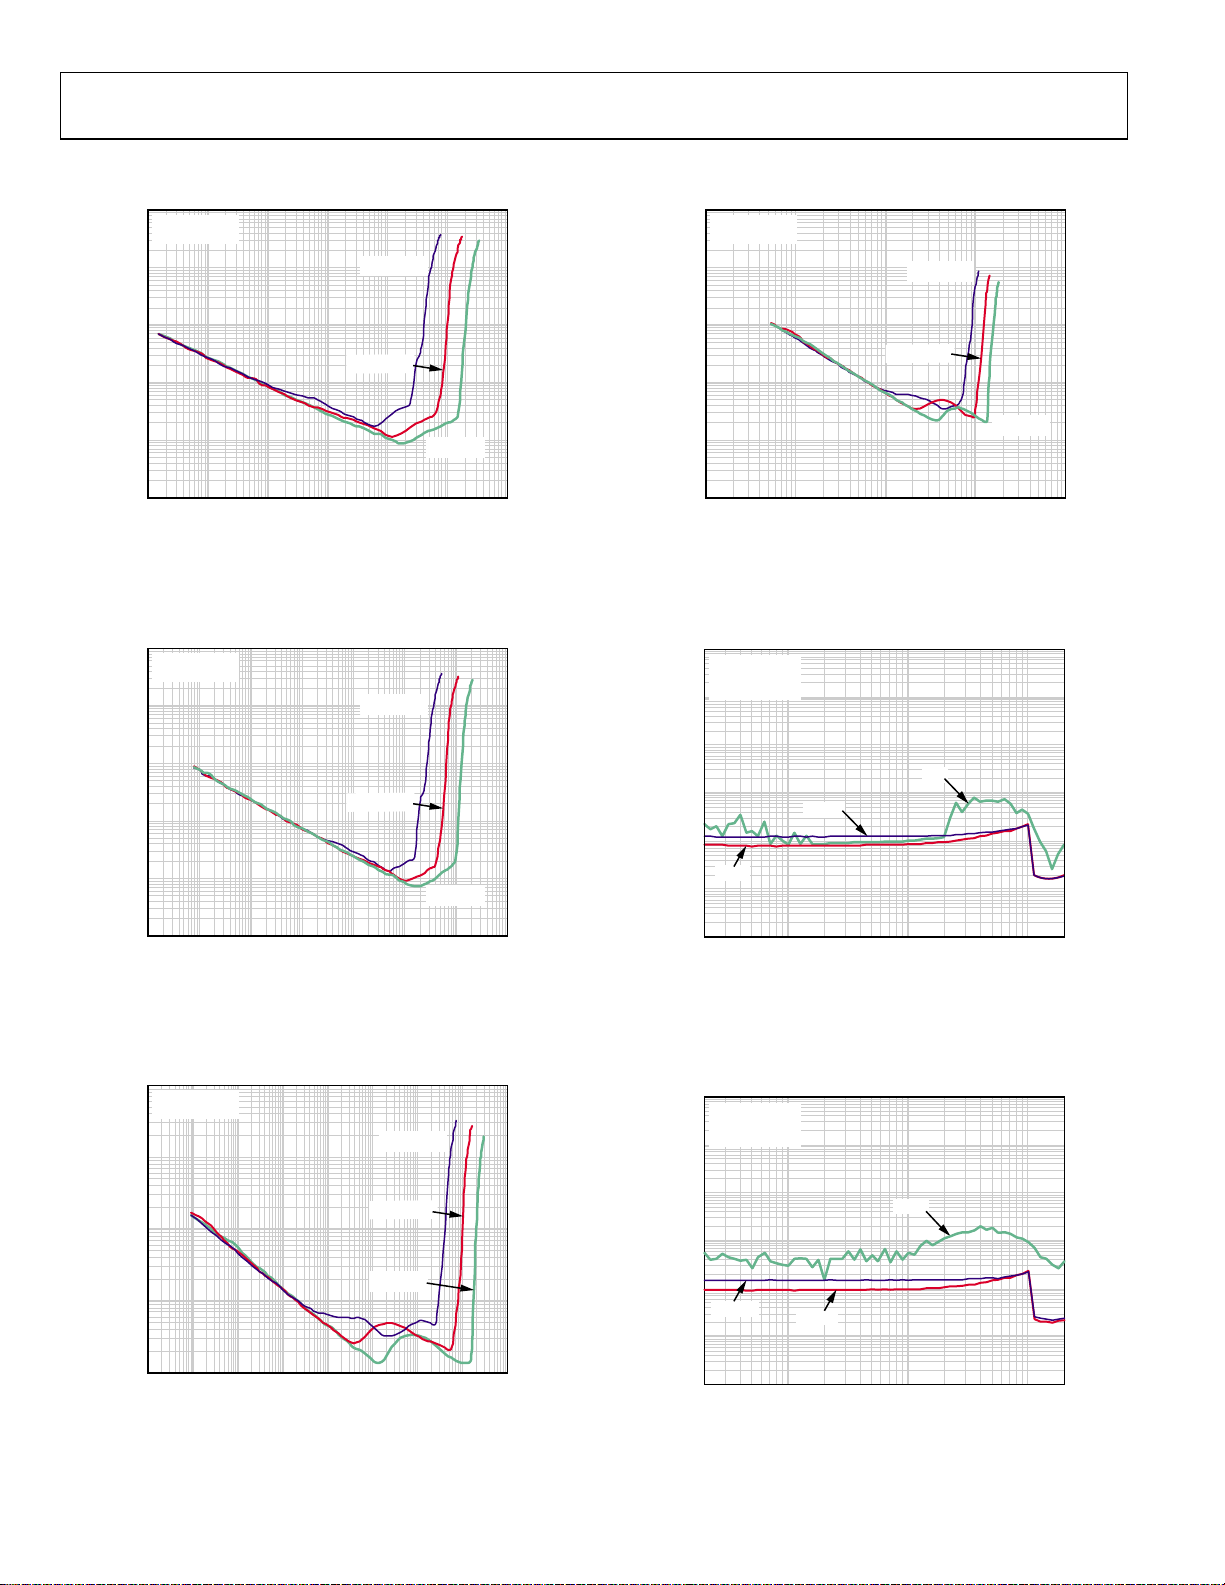
TYPICAL PERFORMANCE CHARACTERISTICS
100
10
RL = 4Ω, 33µH
GAIN = 18dB
VDD = 2.5V
100
10
RL = 8Ω, 33µH
GAIN = 6dB
VDD = 2.5V
1
VDD = 3.6V
THD + N (%)
0.01
0.001
0.1
0.00010.00001 10
0.001 0. 01 0.1 1
OUTPUT PO WER (W)
Figure 3. THD + N vs. Output Power into 4 Ω, A
100
RL = 8Ω, 33µH
GAIN = 18dB
10
1
0.1
THD + N (%)
0.01
VDD = 3.6V
VDD = 2.5V
VDD = 5V
= 18 dB
V
VDD = 5V
1
VDD = 3.6V
0.1
THD + N (%)
0.01
0.001
06162-020
0.000010.0000001 10
0.001 0.1
OUTPUT PO WER (W)
Figure 6. THD + N vs. Output Power into 8 Ω, A
100
VDD = 5V
R
= 8Ω, 33µH
L
GAIN = 6dB
10
1
1W
THD + N (%)
0.01
0.001
0.1
0.25W
0.5W
VDD = 5V
= 6 dB
V
06162-004
0.001
0.000001 0.00010.00001 10
Figure 4. THD + N vs. Output Power into 8 Ω, A
100
RL = 4Ω, 33µH
GAIN = 6dB
10
1
THD + N (%)
0.1
0.01
0.000001 0.0001
0.0000001
0.00001 10
Figure 5. THD + N vs. Output Power into 4 Ω, A
0.001 0.01 0.1 1
OUTPUT PO WER (W)
VDD = 2.5V
VDD = 3.6V
VDD = 5V
0.01
0.001
OUTPUT PO WER (W)
0.1
= 18 dB
V
1
= 6 dB
V
06162-003
06162-021
Rev. 0 | Page 6 of 20
0.0001
20 20k
Figure 7. THD + N vs. Frequency, V
100
VDD = 3.6V
R
GAIN = 6dB
10
1
0.1
THD + N (%)
0.01
0.125W
0.001
0.0001
20 20k
Figure 8. THD + N vs. Frequency, V
100 1k 10k
FREQUENCY (Hz)
DD
= 8Ω, 33µH
L
0.5W
0.25W
100 1k 10k
FREQUENCY (Hz)
= 3.6 V, RL = 8 Ω, AV = 6 dB
DD
= 5 V, RL = 8 Ω, AV = 6 dB
06162-005
06162-006

SSM2304
100
THD + N (%)
0.01
0.001
10
1
0.1
VDD = 2.5V
R
= 8Ω, 33µH
L
GAIN = 6dB
0.25W
0.125W
0.075W
100
THD + N (%)
0.01
0.001
10
1
0.1
VDD = 2.5V
= 4Ω, 33µH
R
L
GAIN = 6dB
0.25W
0.5W
0.125W
0.0001
20 20k
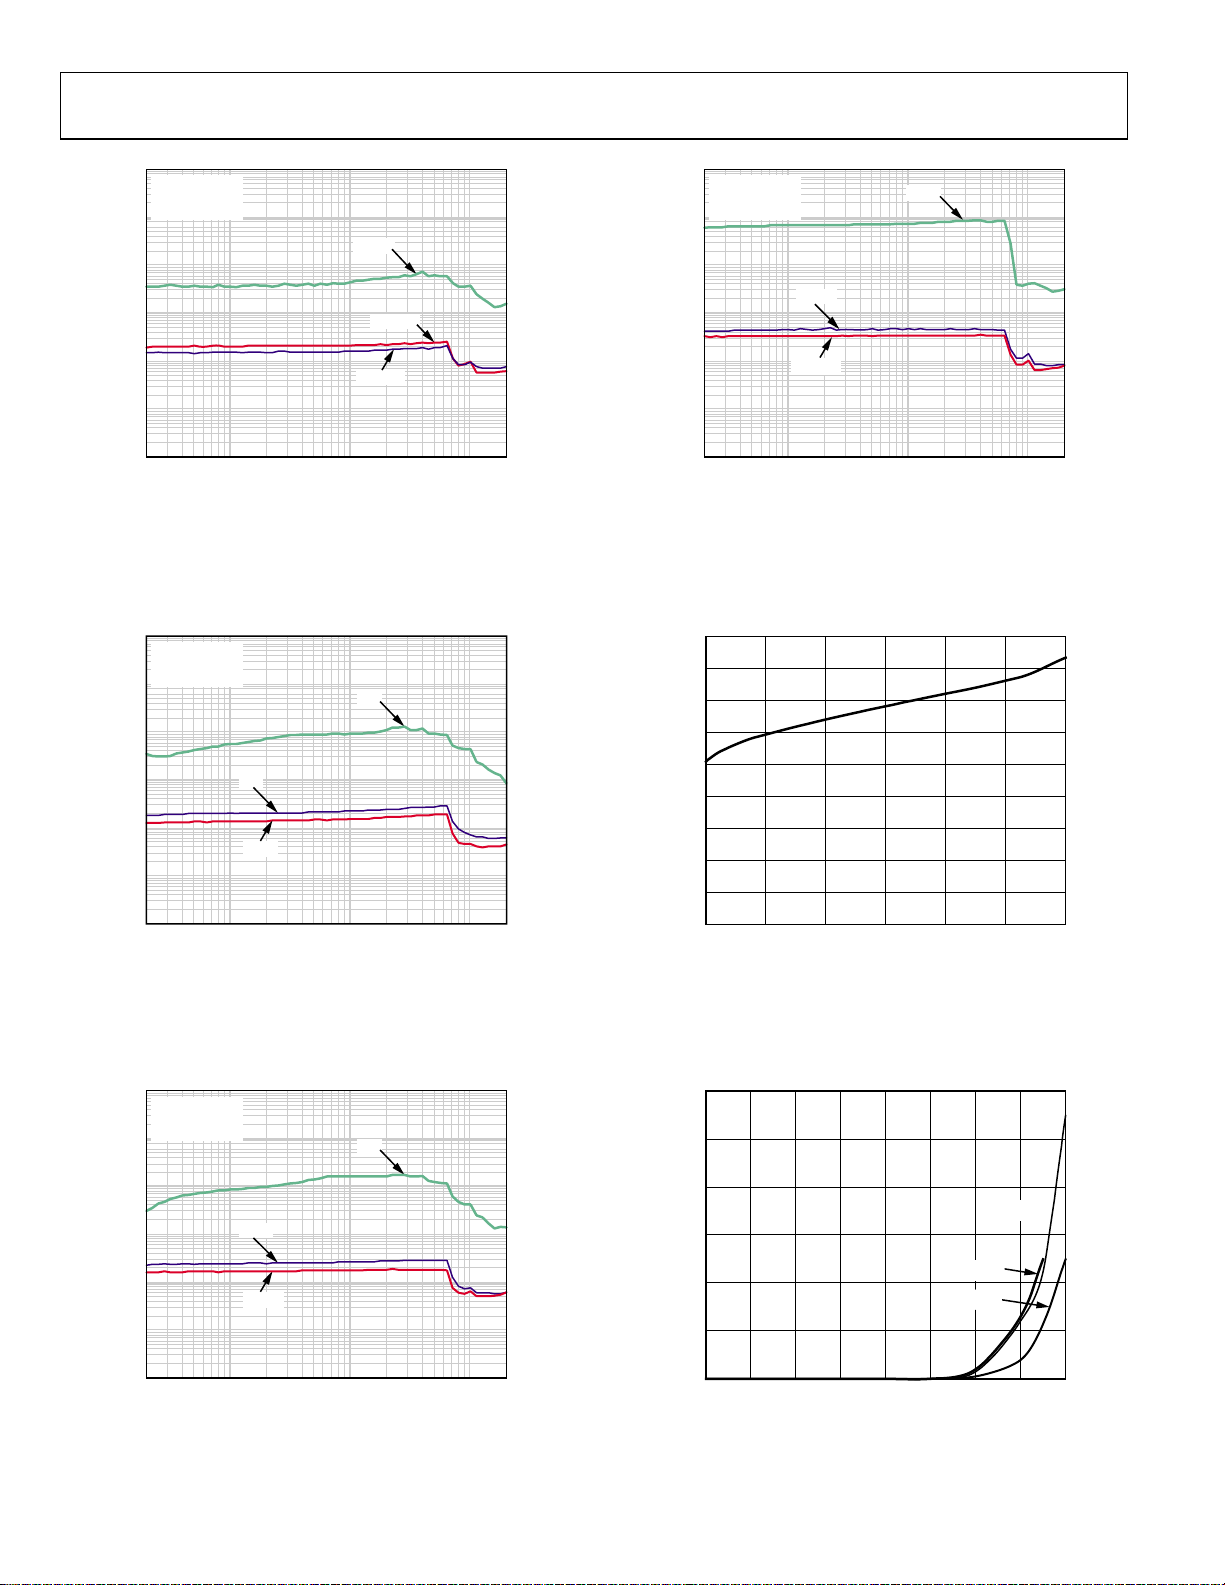
Figure 9. THD + N vs. Frequency, V
100
VDD = 5V
R
GAIN = 6dB
10
1
0.1
THD + N (%)
0.01
0.001
0.0001
20 20k
Figure 10. THD + N vs. Frequency, V
100 1k 10k
FREQUENCY (Hz)
= 2.5 V, RL = 8 Ω, AV = 6 dB
DD
= 4Ω, 33µH
L
100 1k 10k
FREQUENCY (Hz)
DD
2W
1W
= 5 V, RL = 4 Ω, AV = 6 dB
0.5W
0.0001
20 20k
06162-007
Figure 12. THD + N vs. Frequency, V
100
VDD = 5V
R
GAIN = 18dB
10
1
0.1
THD + N (%)
0.01
0.001
0.0001
20 20k
06162-022
Figure 13. THD + N vs. Frequency, V
100 1k 10k
FREQUENCY (Hz)
= 2.5 V, RL = 4 Ω, AV = 6 dB
DD
= 8Ω, 33µH
L
0.5W
0.25W
100 1k 10k
FREQUENCY (Hz)
DD
1W
= 5 V, RL = 8 Ω, AV = 18 dB
06162-024
06162-025
100
VDD = 3.6V
= 4Ω, 33µH
R
L
GAIN = 6dB
10
1
0.1
THD + N (%)
0.01
0.001
0.0001
0.25W
0.5W
20 20k
100 1k 10k
FREQUENCY (Hz)
Figure 11. THD + N vs. Frequency, V
1W
= 3.6 V, RL = 4 Ω, AV = 6 dB
DD
06162-023
Rev. 0 | Page 7 of 20
100
VDD = 3.6V
= 8Ω, 33µH
R
L
GAIN = 18dB
10
1
0.1
THD + N (%)
0.01
0.001
0.0001
20 20k
100 1k 10k
FREQUENCY (Hz)
Figure 14. THD + N vs. Frequency, V
0.5W
0.25W
0.125W
= 3.6 V, RL = 8 Ω, AV = 18 dB
DD
06162-026
SSM2304
THD + N (%)
0.01
0.001
100
10
1
0.1
VDD = 2.5V
= 8Ω, 33µH
R
L
GAIN = 18dB
0.25W
0.125W
0.075W
THD + N (%)
0.01
0.001
100
10
1
0.1
VDD = 2.5V
= 4Ω, 33µH
R
L
GAIN = 18dB
0.5W
0.25W
0.125W
0.0001
20 20k
Figure 15. THD + N vs. Frequency, V
100
VDD = 5V
R
GAIN = 18dB
10
1
0.1
THD + N (%)
0.01
0.001
0.0001
20 20k
Figure 16. THD + N vs. Frequency, V
100 1k 10k
FREQUENCY (Hz)
= 2.5 V, RL = 8 Ω, AV = 18 dB
DD
= 4Ω, 33µH
L
1W
0.5W
100 1k 10k
FREQUENCY (Hz)
DD
2W
= 5 V, RL = 4 Ω, AV = 18 dB
0.0001
20 20k
06162-027
Figure 18. THD + N vs. Frequency, V
9
8
7
6
5
4
3
SUPPLY CURRENT (mA)
2
1
0
2.5 5.5
06162-028
100 1k 10k
FREQUENCY (Hz)
= 2.5 V, RL = 4 Ω, AV = 18 dB
DD
3.0 3.5 4.0 4.5 5.0
SUPPLY VOLTAGE (V)
06162-041
06162-008
Figure 19. Supply Current vs. Supply Voltage, No Load
100
VDD = 3.6V
= 4Ω, 33µH
R
L
GAIN = 18dB
10
1
0.1
THD + N (%)
0.01
0.001
0.0001
20 20k
0.5W
0.25W
100 1k 10k
FREQUENCY (Hz)
Figure 17. THD + N vs. Frequency, V
1W
= 3.6 V, RL = 4 Ω, AV = 18 dB
DD
06162-029
Rev. 0 | Page 8 of 20
12
10
8
VDD = 5V
6
4
SHUTDOWN CURRENT (µ A)
2
0
0.1 0.2 0.3 0.4 0. 5 0.6 0.7
00
SHUTDOWN VOL TAGE (V)
VDD = 2.5V
VDD = 3.6V
.8
06162-009
Figure 20. Supply Current vs. Shutdown Voltage

SSM2304
3.0
f
1.8
f
= 1kHz
GAIN = 6dB
1.6
R
= 8Ω, 15µH
L
1.4
1.2
1.0
0.8
0.6
OUTPUT POW ER (W)
0.4
0.2
0
3.6 5.0
10%
1%
SUPPLY VOLTAGE (V)
Figure 21. Maximum Output Power vs. Supply Voltage, R
4.84.64.44.24.03.8
= 8 Ω, AV = 6 dB
L
06162-010
Figure 24. Maximum Output Power vs. Supply Voltage, R
= 1kHz
GAIN = 18dB
= 4Ω, 15µH
R
L
2.5
2.0
1.5
1.0
OUTPUT POWER (W)
0.5
0
3.6 5.0
10%
1%
SUPPLY VOLTAGE (V)
L
4.84.64.44.24.03.8
06162-062
= 4 Ω, AV = 18 dB
3.0
f
= 1kHz
GAIN = 6dB
R
= 4Ω, 15µH
L
2.5
2.0
1.5
1.0
OUTPUT POW ER (W)
0.5
0
3.6 5.0
10%
1%
SUPPLY VOLTAGE (V)
4.84.64.44.24.03.8
06162-060
Figure 22. Maximum Output Power vs. Supply Voltage, RL = 4 Ω, AV = 6 dB
1.8
f
= 1kHz
GAIN = 18dB
1.6
= 8Ω, 15µH
R
L
1.4
1.2
1.0
0.8
0.6
OUTPUT POWER (W)
0.4
0.2
0
3.6 5.0
10%
SUPPLY VOLTAGE (V)
1%
4.84.64.44.24.03.8
06162-061
Figure 23. Maximum Output Power vs. Supply Voltage, RL = 8 Ω, AV = 18 dB
Rev. 0 | Page 9 of 20
100
RL = 4Ω, 15µH
90
80
70
60
VDD = 2.5V
50
40
EFFICIENCY (%)
30
20
10
0
0
0.2 0.60.4 0.8 1.0 1.2 1.4 1.6 2.01.8
0.1 0.3 0.5 0.7 0.9 1.1 1.3 1.5 1. 7 1.9
VDD = 3.6V
OUTPUT PO WER (W)
VDD = 5V
2.1
06162-042
Figure 25. Efficiency vs. Output Power into 4 Ω
100
RL = 8Ω, 15µH
90
80
70
VDD = 2.5V
60
50
40
EFFICIENCY (%)
30
20
10
0
02
0.2 0.4 0.6 0.8 1. 0 1.2 1. 4 1.6 1.8
VDD = 3.6V
OUTPUT PO WER (W)
VDD = 5V
.0
06162-011
Figure 26. Efficiency vs. Output Power into 8 Ω

SSM2304
1.0
VDD = 3.6V
R
= 8Ω, 33µH
0.9
L
0.8
0.7
0.6
0.5
0.4
0.3
POWER DISSI PATION (W )
0.2
0.1
0
00
0.1 0.2 0.3 0.4 0.5 0. 6 0.7
OUTPUT PO WER (W)
Figure 27. Power Dissipation vs. Output Power at V
= 3.6 V, RL = 8 Ω
DD
.8
06162-012
3.0
VDD = 5V
R
= 4Ω, 15µH
L
2.5
2.0
1.5
1.0
POWER DISSIPATION (W)
0.5
0
0 0.2 0.4 0.6 0.8 1.0 1.2 1.4 1.6 1.8 2.0
OUTPUT PO WER (W)
Figure 30. Power Dissipation vs. Output Power at V
= 5.0 V, RL = 8 Ω
DD
06162-063
1.8
VDD = 5V
R
= 8Ω, 33µH
L
1.6
1.4
1.2
1.0
0.8
0.6
POWER DISSI PATION (W )
0.4
0.2
0
0.1 0.2 0.3 0.4 0.5 0.6 0.7 0.8 0.9 1.0 1.1 1.2
01
OUTPUT PO WER (W)
Figure 28. Power Dissipation vs. Output Power at V
1.8
VDD = 3.6V
R
= 4Ω, 15µH
L
1.6
1.4
1.2
1.0
0.8
0.6
POWER DISSI PATIO N (W)
0.4
0.2
0
0 0.1 0.2 0.3 0.4 0.5 0.6 0.7 0.8 0.9 1.0 1.1 1.2
OUTPUT PO WER (W)
Figure 29. Power Dissipation vs. Output Power at V
= 5.0 V, RL = 8 Ω
DD
= 3.6 V, RL = 4 Ω
DD
.3
06162-013
06162-064
400
RL = 8Ω, 33µH
350
300
250
200
VDD = 2.5V
150
SUPPLY CURRENT (mA)
100
50
0
01.6
Figure 31. Output Power vs. Supply Current, One Channel
0
–10
–20
–30
–40
–50
PSRR (dB)
–60
–70
–80
–90
–100
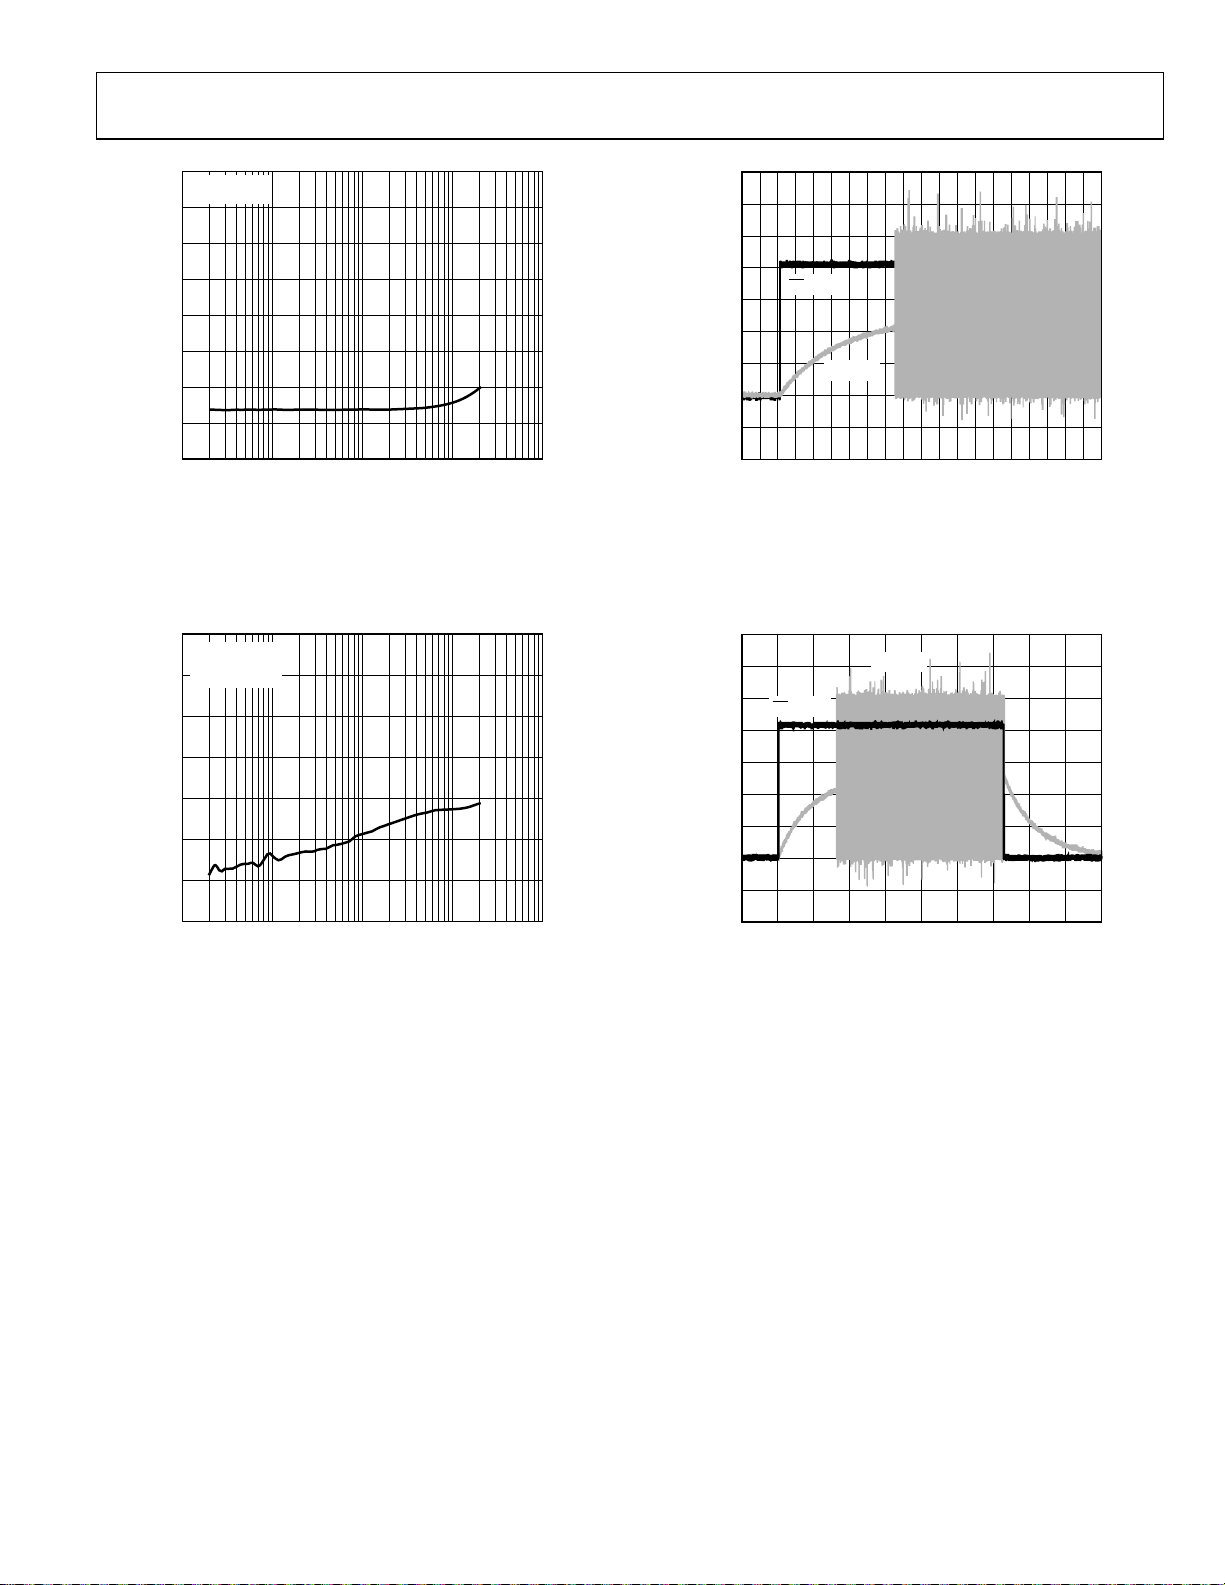
10 100k
Figure 32. Power Supply Rejection Ratio vs. Frequency
Rev. 0 | Page 10 of 20
VDD = 5V
VDD = 3.6V
0.2 0.4 0.6 0.8 1. 0 1.2 1.4
OUTPUT PO WER (W)
100 1k 10k
FREQUENCY (Hz)
06162-014
06162-015
SSM2304
0
RL = 8Ω, 33µH
GAIN = 6dB
–10
–20
–30
–40
CMRR (dB)
–50
–60
–70
–80
10 100k
100 1k 10k
FREQUENCY (Hz)
Figure 33. Common-Mode Rejection Ratio vs. Frequency
06162-016
7
6
5
4
SD INPUT
3
2
VOLTAGE
1
0
–1
–2
–5 0 5 10 15 20 25 30 35 40 45 50 55 60 65 70 75 80 85
–10 90
OUTPUT
TIME (ms)
Figure 35. Turn-On Response
06162-018
0
VDD = 3.6V
= 1V rms
V
RIPPLE
–20
= 8Ω, 33µH
R
L
–40
–60
–80
CROSSTALK (dB)
–100
–120
–140
10 100k
100 1k 10k
FREQUENCY (Hz)
Figure 34. Crosstalk vs. Frequency
06162-017
7
6
5
SD INPUT
4
3
2
VOLTAGE
1
0
–1
–2
0 20 40 60 80 100 120 140 160
–20 180
OUTPUT
TIME (ms)
Figure 36. Turn-Off Response
06162-019
Rev. 0 | Page 11 of 20

SSM2304
TYPICAL APPLICATION CIRCUITS
10µF
0.1µF
VBATT
2.5V TO 5. 0V
VDDVDD
DRIVER
DRIVER
GNDGND
FET
FET
OUTR+
OUTR–
OUTL+
OUTL–
06162-030
RIGHT IN+
RIGHT IN–
SHUTDOWN
LEFT IN+
LEFT IN–
SSM2304
1
22nF
Rext
INR+
INR–
Rext
1
22nF
SD
1
22nF
Rext
INL+
INL–
Rext
1
22nF
1
INPUT CAPS ARE O PTIONAL IF INPUT DC COMMON-M ODE
VOLTAGE IS APPROXIMATELY V
BIAS
/2.
DD
MODULATOR
INTERNAL
OSCILLATOR
MODULATOR
Figure 37. Stereo Differential Input Configuration
0.1µF
MODULATOR
VBATT
2.5V TO 5. 0V
VDDVDD
FET
DRIVER
OUTR+
OUTR–
RIGHT IN
22nF
22nF
Rext
Rext
10µF
SSM2304
INR+
INR–
SHUTDOWN
LEFT IN
22nF
22nF
Rext
Rext
SD
INL+
INL–
BIAS
INTERNAL
OSCILLATOR
MODULATOR
DRIVER
GNDGND
FET
OUTL+
OUTL–
06162-031
Figure 38. Stereo Single-Ended Input Configuration
Rev. 0 | Page 12 of 20

SSM2304
APPLICATION NOTES
OVERVIEW
The SSM2304 stereo Class-D audio amplifier features a filterless
modulation scheme that greatly reduces the external components
count, conserving board space and thus reducing systems cost.
The SSM2304 does not require an output filter, but instead relies
on the inherent inductance of the speaker coil and the natural
filtering of the speaker and human ear to fully recover the audio
component of the square-wave output. While most Class-D amplifiers use some variation of pulse-width modulation (PWM), the
SSM2304 uses a Σ-Δ modulation to determine the switching
pattern of the output devices. This provides a number of important
benefits. Σ-Δ modulators do not produce a sharp peak with
many harmonics in the AM frequency band, as pulse-width
modulators often do. Σ-Δ modulation provides the benefits of
reducing the amplitude of spectral components at high frequencies;
that is, reducing EMI emission that might otherwise be radiated
by speakers and long cable traces. The SSM2304 also offers
protection circuits for overcurrent and temperature protection.
GAIN SELECTION
The SSM2304 has a pair of internal resistors that set an 18 dB
default gain for the amplifier.
It is possible to adjust the SSM2304 gain by using external resistors
at the input. To set a gain lower than 18 dB refer to
differential input configuration and
Figure 38 for single-ended
Figure 37 for
configuration. The external gain configuration is calculated as
External Gain Settings = 376 kΩ/(47 kΩ + Rext)
POP-AND-CLICK SUPPRESSION
Voltage transients at the output of audio amplifiers can occur when
shutdown is activated or deactivated. Voltage transients as low
as 10 mV can be heard as an audio pop in the speaker. Clicks
and pops can also be classified as undesirable audible transients
generated by the amplifier system, therefore as not coming from
the system input signal. Such transients can be generated when
the amplifier system changes its operating mode. For example, the
following can be sources of audible transients: system power-up/
power-down, mute/unmute, input source change, and sample rate
change. The SSM2304 has a pop-and-click suppression architecture
that reduces these output transients, resulting in noiseless activation
and deactivation.
EMI NOISE
The SSM2304 uses a proprietary modulation and spreadspectrum technology to minimize EMI emissions from the
device.
Figure 39 shows SSM2304 EMI emission starting from
100 kHz to 30 MHz.
from 30 kHz to 2 GHz. These figures clearly describe the SSM2304
EMI behavior as being well below the FCC regulation values,
starting from 100 kHz and passing beyond 1 GHz of frequency.
Although the overall EMI noise floor is slightly higher, frequency
spurs from the SSM2304 are greatly reduced.
70
60
50
40
30
LEVEL (dB(µV/m))
20
10
0
0.1 100
70
60
50
40
30
LEVEL (dB(µV/m))
20
10
0
10 10k
The measurements for Figure 39 and Figure 40 were taken with
a 1 kHz input signal, producing 0.5 W output power into an 8 Ω
load from a 3.6 V supply. Cable length was approximately 5 cm.
The EMI was detected using a magnetic probe touching the 2”
output trace to the load.
Figure 40 shows SSM2304 EMI emission
= HORIZONT AL
= VERTICAL
= REGULATION VALUE
110
FREQUENCY (MHz)
Figure 39. EMI Emissions from SSM2304
= HORIZONT AL
= VERTICAL
= REGULATION VALUE
100 1k
FREQUENCY (MHz)
Figure 40. EMI Emissions from SSM2304
06162-032
06162-033
Rev. 0 | Page 13 of 20

SSM2304
LAYOUT
As output power continues to increase, care needs to be taken to
lay out PCB traces and wires properly between the amplifier,
load, and power supply. A good practice is to use short, wide
PCB tracks to decrease voltage drops and minimize inductance.
Make track widths at least 200 mil for every inch of track length
for lowest DCR, and use 1 oz or 2 oz of copper PCB traces to
further reduce IR drops and inductance. A poor layout
increases voltage drops, consequently affecting efficiency. Use
large traces for the power supply inputs and amplifier outputs to
minimize losses due to parasitic trace resistance. Proper
grounding guidelines helps to improve audio performance,
minimize crosstalk between channels, and prevent switching
noise from coupling into the audio signal. To maintain high
output swing and high peak output power, the PCB traces that
connect the output pins to the load and supply pins should be as
wide as possible to maintain the minimum trace resistances. It
is also recommended to use a large-area ground plane for
minimum impedances. Good PCB layouts also isolate critical
analog paths from sources of high interference. High frequency
circuits (analog and digital) should be separated from low
frequency ones. Properly designed multilayer printed circuit
boards can reduce EMI emission and increase immunity to RF
field by a factor of 10 or more compared with double-sided
boards. A multilayer board allows a complete layer to be used
for ground plane, whereas the ground plane side of a doubleside board is often disrupted with signal crossover. If the system
has separate analog and digital ground and power planes, the
analog ground plane should be underneath the analog power
plane, and, similarly, the digital ground plane should be
underneath the digital power plane. There should be no overlap
between analog and digital ground planes nor analog and
digital power planes.
INPUT CAPACITOR SELECTION
The SSM2304 will not require input coupling capacitors if the
input signal is biased from 1.0 V to V
capacitors are required if the input signal is not biased within
this recommended input dc common-mode voltage range, if
high-pass filtering is needed (
ended source (
input, the input capacitor along with the input resistor of the
SSM2304 will form a high-pass filter whose corner frequency is
determined by the following equation:
= 1/(2π × RIN × CIN)
f
C
Input capacitor can have very important effects on the circuit
performance. Not using input capacitors degrades the output
offset of the amplifier as well as the PSRR performance.
Figure 38). If high-pass filtering is needed at the
Figure 37), or if using a single-
− 1.0 V. Input
DD
PROPER POWER SUPPLY DECOUPLING
To ensure high efficiency, low total harmonic distortion (THD),
and high PSRR, proper power supply decoupling is necessary.
Noise transients on the power supply lines are short-duration
voltage spikes. Although the actual switching frequency can
range from 10 kHz to 100 kHz, these spikes can contain
frequency components that extend into the hundreds of
megahertz. The power supply input needs to be decoupled with
a good quality low ESL and low ESR capacitor—usually around
4.7 μF. This capacitor bypasses low frequency noises to the
ground plane. For high frequency transients noises, use a 0.1 μF
capacitor as close as possible to the VDD pin of the device.
Placing the decoupling capacitor as close as possible to the
SSM2304 helps maintain efficiency performance.
Rev. 0 | Page 14 of 20

SSM2304
EVALUATION BOARD INFORMATION
INTRODUCTION
This section describes how to configure and use the SSM2304
Evaluation Board Revision 3.0.
There are several ways to connect the audio signal to the
amplifier on the evaluation board. For example, the signal can
be connected in single-ended or differential mode, and the
output signals can be taken either after the ferrite beads or the
inductors.
BOARD DESCRIPTION
The SSM2304 evaluation board has a complete application
circuit for driving two stereo loudspeakers.
The silkscreen layer of the evaluation board is shown in Figure 41
with other top layers, including top copper, top solder mask,
and multilayer (vias).
Figure 42 shows the top silkscreen layer only. There is no
component in the bottom side; therefore, there is no bottom
silkscreen layer.
Figure 43 shows the top layers without the silkscreen layer.
Figure 44 shows the bottom layers, including bottom copper,
bottom solder mask, and multilayer (vias).
Figure 45 shows the mirrored bottom layers.
The schematic is shown in
Figure 46.
Figure 42. Top Silkscreen
06162-071
Figure 41. Top Silkscreen Layer with Other Top Layers
06162-070
Rev. 0 | Page 15 of 20
Figure 43. Top Layers Without Top Screen Layer
06162-072

SSM2304
When differential mode audio signals are used as the input
signal source, either use Headers 3HD1 and 3HD2 or the
soldering pads located on the left side of the board and turn
Switches S1E and S1F to the off position (lower position). The
top header is for the left channel signals and the lower is for the
right channel signals. There are two ground soldering pads on
the lower left corner.
The lower side of the board has a switch bank and its corres-
Tabl e 5
Figure 44. Bottom Layers
Figure 45. Mirrored Bottom Layers
On the upper left corner of the schematic shown in Figure 46,
there is an audio stereo jack connector (3.5 mm), J1. This jack is
compatible with standard stereo audio signals. It uses a
conventional audio stereo signal connector/cable to obtain
audio signals from common appliances, such as DVD players,
personal computers, TVs, and so on. Because this connector
only provides single-ended audio signals, turn Switches S1E and
S1F to the upper positions when this input connector is utilized
to ac short circuit the negative input ports to ground (see the
schematic in
Figure 46).
ponding channels are listed in
Table 5. Switch Channels
Switch Name Corresponding Channel
S1A Left positive
S1B Left negative
S1C Right negative
S1D Right positive
06162-073
When the switches listed in Tab le 5 are placed in the upper
positions, their corresponding coupling capacitors are shorted;
when the switches are placed in the lower positions, the coupling
capacitors are inserted in the signal paths.
As previously described, Switches S1E and S1F are used to ac
short circuit the left and right channel negative input ports to
ground, respectively. This function is only needed when driving
the input ports in single-ended mode. After shortening the
negative input ports to ground, the noise picked up by the input
port connections will be conducted to the ground.
S1G is not connected for the SSM2304.
S1H controls the shutdown function. The upper position shuts
down the amplifier, and the lower position turns on the amplifier.
The upper right corner has a dc power jack connector. The
center pin is for the positive terminal. It is compatible with 3 V
06162-074
to 5 V voltage, and the maximum peak current is approximately
1.2 A when driving a 4 Ω load (for SSM2304 only) and 0.6 A
when driving an 8 Ω load with an input voltage of 5 V.
There are two solder pads in the upper center edge area for
connecting the power supply voltages by clipping or soldering.
All the output ports are located on the right side of the board
and marked with the corresponding names. Please see the legend
on the board in
Figure 42 and the schematic in Figure 46.
There are three ways to connect the output signals to the loads
(the loudspeakers): using the four 2-pin headers, the terminal
block, or the soldering pads.
Rev. 0 | Page 16 of 20

SSM2304
-
OUTBL
OUTBL+
1
1
B1
12
C21
C7
100pF
12
OUTLL+
1
2HD1
2
BEAD
1 2
1nF
1
S1H
-
OUTLL
1
2PINA
1 2
1 2
C24
100pF
12
VDD
12
B2
R7
100K
8 9
TB1
2HD2
L2
L1
10PST
R1
7109
2PINA
1
2
10uH
10uH
C23
100pF
12
C12
12
C11
12
17
BEAD
PAD
1 2
100
1 2
GND16VDD
OUTL+
1
OUTL-
2
SD
3
INL+
4
INL-
5
R2
2143658
C16
1uF
C18
12
1 2
C15
1uF
C17
12
1 2
1nF
1nF
15
VDD14GND
U1
SSM2302
NC
6
7
100
1 2
C13
1 2
C14
1 2
13
R3
1uF
1uF
INR-8NC
2
C25
100pF
1 2
1nF
1nF
100
1 2
10P_T_BLOCK
2HD3
2PINA
1
1 2
1 2
C26
1 2
OUTR+
OUTR-
GAIN
INR+
-
OUTLR+
OUTLR
1
1
2HD4
2PINA
1
2
L4
10uH
L3
10uH
100pF
B4
B3
BEAD
1 2
12
11
10
R4
9
R6
12
100
12
C10
10uF
20
12
VDD
1 2
OUTBR+
B5
BEAD
-
GND
OUTBR
1
2HD5
1
2
C20
BEAD
1 2
VDD
12
R8
S1G
1 2
S1F
1
2PINA
10uF
C19
100K
C8
12
12
C22
12
100pF
1
J2
PS_JACK
1
123
10uF
1nF
10PST
710
10PST
611
06162-075
GND
1
VDD
PGND
1
C9
10uF
20
C6
100pF
12
C5
100pF
12
C1
1
-
INL
INL+
S1A
100nF
1 2
1
1
GND
C2
10PST
1 16
123
3HD1
S1B
100nF
1 2
J1
3P_HEADER
C3
10PST
2 15
123
3HD2
SJ-3523A
R5
12
S1C
100nF
1 2
3
2
3 14
1
1
3P_HEADER
12
10PST
INR+
S1E
C4
S1D
100nF
1 2
1
-
INR
10PST
512
10PST
4 13
1
GND
Figure 46. Schematic of SSM2304 Evaluation Board Rev. 3.0
Rev. 0 | Page 17 of 20

SSM2304
GETTING STARTED
To ensure proper operation, follow these steps:
1. Verify that the control switches are at the proper positions.
2. Put S1H, the shutdown control, in the lower position to
turn on the amplifier.
3. Put S1G, the gain selection, in the upper position for
higher gain and in the lower position for lower gain.
4. Connect the power supply with the right polarity and
proper voltage.
5. Connect the loads to the proper output ports. Depending
on the application, use nodes OUTBL+, OUTBL−, OUTBR+,
and OUTBR− to connect the loads after the beads or use
nodes OUTLL+, OUTLL−, OUTLR+, and OUTLR− to
connect the loads after the inductors.
WHAT TO TEST
1. EMI (electromagnetic interference). Connect wires for the
speakers that are the length required for the application
and perform the EMI test.
2. Signal-to-noise ratio.
3. Output noise. Use an A-weighting filter to filter the output
before the measurement meter.
4. Maximum output power.
5. Efficiency.
6. Component selections.
Selecting the correct components is the key for achieving the
performance required at the cost budgeted.
1. Input coupling capacitor selection. Capacitors C1, C2, C3,
and C4 should be large enough to couple the low frequency
signal components in the incoming signal, but small enough
to filter out unnecessary low frequency signals. For music
signals, the cutoff frequency is often chosen between 20 Hz
and 30 Hz. The cutoff frequency is calculated by
C = 1/(2 Rfc)
where R is 150k, and fc is the cutoff frequency.
Table 6.
Part No. Manufacturer Z (Ω) I
MPZ1608S601A TDK 600 1000 0.15 1.6 × 0.8 × 0.8
2. Input serial resistors (R1, R2, R3, and R4). These resistors
are not necessary for the amplifier to operate and are only
needed when special gain values are required. Using
resistors of too high a value increases the input noise.
3. Output beads (B1, B2, B3, and B4). The output beads are
necessary components for filtering out the EMIs caused at
the switching output nodes. Ensure that these beads have
enough current conducting capability while providing
sufficient EMI attenuation. The current rating needed for
an 8 Ω load is about 600 mA, and the impedance for
100 MHz must be greater than 600 Ω. In addition, the
lower the DCR (dc resistance) of these beads, the better for
minimizing their power consumptions. The recommended
bead is described in
Tabl e 6.
4. Output shunting capacitors for the beads. There are two
groups of these capacitors: C11, C12, C13, and C14 and
C23, C24, C25, and C26. The former is for filtering out the
lower frequency EMIs (those up to 250 MHz), and the latter
is for filtering out the higher frequency EMIs (those greater
than 250 MHz). Use small size (0603 or 0402) multilayer
ceramic capacitors of a X7R or COG (NPO) material. The
higher the value of these capacitors, the lower the residual
EMI level at the output and the higher the quiescent current
at the power supply. It is recommend to use 500 pF to 1 nF
values for the first group of capacitors and 100 pF to 200 pF
for the second group of capacitors.
5. Output inductors. Some users do not allow high frequency
EMIs in the system and prefer using inductors to filter the
output of the high frequency components at the output nodes.
Choose an inductance greater than 2.2 μH for these inductors.
The higher the inductance, the lower the EMI at the output
and the lower the quiescent current at the power supply.
However, higher inductance also corresponds with higher
power consumption by the inductors when the output power
level is high. It is recommended to use 2.2 μH to 10 μH
inductors; the current rating must be greater than 600 mA
(saturation current) for an 8 Ω load.
Tabl e 7 describes the
recommended inductors.
(mA) DCR (Ω) Size (mm)
MAX
Table 7.
Part No. Manufacturer L (μH) I
LQH32CN4R7M53 Murata Manufacturing Co., Ltd. 4.7 650 0.15 3.2 × 2.5 × 1.55
LQH32CN3R3M53 Murata Manufacturing Co., Ltd. 3.3 710 0.12 3.2 × 2.5 × 1.55
LQH32CN2R2M53 Murata Manufacturing Co., Ltd. 2.2 790 0.1 3.2 × 2.5 × 1.55
SD3118-100-R Cooper Bussmann, Inc. 10 900 0.3 3.1 × 3.1 × 1.8
ELL4LM100M Panasonic Corporation 10 690 0.18 3.8 × 3.8 × 1.8
LBC2518T2R2M Taiyo Yuden Co., Ltd. 2.2 630 0.13 2.5 × 1.8 × 2
1033AS-4R7M Toko Inc. 4.7 680 0.31 3.8 × 3.8 × 1
Rev. 0 | Page 18 of 20
(mA) DCR (Ω) Size (mm)
MAX

SSM2304
PCB LAYOUT GUIDELINES
To keep the EMI within the allowable limits and ensure that the
amplifier chip operates within the temperature limits, adhere to
the following guidelines.
1. Place nine vias onto the thermal pad of the amplifier. The
outer diameter of the vias should be 0.5 mm and the inner
diameter should be 0.33 mm. Use a PCB area of at least
2 cm × 2 cm or an equivalent area on the back side of the
PCB layer as the heat sink (see
Figure 43). If there are internal layers available within the
PCB, allocate an area as large as possible for the ground
plane(s) and connect these vias to the plane(s).
2. Place the EMI filtering beads, B1, B2, B3, and B4, as close
to the amplifier chip as possible. The same principle applies
to the output inductors, L1, L2, L3, and L4, if they are
included in the application design.
3. Place C11, C12, C13, and C14, the decoupling capacitors
for the beads, as close to the amplifier chip as possible and
connect their ground terminals together as close as
possible. The same principle applies to the decoupling
capacitors for the inductors, C15, C16, C17, and C18, if
they are included in the application design.
4. Place C19, the decoupling capacitor for the power supply,
as close to the amplifier chip as possible and connect its
ground terminal directly to the IC’s ground pins, Pins 13
and 16.
5. Place C20, the decoupling capacitor for the power supply,
as close to the amplifier chip as possible and connect its
ground terminal to the PCB ground area containing the
power supply traces.
Figure 41, Figure 42, and
6. Place B5, the bead for the power supply, as close to the
amplifier chip as possible, keeping it on the same side of
the PCB as the chip.
7. The ferrite beads can block an EMI of up to 160 MHz in
frequency. To eliminate EMIs greater than the 160 MHz,
place a small capacitor, such as 100 pF, in parallel with the
decoupling capacitors, C11, C12, C15, and C16, at least
20 mm from the 1 nF decoupling capacitor. Ideally, the
ground terminals of these capacitors are connected to the
ground terminals or the PCB traces, which are placed as
close to the output loads (loudspeakers) as possible. In this
way, the PCB connecting trace between these two capacitors
serves as an inductor for filtering out the high frequency
component.
8. Decouple the input port nodes and the digital pins, Pins 3,
4, 5, 8, 9, and 10, with small capacitors, such as 100 pF.
These capacitors are not necessary, but can lower the EMI
from these pins. The ground terminals of these capacitors
should be connected to the chip ground as close as possible
(see
Figure 41, Figure 42, and Figure 43).
9. Ground the unconnected pins, Pins 6 and 7.
10. Connect the ground pins, Pins 6, 7, 13, and 16, to the
thermal pad and place grounding vias as shown in
Figure 42, and Figure 43.
11. Use a solid polygon plane on the other side of the PCB for
the area of the vias that are placed on the thermal pad of
the chip (see
12. Keep the PCB traces for high EMI nodes on the same side
of the PCB and as short as possible. The high EMI nodes
are Pins 1, 2, 11, and 12 of the SSM2304.
Figure 44 or Figure 45).
Figure 41,
Rev. 0 | Page 19 of 20

SSM2304
R
R
OUTLINE DIMENSIONS
0.50
0.40
PIN 1
INDICATO
0.90
0.85
0.80
SEATING
PLANE
12° MAX
3.00
BSC SQ
TOP
VIEW
0.30
0.23
0.18
*
COMPLIANT
EXCEPT FOR EXPOSED PAD DIMENSION.
2.75
BSC SQ
0.80 MAX
0.65 TYP
0.05 MAX
0.02 NOM
0.20 REF
TO
JEDEC STANDARDS MO-220-VEED-2
0.45
0.50
BSC
1.50 REF
0.60 MAX
13
12
(BOTTOM VIEW)
9
8
Figure 47. 16-Lead Lead Frame Chip Scale Package [LFCSP_VQ]
3 mm × 3 mm Body, Very Thin Quad
(CP-16-3)
Dimensions shown in millimeters
EXPOSED
PAD
0.30
16
1
4
5
N
I
P
D
N
I
*
1.65
1.50 SQ
1.35
0.25 MIN
1
O
T
C
I
A
ORDERING GUIDE
Model Temperature Range Package Description Package Option Branding
SSM2304CPZ-REEL −40°C to +85°C 16-Lead Lead Frame Chip Scale Package [LFCSP_VQ] CP-16-3 A1F
SSM2304CPZ-REEL7 −40°C to +85°C 16-Lead Lead Frame Chip Scale Package [LFCSP_VQ] CP-16-3 A1F
SSM2304Z-EVAL Evaluation Board
1
Z = Pb-free part.
1
1
1
©2006 Analog Devices, Inc. All rights reserved. Trademarks and
registered trademarks are the property of their respective owners.
D06162-0-12/06(0)
Rev. 0 | Page 20 of 20
 Loading...