

Page 1

Errata
71500A and 70820A Microwave Transition Analyzer
Quick Start Guide
70820-90047
November 1, 1992
Title & Document Type:
Manual Part Number:
Revision Date:
HP References in this Manual
This manual may contain references to HP or Hewlett-Packard. Please note that HewlettPackard's former test and measurement, semiconductor products and chemical analysis
businesses are now part of Agilent Technologies. We have made no changes to this
manual copy. The HP XXXX referred to in this document is now the Agilent XXXX.
For example, model number HP8648A is now model number Agilent 8648A.
About this Manual
We’ve added this manual to the Agilent website in an effort to help you support your
product. This manual provides the best information we could find. It may be incomplete
or contain dated information, and the scan quality may not be idea l. If we find a better
copy in the future, we will add it to the Agilent website.
Support for Your Product
Agilent no longer sells or supports this product. You will find any other available
product information on the Agilent Test & Measurement website:
www.tm.agilent.com
Search for the model number of this product, and the resulting product page will guide
you to any available information. Our service centers may be able to perform calibration
if no repair parts are needed, but no other support from Agilent is available.
Page 2
Quick Start Guide
HP 71500A and HP 70820A
Microwave Transition Analyzer
ABCDE
70820-90047
No.
art
P
HP
ember
v
Printed
Edition
USA
in
B.0.0
No
1992
Page 3

Notice
The information contained in this document is sub ject to change
without notice.
Hewlett-Packard makes no warrantyofany kind with regard to this
material, including, but not limited to, the implied warranties of
merchantability and tness for a particular purpose. Hewlett-Packard
shall not be liable for errors contained herein or for incidental
or consequential damages in connection with the furnishing,
performance, or use of this material.
Restricted Rights Legend.
Use, duplication, or disclosure by the U.S. Government is subject to
restrictions as set forth in subparagraph (c) (1) (ii) of the Rights
in Technical Data and Computer Software clause at DFARS
252.227-7013 for DOD agencies, and subparagraphs (c) (1) and (c)
(2) of the Commercial Computer Software Restricted Rights clause at
agencies.
other
F
AR
52.227-19
for
c
Copyright Hewlett-Packard Company 1992
duction, adaptation,
Repro
Reserv
ts
Righ
All
without prior
cop
F
the
oun
taingro
under
1400
ed.
written
t
yrigh
e
v
ermission
p
ws.
la
arkw
P
a
,
y
is
Santa
prohibited,
Rosa,
except
95403-1799,
CA
translation
or
as
allo
USA
ed
w
Page 4
General Safety
Considerations
WARNING
WARNING
UTION
CA
UTION
CA
Before this instrument is switchedon
, make sure it has been properly
grounded through the protective conductor of the ac power cable to a
socket outlet provided with protective earth contact.
Any interruption of the protective (grounding) conductor, inside or
outside the instrument, or disconnection of the protectiveearth
terminal can result in personal injury.
There are many points in the instrument which can, if contacted, cause
personal injury. Be extremely careful.
Any adjustments or service procedures that require operation of the
instrument with protectivecovers removed should be performed only
by trained service personnel.
wer
e
Befor
circuitry
ailure
F
damage
input
otal
T
inputs
uator,
atten
instrument
this
has
set
to
the
to
must
een
b
the
instrumen
signal
exceed
not
er
w
o
p
is
adapted
w
o
p
ac
er
w
o
p
excess
in
switche
to
input to
er
when the
t
to the
dBm.
16
of
d
the
HP
16
mak
on,
oltage of
v
the correct
p
ac
71500A's
Because
ma
dBm
e
w
o
there
y
sure
the ac
v
cable
er
fron
is
damage
primary
its
w
o
p
oltage
is
t-panel
RF
no
the
plugged
po
source.
er
cause
could
in.
hannel
c
input
instrumen
t.
iii
Page 5
HP 71500A
Microwave
Transition
Analyzer - At A Glance
This quick start guide contains two tutorials that introduce you to
the microwave transition analyzer. You'll need ab out 20 minutes to
complete the steps. After completing the tutorial, refer to the
71500A and HP 70820A User's Guide
for a complete discussion of
HP
product features.
Why are there two tutorials
For optimum performance as a stimulus-response test system,
your microwave transition analyzer is designed to control a signal
source. This is referred to as a congured system. Operation in an
uncongured system oers additional measurement capability.
Tutorial 1 shows op eration of a congured system.
Tutorial 2 shows op eration of an uncongured system.
If your system is congured, you can also perform tutorial 2.
Refer to the
HP 71500A Series Instal lation and Verication
information on installing and conguring your instrument.
trols
con
basic
Understanding
71500A
HP
The
70820A
displa
fron
page
micro
and
y
panel of
t
sho
ws
the
micro
transition
e
v
a
w
mainframe,
HP
the
main
the
e
v
a
w
and
70004A
trols
con
transition
analyzer
custom
a
displa
using
for
analyzer
mo
eypad
k
The
.
y
the
consists
the
dule,
that snaps
gure
instrumen
on
HP
of
70004A
the
t.
the
to
in
follo
for
HP
color
the
wing
iv
Page 6
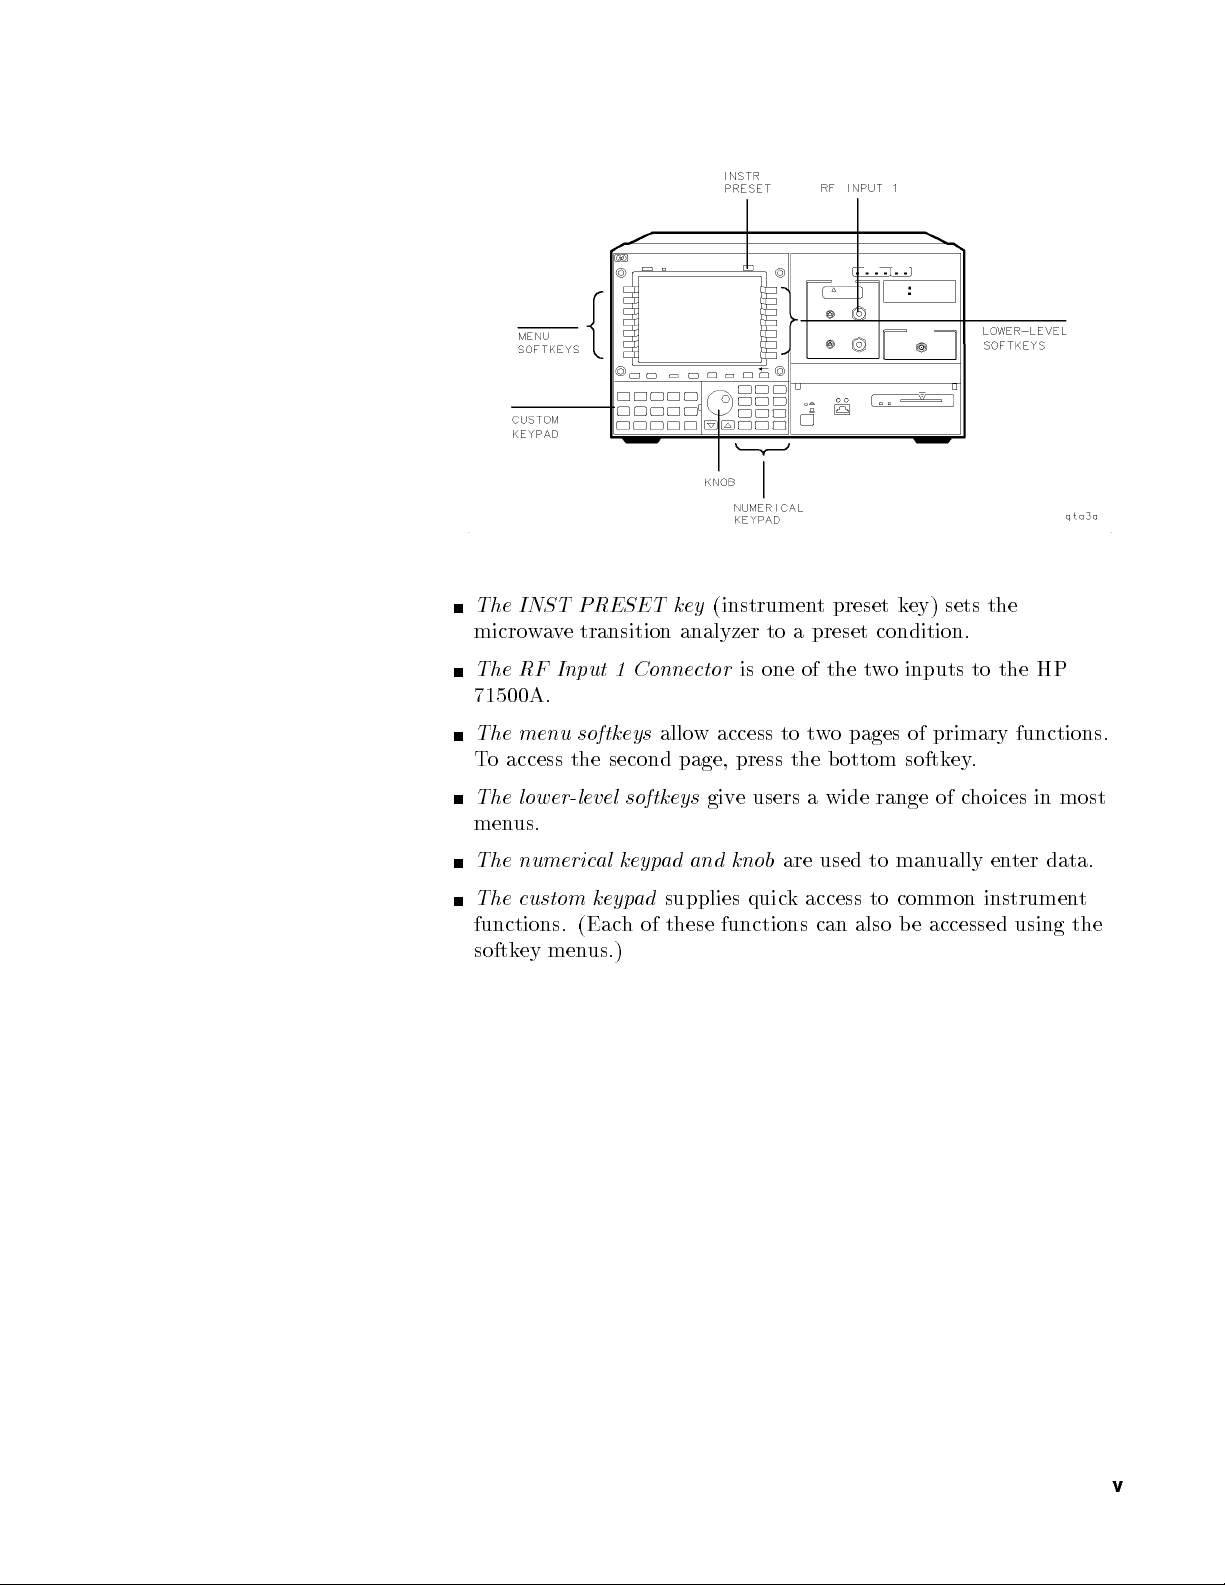
INST
The
w
micro
RF
The
71500A.
PRESET
e
v
a
Input
transition
Connector
1
(instrumen
key
analyzer
to
is one
ey)
t
w
k
inputs
o
preset
t
preset condition.
a
the
of
sets
to
the
the
HP
menu
The
access
o
T
lower-level
The
us.
men
numeric
The
custom
The
functions.
ey men
softk
softkeys
second
the
keyp
al
keyp
(Eac
us.)
allo
softkeys
ad
supplies
ad
these
of
h
w
page,
give
and
access
to
press
users
knob
quic
functions
the
are
k
t
a
access
pages
o
w
ottom
b
wide
to
used
to
can also
primary
of
softkey
of
range
ually
man
common
accessed using
be
functions.
.
hoices
c
ter
en
instrumen
in
data.
most
t
the
v
Page 7

In the text of this quick start guide,
4
5
letters indicate normal front-panel keys.
boxed
NNNNNNNNNNNNNNNNNNNN
shadow
letters indicate softkeys.
vi
Page 8
Quick Start Guide
Contents
Tutorial 1. Using a Congured System
Step 1. Display a continuous wave signal
Step 2. Save a trace
Step 3. Use the noise lter
::::::::::: ::::::::::::::: ::::::::::::::
:::::::::::::: :::::::::::::: ::::::
Step 4. Use the markers menu
Step 5. Recall a trace
::::::::::::::: ::::::::::::::: :::::::::
Step 6. Display a pulsed RF signal
Step 7. Store internal settings (states)
Step
Step
screen
Step 10.
Step
Step
Step
:
8.
9.
:
11.
12.
13.
Use
Remov
::
::
Displa
Recall
Measure
Measure
::
the
::
automatic
automatic measuremen
ethe
:
:
:
:
:
:
:
video
y
states
the
the
measuremen
:
:
:
:
:
:
:
:
feedthrough
:
:
:
:
:
:
:
risetime
falltime of
::::::::::::: ::::::::
::::::::::: ::::::::::::::: ::::
:::::::::::::: ::::::::::::
::::::::::: :::::::::::
:
:
:
:
:
:
:
:
:
table
ts
ts table
:
:
:
:
:
:
::
::
::
::
:
:
:
:
:
:
:
:
:
:
:
:
:
:
:
:
:
:
::
::
:
:
:
:
:
pulse
RF
an
of
pulse
RF
an
from
:
:
:
:
:
:
:
:
:
:
:
::
::
:
:
:
:
:
:
:
:
:
:
:
:
:
:
:
:
:
:
:
:
:
:
:
:
:
::
:
:
:
:
:
:
:
:
:
:
:
:
::
:
:
:
:
the
:
:
:
:
:
:
1
:
:
::
:
:
::
:
:
:
:
:
9
10
10
10
11
11
13
13
:
:
15
15
:
18
19
:
21
:
utorial
T
Step
Step
26
Step
2.
Measure
1.
Using
an
2. Normalize
v
a
e
Mak
3.
Uncongured
frequency
and
the system
oltage
v
ector
System
:
er
:
w
o
p
ector
v
a
for
measuremen
:
:
:
:
:
:
oltage
v
::
:
t
:
:
:
:
:
:
:
:
measuremen
:
:
:
:
:
::
24
:
:
:
:
:
:
:
t
28
:
:
:
:
:
:
:
Quick
Start
Guide
1-1
Page 9
Tutorial 1.
Using a Configured
System
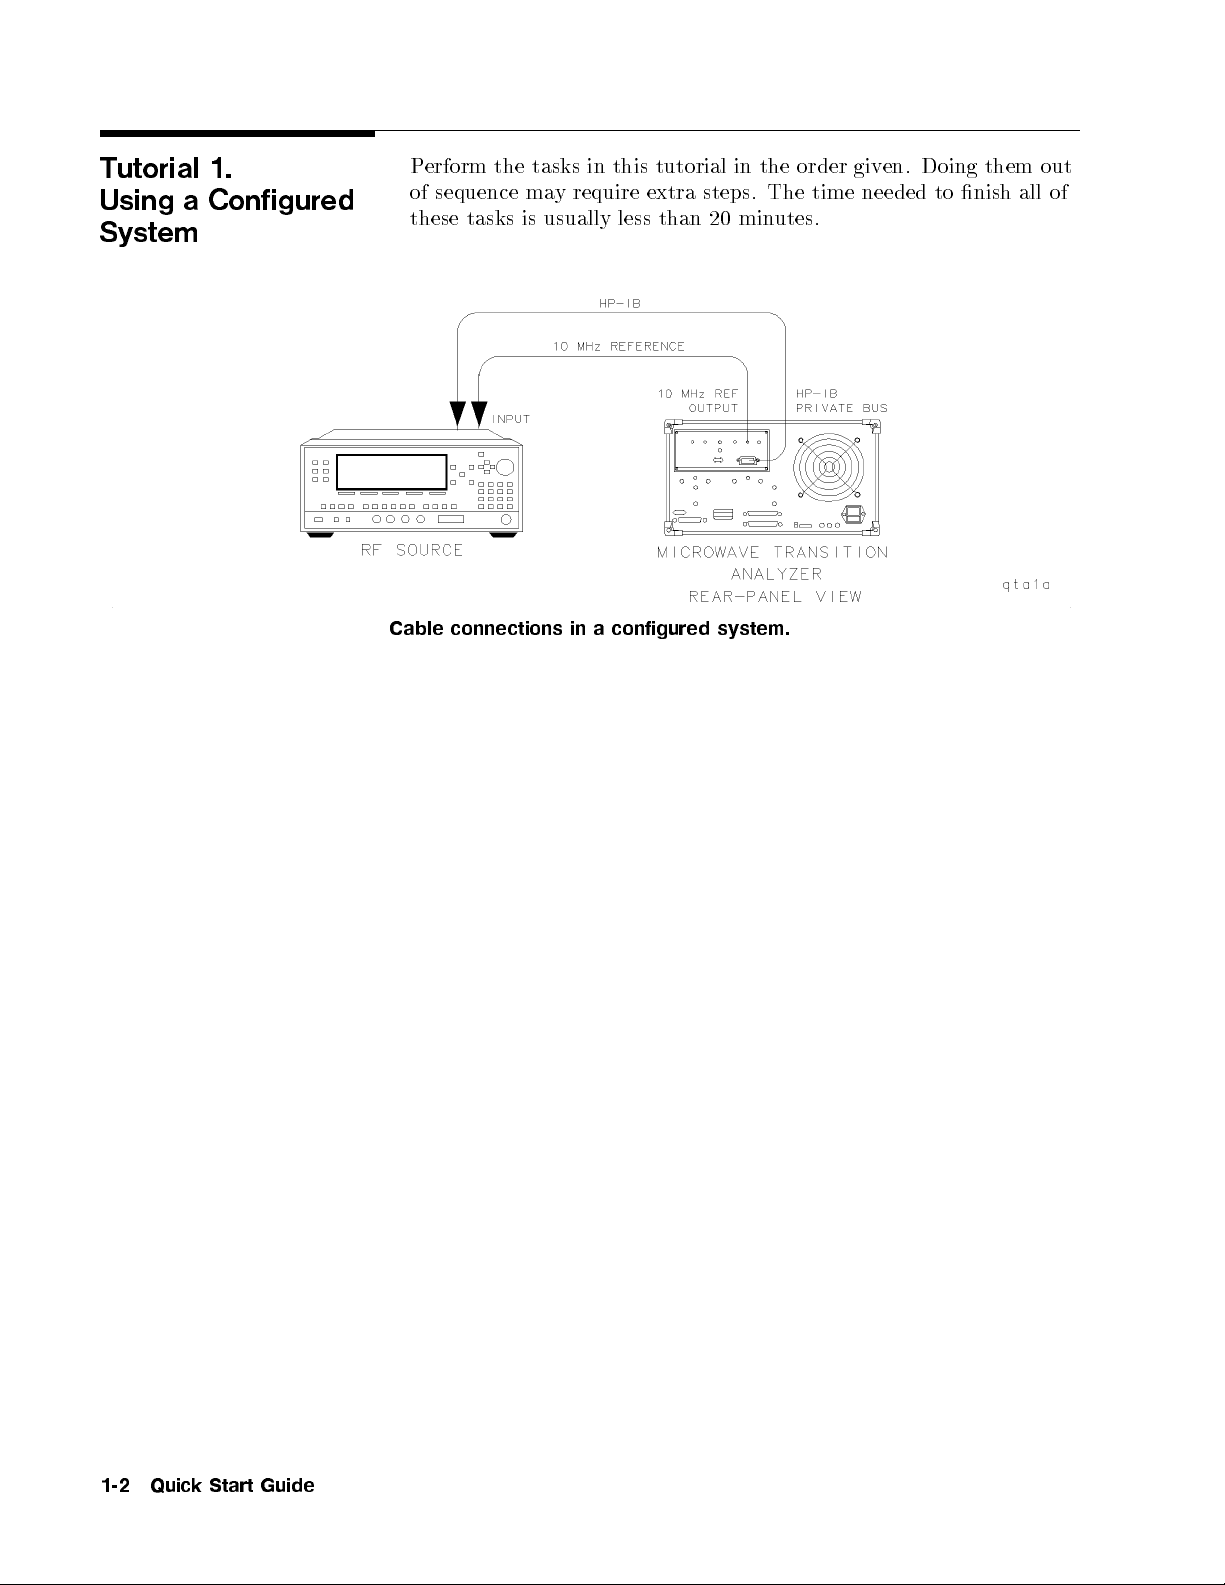
Perform the tasks in this tutorial in the order given. Doing them out
of sequence may require extra steps. The time needed to nish all of
these tasks is usually less than 20 minutes.
Cable
connections
configured
a
in
system.
1-2
Quick
Start
Guide
Page 10

Step 1. Display a
continuous wave signal
1. Connect a cable between your signal source output and the input
to the microwave transition analyzer's RF INPUT 1.
2. Connect a cable between the rear-panel MOD OUTPUT of the
HP 70820A mo dule and the signal source's pulse mo dulation
input.
3. Press
4.
You should nowhaveacontinuous wave (CW) signal on the screen.
The display should look similar to the following gure.
4
INSTR PRESET
NNNNNNNNNNNNNNNNNNNNNNNNNNNNNNNNNNNNNNNNN
Press
RF out ON|OFF
5
.
NNNNNNNN
until
ON
is underlined.
Quick
Start
Guide
1-3
Page 11

Step 2. Save a trace
1. Press
Traces
to enter the Traces menu.
2. Press the following softkeys:
NNNNNNNNNNNNNNNNNNNNNNNNNNNNNNNNNNN
store trace
NNNNNNNNNNNNNNNNNNNNNNN
TO MEM1
This saves the trace on the screen in memory blo cknumber 1.
NNNNNNNNNNNNNNNNNNNN
Step 3. Use the noise
filter
Step 4. Use the markers
menu
trace
Step
5.
Recall
a
1. Press
2.
Press
Main
to enter the Main menu.
NNNNNNNNNNNNNNNNNNNNNNNNNNNNNNNNNNNNNNNNNNNN
noisflt ON|OFF
NNNNNNNN
until
This lters the noise on the signal.
NNNNNNNNNNNNNNNNNNNNNNN
NNNNNNNNNNNNNN
1. Press
2.
Press the
This
ou to
y
Press
1.
Press
2.
Markers
one
is
interpret
N
N
N
N
Traces
the
N
N
N
N
N
N
N
N
N
N
N
N
N
NNNNNNNNNNNNNNNNNNNN
mkr
example
N
N
N
N
N
N
N
N
N
NN
NN
follo
N
N
N
N
N
N
N
N
N
N
N
N
NN
to enter the Markers menu.
NNNNNNNNNNNNNNNNNNNNNNNNNNNNNNNNNNNNNN
!
and then
of ho
measuremen
N
N
N
N
N
to
wing
N
N
N
en
ter
softk
HIGHEST PEAK
wthe
options in
ts.
races
T
the
eys:
input: Ch1
N
N
N
N
N
N
N
N
N
N
N
N
N
N
MEMx
NN
N
N
N
N
N
N
N
N
N
N
N
N
MEM1
Y
ou
no
signal
CW
the
e
v
ha
w
that y
screen.
ON
is underlined.
men
v
ou sa
u.
the
ed
.
Mark
earlier
ers
bac
men
on
k
u
can
the
help
1-4
Displa
6.
Step
pulsed RF signal
Guide
Start
Quick
4
Press
1.
a
y
INSTR
PRESET
.
5
2. Get into the States menuby pressing the following softkeys:
NNNNNNNNNNNNNNNNNNNNNNNNNNNNNNNNNNN
page 1 of 2
NNNNNNNNNNNNNNNNNNNN
States
eys:
softk
wing
follo
the
Press
3.
N
N
N
N
N
NN
N
N
N
N
N
N
N
N
N
N
NN
N
N
N
N
N
N
N
N
N
N
N
NN
N
N
N
more 1
NNNNNNNNNNN
of 2
NNNNNNNNNNNNNNNNNNNNNNNN
PULSED TIME
y pressing the following softkeys:
4. Get in
NNNNNNNNNNNNNN
to the Pulsgen men
NNNNNNNNNNNNNNNNNNNNN
ub
page 1 of 2
NNNNNNNNNNNNNNNNNNNNNNN
Pulsgen
N
N
N
N
N
N
N
N
N
N
N
N
N
N
NN
N
N
N
N
N
N
N
N
N
N
N
N
N
N
N
N
N
N
5.
Press
NN
N
N
RF
N
N
N
PUL|CW
src
un
til
N
N
NN
PUL
N
N
N
N
N
N
N
(pulse),
underlined.
is
Page 12

6. Get into the Main menuby pressing the following softkeys:
NNNNNNNNNNNNNNNNNNNNNNNNNNNNNNNNNNN
page 2 of 2
NNNNNNNNNNNNNN
Main
7.
The signal should lo ok similar to the following gure. The top trace
(Tr1) shows the real input data. The burst of RF is used only for
visual eect. The bottom trace (Tr3) shows the demodulated signal
from the input at channel 1.
NNNNNNNNNNNNNNNNNNNNNNNNNNNNNNNNNNNNNNNNN
Press
RF out ON|OFF
until
NNNNNNNN
ON
is underlined.
Quick
Start
Guide
1-5
Page 13

Step 7. Store internal
settings (states)
1. Get into the States menuby pressing the following softkeys:
NNNNNNNNNNNNNNNNNNNNNNNNNNNNNNNNNNN
page 1 of 2
NNNNNNNNNNNNNNNNNNNN
States
2. Press the following softkeys:
NNNNNNNNNNNNNNNNNNNNNNNNNNNNNNNN
save state
NNNNNNNNNNNNNNNNNNNNNNNNNNNNNNNNNNNNNN
SAVE STATE 1
The instrumentwillsave the state in memory even if power is cycled.
We will recall this state later.
Step 8. Use the
automatic
measurements table
1. Get into the Pulsegen menuby pressing
Pulsgen
.
2. Press the following softkeys to put more than one dutycycleon
the screen:
NNNNNNNNNNNNNNNNNNNNNNN
NNNNNNNNNNNNNNNNNNNNNNNNNNNNNNNNNNNNNNNNNNNNNNN
WIDTH | DUT CYC
4255
N
N
N
N
N
until
NNNNNNNNNNNNNNNNNNNNNNN
DUT CYC
is highlighted.
%
N
page
N
N
N
N
N
N
N
N
N
N
N
N
N
N
2of
2
N
N
N
N
N
N
N
N
N
N
N
N
N
N
N
NN
NN
NN
NN
N
N
N
N
N
N
N
N
N
N
N
Main
4505
N
N
N
N
N
N
N
N
us
3.
Get
in
N
N
N
N
N
N
N
page
N
N
N
N
N
NN
Measure
the
to
N
N
N
N
N
N
N
N
N
N
N
N
N
N
N
N
N
NN
N
N
N
N
N
N
N
N
of 2
1
N
N
N
N
N
N
N
N
N
N
N
N
N
N
N
N
men
N
pressing
by
u
the
eys:
softk
wing
follo
Measure
4. Press
the
N
NN
N
the follo
trace
N
N
N
N
N
N
N
N
N
N
N
ottom
b
(the
3
trace
select
to
eys
softk
wing
measured:
e
b
to
N
N
N
N
N
N
N
NN
NN
NN
N
N
N
N
N
N
N
trace)
MsrTrc: TR1
NNNNNNNNNNN
TR3
5.
NNNNNNNNNNNNNNNNNNNNNNNNNNNNNNNNNNN
Press
MEASURE ALL
.
as
1-6
Quick
Start
Guide
pro
This
microw
vides
v
a
e
k
quic
transition
access
analyzer
multiple
to
system
measuremen
erforms
p
automatically
ts
that
the
.
Page 14

Step 9. Removethe
automatic
measurements
screen
the
from
Step
10.
Displa
y
feedthrough
table
video
1. Press the following softkeys:
NN
update:
NN
NN
N
N
N
N
N
N
SINGLE
N
N
N
N
N
N
N
N
N
N
N
N
N
N
N
N
NN
NN
NN
N
N
N
N
N
N
N
N
N
N
N
N
N
N
N
N
N
N
N
NN
OFF
2. Get
into
N
N
N
N
N
N
N
N
page
N
N
N
N
N
N
NN
pressing
y
b
u
men
ers
Mark
the
N
N
N
N
N
N
N
N
N
N
N
N
N
N
N
N
NN
N
N
N
N
N
N
N
N
N
N
N
N
N
N
N
N
N
2
of
2
N
N
N
N
N
N
N
the
eys:
softk
wing
follo
Markers
Press
v
ha
ers from
N
MARKERS
just
e
NN
NN
NN
N
N
N
N
N
N
N
Main
OFF
deleted the
screen.
the
N
in
get
to
.
automatic measuremen
u.
men
Main
the
to
ts
table
and
the
3.
ou
Y
mark
1. Press
NN
N
N
N
N
N
N
N
N
N
N
N
N
N
N
N
N
N
N
N
N
N
N
N
NN
N
N
N
N
N
N
N
2. Change the displayed time per division by pressing the following
keys:
425
NNNNNNNN
ns
N
N
N
N
N
N
N
N
N
N
N
NN
N
N
N
3.
necessary
If
,
until the leading edge of the
press
N
DELAY
adjust
and
pulse is displa
with the
yed as sho
fron
t-panel
wn b elo
knob
w.
Quick
Start
Guide
1-7
Page 15

4. Change the channel of measurementtochannel 1 by pressing the
NN
N
N
N
N
N
NN
NN
NN
N
N
N
N
N
N
softkeys:
N
N
N
N
N
N
N
N
N
N
N
of
1
N
N
N
N
NN
NN
N
N
N
N
NN
NN
N
N
N
N
N
N
2
following
N
N
N
page
N
N
N
Measure
N
MsrTrc:
N
N
N
N
N
N
N
N
N
N
TR3
N
NN
NN
N
N
N
N
N
N
N
N
N
N
N
N
N
N
N
N
N
N
N
N
N
NN
NN
N
N
N
N
N
TR1
RF
the
Separate
5.
y pressing
b
N
N
N
N
NN
NN
N
N
N
N
N
N
N
N
page
N
N
N
N
N
N
N
N
N
N
N
N
N
NN
N
noisflt
N
N
N
NN
NN
NN
NN
N
N
N
N
N
more
NN
NN
N
N
N
N
N
N
N
N
N
N
N
N
N
N
N
2
N
N
N
N
1
NN
the
N
N
N
N
N
N
N
N
N
NN
RF
the
N
N
N
N
N
N
N
N
N
N
N
2
of
N
N
N
N
NN
NN
N
N
N
ON|OFF
NN
N
N
N
N
N
N
N
N
N
2
of
N
N
N
N
N
N
N
N
N
N
N
follo
NN
N
N
N
N
N
N
N
NN
N
N
N
N
N
from
N
N
N
N
N
N
N
N
NN
N
the
wing
un
til
video
softk
N
N
N
N
NN
N
ON
feedthrough
eys:
N
underlined.
is
and displa
y
sweep options
NNNNNNNNNNNNNNNNNNNNNNNNNNNNNNNNNNNNNN
CH1 = VID/RF
until
NNNNNNNNNNN
VID
(video) is underlined.
The pulse mo dulator in this signal source (an HP 83640A is
being used in this example) is of such a high quality that video
feedthrough is
minimal
and
b
oth
traces
app
straight
e
b
to
ear
lines.
1-8
If a message is
display
Start
Quick
Guide
ed
ys
If the screen displa
profile. Can't find proper carrier mix
Synchronous modulation not allowed for
, then the t
wo signals are
synchronous. The source frequency needs to be adjusted slightly
The microw
To x this problem, press the following softkeys:
NNNNNNNNNNNNNNNNNNNNNNNNNNNNNNNNNNN
more 1 of 2
Autoscale
6.
N
ave transition analyzer system can
NNNNNNNNNNNNNNNNNNNNNNNNNNNNNNNNNNNNNNNNN
,
modify: SYNTH
feedthrough
video
the
N
N
N
N
N
N
N
N
N
N
NN
N
N
N
N
, and then
pressing
y
b
do this automatically
NNNNNNNNNNNNNNNNNNNNNNN
NNNNNNNNNNNNNNNNN
SYNTH
Pulsgen
.
follo
the
wing
,
softk
Scale
.
.
eys:
Page 16

NNNNNNNNNNNNNNNNNNNNNNNNNNNNNNNN
AUTO-SCALE
The following gure has an example of what you might expect to
nd on the screen for this signal source or another of its quality.
7. Take an automatic peak-to-p eak measurement of the video
feedthrough by pressing the following softkeys:
NNNNNNNNNNNNNNNNNNNNNNNNNNNNNNNNNNN
page 1 of 2
NNNNNNNNNNNNNNNNNNNNNNN
Measure
NNNNNNNNNNNNNNNNNNNNNNNNNNNNNNNNNNN
more 1 of 3
NNNNNNNNNNNNNNNNNNNNNNNNNNNNNNNNNNN
more 2 of 3
NNNNNNNNNNNNNNNNN
PK-PK
The following gure shows the video feedthrough of a pulse
originating from an HP 83640A.
Step 11. Recall states
1. Press
States
to access the States menu.
2. Press the following softkeys:
NNNNNNNNNNNNNNNNNNNNNNNNNNNNNNNNNNNNNN
NNNNNNNNNNNNNNNNNNNN
recall
NN
N
N
N
N
N
RECAL
You should ha
state
N
STATE
1
N
N
N
N
N
N
N
N
N
NN
N
N
N
N
N
N
N
N
N
N
NN
N
N
N
N
N
N
N
N
N
N
ve the pulse displa
back on the screen.
ythaty
ved earlier in Step 6
ou sa
Start
Quick
Guide
1-9
Page 17

Step 12. Measure the
risetime of an RF pulse
1. Press the following keys to change the time p er division shown on
the screen:
NNNNNNNNNNNNNNNNNNNNNNN
SEC/DIV
425
NNNNNNNN
ns
2.
If necessary, press
NNNNNNNNNNNNNNNNN
delay
and adjust the delaywiththe
front-panel knob until the leading edge of the pulse is displayed.
3. Get into the Measure menuby pressing the following softkeys:
NNNNNNNNNNNNNNNNNNNNNNNNNNNNNNNNNNN
page 1 of 2
NNNNNNNNNNNNNNNNNNNNNNN
Measure
4. Press the following softkeys to change the trace to be measured to
trace 3:
NNNNNNNNNNNNNNNNNNNNNNNNNNNNNNNNNNNNNN
Msr Trc: TR1
NNNNNNNNNNN
TR3
N
N
N
N
N
N
N
N
N
N
N
N
N
N
N
N
N
NN
NN
NN
NN
N
N
N
N
Press
5.
Note
the
RISE
the
screen.
automatic
TIME
.
measuremen
results
t
that
app
ear
at
the
top
of
1-10
Quick
Start
Guide
Page 18

Step 13. Measure the
falltime of an RF pulse
1. Press
States
to access the States menu.
2. Press the following softkeys to get the RF pulse that you saved
states for earlier, back on the screen:
NNNNNNNNNNNNNNNNNNNNNNNNNNNNNNNNNNNNNN
recall state
NNNNNNNNNNNNNNNNNNNNNNNNNNNNNNNNNNNNNNNNNNNN
RECALL STATE 1
3. Adjust delayby pressing the following keys:
NNNNNNNNNNNNNNNNN
DELAY
NNNNNNNNNNNNNNNNNNNN
415
NNNNNNNN
us
4. Adjust the time per division shown on the screen by pressing the
following keys:
NNNNNNNNNNNNNNNNNNNNNNN
SEC/DIV
425
NNNNNNNN
ns
The
wn
sho
5. Get in
NNNNNNNNNNNNNNNNNNNNNNNNN
NNN
page 1 of
NNNNNNNNNNNN
Measure
follo
of the
wing
trailing edge
the
in
to the Measure men
NNNNNNN
2
NNNNNNNNNNN
pulse should
gure.
y pressing the follo
ub
now
ear
app
wing softkeys:
on
the
screen
as
Quick
Start
Guide
1-11
Page 19

6. Press the following softkeys to make trace 3 the trace to be
measured:
NNNNNNNNNNNNNNNNNNNNNNNNNNNNNNNNNNNNNN
Msr Trc: TR1
NNNNNNNNNNN
TR3
7.
NNNNNNNNNNNNNNNNNNNNNNNNNNNNNNNNNNN
Press
more 1 of 3
and then
NNNNNNNNNNNNNNNNNNNNNNNNNN
FALLTIME
. Note the automatic
measurements that appear at the top of the screen.
Tutorial 2. Using an
Unconfigured
System
Perform the tasks in this tutorial in the order given. Doing them out
of sequence may require extra steps. The time needed to nish all of
these tasks (excluding calibration) is usually less than 20 minutes.
You do not need to congure a signal source to the HP 71500A
microwave transition analyzer system to do the tasks in this chapter.
You will, however, need the following equipment:
(f
)
(for
system
adapters
example,
limiter
a
An
A
Tw
Tw
A
A
or
HP
signal
o2.4
SMA
o
er
w
o
p
device
lter)
a
71500A
source
(f
mm
cables
splitter
test
to
micro
bulkhead
)
ector v
v
a
w
transition
e
v
to
oltage
analyzer
APC-3.5
transmission
mm
1-12
Quick
Start
No connecting cables are needed in an unconfigured system.
Guide
Page 20

Step 1. Measure
frequency and power
1. Press
NNNNNNNNNNNNNNNNNNNN
Config
NNNNNNNNNNNNNNNNNNNNNNNNNNNNN
,
RF Source
NNNNNNNNNNNNNNNNNNNNNNN
,
RF src:
, and then
NNNNNNNNNNNNNN
NONE
to ensure
your source is uncongured.
2. Connect the oscillator under test to the channel 1 input as shown
below.
lev
er
w
o
3.
Set
to
0
the
2.1
oscillator
T
.
dBm
frequency
the
urn
3.1 GHz
to
oscillator
and its
on.
er
w
o
p
output
p
el
4.
5.
6.
7.
8.
4
Press
Press
Press
Access
N
N
N
N
N
N
N
N
N
INSTR
N
N
N
N
N
more
N
NN
N
N
sig
the States
N
NN
NN
page
N
N
N
N
N
N
N
N
N
N
N
N
N
N
States
NNNNNNNNNNNNNNNNNNNNNNNNNNNNNNNNNNNNNN
Press
FREQ & POWER
N
N
N
N
NN
N
N
N
N
N
N
N
N
N
1
NN
N
N
N
N
N
N
N
N
N
N
N
N
N
N
trk
N
N
of
PRESET
N
N
N
N
NN
N
N
N
N
N
of
1
N
N
N
N
N
N
N
N
N
N
N
N
N
N
N
N
N
N
N
N
N
N
2
N
N
N
N
ON
N
N
N
NN
.
5
N
N
N
N
N
N
.
2
N
N
N
N
N
N
N
N
|
menu
N
N
.
N
N
N
N
N
OFF
N
N
N
N
N
N
y
b
N
N
til
un
ON
pressing
N
N
N
N
NN
is
the
underlined.
wing
follo
softk
eys:
Quick
Start
Guide
1-13
Page 21

The results of this measurement are displayed on the screen as shown
below.
The displayed measurementreads03.82 dBm when the input is02.1
dBm because the cable loss is fairly heavy for this particular setup.
This procedure is for a frequency and power measurementofone
input. The microwave transition analyzer system can, however,
determine the frequency and power of up to ve signals at one time.
1-14
Quick
Start
Guide
Page 22

Step 2. Normalize the
system for a vector
voltage measurement
1. Connect the signal source to a power splitter and the microwave
transition analyzer system as shown below.
Quick
Start
Guide
1-15
Page 23

2. Set the frequency of the signal source to 1 GHz and the power
level to010.0 dBm.
3. Press
4
INSTR PRESET
5
.
4. Access the States menuby pressing the following softkeys:
NNNNNNNNNNNNNNNNNNNNNNNNNNNNNNNNNNN
page 1 of 2
NNNNNNNNNNNNNNNNNNNN
States
5.
NNNNNNNNNNNNNNNNNNNNNNNNNNNNNNNNNNNNNNNNNNNN
Press
VECTOR VOLTAGE
.
You should nowhave only a table on the screen. The source signal
is no longer visible on the screen.
6. Access the Table menuby pressing the following softkeys:
NNNNNNNNNNNNNNNNNNNNNNNNNNNNNNNNNNN
page 1 of 2
NNNNNNNNNNNNNNNNN
Table
7. Set the reference to zero by pressing the following softkeys:
N
N
N
N
N
N
N
NN
NN
NN
N
N
N
N
N
N
N
N
N
N
N
N
N
N
N
N
N
N
N
NN
N
delta
N
N
N
SET
ha
ou
Y
system)
(off)
N
N
N
N
N
N
N
N
N
N
NN
NN
NN
NN
N
N
e
v
to
REF
just
mak
.
normalized
accurate
an
e
the
system
ector
v
the
(adjusted
oltage measuremen
v
for
losses
t.
of
the
1-16
Quick
Start
Guide
Page 24

Step 3. Makeavector
voltage measurement
1. Connect the device under test (DUT) to the normalized
measurement setup as shown below.
Read
2.
example sho
The
left
The
frequency
righ
The
the
um
n
.
t
The
um
n
results
ws
in
er
b
cen
ber
at
the
the
ter
sho
the
table
n
ws
the
of
top
measuremen
wn
sho
ws
sho
er
b
um
phase
the
screen
ts
on
the
shift
for
the
wn
sho
as
GHz
1.5
a
screen
is
insertion loss
y
caused
b
the
the
elo
b
w-pass
lo
input
of
DUT.
w.
the
lter.
DUT.
Quick
Start
Guide
1-17
Page 25

 Loading...