

Page 1

Digital Power Meter
Advanced Test Equipment Rentals
www.atecorp.com 800-404-ATEC (2832)
®
E
s
t
a
b
l
i
s
h
e
d
1
9
8
1
IM 760101-01E
4th Edition
Page 2

Product Registration
Thank you for purchasing YOKOGAWA products.
YOKOGAWA provides registered users with a variety of information and
services.
Please allow us to serve you best by completing the product registration
form accessible from our homepage.
http://www.yokogawa.com/tm/
PIM 103-01E
Page 3

Notes
Thank you for purchasing the YOKOGAWA WT1600 Digital Power Meter.
This user’s manual contains useful information about the functions, operating
procedures, and handling precautions of the instrument. To ensure correct use, please
read this manual thoroughly before beginning operation.
After reading the manual, keep it in a convenient location for quick reference whenever a
question arises during operation.
The following two manuals, including this one, are provided as manuals for the WT1600.
Read them along with this manual.
Manual Title Manual No. Description
WT1600 Digital Power Meter IM 760101-01E This manual. Explains all functions and
User’s Manual procedures of the WT1600 excluding
the communication functions.
WT1600 Digital Power Meter IM 760101-11E Explains the communication functions
Communication Interface of the GP-IB, RS-232, and Ethernet
User’s Manual interfaces.
• The contents of this manual are subject to change without prior notice as a result of
continuing improvements to the instrument’s performance and functions. The figures
given in this manual may differ from the actual screen.
• Every effort has been made in the preparation of this manual to ensure the accuracy
of its contents. However, should you have any questions or find any errors, please
contact your nearest YOKOGAWA dealer.
• Copying or reproducing all or any part of the contents of this manual without the
permission of Yokogawa Electric Corporation is strictly prohibited.
• The TCP/IP software of this product and the document concerning the TCP/IP
software have been developed/created by YOKOGAWA based on the BSD
Networking Software, Release 1 that has been licensed from California University.
Trademarks
• MS-DOS is either a registered trademark or trademark of Microsoft Corporation in the
United States and/or other countries.
• Adobe, Adobe Acrobat, and PostScript are registered trademarks or trademarks of
Adobe Systems Incorporated.
• Zip is either a registered trademark or trademark of Iomega Corporation in the United
States and/or other countries.
• For purposes of this manual, the TM and ® symbols do not accompany their
respective trademark names or registered trademark names.
• Other company and product names are trademarks or registered trademarks of their
respective companies.
Revisions
• First edition: June 2001
• Second edition: August 2001
• Third edition: December 2002
• Fouth edition: April 2004
4th Edition : April 2004 (YK)
All Rights Reserved, Copyright © 2001 Yokogawa Electric Corporation
IM 760101-01E
i
Page 4
Checking the Contents of the Package
Unpack the box and check the contents before operating the instrument. If some of the
contents are not correct or missing or if there is physical damage, contact the dealer
from which you purchased them.
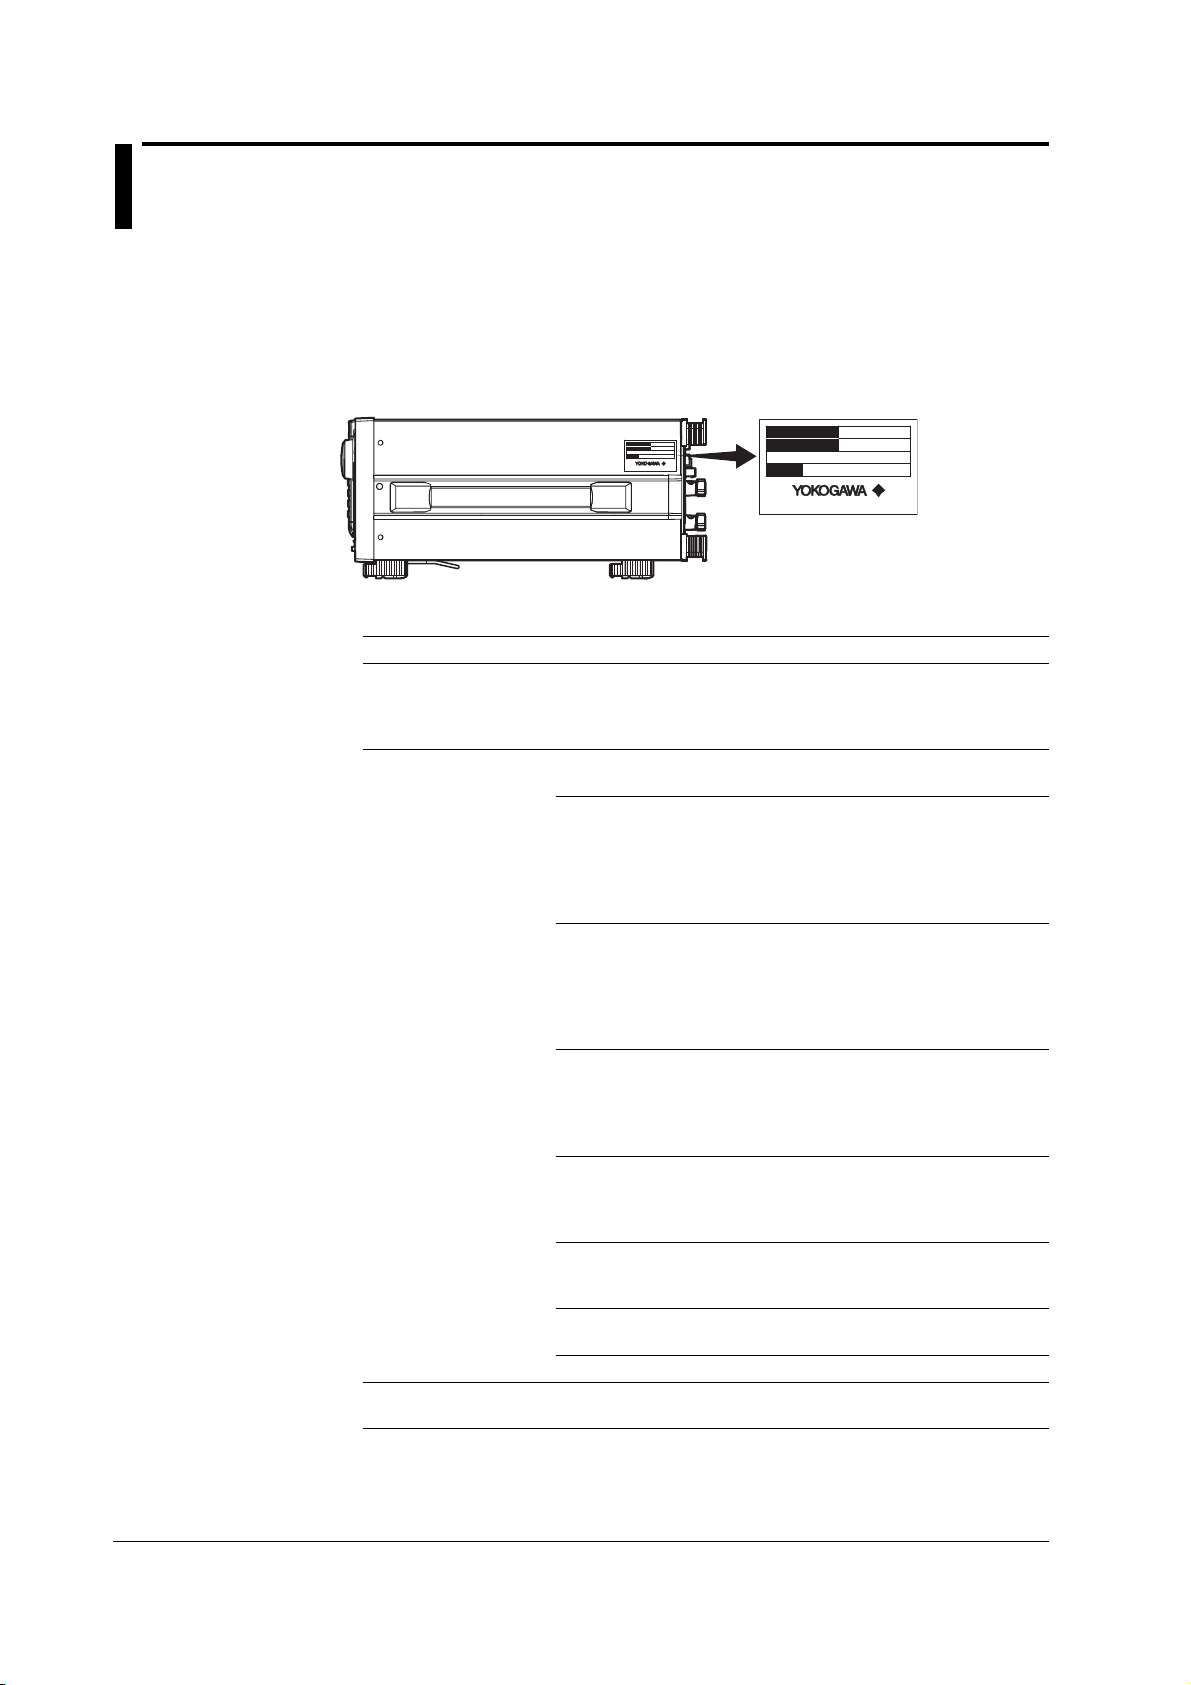
WT1600
Check that the model name and suffix code given on the name plate on the side panel
match those on the order.
MODEL
SUFFIX
NO.
Made in Japan
MODEL
SUFFIX
NO.
Made in Japan
MODEL and SUFFIX Codes
Model Suffix Code Description
760101 100-120 / 200-240 VAC
For details on the construction of the current input
terminal that is equipped on the instrument, see the
next section.
Current input terminal Element 123456
Construction
-01 50 A –––––
-02 50 A 50 A – – – –
-03 50 A 50 A 50 A – – –
-04 50 A 50 A 50 A 50 A – –
-05 50 A 50 A 50 A 50 A 50 A –
-06 50 A 50 A 50 A 50 A 50 A 50 A
-10 5 A –––––
-11 5 A 50 A – – – –
-12 5 A 50 A 50 A – – –
-13 5 A 50 A 50 A 50 A – –
-14 5 A 50 A 50 A 50 A 50 A –
-15 5 A 50 A 50 A 50 A 50 A 50 A
-20 5 A 5 A– – – –
-21 5 A 5 A 50 A – – –
-22 5 A 5 A 50 A 50 A – –
-23 5 A 5 A 50 A 50 A 50 A –
-24 5 A 5 A 50 A 50 A 50 A 50 A
-30 5 A 5 A5 A– – –
-31 5 A 5 A 5 A 50 A – –
-32 5 A 5 A 5 A 50 A 50 A –
-33 5 A 5 A 5 A 50 A 50 A 50 A
-40 5 A 5 A5 A5 A– –
-41 5 A 5 A5 A5 A50 A–
-42 5 A 5 A 5 A 5 A 50 A 50 A
-50 5 A 5 A5 A5 A5 A–
-51 5 A 5 A5 A5 A5 A50 A
-60 5 A 5 A5 A5 A5 A5 A
Communication interface -C1 GP-IB Interface
(Either one is built in.) -C2 Serial (RS-232) interface
ii IM 760101-01E
Page 5

Checking the Contents of the Package
Suffix Code Description
Power cord -D UL/CSA Standard power cord (Part No.: A1006WD)
-F VDE Standard Power Cord (Part No.: A1009WD)
-Q BS Standard Power Cord (Part No.: A1054WD)
-R AS Standard Power Cord (Part No.: A1024WD)
Options /B5 Built-in printer
/C7 SCSI
/C10 SCSI, Ethernet interface, and internal hard disk.
/DA D/A output (30 channels)
/MTR Motor evaluation function
(Either /C7 or /C10 can be added)
Example of specifications and suffix code
Ex: 5-A input terminals in elements 1 through 3, 50-A input terminals in elements 4 through 6,
GP-IB interface, UL/CSA standard power cord, built-in printer, and SCSI → 760101-33-C1-D/
B5/C7
[Maximum rated voltage: 125 V; Maximum rated current: 7 A]
[Maximum rated voltage: 250 V; Maximum rated current: 10 A]
[Maximum rated voltage: 250 V; Maximum rated current: 10 A]
[Maximum rated voltage: 240 V; Maximum rated current: 10 A]
NO. (Instrument No.)
When contacting the dealer from which you purchased the instrument, please quote
the instrument No.
IM 760101-01E
iii
Page 6
Checking the Contents of the Package
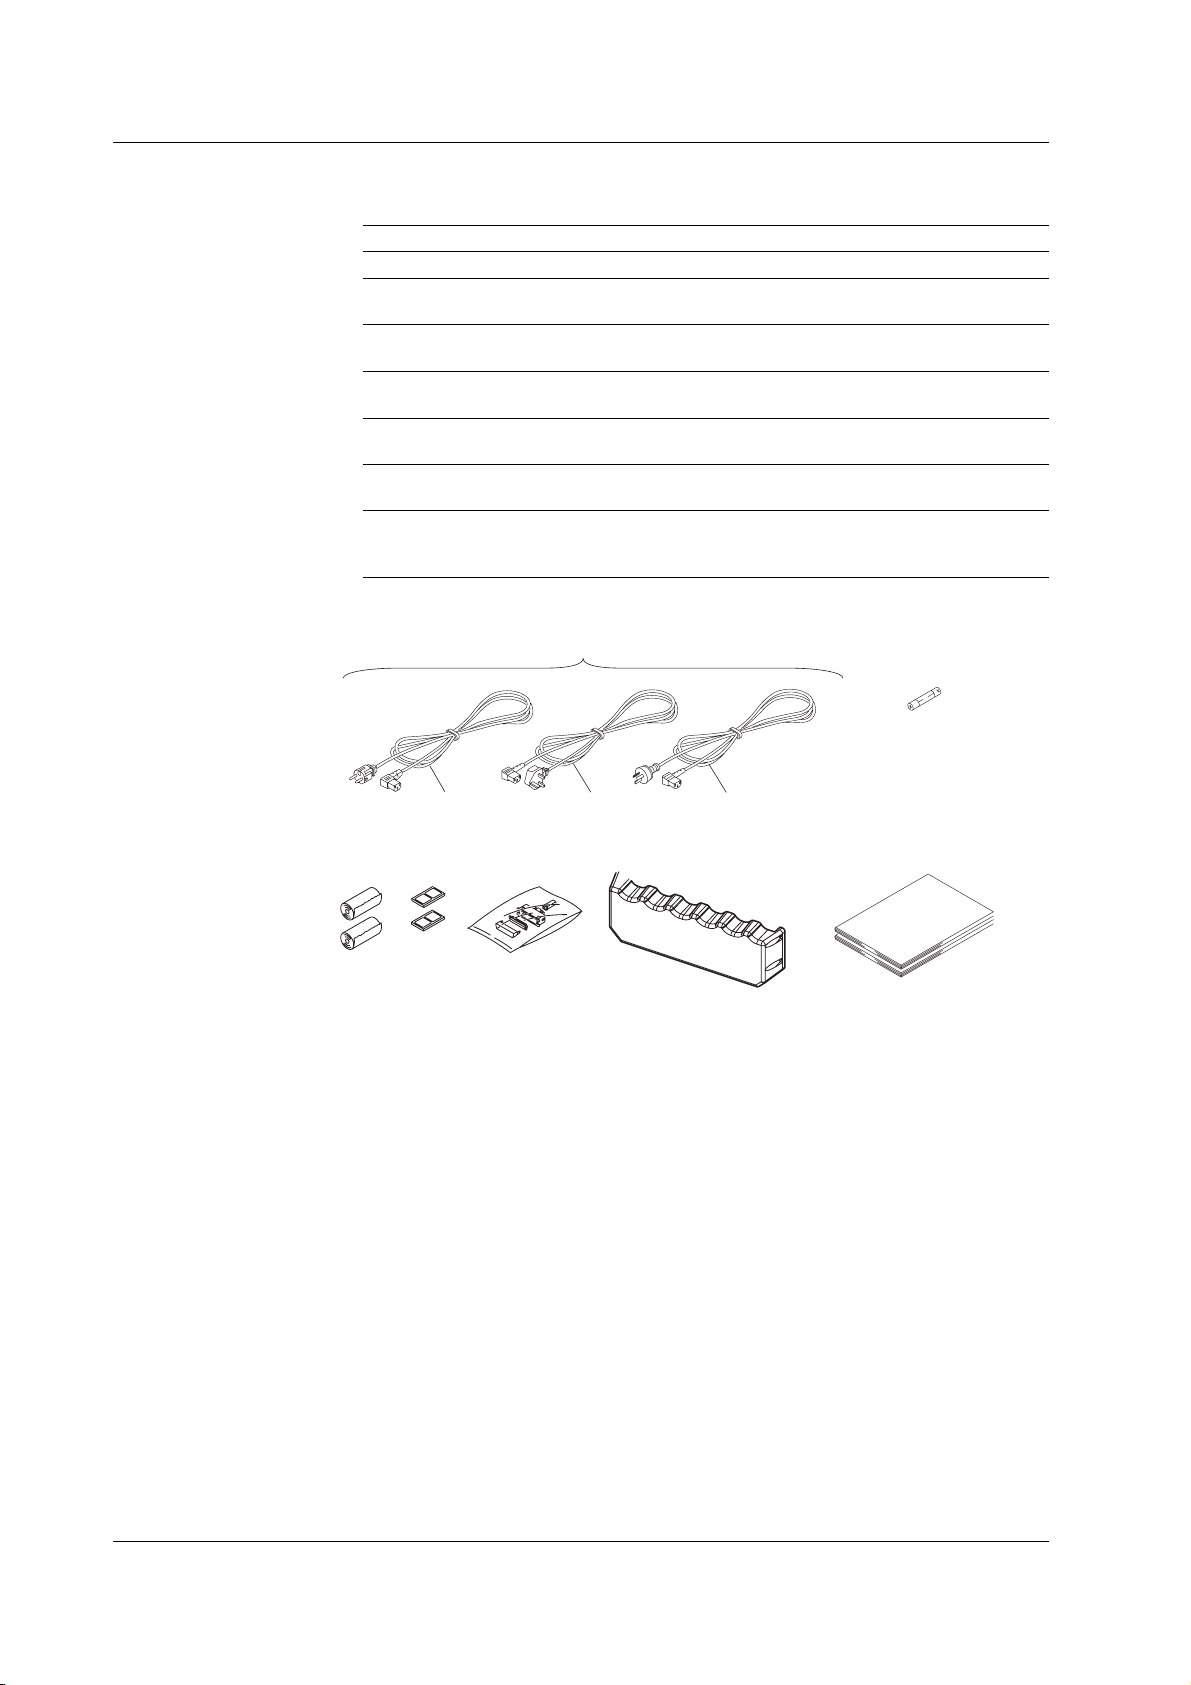
Standard Accessories
The following are supplied with the instrument.
Part Name Part Number Q’ty Notes
1. Power cord See the previous table. 1 –
2. Spare power fuse A1354EF 1 250 V, 6.3 A, time lag
3. Printer roll paper B9316FX 2 For the built-in printer
4. Rubber feet A9088ZM 2 Two pieces in one set.
5. 36-pin connector A1005JD 1 For D/A output
6. Current input protective cover B9316BX 1 With 4 attachment screws, part
7. • User’s Manual IM760101-01E 1 This manual
• Communication Interface IM760101-11E 1 –
User’s Manual
1. (One of the following power cords is supplied
according to the instrument's suffix codes.)
(attached to the fuse holder)
Provided only with option /B5
Two sets provided.
Provided only with option /DA
number B9946GZ.
2.
F
3.
4.
Q
R
6. 7.5.
iv IM 760101-01E
Page 7
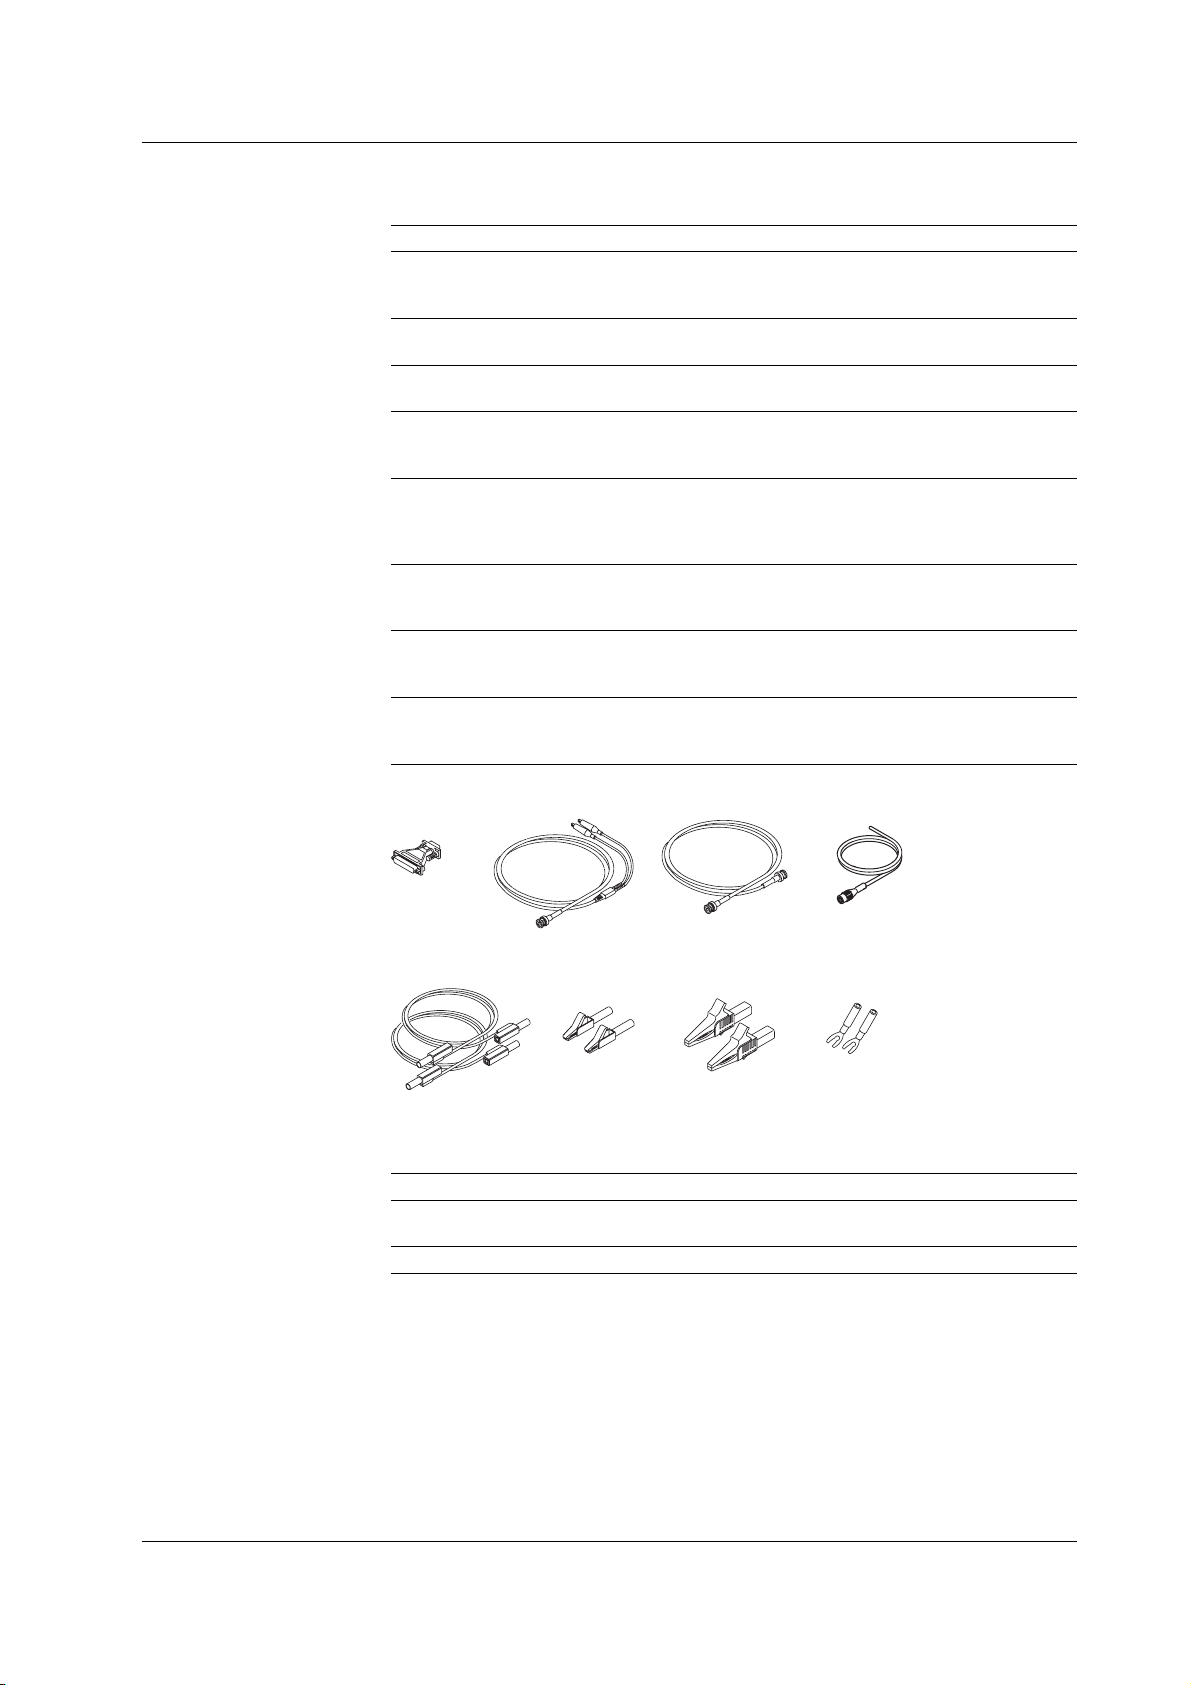
Optional Accessories (Sold Separately)
The following optional accessories are available for purchase separately.
Part Name Part Number Q’ty Notes
1. Serial port adapter 366971 1 9 pin*1-25 pin*2adapter
2. BNC-alligator clip 366926 1 42 V or less, length 1 m
3. BNC-BNC 366924 1 42 V or less, length 1 m
measurement lead 366925 1 42 V or less, length 2 m
4. External sensor cable B9284LK 1 For connecting the current sensor
5. Measurement lead 758917 1 Two leads in one set, used with
6. Alligator clip adapter set 758922 1 Two pieces in one set, for the
7. Alligator clip adapter set 758929 1 Two pieces in one set, for the
8. Fork terminal adapter set 758921 1 Two pieces in one set, for the
Checking the Contents of the Package
*1 EIA-574 Standard
*2 EIA-232 Standard (RS-232)
measurement lead
input connector of the WT1600
Length 0.5 m
the separately sold 758922 or
758929 adapter, length 0.75 m,
ratings 1000 V
758917 measurement lead.
Rated voltage 300 V
758917 measurement lead.
Rated voltage 1000 V
758917 measurement lead.
Rated current 25 A
1.
5.
Spare Parts (Sold Separately)
The following spare parts are available.
Part Name Part Number Q’ty Notes
1. Printer roll paper B9316FX 10 One roll is one set, thermal-
2. Power fuse A1354EF 2 250 V, 6.3 A, time lag
2.
6.
3. 4.
7.
8.
sensitive paper, total length 10 m
IM 760101-01E
v
Page 8

Safety Precautions
This instrument is an IEC safety class I instrument (provided with terminal for protective
earth grounding).
The general safety precautions described herein must be observed during all phases of
operation. If the instrument is used in a manner not specified in this manual, the
protection provided by the instrument may be impaired. Yokogawa Electric Corporation
assumes no liability for the customer’s failure to comply with these requirements.
The following symbols are used on this instrument.
“Handle with care.” (To avoid injury, death of personnel or damage to the
instrument, the operator must refer to the explanation in the User’s Manual or
Service Manual.)
Electric shock, danger
Alternating current
Both direct and alternating current
ON(power)
OFF(power)
In-position of a bistable push control
Out-position of a bistable push control
Ground
vi IM 760101-01E
Page 9

Safety Precautions
Make sure to comply with the precautions below. Not complying might result in injury
or death.
WARNING
Power Supply
Ensure that the source voltage matches the voltage of the power supply before
turning ON the power.
Power Cord and Plug
To prevent the possibility of electric shock or fire, be sure to use the power cord
supplied by YOKOGAWA. The main power plug must be plugged into an outlet
with a protective earth terminal. Do not invalidate this protection by using an
extension cord without protective earth grounding.
Protective Grounding
Make sure to connect the protective earth to prevent electric shock before
turning ON the power.
Necessity of Protective Grounding
Never cut off the internal or external protective earth wire or disconnect the
wiring of the protective earth terminal. Doing so poses a potential shock hazard.
Defect of Protective Grounding
Do not operate the instrument if the protective earth or fuse might be defective.
Also, make sure to check them before operation.
Fuse
To avoid the possibility of fire, only use a fuse that has a rating (voltage, current,
and type) that is specified by the instrument. When replacing a fuse, turn OFF
the power switch and unplug the power cord. Never short the fuse holder.
Do Not Operate in an Explosive Atmosphere
Do not operate the instrument in the presence of flammable liquids or vapors.
Operation in such environments constitutes a safety hazard.
Do Not Remove Covers
The cover should be removed by YOKOGAWA’s qualified personnel only.
Opening the cover is dangerous, because some areas inside the instrument
have high voltages.
External Connection
Securely connect the protective grounding before connecting to the item under
measurement or an external control unit.
IM 760101-01E
vii
Page 10

How to Use This Manual
Structure of the Manual
This user’s manual consists of the following sections.
Chapter 1 Explanation of Functions
Describes the functions of the instrument. Operating procedures are not given in this chapter.
However, reading this chapter will help you understand the operating procedures given in the
chapters that follow.
Chapter 2 Names and Uses of Parts
Describes the names and uses of each part of the instrument.
Chapter 3 Before Starting Measurements
Describes precautions for the use of the instrument, how to install the instrument, how to
connect to the power supply, how to wire measurement circuits, how to turn ON/OFF the
power switch, and other preparations before starting measurements.
Chapter 4 Screen Display Format
Describes how to display numerical data, waveforms, bar graphs, vectors, and trends, the
mixed display, and the meaning of each displayed item.
Chapter 5 Measurement Conditions
Describes how to set the input conditions for the measured voltage/current signal and the
handling of the input signal such as the wiring system, the measurement range, the filter,
averaging, data update rate, and the crest factor.
Chapter 6 Normal Measurement and Integration
Describes how to set the displayed items of numerical data during normal measurement, how
to set the computing equation, and how to set integration.
Chapter 7 Harmonic Measurement
Describes how to set the displayed item of numerical data, the PLL source, the order of analysis,
the computing equation, the bar graph, and the vector display during harmonic measurement.
Chapter 8 Motor Evaluation (Option)
Describes how to set the instrument in order to determine the motor characteristics by
inputting signals from revolution sensors and torque meters.
Chapter 9 Waveform Display
Describes how to display the waveforms of the voltage and current signals.
Chapter 10 Trend Display
Describes how to display the trend.
Chapter 11 Storing and Recalling Data and Saving the Stored Data
Describes how to store and recall the data and how to save the stored data.
Chapter 12 Saving and Loading the Data
Describes how to save setup parameters, waveform display data, numerical data, and screen
image data and how to load the saved data to the instrument.
Chapter 13 Ethernet Communications (Option)
Describes how to mutually transfer files containing setup parameters, waveform display data, and
numerical data with PCs and workstations that are on the network using the Ethernet interface.
Chapter 14 Built-in Printer (Option)
Describes how to output numerical data and screen image to the built-in printer.
Chapter 15 D/A Output and Other Functions
Describes how to set the D/A output and other functions.
Chapter 16 Troubleshooting, Maintenance, and Inspection
Describes the possible causes of problems and their appropriate corrective measures.
Describes the messages that are displayed on the screen. Describes maintenance and
inspection issues such as how to perform self-tests and replace power fuses.
Chapter 17 Specifications
Summarizes the specifications of the instrument in tables.
Appendix
Describes how to determine the measurement function and delta computation. Gives a list of
initial settings. Describes the ASCII header file format.
Index
Alphabetic and symbol index of contents.
viii IM 760101-01E
Page 11
Conventions Used in This Manual
Unit
k: Denotes 1000. Example: 15 kg, 100 kHz
K: Denotes 1024. Example: 640 KB (Storage capacity of floppy disks)
Displayed Characters
Bold characters used in the procedural explanations indicate characters that are
displayed on the panel keys for the respective procedure or the characters on the
screen.
SHIFT+key means you will press SHIFT to turn ON the indicator that is located above
and to the left of SHIFT followed by the operation key. The menu written below the
pressed key appears on the screen.
Symbols
The following symbols are used in this manual.
How to Use This Manual
Improper handling or use can lead to injury to the user or damage
to the instrument.
indicate that the user must refer to the user’s manual for special
instructions. The same symbol appears in the corresponding place
in the user’s manual to identify those instructions. In the manual,
the symbol is used in conjunction with the word “WARNING” or
“CAUTION.”
This symbol appears on the instrument to
WARNING
CAUTION
Note
Symbols Used on Pages Describing Operating Procedures
On pages that describe the operating procedures in Chapter 3 through 16, the
following symbols are used to distinguish the procedures from their explanations.
Keys
Procedure
Explanation
Describes precautions that should be observed to prevent injury or
death to the user.
Describes precautions that should be observed to prevent minor or
moderate injury, or damage to the instrument.
Provides important information for the proper operation of the
instrument.
Indicates the key related to the operation.
Follow the steps indicated with numbers. The procedures are
given with the premise that the user is carrying out the steps for the
first time. Depending on the operation, not all steps need to be
taken.
This section describes the setup parameters and the limitations
regarding the procedures. It does not give a detailed explanation of
the function. For details on the function, see chapter 1.
IM 760101-01E
ix
Page 12

Contents
Checking the Contents of the Package ...........................................................................................ii
Safety Precautions .........................................................................................................................vi
How to Use This Manual .............................................................................................................. viii
Chapter 1 Explanation of Functions
1.1 System Configuration and Block Diagram ....................................................................... 1-1
1.2 Measurement Function and Measurement Period ........................................................... 1-3
1.3 Measurement Conditions ................................................................................................. 1-9
1.4 Numeric Display ............................................................................................................. 1-14
1.5 Computation................................................................................................................... 1-18
1.6 Integration ...................................................................................................................... 1-20
1.7 Waveform Display .......................................................................................................... 1-23
1.8 Bar Graphs, Vectors, and Trend Displays ...................................................................... 1-29
1.9 Saving and Loading Data and Other Functions ............................................................. 1-32
Chapter 2 Names and Uses of Parts
2.1 Front Panel, Rear Panel, and Top View ........................................................................... 2-1
2.2 Operation Keys, Jog Shuttle ............................................................................................ 2-3
Chapter 3 Before Starting Measurements
3.1 Precautions Concerning the Use of the Instrument ......................................................... 3-1
3.2 Installing the Instrument ................................................................................................... 3-2
3.3 Wiring Precautions ...........................................................................................................3-4
3.4 For Making Accurate Measurements ............................................................................... 3-6
3.5 Connecting the Power Supply.......................................................................................... 3-8
3.6 Directly Wiring the Circuit under Measurement ............................................................... 3-9
3.7 Using an External Current Sensor to Wire the Circuit under Measurement .................. 3-12
3.8 Using an External PT or CT to Wire the Circuit under Measurement ............................ 3-16
3.9 Wiring a Circuit with Voltage Input Exceeding 600 V ..................................................... 3-19
3.10 Turning ON/OFF the Power Switch................................................................................ 3-20
3.11 Setting the Date and Time ............................................................................................. 3-22
3.12 Entering Values and Strings........................................................................................... 3-24
Chapter 4 Screen Display Format
4.1 Displaying the Data (Numerical Data) of Measurement Functions .................................. 4-1
4.2 Displaying Waveforms ................................................................................................... 4-10
4.3 Displaying Bar Graphs ................................................................................................... 4-12
4.4 Displaying Vectors ......................................................................................................... 4-14
4.5 Displaying Trends .......................................................................................................... 4-15
4.6 Listing the Setup Parameters......................................................................................... 4-17
Chapter 5 Measurement Conditions
5.1 Selecting the Wiring System ............................................................................................ 5-1
5.2 Setting the Measurement Range during Direct Input ....................................................... 5-4
5.3 Setting the Measurement Range When Using an External Current Sensor .................. 5-10
5.4 Setting the Scaling Function When Using an External PT or CT ................................... 5-14
5.5 Selecting the Input Filter ................................................................................................ 5-17
5.6 Averaging ....................................................................................................................... 5-19
5.7 Changing the Data Update Rate .................................................................................... 5-22
x IM 760101-01E
Page 13

5.8 Holding the Display and Performing Single Measurements........................................... 5-24
5.9 Holding the Numerical Data Display at the Maximum .................................................... 5-25
5.10 Performing Master/Slave Synchronized Measurements ................................................ 5-26
5.11 Selecting the Crest Factor ............................................................................................. 5-29
Chapter 6 Normal Measurement and Integration
6.1 Changing the Displayed Item of Numerical Data ............................................................. 6-1
6.2 Setting the Measurement Period ..................................................................................... 6-4
6.3 Selecting the Frequency Measurement Target ................................................................ 6-7
6.4 Setting the User-Defined Function ................................................................................... 6-8
6.5 Setting the Delta Computation ....................................................................................... 6-12
6.6 Setting the Equations for Apparent Power and Corrected Power .................................. 6-15
6.7 Selecting the Display Format of the Phase Difference .................................................. 6-18
6.8 Setting the Normal Integration Mode and the Integration Timer .................................... 6-20
6.9 Setting the Real-time Integration Mode, the Integration Timer, and the
Reservation Time ........................................................................................................... 6-23
6.10 Selecting the Current Mode for Current Integration and ON/OFF of Integration Auto
Calibration ......................................................................................................................6-29
6.11 Performing Integration (Start, Stop, and Reset)............................................................. 6-31
Contents
1
2
3
4
5
6
7
Chapter 7 Harmonic Measurement
7.1 Setting the Harmonic Measurement Mode ...................................................................... 7-1
7.2 Changing the Displayed Item of Numerical Data ............................................................. 7-2
7.3 Selecting the Measurement Target .................................................................................. 7-7
7.4 Selecting the PLL Source................................................................................................. 7-8
7.5 Setting the Harmonic Order to Be Analyzed .................................................................. 7-11
7.6 Selecting the Equation for the Distortion Factor ............................................................ 7-13
7.7 Changing the Data Length ............................................................................................. 7-14
7.8 Setting the User-Defined Function ................................................................................. 7-15
7.9 Changing the Display Items of Bar Graphs and Performing Cursor Measurements ..... 7-19
7.10 Changing the Vector Display.......................................................................................... 7-23
Chapter 8 Motor Evaluation (Option)
8.1 Inputting Signals of Rotating Speed and Torque.............................................................. 8-1
8.2 Selecting the Input Range of the Revolution and Torque Signals and the Synchronization
Source .............................................................................................................................. 8-3
8.3 Selecting the Line Filter ................................................................................................... 8-6
8.4 Setting the Scaling Factor, the Pulse Count, and Unit Used to Measure the Rotating
Speed ............................................................................................................................... 8-7
8.5 Setting the Scaling Factor and Unit Used to Measure the Torque ................................. 8-10
8.6 Setting the Motor’s Number of Poles Used to Compute the Synchronous Speed and the
Slip ................................................................................................................................. 8-12
8.7 Setting the Scaling Factor and Unit Used to Compute the Motor Output ...................... 8-14
8.8 Computing the Motor Efficiency and Total Efficiency ..................................................... 8-16
Chapter 9 Waveform Display
9.1 Retrieving Waveform Display Data .................................................................................. 9-1
9.2 Setting the Time Axis ....................................................................................................... 9-2
9.3 Setting the Trigger............................................................................................................ 9-4
9.4 Zooming Vertically and Moving the Vertical Position ....................................................... 9-8
9.5 Turning ON/OFF the Waveform Display ........................................................................ 9-11
9.6 Splitting the Screen and Displaying Waveforms ............................................................ 9-13
8
9
10
11
12
13
14
15
16
17
App
IM 760101-01E
xi
Index
Page 14

Contents
9.7 Interpolating the Display and Changing the Graticule.................................................... 9-16
9.8 Turning ON/OFF the Scale Value and Waveform Label ................................................ 9-19
9.9 Performing Cursor Measurements ................................................................................. 9-21
Chapter 10 Trend Display
10.1 Retrieving Trend Display Data ....................................................................................... 10-1
10.2 Selecting the Trend Display Target ................................................................................ 10-2
10.3 Turning ON/OFF the Trend Display ............................................................................... 10-6
10.4 Splitting the Screen and Displaying Trends ................................................................... 10-8
10.5 Setting the Time Axis ................................................................................................... 10-10
10.6 Setting the Scale .......................................................................................................... 10-12
10.7 Performing Cursor Measurements ............................................................................... 10-14
10.8 Restarting the Trend .................................................................................................... 10-18
Chapter 11 Storing and Recalling Data and Saving the Stored Data
11.1 Setting the Store Mode .................................................................................................. 11-1
11.2 Setting the Store Count, the Store Interval, and the Store Reservation Time................ 11-3
11.3 Setting the Numerical Data and Waveform Display Data to Be Stored ......................... 11-6
11.4 Storing the Data ........................................................................................................... 11-10
11.5 Saving the Stored Data ................................................................................................ 11-13
11.6 Recalling the Stored Data ............................................................................................ 11-20
Chapter 12 Saving and Loading the Data
12.1 Precautions to Be Taken When Using the Floppy Disk Drive ........................................ 12-1
12.2 Built-in Hard Disk (Option) ............................................................................................. 12-2
12.3 Connecting a SCSI Device ............................................................................................ 12-3
12.4 Changing the SCSI ID Number ...................................................................................... 12-4
12.5 Formatting the Disk ........................................................................................................ 12-6
12.6 Saving Setup Parameters, Waveform Display Data, and Numerical Data................... 12-11
12.7 Saving Screen Image Data .......................................................................................... 12-20
12.8 Loading Setup Parameters .......................................................................................... 12-23
12.9 Specifying the File to Be Displayed, Viewing File Properties, and Changing the File
Attribute ........................................................................................................................ 12-26
12.10 Deleting Files ............................................................................................................... 12-29
12.11 Copying Files ............................................................................................................... 12-32
12.12 Renaming Directories and Files and Creating Directories ........................................... 12-36
Chapter 13 Ethernet Communications (Option)
13.1 Connecting the WT1600 to a PC ................................................................................... 13-1
13.2 Setting the Ethernet Interface (TCP/IP) ......................................................................... 13-2
13.3 Saving Setup, Waveform Display, Numerical, and Image Data to the FTP Server
(FTP Client Function) ..................................................................................................... 13-8
13.4 Outputting the Screen Image to a Network Printer ...................................................... 13-11
13.5 Sending E-mail Messages ........................................................................................... 13-15
13.6 Accessing the WT1600 from a PC or Workstation (FTP Server Function) .................. 13-19
13.7 Checking the Presence of the Ethernet Interface (Option) and the MAC address ...... 13-23
13.8 Setting the FTP Passive Mode and LPR/SMTP Timeout ............................................. 13-24
Chapter 14 Built-in Printer (Option)
14.1 Installing the Paper Roll and Paper Feeding ................................................................. 14-1
14.2 Printing Screen Images .................................................................................................. 14-5
14.3 Printing Numerical Data Lists and Bar Graphs .............................................................. 14-7
xii IM 760101-01E
Page 15

Chapter 15 D/A Output and Other Functions
15.1 Setting the D/A Output (Option) ..................................................................................... 15-1
15.2 RGB Video Signal (VGA) Output ................................................................................... 15-9
15.3 Initializing the Settings ................................................................................................. 15-10
15.4 Performing Zero-Level Compensation ......................................................................... 15-12
15.5 Using the NULL Function ............................................................................................. 15-13
15.6 Selecting the Message Language and the Screen Brightness .................................... 15-14
15.7 Setting the Display Color of the Screen ....................................................................... 15-16
15.8 Setting Key Lock .......................................................................................................... 15-19
Contents
1
2
3
4
Chapter 16 Troubleshooting, Maintenance, and Inspection
16.1 Troubleshooting ............................................................................................................. 16-1
16.2 Error Messages and Corrective Actions......................................................................... 16-2
16.3 Performing a Self-Test ................................................................................................... 16-6
16.4 Checking the System Conditions ................................................................................... 16-8
16.5 Replacing the Power Fuse ............................................................................................. 16-9
16.6 Recommended Replacement Parts ............................................................................. 16-10
Chapter 17 Specifications
17.1 Input ............................................................................................................................... 17-1
17.2 Display ........................................................................................................................... 17-2
17.3 Measurement Functions (Items) during Normal Measurement...................................... 17-3
17.4 Measurement Functions (Items) during Harmonic Measurement .................................. 17-5
17.5 Accuracy ........................................................................................................................ 17-7
17.6 Functions ..................................................................................................................... 17-10
17.7 Input/Output of the Master/Slave Synchronization Signal............................................ 17-16
17.8 External Clock Input ..................................................................................................... 17-16
17.9 RGB Video Signal (VGA) Output ................................................................................. 17-17
17.10 Built-in Floppy Disk ...................................................................................................... 17-17
17.11 Built-in Hard Disk (Option) ........................................................................................... 17-17
17.12 SCSI (Option) ............................................................................................................... 17-17
17.13 Ethernet Interface (Option) .......................................................................................... 17-18
17.14 Built-in Printer (Option) ................................................................................................ 17-18
17.15 GP-IB Interface ............................................................................................................ 17-18
17.16 Serial (RS-232) Interface ............................................................................................. 17-19
17.17 General Specifications ................................................................................................. 17-19
17.18 External Dimensions .................................................................................................... 17-21
5
6
7
8
9
10
11
12
13
Appendix
Index
IM 760101-01E
Appendix 1 Symbols and Determination of Measurement Functions .................................. App-1
Appendix 2 Determination of Delta Computation ................................................................. App-6
Appendix 3 List of Initial Settings and Display Order of Numerical Data ............................. App-8
Appendix 4 ASCII Header File Format ...............................................................................App-14
Appendix 5 Power Basics
(Power/Harmonics/Three Constants Related to the AC Circuit) ..................... App-17
xiii
14
15
16
17
App
Index
Page 16
Chapter 1 Explanation of Functions
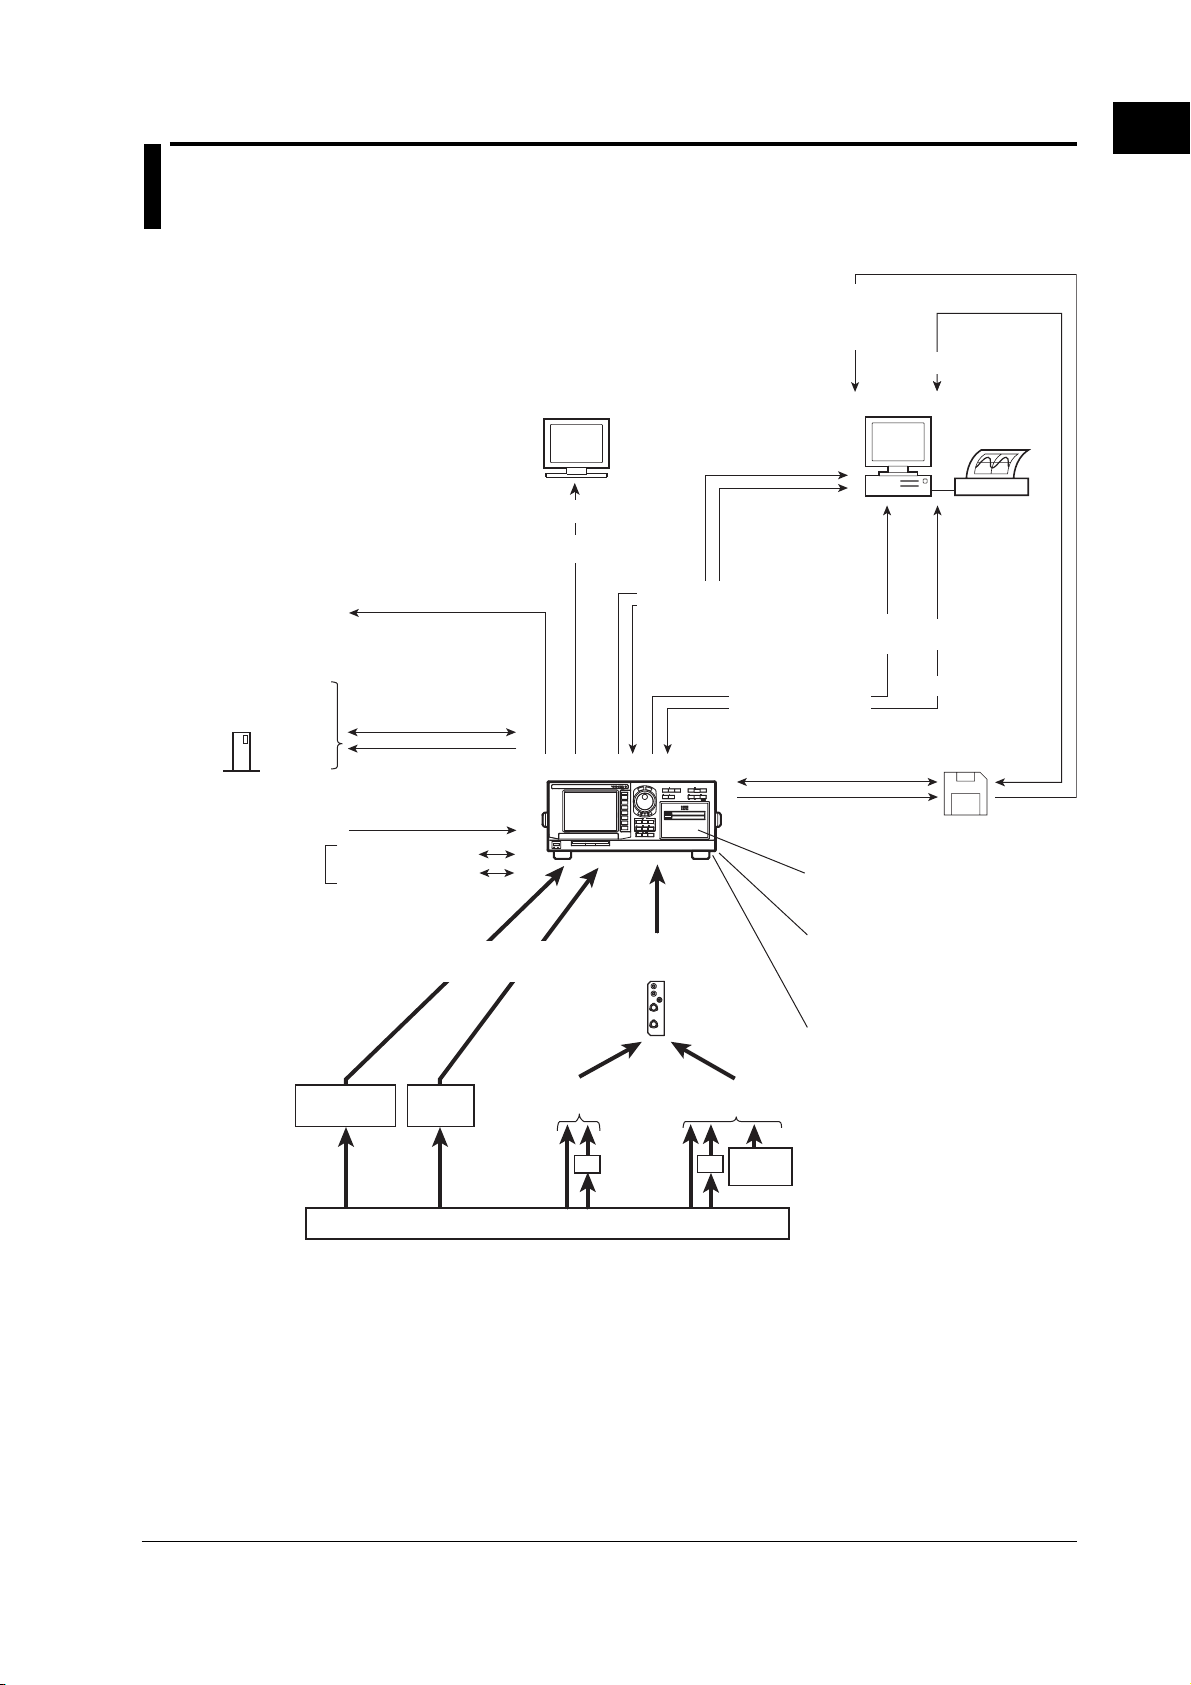
1.1 System Configuration and Block Diagram
System Configuration
Numerical data
Waveform display data
Screen image data
Stored data
Setup parameters
1
Explanation of Functions
Outputs measured
values using analog
voltage
PC
External
SCSI
device
External clock input
Master/slave
sync signal
Revolution
sensor
RGB video signal (VGA) output
D/A output (option)
SCSI interface
(option)
Setup parameters
Numerical data
Waveform display data
Screen image data
Stored data
Measurement start
Measurement stop
Motor evaluation
(option)
Torque
meter
CRT
Image signal
element
Voltage
(Input either one)
Numerical data
Waveform display data
Screen image data
Stored data
Setup parameters
Ethernet (option)
interface
GP-IB/serial*
interface
Setup parameters
Input
Current
(Input any one)
PC
Printer
Numerical data
Waveform display data
Setup parameters
Floppy disk
Numerical data
Waveform display data
Screen image data and stored data
Built-in printer (option)
Prints screen image/
numerical data list
Internal memory
Stores numerical data/
waveform display data
Recalls numerical data/waveform
display data
Built-in hard disk (option)
Saves stored data,
Saves setup parameters/
numerical data/
waveform display data/
screen image data
IM 760101-01E
PT
Item under measurement
* Conforms to EIA-574 (9-pin EIA-232(RS-232)).
CT
Current
sensor
1-1
Page 17
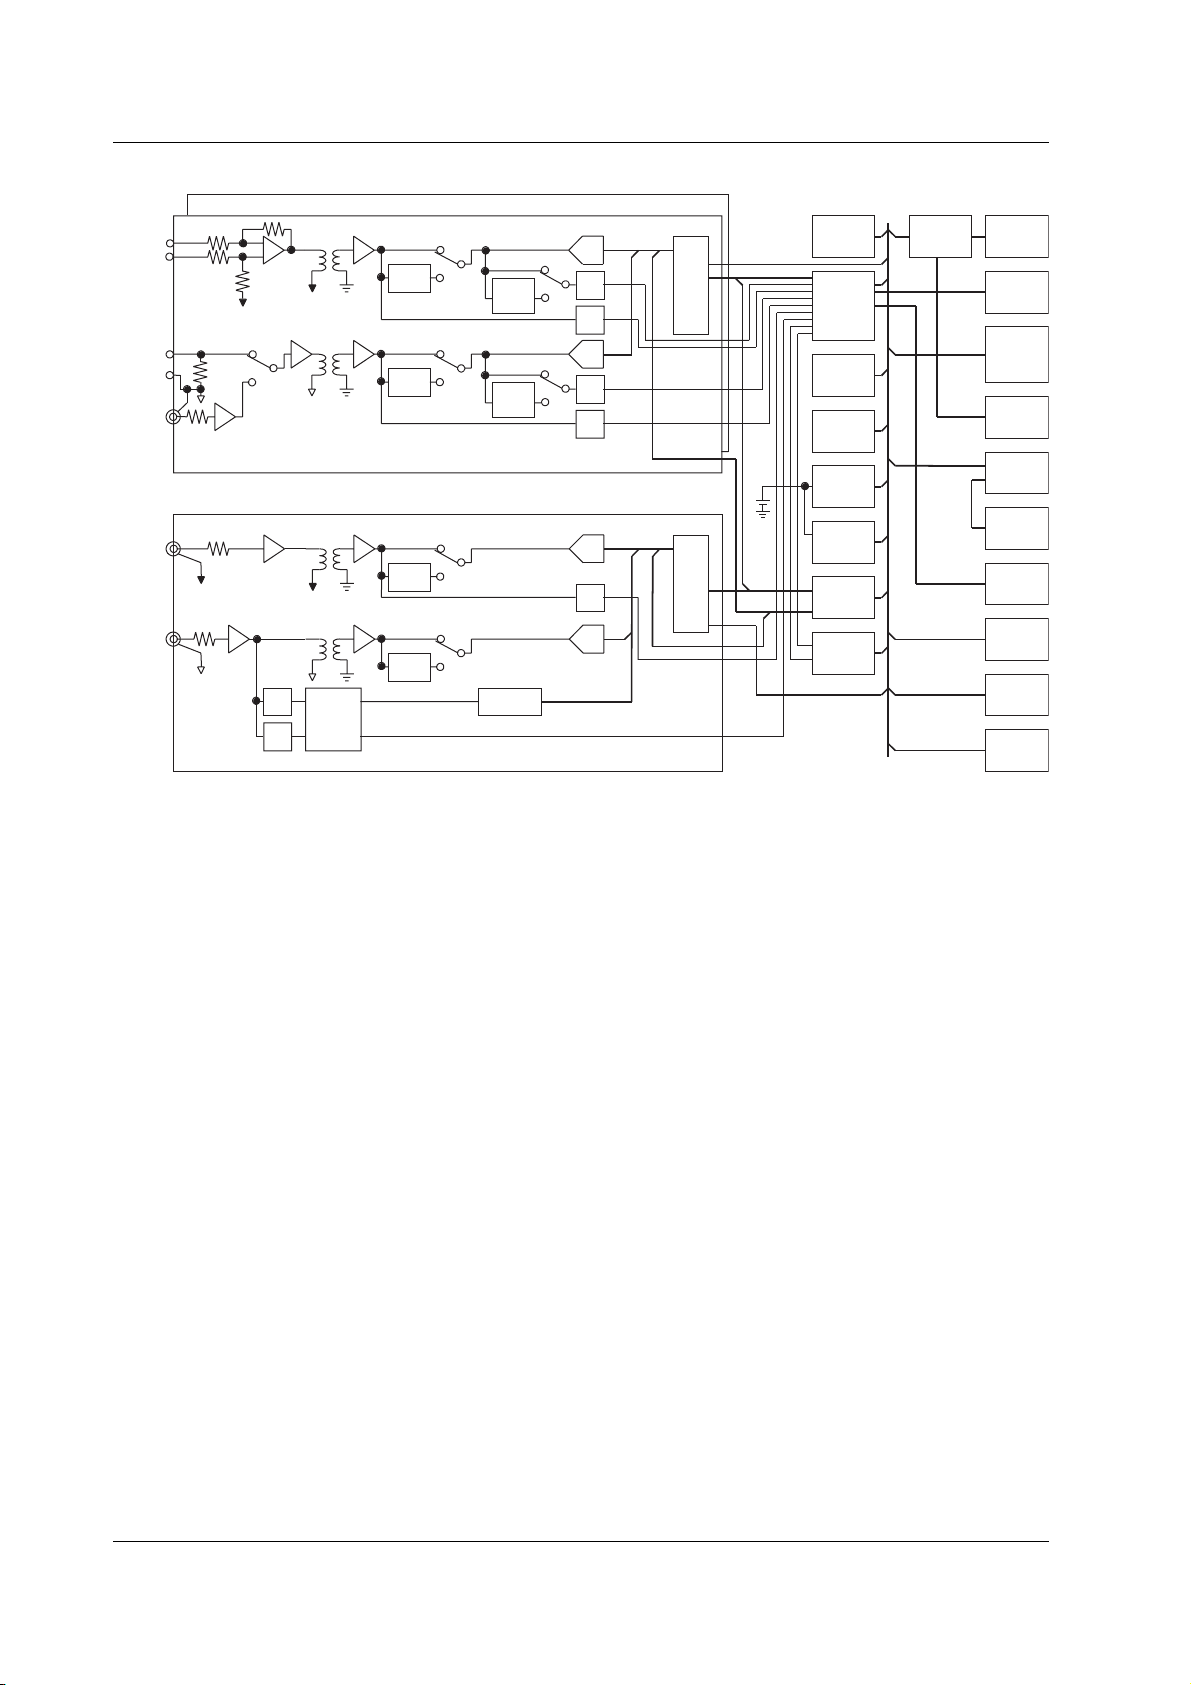
1.1 System Configuration and Block Diagram
Block Diagram
ELEMENT2~6
ELEMENT1
Line
Filter
Line
Filter
EXT
U
±
I
±
Zero
Cross
Filter
Zero
Cross
Filter
A/D
ZERO
DET.
PEAK
DET.
A/D
ZERO
DET.
PEAK
DET.
DSP
CPU
CPU
G.A
ROM
DRAM
SRAM
Display
G.A
.
”
6.4
LCD
KEY&
LED
GP-IB
or
Serial
PRINTER
(option)
SCSI
(option)
TORQUE
SPEED
MOTOR(option)
ZERO
DET.
PHOTO
ISO.
PEAK
DET.
HDD
(option)
I/O
D/A
(option)
10BASE-T
(option)
Line
Filter
Line
Filter
COUNTER
A/D
PEAK
DET.
A/D
RTC
DSP
DSP
PLL
FDD
Signal Flow and Process
The input circuits, Elements 1 through 6, consist of a voltage input circuit and a current
input circuit. The input circuits are mutually isolated. They are also isolated from the case.
The voltage signal that is applied to the voltage input terminal (U, ± ) is normalized using the
voltage divider of the voltage input circuit and an operational amplifier (OP AMP). It is then
isolated by the transformer and input to a voltage A/D converter.
The current input circuit is equipped with two types of input terminals, a current input terminal
(I, ± ) and a current sensor input connector (EXT). Either one can be used at any given time.
The voltage signal from the current sensor that received the signal at the current sensor input
connector is normalized using the voltage divider and an operational amplifier (OP AMP). It is
then isolated by the transformer and input to a current A/D converter. The current signal that is
applied to the current input terminal is converted to a voltage by a current divider. Then, it is input
to the current A/D converter in the same fashion as the voltage signal from the current sensor.
During normal measurement, the voltage signal that is input to the voltage A/D converter or
current A/D converter is converted to digital values at an interval of approximately 5 µs.
The measured value is derived using a DSP based on the converted digital values.
During harmonic measurement, the applied voltage signal is converted to digital values at
an interval that is an integer multiple of the PLL source signal (cycle of the clock generated
by the PLL circuit). The measured value of each item of harmonic measurement is derived
by performing an FFT based on the converted digital values using a DSP.
The measured value is transmitted to the CPU. Various computed values are
determined from the measured values. These measured values and computed values
are displayed, output through a D/A output, or output through communications.
When waveform display data is not being retrieved during normal measurement, the DSP
and CPU processes are pipelined, and the DSP process is executed in real-time.
Therefore, measurements with few data dropouts can be achieved against the input signal.
1-2 IM 760101-01E
Page 18

1.2 Measurement Function and Measurement Period
Types of Measurement Functions during Normal Measurement
The data (numerical data) of measurement functions during normal measurement is
measured or computed from the sampled data*1 described later in “Measurement
Period.”
*1 The WT1600 samples the instantaneous values of the voltage and current signals at a
specified sample rate*2. The sampled data is processed as numerical data or data used to
display waveforms on the screen (waveform display data).
*2 Sample rate represents the number of data points that are sampled within 1 s. For example,
at a sample rate of 200 kS/s, 200000 data points are sampled every second.
• Types of Measurement Functions
• Measurement functions on each input element
The following 29 types of measurement functions are available. For details on the
determination of each measurement function data, see appendix 1.
U (voltage Urms, Umn, Udc, Uac), I (current Irms, Imn, Idc, Iac), P (active power),
S (apparent power), Q (reactive power), λ (power factor), φ (phase difference), fU/fI
(also expressed as fU: FreqU and fI: FreqI, measures the frequencies of up to
three voltage/current signals), U+pk/U-pk (maximum/minimum values of voltage),
I+pk/I-pk(maximum/minimum values of current), CfU/CfI(crest factor of voltage/
current), FfU/FfI (form factor of voltage/current), Z (impedance of the load circuit),
Rs/Xs (resistance/reactance of the load circuit that has a resistor R, inductor L, and
capacitor C connected in series), Rp/Xp (resistance/reactance of the load circuit
that has a R, L, and C connected in parallel), Pc (Corrected Power)
1
Explanation of Functions
• Measurement functions of the average or sum of input elements (Σ functions)
The following 19 types of measurement functions are available. For details on the
determination of each measurement function data, see appendix 1.
UΣ (voltage average UrmsΣ, UmnΣ, UdcΣ, UacΣ), IΣ (current average IrmsΣ, ImnΣ,
IdcΣ, IacΣ), PΣ (sum of active powers), SΣ (sum of apparent powers), QΣ (sum of
reactive powers), λΣ (power factor average), φΣ (phase difference average), ZΣ
(impedance average of the load circuit), RsΣ/XsΣ (average of the resistance/
reactance of the load circuit that has a R, L, and C connected in series), RpΣ/XpΣ
(average of the resistance/reactance of the load circuit that has a R, L, and C
connected in parallel), PcΣ (sum of Corrected Powers)
• Efficiency (Σ functions)
η (Efficiency 1), 1/η (Efficiency 2). See “Efficiency” on the next page.
• Measurement functions of integration
See section 1.6.
IM 760101-01E
1-3
Page 19
1.2 Measurement Function and Measurement Period
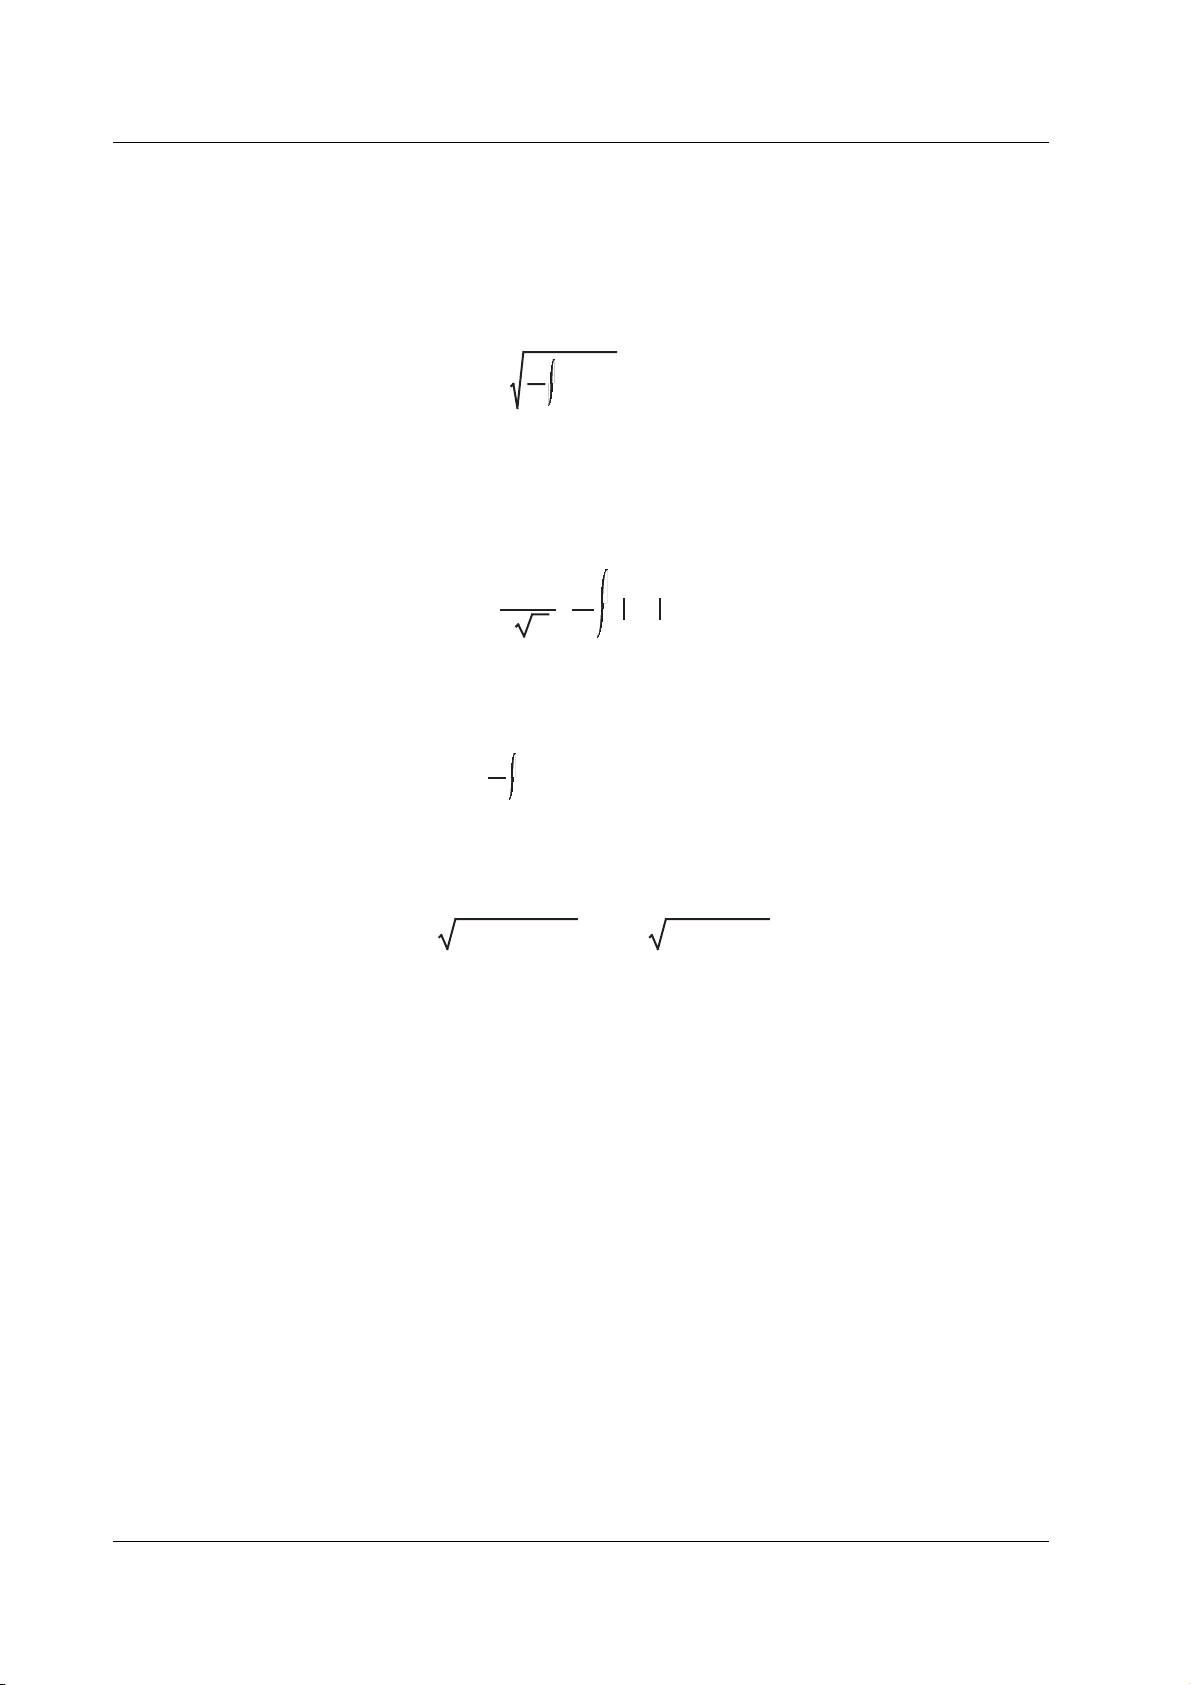
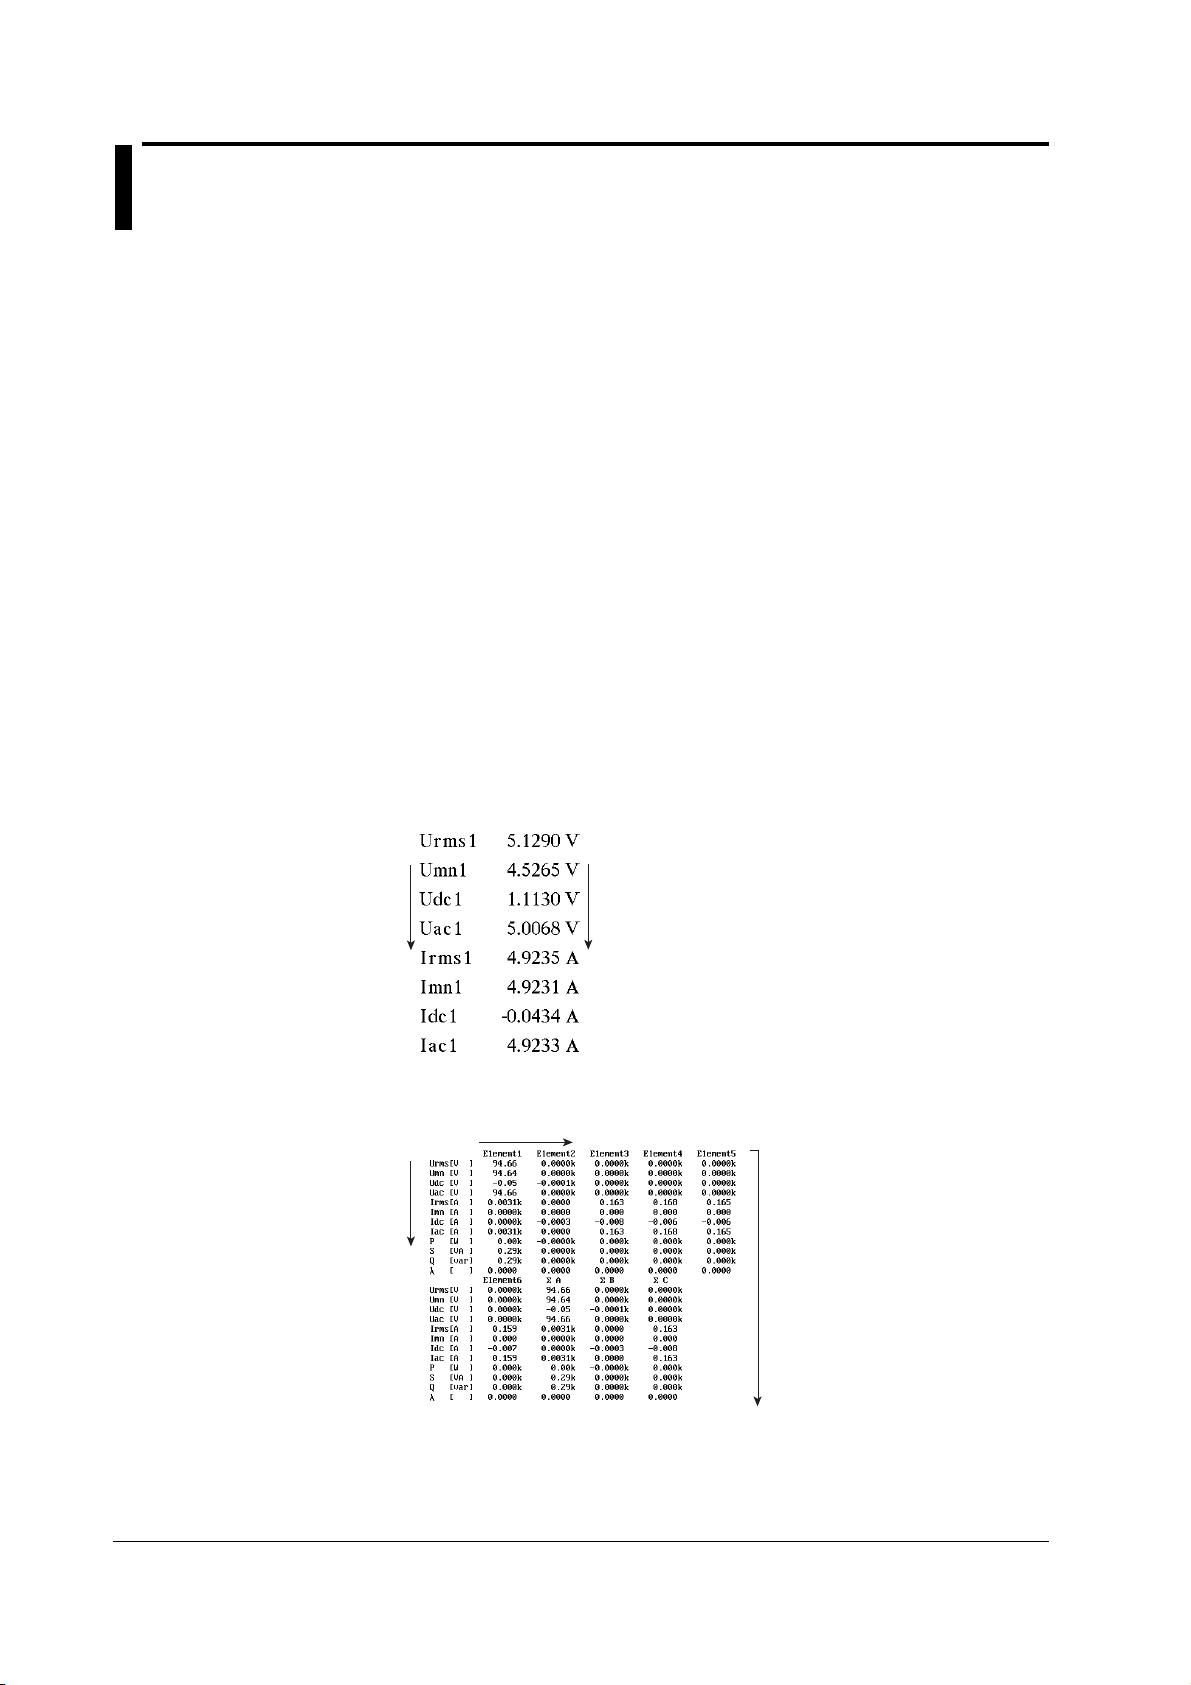
Determining the Voltage and Current
There are four types of measurement functions for voltage (U) and current (I).
• Urms, Irms (true rms value)
These values are the true rms values of the voltage and current. The
instantaneous values over one period are squared and averaged. Then, the
square root of the value is determined. f(t) and T represent the input signal as a
function of time and the period of the input signal, respectively.
Urms or Irms =
1
T
• Umn, Imn (rectified mean value calibrated to the rms value)
This function rectifies one period of the voltage or current signal, determines the average,
and multiplies the result by a coefficient. The coefficient is a value that when applied to a
sinusoidal input signal, gives the true rms value. When the input signal is a distorted or is a
DC waveform, these values will differ from the true rms values. f(t) and T represent the
input signal as a function of time and the period of the input signal, respectively.
Umn or Imn =
π
2
2
• Udc, Idc (simple average)
These are the average values over one period of the voltage and current signal.
This function is useful when determining the average value of a DC input signal or
a DC component that is superimposed on an AC input signal.
T
Udc or Idc =
1
f(t) dt
T
0
• Uac, Iac (AC component)
These are the AC components of the voltage and current. They are the square
root values of the difference of the square of the true rms values of the input signal
and the square of the DC component.
T
f(t)2 dt
0
•
T
1
f(t) dt
T
0
Uac =
Urms
– Udc
2
or Iac =
Irms
2
– Idc
2
2
Element
Element refers to a set of input terminals that can input a single phase of voltage and
current to be measured. The WT1600 can contain up to six elements, which are
numbered from 1 to 6. The element number is appended to the symbols that were
defined in the earlier section, “Measurement functions on each input element” so that
the correspondence between the numerical data and the element can be seen. For
example, “Urms1” represents the true rms value of the voltage of element 1.
Wiring System
The selectable patterns of wiring systems vary depending on the number of input elements
that are installed in the instrument. You may be able to select only a single type of wiring
system or two or three types of wiring systems. When two or more types of wiring systems
are selected, “A”, “B”, or “C” is appended to the symbols that were defined in the earlier
section “Measurement functions of the average or sum of input elements (Σ functions)” so
that the correspondence between the numerical data and the wiring unit can be seen.
For example, “UrmsΣA” represents the true rms value of the average of the voltage of
the input elements that are assigned to wiring unit ΣA
Efficiency
η (efficiency 1) is determined by the equation (PΣB)/(PΣA) × 100; 1/η (efficiency 2) is
determined by the equation (PΣA)/(PΣB) × 100. You can create an equation using
user-defined functions to determine efficiencies other than the above two. In addition,
on models with the motor evaluation function (option), ηmA((Pm)/(PΣA) × 100) and
ηmB((Pm)/(PΣB) × 100) can be determined.
1-4 IM 760101-01E
Page 20
1.2 Measurement Function and Measurement Period
Types of Measurement Functions during Harmonic Measurement
The data (numerical data) of measurement functions during harmonic measurement is
measured or computed from the sampled data*1 described later in “Measurement Period.”
* See the description of the sampled data in the earlier section “Types of Measurement
Functions during Normal Measurement.”
Types of Harmonic Measurement Functions
• Harmonic measurement functions on each input element
The following 28 types of harmonic measurement functions are available. For
details on the determination of each measurement function data, see appendix 1.
1
Explanation of Functions
Measurement
Function
U( )
I( )
P( )
S( )
Q( )
λ( )
φ( )
φU( )
φI( )
Z( )
Rs( )
Xs( )
Rp( )
Xp( )
Uhdf( )
Ihdf( )
Phdf( )
Uthd
Ithd
Pthd
Uthf
Ithf
Utif
Itif
hvf
hcf
fU
fI
Chars and Numbers inside ( )
dc
Yes
Yes
Yes
Yes
Always 0
Yes
No
No
No
Yes
Yes
Yes
Yes
Yes
Yes
Yes
Yes
No
No
No
No
No
No
No
No
No
No
No
Yes
Yes
Yes
Yes
Yes
Yes
Yes
No
No
Yes
Yes
Yes
Yes
Yes
Yes
Yes
Yes
No
No
No
No
No
No
No
No
No
No
No
1
k
Yes
Yes
Yes
Yes
Yes
Yes
Yes
Yes
Yes
Yes
Yes
Yes
Yes
Yes
Yes
Yes
Yes
No
No
No
No
No
No
No
No
No
No
No
All
(No ( ))
Yes
Yes
Yes
Yes
Yes
Yes
Yes
No
No
No
No
No
No
No
No
No
No
Yes
Yes
Yes
Yes
Yes
Yes
Yes
Yes
Yes
Yes
Yes
Yes: Numerical data exists
No: Numerical data does
not exist
• The meaning of measurement functions with parentheses varies depending on
the characters or numbers that are inside the parentheses as follows:
• dc: Indicates numerical data of the DC component.
• 1: Indicates numerical data of the fundamental signal.
• k: Indicates numerical data from 2
nd
to Nth order harmonics. N is the upper limit of
harmonic order under analysis (see section 17.6). The upper limit is determined
automatically (maximum is 100) by the frequency of the PLL source.
• All: No parentheses are appended after the measurement function. Indicates
numerical data related to all waveforms including the fundamental and harmonics.
• Uhdf to hcf are measurement functions that indicate characteristics specific to
the harmonics. For details on the determination of the measurement functions,
see appendix 1.
• The frequency of up to three signals including the signals selected for the PLL source
as fU (FreqU: voltage frequency) or fI (FreqI: current frequency) can be measured.
IM 760101-01E
1-5
Page 21

1.2 Measurement Function and Measurement Period
• Harmonic measurement function that indicates the phase difference (φ) of the
voltage and current between the input elements
There are five harmonic measurement functions that express the phase difference
(φ).
Explanation is given below for the case when the number of installed input
elements is 5, the wiring system pattern is three-phase, four-wire for ΣA and threephase, three-wire for ΣB.
When the target of the harmonic measurement is set to wiring unit ΣA, the target
elements are 1, 2, and 3. The numerical data of the harmonic measurement
functions of phase difference concerning elements 1, 2, and 3 can be determined
as shown below.
When the target of the harmonic measurement is set to wiring unit ΣB, the target
elements are 4 and 5. The numerical data of the harmonic measurement functions
of phase difference concerning elements 4 and 5 (φU4-U5, φU4-I4 and φU4-I5) can
be determined. The phase difference φU4-U-6 and φU4-I6 cannot be determined.
• φU1-U2
Phase difference of the fundamental voltage U2(1) of element 2 with respect to
the fundamental voltage U1(1) of element 1.
• φU1-U3
Phase difference of the fundamental voltage U3(1) of element 3 with respect to
the fundamental voltage U1(1) of element 1.
• φU1-I1
Phase difference of the fundamental current I1(1) of element 1 with respect to
the fundamental voltage U1(1) of element 1.
• φU1-I2
Phase difference of the fundamental current I2(1) of element 2 with respect to
the fundamental voltage U1(1) of element 1.
• φU1-I3
Phase difference of the fundamental current I3(1) of element 3 with respect to
the fundamental voltage U1(1) of element 1.
• Harmonic measurement function of the average or of the sum of the input
elements (Σ functions)
The following 6 types of harmonic measurement functions are available. For
details on the determination of each measurement function, see appendix 1.
Measurement
Function
UΣ( )
IΣ( )
PΣ( )
SΣ( )
QΣ( )
λΣ( )
Chars and Numbers
inside ( )
1
Yes
Yes
Yes
Yes
Yes
Yes
All
(No ( ))
Yes
Yes
Yes
Yes
Yes
Yes
Yes: Numerical data exists
• For measurement functions with parentheses, the value “1” is entered in the
parentheses. This represents the numerical data of the fundamental signal.
• All: No parentheses are appended after the measurement function. Indicates
numerical data related to all waveforms including the fundamental and
harmonics.
1-6 IM 760101-01E
Page 22

1.2 Measurement Function and Measurement Period
Element
Element refers to a set of input terminals that can input a single phase of voltage and
current to be measured. The WT1600 can contain up to six elements, which are
numbered from 1 to 6. The element number is appended to the symbols that were
defined in the earlier section, “Harmonic measurement functions on each input
element” so that the correspondence between the numerical data and the element
can be seen. For example, “U1(2)” represents the voltage of the 2
of element 1.
Wiring System
The selectable patterns of wiring systems vary depending on the number of input
elements that are installed in the instrument. You may be able to select only a single
type of wiring system or two or three types of wiring systems. When two or more
types of wiring systems are selected, “A”, “B”, or “C” is appended to the symbols that
were defined in the earlier section “Harmonic measurement functions of the average
or sum of input elements (Σ functions)” so that the correspondence between the
numerical data and the wiring unit can be seen.
For example, “UΣA(1)” represents the average of the voltage of the fundamental
signal of the input elements that are assigned to wiring unit ΣA.
PLL Source «For procedures, see section 7.4»
When measuring harmonics, the fundamental period (period of the fundamental
signal) must be determined in order to analyze the higher orders. The PLL (phase
locked loop) source is the signal that is used to determine the fundamental period.
Selecting a signal with little distortion or fluctuation for the PLL source will result in a
stable harmonic measurement. An ideal signal would be a rectangular wave with
amplitude that is greater than or equal to 50% or 100% of the measurement range
(see section 1.3) when the crest factor (see section 5.11) is set to 3 or 6, respectively.
In addition, a sampling clock signal (Smp Clk) with a frequency that is 2048 times the
fundamental frequency of the waveform on which to perform harmonic measurements
can be input to the external clock input connector. Stable harmonic measurement is
achieved by using this sampling clock to sample data from the target waveform.
Stable harmonic measurement can also be achieved by applying a clock signal (Ext
Clk) that has the same period as the waveform on which to perform harmonic
measurements.
nd
order harmonic
1
Explanation of Functions
Types of Measurement Functions of the Motor Evaluation Function (Option)
By using the motor evaluation function (option), the rotating speed, torque, and output of
a motor can be determined from the DC voltage (analog signal) or pulse count signal
received from a revolution sensor, which is proportional to the rotating speed of the
motor, and the DC voltage (analog signal) received from a torque meter, which is
proportional to the motor’s torque. In addition, the synchronous speed and slip of a
motor can be determined by setting the motor’s number of poles. Furthermore, the
active power and frequency that are measured by the WT1600 and the motor output can
be used to compute the motor efficiency and the total efficiency.
Types of Measurement Functions
Speed (rotating speed), Torque, Pm (motor output or mechanical power),
synchronous speed (Sync), Slip, motor efficiency (ηmA), and total efficiency (ηmB).
For details on the determination of the measurement functions, see appendix 1.
IM 760101-01E
1-7
Page 23
1.2 Measurement Function and Measurement Period
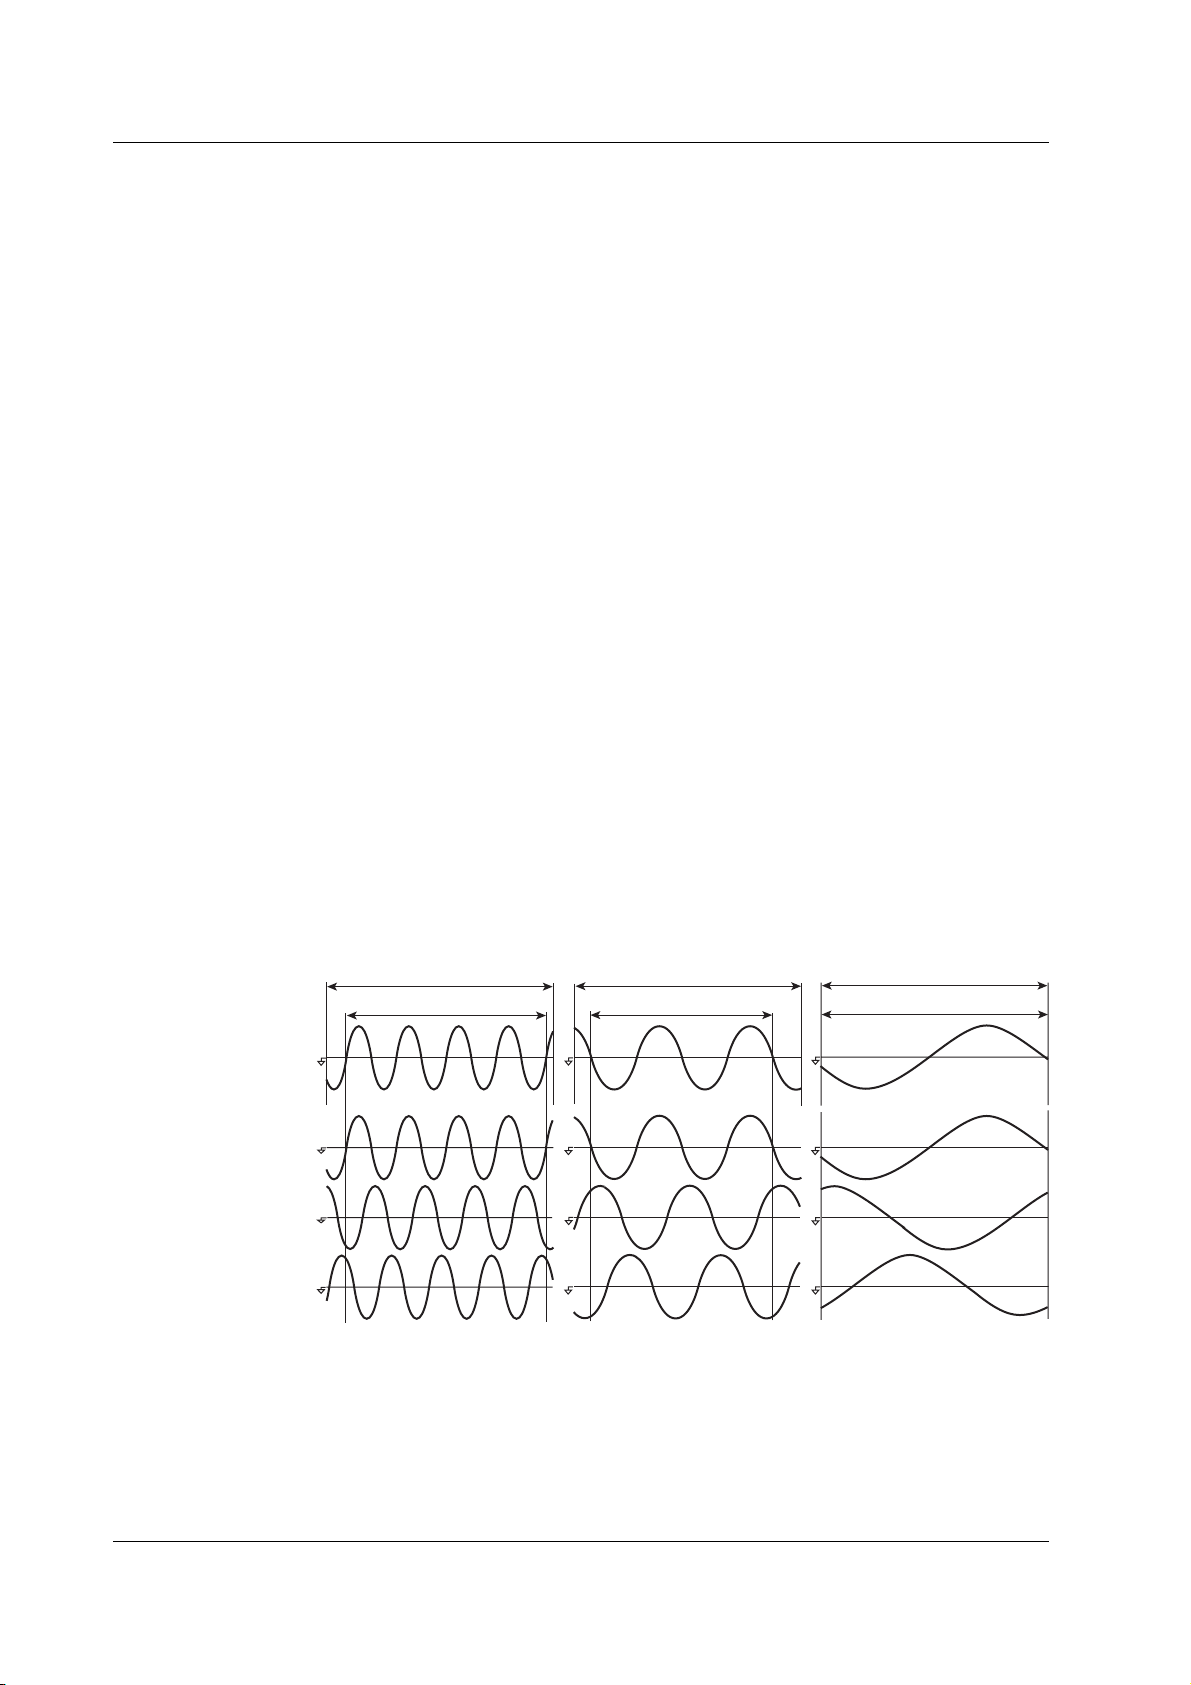
Measurement Period
During Normal Measurement
The numerical data is measured or computed using the sampled data*1 in the
measurement period that is determined according to the following principle*2.
• The measurement period is set between the first point where the reference input
signal (synchronization source) crosses the level zero point (center of the
amplitude) on the rising slope (or falling slope)*3 within the data update interval
and the last point where the synchronization source crosses the level zero point
(center of the amplitude) on the rising slope (or falling slope) within the data update
interval.
• The rising or falling edge is automatically selected for the one that allows the
interval to be longer.
• If the number of rising slope or falling slope is zero or one within the data update
interval, the measurement period is set to the entire span within the data update
interval.
• You can select which input signal will be the synchronization source (synchronized
to the zero crossing point of the input signal) for each element. You can select the
voltage, current, or external clock that is input to the element to be the
synchronization source signal.
*1 For details on the sampled data, see the description of the sampled data in the earlier
section “Types of Measurement Functions during Normal Measurement.”
*2 The measurement period for determining the numerical data of the peak voltage or peak
current is the entire span within the data update interval. Therefore, the measurement
period for the measurement functions U+pk, U-pk, I+pk, I-pk, CfU, CfI, FfU, and FfI that
are determined from the maximum value of the voltage and current is also the entire span
within the data update interval.
*3 Slope refers to the movement of the signal from a low level to a high level (rising edge) or
from a high level to a low level (falling edge).
*4 The data update interval is the interval by which the data is sampled for determining the
measurement functions. This is equivalent to the value you can specify in “Data Update
Rate” of section 1.3.
*4
Data update interval
Measurement period
Synchronization source
Input signal U1
Input signal U2
Input signal U3
Data update interval
Measurement period
Data update interval
Measurement period
During Harmonic Measurement
The data length (the number of sampled data) to be used in harmonic measurement is
set to 8192, 4096, or 2048 points. The selected data length is the measurement
period. When the waveform is displayed, the measurement period corresponds to
one screen of the waveform.
1-8 IM 760101-01E
Page 24
1.3 Measurement Conditions
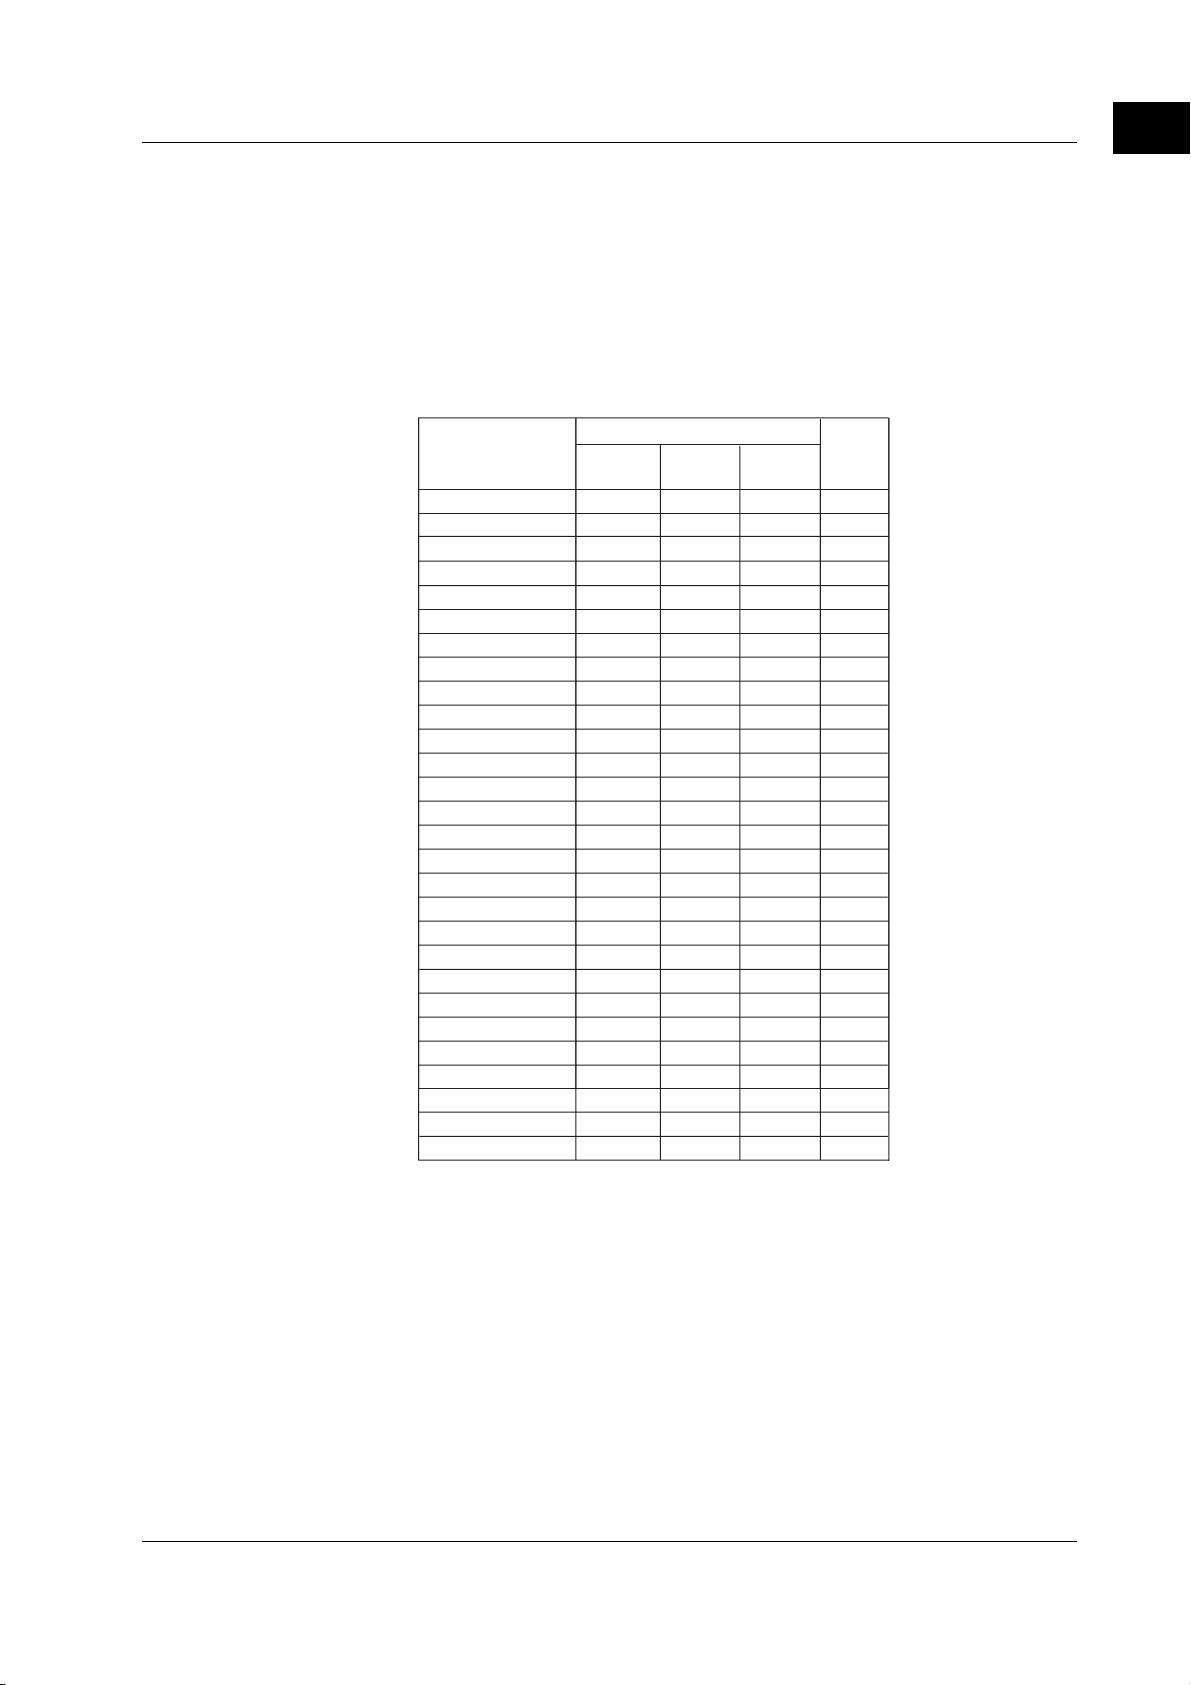
Number of Installed Input Elements and Wiring Systems «For procedures, see section 5.1.»
• The selectable patterns of wiring systems vary depending on the number of input
elements that are installed in the instrument. You may be able to select only a single
type of wiring system or two or three types of wiring systems. You can select the
wiring system from the following five types.
1P2W (single-phase, two-wire), 1P3W (single-phase, three-wire), 3P3W (three-phase,
three-wire), 3P4W (three-phase, four-wire), and 3V3A (three-voltage, three-current)
• The input element assignment to wiring units ΣA, ΣB, and ΣC is determined from the
wiring system pattern. This allows Σ functions of voltage, current, active power,
apparent power, reactive power, power factor, phase difference, and other parameters
to be determined. For the relationship between the wiring system and the
determination of the Σ function, see appendix 1.
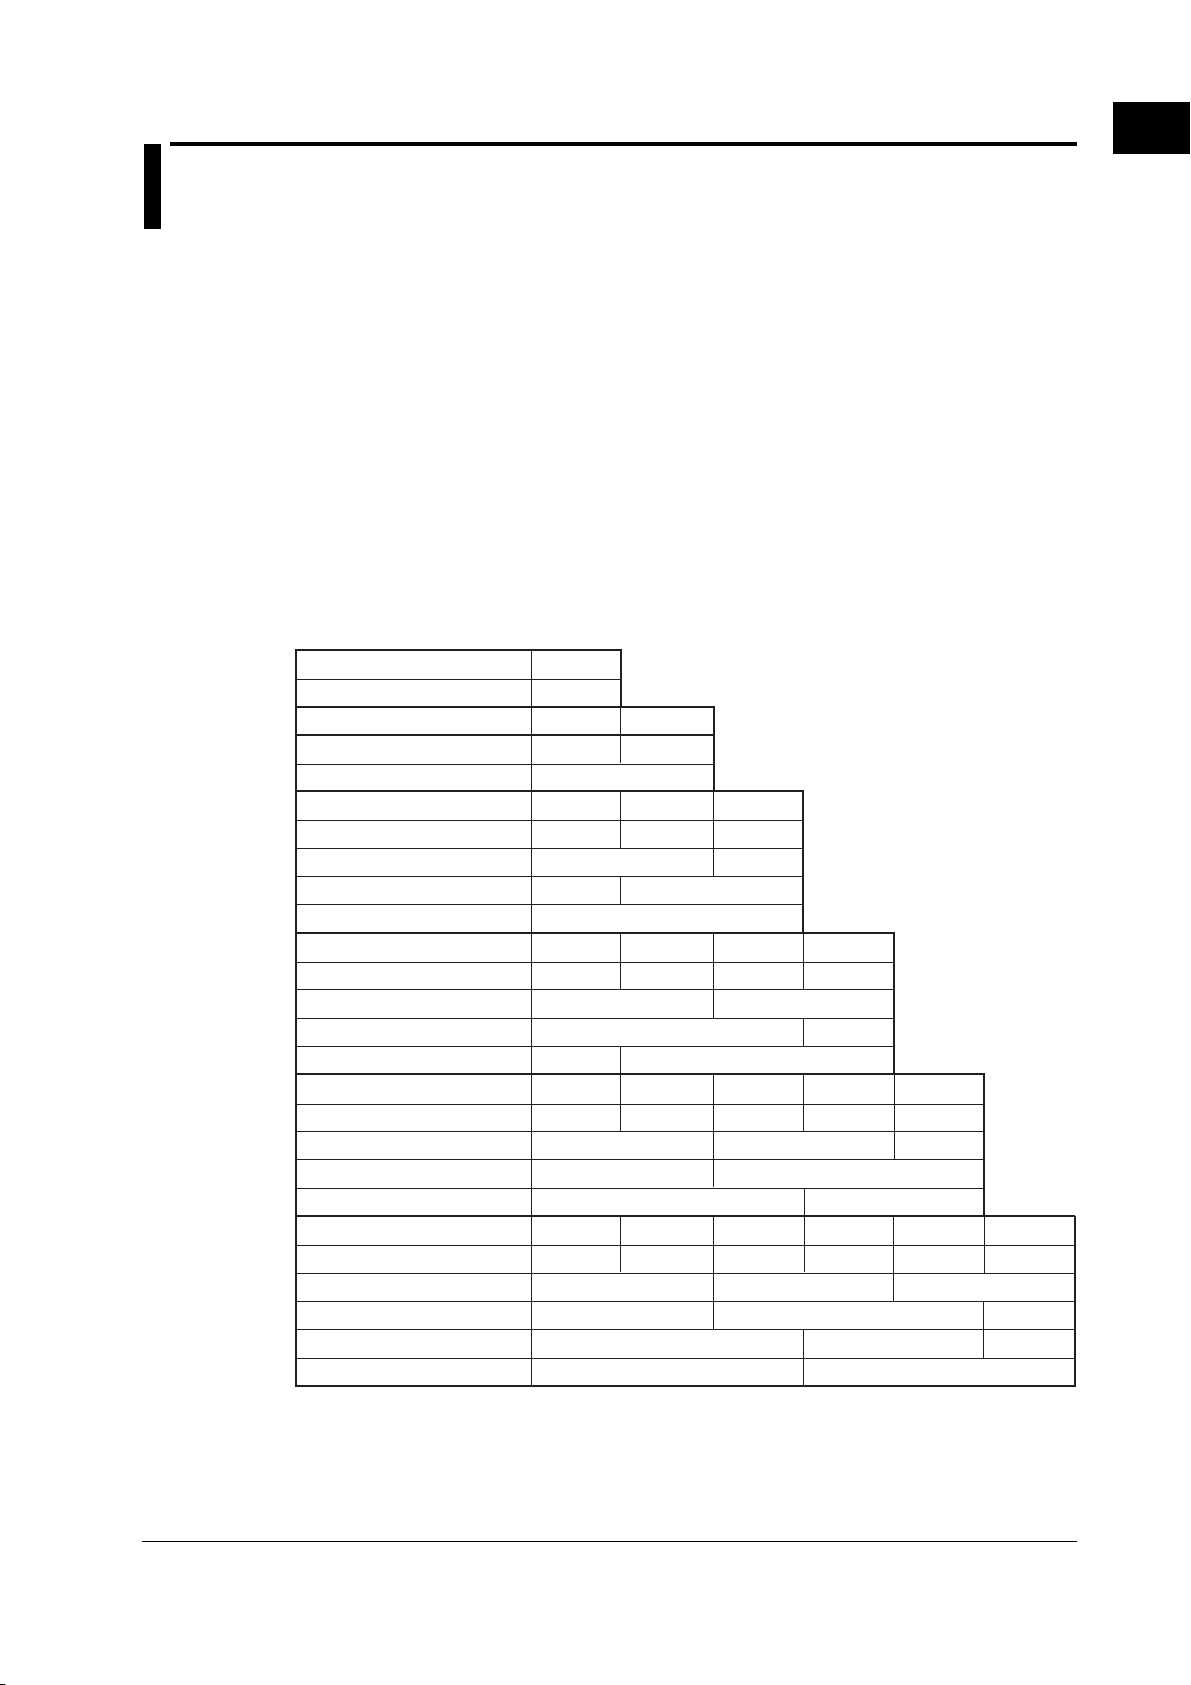
• The following table shows the relationship between the number of installed elements,
the selectable wiring system patterns, and the assignment of input elements to wiring
units ΣA, ΣB, and ΣC.
1
Explanation of Functions
Installed input elements
Wiring system pattern 1
Installed input elements
Wiring system pattern 1
Wiring system pattern 2
Installed input elements
Wiring system pattern 1
Wiring system pattern 2
Wiring system pattern 3
Wiring system pattern 4
Installed input elements
Wiring system pattern 1
Wiring system pattern 2
Wiring system pattern 3
Wiring system pattern 4
Installed input elements
Wiring system pattern 1
Wiring system pattern 2
Wiring system pattern 3
Wiring system pattern 4
Installed input elements
Wiring system pattern 1
Wiring system pattern 2
Wiring system pattern 3
Wiring system pattern 4
Wiring system pattern 5
1
1P2W
1
1P2W
1P3W or 3P3W(ΣA)
1
1P2W
1P3W or 3P3W(ΣA)
1P2W(ΣA)
3P4W or 3V3A(ΣA)
1
1P2W
1P3W or 3P3W(ΣA)
3P4W or 3V3A(ΣA)
1P2W(ΣA)
1
1P2W
1P3W or 3P3W(ΣA) 1P3W or 3P3W(ΣB)
1P3W or 3P3W(ΣA) 3P4W or 3V3A(ΣB)
3P4W or 3V3A(ΣA) 1P3W or 3P3W(ΣB)
1
1P2W
1P3W or 3P3W(ΣA) 1P3W or 3P3W(ΣB) 1P3W or 3P3W(ΣC)
1P3W or 3P3W(ΣA) 3P4W or 3V3A(ΣB) 1P2W(ΣC)
3P4W or 3V3A(ΣA)
3P4W or 3V3A(ΣA) 3P4W or 3V3A(ΣB)
2
1P2W
2
1P2W
1P3W or 3P3W(ΣB)
2
1P2W
3P4W or 3V3A(ΣB)
2
1P2W
2
1P2W
3
1P2W
1P2W(ΣB)
3
1P2W
1P3W or 3P3W(ΣB)
3
1P2W
3
1P2W
4
1P2W
1P2W(ΣB)
4
1P2W
4
1P2W
1P3W or 3P3W(ΣB)
1P2W
1P2W(ΣC)
1P2W
5
5
6
1P2W
1P2W(ΣC)
IM 760101-01E
1-9
Page 25

1.3 Measurement Conditions
Measurement Range «For procedures, see section 5.2.»
Set the measurement range using an rms level. When directly inputting voltage or
current signals to the input element, two types of measurement ranges is available, fixed
range and auto range. When waveforms are displayed, the vertical display range
corresponds to 3 or 6 times the measurement range when the crest factor (see section
5.11) is set to 3 or 6, respectively. For details on waveform display, see section 1.7,
“Waveform Display.”
Fixed Range
Select each range from a number of choices. The selected range does not switch
even if the amplitude of the input signal changes. For voltage, the maximum and
minimum selectable ranges are 1000 V and 1.5 V, respectively, when the crest factor
is set to 3. When the crest factor is set to 6, the maximum and minimum selectable
ranges are 500 V and 750 mV, respectively.
Auto Range
The measurement range switches automatically depending on the amplitude of the
input signal. The different ranges used in the auto range are the same as those
available for fixed range.
• Range increase
• When the data of measurement function Urms or Irms exceeds 110% of the
current measurement range, the measurement range is increased.
• When the peak value of the input signal exceeds 330% or 660% of the current
measurement range when the crest factor is set to 3 or 6, respectively, the
range is increased.
• Range decrease
When the data of the measurement function Urms or Irms is less than or equal to
30% of the measurement range and Upk and Ipk is less than or equal to 300% or
600% of the next lower range when the crest factor is set to 3 or 6, respectively,
the range is decreased.
Power Range
The measurement ranges (power ranges) of active power, apparent power, and
reactive power are determined by the wiring system, voltage range, and current range
as follows. For the actual values of the measurement range, see section 5.2, “Setting
the Measurement Range during Direct Input.”
Wiring System Power Range
1P2W (single-phase, two-wire) voltage range × current range
1P3W (single-phase, three-wire) voltage range × current range × 2
3P3W (three-phase, three-wire) (when the voltage and current ranges on the
3V3A (three-voltage, three-current) corresponding elements are set to the same range)
3P4W (three-phase four-wire) voltage range × current range × 3
(when the voltage and current ranges on the
corresponding elements are set to the same range)
1-10 IM 760101-01E
Page 26

Scaling «For procedures, see sections 5.3 and 5.4.»
When inputting current signals via an external current sensor or inputting voltage or
current signals via the external PT (potential transformer) or CT (current transformer),
the transformation ratio and coefficient can be specified.
When Inputting Current Signals via an External Current Sensor
The output of current sensors, such as shunts and clamps, can be input to the current
sensor connector (EXT) and be measured. Set how many mV the current sensor
outputs when 1 A of current flows (transformation ratio). Then, the input signal can be
made to correspond to the numerical data or waveform display data that are obtained
when the current is directly applied to the input terminals.
Measurement Function Transformation Ratio Data before Conversion Conversion Result
Current I E IS(current sensor output) IS/E
Active power P E P
Apparent power S E S
Reactive power Q E Q
Max./Min. current value Ipk E IpkS(current sensor output) IpkS/E
When Inputting Voltage or Current Signals via an External PT or CT
Measurements can be made by connecting the output of the secondary side of the PT
and the output of the secondary side of the CT to the same voltage and current input
terminals that are used when directly inputting a signal. Set the PT ratio, CT ratio,
and power coefficient (coefficient multiplied to the power determined from the voltage
and current). Then, the input signal can be made to correspond to the numerical data
or waveform display data that are obtained when the current is directly applied to the
input terminals.
Measurement Function Data before Conversion Conversion Result
Voltage U U2(secondary output of PT) U2 × P P: PT ratio
Current I I2(secondary output of CT) II2 × C C: CT ratio
Active power P P
Apparent power S S
Reactive power Q Q
Max./Min. current value Ipk Ipk2(secondary output of CT) Ipk2 × C
2
2
2
1.3 Measurement Conditions
S
S
S
P2 × P × C × SF SF: Power coefficient
S2 × P × C × SF
Q2 × P × C × SF
PS/E
SS/E
QS/E
1
Explanation of Functions
Input Filter «For procedures, see section 5.5.»
There are two types of filters. This WT1600 makes measurements by synchronizing to
the input signal. Therefore, the frequency of the input signal must be measured
accurately.
Line Filter
The line filter is inserted into the circuit under measurement. It removes the noise
from the inverter and from distorted waveforms. The cutoff frequency can be
selected.
Zero Crossing Filter
This filter is inserted only into the frequency measurement circuit. Zero crossing
refers to the point where the input signal crosses the center level of the amplitude.
This filter is used to accurately detect the zero crossing point. The WT1600 detects
the zero crossing point with a hysteresis of approximately 5% or 10% of the
measurement range when the crest factor is set to 3 or 6, respectively. The zero
crossing detection is used to determine the measurement period, measure the
frequency, and determine the period of a PLL source.
IM 760101-01E
1-11
Page 27

1.3 Measurement Conditions
Averaging «For procedures, see section 5.6.»
The averaging function is effective when reading of the numerical display is difficult due
to fluctuations. This occurs when the fluctuation of the power supply or the load is large
or when the input signal frequency is low.
During Normal Measurement
Two types, exponential average and moving average, are available.
• Exponential average
The numerical data can be exponentially averaged using a specified attenuation
constant. Averaging is performed according to the following equation.
(Mn – D
D
D
n =
n – 1
+
Dn: Displayed value that has been exponentially averaged nth times. (The
displayed value D1 on the first time is M1.)
D
: Displayed value that has been exponentially averaged n-1th times.
n–1
Mn: Measured data on the nth time.
K: Attenuation constant (select from 2, 4, 8, 16, 32, and 64)
• Moving average
The numerical data can be linearly averaged using a specified average count.
Averaging is performed according to the following equation.
n – 1
K
)
M
n – (m – 1)
D
n =
+ • • • M
n – 2
+ M
n – 1
+ M
n
m
Dn: Displayed value obtained by linearly averaging m points of numerical data from
the n–(m–1)th to nth time
M
: Measured data on the n–(m–1)th time.
n–(m–1)
..............................
..............................
M
: Measured data on the n–2th time.
n–2
M
: Measured data on the n–1th time.
n–1
Mn: Measured data on the nth time.
m: Average count (select from 8, 16, 32, 64, 128, and 256)
During Harmonic Measurement
When the fundamental frequency is 50/60 Hz, the attenuation constant is
automatically adjusted so that a first-order low-pass filter with a time constant of 1.5 s
is achieved. Exponential averaging is performed using this attenuation constant. For
example, if the data length for the analysis is 8192 points and the fundamental
frequency of the PLL source is between 55 Hz and 75 Hz, the attenuation constant is
set to 5.625. For other frequencies, it is set to 4.6875.
1-12 IM 760101-01E
Page 28

Data Update Rate «For procedures, see section 5.7.»
This is the period by which the data is sampled for determining the measurement
functions.
During Normal Measurement
Select the value from 50 ms, 100 ms, 200 ms, 500 ms, 1 s, 2 s, and 5 s. The
numerical data is updated once at the selected period. You can increase the data
update rate to acquire relatively fast load fluctuations in the power system or decrease
the rate to acquire sampled data for several periods even for relatively long signals.
During Harmonic Measurement
The data update rate is determined by the fundamental frequency of the PLL source
and the number of periods of the PLL source used for the analysis.
Hold «For procedures, see section 5.8.»
The data display of each measurement function can be held. The communication output
data while the display is held is the held numeric data.
Single Measurement «For procedures, see section 5.8.»
While in the held condition, the measurement is performed once at the specified data
update rate and enters the held condition.
1.3 Measurement Conditions
1
Explanation of Functions
MAX Hold «For procedures, see section 5.9.»
Holds the maximum value of the numerical data. Holds the data of measurement
functions Urms, Umn, Udc, Uac, Irms, Imn, Idc, Iac, P, S, Q, U+pk, U-pk, I+pk, and I-pk
as well as the data of the Σ function of these functions while the MAX hold function is
enabled.
Master/Slave Synchronized Measurement «For procedures, see section 5.10.»
With the master instrument outputting measurement start and stop signals and the slave
instrument receiving those signals, synchronized measurement on two instruments is
achieved.
IM 760101-01E
1-13
Page 29
1.4 Numeric Display
The numerical data can be displayed. The display format differs between normal
measurement and harmonic measurement. In addition, the screen can be divided into
top and bottom halves so that the numerical data can be displayed simultaneously with
waveforms, bar graphs, or trends (explained later).
Display Resolution
The display resolution for voltage, current, active power, apparent power, reactive power,
and so on is 60000. When the range rating (rated value of the specified range) is
applied, the Σ function of voltage, current, active power, apparent power, reactive power,
and so on is set to the decimal point position and unit of the element with the lowest
display resolution of the target elements. For the display resolution during integration,
see section 6.11.
Numerical Display during Normal Measurement «For procedures, see sections 4.1 and 6.1.»
Selecting the Number of Displayed Items
You can select the number of displayed items in the range from 4 to all. When the
numerical data is displayed simultaneously with waveforms, bar graphs, or trends,
only half of the selected number of items is displayed. Not all the data can be
displayed on one screen. Thus, you can scroll through the displayed items to view
the succeeding data.
• Example in which eight items are displayed
Measurement function
• Example in which all items are displayed
Element and wiring system
Measurement function
Data
Data
1-14 IM 760101-01E
Page 30
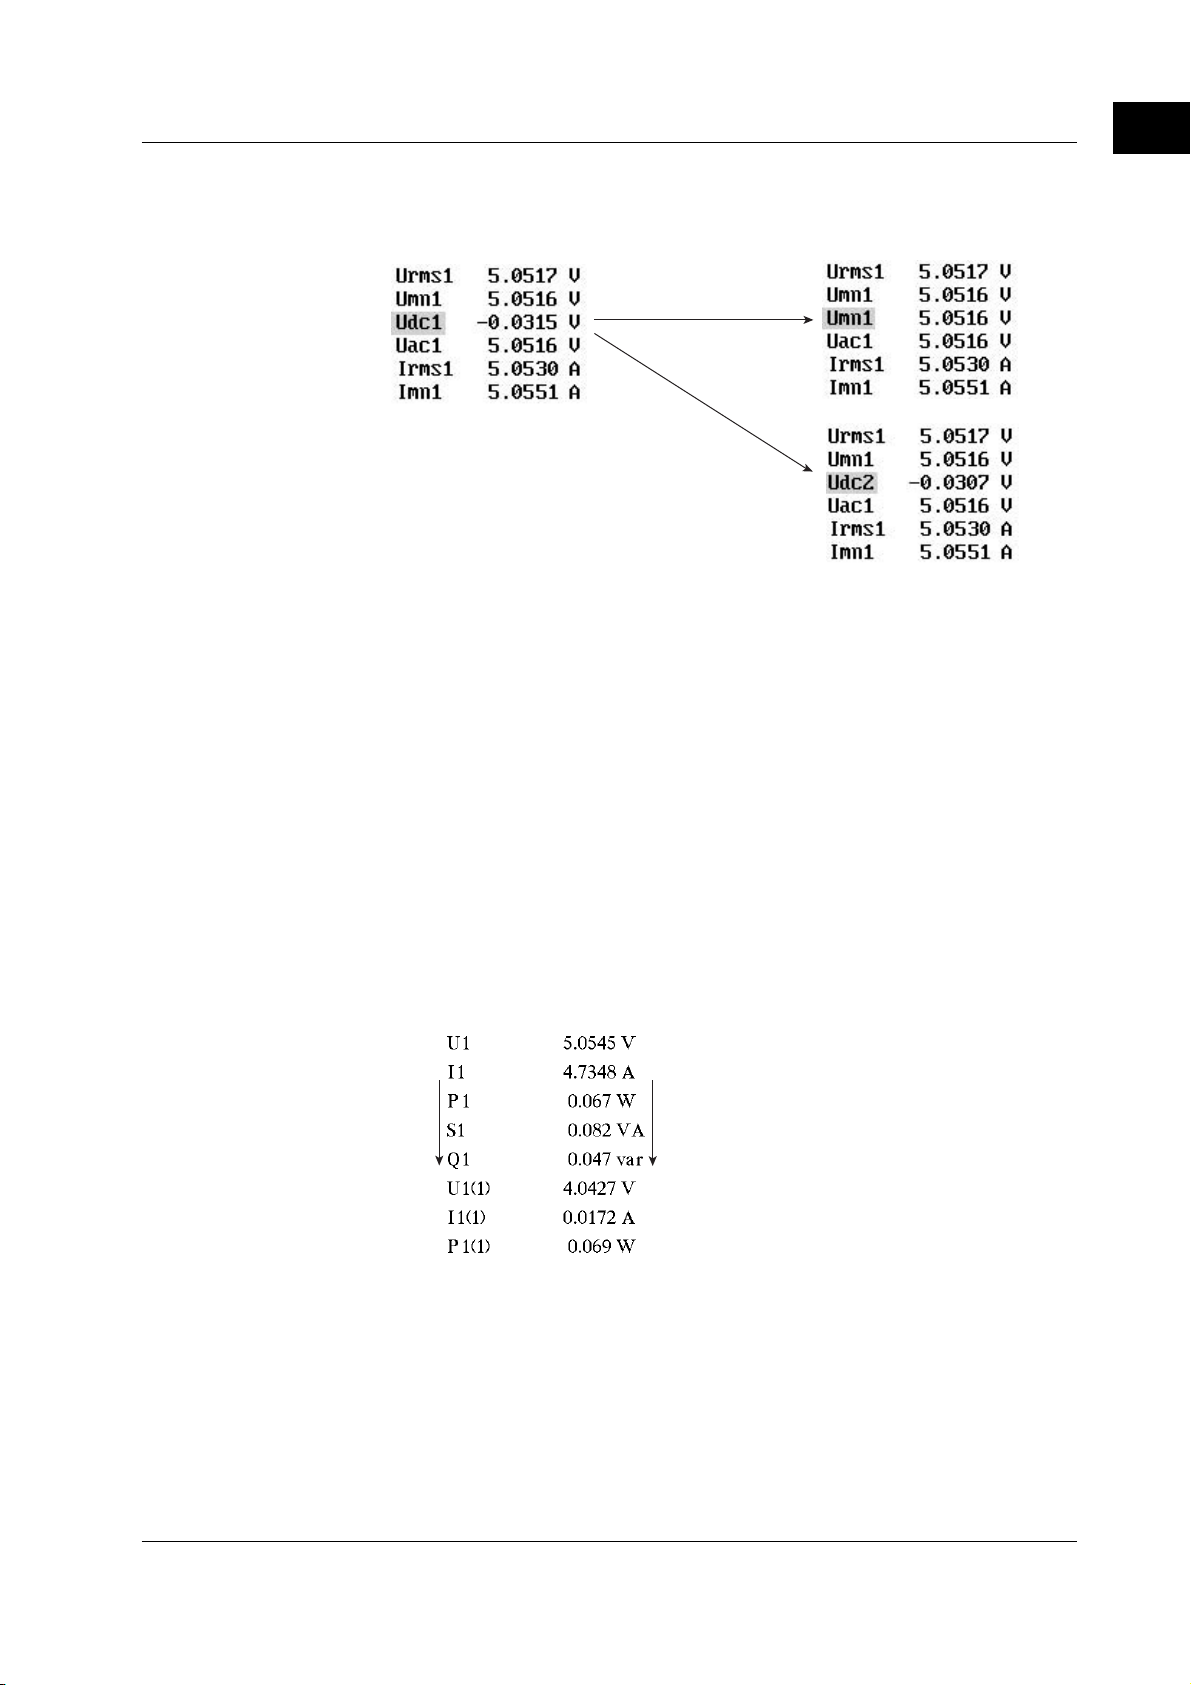
1.4 Numeric Display
Changing the Displayed Items
By selecting a displayed item, the numerical data value that is displayed at the
position can be changed.
Change the measurement
function of the third item
Change the element
of the third item
Scrolling the Page
Not all the data can be displayed on one screen. Thus, you can scroll the page to
display the succeeding (or preceding) data.
Resetting the Numerical Display
If the number of displayed items is set to a value other than All, the display order of
measurement functions can be reset to the default order (1 default set).
1
Explanation of Functions
Numerical Display during Harmonic Measurement «For procedures, see sections 4.1 and 7.2.»
Selecting the Number of Displayed Items
You can select four, eight or 16 for the number of displayed items. When the
numerical data is displayed simultaneously with waveforms, bar graphs, or trends,
only half of the selected number of items is displayed. Not all the data can be
displayed on one screen. Thus, you can scroll through the displayed items to view
the succeeding data.
Example in which eight items are displayed
Measurement function
Data
IM 760101-01E
1-15
Page 31
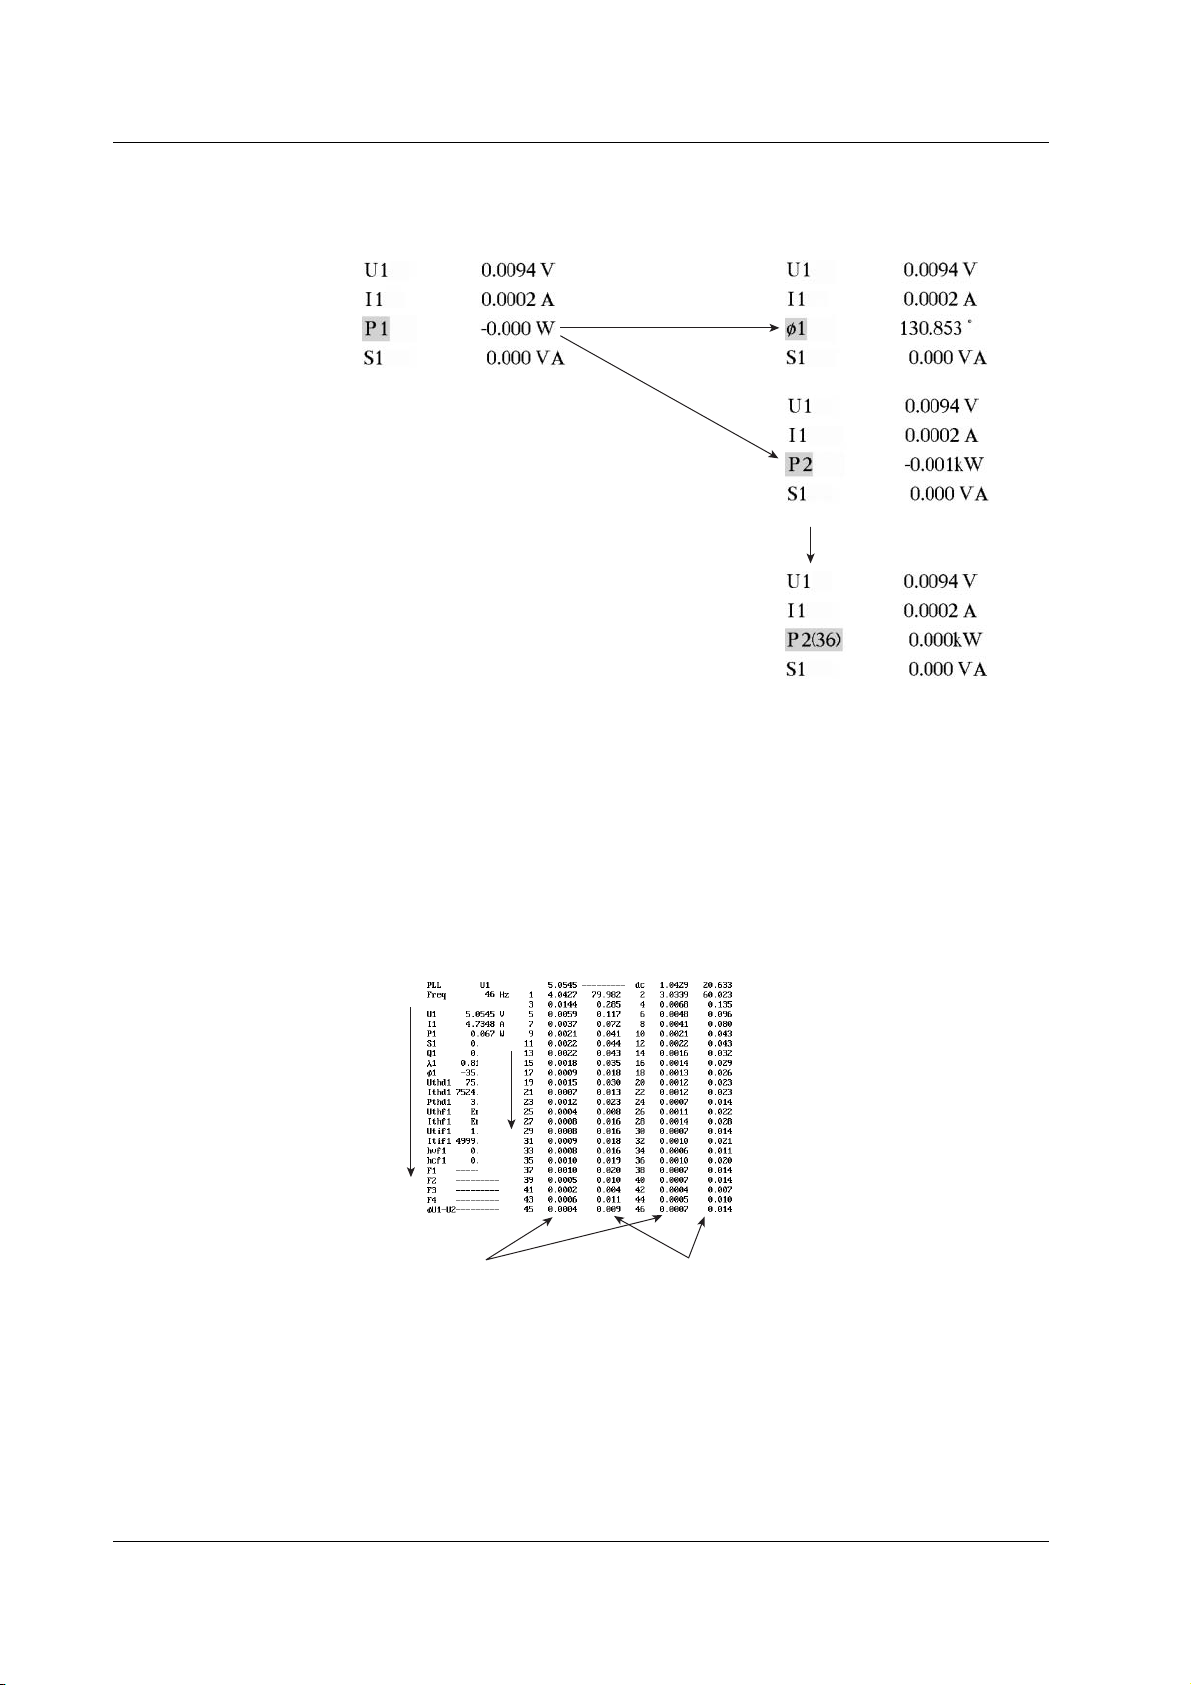
1.4 Numeric Display
Changing the Displayed Items When Four, Eight, or 16 Items Are Displayed
By selecting a displayed item, the numerical data value that is displayed at the
position can be changed.
Change the measurement
function of the third item
Change the element
of the third item
Change the harmonic
order
List Display
For each measurement function, the numerical data of the fundamental and all
harmonics can be displayed in two columns. When the numerical data is displayed
simultaneously with waveforms, bar graphs, or trends, approximately half of the data
is displayed.
• Single list
The data of a single measurement function is displayed by separating the even and
odd harmonics in each column. You can select the following measurement
functions: U, I, P, S, Q, λ, φ, φU, φI, Z, Rs, Xs, Rp, and Xp.
Data related to all harmonic signals
Harmonic order
Numerical data of
each harmonic
Harmonic distortion factor
(When the selected measurement function
is U, I, or P, Uhdf, Ihdf, or Phdf is displayed,
respectively.)
1-16 IM 760101-01E
Page 32

1.4 Numeric Display
• Dual list
The data of two measurement functions is displayed in its own column. You can
select the following measurement functions: U, I, P, S, Q, λ, φ, φU, φI, Z, Rs, Xs,
Rp, and Xp.
Data related to all harmonic signals
Harmonic order
1
Explanation of Functions
Numerical data of
each harmonic
Harmonic distortion factor
(When the selected measurement function
is U, I, or P, Uhdf, Ihdf, or Phdf is displayed,
respectively.)
• Σ list
Displays the numerical data of measurement functions (such as U, I, P, S, Q, λ, φ,
φU, φI, Z, Rs, Xs, Rp, Xp, φU1-U2, φU1-U3, φU1-I1, φU1-I2, and φU1-I3) of each
element and each wiring system for the selected harmonic orders.
Element and wiring system
Measurement function
Scrolling the Page
Not all the harmonic data can be displayed on one screen. When the list display is
not set to Σ list, you can scroll the page to display the succeeding (or preceding) data.
IM 760101-01E
Resetting the Numerical Display
If the number of displayed items is set to four, eight, or 16, the display order of
measurement functions can be reset to a default order (1 default set).
1-17
Page 33

1.5 Computation
By using the data of measurement functions, the following types of computation can be
performed. In addition, a function is provided in which the equation used to determine
the measurement function data can be selected.
User-Defined Functions «For procedures, see sections 6.4 and 7.8.»
Equations can be created (defined) by combining the measurement function symbols
and operators. The numerical data corresponding to the equation can then be
determined. The combination of a measurement function and element number (Urms1,
for example) constitutes an operand. Four equations (F1 through F4) can be defined for
normal measurement and harmonic measurement.
Operators
There are 11 types of operators: +, –, ∗, /, ABS (absolute value), SQR (square),
SQRT (square root), LOG (logarithm), LOG10 (common logarithm), EXP (exponent),
and NEG (negation).
Number of Operands
There can be up to 16 operands in one equation.
Delta Computation «For procedures, see section 6.5.»
Delta computation can be performed during normal measurement. For example, if
elements 1, 2, and 3 are assigned to wiring A, the sum or difference of the instantaneous
values (sampled data) of the voltage or current between elements 1, 2, and 3 can be
determined. Then, from the results, the measurement functions ∆Urms, ∆Irms, ∆Umn,
∆Imn, ∆Udc, ∆Idc, ∆Uac, and ∆Iac can be determined. This operation is called delta
computation. The delta computation can be used, for example, to perform star-to-delta
transformation of a three-phase AC circuit. For the equation, see appendix 2. The
measurement period is the same as that described in section 1.2, “Measurement
Function and Measurement Period.”
Equation for the Apparent Power «For procedures, see section 6.6.»
The apparent power can be determined by the product of the voltage and current. The
voltage and current can be selected from the four types, (1) the true rms value, (2) the
rectified mean value calibrated to the rms value, (3) the simple average, and (4) the
rectified mean value calibrated to the rms value for the voltage and the true rms value for
the current, as explained in “Determining the Voltage and Current” in section 1.2,
“Measurement Function and Measurement Period.”
Corrected Power «For procedures, see section 6.6.»
Depending on the applicable standard, when the load that is connected to the potential
transformer is extremely small, the active power of the potential transformer that is measured
needs to be compensated. In such case, set the compensating equation and the coefficient.
IEC76-1(1976), IEEE C57.12.90-1993 IEC76-1(1993)
1 + P2
P
Urms
Umn
2
Pc =
1 +
P
Pc =
P
Pc: Corrected Power
P: Active power
Urms: True rms voltage
Umn: Voltage (rectified mean value calibrated to the rms value)
P
, P2: Coefficient as defined in the applicable standard
1
Umn – Urms
Umn
1-18 IM 760101-01E
Page 34

Phase Difference «For procedures, see section 6.7.»
The display format of the phase difference between the voltage and current of each
element can be selected. With the voltage of each element as a reference, one format
displays the phase difference using 360° in the clockwise direction, and the other format
displays a lead of 180° in the counter-clock wise direction and a lag of 180° in the
clockwise direction.
Equation for the Distortion Factor «For procedures, see section 7.6.»
The measurement functions, Uhdf, Ihdf, Phdf, Uthd, Ithd, and Pthd during harmonic
measurement have two defining equations that you can select from. For the equations,
see appendix 1.
1.5 Computation
1
Explanation of Functions
IM 760101-01E
1-19
Page 35

1.6 Integration
The WT1600 can integrate the active power (watt hour) and current (current hour).
During integration, the measured and computed values of normal measurements can be
displayed in addition to the watt hour, current hour, and integration time. However,
integration cannot be performed when the waveform display is turned ON.
Measurement Functions of Integration
Measurement Functions on Each Input Element
The following seven types of numerical data can be determined. For details on the
determination of each measurement function data, see appendix 1.
Wp (watt hour, sum of positive and negative watt hours), Wp+ (positive watt hour
consumed), Wp- (negative watt hour returned to the power supply (regenerated
energy)), q (current hour, sum of positive and negative current hours), q+ (positive
current hour consumed), q- (negative current hour returned to the power supply),
Time (integration time)
Measurement functions of the sum of input elements (Σ functions)
The following six types of numerical data can be determined. For details on the
determination of each measurement function data, see appendix 1.
WpΣ (sum of Wp), Wp+Σ (sum of Wp+), Wp-Σ (sum Wp-), qΣ (sum of q), q+Σ (sum of
q+), q-Σ (sum of q-)
Integration Mode «For procedures, see sections 6.8 and 6.9.»
Manual Integration Mode
Integration continues from the point when integration is started to the point it is
stopped. However, when the integration time reaches its maximum (10000 hours) or
the integration value reaches its maximum or minimum (±999999 MWh or ±999999
MAh), the integration is stopped and the integration time and integration value at that
point are held.
Integrated
value
Integration
time
Start Stop Reset ResetStart
Hold
Hold
When STOP is pressed
or when the maximum
integration time is reached
Hold
When the maximum
integration time is
reached (999999 MWh
or 999999 MAh)
Hold
1-20 IM 760101-01E
Page 36

1.6 Integration
Normal Integration Mode
The integration time is set in relative time. The integration is stopped after the
specified time elapses or when the integration value reaches the maximum or
minimum integration display value. The integration time and value are held at that
point.
Integrated
value
Hold
1
Explanation of Functions
Integration
time
Timer setting
Hold
ResetStart
Repetitive Integration Mode (Continuous Integration)
The integration time is set in relative time. When the specified time elapses, the
operation is automatically reset and restarted. Integration is repeated until STOP is
pressed. When the integration value reaches the maximum or minimum integration
display value. The integration time and value are held at that point.
Integrated
value
Hold
Integration
time
Hold
IM 760101-01E
Timer
setting
Start Reset
Timer
setting
Timer
setting
STOP is
pressed
1-21
Page 37

1.6 Integration
Real-time Normal Integration Mode
The start and stop of the integration operation is set through date and time. The
integration is stopped at the specified time or when the integration value reaches the
maximum or minimum integration display value. The integration time and value are
held at that point.
Integrated
value
Integration
time
Start
date/time
Hold
Hold
Stop
date/time
Reset
Real-time Repetitive Integration Mode (Continuous Integration)
The start and stop of the integration operation is set through date and time. The
integration is repeated at the specified timer setting during that time. When the time
specified by the timer elapses, the operation is automatically reset and restarted. The
integration is stopped at the specified time or when the integration value reaches the
maximum or minimum integration display value. The integration time and value are
held at that point.
Integrated
value
Integration
time
Start
date/time
Timer
setting
Timer
setting
Timer
setting
Hold
Hold
Stop
date/time
Reset
1-22 IM 760101-01E
Page 38

1.7 Waveform Display
The WT1600 displays waveforms based on the data sampled within the data update rate.
Vertical (Amplitude) Axis
The vertical display range is determined based on the specified measurement range.
For example, if the crest factor is set to 3 and the voltage measurement range is set to
“100 Vrms,” then the display range is set so that the top of the screen is 300 Vpk (100
Vrms × 3) and the bottom is –300 Vpk (–100 Vrms × 3) with the zero input line at the
center. If the crest factor is set to 6 and the voltage measurement range is set to “50
Vrms,” then the display range is set so that the top of the screen is 300 Vpk (100 Vrms ×
6) and the bottom is –300 Vpk (–100 Vrms × 6) with the zero input line at the center.
However, the display range for a measurement range of 1000 V or 500 V when the crest
factor is set to 3 or 6, respectively, is within ±2000 V. The waveform clips if this range is
exceeded.
1
Explanation of Functions
When the measurement range
is set to “100 Vrms”
300 Vpk
Zero input line
–300 Vpk
1 grid (1 div)
= 75 V
900 Vpk
–900 Vpk
Horizontal (Time) Axis «For procedures, see section 9.2.»
Set the horizontal (time) axis by specifying the time per grid (1 division). The time axis
can be set in 1, 2, or 5 steps in the range up to the point in which the time
corresponding to one screen is equal to the data update rate. For example, if the data
update rate is 500 ms, the time per division can be changed in the order, 0.5 ms, 1
ms, 2 ms, 5 ms, 10 ms, 20 ms, and 50 ms.
1 grid (1 div) = 10 ms
1 grid (1 div) = 20 ms
When the same signal is measured
with the measurement range set to
“300 Vrms”
1 grid (1 div)
= 225 V
IM 760101-01E
100 ms
(Observation time)
200 ms
(Observation time)
During Normal Measurement
The time axis can be set in 1, 2, or 5 steps in the range up to the data update rate
according to the horizontal (time) axis setting described earlier. For example,
changing the time per division in the order 0.5 ms, 1 ms, 2 ms, 5 ms, 10 ms, 20 ms,
and 50 ms changes the time corresponding to one screen in the order 5 ms, 10 ms,
50 ms, 100 ms, 200 ms, and 500 ms.
1-23
Page 39

1.7 Waveform Display
During Harmonic Measurement
The time corresponding to one screen in harmonic measurement is automatically
determined from the sample rate, which can be derived from the fundamental
frequency of the PLL source (see page 1-7), and the window width (time width over
which FFT analysis is performed when determining harmonics).
Note
Number of displayed points on the screen
When waveforms are displayed, the data points (waveform display data) are displayed in
segments called rasters. There are 501 rasters in the time axis direction on one screen.
On the other hand, data is sampled according to the sample rate, and one screen of the
sampled data becomes the data that is displayed on the screen as a waveform.
Because the number of display segments (number of displayed points) on the screen is
constant at 501 rasters while the number of sampled data points varies according to the time
corresponding to one screen, the following process is performed.
P-P compression is performed over a certain period along the time axis, the waveform display
data is determined, and the data is displayed. P-P compression refers to the determination of
the maximum and minimum values for each certain period. One raster will display these two
points.
Sampled data
Sampled data
P-P compression
Vertical axis
On the screen
0
Aliasing
When the sample rate is comparatively low with respect to the input signal frequency, the
harmonics contained in the signal are lost. In this case, some of the harmonics will appear at
low frequencies due to the effects described by the Nyquist sampling theorem. This
phenomenon is called aliasing.
Aliased signal Input signal Sampling point
Retrieval of Waveform Display Data
The WT1600 retrieves waveform display data to the memory at a sample rate of
approximately 200 kS/s. The frequency that allows displaying of waveforms that are close to
the input signal is up to approximately 10 kHz.
501 rasters
500
Time axis
1-24 IM 760101-01E
Page 40
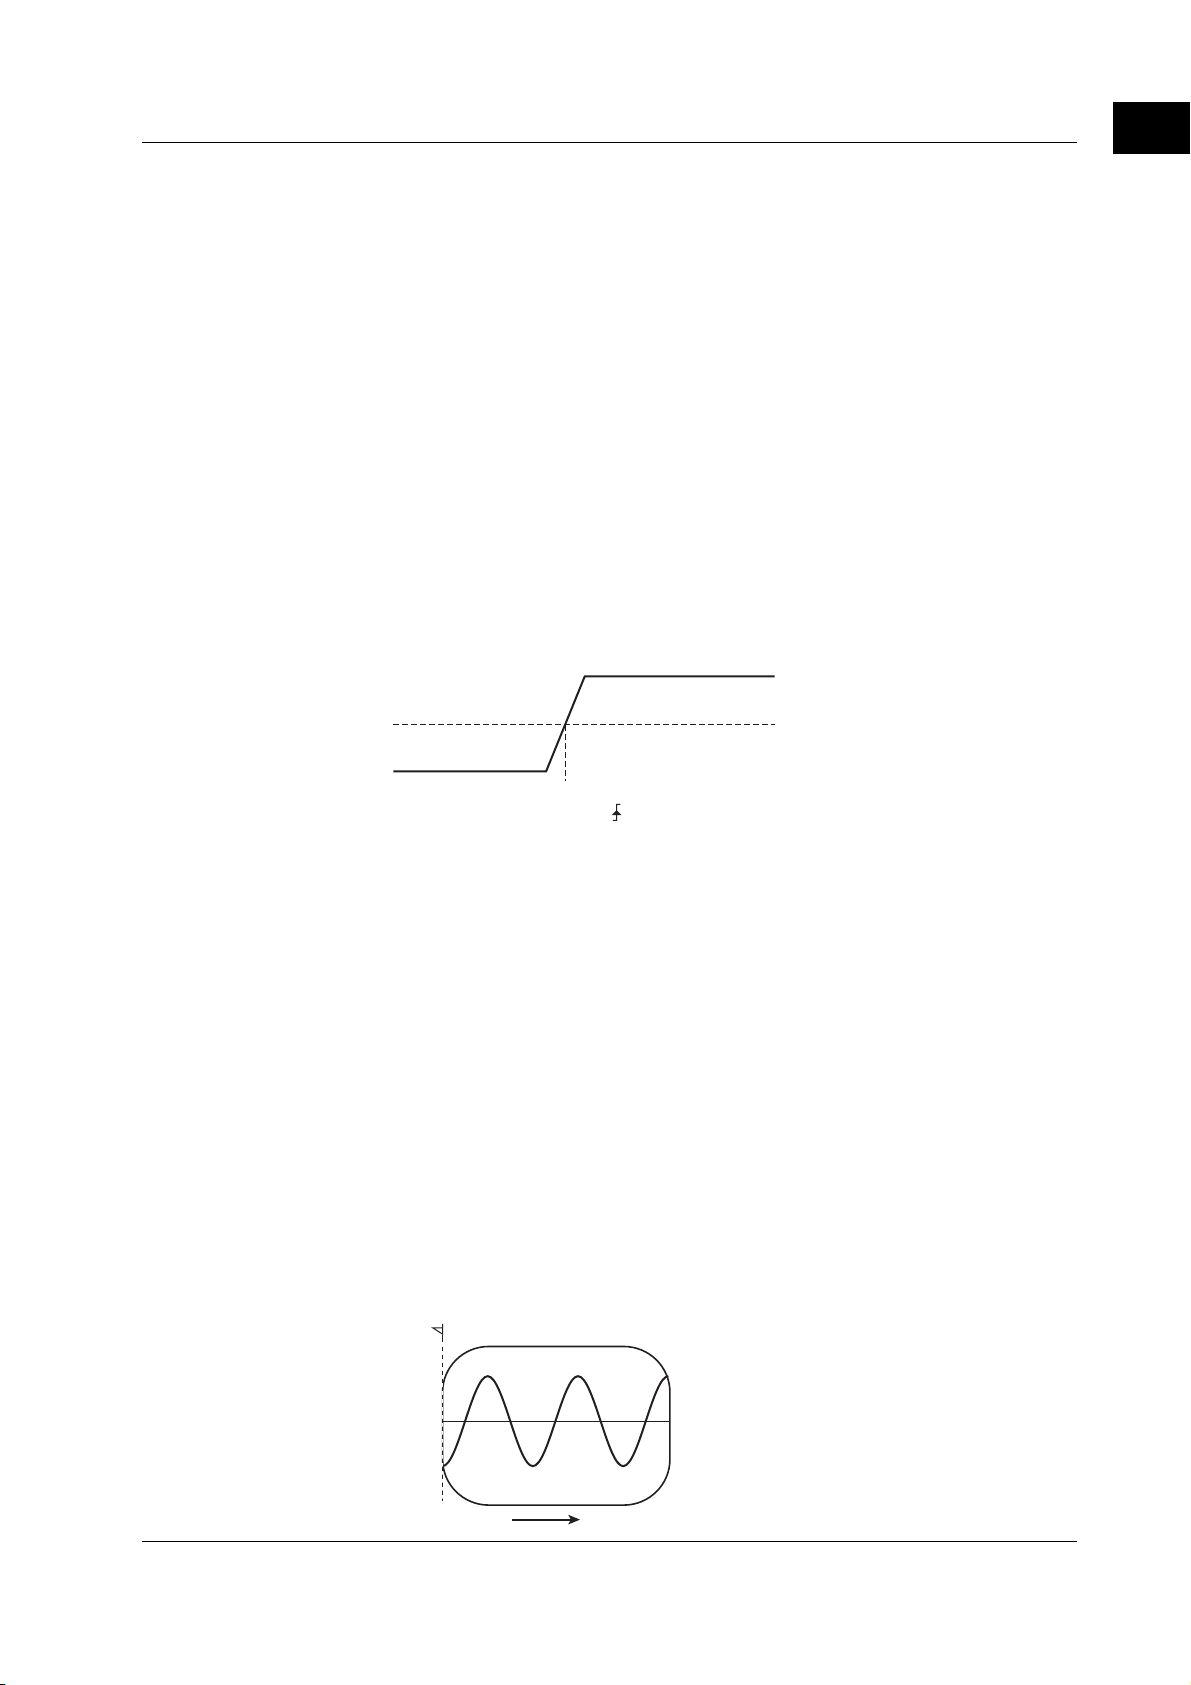
Trigger «For procedures, see section 9.3.»
Trigger is a cue used to display the waveform on the screen. The trigger is activated
when the specified trigger condition is met. At this point, the waveform is ready to be
displayed on the screen.
Trigger Source
Trigger source refers to the signal that is used in checking the trigger condition.
Trigger Slope
Slope refers to the movement of the signal from a low level to a high level (rising
edge) or from a high level to a low level (falling edge). When the slope is used as one
of the trigger conditions, it is called a trigger slope.
Trigger Level
Trigger level refers to the level through which the trigger slope passes.
When the slope of the trigger source passes through the specified trigger level on a
rising or falling edge, a trigger occurs. You can select the input signal of each
element or external clock input signal as a trigger source.
1.7 Waveform Display
1
Explanation of Functions
Trigger level
Trigger source
A trigger occurs at this point if rising
edge ( ) is selected (trigger point).
Trigger Mode
Trigger mode specifies the conditions for updating the screen display.
• Auto mode
If a trigger occurs within a specified amount of time (about 100 ms, referred to as
the timeout period), the waveform display is updated. If a trigger does not occur
within the timeout time, the display is automatically updated when the timeout time
elapses.
• Normal mode
The display is updated only when the trigger occurs. The display is not updated if
the trigger does not occur.
Trigger Point
Trigger point refers to the point at which a trigger occurred. The trigger point is
always at the left end of the screen. The waveform after the trigger point is displayed
from the left to the right of the screen as the time progresses.
IM 760101-01E
Trigger point
Time
1-25
Page 41

–
1.7 Waveform Display
Zooming on the Waveform «For procedures, see section 9.4.»
Each displayed waveform can be expanded or reduced vertically by the zoom factor in
the range of 0.1 to 100. The waveform is zoomed around the zero input line.
When the zoom factor is set to ×2
300 Vpk
Input zero line
–300 Vpk
300 Vpk
150 Vpk
–150 Vpk
–300 Vpk
Vertical Position of the Waveform «For procedures, see section 9.4.»
The displayed position of the waveform can be moved vertically to the desired position
such as when you wish to view the mutual relationship between the voltage and current
waveforms or when the section of the waveform you wish to view goes out of the display
frame.
100%
Range displayed
on the screen
Move the
position by
50%
Move the
position by
100%
–50%
Turning ON/OFF of the Waveform Display «For procedures, see section 9.5.»
The voltage and current waveforms corresponding to the element that has input modules
installed can be turned ON/OFF. This feature enables easy viewing of waveforms as
only the required waveforms can be displayed.
1-26 IM 760101-01E
Page 42

1.7 Waveform Display
Split Screen of the Waveform and Waveform Mapping
«For procedures, see section 9.6»
The screen can be evenly divided and the waveforms can be mapped to the divided
windows. The screen can be divided into up to four windows. This function is useful
when there are many waveforms on the screen. You can select the method of mapping
from the following list of choices:
• Auto
The waveforms that are turned ON are mapped in order according to the element
number to the divided windows, voltage first and then current.
•Fixed
The waveforms are mapped in order by element number in the order voltage and
current to the divided windows regardless of whether or not the display is turned ON.
•User
The waveforms can be mapped arbitrarily to the divided windows regardless of
whether or not the display is turned ON.
Display Interpolation of the Waveform «For procedures, see section 9.7.»
The waveform display data can be connected linearly to display the waveform smoothly.
Linear Interpolation
Linearly interpolates between two points.
1
Explanation of Functions
Interpolation OFF
No interpolation is performed. Only the data points are displayed.
Graticule «For procedures, see section 9.7.»
A grid or cross scale can be displayed on the screen. You can also select not to display
the grid or cross scale.
Displaying Scale Values «For procedures, see section 9.8.»
The upper and lower limits of the vertical axis and the values at the left and right ends of
the horizontal axis (time axis) of each waveform can be turned ON or OFF.
IM 760101-01E
1-27
Page 43

1.7 Waveform Display
Displaying Waveform Labels «For procedures, see section 9.8.»
Waveform labels can be turn ON or OFF.
Upper limit
Waveform label
Lower limit
Time at the left end of the screen
Time at the right
end of the screen
Cursor Measurement «For procedures, see sections 7.9, 9.9, and 10.7.»
The value at the crossing point of the waveform and cursor can be measured and
displayed. It can be used to measure the voltage and current of various sections of the
waveform and the data on the horizontal axis (X-axis). Cursor measurements are
performed on the data that is displayed on the screen.
Cursors are the “+” and “×” marks that are displayed on the screen. The vertical value
and the X-axis value from the left end of the screen for each cursor can be measured. In
addition, the difference in the vertical values and in the X-axis values between the
cursors can be measured.
Cursor +
Cursor x
Measured values
1-28 IM 760101-01E
Page 44

1.8 Bar Graphs, Vectors, and Trend Displays
Bar graphs of harmonics of each order, vectors of the fundamental signal of each
element (during harmonic measurement), and trends of each measurement function can
be displayed.
Bar Graph Display of Harmonic Data «For procedures, see section 7.9.»
The amplitude of each harmonic can be displayed on the bar graph. The horizontal axis
represents harmonic order, and the vertical axis represents the amplitude of each
harmonic. The harmonic measurement functions, elements, and order to be displayed can
be specified. You can select the following harmonic measurement functions: U, I, P, S, Q,
λ, φU, φI, Z, Rs, Xs, Rp, and Xp. The screen can be divided into top and bottom halves
so that the bar graph can be displayed simultaneously with the numerical data.
Bar graph display of harmonic data
Measured values of
cursor + and x of
Cursor +
bar graph 1
1
Explanation of Functions
Cursor x
Measured values of
cursor + and x of
bar graph 2
Harmonic order indicating
the cursor position.
Cursor + is at 1st order and
Cursor x is at 13th order.
Vector Display of Harmonics «For procedures, see section 7.10.»
During harmonic measurement, vectors can be displayed to show the relationship
between the phase difference and amplitude (rms value) of the fundamental signals U(1)
and I(1) of each element that is assigned to the selected wiring unit. The positive vertical
axis is set to 0 (angle 0), and the vector of each input signal is displayed. In addition,
you can zoom in on the vector or display the values of the amplitude and the phase
difference between the signals simultaneously.
The vector display is shown on the next page.
The elements that are to be displayed as vectors vary depending on the number of
installed input elements and the selected wiring pattern.
Explanation is given below for the case when the number of installed input elements is 5,
the wiring system pattern is three-phase, four-wire for ΣA and three-phase, three-wire for
ΣB.
IM 760101-01E
When the target of the harmonic measurement is set to wiring unit ΣA, the target
elements are 1, 2, and 3. Vectors 1, 2, and 3 correspond to elements 1, 2, and 3,
respectively. The relationship between the phase difference and amplitude of U1(1),
U2(1), U3(1), I1(1), I2(1), and I3(1) is displayed as vectors.
When the target of the harmonic measurement is set to wiring unit ΣB, the target
elements are 4 and 5. Vectors 4 and 5 correspond to elements 4 and 5, respectively.
The relationship between the phase difference and amplitude of U4(1), U5(1), I4(1), and
I5(1) is displayed as vectors. The vectors for U6(1) and I6(1) are computed and
displayed.
1-29
Page 45

1.8 Bar Graphs, Vectors, and Trend Displays
Vector display when the wiring system is 3P4W (three-phase, four-wire)
U1(1), U2(1), and U3(1) are common mode voltages. I1(1), I2(1), and I3(1) are line currents.
I1(1)
U1(1)
φ1(1),
φU1-I1
φU1-I2
φU1-I3
I3(1)
φ3(1)
U3(1)
φU1-U3
Vector display when the wiring system is 3V3A (three-voltage, three-current)
U1(1), U2(1), and U3(1) are line voltages. I1(1), I2(1), and I3(1) are line currents.
φU1-U2
U2(1)
φ2(1)
I2(1)
I1(1)
By moving the vectors, U1(1), U2(1),
and U3(1), (without changing their
orientations) so that the starting points
of vectors are all at the origin, the phase
relationship can be observed in the same
fashion as the three-phase, four-wire system.
(The WT1600 does not provide a function for
moving the vectors.)
U3(1)
I3(1)
I3(1)
φU1-U2
U1(1)
U2(1)
φU3-U1
O
φU2-U3
The phase difference between the line voltages can
be determined from the phase difference measurement
I2(1)
functions φU1-U2 and φU1-U3.
φU1-U2 = This is the measurement function φU1-U2.
φU2-U3 = (φU1-U3) – (φU1-U2) – 180°
φU3-U1 = –(φU1-U3)
Vector display when the wiring system is 3P3W (three-phase, three-wire)
U1(1), U2(1), and U3(1) are line voltages. I1(1), I2(1), and I3(1) are line currents.
However, U3(1) and I3(1) are not actually measured for the three-phase, three-wire
system. The vectors are displayed through computation.
I1(1)
U1(1)
U3(1)
O
φU1-U3
φ3(1)
U3(1)
φ1(1),
φU1-I1
φU1-I3
I1(1)
U1(1)
φU1-U2
φU1-I2
U2(1)
φ2(1)
I2(1)
I3(1)
U2(1)
I2(1)
1-30 IM 760101-01E
Page 46

Trend Display
1.8 Bar Graphs, Vectors, and Trend Displays
The trends of all measurement functions that are measured during normal measurement
and harmonic measurement are displayed.
Trend Display Data
When the retrieval of waveform display data is OFF during normal measurement, the
numerical data of measurement functions that is determined for each data update rate
is P-P compressed
*
for each display segment (raster) and made into trend display
data.
When the retrieval of waveform display data is ON during normal measurement, the
numerical data of measurement functions that is determined each time a trigger
occurs is P-P compressed
*
for each display segment (raster) and made into trend
display data.
During harmonic measurement, the numerical data of the measurement function that
is automatically determined from the sample rate, which can be derived from the
fundamental frequency of the PLL source (see page 1-7), and the window width (time
width over which FFT analysis is performed when determining harmonics) is P-P
compressed
* In some cases, P-P compression is not performed.
*
for each display segment (raster) and made into trend display data.
Split Screen Display and Assignments «For procedures, see section 10.4.»
Up to 16 lines (T1 through T16) of trends can be displayed. You can select the
measurement function of any element to be assigned to T1 through T16. During
harmonic measurement, you can also specify the harmonic order.
The screen is divided up to 4 windows and the trends that are turned ON are mapped
to the divided windows in order from T1 through T16.
1
Explanation of Functions
Horizontal (Time) Axis «For procedures, see section 10.5.»
When the retrieval of waveform display data is OFF during normal measurement, the
time per division can be set in the range of 3 s to 1 day. When the retrieval of
waveform display data is ON during normal measurement or during harmonic
measurement, the value can be set in terms of the number of measurements per
division.
Setting the Scale «For procedures, see section 10.6.»
Auto scaling is provided in which the upper and lower limits of the screen are
determined automatically from the maximum and minimum values of the trend display
data. Manual scaling is also available in which the upper and lower limits can be set
arbitrarily as necessary.
Display Interpolation, Graticule, and Label Display
«For procedures, see sections 9.7 and 9.8.»
The settings specified for waveform display are used.
IM 760101-01E
1-31
Page 47
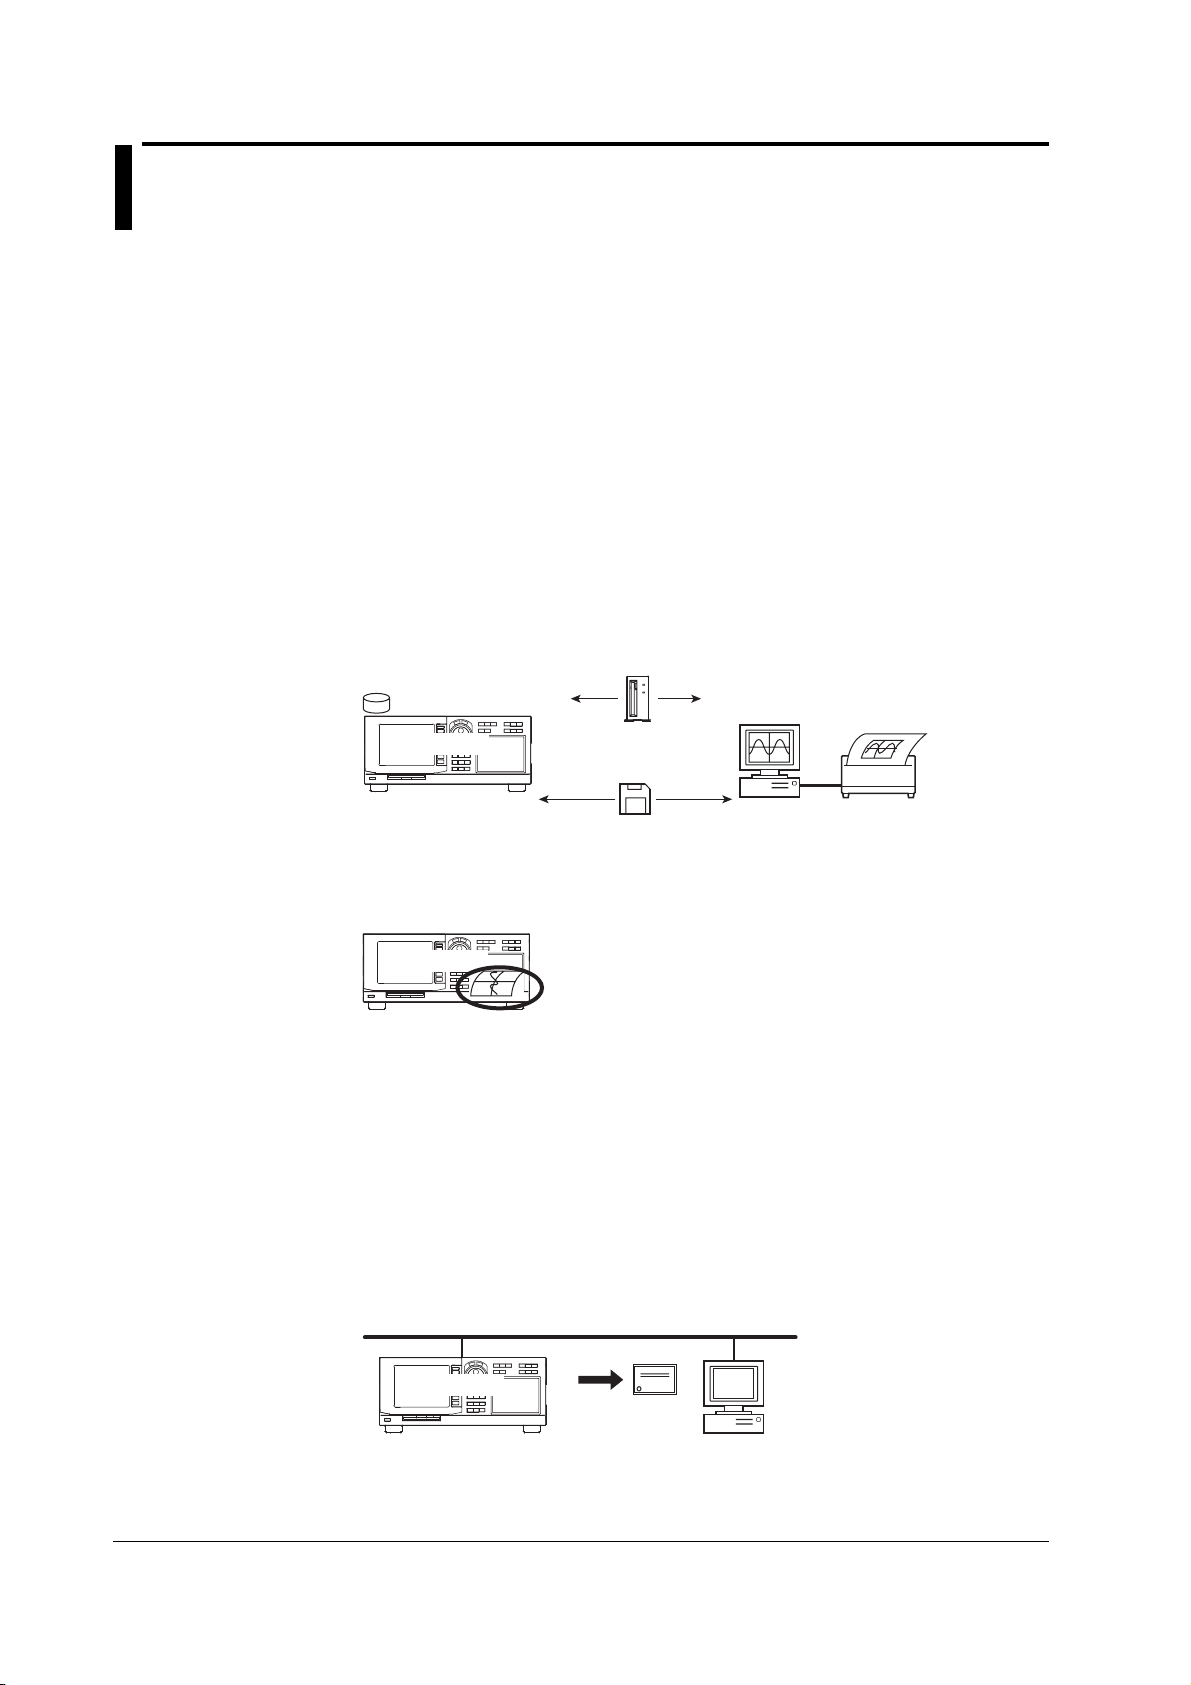
1.9 Saving and Loading Data and Other Functions
Storing and Recalling «For procedures, see chapter 11.»
The numerical data and waveform display data can be stored to the internal memory
(approximately 12 MB, or approximately 11 MB when using a WT1600 with ROM version
2.01 or later). The data is stored to the internal memory at the data update rate or the
specified time interval. In addition, the stored data can be saved to a floppy disk or builtin hard disk. The data that is saved to the built-in hard disk or floppy disk cannot be
recalled.
Saving and Loading to the Floppy Disk, Built-in Hard Disk, and External SCSI Device
«For procedures, see chapter 12.»
A floppy disk (FD) drive comes standard with the instrument. Additionally, a built-in hard
disk or SCSI can be installed as an option. The numerical data, waveform display data,
screen image data, and setup parameters can be saved to these media. The saved
setup parameters can be loaded as necessary. The screen image data can be pasted to
documents on a word-processing application.
SCSI
Built-in hard disk
WT1600
SCSI device
Floppy disk
PC
Printing on the Built-in Printer «For procedures, see chapter 14.»
The screen image, numerical data list, and bar graphs can be printed on the built-in
printer (option).
WT1600
Built-in printer
(option)
Ethernet Communications (Option) «For procedures, see chapter 13.»
The numerical data, waveform display data, screen image data, and setup parameters
can be saved to a device connected via the Ethernet interface or information about the
WT1600 can be transmitted.
Saving and Loading from an FTP Server on the Network (FTP Client Function)
The numerical data, waveform display data, screen image data, and setup parameters
can be saved to an FTP server
disk or external SCSI device. The saved setup parameters can also be loaded as
necessary.
* PC or workstation on which the FTP server function is running.
*
on the network in the same fashion as with the floppy
File
WT1600
PC
1-32 IM 760101-01E
Page 48

1.9 Saving and Loading Data and Other Functions
Accessing the WT1600 from an FTP Client on the Network (FTP Server Function)
The WT1600 can be accessed from an FTP client* on the network, and files on the
floppy disk, built-in hard disk, and external SCSI device connected to the WT1600 can
be retrieved.
* PC or workstation on which the FTP client function is running.
File
WT1600
PC
Outputting to a Network Printer (LPR Client Function)
The screen image can be printed to a network printer in the same fashion as with the
built-in printer.
WT1600
Printer
Sending Mail (SMTP Client Function)
The information of the WT1600 can be transmitted periodically to a specified mail
address.
1
Explanation of Functions
WT1600
GP-IB/Serial Communication «See the
IM760101-11E
.»
Either a GP-IB interface or a serial interface (conforming to EIA-574 (9-pin EIA-232 (RS-
232)) comes standard with the WT1600 (specified at the time of purchase). The
measured data can be transferred to a PC for analysis or an external controller can be
used to control the instrument for making measurements.
WT1600
Communication Interface User’s Manual
Communication
Mail
PC
PC
interface
D/A Output (Option) «For procedures, see section 15.1.»
The numerical data can be output using a ±5 V FS DC analog voltage. Up to 30 items
can be specified for normal measurement and harmonic measurement, separately.
RGB Video Signal (VGA) Output «For procedures, see section 15.2.»
The RGB video signal (VGA, Video Graphics Array) can be output to an external
monitor. This allows values and waveforms to be displayed on a large screen.
Initialization «For procedures, see section 15.3.»
The settings entered using keys and soft keys can be initialized to factory default
condition. For details on the initial settings, see appendix 3, “List of Initial Settings and
Display Order of Numerical Data.”
IM 760101-01E
1-33
Page 49

1.9 Saving and Loading Data and Other Functions
Zero-Level Compensation «For procedures, see section 15.4.»
Zero-level compensation refers to creating a zero input condition inside the WT1600 and
setting the level at that point as the zero level. Zero-level compensation must be
performed in order to satisfy the specifications of this instrument (see chapter 17). Zerolevel compensation is automatically performed when harmonic measurement is turned
ON/OFF or the measurement range or input filter is changed. However, if the harmonic
measurement ON/OFF setting, measurement range, and input filter are not changed
over an extended time, the zero level may change due to the changes in the
environment surrounding the instrument. In such case, you can manually perform zerolevel compensation. There is also a function that performs zero-level compensation
during integration.
NULL Function «For procedures, see section 15.5.»
When the NULL function is turned ON, Udc and Idc (numerical data of the simple
average of the voltage and current during normal measurement) are set as NULL values.
The NULL value is subtracted from the sampled data of voltage and current. Hence, all
measurement functions are affected by the NULL values.
Selecting the Message Language «For procedures, see section 15.6.»
The language of the error messages displayed on the screen during operation can be set
to English or Japanese.
Setting the Brightness of the Screen «For procedures, see section 15.6.»
The brightness of the LCD monitor can be adjusted.
Setting the Display Colors «For procedures, see section 15.7.»
The colors for graphical elements such as the waveform, background, scale, and cursor
and text elements such as the menu and the menu background can be selected. Set the
color using a ratio of red (R), green (G), and blue (B).
Self-Test Function «For procedures, see section 16.3.»
A self-test can be performed to check whether the instrument is operating properly.
Components such as the internal memory (ROM and RAM), the operation keys, the
floppy disk drive, and the built-in printer (option) can be tested.
Confirming the System Condition of the Instrument «For procedures, see section 16.4.»
The system condition of the instrument such as the model, ROM version (firmware
version), input element configuration, and existence of options can be confirmed.
1-34 IM 760101-01E
Page 50

Chapter 2 Names and Uses of Parts
l
2.1 Front Panel, Rear Panel, and Top View
Front Panel
2
Names and Uses of Parts
Handle
Use the handles (both sides)
when moving the instrument.
(Section 3.1)
Power switch
(Section 3.10)
Used when saving or loading data.
(Chapter 12)
Rear Panel
Current sensor input connector
Connect the external sensor cable
from the external current sensor.
(Section 3.7)
Current input terminal
Wire current measurement
cables.
(Sections 3.6, 3.8, and 3.9)
Revolution signal input connector (option)
Input signals from revolution sensors when
evaluating motors. (Section 8.1)
ESC key
Clears and escapes from
the current menu.
DIGITAL POWER METER
LCD
POWER
ESC
Jog shuttle
Used when selecting setup parameters and setting values.
(Section 2.2)
S
E
T
L
E
E
C
S
E
T
R
INPUT
RANGE
SCALING
WIRING
MOTOR SET
FILTER
AVG MEASURE
CAL
INTEGRATOR
SYNC
START STOP
SRC
INTEG SET
RESET
Floppy disk drive
Soft keys
Used when selecting setup
parameters in a menu.
Voltage input terminal
Wire voltage measurement cables.
(Sections 3.6 to 3.9)
Element 1 (Section 1.3)
Element 2
Element 3
Element 4
Element 5
Element 6
654321
U
U
U
U
U
U
EXT
EXT
EXT
EXT
EXT
EXT
I
I
I
I
I
I
Tor que signal input connector (option)
Input signals from torque meters when
evaluating motors. (Section 8.1)
UPDATE
FILE
DISPLAY
TRIG'D
WAVE
CURSOR
STORE
HOLD
SINGLE
HARMONICS
COPY
RATE
STORE SET
MENU
REMOTE
LOCAL
MISC
MAX HOLD
NULL
PUSH
Operation keys
SHIFT
Keys that are pressed first when
carrying out an operation.
Displays the first menu of the
corresponding key (setting).
(Section 2.2)
Built-in printer (option)
Prints screen images and numeric data list.
(Chapter 14)
GP-IB or Serial (RS-232) connector
For details on communication functions, see
the Communication Interface User's Manual
(IM760101-11E).
External clock input connector
Used when inputting the synchronization
signal of the measurement/computation
period. (Sections 6.2 and 7.4)
External start/stop signal
input/output connector
Used when performing master/slave
synchronized measurement.
D/A OUTPUT
TORQUE
SPEED
(IEEE488)
VIDEO-OUT
(VGA)
START
(Section 5.10)
STOP
TXD
LINK
Ethernet connector (option)
10Base-T
GP-IB
SERIAL
or
(RS-232)
SCSI
Connect an Ethernet cable.
(Section 13.1)
For details on communication functions, see
the Communication Interface User's Manua
(IM760101-11E).
SCSI connector (option)
External SCSI devices are
connected here.
(Section 12.3)
Power connector (Section 3.5)
Power fuse (Section 16.5)
RGB video signal (VGA) output connector
Outputs image signals. (Section 15.2)
D/A output connector (option).
Outputs numeric data that has been converted to
analog DC voltage. (Section 15.1)
IM 760101-01E
2-1
Page 51

2.1 Front Panel, Rear Panel, and Top View
Top View
Rear Panel
.........
Vent holes (Section 3.2)
(Vent holes are also present
on the bottom side.)
Front Panel
2-2 IM 760101-01E
Page 52

2.2 Operation Keys, Jog Shuttle
Common to All Functions
ESC key
Clears and escapes from the current menu.
RESET key
Press this key to reset the value to default.
SELECT key
Confirms the selection made using the jog shuttle or the set value.
S
E
T
L
E
E
S
C
E
T
ESC
R
RANGE
MOTOR SET
FILTER
INTEGRATOR
START STOP
INTEG SET
INPUT
SCALING
AVG
RESET
WIRING
MEASURE
CAL
SYNC
SRC
DISPLAY
TRIG'D
WAVE
CURSOR
Arrow (< and >) keys
Moves along the digits of the value that is set by the jog shuttle or moves
the input position of the character string.
Soft keys
Press these keys to select the setup parameter on the displayed menu.
HOLD
SINGLE
HARMONICS
UPDATE
RATE
FILE
REMOTE
LOCAL
MAX HOLD
STORE
STORE SET
MISC
NULL
COPY
SHIFT key
MENU
After pressing SHIFT to light the indicator
above and to the left of SHIFT,
SHIFT
press an operation key to display the menu
corresponding to the item indicated below
Jog shuttle
the operation key.
Rotate the jog shuttle to select setup parameters or to set values.
It is also used to move the cursor.
The step size increases as the rotation angle of the shuttle ring increases.
(Shuttle ring)
2
Names and Uses of Parts
Set Measurement Conditions and Normal Measurement Mode
SHIFT+RANGE (MOTOR SET) key (option)
Sets items that are required in the motor evaluation such as torque,
number of rotations, and motor output. (Sections 8.2 to 8.7)
RANGE key
Sets the measurement range of voltage and current. (Sections 5.2 and 5.3)
HOLD key
Puts the instrument in a held condition. (Section 5.8)
SHIFT+HOLD (SINGLE) key
Performs a single measurement. (Section 5.8)
UPDATE RATE key
Sets the data update rate. (Section 5.7)
COPY
MENU
SHIFT+MISC (NULL) key
Activates the NULL function. (Section 15.5)
SHIFT
SHIFT+LOCAL (MAX HOLD) key
Holds the maximum value of the numeric data. (Section 5.9)
ESC
S
E
T
L
E
E
S
C
E
T
R
INPUT
RANGE
SCALING
INTEGRATOR
AVG
RESET
WIRING
MEASURE
CAL
SYNC
SRC
MOTOR SET
FILTER
START STOP
INTEG SET
FILTER key
Set the input filter.
(Section 5.5)
DISPLAY
TRIG'D
WAVE
CURSOR
HOLD
SINGLE
HARMONICS
UPDATE
RATE
FILE
STORE
STORE SET
REMOTE
LOCAL
MISC
NULL
MAX HOLD
SCALING key
Sets the transformation ratio, PT ratio, CT ratio, and power coefficient
of the current sensor. (Sections 5.3 and 5.4)
WIRING key
Sets the wiring system. (Section 5.1)
MEASURE key
Sets the target frequency to be measured, user-defined functions,
delta computation, the equation for apparent power and corrected power,
the display format of the phase difference, master/slave synchronized
measurement and other settings. (Sections 5.10 and 6.3 to 6.7)
SHIFT+MEASURE (CAL) key
Performs zero-level compensation. (Section 15.4)
AVG key
Sets the averaging function. (Section 5.6)
SYNC SRC key
Sets the synchronization source used to determine the measurement period.
(Section 6.2)
IM 760101-01E
2-3
Page 53

2.2 Operation Keys, Jog Shuttle
Set Integration and Harmonics Measurement
S
E
T
L
E
E
S
C
E
T
ESC
R
DISPLAY
TRIG'D
WAVE
CURSOR
HOLD
SINGLE
HARMONICS
UPDATE
RATE
FILE
REMOTE
LOCAL
MAX HOLD
HARMONICS key
Sets various parameters for harmonic measurement.
(Sections 7.1 and 7.3 to 7.7)
RANGE
SCALING
MOTOR SET
FILTER
INTEGRATOR
START STOP
INTEG SET
INPUT
AVG
RESET
WIRING
MEASURE
CAL
SYNC
SRC
START key
Starts integration. (Section 6.11)
STOP key
Stops integration. (Section 6.11)
SHIFT+STOP (RESET) key
Resets the integrated result (integrated value and integration time).
(Section 6.11)
SHIFT+START (INTEG SET) key
Sets the integration mode and timer. (Sections 6.8 to 6.10)
Set the Display
DISPLAY key
Sets the display format for numerical data, waveforms, bar graphs, vectors,
trends, and others. (Chapter 4, sections 6.1, 7.2, 7.9, 7.10, 9.5 to 9.8, and
chapter 10)
DISPLAY
HOLD
SINGLE
TRIG'D
HARMONICS
WAVE
CURSOR
UPDATE
RATE
FILE
REMOTE
LOCAL
MAX HOLD
ESC
S
E
T
L
E
E
S
C
E
T
R
STORE
STORE SET
MISC
NULL
STORE
STORE SET
MISC
NULL
COPY
MENU
SHIFT
COPY
MENU
SHIFT
RANGE
SCALING
MOTOR SET
FILTER
INTEGRATOR
START STOP
INTEG SET
INPUT
AVG
RESET
WIRING
MEASURE
CAL
SYNC
SRC
SHIFT+WAVE (CURSOR) key
Performs cursor measurement. (Sections 7.9, 9.9 and 10.7)
WAVE key
Sets the acquisition conditions of waveform display data. (Sections 9.1 to 9.4)
2-4 IM 760101-01E
Page 54

2.2 Operation Keys, Jog Shuttle
Store and Recall Data, Save and Load Data, Set Ethernet Communications and Other
Functions
FILE key
Formats disks, saves setup parameters, waveform display data,
numerical data, and screen image data, loads setup parameters,
changes file attributes, deletes files, copies files, renames
directories/files, and creates directories. (Chapter 12)
STORE key
Executes store operation. (Sections 11.4 and 11.6)
COPY key
Saves and prints screen image data.
(Sections 12.7, 13.3, and 14.2)
COPY
MENU
SHIFT+COPY (MENU) key
Feeds printer paper, sets the saving or printing of
SHIFT
screen image data and numerical data list.
(Section 12.6 and chapter 14)
SHIFT+STORE (STORE SET) key
Sets store and recall operations. (Chapter 11)
MISC key
Confirms or initializes the system conditions, sets GP-IB and serial
communications, sets the date and time, selects the message
language, sets the brightness of screen, performs self-tests, sets
displayed colors, selects the crest factor, sets key lock, changes
SCSI ID numbers, sets Ethernet communications, and sets D/A
output.
(Sections 3.11, 5.11, 12.4, chapter 13, sections 15.1, 15.3, 15.6,
15.7, 15.8, 16.3, and 16.4)
For details on setting the GP-IB and serial communications, see
the Communication Interface User's Manual (IM760101-11E).
SHIFT + MISC (NULL) key
Sets the NULL function. (Section 15.5)
ESC
E
S
E
R
RANGE
SCALING
MOTOR SET
FILTER
INTEGRATOR
START STOP
INTEG SET
T
INPUT
AVG
RESET
S
E
L
WIRING
MEASURE
E
C
CAL
SYNC
SRC
T
DISPLAY
TRIG'D
WAVE
CURSOR
HOLD
SINGLE
HARMONICS
UPDATE
RATE
FILE
REMOTE
LOCAL
MAX HOLD
STORE
STORE SET
MISC
NULL
LOCAL key
See the Communication Interface User's Manual (IM760101-11E).
2
Names and Uses of Parts
IM 760101-01E
2-5
Page 55

Chapter 3 Before Starting Measurements
3.1 Precautions Concerning the Use of the Instrument
Safety Precautions
Safety Precautions
If you are using this instrument for the first time, make sure to thoroughly read the
“Safety Precautions” given on pages vi to vii.
Do Not Remove the Case
Do not remove the case from the instrument. Some sections inside the instrument
have high voltages that are extremely dangerous. For internal inspection or
adjustment, contact your nearest YOKOGAWA dealer.
Abnormal Behavior
Stop using the instrument if there are any symptoms of trouble such as strange odors
or smoke coming from the instrument. If these symptoms occur, immediately turn
OFF the power and unplug the power cord. In addition, turn OFF the power to the
measurement circuits that are connected to the input terminals. Then, contact your
nearest YOKOGAWA dealer.
Power Cord
Nothing should be placed on top of the power cord. The power cord should also be
kept away from any heat sources. When unplugging the power cord from the outlet,
never pull by the cord itself. Always hold and pull by the plug. If the power cord is
damaged, check the part number indicated on page iii and purchase a replacement.
3
Before Starting Measurements
General Handling Precautions
Do Not Place Objects on Top of the Instrument
Never stack the instruments or place other instruments or any objects containing
water on top of the instrument. Such act can lead to malfunction.
Keep Electrically Charged Objects Away from the Instrument
Keep electrically charged objects away from the input terminals. They may damage
the internal circuitry.
Do Not Damage the LCD
The LCD is very vulnerable to scratches. Therefore, be careful not to damage the
surface with sharp objects. Also, do not apply vibration or shock to it.
When Not Using the Instrument for a Extended Time
Turn OFF the power to the measurement circuit and the instrument and remove the
power cord from the outlet.
When Carrying the Instrument
First, turn OFF the devices under measurement and remove the measurement cables.
Then, turn OFF the instrument and remove power and other cables. To carry the
instrument, use the handle or carry it using both hands.
IM 760101-01E
Cleaning
When cleaning the case or the operation panel, first turn OFF the circuit under
measurement and the instrument and remove the instrument’s power cord from the
outlet. Then, wipe with a dry, soft cloth. Do not use volatile chemicals as this may
cause discoloring and deformation.
3-1
Page 56

3.2 Installing the Instrument
Installation Conditions
Install the instrument in a place that meets the following conditions.
Flat, Even Surface
If the instrument is not installed on a stable horizontal surface, the printer’s recording
quality may degrade and precise measurements may be impeded.
Well-Ventilated Location
Vent holes are located on the top and bottom of the instrument. To prevent internal
overheating, allow at least 20 mm of space around the vent holes.
When connecting measurement wires and other various cables or when opening or
closing the built-in printer cover, allow extra space for operation.
Ambient Temperature and Humidity
Ambient temperature: 5 to 40°C
Ambient humidity: 20 to 80%RH (when the printer is not used)
35 to 80%RH (when the printer is used)
No condensation in either case.
Storage Location
Do Not Install the Instrument in the Following Places:
• In direct sunlight or near heat sources.
• Where an excessive amount of soot, steam, dust, or corrosive gas is present.
• Near strong magnetic field sources.
• Near high voltage equipment or power lines.
• Where the level of mechanical vibration is high.
• In an unstable place.
Note
• For the most accurate measurements, use the instrument in the following environment.
Ambient temperature: 23±3°C Ambient humidity: 30 to 75%RH (no condensation)
When using the instrument in a place where the ambient temperature is 5 to 20°C or 26 to
40°C, add the temperature coefficient to the accuracy as specified in chapter 17.
• When installing the instrument in a place where the ambient humidity is 30% or below, take
measures to prevent static electricity such as using an anti-static mat.
• Condensation may occur if the instrument is moved to another place where the ambient
temperature is higher, or if the temperature changes rapidly. In this case, let the instrument
adjust to the new environment for at least an hour before using the instrument.
When storing the instrument, avoid the following places:
• Where the relative humidity is 80% • Where the level of mechanical vibration is
or more. high.
• In direct sunlight. • Where corrosive or explosive gas is present.
• Where the temperature is 60°C•Where an excessive amount of soot, dust,
or higher. salt, and iron are present.
• Near a high humidity or heat source. • Where water, oil, or chemicals may splash.
It is recommended that the instrument be stored in an environment where the
temperature is between 5 and 40°C and the relative humidity is between 20 and 80%.
3-2 IM 760101-01E
Page 57

Installation Position
3.2 Installing the Instrument
Desktop
Place the instrument on a flat, even surface as shown in the figure below. If the
instrument is installed in a horizontal position, rubber feet can be attached to prevent
slipping. Two sets (four pieces) of rubber feet are included in the package.
Rack Mount
To rack mount the instrument, use the rack mount kit that is sold separately.
Name Model Notes
Rack mount kit 751535-E4 For EIA
Rack mount kit 751535-J4 For JIS
An outline of the attachment procedures is given below. For details regarding the
attachment procedures, see the instructions that are included with the rack mount kit.
1. Remove the handles on both sides of the instrument.
2. Remove the four feet on the bottom of the instrument.
3. Remove the two plastic rivets and the four seals covering the rack mount
attachment holes on both sides of the instrument near the front.
4. Places seals over the feet and handle attachment holes.
5. Attach the rack mount kit.
6. Mount the instrument on the rack.
3
Before Starting Measurements
IM 760101-01E
Note
• When rack mounting the instrument, allow at least 20 mm of space around the vent holes to
prevent internal overheating.
• Make sure to have adequate support for the bottom of the instrument. However, do not block
the vent holes in the process.
3-3
Page 58

3.3 Wiring Precautions
To prevent the possibility of electric shock and damage to the instrument, follow the
warnings below.
• Employ protective earth ground before connecting measurement cables.
• Turn OFF the power to the measurement circuit, when wiring the circuit. Connecting or
removing measurement cables while the power is turned ON is dangerous.
• Take special caution not to wire a current circuit to the voltage input terminal or
a voltage circuit to the current input terminal.
• Strip the insulation cover of the measurement cable so that when it is wired to
the input terminal, the conductive parts (bare wires) do not protrude from the
terminal. Also, make sure to fasten the input terminal screws securely so that
the cable does not come loose.
• Use cables with safety terminals that cover the conductive parts for connecting
to the voltage input terminals. Using a terminal with bare conductive parts (such
as a banana plug) is dangerous when the terminal comes loose.
• Use cables with safety terminals that cover the conductive parts for connecting
to the current sensor input terminals. Using a terminal with bare conductive
parts is dangerous when the terminal comes loose.
• When the voltage of the circuit under measurement is being applied to the current
input terminals, do not touch the current sensor input terminals. Since these
terminals are electrically connected inside the instrument, this act is dangerous.
• When connecting measurement cables from an external current sensor to the current
sensor input connector, remove the cables connected to the current input terminals. In
addition, when the voltage of the circuit under measurement is being applied to the
current sensor input terminal, do not touch the current input terminals. Since these
terminals are electrically connected inside the instrument, this act is dangerous.
• When using the external potential transformer (PT) or current transformer (CT), make
sure it has enough withstand voltage with respect to the voltage (U) being measured
(2U + 1000 V recommended). Also, make sure that the secondary side of the CT does
not become an open circuit while the power is being applied. Otherwise, high voltage
will appear at the secondary side of the CT, making it extremely dangerous.
• When using an external current sensor, make sure to use a sensor that comes in a
case. The conductive parts and the case should be insulated, and the sensor should
have enough withstand voltage with respect to the voltage being measured. Using a
bare sensor is dangerous, because you might accidentally come in contact with it.
• When using a shunt-type current sensor as an external current sensor, turn OFF
the circuit under measurement. Connecting or removing a sensor while the
power is ON is dangerous.
• When using a clamp-type current sensor as an external current sensor, have a
good understanding of the voltage of the circuit under measurement and the
specifications and handling of the clamp-type sensor. Then, confirm that there
are no shock hazards.
• For safety reasons, when using the instrument on a rack mount, furnish a switch
for turning OFF the circuit under measurement from the front side of the rack.
• After connecting the measurement cable, attach the current input protection
cover using the 4 screws provided for your safety. Make sure that the
conductive parts are not exposed from the protection cover.
WARNING
3-4 IM 760101-01E
Page 59

3.3 Wiring Precautions
• To make the protective functions effective, check the following items before
applying the voltage or current of the circuit under measurement.
• The power cable provided with the instrument is used to connect to the power
supply and the instrument is grounded.
• The power switch of the instrument is turned ON.
• The current input protective cover provided with the instrument is being used.
• When the power switch of the instrument is turned ON, do not apply a signal
that exceeds the following values to the voltage or current input terminals.
When the instrument is turned OFF, turn OFF the circuit under measurement.
For other input terminals, see the specifications of each module in chapter 17.
Instantaneous Maximum Allowable Input (1 cycle, for 20 ms)
Voltage Input
Peak value of 4000 V or RMS value of 1500 V, whichever is less.
Current Input
5-A input element
Peak value of 30 A or RMS value of 15 A, whichever is less.
50-A input element
Peak value of 450 A or RMS value of 300 A, whichever is less.
Continuous Maximum Allowable Input
Voltage Input
Peak value of 1500 V or RMS value of 1000 V, whichever is less.
Current Input
5-A input element
Peak value of 10 A or RMS value of 7 A, whichever is less.
50-A input element
Peak value of 150 A or RMS value of 50 A, whichever is less.
3
Before Starting Measurements
CAUTION
• Use measurement cables that have adequate margins of withstand voltage and
current capacity with respect to the voltage or current being measured. It should
also have proper ratings that are suited to the measurement.
Example: When making measurements on a current of 20 A, use copper wires
that have a conductive cross-sectional area of 4 mm2.
• When the measurement cable is connected, it may cause radio interference in
which case the user may be required to take adequate measures.
Note
• After wiring, the wiring system must be selected. See section 5.1, “Selecting the Wiring System.”
• When measuring large currents or voltages or currents that contain high frequency
components, take special care in dealing with mutual interference and noise when wiring.
• Keep the measurement cables as short as possible to minimize the loss between the circuit
under measurement and the instrument.
• The thick lines on the wiring diagrams shown in sections 3.6 and 3.9 are the sections where
the current flows. Use appropriate wires that are suitable for the current.
• In order to make accurate measurements of the voltage of the circuit under measurement,
connect the cable to the circuit as close as possible.
• In order to make correct measurements, separate the measurement cables as far away from
the earth ground wires and the instrument’s case as possible to minimize the static
capacitance to earth ground.
• To more accurately measure apparent power and power factor in three-phase unbalanced
circuits, we recommend the three-voltage three-current (3V3A) measurement method.
IM 760101-01E
3-5
Page 60
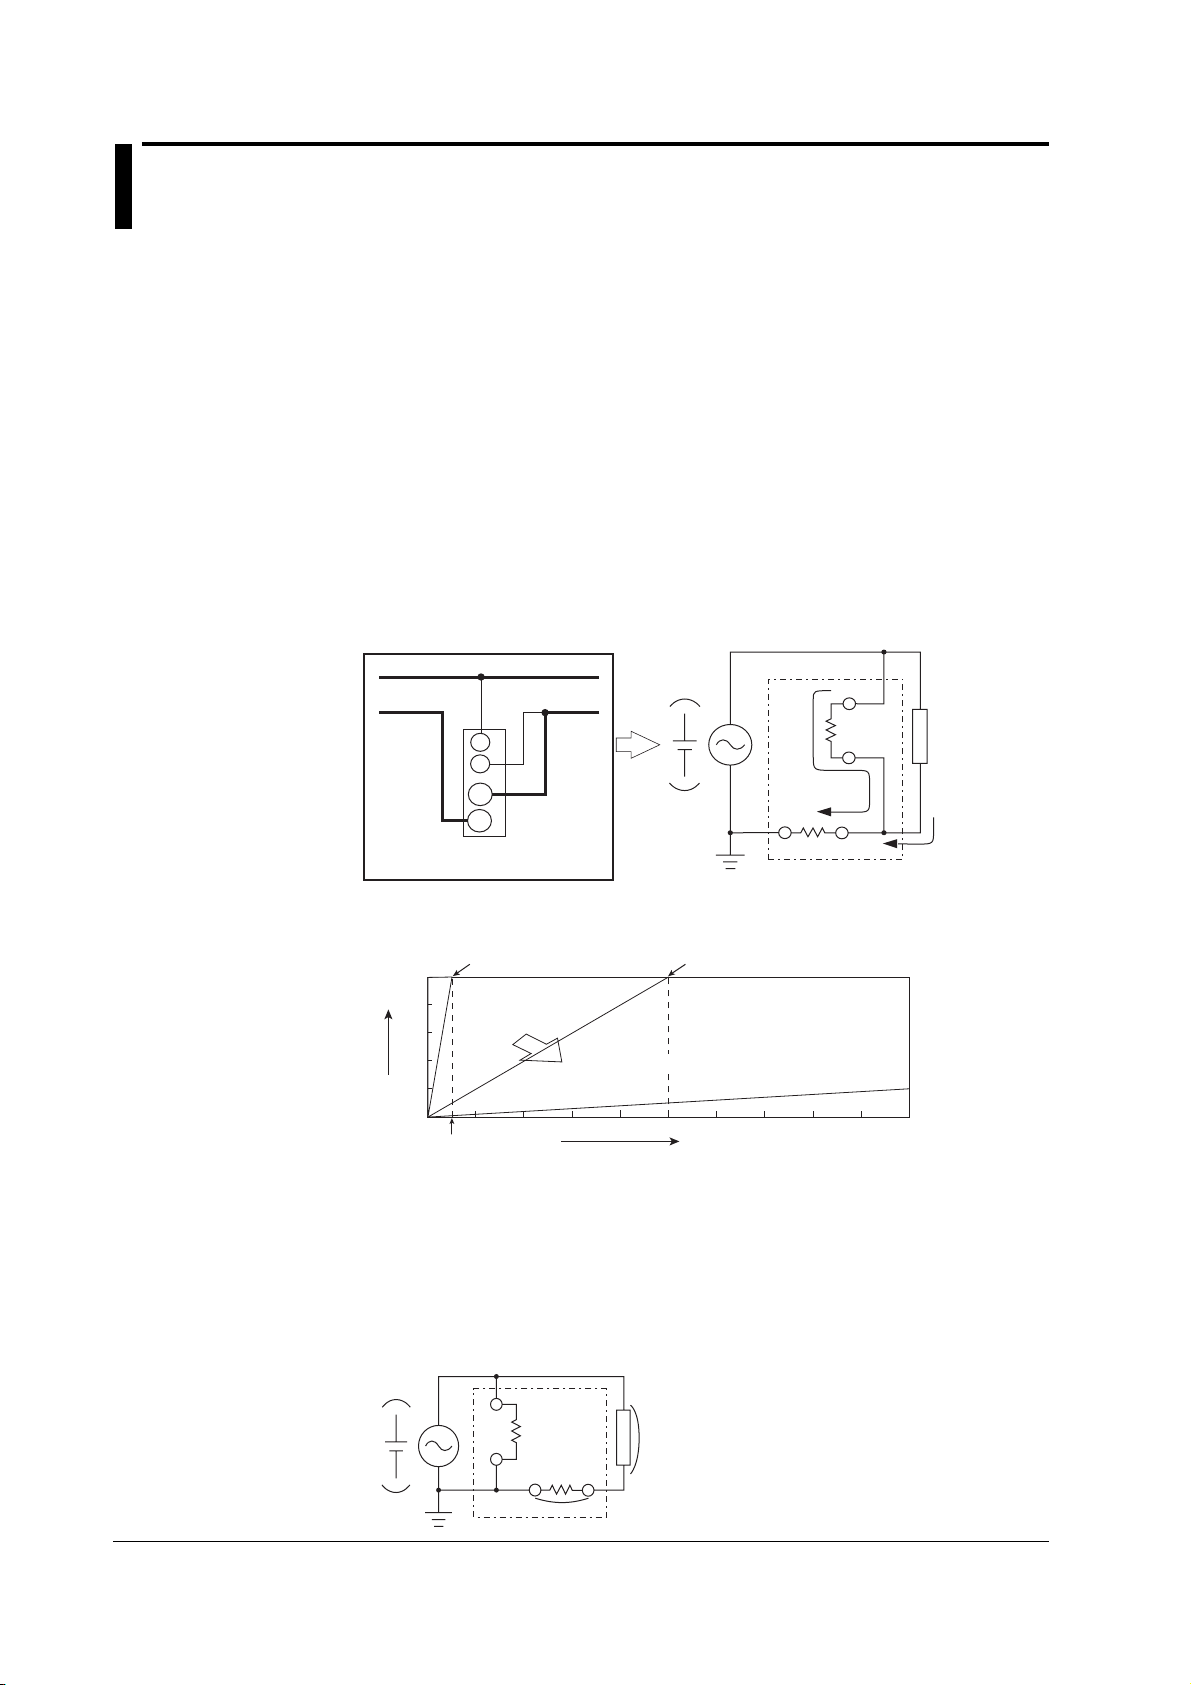
3.4 For Making Accurate Measurements
Effects of Power Loss
By using an appropriate wiring system that matches the load, the effects of power loss
on measurement accuracy can be minimized. We will consider the current source
(SOURCE) and load resistance (LOAD) below.
• When the Measurement Current Is Relatively Large
Wire so that the voltage measurement circuit is connected to the load side. The
current measurement circuit measures the sum of current i
of the circuit under measurement and the current iV flowing through the voltage
measurement circuit. Because the current flowing through the circuit under
measurement is iL, iV is the amount of error. The input resistance of the voltage
measurement circuit of the instrument is approximately 2 MΩ. If the input is 1000 V,
iV is approximately 0.5 mA (1000 V/2 MΩ). If the load current, iL, is 5 A or more (load
resistance is 200 Ω or less), then the effect of iV on the measurement is 0.01% or
less. If the input is 100 V and 5 A, iV = 0.05 mA (100 V/2 MΩ) then the effect of iV on
the measurement accuracy is 0.001% (0.05 mA/5 A).
SOURCE
U
±
I
±
Input terminal
(ELEMENT)
LOAD
SOURCE
As a reference, the relationship of the voltages and currents that produce effects of
0.1%, 0.01%, and 0.001% are shown in the figure below.
Measured voltage (V)
1000
800
600
400
200
0.1% Effect 0.01% Effect
Smaller effect
0
0 1 2 3 4 5 6 7 8 9 10
0.5A
Measured current (A)
• When the Measurement Current Is Relatively Small
Wire so that the current measurement circuit is connected to the load side. In this case,
the voltage measurement circuit measures the sum of the load voltage eL and voltage
drop eI across the current measurement circuit. eI is the amount of error in this case.
The input resistance of the current measurement circuit of the instrument is 100 mΩ and
2 mΩ for the 5-A and 50-A input terminals, respectively. For example, if the load
resistance is 1 kΩ, then the effects on the measurement accuracy is 0.01% for the 5-A
input terminal (100 mΩ/1 kΩ) and 0.0002% for the 50-A input terminal (2 mΩ/1 kΩ).
SOURCE
U
±
±
e
I
WT1600
LOAD
e
L
I
3-6 IM 760101-01E
flowing through the load
L
U
i
V
±
±
I
WT1600
0.001% Effect
LOAD
i
L
Page 61

Effects of Stray Capacitance
The effects of stray capacitance on the measurement accuracy can be minimized by
connecting the current input terminal of the instrument to the side that is close to the
earth potential of the power source (SOURCE).
3.4 For Making Accurate Measurements
The internal structure of the instrument is as follows.
The voltage and current measurement circuits are each enclosed in shielded cases. These
shielded cases are placed inside the outer case. The shielded case of the voltage measurement
circuit is connected to the ± terminal of the voltage input terminal and the shielded case of the
current measurement circuit is connected to the ± terminal of the current input terminal.
Because the outer case is insulated from the shielded case, stray capacitance Cs of
approximately 100 pF exists. The current generated by this stray capacitance, Cs, will
cause errors.
Shielded case of the voltage
U
±
I
±
measurement circuit
Cs
Cs
Outer case
Earth
Shielded case of the current
measurement circuit
For example, we will consider the case when one side of the power source and the outer
case are grounded.
In this case, two current flows can be considered, load current i
and the current that flows
L
through the stray capacitance iCs. iL flows through the current measurement circuit, then through
the load, and returns to the power source (shown with a dotted line). iCs flows through the current
measurement source, through the stray capacitance, and then through the earth ground of the
outer case, and returns to the power source (shown with a dot-dash line).
Therefore, the current measurement circuit ends up measuring the sum of i
and iCs even
L
though it wants to measure only iL. iCs is the amount of error in this case. If the voltage
applied to Cs is VCs (common mode voltage), then iCs can be found using the following
equation. Because the phase of iCs is ahead of the voltage by 90° the effects of iCs on
the measurement accuracy increases as the power factor gets smaller.
= VCs × 2πf × Cs
i
Cs
3
Before Starting Measurements
IM 760101-01E
i
i
Cs
i
L
L
SOURCE
U
±
I
±
Cs
i
Cs
LOAD
i
L
When measuring high frequencies as in this instrument, this error, iCs, cannot be ignored.
By connecting the current input terminal of the instrument to the side that is close to the
earth potential of the power source (SOURCE), the terminal of the current measurement
circuit of the instrument approaches the earth potential. Thus, V
approximately zero and very little i
flows.
Cs
becomes
Cs
3-7
Page 62
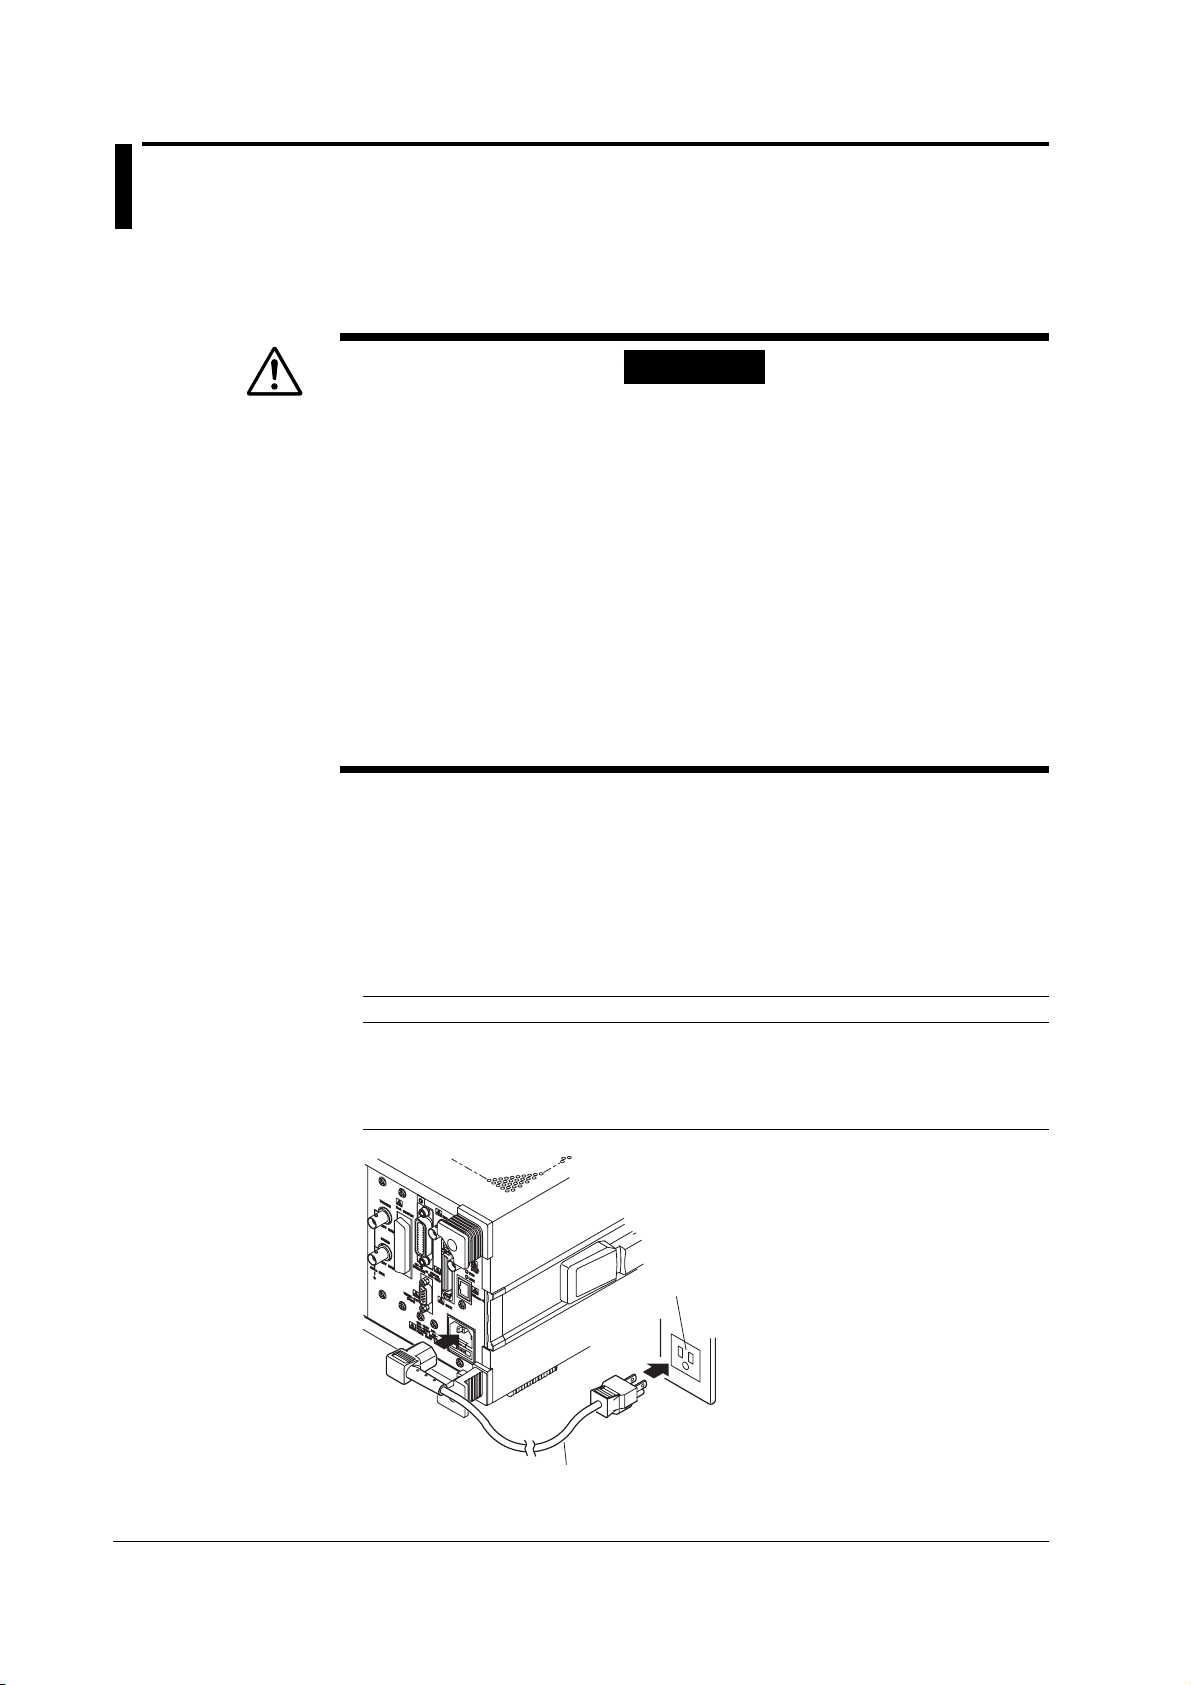
3.5 Connecting the Power Supply
Before Connecting the Power
To prevent the possibility of electric shock and damage to the instrument, follow the
warnings below.
WARNING
• Connect the power cord only after confirming that the voltage of the power
supply matches the rated electric power voltage for the instrument.
• Connect the power cord after checking that the power switch of the instrument is
turned OFF.
• To prevent the possibility of electric shock or fire, always use the power cord
supplied by YOKOGAWA.
• Make sure to perform protective grounding to prevent the possibility of electric
shock. Connect the power cord to a three-pin power outlet with a protective
earth terminal.
• Do not use an extension cord without protective earth ground. Otherwise, the
protection function will be compromised.
• Use a power outlet compatible with the accessory power cord and ensure
proper protective grounding. Do not use the instrument if no such compatible
power outlet and proper protective grounding are available.
Connecting the Power Cord
1. Check that the power switch is OFF.
2. Connect the power cord plug to the power connector on the rear panel. (Use
the power cord that came with the package.)
3. Connect the plug on the other end of the power cord to the outlet that meets the
conditions below. The AC outlet must be of a three-pin type with a protective
earth ground terminal.
Item Specification
Rated supply voltage 100 to 120 VAC, 200 to 240 VAC
Permitted supply voltage range 90 to 132 VAC, 180 to 264 VAC
Rated supply voltage frequency 50/60 Hz
Permitted supply voltage frequency range 48 to 63 Hz
Maximum power consumption (when using the printer) 150 VA
3-pin outlet
Power cord
(included in the package)
3-8 IM 760101-01E
Page 63

3.6 Directly Wiring the Circuit under Measurement
The measurement cable is wired directly from the circuit under measurement to the
voltage/current input terminal.
To prevent the possibility of electric shock and damage to the instrument, follow the
precautions given in section 3.3, “Wiring Precautions.”
Connecting to the Input Terminal
• Voltage Input Terminal
The terminal is a φ4-mm safety banana jack (female).
Insert the safety terminal (the conductive parts are not exposed) into the voltage input
terminal.
• Current Input Terminal
• When the voltage of the circuit under measurement is being applied to the current
input terminals, do not touch the current sensor input terminals. Since these
terminals are electrically connected inside the instrument, this act is dangerous.
• When connecting measurement cables from an external current sensor to the
current sensor input connector, remove the cables connected to the current input
terminals. In addition, when the voltage of the circuit under measurement is being
applied to the current sensor input terminal, do not touch the current input
terminals. Since these terminals are electrically connected inside the instrument,
this act is dangerous.
• The terminal is a binding post. The screws used on the terminal (binding post) are
M6 screws. Either wind the wire around the screw or pass the crimp-on lugs
through the screw axis, then tighten firmly by holding the terminal knob.
3
Before Starting Measurements
3.1
7
2.1
Unit: mm
6
Number of Installed Input Elements and Wiring Systems
The selectable wiring systems vary depending on the number of input elements that are
installed in the instrument. You may be able to select only a single type of wiring system
or two or three types of wiring systems. For details, see “Number of Installed Input
Elements and Wiring Systems” in section 1.3, “Measurement Conditions.”
IM 760101-01E
3-9
Page 64

3.6 Directly Wiring the Circuit under Measurement
Note
• After wiring, the wiring system must be selected. See section 5.1, “Selecting the Wiring System.”
• The thick lines on the wiring diagrams are the sections where the current flows. Use
appropriate wires that are suitable for the current.
Wiring Example of a Single-Phase, Two-Wire System (1P2W)
If there are six input elements, six single-phase, two-wire systems can be set up.
SOURCE
U
±
I
±
Input terminal
SOURCE
U
±
I
±
Input terminal
LOAD
SOURCE
LOAD
SOURCE
Wiring Example of a Single-Phase, Three-Wire System (1P3W)
• If there are six input elements, three single-phase, three-wire systems can be set up
(elements 1 and 2, elements 3 and 4, and elements 5 and 6).
• The assignment of elements to the input terminals in the figure varies depending on
the number of installed input elements. For details, see “Number of Installed Input
Elements and Wiring Systems” in section 1.3, “Measurement Conditions.”
U
U1
±
±
I
I1
±
I
I1
U
U1
±
LOAD
LOAD
U
±
±
I
LOAD
SOURCE
±
I
I1
U
U1
N
I2
I
±
±
U2
U
±
LOAD
SOURCE
N
Input terminal 1
U
±
I
±
Input terminal 2
3-10 IM 760101-01E
Page 65

3.6 Directly Wiring the Circuit under Measurement
Wiring Example of a Three-Phase, Three-Wire System (3P3W)
• If there are six input elements, three three-phase, three-wire systems can be set up
(elements 1 and 2, elements 3 and 4, and elements 5 and 6).
• The assignment of elements to the input terminals in the figure varies depending on
the number of installed input elements. For details, see “Number of Installed Input
Elements and Wiring Systems” in section 1.3, “Measurement Conditions.”
SOURCE
R
S
T
LOAD
SOURCE
U
±
I
±
U
±
I
±
Input terminal 2Input terminal 1
I
R
ST
I
Wiring Example of a Three-Voltage, Three-Current System (3V3A)
• If there are six input elements, two three-voltage, three-current systems can be set up
(elements 1, 2, and 3 and elements 4, 5, and 6).
• The assignment of elements to the input terminals in the figure varies depending on
the number of installed input elements. For details, see “Number of Installed Input
Elements and Wiring Systems” in section 1.3, “Measurement Conditions.”
3
Before Starting Measurements
±
I1
I2
±
U2
U
U1
±
U
±
LOAD
SOURCE
R
S
T
U
±
I
±
U
±
I
±
Input terminal 2Input terminal 1 Input terminal 3
LOAD
SOURCE
U
±
I
±
T
Wiring Example of a Three-Phase, Four-Wire System (3P4W)
• If there are six input elements, two three-phase, four-wire systems can be set up
(elements 1, 2, and 3 and elements 4, 5, and 6).
• The assignment of elements to the input terminals in the figure varies depending on
the number of installed input elements. For details, see “Number of Installed Input
Elements and Wiring Systems” in section 1.3, “Measurement Conditions.”
SOURCE
R
S
T
N
U
±
I
±
Input terminal 1 Input terminal 2 Input terminal 3
U
±
I
±
LOAD
SOURCE
U
±
I
±
±
I
I1
R
U3 U1
U
U2
±
U1
±
U2
U
U
LOAD
±
U
±
±
U
LOAD
U
±
S
I2
±
I
I3
±
I
±
I
I1
R
N
ST
U3
I2
±
I
I3
±
I
IM 760101-01E
Note
For the relationship between the wiring systems and the method of determining the measured
values or computed values, see Appendix 1, “Symbols and Determination of Measurement
Functions.”
3-11
Page 66

3.7 Using an External Current Sensor to Wire the Circuit under Measurement
To prevent the possibility of electric shock and damage to the instrument, follow the
precautions given in section 3.3, “Wiring Precautions.”
• As shown below, when the maximum current value of the circuit under measurement
exceeds the maximum range of the input element, an external sensor can be
connected to the current sensor input connector in order to measure the current of the
circuit under measurement.
• 5-A input element
When the maximum current exceeds “5 Arms.”
• 50-A input element
When the maximum current exceeds “50 Arms.”
•A shunt-type or clamp-type current sensor can be used for an external current sensor.
Connecting to the Current Sensor Input Connector
Connect an external sensor cable with the BNC connector (B9284LK, sold separately) to
the current sensor input connector.
When connecting the external sensor cable, remove the measurement cable from the
current input terminal. Since the current sensor input connector and the current input
connector are connected internally, measurement inaccuracies or malfunction could
result. In addition, when the voltage of the circuit under measurement is being applied to
the current sensor input terminals, do not touch the other current input terminals or
current sensor terminals. Since these terminals are electrically connected inside the
instrument, doing so can be dangerous.
Number of Installed Input Elements and Wiring Systems
The selectable wiring systems vary depending on the number of input elements that are
installed in the instrument. You may be able to select only a single type of wiring system
or two or three types of wiring systems. For details, see “Number of Installed Input
Elements and Wiring Systems” in section 1.3, “Measurement Conditions.”
3-12 IM 760101-01E
Page 67

3.7 Using an External Current Sensor to Wire the Circuit under Measurement
Note
• After wiring, the wiring system must be selected. See section 5.1, “Selecting the Wiring
System.”
• The thick lines on the wiring diagrams are the sections where the current flows. Use
appropriate wires that are suitable for the current.
• To more accurately measure apparent power and power factor in three-phase unbalanced
circuits, we recommend the three-voltage three-current (3V3A) measurement method.
• The current sensor input transformation function can be used to transform the input signal to
data that correspond to direct measurements. For the procedures, see section 5.3, “Setting
the Measurement Range When Using an External Current Sensor.”
• Note that the frequency and phase characteristics of the external current sensor affect the
measured data.
• Make sure you have the polarities correct when making the connections. Otherwise, the
polarity of the measurement current will be reversed and correct measurements cannot be
made. Be especially careful when connecting the clamp type current sensor, because it is
easy to reverse the connection.
• To minimize error when using a shunt-type current sensor, note the following points when
connecting the external sensor cable.
• Connect the shielded wire of the external sensor cable to the L side of the shunt output
terminal (OUT).
• Minimize the area created between the wires connecting the current sensor to the external
sensor cable. The effects due to the line of magnetic force (caused by the measurement
current) and noise that enter this area of space can be reduced.
3
Before Starting Measurements
Shunt-type current sensor
I
±
• For a shunt-type current sensor, connect it to the power earth ground side as shown in the
figure below. If you have to connect the sensor to the non-earth side, use a wire that is
thicker than AWG18 (conductive cross-sectional area of approx. 1 mm2) between the sensor
and the instrument to reduce the effects of common mode voltage. Take safety and error
reduction in consideration when constructing an external sensor cable.
Shunt-type current sensor
• When the circuit under measurement is not grounded and the signal is high in frequency or
large in power, the effects of the inductance of the connection cable for the shunt-type current
sensor become large. In these cases, use an isolation sensor (CT, DC-CT, or clamp) for the
measurements.
OUT H
OUT L
Area of space created by the connection wires
External sensor cable
WT1600
Shielded wire
V
Voltage input
±
terminal
LOAD
Current sensor input
connector
IM 760101-01E
Clamp-type current sensor
V
Voltage input
±
terminal
Current sensor input
connector
LOAD
3-13
Page 68

3.7 Using an External Current Sensor to Wire the Circuit under Measurement
The following wiring examples are for connecting shunt-type current sensors. When
connecting a clamp-type current sensor, replace the shunt-type current sensor with the
clamp-type. In addition, the assignment of elements to the input terminals in the
following figure varies depending on the number of installed input elements. For details,
see “Number of Installed Input Elements and Wiring Systems” in section 1.3,
“Measurement Conditions.”
Wiring Example of a Single-Phase, Two-Wire System (1P2W) Using a Shunt-Type
Current Sensor
SOURCE
Shunt-type current sensor
±
Earth
side
OUT L OUT H
I
U
±
Current sensor input
connector (EXT)
LOAD
Input terminal
Wiring Example of a Single-Phase, Three-Wire System (1P3W) Using a Shunt-Type
Current Sensor
SOURCE LOAD
N
OUT H
I
±
OUT L
U
Input terminal 1
±
OUT H
I
±
OUT L
U
Input terminal 2
±
Current sensor input
connector (EXT)
Current sensor input
connector (EXT)
Wiring Example of a Three-Phase, Three-Wire System (3P3W) Using a Shunt-Type
Current Sensor
SOURCE LOAD
R
S
T
3-14 IM 760101-01E
OUT H
I
±
OUT L
U
Input terminal 1
±
Current sensor input
connector (EXT)
I
OUT H
±
OUT L
U
Input terminal 2
±
Current sensor input
connector (EXT)
Page 69

3.7 Using an External Current Sensor to Wire the Circuit under Measurement
Wiring Example of a Three-Voltage, Three-Current System (3V3A) Using a Shunt-Type
Current Sensor
SOURCE
R
S
T
I
OUT H
±
OUT L
I
OUT H
U
Input
±
terminal 1
Current sensor input
connector (EXT)
±
OUT L
I
OUT H
U
Input
±
terminal 2
Current sensor input
connector (EXT)
±
OUT L
U
±
Current sensor input
connector (EXT)
LOAD
Input
terminal 3
Wiring Example of a Three-Phase, Four-Wire System (3P4W) Using a Shunt-Type
Current Sensor
SOURCE LOAD
R
S
T
N
I
OUT H
±
OUT L
U
±
Input
terminal 1
I
±
OUT LOUT H
U
Input
±
terminal 2
I
OUT H
±
OUT L
U
±
Input
terminal 3
3
Before Starting Measurements
Current sensor input
connector (EXT)
Current sensor input
connector (EXT)
Current sensor input
connector (EXT)
Note
For the relationship between the wiring systems and the method of determining the measured
values or computed values, see Appendix 1, “Symbols and Determination of Measurement
Functions.”
IM 760101-01E
3-15
Page 70

3.8 Using an External PT or CT to Wire the Circuit under Measurement
Connect a measurement cable from an external potential transformer (PT) or current
transformer (CT) to the voltage or current input terminal of the input element.
To prevent the possibility of electric shock and damage to the instrument, follow the
precautions given in section 3.3, “Wiring Precautions.”
• An external PT can be used to make measurements when the maximum voltage of
the circuit under measurement exceeds “1000 Vrms.”
• An external CT can be used to make measurements when the maximum current of
the circuit under measurement exceeds the maximum range of the input element as
shown below.
• 5-A input element
When the maximum current exceeds “5 Arms.”
• 50-A input element
When the maximum current exceeds “50 Arms.”
Connecting to the Input Terminal
• Voltage input terminal
Insert the safety terminal (the conductive parts are not exposed) into the voltage input
terminal.
• Current input terminal
• When the voltage of the circuit under measurement is being applied to the current
input terminals, do not touch the current sensor input terminals. Since these
terminals are electrically connected inside the instrument, this act is dangerous.
• When connecting measurement cables from an external current sensor to the
current sensor input connector, remove the cables connected to the current input
terminals. In addition, when the voltage of the circuit under measurement is being
applied to the current sensor input terminal, do not touch the current input
terminals. Since these terminals are electrically connected inside the instrument,
this act is dangerous.
• The screws used on the terminal (binding post) are M6 screws. Either wind the
wire around the screw or pass the crimp-on lugs through the screw axis, then
tighten firmly by holding the terminal knob.
Number of Installed Input Elements and Wiring Systems
The selectable wiring systems vary depending on the number of input elements that are
installed in the instrument. You may be able to select only a single type of wiring system
or two or three types of wiring systems. For details, see “Number of Installed Input
Elements and Wiring Systems” in section 1.3, “Measurement Conditions.”
3-16 IM 760101-01E
Page 71

3.8 Using an External PT or CT to Wire the Circuit under Measurement
Note
• After wiring, the wiring system must be selected. See section 5.1, “Selecting the Wiring System.”
• The thick lines on the wiring diagrams are the sections where the current flows. Use
appropriate wires that are suitable for the current.
• The scaling function can be used to transform the input signal to data that correspond to
direct measurements. For the procedures, see section 5.4, “Setting the Scaling Function
when using an External PT or CT.”
• Note that the frequency and phase characteristics of the PT or CT affect the measured data.
• This section includes wiring diagrams that show, for safety purposes, the grounding of the
secondary common terminals (+/–) for PT and CT.
• To more accurately measure apparent power and power factor in three-phase unbalanced
circuits, we recommend the three-voltage three-current (3V3A) measurement method.
The assignment of elements to the input terminals in the following figure varies
depending on the number of installed input elements. For details, see “Number of
Installed Input Elements and Wiring Systems” in section 1.3, “Measurement Conditions.”
Wiring Example of a Single-Phase, Two-Wire System (1P2W) Using PT and CT
3
Before Starting Measurements
SOURCE
CT
L
U
±
I
±
Input terminal
LOAD
SOURCE
PT
V
vl
CT
L
U
±
I
±
Input terminal
LOAD
PT
V
vl
Wiring Example of a Single-Phase, Three-Wire System (1P3W) Using PT and CT
SOURCE
N
CT
L
l
U
±
I
±
Input terminal 1
PT
V
v
CT
L
l
U
±
I
±
Input terminal 2
LOAD
PT
V
v
IM 760101-01E
3-17
Page 72

3.8 Using an External PT or CT to Wire the Circuit under Measurement
Wiring Example of a Three-Phase, Three-Wire System (3P3W) Using PT and CT
SOURCE
R
S
T
CT
L
l
U
±
I
±
Input terminal 1
PT
V
v
CT
L
U
±
I
±
Input terminal 2
LOAD
PT
V
vl
Wiring Example of a Three-Voltage, Three-Current System (3V3A) Using PT and CT
SOURCE
R
S
T
CT
L
PT
V
vl
CT
L
PT
V
vl
CT
L
LOAD
PT
V
vl
U
±
I
±
Input terminal 1
U
±
I
±
Input terminal 2
U
±
I
±
Input terminal 3
Wiring Example of a Three-Phase, Four-Wire System (3P4W) Using PT and CT
SOURCE
R
S
T
N
CT
L
U
±
I
±
Input terminal 1
Note
PT
V
vl
For the relationship between the wiring systems and the method of determining the measured
values or computed values, see Appendix 1, “Symbols and Determination of Measurement
Functions.”
CT
L
U
±
I
±
Input terminal 2
PT
V
vl
CT
L
U
±
I
±
Input terminal 3
LOAD
PT
V
vl
3-18 IM 760101-01E
Page 73

3.9 Wiring a Circuit with Voltage Input Exceeding 600 V
When the voltage across the voltage input terminals exceeds 600 V, do not directly input
the current to the current input terminals. Connect the output of an isolation sensor (CT,
DT-CT, or clamp) to the current sensor input connector.
WARNING
• The rated voltage between the input terminal (voltage input terminal, current
input terminal, and current sensor input connector) and earth ground is 600 V.
Do not apply a voltage exceeding 600 V.
• The rated voltage between the voltage and current input terminals, between the
voltage input terminal and current sensor input connector, and between the
current input terminal and current sensor input connector is 600 V. Do not apply
a voltage exceeding 600 V.
• The rated voltage between the U-voltage input terminal and the terminal of
voltage input terminal is 1000 V. Do not apply a voltage exceeding 1000 V.
• When the voltage across the voltage input terminals exceeds 600 V, do not
directly input the current to the current input terminals. Connect the output of an
isolation sensor (CT, DT-CT, or clamp) to the current sensor input connector.
• Follow the precautions given in section 3.3, “Wiring Precautions.”
3
Before Starting Measurements
• When the isolation sensor is current output
SOURCE
U
±
Input terminal
I
±
• When the isolation sensor is voltage output
SOURCE
U
±
Current sensor input
connector (EXT)
LOAD
LOAD
Input terminal 1
IM 760101-01E
Note
For wiring precautions, see also sections 3.7 and 3.8.
3-19
Page 74

3.10 Turning ON/OFF the Power Switch
Points to Check before Turning ON the Power
• Check that the instrument is installed properly (see section 3.2, “Installing the
Instrument”).
• Check that the power cord is connected properly (see section 3.5, “Connecting the
Power Supply”).
• Check that the circuit under measurement is wired properly (see sections 3.7 “Directly
Wiring the Circuit under Measurement,” 3.8 “Using an External Current Sensor to Wire
the Circuit under Measurement,” 3.9 “Using an External PT or CT to Wire the Circuit
under Measurement,” and 3.10 “Wiring a Circuit with Voltage Input Exceeding 600 V.”
Location of the Power Switch
The power switch is located in the lower left corner of the front panel.
Turning ON/OFF the Power Switch
The power switch is a push button. Press the button once to turn it “ON” and press it
again to turn it “OFF.”
OFF ON
The Order in Turning ON/OFF the Power
When using the model with the SCSI option and you wish to save or load data using an
external SCSI device, turn ON the SCSI device first, then turn ON this instrument. When
turning OFF the instrument and SCSI device, reverse the order.
Power Up Operation
When the power switch is turned ON, the self-test starts automatically. When the selftest completes successfully, the display shows the screen that is displayed when the
power switch is turned OFF.
Note
If the instrument does not operate as described above when the power switch is turned ON,
turn OFF the power switch and check the following points.
• Check that the power cord is securely connected to the outlet.
• Check that the correct voltage is coming to the power outlet (see section 3.5, “Connecting
the Power Supply”).
• Check that the fuse is not blown (see section 16.5, “Replacing the Power Fuse”).
• If the power switch is turned ON while pressing RESET, the setup parameters are
initialized to their factory default values. For information on initialization, see section 15.3,
“Initializing the Settings.”
If the instrument still does not work after checking these points, contact your nearest
YOKOGAWA dealer for repairs.
3-20 IM 760101-01E
Page 75

For Making Accurate Measurements
• Allow the instrument to warm up for at least an hour after turning ON the power
switch.
• Perform zero-level compensation after warm-up (see section 15.4, “Performing ZeroLevel Compensation”).
Shutdown Operation
The setup parameters that exist immediately before the power switch is turned OFF are
stored in memory. The same is true when the power cord gets disconnected from the
outlet. The next time the power switch is turned ON, the instrument powers up using the
stored setup parameters.
Note
A lithium battery is used to retain the setup parameters. When the lithium battery voltage falls
below a certain level, a message is displayed on the screen (see section 16.2) when the
power switch is turned ON. When this message appears frequently, the battery must be
replaced quickly. The user cannot replace the battery. For battery replacement, contact your
nearest YOKOGAWA dealer. For information regarding battery life, see section 16.6.
3.10 Turning ON/OFF the Power Switch
3
Before Starting Measurements
IM 760101-01E
3-21
Page 76
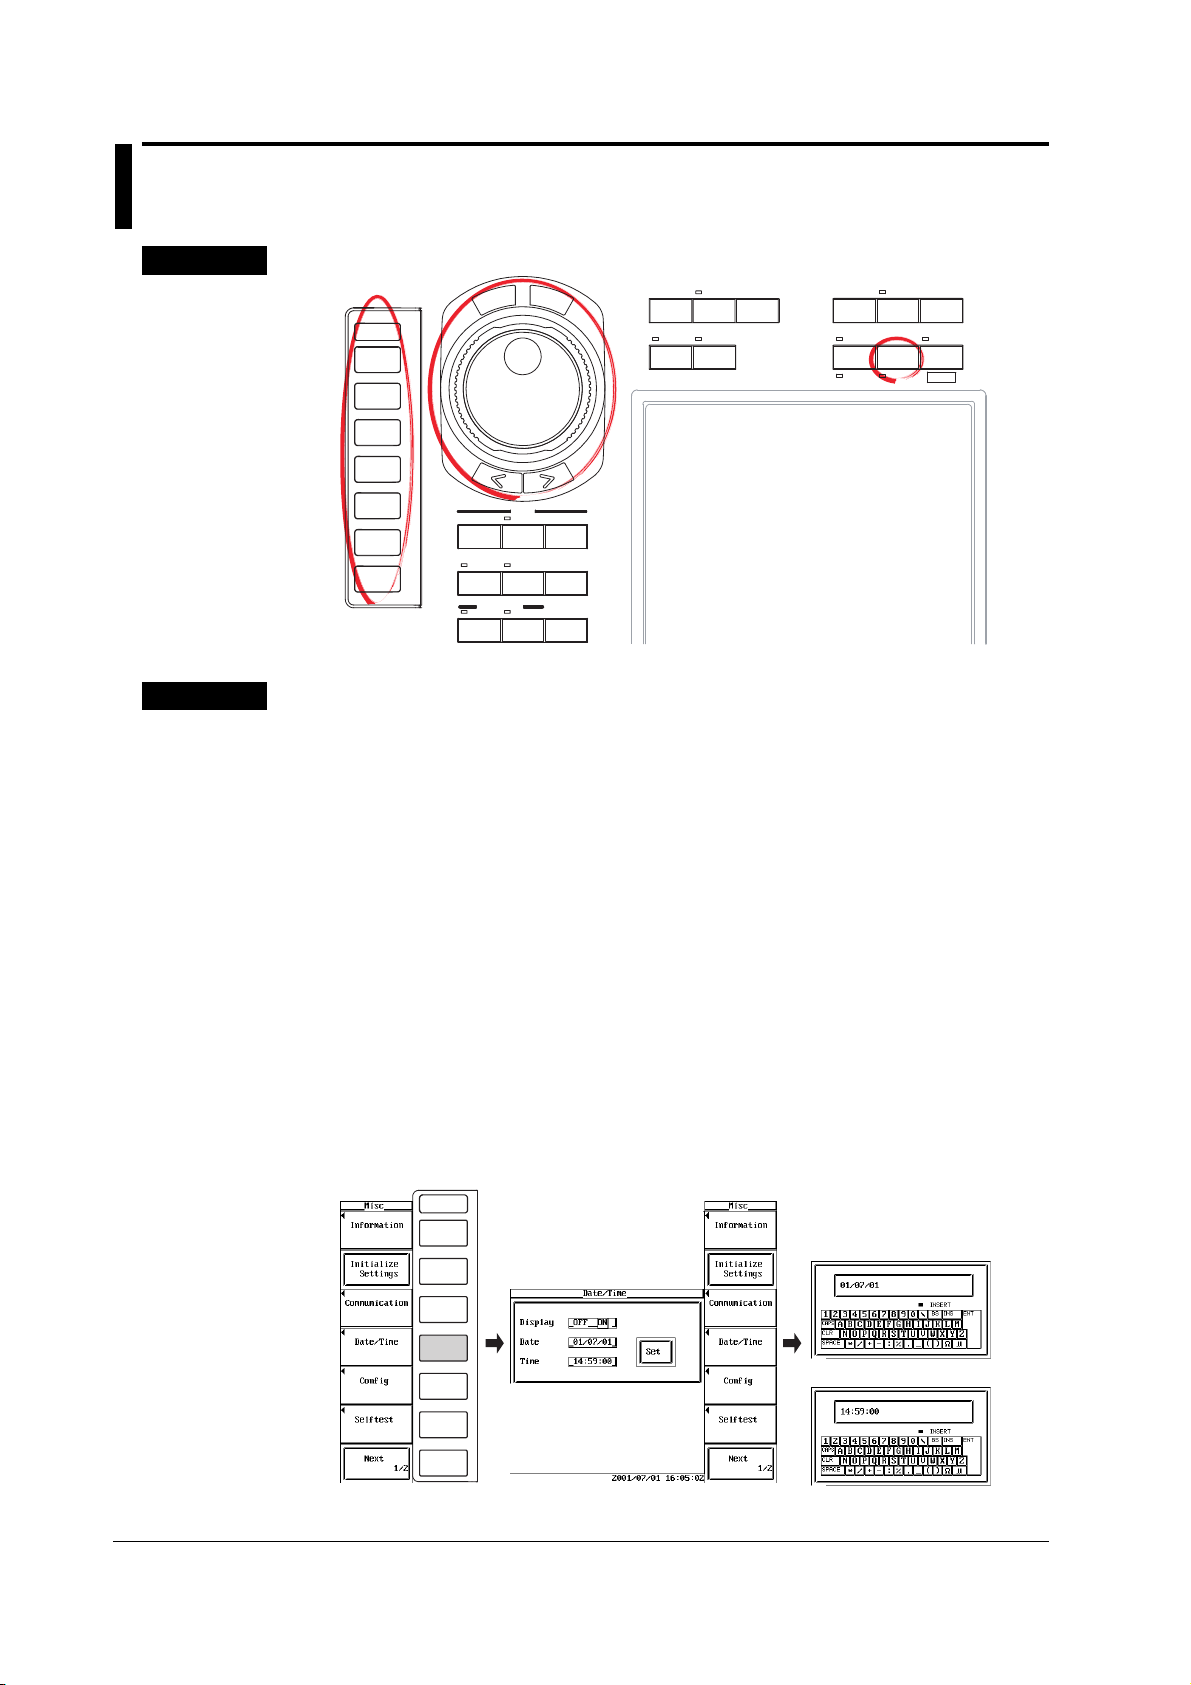
3.11 Setting the Date and Time
ESC
ESC
Keys
S
E
T
L
E
E
INPUT
SCALING
AVG
C
T
WIRING
MEASURE
CAL
DISPLAY
TRIG'D
WAVE
CURSOR
To exit the menu during operation, press ESC.
Procedure
ES
R
RANGE
MOTOR SET
FILTER
INTEGRATOR
START STOP SYNC SRC
INTEG SET RESET
1. Press MISC to display the Misc menu.
2. Press the Date/Time soft key to display the Date/Time dialog box.
HOLD
SINGLE
HARMONICS
UP DATE
RATE
FILE
STORE SET
REMOTE
LOCAL MISC
MAX HOLD N ULL
COPYSTORE
MENU
SHIFT
• Turning ON/OFF the Date/Time Display
3. Turn the jog shuttle to select Display.
4. Press SELECT to select ON or OFF.
• Setting the Date and Time
5. Turn the jog shuttle to select Date or Time.
6. Press SELECT to display the keyboard.
7. Use the keyboard to set the date or time.
For keyboard operations, see section 3.12, “Entering Values and Strings.”
• Confirming the New Settings
8. Turn the jog shuttle to select Set.
9. Press SELECT. If ON was selected in step 4, the new date and time are
displayed in the lower right corner of the screen. If the procedure is aborted
without pressing SELECT, the new settings are not reflected on the display.
Setting the date
Setting the time
3-22 IM 760101-01E
Page 77

Explanation
3.11 Setting the Date and Time
• Turning ON/OFF the Date/Time display
You can select whether or not to display the date and time in the lower right corner of the
screen.
• OFF: Do not display the date and time.
• ON: Display the date and time.
• Setting the Date and Time
• Setting the date
You can set the date in the form YY/MM/DD (year/month/day). Set the lower two
digits of the year. Set 00 to 99 for years 2000 to 2099.
• Setting the time
You can set the time in the form HH:MM:SS (hour:minute:second). The hour is set
using a 24-hour clock.
• Confirming the New Settings
When the date/time is turned ON/OFF, it is immediately reflected on the screen.
However, if you are changing the date and time, you must confirm the new settings. If
you do not (abort the operation), the new settings will not take effect.
3
Before Starting Measurements
Note
• The date and time information is backed up with the lithium battery when the power is turned OFF.
• The instrument contains leap year information. The instrument determines the leap year
calendar when the new settings are confirmed. If you enter [2/29] on a non-leap year, an
error message will be displayed.
IM 760101-01E
3-23
Page 78

3.12 Entering Values and Strings
ESC ESC
Entering Values
After selecting the setup parameter with the SELECT key and soft keys, the value can
be changed using the jog shuttle. The outer shuttle ring can be used step through the
values in large increments. On some parameters, the arrow keys below the jog
shuttle can be used to move among the digits.
Note
Some of the parameters that can be changed using the jog shuttle are reset to their initial
values when the RESET key is pressed.
Entering Strings
The date/time, the equation for the user-defined function, a file name, and a comment
can be entered using the keyboard that is displayed on the screen. The jog shuttle,
arrow keys, and SELECT key are used to operate the keyboard to enter the character
strings.
• Entering the date or unit
The following figure shows the keyboard that appears when setting the date or unit.
1. Turn the jog shuttle to select the character to be entered.
2. Press SELECT to enter the string in the entry box.
3. Repeat steps 1 and 2 to enter all the characters.
4. After entering all the characters, select ENT on the keyboard and press
INSERT indicator
If there are strings already in the entry box, use the arrow keys to select the
entry position.
SELECT. The string is confirmed and the keyboard disappears.
Entry box
3-24 IM 760101-01E
Page 79

3.12 Entering Values and Strings
• Entering the equation for the user-defined function
The following figure shows the keyboard that appears when setting the equation for
the user-defined function. Long equations can be temporarily held in the internal
memory so that it can be used in other equations.
• Entering the equation and temporarily storing it
1. Turn the jog shuttle to select the character to be entered.
(Long function names can be selected by pressing one key.)
2. Press SELECT to enter the string in the entry box.
If there are strings already in the entry box, use the arrow keys to select the
entry position.
3. Repeat steps 1 and 2 to enter all the characters.
4. After entering all the characters, select ENT on the keyboard and press
SELECT. The string is confirmed and the keyboard disappears. At the same
time, the equation is temporarily stored in the internal memory.
• When the equation is not correct and an error message is displayed, it is still stored in
the memory.
• Up to five equations can be stored. Beyond five, for all successive equations, the
oldest equation is cleared.
• Recalling the temporarily stored equation
1. Select on the keyboard and press SELECT. A window opens and the
temporarily stored equation is displayed.
2. Select the equation you wish to recall and press SELECT. The selected
equation appears in the entry box on the keyboard.
If there are strings already in the entry box, they are overwritten with the recalled equation.
3. Correct the recalled equation according to steps 1 to 4 in “Entering the equation
and temporary storage” described above and confirm it. At this point, the
equation is temporarily stored in the internal memory.
3
Before Starting Measurements
The window displaying the equation
that is stored in the memory
The key that is selected when
displaying the window on the right
IM 760101-01E
3-25
Page 80

ESC
3.12 Entering Values and Strings
• Enter the file name and comment
(such as the server name, user name, password, and e-mail address for
Ethernet communication)
The following figure shows the keyboard that appears when setting the file name or
comment. File names and comments can be temporarily held in the internal memory
so that they can be used in other file names and comments.
• Enter the file name and comment and temporarily storing them
1. Turn the jog shuttle to select the character to be entered. You can also press
2. Press SELECT to enter the string in the entry box.
3. Repeat steps 1 and 2 to enter all the characters.
4. After entering all the characters, select ENT on the keyboard and press
the
and soft keys to move the cursor vertically.
If there are strings already in the entry box, use the arrow keys to select the
entry position.
SELECT. The string is confirmed and the keyboard disappears (you can also
press the ENT soft key to achieve the same result). At the same time, the
confirmed string is temporarily stored in the internal memory.
Up to 8 sets of strings can be stored. Beyond eight, for all successive entries, the
oldest string is cleared.
• Recalling the temporary stored string
1. Press the soft key. Each time the soft key is pressed the temporarily stored
strings are displayed in the entry box of the keyboard in order. When the eight
strings that are temporarily stored are displayed, the most recent string is
displayed again.
If there are strings already in the entry box, they are overwritten with the recalled string.
2. Correct the recalled equation according to steps 1 to 4 in “Entering the file name
and comment and temporary storing them” described above and confirm it. At
this point, the string is temporarily stored in the internal memory.
Entry box
Moves the cursor upward.
Moves the cursor downward.
Switches between upper case and lower case.
Deletes the character before the entry position.
Switches the insert/overwrite mode.
Recalls the temporary stored string
Confirms the string.
3-26 IM 760101-01E
Page 81

3.12 Entering Values and Strings
• Keys other than the character keys
• BS: Deletes the character before the entry position.
• INS: Switches the insert/overwrite mode. During the insert mode, the INSERT
indicator on the keyboard lights. When a new character is entered in the insert
mode, the new character is placed at the entry position and all following characters
are moved backward. On the keyboard that appears when entering a file name or
comment, pressing “RESET” on the front panel achieves the same operation as
CLR.
• CLR: Clears all displayed characters.
• CAPS: Switches between upper case and lower case.
• SPACE: Enters a space.
• ENT: Confirms the displayed characters.
• Number of characters and types that can be used
Item Number of Characters Characters That Can Be Used
Date and time Specified number 0 to 9 (/, :)
Equation 1 to 50 characters Characters that are displayed on the keyboard
and spaces
Unit 1 to 8 characters Characters that are displayed on the keyboard
and spaces
File Name 1 to 8 characters 0-9, A-Z, %, _, ( ) (parenthesis), – (minus sign)
Comment 0 to 25 characters Characters that are displayed on the keyboard
and spaces
Server name 0 to 40 characters Characters that are displayed on the keyboard
and spaces
User name 0 to 40 characters Characters that are displayed on the keyboard
and spaces
Password 0 to 40 characters Characters that are displayed on the keyboard
and spaces
E-mail address 0 to 40 characters Characters that are displayed on the keyboard
and spaces
(the @ character cannot be entered
consecutively.)
3
Before Starting Measurements
Note
• Upper and lower case letters are not distinguished for file names. They are distinguished
in comments. In addition, the following five file names cannot be used due to limitations of
MS-DOS.
AUX, CON, PRN, NUL, and CLOCK
• When using the GP-IB or serial interface commands to enter a file name, the following
symbols that do not exist on the keyboard of this instrument can be used.
{ }
IM 760101-01E
3-27
Page 82

Chapter 4 Screen Display Format
ESC
ESC
4.1 Displaying the Data (Numerical Data) of Measurement Functions
«For a functional description, see section 1.4.»
Keys
S
E
T
L
E
E
INPUT
SCALING
AVG
C
T
WIRING
MEASURE
CAL
HOLD
SINGLE
HARMONICS
UP DATE
RATE
DISPLAY
TRIG'D
WAVE
CURSOR
To exit the menu during operation, press ESC.
Procedure
ES
R
RANGE
MOTOR SET
FILTER
INTEGRATOR
START STOP SYNC SRC
INTEG SET RESET
1. Press DISPLAY to display the Display menu.
2. Press the Format soft key to display the display format selection box.
FILE
STORE SET
REMOTE
LOCAL MISC
MAX HOLD N ULL
COPYSTORE
MENU
SHIFT
4
Screen Display Format
Displaying Numerical Data
3. Turn the jog shuttle to select Numeric, Numeric+Wave, Numeric+Bar (only
during harmonic measurement), or Numeric+Trend.
4. Press SELECT to confirm the new display format.
IM 760101-01E
4-1
Page 83

ESC
ESC
ESC
ESC
4.1 Displaying the Data (Numerical Data) of Measurement Functions
The following procedures are given for a representative example in which the
display format is set to Numeric.
During Normal Measurement
Selecting the Displayed Item
5. Press the Item Amount soft key to display the Item Amount menu.
6. Press one of the 4(2) to All keys to select the number of displayed items.
ESC
Scrolling the Display
7. Turn the jog shuttle to move the highlighting of the measurement function.
• If the number of displayed items is set to 4(2) through 78(39), the item number of the
highlighted measurement function is displayed in the Norm Item No. box of the Display
menu.
• If the number of displayed items is set to All, the symbol corresponding to the
highlighted measurement function is displayed in the Function box of the Display menu.
When set to 4(2) to 78(39) When set to All
ESC
4-2 IM 760101-01E
Page 84

ESC
4.1 Displaying the Data (Numerical Data) of Measurement Functions
Page Scrolling the Display
7. Press the Page Up Scroll Exec or Page Down Scroll Exec soft key to scroll
the page.
• If you press the Page Up Scroll Exec soft key, the numerical data corresponding to
item numbers that are smaller than those of the numerical data of measurement
functions displayed up to that point are displayed.
• If you press the Page Down Scroll Exec soft key, the numerical data corresponding to
item numbers that are larger than those of the numerical data displayed up to that point
are displayed.
4
Screen Display Format
IM 760101-01E
4-3
Page 85

ESCESC
ESC ESCESC
4.1 Displaying the Data (Numerical Data) of Measurement Functions
During Harmonic Measurement
Selecting the Number of Displayed Items or List Display
5. Press the Item Amount soft key to display the Item Amount menu.
6. Select one of the 4(2) to ΣList soft keys to select the number of displayed items
or list display.
Scrolling the Display
7. Turn the jog shuttle to move the highlighting.
• If the number of displayed items is set to 4(2) through 16(8), the item number of the
highlighted measurement function is displayed in the Harm Item No. box of the Display
menu.
• If the number of displayed items is set to Single List or Dual List, the highlighted order
is displayed in the Order box of the Display menu.
• If the number of displayed items is set to ΣList, the symbol of the highlighted
measurement function is displayed in the Function box in the Display menu and the
order in the Order box.
If the Function box is selected with the soft key, the measurement functions are
scrolled. If the Order box is selected, the order is scrolled. The corresponding
numerical data is displayed.
When set to 4(2) to 16(8)
When set to Single List
or Dual List
When set to ΣList
4-4 IM 760101-01E
Page 86

ESC
ESC
4.1 Displaying the Data (Numerical Data) of Measurement Functions
Page Scrolling the Display
• When 4(2) through 16(8) is selected in step 6
7. Press the Page Up Scroll Exec or Page Down Scroll Exec soft key to scroll
the page.
• If you press the Page Up Scroll Exec soft key, the numerical data corresponding to
item numbers that are smaller than those of the data (numerical data) of measurement
functions displayed up to that point are displayed.
• If you press the Page Down Scroll Exec soft key, the numerical data corresponding to
item numbers that are larger than those of the numerical data displayed up to that point
are displayed.
4
Screen Display Format
• When Single List or Dual List is selected in step 6
7. Press the Page Up Scroll Exec or Page Down Scroll Exec soft key to scroll
the page.
• If you press the Page Up Scroll Exec soft key, the numerical data corresponding to
orders that are smaller than those of the numerical data displayed up to that point are
displayed.
• If you press the Page Down Scroll Exec soft key, the numerical data corresponding to
orders that are larger than those of the numerical data displayed up to that point are
displayed.
IM 760101-01E
4-5
Page 87

4.1 Displaying the Data (Numerical Data) of Measurement Functions
Explanation
A display example is shown below. For the procedure in changing the displayed items
and contents of numerical data, see chapters 6, 7, and 8.
The color changes from green to red when the input signal level exceeds
approx. three or six times the specified measurement range when the
crest factor is set to 3 or 6, respectively. The conditions of the input
signals of elements 1 to 6 are displayed in order from the left.
Displayed only to products with the motor evaluation function
(option). The color changes from green to red when the analog
revolution/torque signal level exceeds approx. 180% of the
specified measurement range. For pulse revolution signal, the
color changes from green to red when approx. ±10 V is exceeded.
The first and second lines correspond to the conditions of rotating
speed and torque, respectively.
Measurement functions
Number of data updates
• The number of data updates is shown in the Update line at the lower left
part of the screen.
• Press HOLD to stop the data from updating. The update number stops
incrementing. Press HOLD again to allow updating to continue. The update
number resumes incrementing.
• If the value exceedes 65535, it returns to 0.
• If the power is turned OFF, the number of data updates resets to 0.
During Normal Measurement
Meaning of the Measurement Function Symbols
• For the meanings of the measurement function symbols that are displayed, see
section 1.2, “Measurement Functions and Measurement Periods,” 1.5,
“Computation,” 1.6, “Integration,” appendix 1, “Symbols and Determination of
Measurement Functions,” and appendix 2, “Determination of Delta Computation.”
• For details on the wiring units expressed as ΣA, ΣB, ΣC, see section 5.1, “Selecting
the Wiring System.”
Example The true rms value of the voltage of element 1
Data
Urms1
Element 1
True rms value
Voltage
Simple average of the current of the elements combined by wiring
unit ΣA
IdcΣA
Σ function of wiring unit ΣA
Simple average
Current
4-6 IM 760101-01E
Page 88

4.1 Displaying the Data (Numerical Data) of Measurement Functions
Selecting the Display Format
Select the display format of the numerical data from the following list of choices.
[-------] (no data) is displayed in places where the measurement function is not
selected or where no numerical data is present.
• Numeric
Only the numerical data is displayed.
• Numeric+Wave
The numerical data and waveform are displayed separately in the top and bottom
windows. For details on setting the waveform display, see section 4.2 and chapter 9.
• Numeric+Trend
The numerical data and trend are displayed separately in the top and bottom
windows. For details on setting the trend display, see section 4.5 and chapter 10.
Selecting the Number of Displayed Items
Select the number of numerical data items that are displayed simultaneously from the
following list of choices.
• 4(2)
• When the display format is Numeric, 4 numerical data values are displayed in
one column.
• When the display format is other than Numeric, 2 numerical data values are
displayed.
• 8(4)
• When the display format is Numeric, 8 numerical data values are displayed in
one column.
• When the display format is other than Numeric, 4 numerical data values are
displayed.
• 16(8)
• When the display format is Numeric, 16 numerical data values are displayed in
two columns.
• When the display format is other than Numeric, 8 numerical data values are
displayed.
• 42(21)
• When the display format is Numeric, 42 numerical data values are displayed in
three columns.
• When the display format is other than Numeric, 21 numerical data values are
displayed.
4
Screen Display Format
IM 760101-01E
• 78(39)
• When the display format is Numeric, 78 numerical data values are displayed in
three columns.
• When the display format is other than Numeric, 39 numerical data values are
displayed.
• All
A table is displayed indicating the numerical data of items with measurement
functions listed vertically and symbols indicating elements and wiring units listed
horizontally. The number of displayed items varies depending on the number of
installed elements.
4-7
Page 89

4.1 Displaying the Data (Numerical Data) of Measurement Functions
During Harmonic Measurement
Meaning of the Measurement Function Symbols
• For the meanings of the measurement function symbols that are displayed, see
section 1.2, “Measurement Functions and Measurement Periods,” 1.5, “Computation,”
and appendix 1, “Symbols and Determination of Measurement Functions.”
• For details on the wiring units expressed as ΣA, ΣB, ΣC, see section 5.1, “Selecting
the Wiring System.”
Example 20
Selecting the Display Format
Select the display format of the numerical data from the following list of choices.
[-------] (no data) is displayed in places where the measurement function is not
selected or where no numerical data is present.
•Numeric
Only the numerical data is displayed.
• Numeric+Wave
The numerical data and waveform are displayed separately in the top and bottom
windows. For details on setting the waveform display, see section 4.2 and chapter 9.
• Numeric+Bar
The numerical data and bar graph are displayed separately in the top and bottom
windows. For details on setting the bar graph display, see section 4.3 and section 7.9.
• Numeric+Trend
The numerical data and trend are displayed separately in the top and bottom
windows. For details on setting the trend display, see section 4.5 and chapter 10.
th
harmonic voltage of element 2
U2(20)
th
20 order
Element 2
Voltage
Average of the 30th harmonic current of the elements combined by
wiring unit ΣB
IΣB(30)
th
30 order
Σ function of wiring unit ΣB
Current
Selecting the Number of Displayed Items or List Display
Select the number of numerical data items that are displayed simultaneously or list
display from the following list of choices.
• 4(2)
• When the display format is Numeric, 4 numerical data values are displayed in
one column.
• When the display format is other than Numeric, 2 numerical data values are displayed.
• 8(4)
• When the display format is Numeric, 8 numerical data values are displayed in
one column.
• When the display format is other than Numeric, 4 numerical data values are displayed.
• 16(8)
• When the display format is Numeric, 16 numerical data values are displayed in
two columns.
• When the display format is other than Numeric, 8 numerical data values are displayed.
4-8 IM 760101-01E
Page 90

4.1 Displaying the Data (Numerical Data) of Measurement Functions
• Single List
• When the display format is Numeric, 48 numerical data values for a single
measurement function are displayed in two columns.
• When the display format is other than Numeric, 22 numerical data values for a
single measurement function are displayed in two columns.
• Dual List
• When the display format is Numeric, 24 numerical data values each for two
measurement functions are displayed in each column.
• When the display format is other than Numeric, 11 numerical data values each
for two measurement functions are displayed in each column.
• Σ List
• When the display format is Numeric, a table is displayed indicating the
numerical data of items with 19 measurement functions (such as U, I, P, S, Q, λ,
φ) listed vertically and symbols indicating elements and wiring units listed
horizontally.
• When the display format is other than Numeric, a table is displayed indicating
the numerical data of items with 11 measurement functions (such as U, I, P, S,
Q, λ, φ) listed vertically and symbols indicating elements and wiring units listed
horizontally.
•A table is displayed for each order.
4
Screen Display Format
Note
• All harmonic orders (Total) or from dc (0th order) up to 100th order can be displayed.
However, the numerical data up to the order corresponding to the upper limit of harmonic
order under analysis (see section 17.6) that is automatically determined by the frequency of
the PLL source is the data determined by the harmonic measurement.
• [-------] (no data) is displayed in places where the measurement function is not selected or
where no numerical data is present.
• If Urms, Umn, Uac, Udc, Irms, Imn, Iac, or Idc exceeds 140% of the measurement range,
over the range [-OL-] is displayed.
•P shows over the range [-OL-] if the measured values of either the voltage or current exceeds
140% of the measurement range.
• If the measured or computed result cannot be displayed using the specified decimal position
or unit, overflow [-OF-] is displayed.
• If Urms, Uac, Irms, or Iac is less than or equal to 0.3% (when the crest factor is set to 3; less
than or equal to 0.6% when the crest factor is set to 6) or Umn or Imn is less than or equal to
1% (when the crest factor is set to 3; less than or equal to 2% when the crest factor is set to
6) of the measurement range, Urms, Umn, Uac, Irms, Imn, Iac, and the measurement
functions that are determined using these measurement functions display zeroes. λ or φ
displays an error.
• If the measured value of frequency is outside the measurement range, fU or fI displays an
error.
• If both the voltage and current are sinusoids and the ratio of the voltage and current inputs do
not differ greatly with respect to the measurement range, the phase difference φ of lead (D)
and lag (G) are detected correctly.
• If the power factor λ is greater than 1 and less than or equal to 2, λ becomes [1]. φ displays
zero.
• If the power factor λ is greater than 2, λ and φ display errors.
IM 760101-01E
4-9
Page 91

4.2 Displaying Waveforms
ESC
ESC
Keys
S
E
T
L
E
E
INPUT
SCALING
AVG
C
T
WIRING
MEASURE
CAL
Procedure
ES
R
RANGE
MOTOR SET
FILTER
INTEGRATOR
START STOP SYNC SRC
INTEG SET RESET
The retrieval of waveform display data must be turned ON to display
waveforms. For the procedure, see section 9.1.
«For a functional description, see section 1.7.»
HOLD
SINGLE
HARMONICS
UP DATE
RATE
FILE
STORE SET
REMOTE
LOCAL MISC
MAX HOLD N UL L
COPYSTORE
MENU
SHIFT
DISPLAY
TRIG'D
WAVE
CURSOR
To exit the menu during operation, press ESC.
1. Press DISPLAY to display the Display menu.
2. Press the Format soft key to display the display format selection box.
Displaying Waveforms
3. Turn the jog shuttle to select Wave, Numeric+Wave, Wave+Bar (only during
harmonic measurement), or Wave+Trend.
4. Press SELECT to confirm the new display format.
4-10 IM 760101-01E
Page 92

Explanation
Distinction of voltage or current,
the element, and the upper limit
of the displayed waveform
Distinction of voltage or current,
the element, and the lower limit
of the displayed waveform
4.2 Displaying Waveforms
A display example is shown below. For the procedure in changing the displayed items
and contents of waveforms, see chapter 9.
4
Screen Display Format
Time at the left end of the screen
(fixed to 0 s)
Selecting the Display Format
Select the waveform display format from the following list of choices.
• Wave
Only waveforms are displayed.
• Numeric+Wave
The numerical data and waveform are displayed separately in the top and bottom
windows. For details on setting the numerical data display, see section 4.1,
chapters 6, 7, and 8.
•Wave+Bar
The waveform and bar graph are displayed separately in the top and bottom
windows. The bar graph is valid during harmonic measurement. For details on
setting the bar graph display, see section 4.3 and section 7.9.
• Wave+Trend
The waveform and trend are displayed separately in the top and bottom windows.
For details on setting the trend display, see section 4.5 and chapter 10.
Time at the right end of the screen
(time span of the screen)
• Number of data points displayed in the range
from the left to the right end of the screen
• When “P-P” is displayed, waveform is displayed
using P-P compression
(see section 1.7.)
IM 760101-01E
4-11
Page 93

4.3 Displaying Bar Graphs
ESC
ESC
Keys
S
E
T
L
E
E
INPUT
SCALING
AVG
C
T
WIRING
MEASURE
CAL
Procedure
ES
R
RANGE
MOTOR SET
FILTER
INTEGRATOR
START STOP SYNC SRC
INTEG SET RESET
Check that the measurement mode is set to harmonic measurement. If the
measurement mode is set to normal measurement, set Mode to ON in the
Harmonics menu (see section 7.1).
«For a functional description, see section 1.8.»
HOLD
SINGLE
HARMONICS
UP DATE
RATE
FILE
STORE SET
REMOTE
LOCAL MISC
MAX HOLD N UL L
COPYSTORE
MENU
SHIFT
DISPLAY
TRIG'D
WAVE
CURSOR
To exit the menu during operation, press ESC.
1. Press DISPLAY to display the Display menu.
2. Press the Format soft key to display the display format selection box.
Displaying Bar Graphs
3. Turn the jog shuttle to select Wave, Bar, Numeric+Bar, Wave+Bar, or
Bar+Trend.
4. Press SELECT to confirm the new display format.
4-12 IM 760101-01E
Page 94

Explanation
4.3 Displaying Bar Graphs
A display example is shown below. For the procedure in changing the displayed items
and contents of bar graphs, see section 7.9. When the vertical axis is set to logarithmic
coordinates, the characters <log Scale> appears at the upper left corner of the screen.
Range of orders of the displayed
bar graph
Distinction of voltage or current,
the element, and the upper limit
of the displayed bar graph
Distinction of voltage or current,
the element, and the lower limit
of the displayed bar graph
Selecting the Display Format
Select the bar graph display format from the following list of choices.
• Bar
Only bar graphs are displayed.
• Numeric+Bar
The numerical data and bar graph are displayed separately in the top and bottom
windows. For details on setting the numerical data display, see section 4.1,
chapters 6, 7, and 8.
•Wave+Bar
The waveform and bar graph are displayed separately in the top and bottom
windows. For details on setting the waveform display, see section 4.2 and chapter
9.
•Bar+Trend
The bar graph and trend are displayed separately in the top and bottom windows.
For details on setting the trend display, see section 4.5 and chapter 10.
4
Screen Display Format
IM 760101-01E
4-13
Page 95

4.4 Displaying Vectors
ESC
ESC
Keys
S
E
T
L
E
ES
R
INPUT
RANGE
SCALING
MOTOR SET
FILTER
AVG
INTEGRATOR
START STOP SYNC SRC
INTEG SET RESET
Procedure
Check that the measurement mode is set to harmonic measurement. If the
measurement mode is set to normal measurement, set Mode to ON in the
Harmonics menu (see section 7.1).
E
C
T
WIRING
MEASURE
CAL
«For a functional description, see section 1.8.»
HOLD
SINGLE
HARMONICS
UP DATE
RATE
FILE
STORE SET
REMOTE
LOCAL MISC
MAX HOLD N UL L
COPYSTORE
MENU
SHIFT
DISPLAY
TRIG'D
WAVE
CURSOR
To exit the menu during operation, press ESC.
Explanation
1. Press DISPLAY to display the Display menu.
2. Press the Format soft key to display the display format selection box.
Displaying Vectors
3. Turn the jog shuttle to select Vector.
4. Press SELECT to confirm the new display format.
The phase and size (rms value) relationship between the fundamental waves U(1) and
I(1) of each element specified for harmonic measurement (see section 7.3) can be
displayed using vectors. The positive vertical axis is set to 0 (angle 0), and the vector of
each input signal is displayed.
For examples of vector displays and the procedure in changing the displayed items and
contents, see section 7.10.
4-14 IM 760101-01E
Page 96

4.5 Displaying Trends
ESC
ESC
Keys
S
T
E
ES
R
INPUT
RANGE
SCALING
MOTOR SET
FILTER
AVG
INTEGRATOR
START STOP SYNC SRC
INTEG SET RESET
Procedure
The retrieval of trend display data must be turned ON to display trends. For the
procedure, see section 10.1.
E
L
E
WIRING
MEASURE
«For a functional description, see section 1.8.»
C
T
DISPLAY
TRIG'D
WAVE
CURSOR
HOLD
SINGLE
HARMONICS
UP DATE
RATE
FILE
STORE SET
REMOTE
LOCAL MISC
MAX HOLD N UL L
COPYSTORE
MENU
SHIFT
4
Screen Display Format
To exit the menu during operation, press ESC.
CAL
1. Press DISPLAY to display the Display menu.
2. Press the Format soft key to display the display format selection box.
Displaying Trends
3. Turn the jog shuttle to select Trend, Numeric+Trend, Wave+Trend, or
Bar+Trend.
4. Press SELECT to confirm the new display format.
IM 760101-01E
4-15
Page 97

4.5 Displaying Trends
Explanation
A display example is shown below. For the procedure in changing the displayed items
and contents of trends, see chapter 10. When the retrieval of waveform display data is
OFF (see section 9.1) during normal measurement, the horizontal axis is expressed
using time as shown below. During harmonic measurement or when the retrieval of
waveform display data is ON, the horizontal axis is expressed using the number of data
points on the screen.
The trend value in the held condition (see section 5.8) is
the same as the numerical data when HOLD is pressed.
When hold is released, the trend that was held is displayed.
Displayed trend target,
measurement function,
upper limit
Displayed trend target,
measurement function,
lower limit
Time at the left end of the screen
Number of trend display data
(fixed to 0 s)
points retrieved
• Number of data points displayed in the range
from the left to the right end of the screen
• When “P-P” is displayed, trend is displayed
using P-P compression
(see sections 1.7 and 1.8)
Selecting the Display Format
Select the trend display format from the following list of choices.
• Trend
Only trends are displayed.
• Numeric+Trend
The numerical data and trend are displayed separately in the top and bottom
windows. For details on setting the numerical data display, see section 4.1,
chapters 6, 7, and 8.
• Wave+Trend
The waveform and trend are displayed separately in the top and bottom windows.
For details on setting the waveform display, see section 4.2 and chapter 9.
• Bar+Trend
The bar graph and trend are displayed separately in the top and bottom windows.
For details on setting the bar graph display, see section 4.3 and section 7.9.
Time at the right end of the screen
(time span of the screen)
4-16 IM 760101-01E
Page 98

4.6 Listing the Setup Parameters
ESC
ESC
Keys
S
E
T
L
E
E
INPUT
SCALING
AVG
C
T
WIRING
MEASURE
CAL
DISPLAY
HOLD
SINGLE
TRIG'D
HARMONICS
WAVE
CURSOR
To exit the menu during operation, press ESC.
Procedure
ES
R
RANGE
MOTOR SET
FILTER
INTEGRATOR
START STOP SYNC SRC
INTEG SET RESET
1. Press DISPLAY to display the Display menu.
2. Press the Format soft key to display the display format selection box.
UP DATE
RATE
FILE
STORE SET
REMOTE
LOCAL MISC
MAX HOLD N UL L
COPYSTORE
MENU
SHIFT
4
Screen Display Format
Selecting the List of Setup Parameters
3. Turn the jog shuttle to select Information.
4. Press SELECT to confirm the new display format.
IM 760101-01E
4-17
Page 99

ESC
4.6 Listing the Setup Parameters
Displaying the Relation Table of Elements and Measurement Ranges
5. Press the Power Element soft key. The relation table of measurement ranges,
Displaying the Relation Table of Trend Targets and Measurement Functions
5. Press the Trend soft key to display the relation table of trend targets and
input filters, transformation ratios, scaling factors, and other parameters are
displayed for each element.
measurement functions.
Displaying the Relation Table of D/A Output Channels and Measurement
Functions
*
5. Press the D/A Output soft key to display the relation table of D/A output
channels and measurement functions.
* Displayed only on products with the D/A output (option).
Displaying the Relation Table of Rotating Speeds and the Input Ranges of Torque
5. Press the Motor Element soft key. A relation table of the rotating speed and
the input range, filter, scaling factor, unit, and synchronization source of torque,
number of poles, frequency measurement source, and other parameters is
displayed.
* Displayed only to products with the motor evaluation function (option).
*
Explanation
Relation Table of Elements and Measurement Ranges
If the menu is cleared using ESC, a relation table of up to 6 elements is displayed.
The following figure shows an example when the crest factor is set to 3.
4-18 IM 760101-01E
Page 100
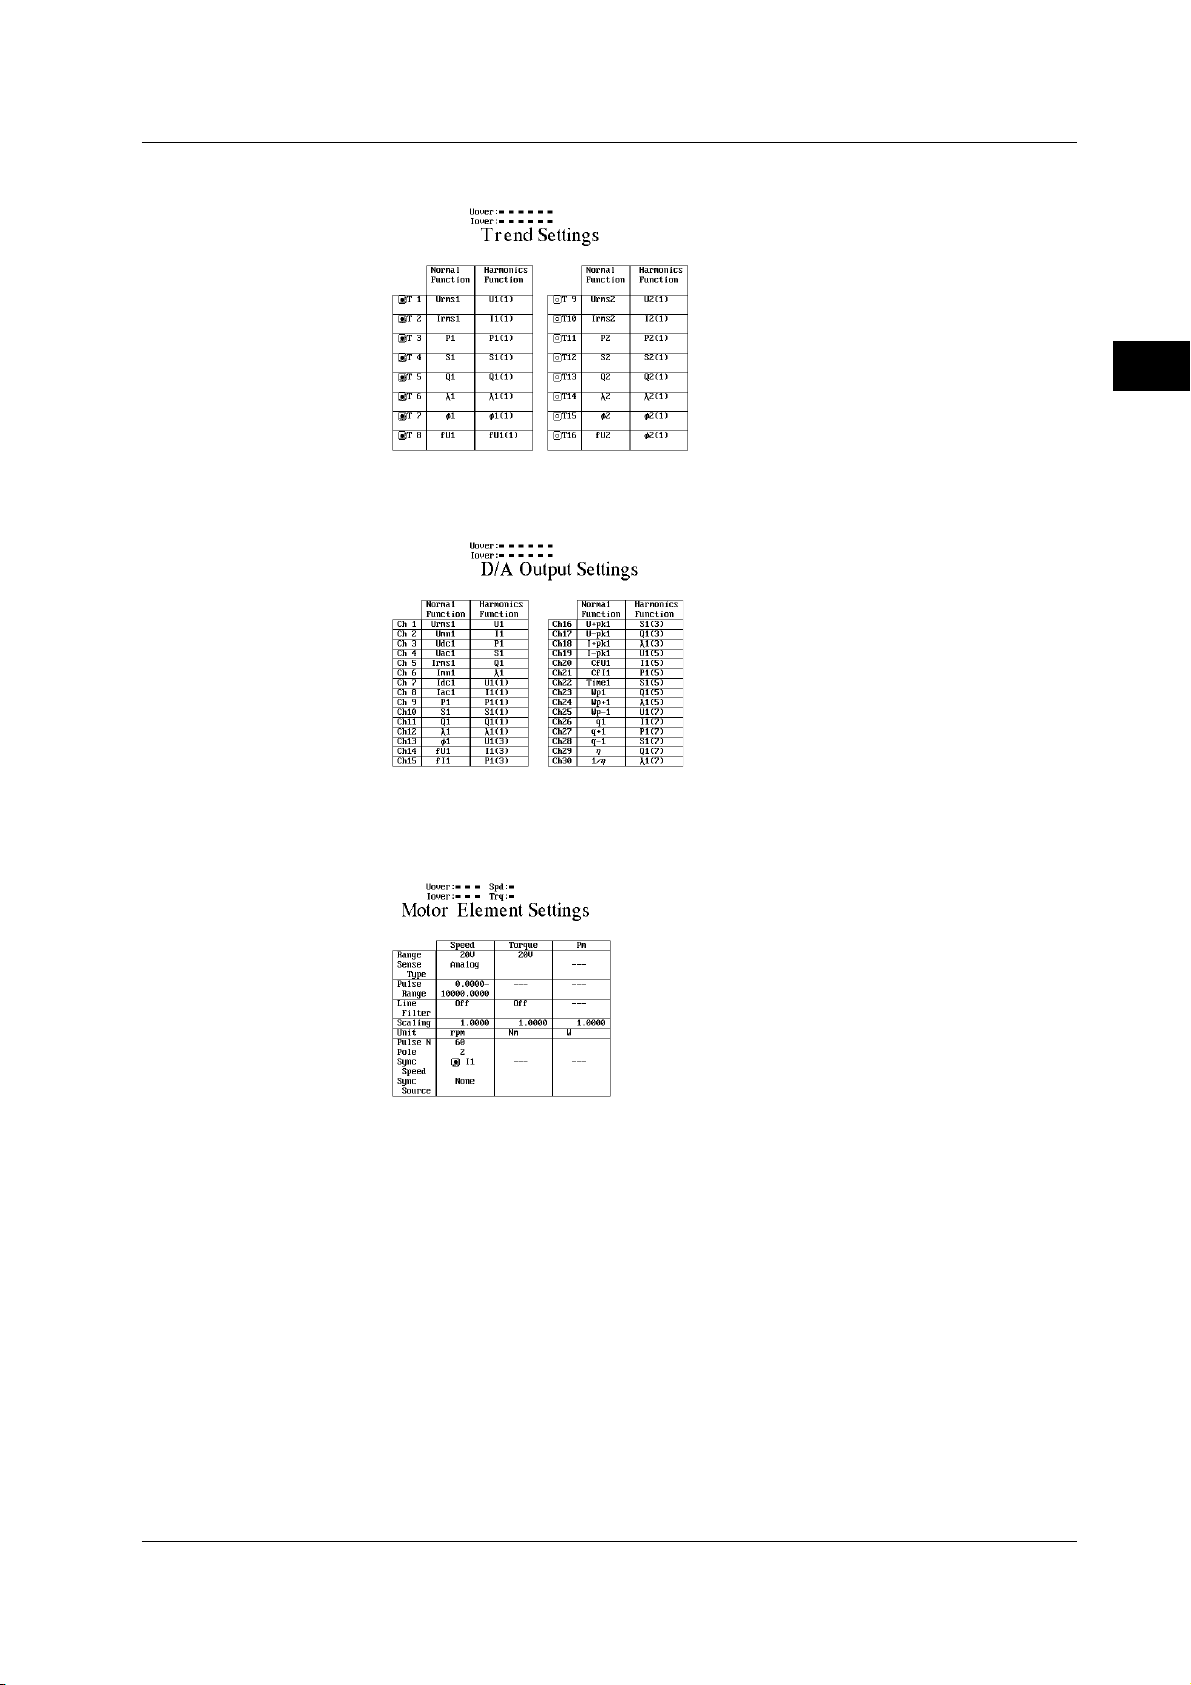
4.6 Listing the Setup Parameters
Relation Table of Trend Targets and Measurement Functions
Relation Table of D/A Output Channels and Measurement Functions
Displayed only on products with the D/A output (option).
4
Screen Display Format
Relation Table of the Rotating Speed of Motor Evaluation Function (Option) and
Input Ranges of Torque
Displayed only to products with the motor evaluation function (option).
IM 760101-01E
4-19
 Loading...