

Page 1

User’s
Manual
Models LL100/LL200
Multi-monitoring Function
User ’s Manual
IM 05G01B12-02E
IM 05G01B12-02E
1st Edition
Page 2

Page 3

<Toc> <Ind> <Rev> <Introduction>
Introduction
This Multi-monitoring function of the LL100 PC-based Parameters Setting Tool and the
LL200 PC-based Custom Computation Building Tool is a software package used to monitor
data of two or more GREEN Series controllers.
This user’s manual describes how to operate the Multi-monitoring function.
For explanations other than the Multi-monitoring function, see LL100 PC-based Param-
eters Setting Tool or LL200 PC-based Custom Computation Building Tool User’s Manual of
GREEN Series User’s Manual (Reference) (CD-ROM).
The LL100 PC-based Parameters Setting Tool and the LL200 PC-based Custom Computation Building Tool can be used with Windows 98/2000/XP or Windows NT4.0 (Service Pack
3 or later). For how to use a personal computer and Windows, refer to each user’s manual.
■ Controllers Covered by LL100 and LL200
For information about the GREEN Series controllers covered by LL100 and LL200, see the
user’s manual of each controller or GREEN Series User’s Manual (Reference) (CD-ROM).
■ Intended Readers
i
This manual is intended for people familiar with the functions of the GREEN Series controllers and capable of working with Windows 98/2000/XP or Windows NT 4.0 (Service Pack 3
or later), such as control engineers and personnel in charge of the maintenance of instrumentation and control equipment.
-
■T rademarks
Windows 98/2000/XP and Windows NT 4.0 are registered trademarks of Microsoft Corporation in the United States.
“Ethernet” is registered trademark of XEROX Corporation in the United States.
Media No. IM 05G01B12-02E 1st Edition : Nov. 2004 (YK)
All Rights Reserved Copyright © 2004, Y okogawa Electric Corporation
IM 05G01B12-02E 1st Edition : 2004.11.05-00
Page 4

<T oc> <Ind> <Rev> <Introduction>
Visual Inspection and Check of Accessories
Visually inspect the product upon delivery to make sure it is not damaged in any way . Store
the box and inner packing material of the package in a safe place - they may be needed if
there is a problem with the product and it needs to be sent back for repair.
■ Check of Model and Suffix Codes
Refer to the following table to make sure the model and suffix codes of the tool are as were
specified with your order.
ii
Model code
LL100 PC-based Parameters Setting Tool for GREEN Series controllers
Model code
LL200 PC-based Custom Computation Building Tool for GREEN Series controllers
Suffix code
-E10 Model for use with IBM PC/AT-compatible personal computer (English version)
Suffix code
-E10 Model for use with IBM PC/AT-compatible personal computer (English version)
■ Confirmation of the Package Contents
Make sure the delivered package contains all of the following items. If any item is missing
or found to be damaged, immediately contact the sales office or dealership from which you
purchased the product.
(1) 3.5-inch floppy disks (4 disks)
(2) Dedicated adapter, supplied with two AAA-size batteries (one unit)
(3) Dedicated cable (one cable)
(4) GREEN Series User’s Manual (Reference) (CD-ROM version)
(5) User’s manual for Multi-monitoring Function (This manual)
Description
Description
IM 05G01B12-02E 1st Edition : 2004.11.05-00
Page 5

<Toc> <Ind> <Rev> <Introduction>
Documentation Conventions
■ Symbols
WARNING
Indicates that operating the hardware or software in this manner may damage it or lead to
system failure.
NOTE
Draws attention to information that is essential for understanding the operation and/or
features of the product.
TIP
Gives additional information to complement the present topic.
See Also
iii
Gives reference locations for further information on the topic.
■ Description of Displays
(1) Some of the representations of product displays shown in this manual may be exag-
gerated, simplified, or partially omitted for reasons of convenience when explaining
them.
(2) Figures and illustrations representing the controller’s displays may differ from the real
displays in regard to the position and/or indicated characters (upper-case or lowercase, for example), to the extent that they do not impair a correct understanding of the
functions and the proper operation and monitoring of the system.
IM 05G01B12-02E 1st Edition : 2004.11.05-00
Page 6

<T oc> <Ind> <Rev> <Introduction>
Notices
■ Regarding This User’s Manual
(1) This manual should be passed on to the end user. Keep at least one extra copy of the
manual in a safe place.
(2) Read this manual carefully to gain a thorough understanding of how to operate this
product before you start using it.
(3) This manual is intended to describe the functions of this product. Yokogawa Electric
Corporation (hereinafter simply referred to as Yokogawa) does not guarantee that
these functions are suited to the particular purpose of the user.
(4) Under absolutely no circumstance may the contents of this manual, in part or in whole,
be transcribed or copied without permission.
(5) The contents of this manual are subject to change without prior notice.
(6) Every effort has been made to ensure accuracy in the preparation of this manual.
Should any errors or omissions come to your attention, however, please contact your
nearest Yokogawa representative or our sales office.
iv
■ Regarding Protection, Safety , and Prohibition Against Unauthorized
Modification
(1) In order to protect the product and the system controlled by it against damage and
ensure its safe use, make certain that all of the instructions and precautions relating to
safety contained in this document are strictly adhered to. Yokogawa does not guaran-
tee safety if products are not handled according to these instructions.
(2) Modification of the product is strictly prohibited.
(3) Reverse engineering such as the disassembly or decompilation of software is strictly
prohibited.
■ Force Majeure
(1) Y okogawa assumes no liability to any party for any loss or damage, direct or indirect,
caused by the use or any unpredictable defect of the product.
(2) No portion of the software supplied by Yokogawa may be transferred, exchanged,
leased or sublet for use by any third party without the prior permission of Yokogawa.
(3) Be sure to use the spare parts approved by Yokogawa when replacing parts or
consumables.
(4) Use this software with one specified computer only . You must purchase another copy
of the software for use on each additional computer.
(5) Copying this software for purposes other than backup is strictly prohibited.
(6) Store the floppy disk(s) (original medium or media) containing this software in a
secure place.
IM 05G01B12-02E 1st Edition : 2004.11.05-00
Page 7

<Int> <Ind> <Rev>
Models LL100/LL200
Multi-monitoring Function
User’s Manual
CONTENTS
Introduction........................................................................................................... i
Visual Inspection and Check of Accessories ......................................................ii
Documentation Conventions ..............................................................................iii
Notices .................................................................................................................iv
1. Overview ................................................................................................. 1-1
2. Starting and Quitting the Multi-monitor T ool......................................... 2-1
2.1 Starting the Multi-monitor T ool ...................................................................... 2-1
2.2 Quitting the Multi-monitor T ool ...................................................................... 2-2
Toc-i
IM 05G01B12-02E 1st Edition
3. Work Flow of Multi-monitoring Function............................................... 3-1
4. Setting the Multi-monitoring Function................................................... 4-1
4.1 Automatic Scan............................................................................................... 4-1
4.2 Setting Trend Display ..................................................................................... 4-9
4.2.1 Setting Scale ...................................................................................4-11
4.2.2 Setting Data.....................................................................................4-1 1
5. Operating the Multi-monitoring Function .............................................. 5-1
5.1 Multi-monitor Display ..................................................................................... 5-1
5.2 Starting and Stopping Trend Display............................................................. 5-2
5.3 Saving T rend Data........................................................................................... 5-4
5.4 Setting Trend Display Cycle........................................................................... 5-5
5.5 Operating T rend Display Function................................................................. 5-6
5.5.1 Showing / Hiding Trend Data ............................................................ 5-6
5.5.2 Scrolling Trend Display ..................................................................... 5-7
5.5.3 Changing X-axis Scale ..................................................................... 5-7
5.5.4 Zooming in and Zooming out Trend Display...................................... 5-8
5.6 Panel View......................................................................................................5-11
5.7 Status Display ............................................................................................... 5-13
5.8 Printing Function .......................................................................................... 5-14
6. Tuning ..................................................................................................... 6-1
6.1 Tuning .............................................................................................................. 6-1
6.2 Saving T uning Data......................................................................................... 6-4
IM 05G01B12-02E 1st Edition : 2004.11.05-00
Page 8

<Int> <Ind> <Rev>
7. T rend Data File........................................................................................ 7-1
Revision Information ............................................................................................ i
Toc-ii
7.1 Opening a Trend Data File .............................................................................. 7-1
7.2 Operating T rend Data...................................................................................... 7-2
7.3 Example of Trend Data Saved as a CSV File ................................................. 7-2
IM 05G01B12-02E
1st Edition : 2004.11.05-00
Page 9
<Toc> <Ind> <1. Overview >
1. Overview
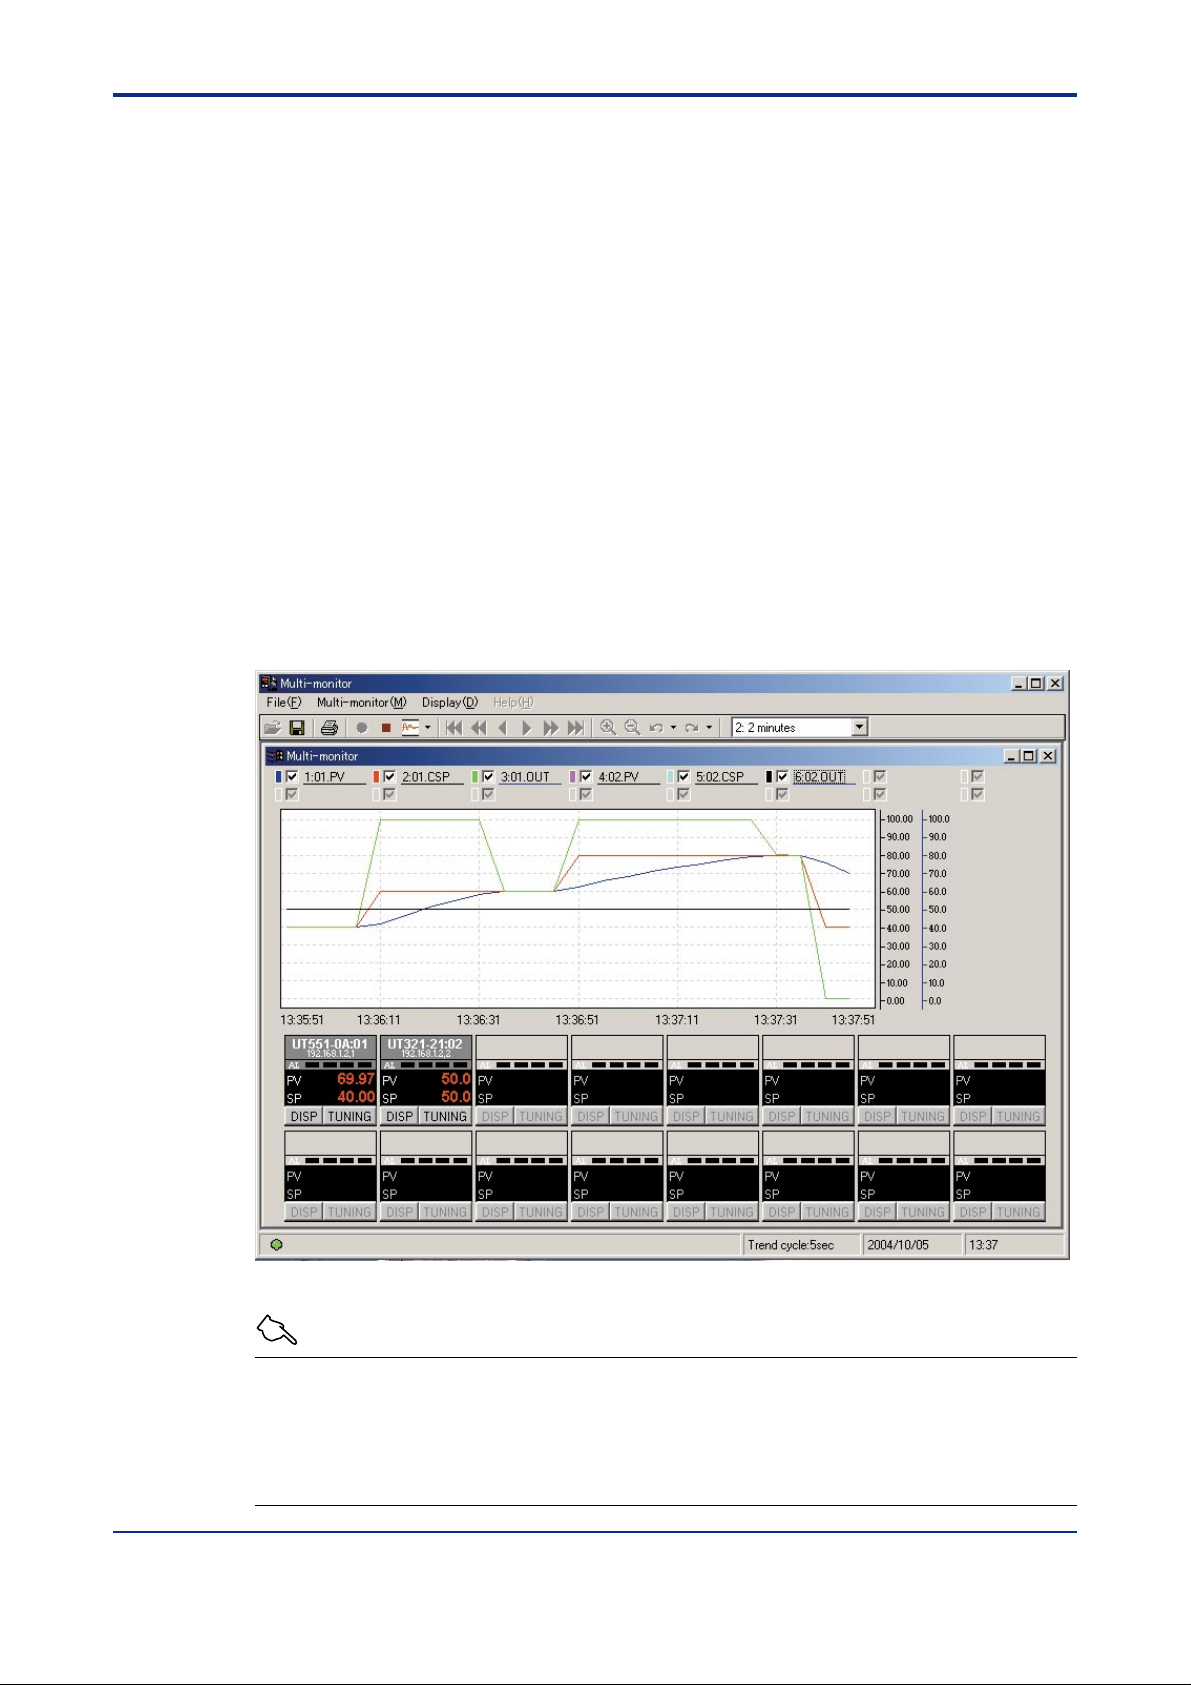
● The Multi-monitoring function allows users to display and collect “measured input
value”, “current setpoint”, “control output” and “alarm generating state” of GREEN
Series controller as trend data. The GREEN Series controllers connected to the
personal computer can be detected automatically by Automatic scan, and the trend
data is displayed on a personal computer screen. The data of a maximum of 16 loops
(*1) can be collected at the same time.
A maximum of 16 trend data can be displayed on a chart screen.
Trend display cycle: 1 to 3600 sec (variable)
Trend display times: 65000 times (fixed regardless of a trend display cycle)
● The Panel view shows measured input value, current setpoint, control output and
alarm generating state of the connected loop.
● The collected trend data can be outputted as a CSV format so that commercial spreadsheet software like Microsoft Excel can treat.
● The saved trend data can be read out and displayed as trend graph.
● T uning can be carried out for every connected loop. Auto-tuning, change of PID param-
eters, change of operation mode and the like can be carried out.
*1: One unit of the following controllers uses two loops: UT750/UP750 cascade control, dual-loop control, temperature and
humidity control and cascade control with two universal inputs, UT550/UT551/UT520/UP550 cascade control.
1-1
Figure 1.1.1 Multi-monitor Display
See Also
LL100 PC-based Parameter Setting Tool or LL200 PC-based Custom Computation Building
Tool User’s Manual of GREEN Series User’s Manual (Reference) (CD-ROM) for information
about operating conditions of personal computer, hardware specification, how to install,
maintenance, troubleshooting and the like.
IM 05G01B12-02E 1st Edition : 2004.11.05-00
Page 10

Blank Page
Page 11
<Toc> <Ind> <2. Starting and Quitting the Multi-monitor T ool >
2. Starting and Quitting the Multi-monitor Tool
This chapter describes how to start and quit the Multi-monitor tool.
2.1 Starting the Multi-monitor T ool
● Operation Procedure
(1) Start Windows.
(2) From the Start menu of Windows, choose Programs, then Green Series, and click
Green Series LL100 or Green Series LL200.
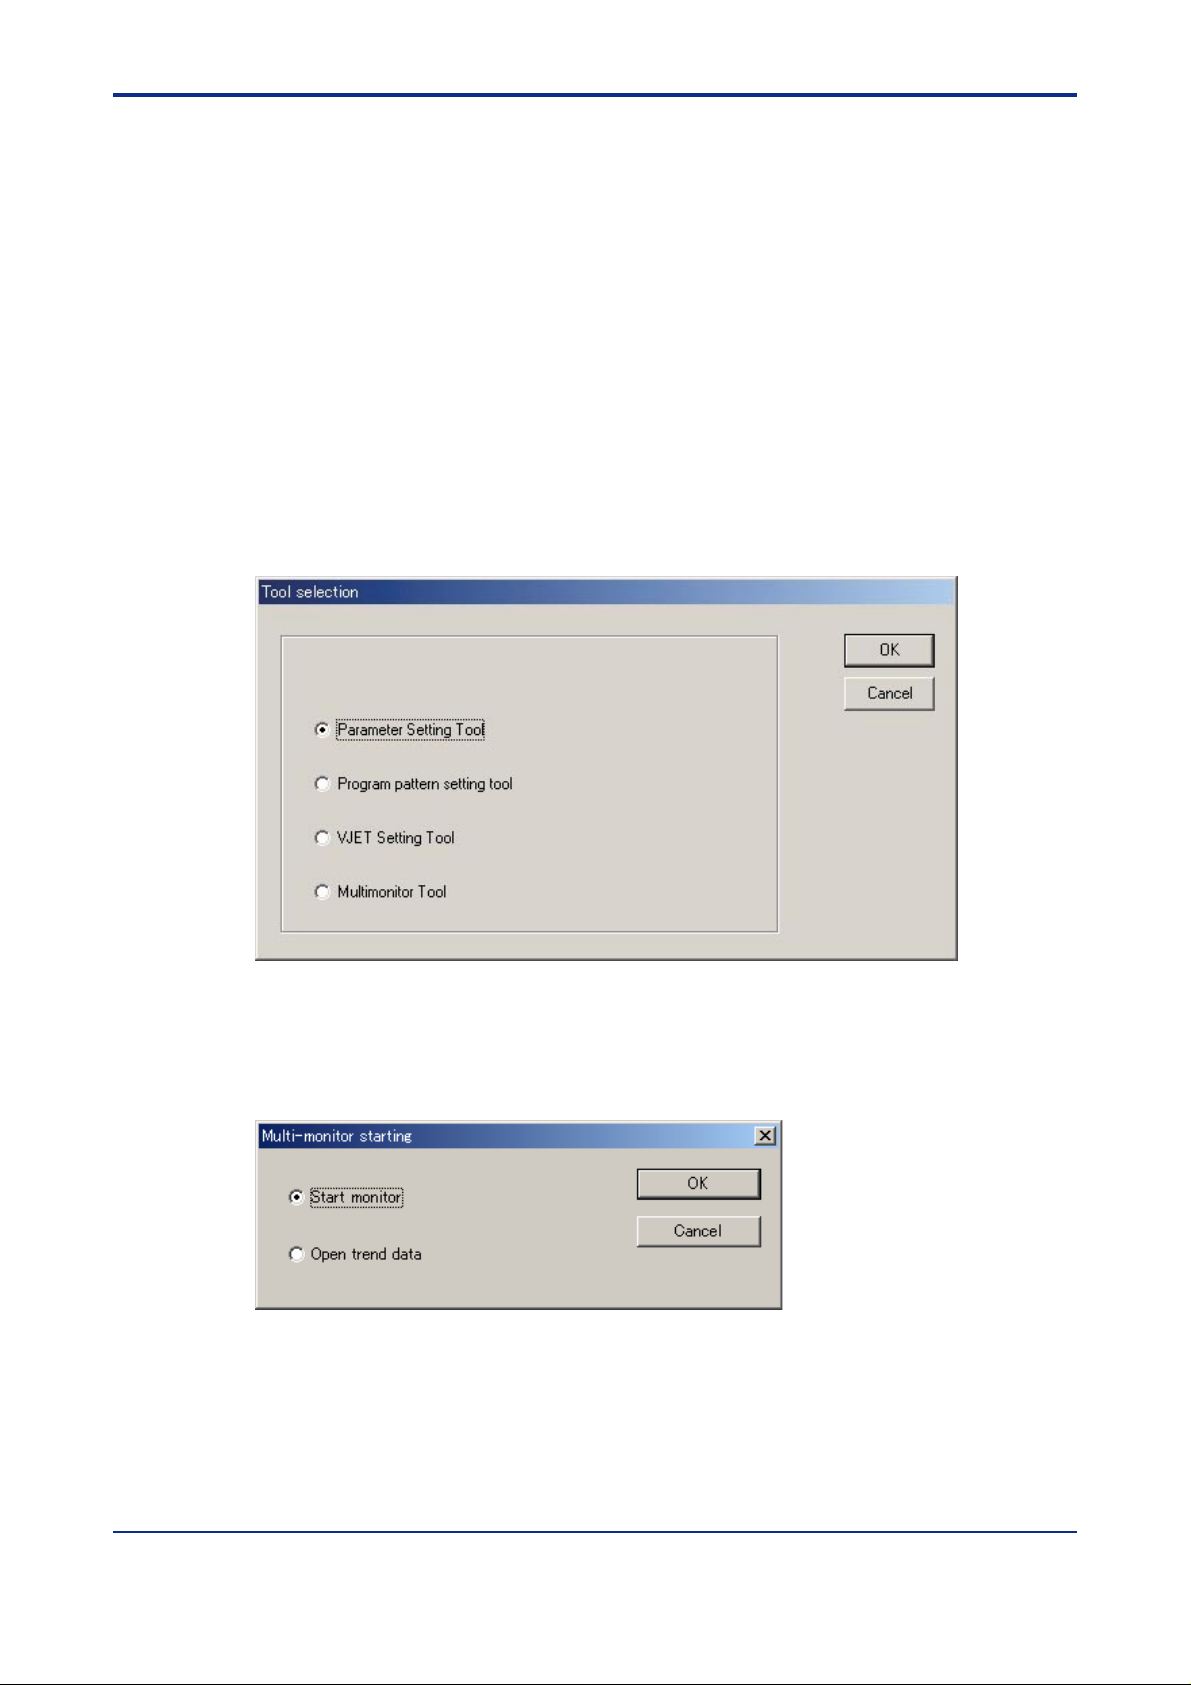
The tool then starts and the Tool Selection dialog box (Figure 2.1.1) appears.
(For LL200, “Custom Computation Building Tool” appears at the top of dialog box.)
2-1
Figure 2.1.1 Tool Selection Dialog Box
(3) Select Multi-monitor Tool.
(4) Click OK.
(5) The Multi-monitor Starting dialog box (Figure 2.1.2) appears.
Figure 2.1.2 Multi-monitor Starting Dialog Box
(6) See Chapter 4, “Setting the Multi-monitoring Function” when Start monitor is se-
lected.
See Chapter 7, “Trend Data File” when Open trend data is selected.
IM 05G01B12-02E 1st Edition : 2004.11.05-00
Page 12
<T oc> <Ind> <2. Starting and Quitting the Multi-monitor Tool >
■ Operation from the Menu Bar
LL100: From the menu bar, choose Parameter setting, then Run Multi-monitor tool.
The Automatic Scan dialog box (Figure 4.1.1) appears.
LL200: From the menu bar, choose Custom Computation, then Run Multi-monitor
tool. The Automatic Scan dialog box (Figure 4.1.1) appears.
2.2 Quitting the Multi-monitor T ool
● Operation Procedure
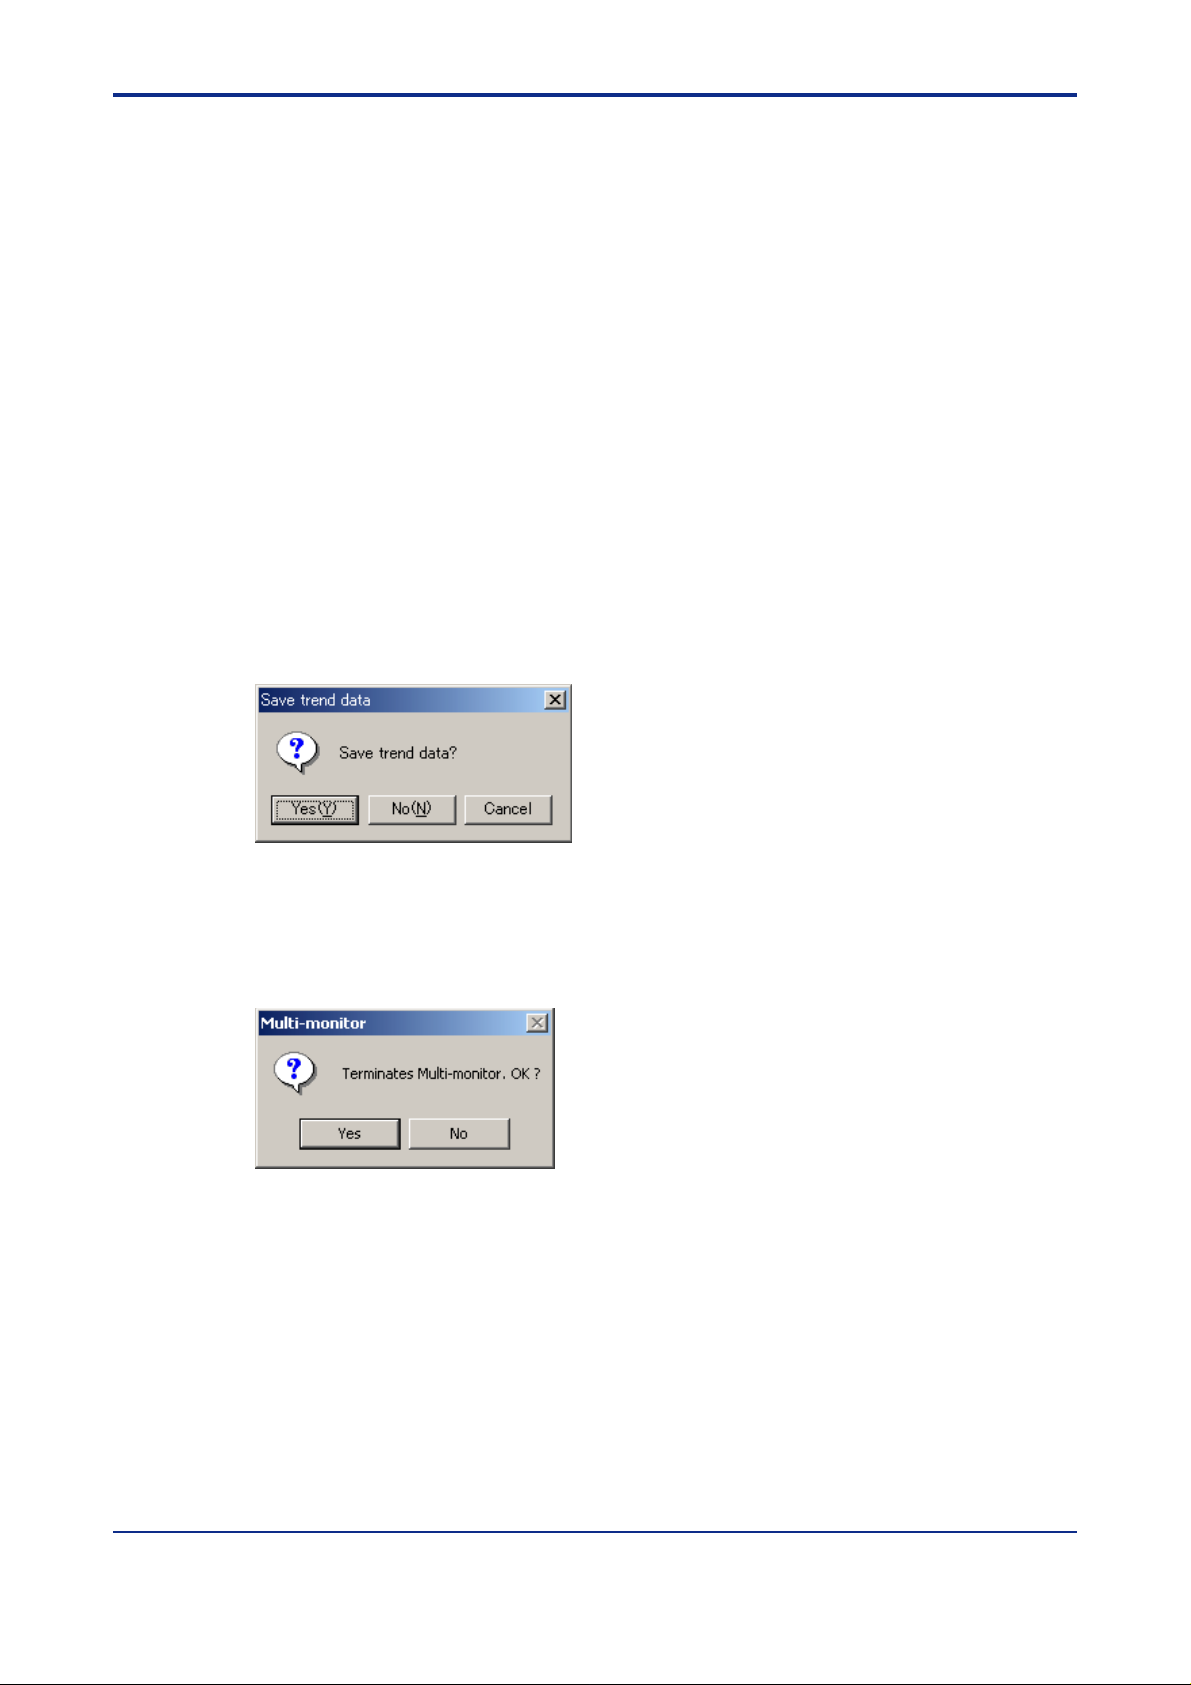
(1) From the menu bar, choose File, then Exit.
(2) The following message box (Figure 2.2.1) appears when the tool is under operation.
The following message box (Figure 2.2.2) appears when the tool is not under operation.
• T o quit after saving the current trend data, click YES. See Section 5.3, “Saving T rend
Data.”
• T o quit without saving the trend data, click NO.
• T o cancel quitting, click CANCEL.
2-2
Figure 2.2.1 Save Trend Data Confirming Message Box
(3) The message box (Figure 2.2.2) appears for confirmation.
• T o quit, click YES.
• T o cancel quitting, click NO.
Figure 2.2.2 Close Message Box
IM 05G01B12-02E 1st Edition : 2004.11.05-00
Page 13
<Toc> <Ind> <3. Work Flow of Multi-monitoring Function >
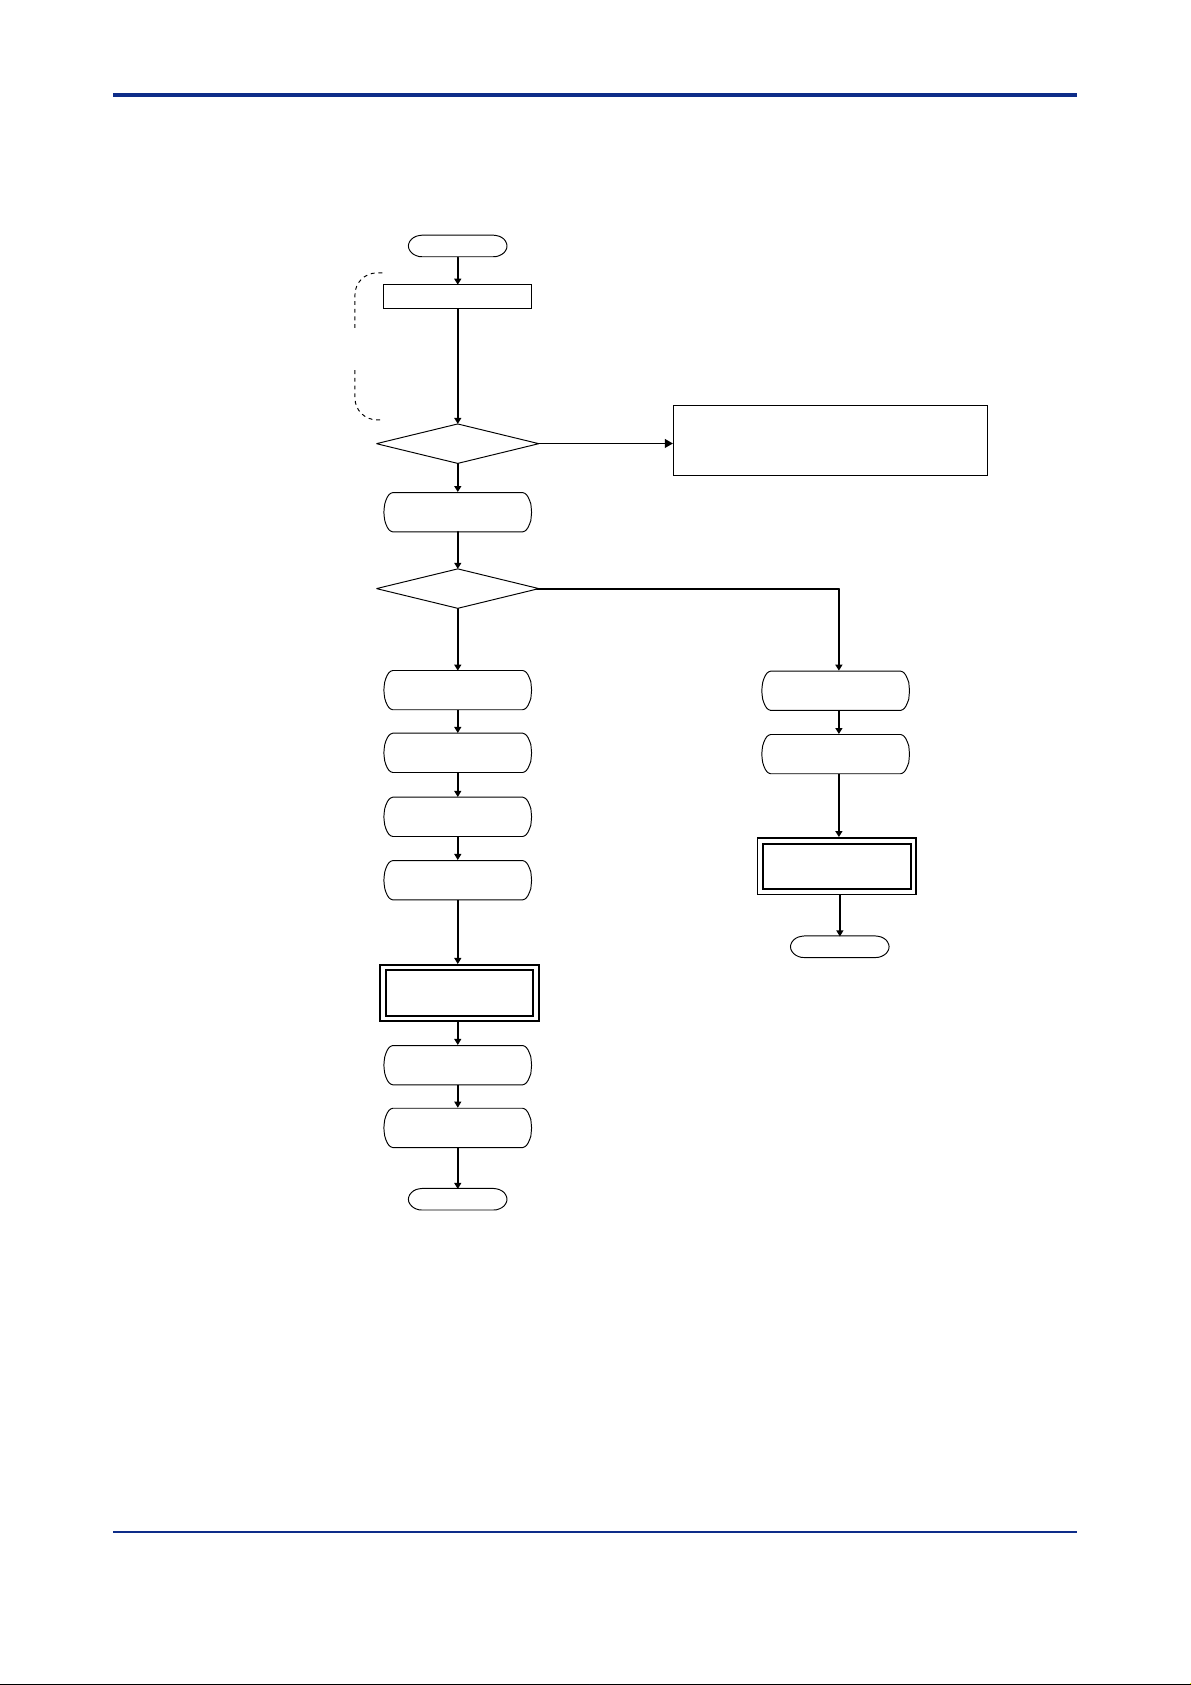
3. Work Flow of Multi-monitoring Function
This chapter describes the work flow of Multi-monitoring function.
Start
Start LL100/LL200 tool
See GREEN Series User’s
Manual (Reference) (CD-ROM)
See GREEN Series User’s Manual (Reference) (CD-ROM).
See LL100 PC-based Parameter
Setting Tool, LL200 PC-based
Custom Computation Building
Tool or Ethernet Communication
Functions User’s Manual of
GREEN Series User’s Manual
(Reference) (CD-ROM) for
information about connection to
the controller.
Scan the controller
automatically and
monitor data (on-line
monitor)
Tool selection
Start Multi-monitor tool
Monitor selection
Start monitor
(2.1 Starting the Multi-monitor Tool)
Read out data file from a PC and
monitor data (off-line monitor)
(2.1 Starting the Multi-monitor Tool) (7.1 Opening a Trend Data File
- Parameter Setting Tool
- Program Pattern Setting Tool
- VJET Setting Tool
- Custom Computation Building Tool (for LL200 only)
Open Trend Data
3-1
Automatic scan
Set trend
Start trend
Multi-monitor
(on-line)
Tuning
Save trend data
End
(4.1 Automatic Scan)
(4.2 Setting Trend Dispaly)
(5.2 Starting and Stopping Trend Display)
(5. Operating Multi-monitoring Function)
(6. Tuning)
(5.3 Saving Trend Data)
Figure 3.0.1 Work Flow of Multi-monitoring Function
Set up Trend
Multi-monitor
(off-line)
End
(7.2 Operating Trend Data)
IM 05G01B12-02E
1st Edition : 2004.11.05-00
Page 14

Blank Page
Page 15
<Toc> <Ind> < 4. Setting the Multi-monitoring Function >
4. Setting the Multi-monitoring Function
This chapter describes how to set the Multi-monitoring function.
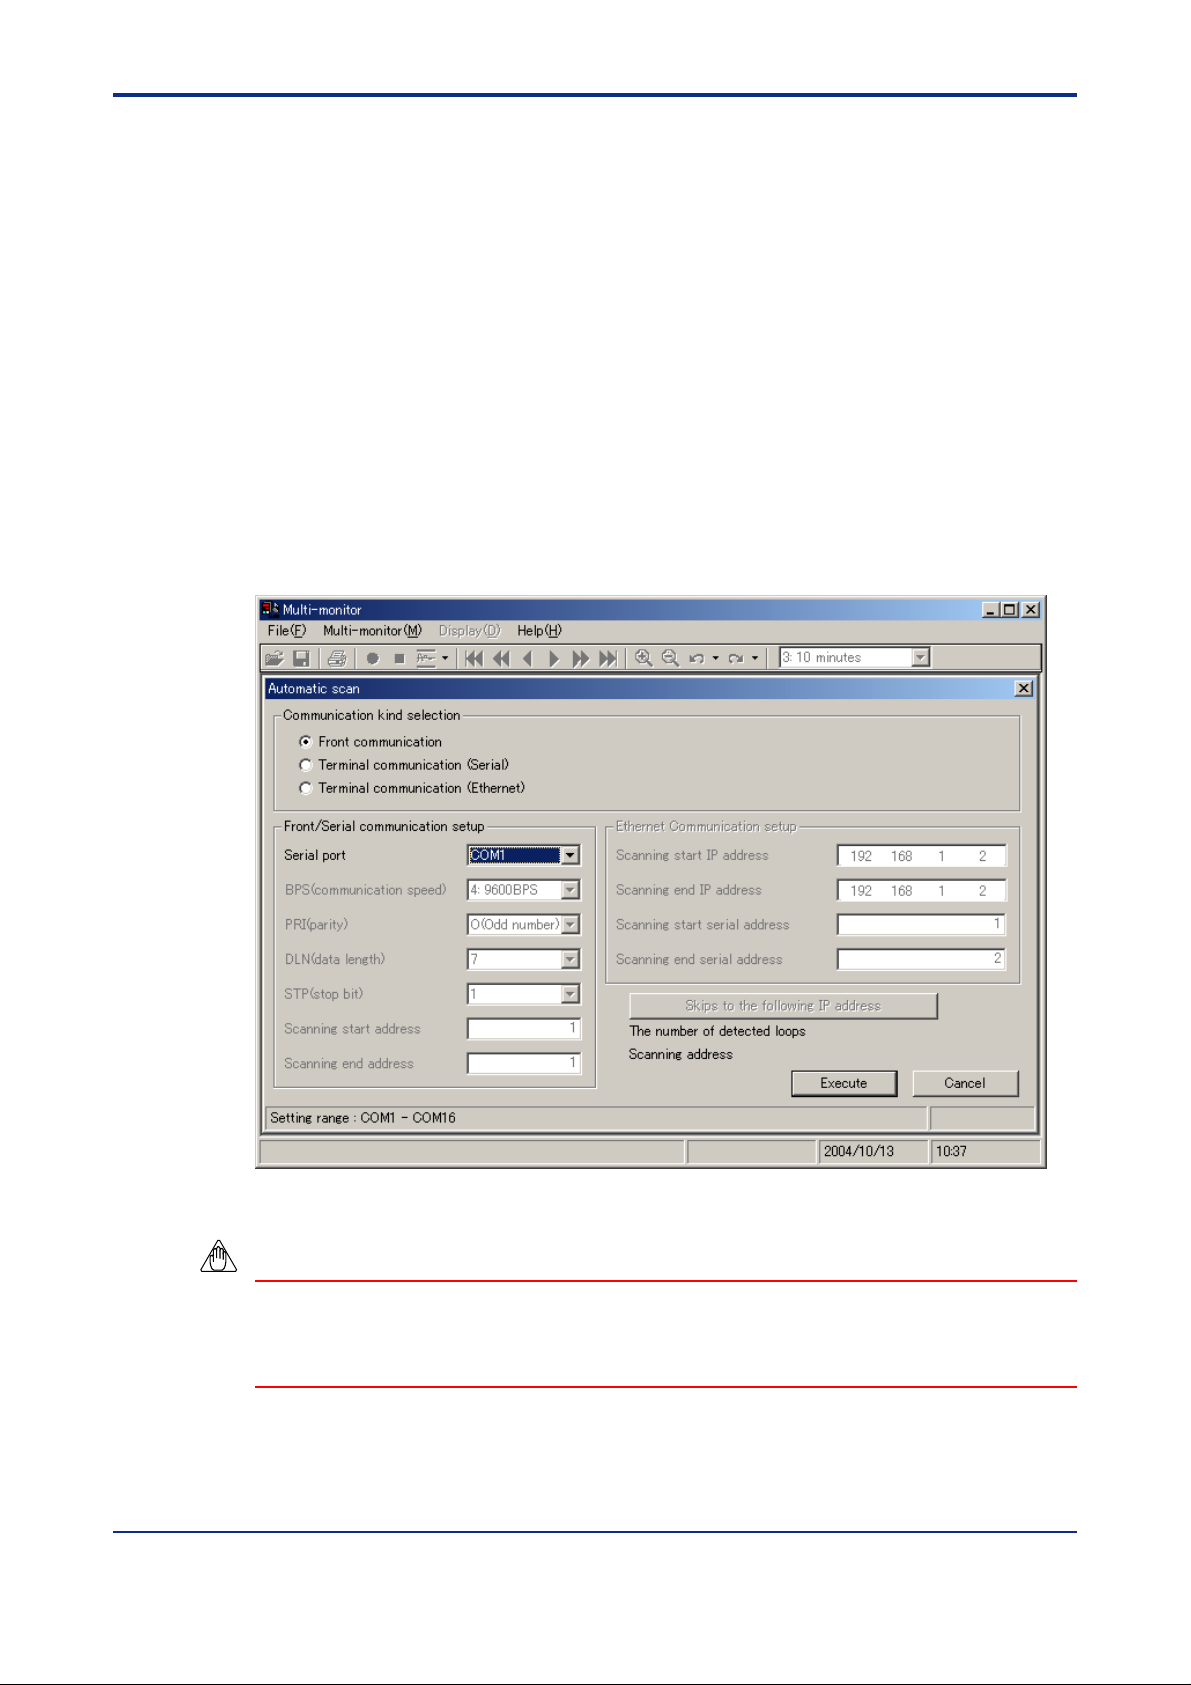
4.1 Automatic Scan
This function allows to detect the GREEN Series controllers connected to the personal
computer automatically .
After you choose Start Monitor in the Multi-monitor Starting dialog box (Figure 2.1.2), the
Automatic Scan dialog box (Figure 4.1.1) appears.
The following three ways can be used for communication.
• Front communication (Optical communication adapter)
• Terminal communication (Serial communication)
• Terminal communication (Ethernet communication)
4-1
Figure 4.1.1 Automatic Scan Dialog Box
NOTE
Front communication (Optical communication adapter), Terminal communication (Serial
communication) and Terminal communication (Ethernet communication) cannot be used
for communication (monitoring) at the same time.
IM 05G01B12-02E
1st Edition : 2004.11.05-00
Page 16
<T oc> <Ind> < 4. Setting the Multi-monitoring Function >
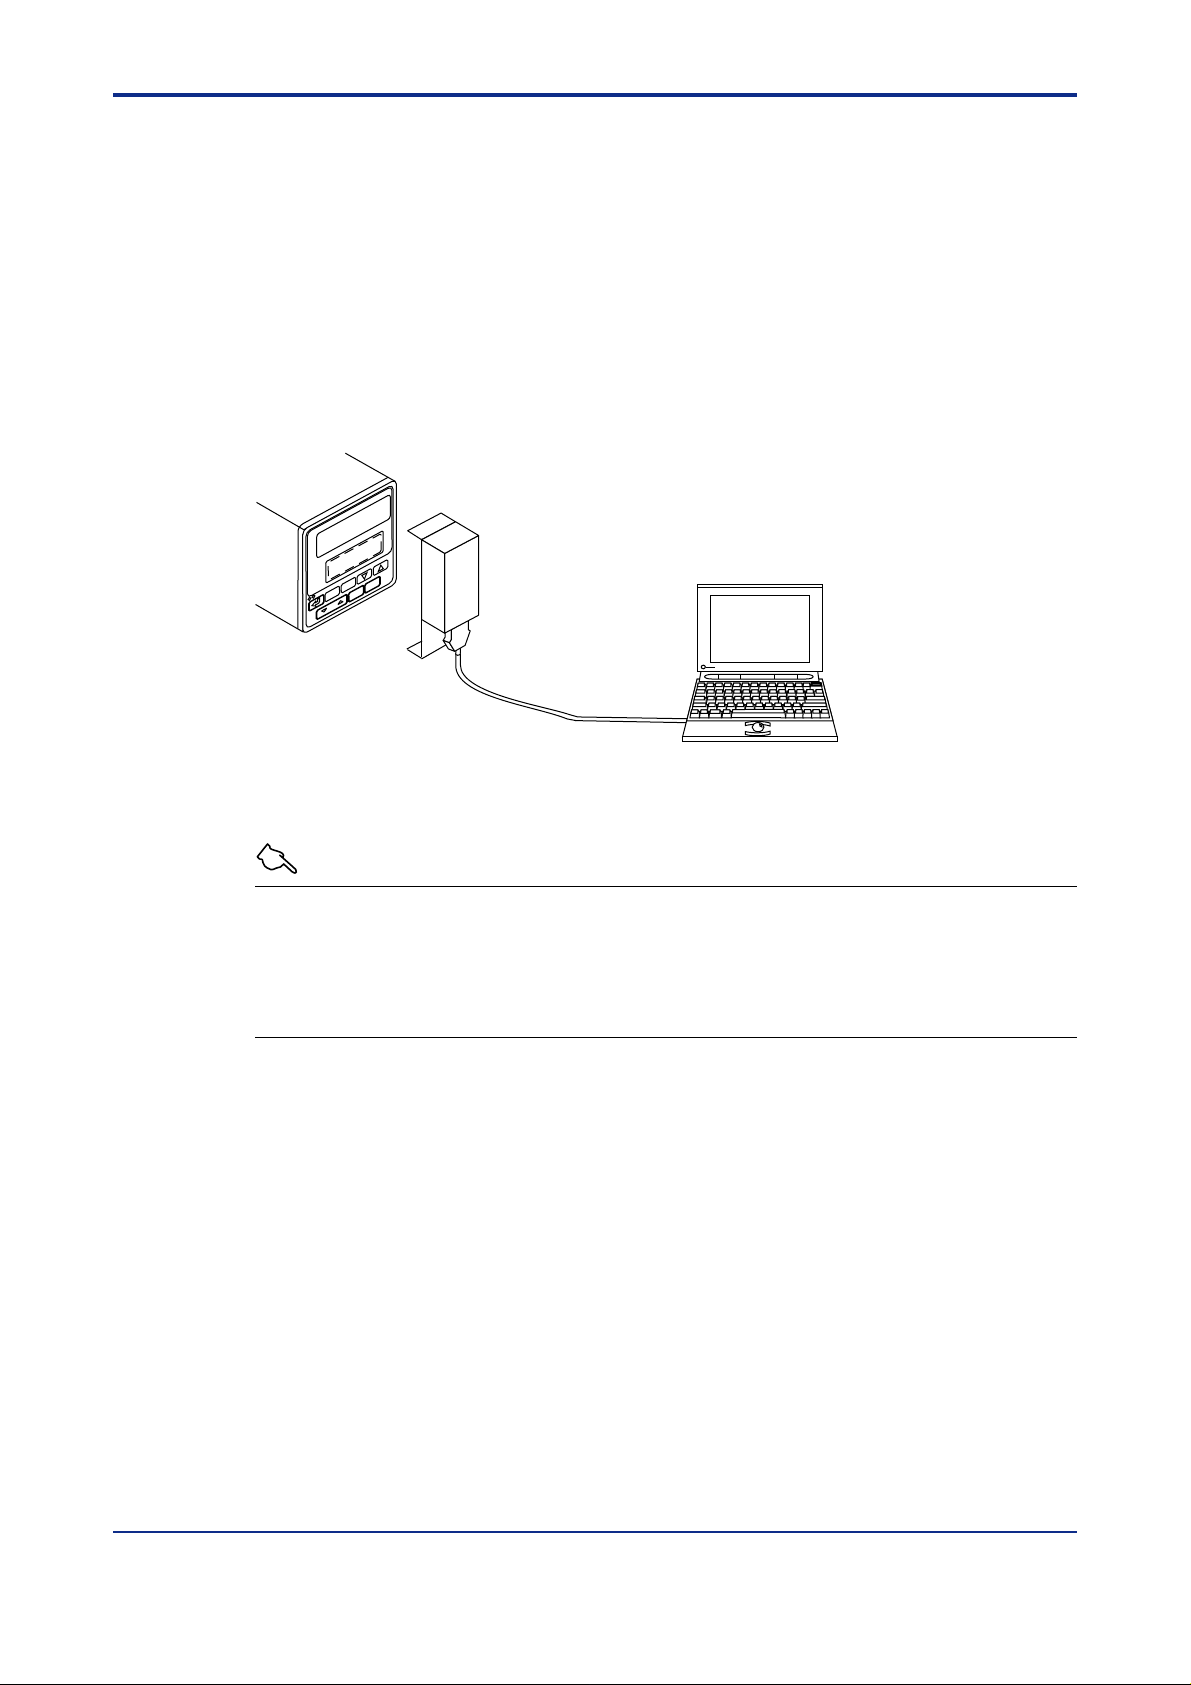
■ T o Monitor via Supplied Optical Communication Adapter
● Operation Procedure
(1) Click Front communication.
(2) From the Serial port list, select the communication port of the personal computer from
COM1 to COM16.
(3) Connect the controller to the personal computer, and then click Execute.
(4) The T rend Setup dialog box (Figure 4.2.1) appears after Automatic scan is completed.
● Connection
Optical communication adapter
(Light loader adapter)
4-2
Controller
Personal computer
Figure 4.1.2 Connection via Optical Communication Adapter (Light Loader Adapter)
See Also
Section 2.3, “Connecting Controller to Personal Computer” of LL100 PC-based Parameter
Setting Tool or LL200 PC-based Custom Computation Building T ool User’s Manual of
GREEN Series User’s Manual (Reference) (CD-ROM) for details how to connect the optical
communication adapter.
IM 05G01B12-02E
1st Edition : 2004.11.05-00
Page 17
<Toc> <Ind> < 4. Setting the Multi-monitoring Function >
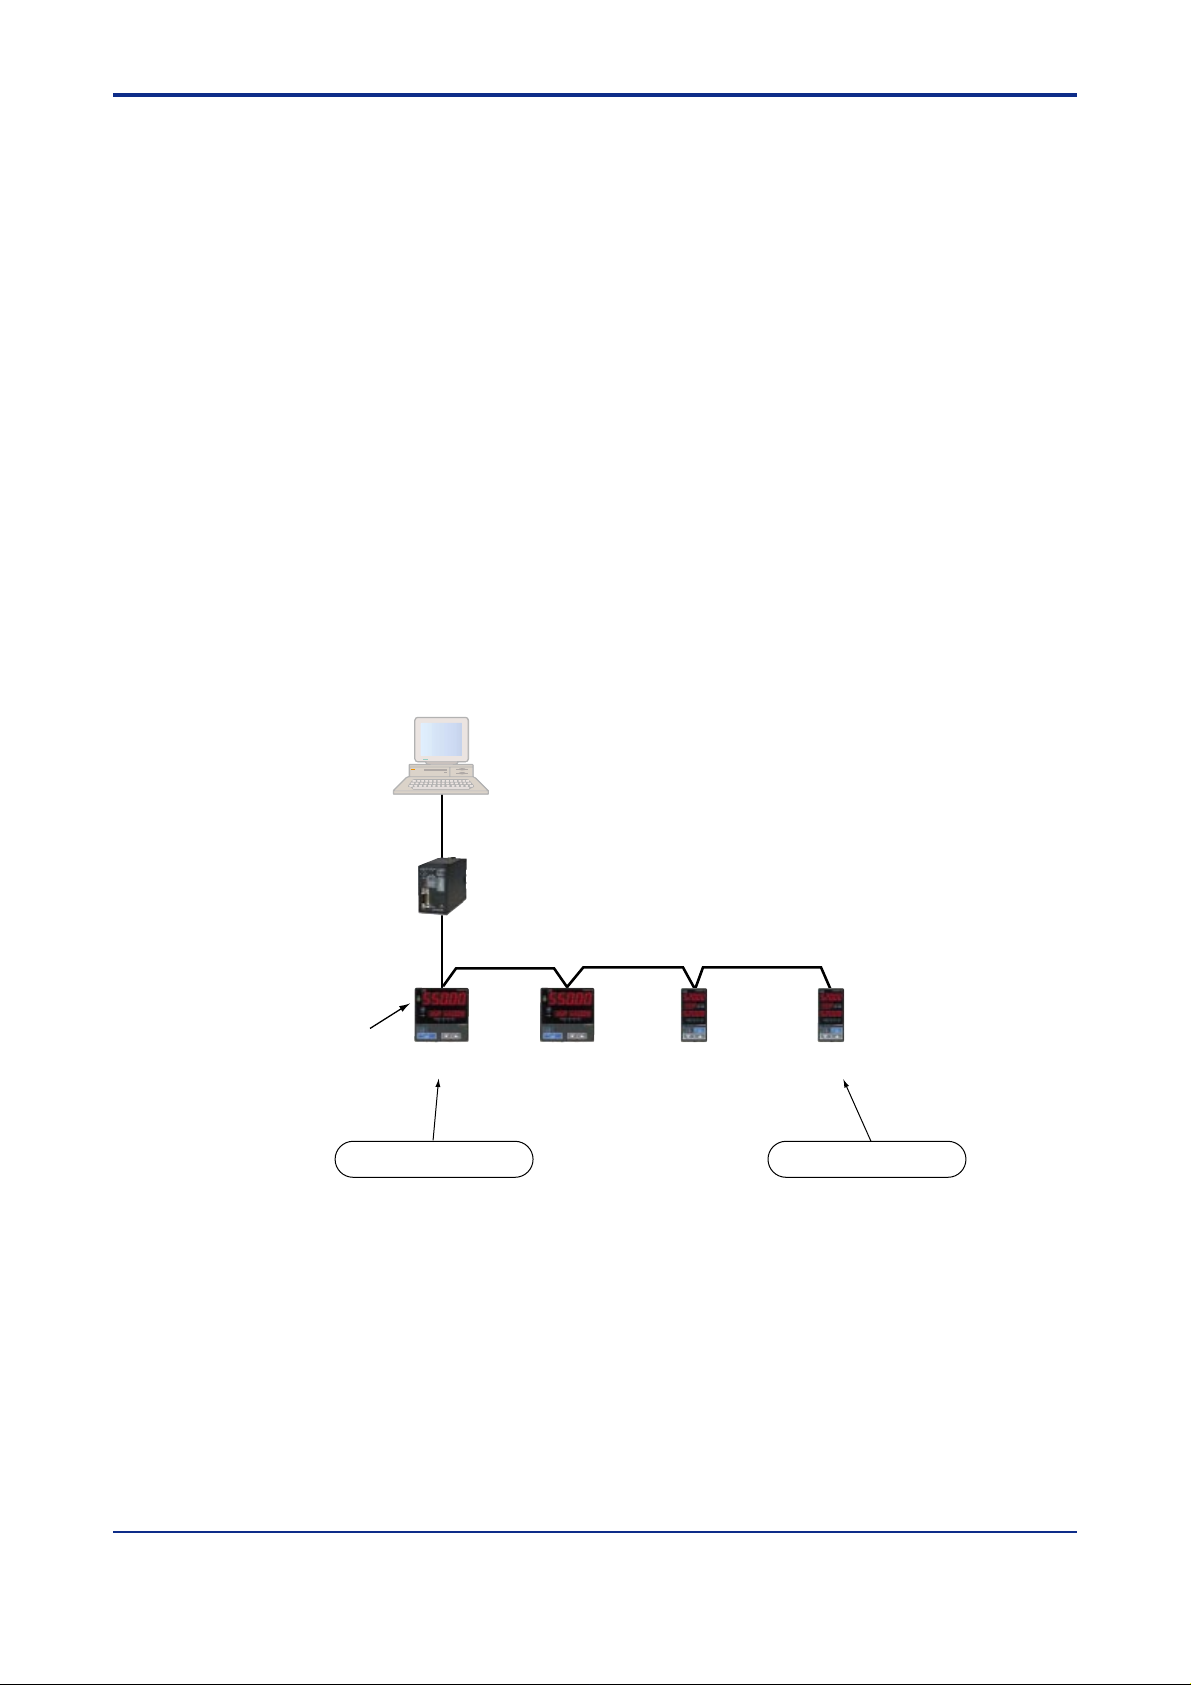
■ T o Monitor via Serial Communication Terminals
● Operation Procedure
(1) Click T erminal communication (Serial).
(2) From the Serial port list, select the communication port of the personal computer from
COM1 to COM16.
(3) Set the RS485 communication parameters.
Select communication speed, parity , data length and stop bit from the drop-down lists.
Make the same RS485 communication settings in the target controller.
(4) Set the Scanning start address and Scanning end address
(5) Connect the controller to the personal computer, and then click Execute.
(6) The Scanning address and the Number of detected loops are displayed during Auto-
matic scan.
(7) When the 16 loops are detected after starting scanning, the scanning to the Scanning
end serial address is completed or Cancel is clicked, Automatic scan stops and the
Trend Setup dialog box (Figure 4.2.1) appears. When interrupted on the way, the
loops already detected by that time can be monitored.
4-3
● Example of Connection
Personal Computer
ML2
RS232C/RS485 converter
RS485
RS485 rear
communication
connection
Figure 4.1.3 Example of Serial Communication Connection
Seiral Address
(ADR) = 1
Scanning start serial address
Seiral Address
(ADR) = 2
Seiral Address
(ADR) = 3
Seiral Address
(ADR) = 4
Scanning end serial address
IM 05G01B12-02E
1st Edition : 2004.11.05-00
Page 18

<T oc> <Ind> < 4. Setting the Multi-monitoring Function >
● Setting Example of Automatic Scan Dialog Box
4-4
Figure 4.1.4 Setting Example of Serial Communication
NOTE
Discontinuous values like 1, 3, and 5 can be set for each controller as serial address.
However, continuous values can shorten time required for Automatic scan.
NOTE
One unit of the following controllers uses two loops:
UT750/UP750 cascade control, dual-loop control, temperature and humidity control and
cascade control with two universal inputs
UT550/UT551/UT520/UP550 cascade control.
If the controller above is connected to the 16th loop for Automatic scan, the 16th loop is
judged that it does not exist, and Automatic scan stops. The detected 15 loops can be
monitored.
IM 05G01B12-02E
1st Edition : 2004.11.05-00
Page 19

<Toc> <Ind> < 4. Setting the Multi-monitoring Function >
NOTE
Communication via serial terminal communication is possible only for GREEN Series
controllers with RS485 communication (optional function). For controllers without RS485
communication, always select Front communication.
To communicate via serial terminal communication, set the target controller’s RS485
communication protocol to PC-link communication. With other protocol, the serial terminal
communication is unavailable. In addition, the RS485 communication parameters (communication speed, parity , stop bit and data length) of both the target controller and the personal computer must be the same.
For the 300 series of old GREEN Series, communication via serial terminal communication
is possible only for the controllers with the communication function.
For the 300 series of GREEN Series, select Front communication or Serial terminal communication using the LL operating parameter . To select Serial terminal communication, set
the LL parameter to OFF.
See Also
4-5
Chapter 2, “Setup” of GREEN Series Communication Functions (IM 05G01B02-01E) of
GREEN Series User’s Manual (Reference) (CD-ROM) for information about connection for
terminal communication.
IM 05G01B12-02E
1st Edition : 2004.11.05-00
Page 20

<T oc> <Ind> < 4. Setting the Multi-monitoring Function >
■ T o Monitor via Ethernet Terminal Communication
● Operation Procedure
(1) Click T erminal communication (Ethernet).
(2) Set the target controller’s IP address (Scanning start IP address and Scanning end IP
address), and RS485 communication address (Scanning start serial address and
Scanning end serial address) in the text box.
(3) Connect the controller to the personal computer, and then click Execute.
(4) The Scanning address and the Number of detected loops are displayed during Auto-
matic scan.
(5) Automatic scan starts at the Scanning start serial address of the Scanning start IP
address. After scanning the Scanning end serial address, the scanning of the next IP
address is started. Clicking Skips to the following IP address during scanning
transfers to the next IP address regardless of the serial address at that time.
(6) When the 16 loops are detected after starting scanning, the scanning to the Scanning
end serial address is completed or Cancel is clicked, Automatic scan stops and the
Trend Setup dialog box (Figure 4.2.1) appears. When interrupted on the way, the
loops already detected by that time can be monitored.
4-6
NOTE
Consult your network administrator on routing settings.
● Example of Connection
Personal Computer
Ethernet
IP Address=192.168.1.1
Serial Address (ADR)=1
IP Address=192.168.1.2
Serial Address (ADR)=1
10BASE-T Cable
IP Address=192.168.1.3
Serial Address (ADR)=1
Scanning start IP address
Scanning start serial address
Figure 4.1.5 Example of Ethernet Communication Connection
Scanning end IP address
Scanning end serial address
IM 05G01B12-02E
1st Edition : 2004.11.05-00
Page 21

<Toc> <Ind> < 4. Setting the Multi-monitoring Function >
● Setting Example of Automatic Scan Dialog Box
4-7
Figure 4.1.6 Setting Example of Ethernet Communication
● Example of Connection when Gateway Function is Used
Personal Computer
UT551
RS485
Serial Address
(ADR) = 2
Ethernet
IP Address=192.168.1.1
Serial Address (ADR)=1
10BASE-T Cable
RS485 rear
terminal
communication
connection
VJET
IP Address=192.168.1.2
Serial Address
(ADR) = 1
RS485
Serial Address
(ADR) = 2
Serial Address
(ADR) = 3
Scanning start serial address:
The minimum serial address of the connected controllers.
In the example above, Serial address (ADR) = 1 connected to the VJET is the Scanning
start serial address.
Scanning end serial address:
The maximum serial address of the connected controllers.
In the example above, Serial address (ADR) = 3 connected to the VJET is the Scanning
end serial address.
Figure 4.1.7 Example of Ethernet Communication (Gateway Function) Connection
IM 05G01B12-02E
1st Edition : 2004.11.05-00
Page 22

<T oc> <Ind> < 4. Setting the Multi-monitoring Function >
● Setting Example of Automatic Scan Dialog Box
4-8
Figure 4.1.8 Setting Example of Ethernet Communication (Gateway Function)
NOTE
Set the minimum serial address of all serial instruments as the Scanning start serial address.
Set the maximum serial address of all serial instruments as the Scanning end serial address.
NOTE
One unit of the following controllers uses two loops:
UT750/UP750 cascade control, dual-loop control, temperature and humidity control and
cascade control with two universal inputs
UT550/UT551/UT520/UP550 cascade control.
If the controller above is connected to the 16th loop for Automatic scan, the 16th loop is
judged that it does not exist, and Automatic scan stops. The detected 15 loops can be
monitored.
See Also
Chapter 2, “Setup” of Ethernet Communication Functions (IM 05G01B52-01E) of GREEN Series User’s
Manual (Reference) (CD-ROM) for information about connection for terminal communicaiton.
IM 05G01B12-02E
1st Edition : 2004.11.05-00
Page 23

<Toc> <Ind> < 4. Setting the Multi-monitoring Function >
4.2 Setting T rend Display
● Operation Procedure at the time of the Multi-monitor Start
(1) The T rend Setup dialog box (Figure 4.2.1) appears after Automatic scan is completed.
● Operation Procedure on the Menu Bar
(1) From the menu bar, choose Multi-monitor, then Set trend display. The scale of trend
display can be changed by the operation from the menu bar.
NOTE
The Trend Setup dialog box appears when the operation in Section 7.1, “Opening a Trend
Data File” is carried out.
Select the trend data item to be displayed in the Multi-monitor display , scale type and
display color in the Trend Setup dialog box.
The figure below shows the setting example of trend display for measured input value (PV),
current setpoint (CSP) and control output (OUT) of the controller with Serial gateway
function and the controller connected to it.
4-9
The connection for the setting example below is shown on the next page.
Figure 4.2.1 Trend Setup Dialog Box
Double-clicking the Display color displays the Color Setup dialog box (Figure 4.2.2).
IM 05G01B12-02E
1st Edition : 2004.11.05-00
Page 24

<T oc> <Ind> < 4. Setting the Multi-monitoring Function >
Figure 4.2.2 Color Setup Dialog Box
● Example of Connection
4-10
The connection for the setting example of the Trend Setup dialog box (Figure 4.2.1) is
shown below. A maximum of 16 data items can be displayed in the Multi-monitor display. In
this example, the 6 data items of measured input value (PV), current setpoint (CSP) and
control output (OUT) of two controllers are displayed.
Personal Computrer
Ethernet
10BASE-T Cable
UT551
IP Address=192.168.1.1
Serial Address (ADR) = 1
RS485
rear treminal
communication
connection
UT321
Serial Address
(ADR) = 2
Figure 4.2.3 Example of Connection
Loop-1 Controller
Measured input value (PV), Terget setpoint (CSP), Control output (OUT)
Loop-2 Controller
Measured input value (PV), Terget setpoint (CSP), Control output (OUT)
IM 05G01B12-02E
1st Edition : 2004.11.05-00
Page 25

<Toc> <Ind> < 4. Setting the Multi-monitoring Function >
4.2.1 Setting Scale
Set the Y-axis scale of the trend data to be displayed in the Multi-monitor display in the
Scale Setup.
Select either of “PV range of the loop detected automatically”, “0.0% - 100.0%” or “User
scale”. Up to four scale types can be registered.
The maximum value and minimum value can be changed only when the scale type is set to
“User scale.”
The maximum value and minimum value for each scale type are as follows.
Table 4.2.1 Scale Type
Scale type Remarks
PV range
of loop1 to loop16
0 to 100%
User scale
Scale setup becomes effective when OK is clicked in the T rend Setup dialog box.
Minimum value
Lower limit of the PV input
range of the corresponding loop
0
User scale
Upper limit of the PV input
range of the corresponding loop
100
User scale
Maximum value
Upper and lower limits
cannot be changed.
Upper and lower limits
cannot be changed.
Upper and lower limits can
be changed on condition
that lower limit < upper limit.
4-11
4.2.2 Setting Data
Select the trend data item to be displayed in the Multi-monitor display in the Data Setup. A
maximum of 16 data item can be displayed.
The trend data items are measured input value (PV), current setpoint (CSP), (heating-side)
control output (OUT) and cooling-side control output (OUTc) of the loop detected automatically.
Two or more same data items cannot be registered.
Table 4.2.2 Data Setup
Loop Display colorData Scale
Select loops
from loop 1 to
loop 16.
NOTE
Measured input value (PV), current setpoint (CSP), (heating-side) control output (OUT),
cooling-side control output (OUTc) and alarm generating state of all the loops detected
automatically by Automatic scan are collected while the trend display is working.
Select data item from measured
input value (PV), current setpoint
(CSP), (heating-side) control
output (OUT) and cooling-side
control output (OUTc) of the
controller of the corresponding
loop.
Select the type set in the
Scale Setup.
Select the
display color for
each data item.
IM 05G01B12-02E
1st Edition : 2004.11.05-00
Page 26

Blank Page
Page 27

<Toc> <Ind> < 5. Operating the Multi-monitoring Function >
5-1
5. Operating the Multi-monitoring Function
This chapter describes how to operate the Multi-monitoring function.
5.1 Multi-monitor Display
The followings can be carried out in the Multi-monitor display .
● Showing / hiding, scrolling, zooming in and zooming out of trend data
● Start / stop of trend display and saving of trend data
● Display in the Panel view of measured input value (PV), current setpoint (CSP),
(heating-side) control output (OUT), cooling-side control output (OUT c) and
alarm generating state of the connected loop
● Tuning of the controller of connected loop
● Pop-up display of tuning data on a chart
Displays the data items selected in the Data Setup
Chart
Scroll
Showing / hiding of trend data
Zoom in/Zoom out
X-axis scale of chart
Panel view
Figure 5.1.1 Multi-monitor Display while Trend Display is Stopped
Status display bar
Scale type
Scale 1, scale 2, scale 3
and scale 4 from the left
IM 05G01B12-02E
1st Edition : 2004.11.05-00
Page 28

<T oc> <Ind> < 5. Operating the Multi-monitoring Function >
5.2 Starting and Stopping T rend Display
■ Starting T rend Display
● Operation Procedure
(1) From the toolbar, click the [ ] shortcut, or from the menu bar, choose Multi-monitor,
then Start trend display while the trend display is stopped.
(2) Trend display starts.
Shortcut button
5-2
Figure 5.2.1 Multi-monitor Display while Trend Display is W orking
IM 05G01B12-02E
1st Edition : 2004.11.05-00
Page 29

<Toc> <Ind> < 5. Operating the Multi-monitoring Function >
■ Stopping T rend Display
● Operation Procedure
(1) From the toolbar, click the [ ] shortcut, or from the menu bar, choose Multi-monitor,
then choose Stop trend display while the trend display is working.
(2) The following message box (Figure 5.2.2) appears for confirmation.
• T o stop trend display after saving the current trend data, click YES. See Section 5.3,
“Saving Trend Data.”
• T o stop trend display without saving the trend data, click NO.
• T o cancel stopping trend display, click CANCEL.
Figure 5.2.2 Save Trend Data Confirming Message Box
5-3
NOTE
By stopping the trend display , it will be in a trend display stop state. In this manual, the state
where the trend display is not performed and the trend data file is opened is named generically “The trend display is stopped.”
NOTE
If opening a saved trend data file while the trend display is stopped, and then starting the
trend display again, the Automatic Scan dialog box appears. T rend display can be started
after Automatic scan and the setup for trend display are completed.
NOTE
The Multi-monitor tool can hold a maximum of 65000 times of trend data regardless of a
trend cycle. When exceeds 65000 times, trend data is discarded from old data. Periodical
saving of monitored data as a file is recommended. The saved data is the trend data of the
time of data saving. If the trend cycle is 5 seconds (data acquisition per 5 seconds), data
saving of about 90 hours is continuously possible.
IM 05G01B12-02E
1st Edition : 2004.11.05-00
Page 30

<T oc> <Ind> < 5. Operating the Multi-monitoring Function >
5.3 Saving T rend Data
Trend data can be saved while trend display is working or stopped.
Measured input value (PV), current setpoint (CSP), (heating-side) control output (OUT),
cooling-side control output (OUTc), alarm generating state and tuning data (if recorded in
the Tuning display) of all the loops detected automatically can be saved as a CSV file.
● Operation Procedure
(1) From the toolbar, click the [ ] shortcut, or from the menu bar, choose File, and then
Save trend data.
(2) The Save T rend Data dialog box (Figure 5.3.1 or Figure 5.3.2) appears. In the File
name text box, enter a file name then click Save.
5-4
Figure 5.3.1 Save Trend Data Dialog Box while Trend Display is Stopped
Figure 5.3.2 Save Trend Data Dialog Box while Trend Display is Working
NOTE
If stopping the trend display , and then starting it again without saving the current trend data,
the trend data is discarded.
IM 05G01B12-02E
1st Edition : 2004.11.05-00
Page 31

<Toc> <Ind> < 5. Operating the Multi-monitoring Function >
5.4 Setting T rend Display Cycle
Trend display cycle can be changed while trend display is working or stopped.
● Operation Procedure
(1) From the status display bar, double-click T rend cycle, or from the menu bar , choose
Multi-monitor, then Change trend cycle while trend display is working or stopped.
(2) The T rend Cycle dialog box (Figure 5.4.1) appears. The setting range is 1 to 3600 sec.
The initial value is 5 sec.
(3) Change the trend display cycle, and then click OK.
5-5
Communication status lamp
Green: Data acquisition state is good.
Red: Data acquisition state is bad.
Figure 5.4.1 Trend Data Cycle Dialog Box
NOTE
Status display bar
If trend display cycle is shortened, data acquisition may not be completed within the trend
display cycle when many loops are connected. The communication status lamp on the
status display bar becomes red. In this case, set a longer trend display cycle to complete
data acquisition within the trend display cycle.
IM 05G01B12-02E
1st Edition : 2004.11.05-00
Page 32

<T oc> <Ind> < 5. Operating the Multi-monitoring Function >
5.5 Operating T rend Display Function
5.5.1 Showing / Hiding T rend Data
Showing / hiding of trend data to be displayed in the Multi-monitor display can be switched
while trend display is working or stopped.
Checked: Shows trend data
Control output trend of loop 1 is displayed.
5-6
Blank: Hides trend data
Control output trend of loop 1 is not displayed.
Figure 5.5.1 Showing / Hiding of Trend Data
IM 05G01B12-02E
1st Edition : 2004.11.05-00
Page 33

<Toc> <Ind> < 5. Operating the Multi-monitoring Function >
5.5.2 Scrolling T rend Display
The displayed trend data can be scrolled while the trend display is stopped. click the
shortcut button from the toolbar, or operate from the menu bar (Table 5.5.1).
Table 5.5.1 Scroll of Trend Display
Function Name Remarks
Start
Shortcut Button Menu Bar Operation
[Display(D)]-[Move(M)]-[Start]
The left end of a chart is displayed as start data.
5-7
-1/2 scrolling
-1/4 scrolling
1/4 scrolling
1/2 scrolling
Newest
[Display(D)]-[Move(M)]-[-1/2 scrolling]
[Display(D)]-[Move(M)]-[-1/4 scrolling]
[Display(D)]-[Move(M)]-[1/4 scrolling]
[Display(D)]-[Move(M)]-[1/2 scrolling]
[Display(D)]-[Move(M)]-[Newest]
5.5.3 Changing X-axis Scale
The X-axis to be displayed in the Multi-monitor display can be changed while the trend
display is working or stopped. Select from the drop-down list on the toolbar (Figure 5.5.2) or
operate from the menu bar (Table 5.5.2).
On the present X-axis scale, it scrolls 1/2 of
the X-axis scale to the past.
On the present X-axis scale, it scrolls 1/4 of
the X-axis scale to the past.
On the present X-axis scale, it scrolls 1/4 of
the X-axis scale to the future.
On the present X-axis scale, it scrolls 1/2 of
the X-axis scale to the future.
The right end of a chart is displayed as the newest
data.
X-axis scale on a chart
Figure 5.5.2 X-axis Scale
IM 05G01B12-02E
1st Edition : 2004.11.05-00
Page 34

<T oc> <Ind> < 5. Operating the Multi-monitoring Function >
Table 5.5.2 X-axis Scale
Function Name Remarks
1-minute display
2-minute diplay
10-minute diplay
1-hour display
2-hour diplay
12-hour diplay
24-hour diplay
All data display
Automatic
[Display(D)]-[X-axis scale(X)]-[1:1 minute]
[Display(D)]-[X-axis scale(X)]-[2:2 minutes]
[Display(D)]-[X-axis scale(X)]-[3:10 minutes]
[Display(D)]-[X-axis scale(X)]-[4:1 hour]
[Display(D)]-[X-axis scale(X)]-[5:2 hours]
[Display(D)]-[X-axis scale(X)]-[6:12 hours]
[Display(D)]-[X-axis scale(X)]-[7:24 housrs]
[Display(D)]-[X-axis scale(X)]-[8:All data]
None
Menu Bar Operation
The X-axis scale to be displayed on a chart is 1 minute.
The X-axis scale to be displayed on a chart is 2 minutes.
The X-axis scale to be displayed on a chart is 10 minutes.
The X-axis scale to be displayed on a chart is 1 hour.
The X-axis scale to be displayed on a chart is 2 hours.
The X-axis scale to be displayed on a chart is 12 hours.
The X-axis scale to be displayed on a chart is 24 hours.
All data is displayed. The left end of a chart is displayed as
the start time, the right end as the newest time.
Automatic is selected automatically when the scale is changed
by Zoom in or Zoom out. (Cannot be changed)
5.5.4 Zooming in and Zooming out T rend Display
Trend display can be zoomed in or zoomed out while the trend display is stopped.
● T oolbar Shortcut Operation or Menu Bar Operation
Table 5.5.3 Zoom in and Zoom out
Function Name Remarks
Zoom in
Zoom out
Shortcut Button Menu Bar Operation
[Display(D)]-[Zoom(Z)]-[Zoom in(I)]
[Display(D)]-[Zoom(Z)]-[Zoom out(O)]
Trend display is zoomed in by changing
the scale of the X-axis nX% and Y-axis
nY%.
5-8
● Mouse Operation
Mouse operaiton is described in Figure 5.5.3 and Figure 5.5.4.
Table 5.5.4 Zoom in and Zoom out
Function Name
Zoom in
Zoom out
On a chart, move a mouse to the right with the left click of the mouse carried out, and then
cancel the left click.
On a chart, move a mouse to the left with the left click of the mouse carried out, and then
cancel the left click.
Operation
● Operation to Reset Display Scale
To reset the zoomed in or zoomed out display, on the toolbar , choose Display, Zoom, then
Reset. In this case, X-axis is set to 10 minutes. Change it as necessary .
IM 05G01B12-02E
1st Edition : 2004.11.05-00
Page 35

<Toc> <Ind> < 5. Operating the Multi-monitoring Function >
Dragging a mouse cursor in the direction of an arrow
zooms in the trend display as shown below.
5-9
Figure 5.5.3 Zoom in
IM 05G01B12-02E
1st Edition : 2004.11.05-00
Page 36

<T oc> <Ind> < 5. Operating the Multi-monitoring Function >
Dragging a mouse cursor in the direction of an arrow
zooms out the trend display as shown below.
5-10
Figure 5.5.4 Zoom out
IM 05G01B12-02E
1st Edition : 2004.11.05-00
Page 37

<Toc> <Ind> < 5. Operating the Multi-monitoring Function >
5.6 Panel View
Data of each loop are displayed in the Panel view (Figure 5.6.1) on the lower part of Multimonitor display .
While the trend display is working: Displays the newest data.
While the trend display is stopped: Displays the data of the position where a mouse cursor
is placed.
All data of X-axis where a mouse cursor is placed are displayed.
Mouse cursor
5-11
Figure 5.6.1 Confirmation of Trend Data
IM 05G01B12-02E
1st Edition : 2004.11.05-00
Page 38

<T oc> <Ind> < 5. Operating the Multi-monitoring Function >
5-12
Alarm 1 to 4 lamps
Alarm On: Lights up (red)
Alarm Off: Goes off (black)
For UP350/UP351,
PV evnet 1, PV event 2 and
Time evnet are displayed and
the right end lamp is not used.
the instrument alarms are displayed.
(Heating-side) control output (OUT)
Cooling-side control output (OUTc)
displays of current setpoint (SP),
(heating-side) control output (OUT),
cooling-side control output (OUTc).
For UP550/UP750,
Measured input value (PV)
Current setpoint (SP)
Display switching button
Clicking the button switches
Figure 5.6.2 Panel View
NOTE
For UP350 and UP351, alarm status lamps indicate PV event 1, PV event 2 and Time
event. The right end lamp is always off.
Model : Loop number (01 to 16)
Address
For optical communication adapter or serial communication:
Serial communication address
For Ethernet communication:
0 to 255
0 to 255
0 to 255
IP1
IP2
IP address
Tuning button
Operation mode such as Auto/Manual or
Run/Stop, SP No. and PID parameter can be checked.
See Chapter 6, “Tuning.”
IP3
0 to 255
IP4
01 to 99
ADR
01 to 99
ADR
Serial communication address
For UT550, alarms 5 to 8 are not displayed when eight alarms are used.
IM 05G01B12-02E
1st Edition : 2004.11.05-00
Page 39

<Toc> <Ind> < 5. Operating the Multi-monitoring Function >
5.7 Status Display
5-13
1 2
Status display bar
Figure 5.7.1 Status Display
Table 5.7.1 Status Display
StatusDisplay Position Remarks
1
1
2
1
3
4
Under communication
Communication delay occurs
Trend cycle
Progress
Date
Time
Display
Green lamp lights up
Red lamp lights up
Trend cycle
Progress bar display
PC system date
PC system time
3
Blinks for every trend cycle
Blinks for every trend cycle
Double-clicking displays the Trend Cycle dialog box by
pop-up one.
Rate of Progress is displayed when processing
takes time.
Year/month/day
Time: minute
4
IM 05G01B12-02E
1st Edition : 2004.11.05-00
Page 40

<T oc> <Ind> < 5. Operating the Multi-monitoring Function >
5.8 Printing Function
The Multi-monitor display (Figure 5.8.1) can be printed or copied to a cliploard.
Print: On the menu bar, click File, and then choose Print.
Hard copy: On the menu bar, click File, and then choose Copy to clipboard.
● Operation Procedure for Printing
(1) On the menu bar, Click File, and then choose Print.
(2) The Printer Selection dialog box appears. However , not appears while trend data is
working.
(3) The Multi-monitor display is printed.
● Operation Procedure for Copying to Clipboard
(1) From the menu bar, choose File, then Copy to clipboard .
(2) The Multi-monitor display can be pasted on drawing software and the like.
5-14
Figure 5.8.1 Example of Hard Copy
IM 05G01B12-02E
1st Edition : 2004.11.05-00
Page 41

<Toc> <Ind> < 6. T uning >
6. Tuning
This chapter describes how to tune the Multi-monitoring function.
6.1 T uning
Tuning of the loop detected automatically by Automatic scan can be tuned.
● Operation Procedure
(1) Click TUNING button in the Panel view of the loop to be tuned, or select the loop to be
tuned from the [
(2) The T uning dialog box of the corresponding loop appears (Figure 6.1.1).
(3) The current setpoint is displayed. Select the value of the parameter to be changed from
the drop-down list, or double-click the text box to enter the required value.
(4) Data change of the controller is activated when ENTER key is pressed.
(5) Refer to Section 6.2, “Saving Tuning Data” when saving the tuning data. Click Close
when not saving the tuning data.
] drop-down list on the toolbar while trend display is working.
6-1
NOTE
Tuning can be carried out only when trend display is working. T uning cannot be carried out
for the saved data opened by selecting Open trend data.
Dispalys model, IP address, serial
communication address
Displays measured input value (PV), current
setpoint (CSP), (heating-side) control output
(OUT) and cooling-side control output (OUTc).
Displays and changes mode parameters such
as RUN/STOP or REMOTE/LOCAL, current
setpoint (SP), parameters such as control
output at manual operation (MOUT) and PID
parameters such as P, I, D, Pc, Ic and Dc.
Close button: Quits without recording the tuning
data on trend data.
Figure 6.1.1 Tuning Dialog Box
Record tuning data button: Tuning data is
recorded on trend data. However, it is not saved
as a file. Save data as a file as necessary. (See
Section 6.2, “Saving Tuning Data.”
Displays the guidance for setting range and unit.
IM 05G01B12-02E
1st Edition : 2004.11.05-00
Page 42

<T oc> <Ind> < 6. Tuning >
■ Displaying and Setting Modes
Select a value from the drop-down list for the following mode.
Loop 1/2: Displays the loop when the controller is in dual-loop control, temperature and
humidity control or cascade control.
RUN/STOP: Displays and changes the RUN/STOP status of the controller
REMOTE/LOCAL: Displays and changes the Remote/Local mode of the controller
MAN/AUTO/CAS: Displays and changes the Manual/Auto (/Cascade) mode of the
controller. (CAS is not provided for UT450/UT420.)
A T ON/OFF: Starts and stops auto-tuning. After you start auto-tuning, optimized PID
parameter values are set in the controller.
V .AT ON/OFF: Starts and stops automatic valve tuning. (Only for position proportional
type controllers)
RESET/PROG1/PROG2: Displays and changes the Program 1 start/Program 2 start/
Operation stop of the controller.
RESET/PROG/LOCAL: Displays and changes the Program operation start/Local opera-
tion start/Operation stop of the controller.
6-2
■ Displaying and Setting Parameters
Enter a value in the text box for the following data.
See the User’s Manual of each controller for the setting contents of parameters.
SP No: Displays and changes the SP number .
PID No.: Displays the PID group number.
SP: Displays and changes the current setpoint.
LSP: Displays and changes the local setpoint.
LPID: Displays and changes the PID number in LOCAL mode.
PTN: Displays the program pattern number.
PID No.: Displays the PID number.
MOUT: Displays and changes the control output (heating-side control output) in Manual
mode.
MOUTc: Displays and changes the cooling-side control output in Manual mode.
P: Displays and changes the (heating-side) proportional band.
I: Displays and changes the (heating-side) integral time.
D: Displays and changes the (heating-side) derivative time.
Pc: Displays and changes the cooling-side proportional band.
I: Displays and changes the cooling-side integral time.
D: Displays and changes the cooling-side derivative time.
IM 05G01B12-02E
1st Edition : 2004.11.05-00
Page 43

<Toc> <Ind> < 6. T uning >
Table 6.1.1 Tuning Parameter
Function
Run / Stop switching
Remote / Local switching
Manual / Automatic (/ Cascade) switching
Auto-tuning
Automatic valve tuning
SP No.
PID No.
Target (Current) Setpoint
(Heating-side) control output
Cooling-side control output
(Heating-side) Proportional band
(Heagting-side) Integral time
(Heating-side) Derivative time
Cooling-side proportional band
Cooling-side integral time
Cooling-side derivative time
UT350/UT320/UT351/UT321
-
MAN/AUTO
AT ON/OFF
-
SP. No
PID No. (display only)
SP
MOUT
MOUTc
P
I
D
Pc
Ic
Dc
UT450/UT420
RUN/STOP
REMOTE/LOCAL
MAN/AUTO
AT ON/OFF
V.AT ON/OFF
SP. No
PID No. (display only)
SP
MOUT
MOUTc
P
I
D
Pc
Ic
Dc
UT550/UT520/UT551/UT750
REMOTE/LOCAL
MAN/AUTO/CAS
V.AT ON/OFF
PID No. (display only)
6-3
RUN/STOP
AT ON/OFF
SP. No
SP
MOUT
MOUTc
P
I
D
Pc
Ic
Dc
Program start / stop switching
Manual / Automatic switching
Auto-tuning
Automatic valve tuning
Local setpoint
Local PID No.
Program pattern No.
PID No.
(Heating-side) control output
Cooling-side control output
(Heating-side) Proportional band
(Heagting-side) Integral time
(Heating-side) Derivative time
Cooling-side proportional band
Cooling-side integral time
Cooling-side derivative time
UP350/UP351Function
RESET/PROG1/PROG2
-
AT ON/OFF
-
-
-
-
PID No. (display only)
-
-
P
I
D
-
-
-
UP550/UP750
RESET/PROG/LOCAL
MAN/AUTO
AT ON/OFF
V.AT ON/OFF(UP550 only)
LSP
LPID
PTN (display only)
PID No. (display only)
MOUT
MOUTc
P
I
D
Pc
Ic
Dc
IM 05G01B12-02E
1st Edition : 2004.11.05-00
Page 44

<T oc> <Ind> < 6. Tuning >
6.2 Saving T uning Data
■ Recording T uning Data on Trend Data
The tuning data can be recorded on trend data. The data to be recorded are RUN/STOP,
RESET/PROG1/PROG2, RESET/PROG/LOCAL, MAN/AUTO/CAS, REMOTE/LOCAL,
SP No., PID No., LSP, P, I, D, Pc, Ic, Dc, MOUT and MOUTc.
When the tuning data is recorded, a tuning mark appears on a chart. Pointing a mouse to
the tuning mark displays the tuning data by pop-up one.
NOTE
Clicking Record tuning data records the tuning data on the trend data on a memory.
However, it is not saved as a file. Save the trend data when stopping the trend display or as
necessary .
● Operation Procedure
6-4
(1) After tuning is completed, click Recorded tuning data in the T uning dialog box (Figure
6.1.1) of the corresponding loop.
(2) The Record T uning Data message box (Figure 6.2.1) appears, and the tuning mark
appears in the trend display .
Figure 6.2.1 Record T uning Data Dialog Box
IM 05G01B12-02E
1st Edition : 2004.11.05-00
Page 45

<Toc> <Ind> < 6. T uning >
Tuning mark
Tuning data is displayed by pop-up one for a constant period (5 to 10 sec)
when pointing a mouse to the tuning mark after tuning is completed.
6-5
Figure 6.2.2 Tuning Mark
(3) Click OK.
(4) From the toolbar, click the [
] shortcut, or from the menu bar, choose File, then Save
trend data.
(5) The Save T rend Data dialog box (Figure 6.2.3) appears. In the File name text box,
enter a file name then click Save.
Figure 6.2.3 Save Trend Data Dialog Box
IM 05G01B12-02E
1st Edition : 2004.11.05-00
Page 46

Blank Page
Page 47

<Toc> <Ind> < 7. Trend Data File >
7. T rend Data File
This chapter describes how to operate a trend data file of Multi-monitoring function.
7.1 Opening a T rend Data File
A trend data file saved to a PC can be read out and displayed in the Multi-monitor display
while the trend display is stopped.
● Operation Procedure
(1) Select Open trend data in the Start Multi-monitor starting dialog box, or from the Menu
bar, choose File, then Open trend data while the trend display is stopped
(2) The Open T rend Data dialog box (Figure 7.1.1) appears.
(3) Select a trend data file and click Open. The T rend Setup dialog box appears. See
Section 4.2, “Setting Trend Display .”
(4) Select the trend data item to be displayed in the Multi-monitor display , scale and display
color, and then click OK. The Multi-monitor display appears. See Section 5.5, “Operat-
ing Trend Display Function” for how to operate in the Multi-monitor display.
7-1
Figure 7.1.1 Open Trend Data Dialog Box
NOTE
If starting the trend display after opening a saved trend data file, the Automatic Scan dialog
box appears. Trend display can be started after Automatic scan and the setup for trend
display are completed.
IM 05G01B12-02E
1st Edition : 2004.11.05-00
Page 48

<T oc> <Ind> < 7. Trend Data File >
7.2 Operating T rend Data
The trend display function at the time of off-line is same as that when the trend display is
working at the time of on-line. However, trend cycle cannot be set and tuning cannot be
carried out. See Section 5.5, “Operating T rend Display Function.”
7.3 Example of T rend Data Saved as a CSV File
The example when reading a CSV file to Excel is shown below. As for actual CSV data,
each data is divided by “ , .”
1. Connection Information, Scale Setup and T rend Setup
Connection Information
7-2
Scale Setup
T rend Setup
IM 05G01B12-02E
1st Edition : 2004.11.05-00
Page 49

<Toc> <Ind> < 7. Trend Data File >
2. T rend Data
7-3
IM 05G01B12-02E
1st Edition : 2004.11.05-00
Page 50

Blank Page
Page 51

<Int> <Toc> <Ind>
Revision Information
● Manual Title: Models LL100/LL200 Multi-monitoring Function User’s Manual
● Manual No. : IM 05G01B12-02E
1st Edition/Nov . 2004
Newly published.
i
Written by Yokogawa Electric Corporation
Published by Yokogawa Electric Corporation
2-9-32 Nakacho, Musashino-shi, Tokyo 180-8750, JAPAN
IM 05G01B12-02E 1st Edition : 2004.11.05-00
Page 52

Blank Page
Page 53

Page 54

YOKOGAWA ELECTRIC CORPORATION
Network Solutions Business Division
2-9-32, Nakacho, Musashino-shi, Tokyo, 180-8750 JAPAN
Phone: +81-422-52-7179 Facsimile: +81-422-52-6793
Sales Branch Offices
Tokyo, Nagoya, Osaka, Hiroshima, Fukuoka
YOKOGAWA CORPORATION OF AMERICA
Headquaters
2 Dart Road, Newnan, GA. 30265-1094 U.S.A.
Phone: +1-770-253-7000 Facsimile: +1-770-251-0928
Sales Branch Offices / Texas, Chicago, Detroit, San Jose
YOKOGAWA EUROPE B. V.
Headquaters
Databankweg 20, 3821 AL Amersfoort THE NETHERLANDS
Phone: +31-334-64-1611 Facsimile: +31-334-64-1610
Sales Branch Offices / Houten (The Netherlands), Wien (Austria), Zaventem
(Belgium), Ratingen (Germany), Madrid (Spain), Bratislava (Slovakia), Runcorn (United
Kingdom), Milano (Italy), Velizy villacoublay(France), Johannesburg(Republic of South
Africa)
YOKOGAWA AMERICA DO SUL S.A.
Headquarters & Plant
Praca Acapulco, 31-Santo Amaro, Sao Paulo/SP, BRAZIL CEP-04675-190
Phone: +55-11-5681-2400 Facsimile: +55-11-5681-4434
YOKOGAWA ENGINEERING ASIA PTE. LTD.
Head office
5 Bedok South Road, Singapore 469270 SINGAPORE
Phone: +65-6241-9933 Facsimile: +65-6241-2606
YOKOGAWA ELECTRIC KOREA CO., LTD.
Seoul Sales office
395-70, Shindaebang-dong, Dongjak-gu, Seoul,156-010, KOREA
Phone: +82-2-3284-3000 Facsimile: +82-2-3284-3019
YOKOGAWA TAIWAN CORPORATION
Head office
17F, No.39, Sec. 1, Chung Hwa Road Taipei, 100 TAIWAN
Phone: +886-2-2314-9166 Facsimile: +886-2-2314-9918
YOKOGAWA AUSTRALIA PTY. LTD.
Head office
Centrecourt D1, 25-27 Paul Street North, North Ryde, N. S. W. 2113, AUSTRALIA
Phone: +61-2-9805-0699 Facsimile: +61-2-9888-1844
YOKOGAWA INDIA LTD.
Head office
40/4 Lavelle Road, Bangalore, 560 001, INDIA
Phone: +91-80-227-1513 Facsimile: +91-80-227-4270
LTD. YOKOGAWA ELECTRIC
Grokholskiy per. 13, Build. 2, 4th Floor, 129010, Moscow, RUSSIA FEDERATION
Phone: +7-095-737-7868 Facsimile: +7-095-737-7869
 Loading...