

Page 1
99 Washington Street
Melrose, MA 02176
Phone 781-665-1400
Toll Free 1-800-517-8431
Visit us at www.TestEquipmentDepot.com
YELLOW JACKET
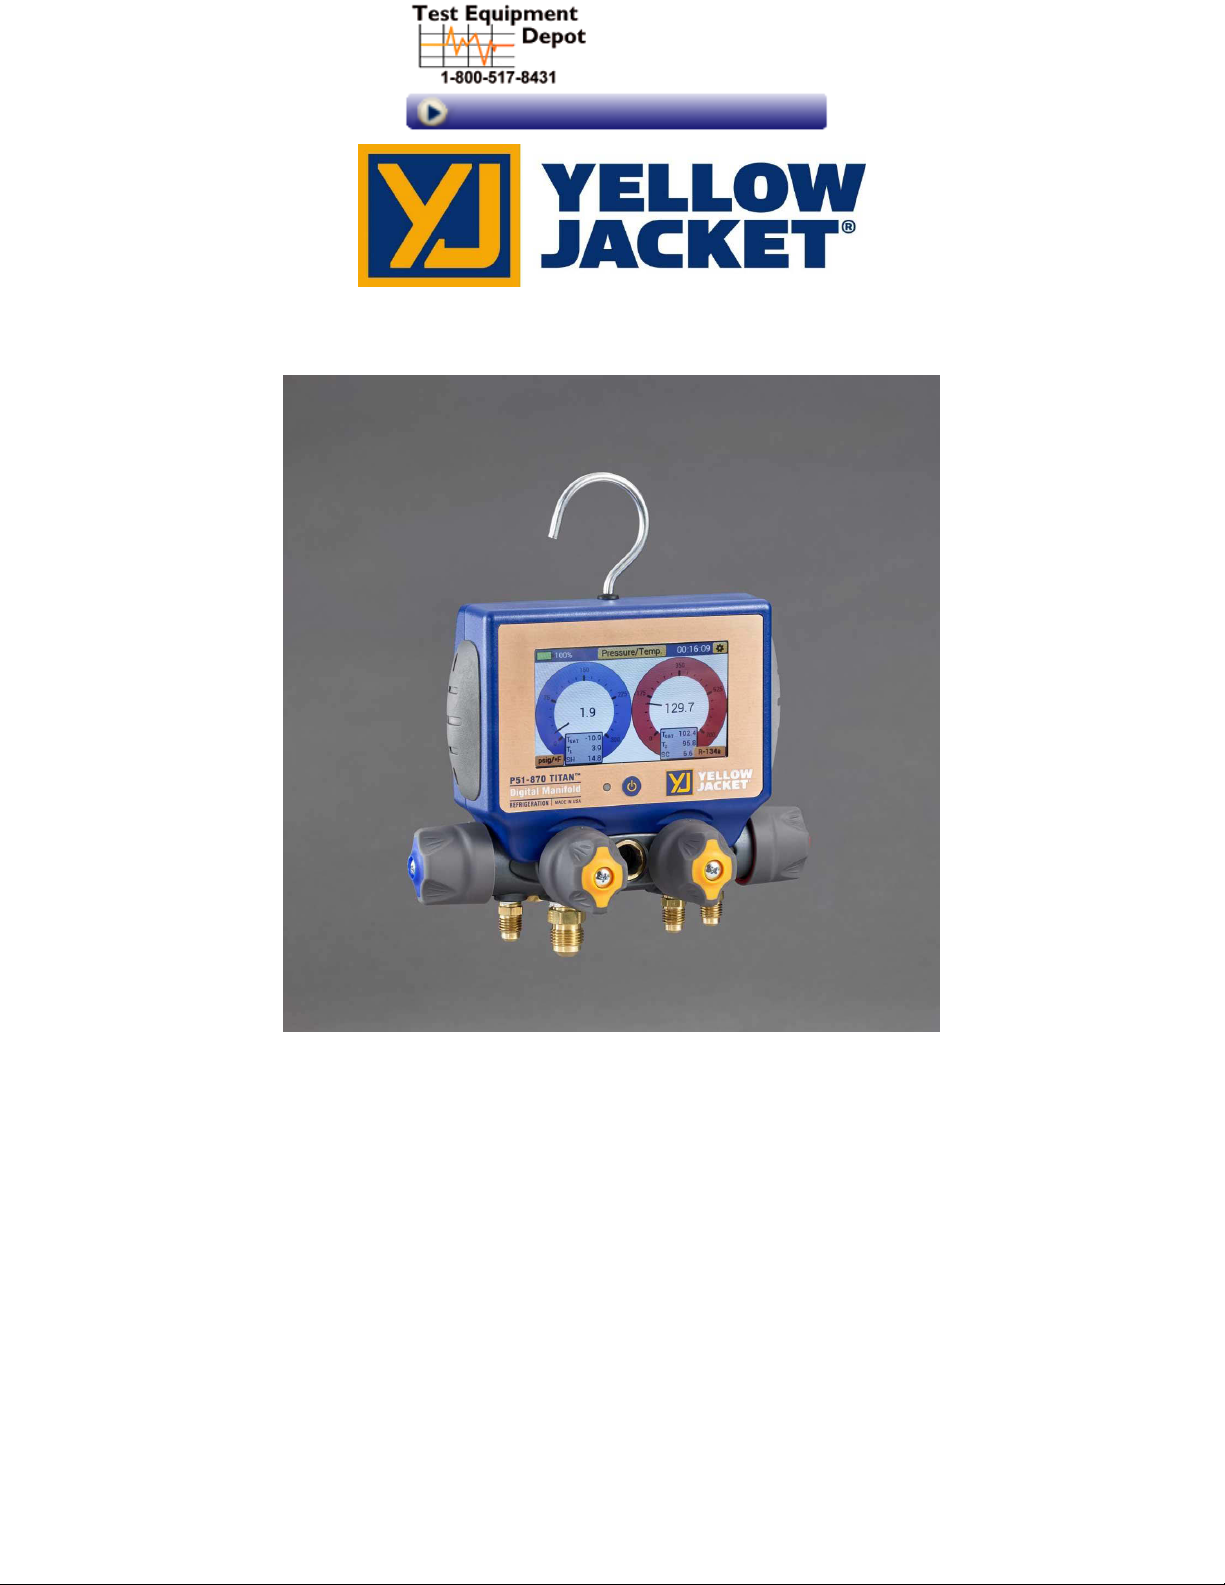
P51-870 TITAN™ User Manual
UPC# 40870, 40875
Note: These Instructions do not cover the manifold attached to the instrument.
Page 2

Table of Contents
Ch. 1: Before You Start…………………….…………………………………………………………..……1
Contacting Ritchie Engineering..…………………….……………………………………………………………….1
Safety Information……………………………………………………….…………………………………………………1
Ch. 2: Getting Started…………………………………………………………..……………………………3
Getting to Know Your P51-870 TITAN™…………………………………………………….……………………..3
Turning the instrument On and Off………………………………………………………………………………….3
Interacting with the Device……………………………………………………………………………………………..4
Connecting and Using the Temperature Clamps………………………………………………………………4
Connecting and Using the Vacuum Sensor……………………………………………………………………….5
Interpreting the Battery Life Indicator………………………………………………………………………….….5
Charging the Battery………………………………………………………………………………………..…………….6
Operating the Backlight…………………………………………………………………………………………..……..6
Datalogging……………………………………………………………………………………………………………………6
Interpreting the RGB LED…………………………………………………………………………………………………8
Ch. 3: Modes of Operation…………………………………………………………………………………9
Modes Menu……………………………………………………………………………………………………….……..9
Pressure/Temperature Mode……………………………………………………………………………………..9
Overview…………………………………………………………………………………………………………….9
Interpreting the Pressure Analog Gauges…………………………………………………………..10
Interpreting the Pressure and Temperature Line Graphs……………………………….……10
Operating Pressure/Temperature Mode………………………………………………..………….11
Evacuation Mode……………………………………………………………………………………………………..12
Overview…………………………………………………………………………………………………………..12
Interpreting the Evacuation Gauge……………………………………………………………………12
Interpreting the Evacuation Graph…………………………………..………………………………..13
Operating the Evacuation Mode……………………………………….……………………………….13
Pressure Hold Mode – Pressure Decay Test………………………..………………………………………14
Overview…………………………………………………………………………………………………..………14
Interpreting the Pressure Decay Gauge………………………………………..………….………..15
Interpreting the Pressure Decay Graph……………………………………………………………..15
Operating the Pressure Decay Mode………………………………………………………………….16
Pressure Hold Mode – Pressure Rise Test………………………………………………..…………………17
Overview………………………………………………………………………………………………………..…17
Interpreting the Pressure Rise Gauge………………………………………….…………………....18
Interpreting the Pressure Rise Graph…………………………………………………………………18
Operating the Pressure Rise Test……………………………………………………………………….19
Page 3

Ch. 4: Settings…………………………………………….……………………………………………………20
Settings Menus Overview…………………………………………………….…………………………………..20
General Settings Menu......……………………………………………………………………………………….20
Zeroing the Pressure Transducers………………………………………………………………………20
Calibrating the Touchscreen………………………………………………………………………………21
Refrigerant Settings Menu…………………………………………………………………………………….….21
Unit Settings Menu…………………………………………………………………………………………………..21
Pressure Units……………………………………………………………………………………………….….22
Temperature Units…………………………………………………….………………………………………22
Vacuum Units……………………………………………………………………………………………….…..22
Device Settings Menu……………………………………………………………………………………………….22
Brightness……………………………………………………………………………………………………..….22
Backlight Timer………………………………………………………………………..………………..……..22
Auto Off……………………………………………………………………………………….……………………23
Logging Rate…………………………………………………………………………………………..…..……23
Ch. 5: Mantooth App Integration…………………………………………………………………..…24
Overview………………………………………………………………………………………………………………………24
Operation of the Mantooth App with the P51-870 TITAN™………………………………………..….24
Ch. 6: Maintenance………………….……………………………………………………………………..25
Overview……………………………………………………………………………………………………………………...25
General Maintenance……………………………………………………………………………………………………25
Replacement Parts…………………………..…………………………………………………………..…………..….25
Software Updates…………………………………………………………………..…………………………………….26
Ch. 7: Device Specifications………………………………………………………………………….….26
Ch. 8: Troubleshooting Guide….…………………………………………………….…………………27
Page 4
Chapter 1:
Table 1-1. Safety Information
Warning
To avoid personal injury or death, follow these
guidelines:
• Most governments and legal authorities require that HVAC technicians be trained and
certified in the safe and proper operation of
HVAC tools, such as this instrument. Since
this tool may be connected to many types of
equipment through a limitless combination
of hoses and fittings, proper training is the
most important element of using this tool
safely.
• Read the entire User Manual before using
the instrument.
• Use the instrument only as described in the
User Manual, otherwise the protection provided by the equipment may be impaired.
•
Do not use the instrument if it is damaged.
Before you use the instrument, inspect the
case. Look for cracks or loose components
• The instrument contains no internal userserviceable parts; Do not open the
instrument. Have the instrument serviced
only by Ritchie Engineering Co. or
authorized service centers.
• Do not use the instrument if it operates abnormally. Protection may be impaired.
When in doubt, have the instrument
serviced.
Before You Start
Contacting Ritchie Engineering:
To order accessories, receive assistance, or locate the nearest YELLOW JACKET distributor.
Safety Information:
Use the instrument only as specified in this manual. Otherwise, the protection provided by the
instrument may be impaired. Refer to safety information in Table 1-1.
A Warning identifies conditions and actions that pose hazards to the user. A Caution identifies
conditions and actions that may damage the instrument or the equipment under test.
1
Page 5

• Do not operate the instrument around
explosive gas, vapor, or dust.
• Various refrigerants have been intentionally
excluded for very significant safety reasons.
Never use refrigerants in this instrument
that are not listed in the Set-up menu.
• The refrigerant database in this unit may
include refrigerants classified as flammable.
If such refrigerants are selected, the
operator may need additional certifications
and/or training. Consult your government
and legal authority and comply fully with all
requirements.
• Always wear eye and skin protection when
working with refrigerants. Escaping
refrigerant vapors will present a freezing
danger. Do not direct refrigerant vapors
venting from hoses towards the skin.
•
Maximum Working Pressure: 700
psia (4.83
MPa)
• Because this instrument allows for various
inputs including electrical and mechanical,
care must be taken to observe any ways
that an electrical shock hazard could
develop. Example: Wet or humid conditions,
along with a damaged thermocouple or
vacuum sensor, could allow an electrical
path across the instrument and over wet
hoses. Keep all interconnected equipment
clean, organized, and in proper condition.
Do not use the instrument if you are not
qualified to recognize potential electrical
faults.
To avoid damage to equipment, follow these
guidelines:
• Do not allow pressures beyond the
specifications listed in this manual.
• Be aware that internal pressures can change
unintentionally when equipment is stored
with pressure in the system during
temperature changes. If sub-cooled liquid
refrigerant is trapped in a hose or manifold
with no room for expansion, it may result in
dramatic pressure variations with seemingly
small temperature changes. Pressures can
reach high enough levels to cause damage
to the instrument’s internal pressure
transducers. Release liquid refrigerant from
the hoses and manifold when disconnecting
from a system.
•
Do not attempt to introduce liquid or
samples heavily laden with oil into the
instrument.
•
Do not use this instrument on systems
containing leak sealing chemicals. These
leak sealants can collect and harden in the
instrument, causing permanent damage.
2
Page 6
Getting Started
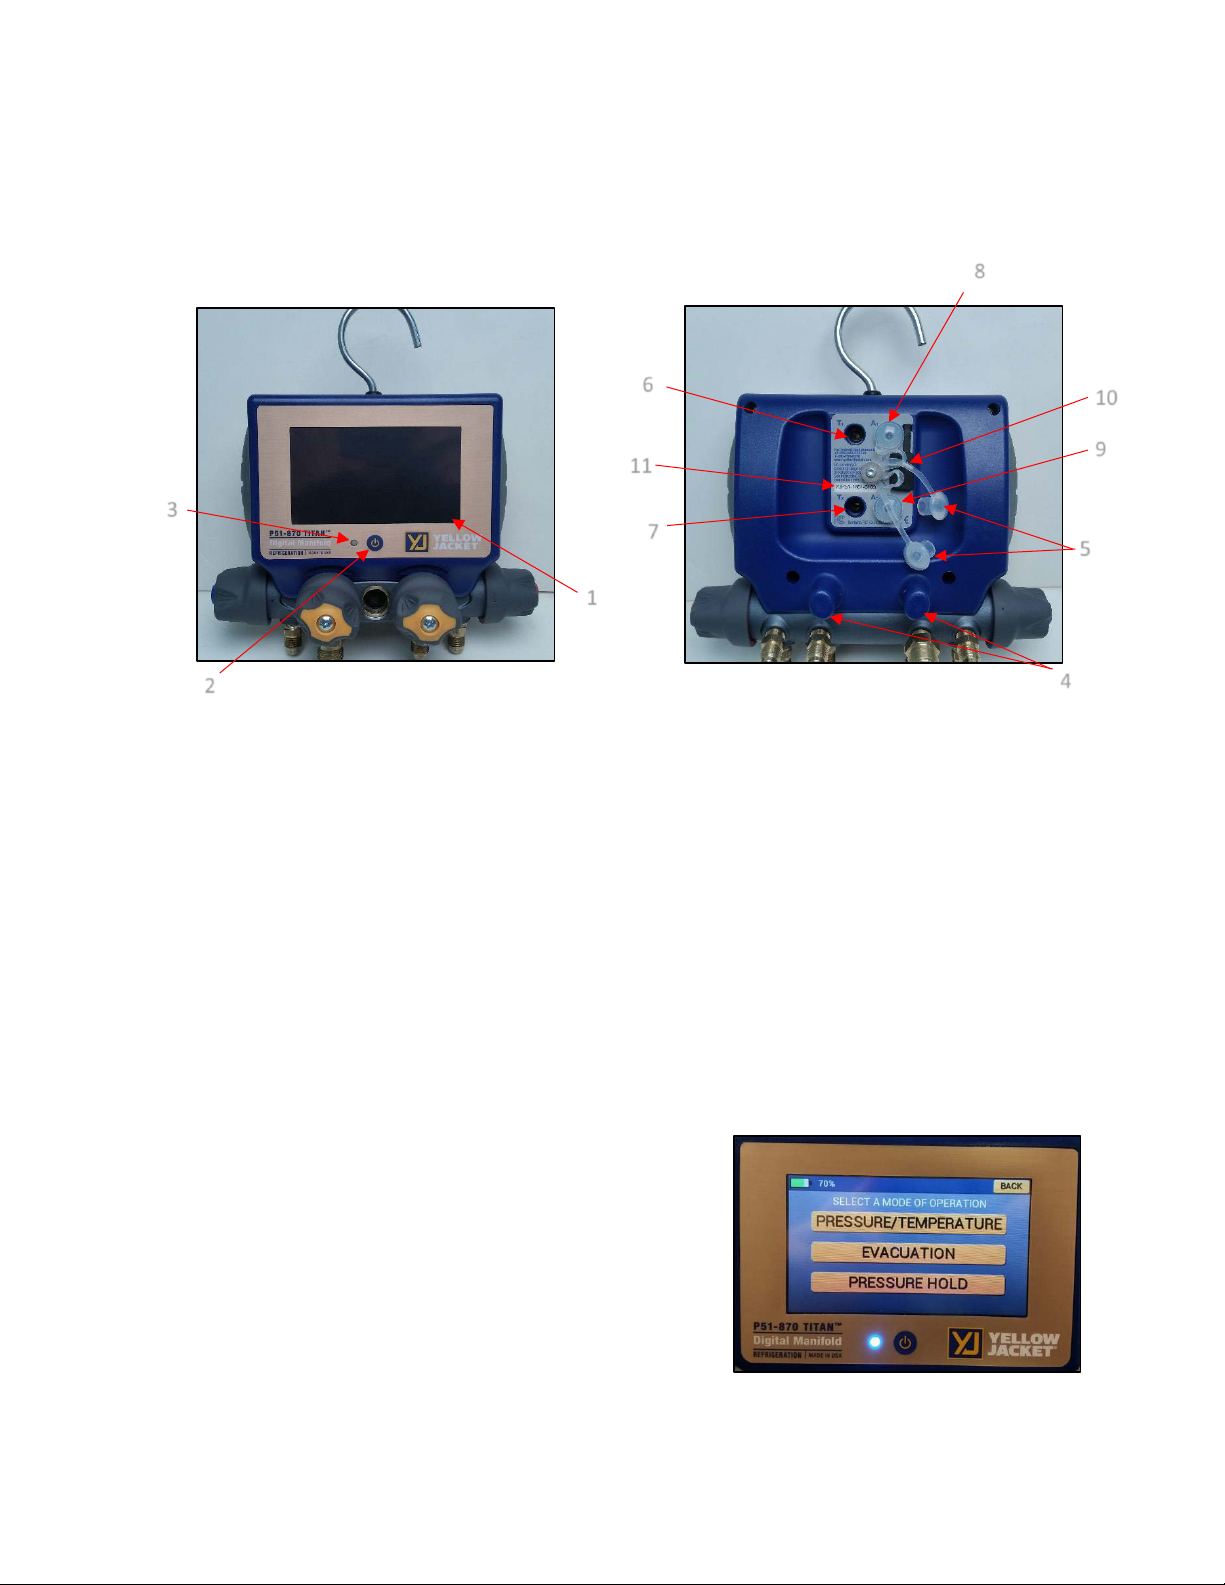
Figure 1: P51-870 Front View
1
2 3 4
7
8 5 9
6
Figure 3: Powering on the Device
Figure 2: P51-870 Rear View
11
10
Getting to Know Your P51-870 TITAN™:
Chapter 2:
1. Touchscreen Display
2. Power Button
3. RGB LED
4. Temperature Clamp Mounting Pegs
5. Silicone Plugs
6. T1 Connector
7. T2 Connector
8. A1 Connector
9. A2 Connector
10. Micro-USB Connector
11. Serial Number/Bluetooth ID
Turning the instrument On and Off:
Press and release the power button, located at bottom
center of the display. The YJ logo will appear briefly on
startup. The current firmware version and Serial Number are
displayed at the bottom left and right corners of the display
respectively on power up. The instrument will then proceed
to the Modes Menu.
At any time during operation, press and hold the power
button for 3 seconds to turn off the instrument.
3
Page 7
Interacting with the device:
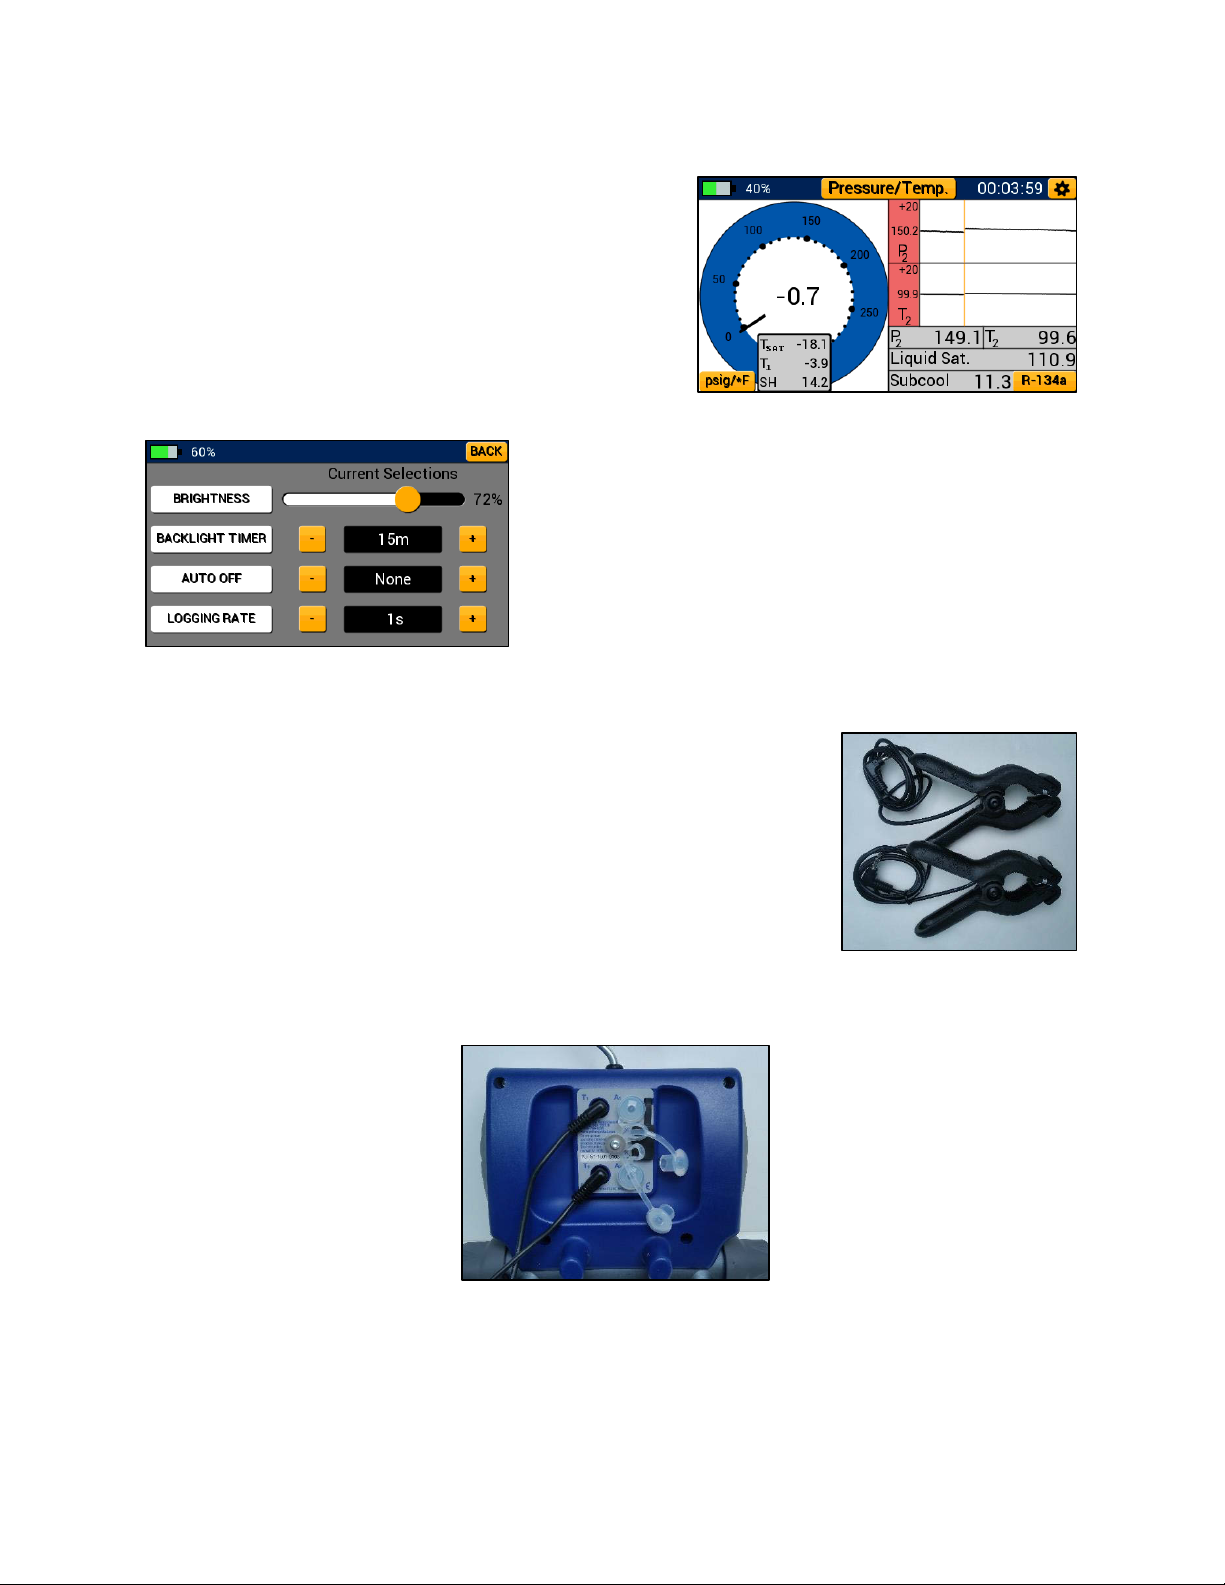
Figure 4: Pressure/Temperature Mode Interaction
Figure 5: Device Settings Interaction
Figure 6: 67010 Included Temp
Probes
Figure 7: Connecting the Temp Probes
The P51-870 TITAN™ features a 4.3” full color resistive
touchscreen for improved usability and durability. To
interact with the device, use a finger or stylus to touch
anywhere on the screen. All interactive buttons are
conveniently displayed with the same golden yellow
color as seen in Figures 4 & 5. The only exception to this
rule is the interaction with the gauge and graphs in
Pressure/Temperature mode.
Resistive touchscreens are resistant to impact and various
chemicals, compatible with all types of stylus, and are not
susceptible to grease and moisture. While more durable, a
resistive touchscreen requires a larger input force to
register a touch then other common touchscreen types.
Using a fine tipped stylus or fingernail can greatly improve
interaction with the device. For instructions on
touchscreen calibration, see page 21.
Connecting and Using the Temperature Clamps:
Two (67010) temperature clamps, pictured in Figure 6, are supplied
with the P51-870 TITAN™ and can be used to monitor system
temperature, superheat and subcooling. To connect the sensors to the
device, remove the clear silicone plugs from the back of the device
covering connectors T1 and T2. Insert the male temperature clamp
connectors into either the T1 or T2 connectors (shown in Figure 7
below). Attach the clamps to the point on the system where it is
desired to measure temperature. Ensure that both jaws of the clamp
are well secured and the metal temperature probe on the upper jaw is
flush with the surface to be measured.
When not in use, the temperature clamps can be conveniently stored by attaching the clamps to
the two mounting pegs located on the back of the device.
4
Page 8
Connecting and Using the Vacuum Sensor:
Figure 8: 67030 Vacuum Sensor
Figure 9: Connecting the Vacuum Sensor
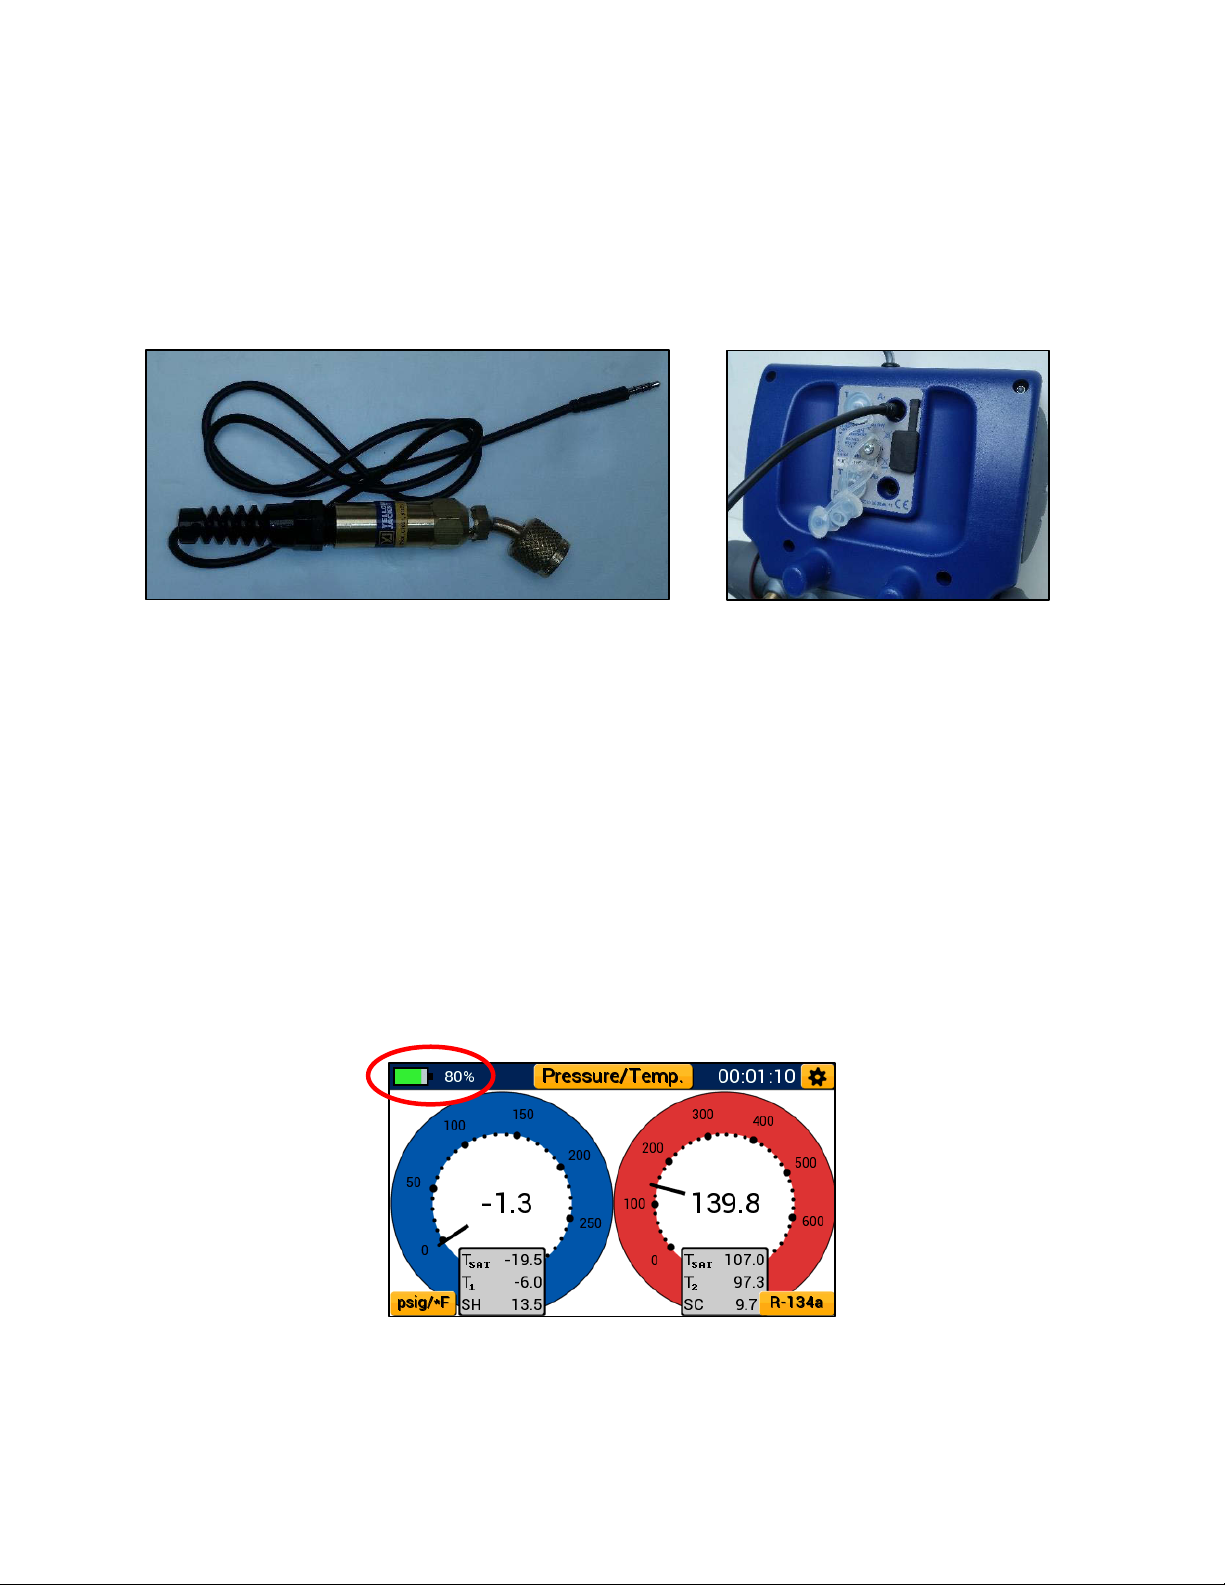
The P51-870 TITAN™ includes a (67030) YJ vacuum sensor, pictured in Figure 8, which can be
used with this unit to measure the current depth of vacuum within a system. To connect the
vacuum probe to the device, remove either of the two clear silicone plugs on the back of the
device covering the A1 and A2 connectors.
Insert the vacuum probe connector into either the A1 or A2 audio connectors as shown in Figure
9. The P51-870 TITAN™ will prioritize the A1 connector but can measure through the A2
connector. Connect the vacuum probe to a system during evacuation to monitor the system
pump down. Ensure that the vacuum probe is tight to the system and at a significant distance
from the vacuum pump such that it does not disturb the vacuum measurements.
Interpreting the Battery Life Indicator:
This instrument utilizes a 2000mAhr rechargeable lithium ion battery. It is equipped with a
battery level indicator displayed in the top left corner of all screens (shown in Figure 10). At full
charge, the battery will appear solid green and will indicate 100% charge to the right of the
indicator. As the charge is drained, the green bar will decrease in width. When the battery life
indicator turns red, the device charge is at 10% or less and needs to be plugged into a power
source immediately.
Figure 10: Battery Life Indicator
This device is rated for 4 hours of battery life with full backlight brightness and 80 hours with no
backlight. To properly maximize battery life, make use of both auto off and auto dimming
5
Page 9
features accessible in the device settings menu (see Pages 22-23). The most influencing factor on
Figure 12: Backlight Settings
Figure 11: Charging the
Battery
battery life is the backlight intensity, be sure to adjust the backlight level accordingly depending
on your current viewing conditions.
Charging the Battery:
To ensure maximum battery life, make sure the P51-870 TITAN™ is charged
before and after each job session. To charge the device, remove the microusb cover and connect the manifold to a power source via the provided data
transfer cable as pictured in Figure 11. When connected to a power source,
the LED will turn a solid green. It takes approximately 2.5 – 3hrs to reach full
charge from dead battery. Once the device has reached full charge, the
green LED will shut off indicating the charge is complete.
Operating the Backlight:
This instrument is equipped with an adjustable backlight and backlight auto dimming capabilities.
When the backlight dims during use, a touch anywhere on the screen or a quick press of the
power button can be used to wake up the device and power the backlight on.
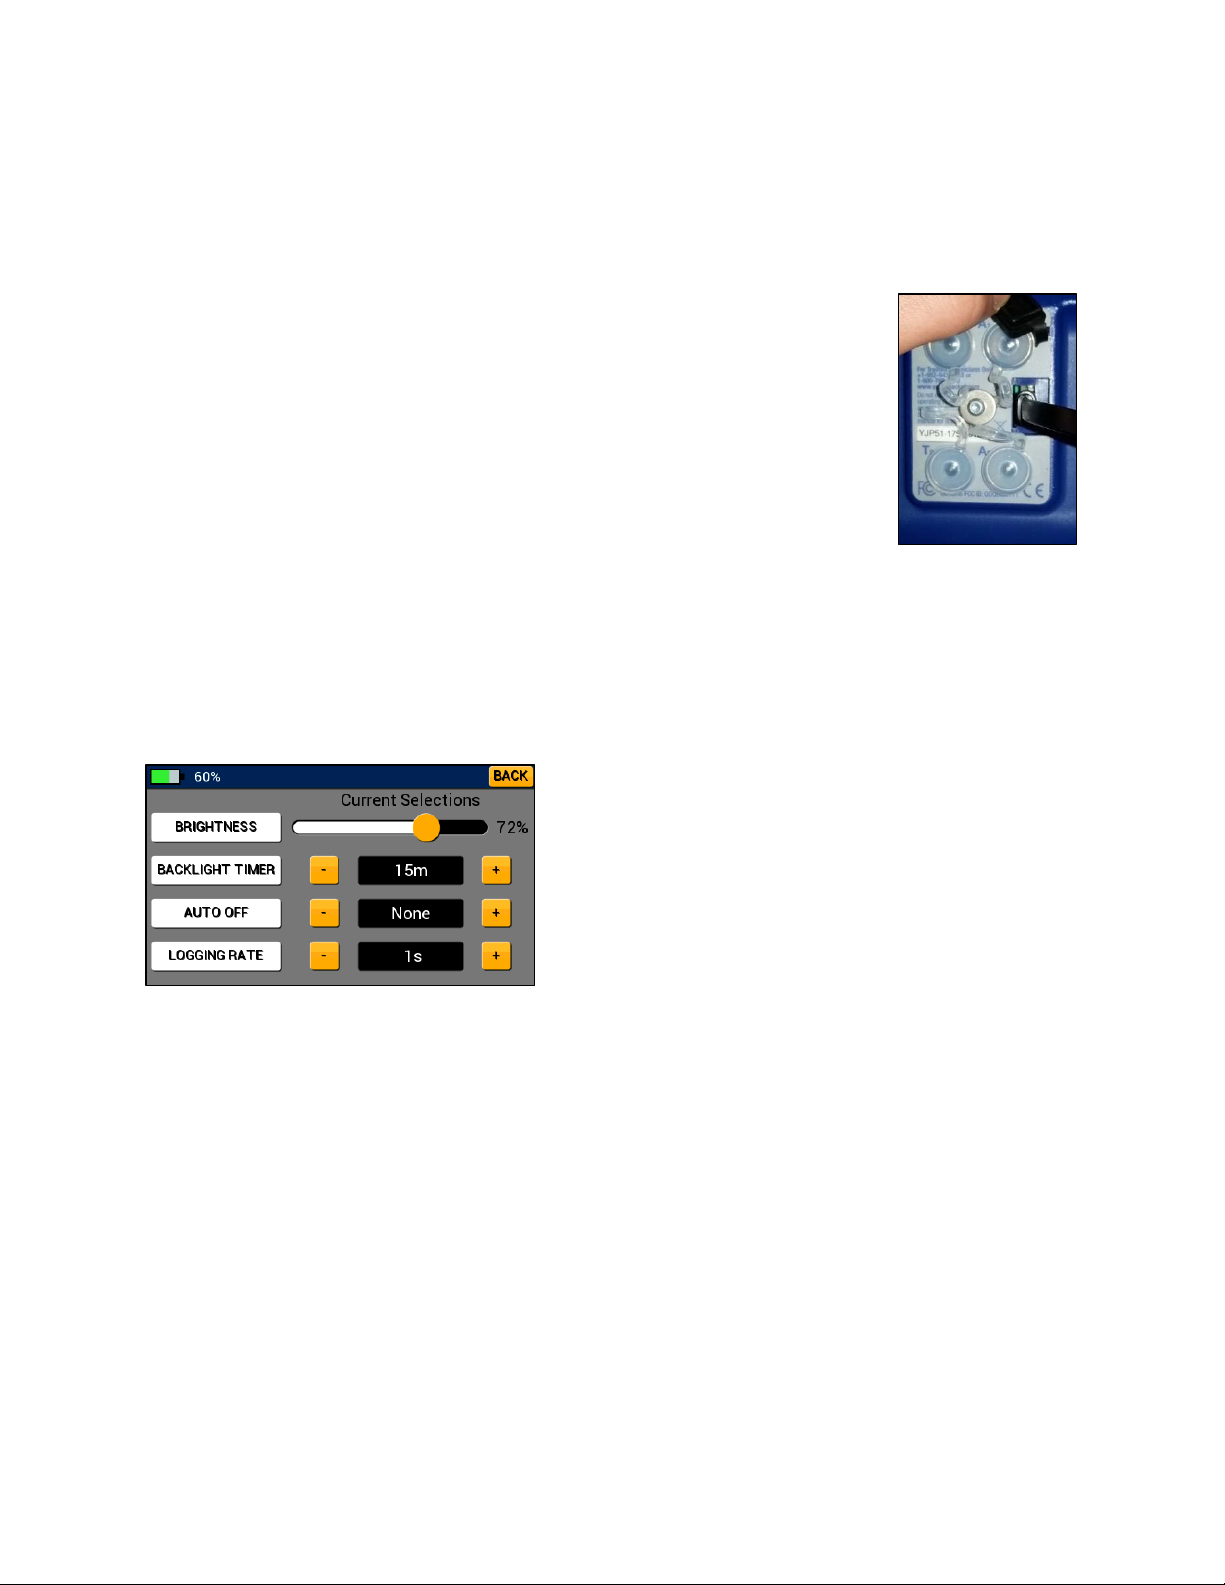
To help conserve battery life, make sure to use the
backlight timer feature in device settings (Figure 12).
This feature allows the user to set intervals for how long
the backlight should remain on after the last user input.
The backlight timer can be adjusted from 5 seconds to
15 min. See page 22 for instructions on adjusting the
backlight level and timer.
Datalogging:
The P51-870 TITAN™ digital manifold can be used to gather and record live system readings for
later analysis. From the moment the device is powered on, it begins to record all current data
inputs including Pressure, Temperature, and Vacuum. The logging rate can be adjusted anytime
through the device settings menu (see Page 22).
6
Page 10
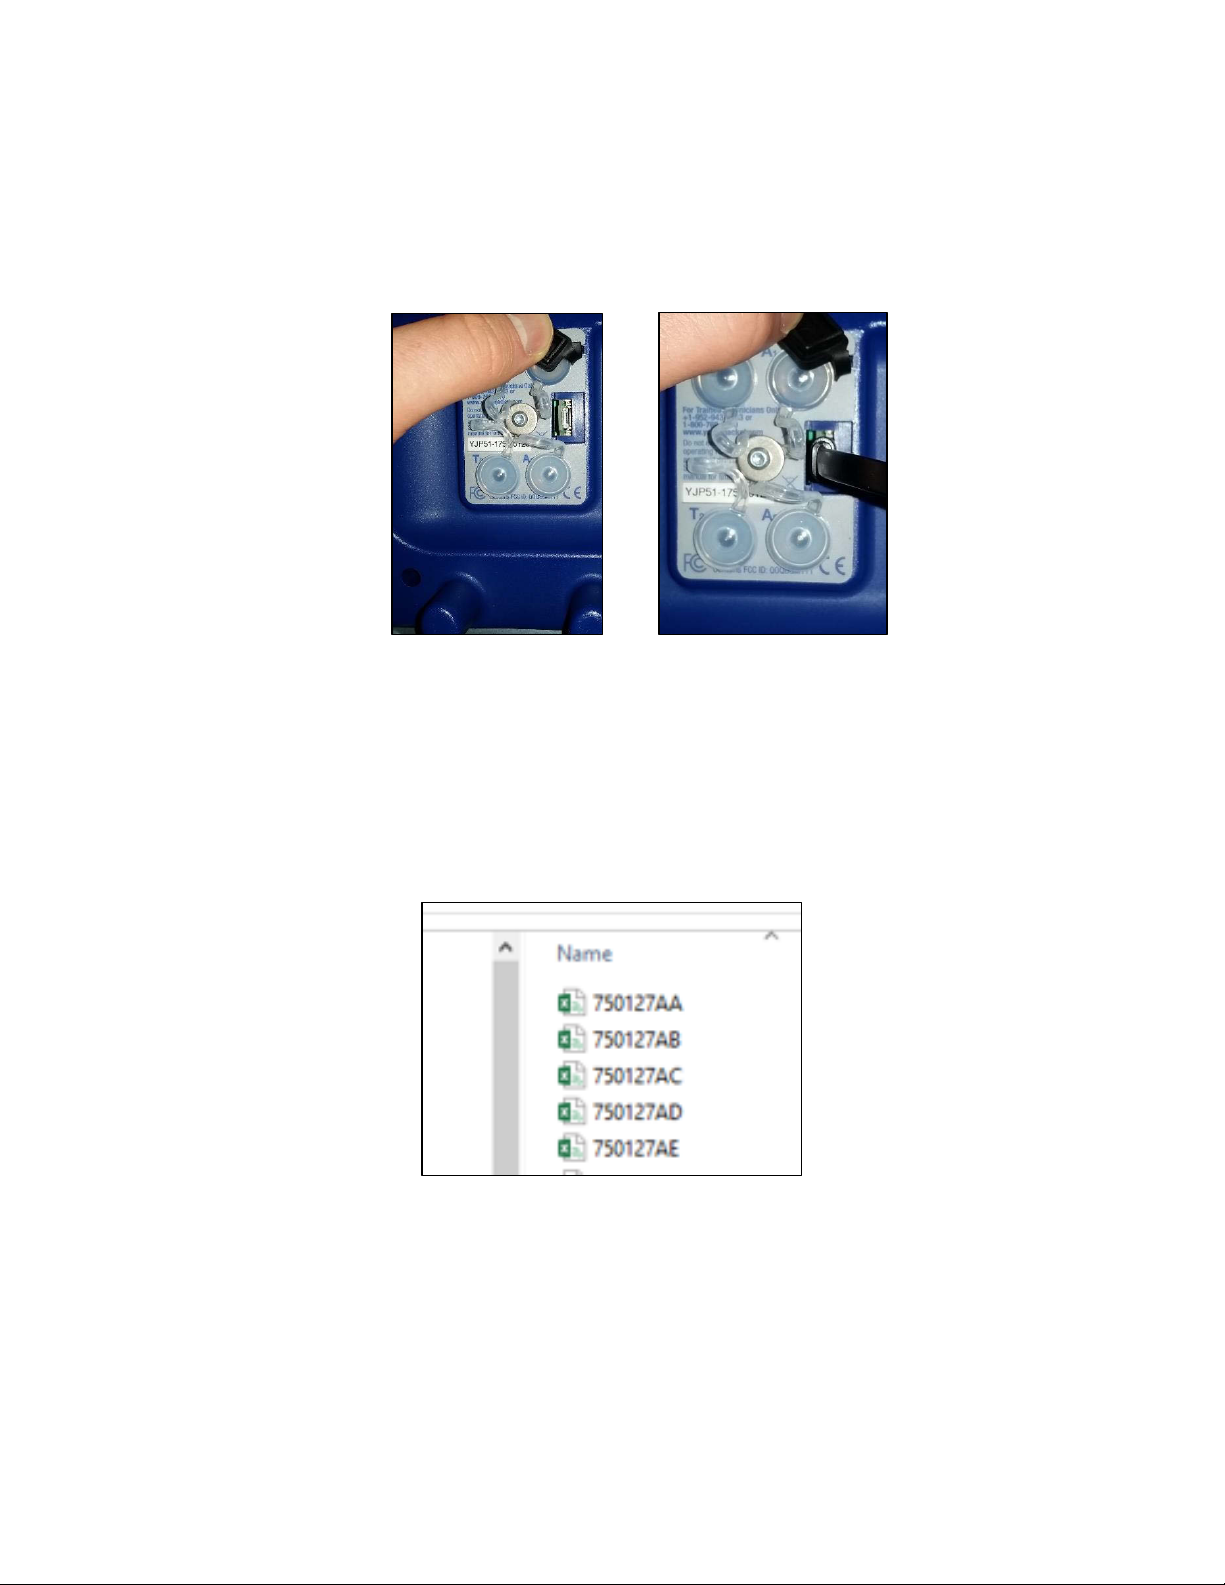
After completing a job, the datalog files can be accessed by connecting the instrument to a PC.
Figure 15: P51-870 as Removeable Drive
Figure 13: Micro-USB
Location
Figure 14: Connecting to
the Micro-USB
To connect the P51-870 TITAN™ to a PC, connect the provided data transfer cable to the microusb port on the back of device shown in Figures 13 and 14. Plug the opposite end into the usb
port on a PC. Ensure that the device is powered on, the PC will attempt to open the device as a
flash drive.
Datalog files are stored as .csv files and are named with the following date/time convention: last
number of year, work week, last three digits of serial number, letter convention preventing
duplicates. See Figure 15 for example of stored datalog files.
Ex. 50th week of 2017 with device serial number ending in 127, 4th datalog file; 750127AD
These files cannot be modified while stored on the device but can be copied from the drive to
the PC and modified using any application compatible with .csv files (Microsoft Excel, notepad,
etc.).
When the device is nearing full storage capacity, the device will prompt the user with remaining
datalog time at current sampling rate. Selecting “Yes” will clear all datalog files stored on the
device. If selecting “NO”, the device will proceed to normal startup and retain all stored datalog
7
Page 11

files. If the device reaches max storage and has not been cleared, it will cease to log data until all
files have been cleared from the device.
Interpreting the RGB LED:
The LED on the front face of the device can display a variety of colors during normal operation.
Below is a list of various colors and flashing schemes encountered during normal use.
• Flashing Blue: The P51-870 TITAN™ flashes blue every time it stores a datalog sample. If
the logging rate is set to a larger time increment, the LED will not flash blue as often.
• Flashing Red: When the device reaches low charge, or falls below 10% battery charge, the
LED will flash red every time a datalog sample is taken (at the same rate as flashing blue).
• Flashing Violet: The instrument will flash a violet color every 1 second when connected
and transmitting data via Bluetooth to a device.
• Solid Red/Blue: The LED will turn a solid red or blue when the power button is pressed
and held (usually when powering on/off). Powering on the device will display a solid blue
LED, powering off will display a solid red LED.
• Solid Green: The LED will remain a solid green color when connected to a power source
and charging. When the device reaches full charge, the solid green light will shut off
regardless if it remains connected to a power source.
• Solid Violet: If the instrument is placed into updater mode, the LED will turn a solid violet
color and the display will shut off (if the device is powered on). This mode is not intended
for normal use; to exit updater mode, hold the power button for 3 seconds or until the
LED powers off.
8
Page 12
Chapter 3:
Figure 16: Modes Menu
Modes of Operation
Modes Menu
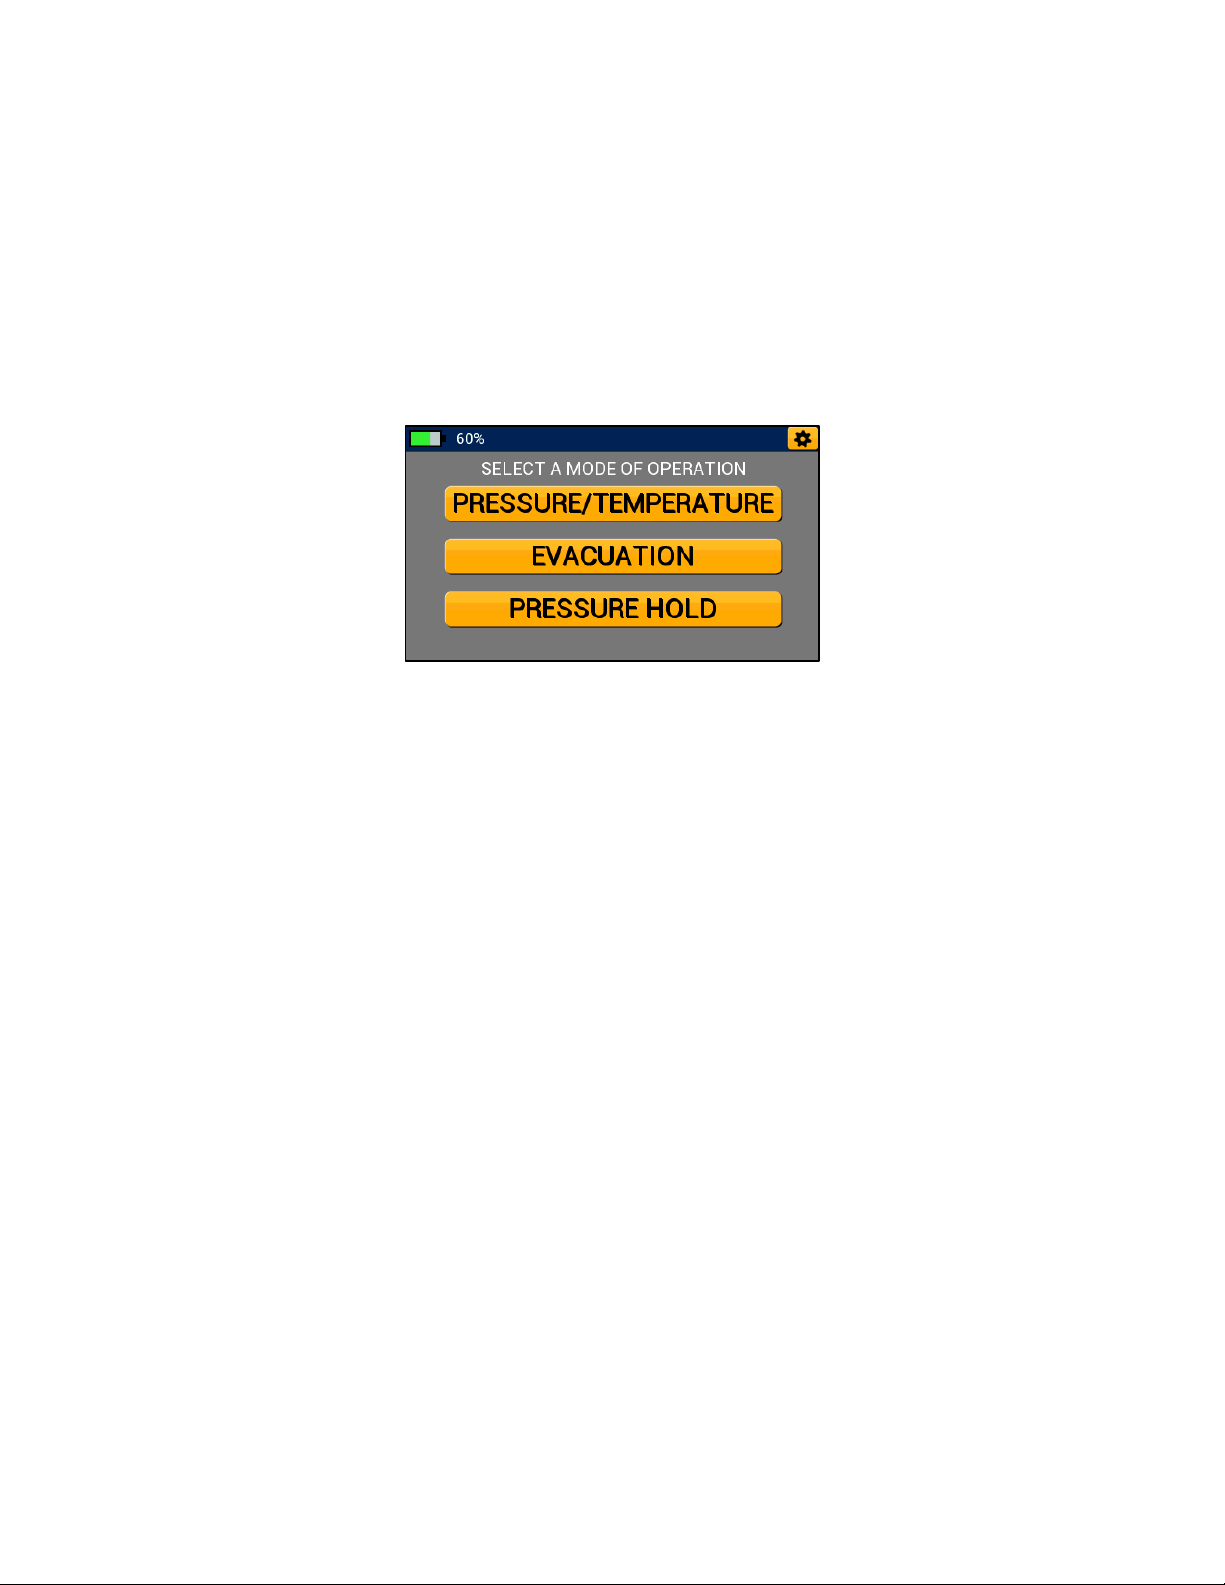
The P51-870 TITAN™ will always start up on the Modes Menu shown in Figure 16 below. Tap any
of the three buttons labeled “Pressure/Temperature, Evacuation, Pressure Hold” to start a
Pressure/Temperature, Evacuation, or Pressure Hold session respectively. The general settings
menu can be accessed by tapping the gear icon in the upper right-hand corner.
Pressure/Temperature Mode
Overview:
The P51-870 TITAN™ Pressure/Temperature mode can be used to accurately diagnose and
service any system with compatible refrigerant. Pressure/Temperature mode features high and
low side digital analog gauges that can be converted to a graphical form for superior data
evaluation. This mode can be used to monitor system high and low side pressure, system
temperature, vapor saturation and liquid saturation temperatures, and calculated system
superheat and subcool.
9
Page 13
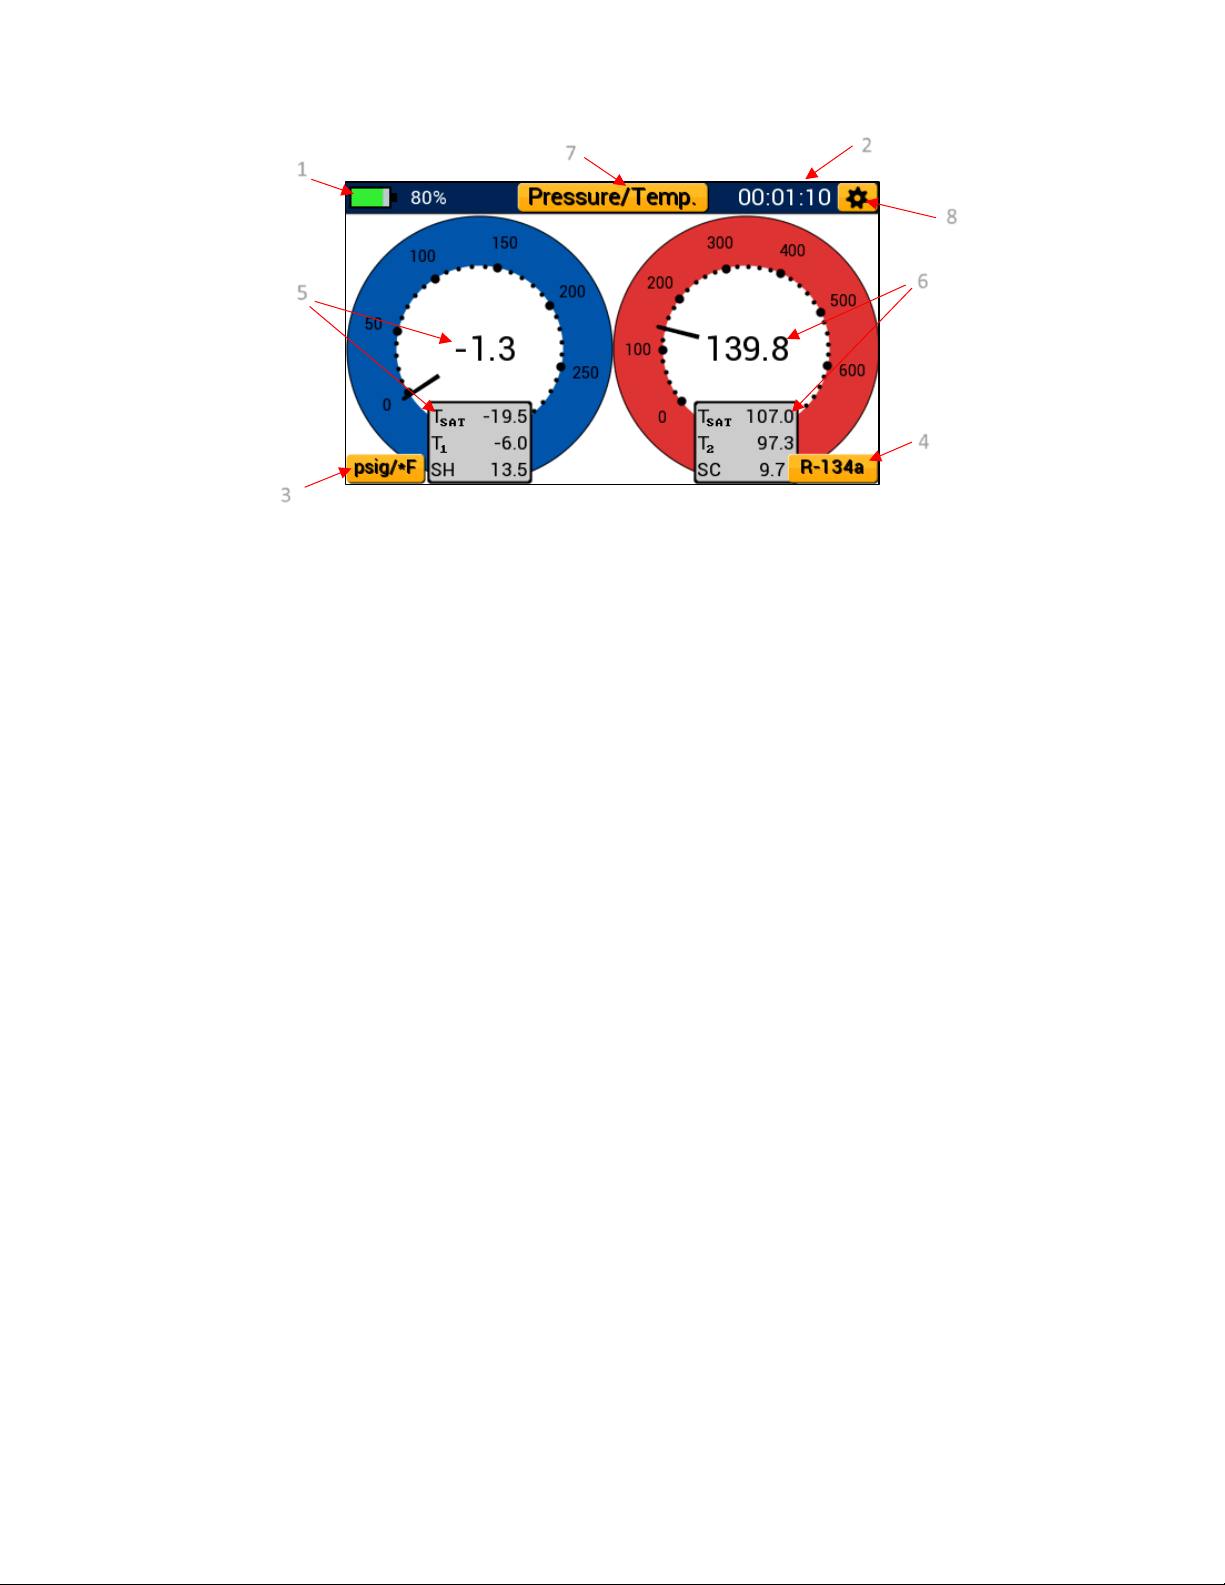
1. Battery Level Indicator
3
1
2
4
5 6 7
8
Figure 17: Pressure/Temperature Mode Diagram
2. Session Timer
3. Currently Selected Pressure & Temperature Units – Unit Settings Menu Shortcut
4. Currently Selected System Refrigerant – Refrigerant Settings Shortcut
5. Low Side Pressure & Temperature Measurement
6. High Side Pressure & Temperature Measurement
7. Current Mode Selection – Modes Menu Button
8. General Settings Button
Interpreting the Pressure Analog Gauges:
Pressure/Temperature mode features a set of fully functional digital analog pressure gauges.
Each gauge operates on a linear scale with minor divisions indicated by small dots and major
divisions by larger dots respectively. When adjusting the selected pressure unit, the gauge face
will update accordingly to reflect that unit of measure. High and low side pressure is displayed in
a digital format at the center of each blue and red analog gauge respectively. Each gauge needle
adjusts in real time and can be used to observe fluctuations in pressure as if utilizing a real analog
gauge. All temperature readings are conveniently displayed below each gauge as Tsat (saturation
Temperature), T1/T2 (system temperature), and SH/SC (superheat & subcool).
Interpreting the Pressure and Temperature Line Graphs:
Each digital analog gauge can be transformed into a line graph (shown in Figure 18) by tapping
anywhere within the center of the gauge. While in graph mode, both system pressure and
temperature are plotted on a linear scale and are denoted as P1/P2 and T1/T2. The pressure and
temperature graphs utilize an orange leader line to plot new data from left to right. Old data is
conveniently displayed to the right of the leader line such that it can be compared to newer data
10
Page 14
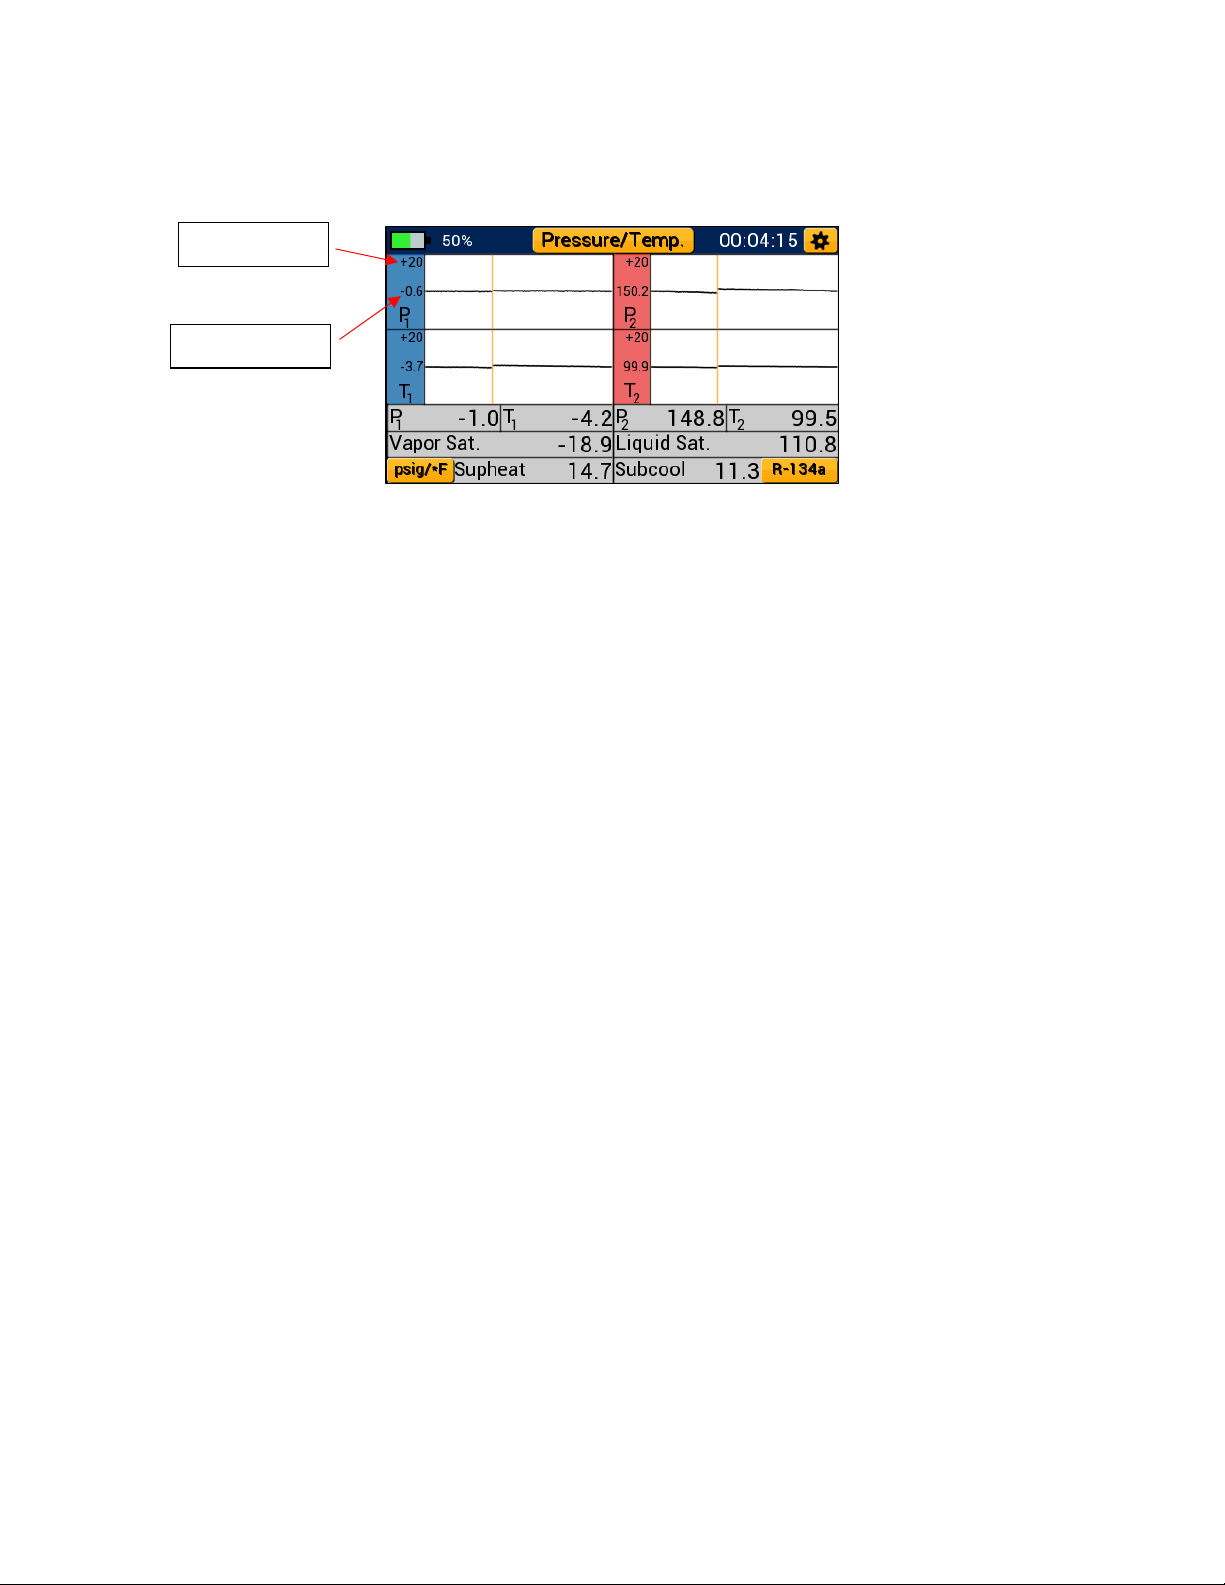
as it is recorded. Any old data will be replaced by newer data as the leader line advances to the
Central Value
Scaling Value
Figure 18: Pressure/Temperature Line Graphs
right, each graph completely overwrites every 100 seconds (approx. 1.5 minutes).
Each line graph centers on the first pressure or temperature measurement recorded when
beginning a new plot, this value is displayed adjacent to the plot line to the left of each graph.
Above this, a scaling value is displayed. The scaling value sets the upper and lower bound of each
graph based on the current central value.
Ex. First Reading = 150.2 psig
Scaling Value = 20 psi
Upper Boundary = 150.2 psig + 20 psi = 170.2 psig
Lower Boundary = 150.2 psig – 20 psi = 130.2 psig
While in line graph format, pressure, system temperature, saturation temperature and calculated
superheat and subcool are displayed in a table format below each set of graphs. Each graph can
be transformed back into a gauge at any time by tapping anywhere within the graph.
Operating Pressure/Temperature Mode:
While on any modes screen (or the modes menu), tap the settings icon in the upper right-hand
corner to access the general settings menu. Additionally, the unit settings and refrigerant settings
menus can be quickly accessed by tapping their respective buttons in the lower left and righthand corners respectively (or through the general settings menu). Finally, the modes menu can
be accessed by tapping the modes button at the top center of the display labeled with the current
mode of operation. The session timer displayed in the top right corner of the display begins to
increment the moment pressure/temperature mode is selected. Use the session timer to track
the length of a pressure/temperature session.
NOTE: Before connecting to the system, make sure to zero the pressure transducers at ambient
pressure to ensure accurate pressure readings. To read about the transducer zeroing process,
see page 20.
11
Page 15
Evacuation Mode
1
2
3
4
5
6
7
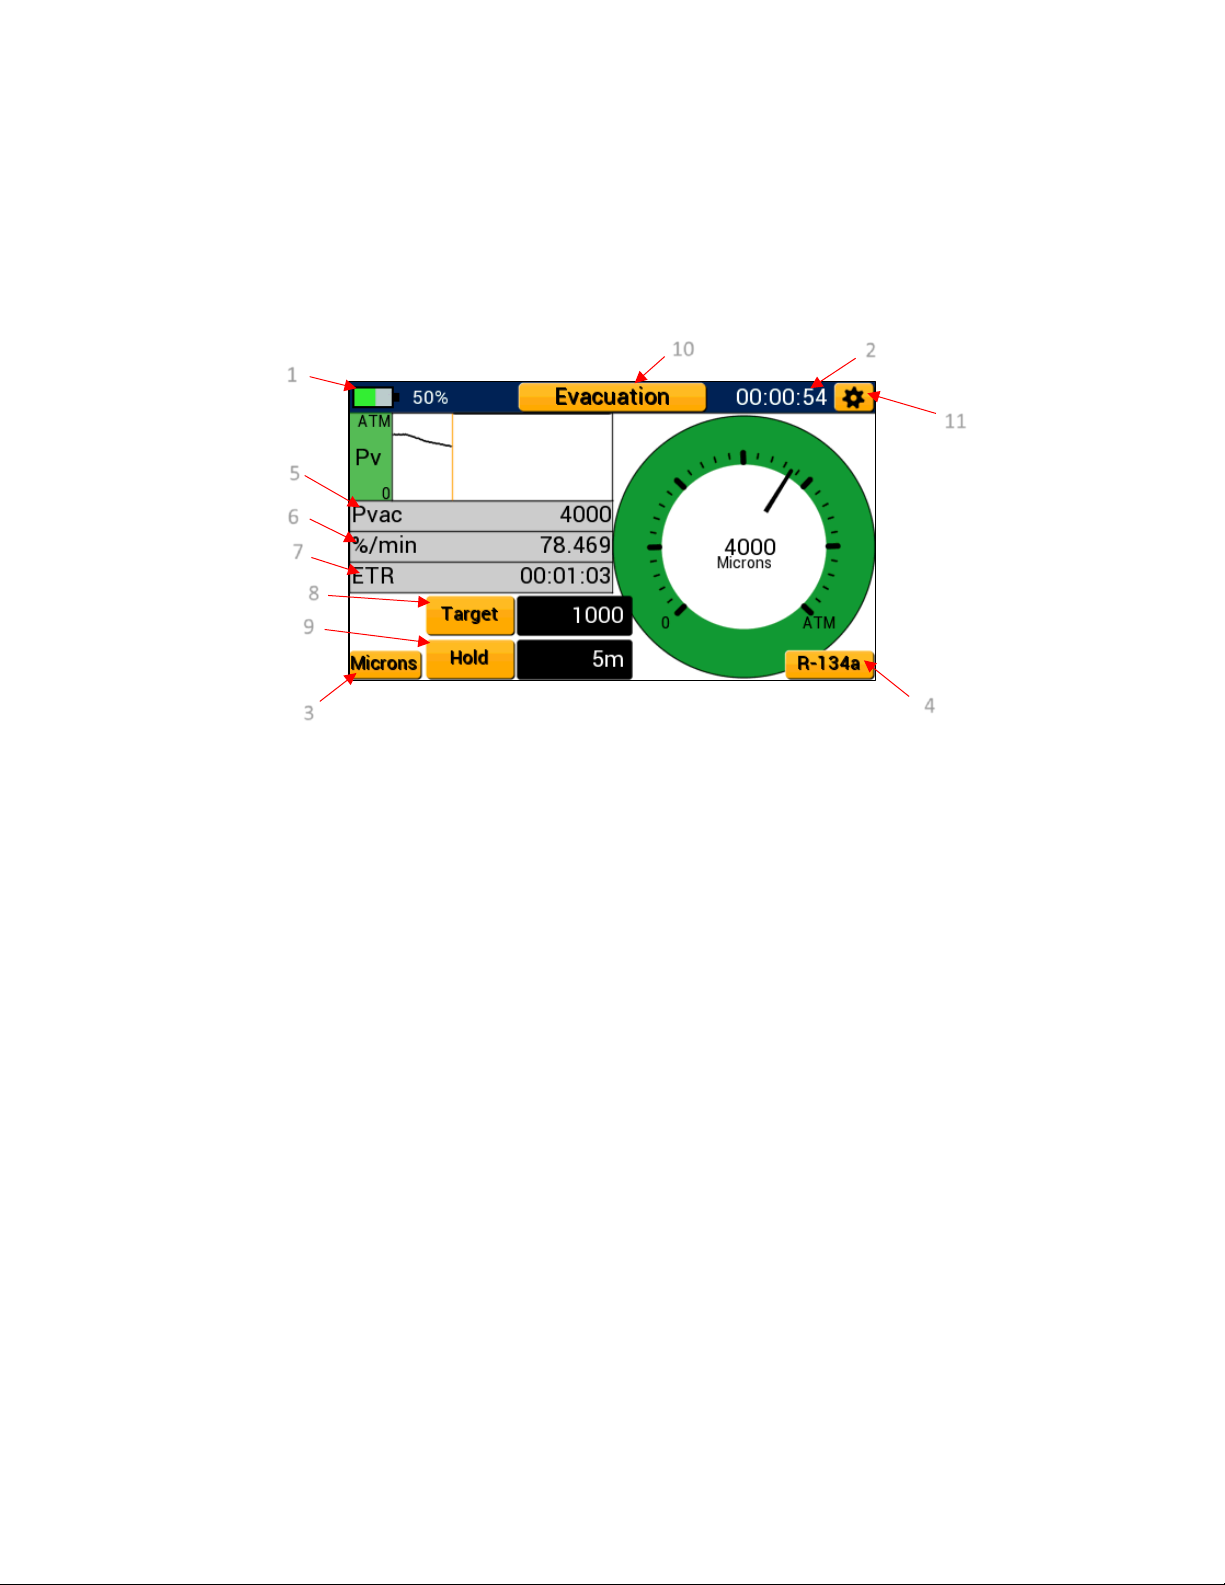
Figure 19: Evacuation Mode Diagram
8
9
10
11
Overview:
Once the refrigerant has been recovered from the system, the P51-870 TITAN™ can be used to
accurately monitor the system evacuation. Evacuation mode displays the current vacuum
pressure in digital, analog, and graphical form, percent change per minute, estimated time
remaining, target vacuum level, and the vacuum hold timer.
1. Battery Level Indicator
2. Session Timer
3. Currently Selected Vacuum Unit – Unit Settings Menu Shortcut
4. Currently Selected Refrigerant – Refrigerant Settings Menu Shortcut
5. System Vacuum Pressure
6. Percent Change per Min.
7. Estimated Time Remaining
8. Target Vacuum Level Button
9. Vacuum Hold Timer Button
10. Modes Menu Button
11. General Settings Button
System vacuum pressure is displayed in real time as a digital representation as denoted by Pvac,
analog as represented by the green analog gauge, and a graphical format as a logarithmic line
graph. While evacuating the system, the P51-870 TITAN™ will display 100000microns from
atmosphere down to the 100000micron vacuum level after which it will accurately measure and
display down to 5 microns.
Interpreting the Evacuation Gauge:
Evacuation mode features a fully functional digital analog vacuum gauge on the right side of the
display. The evacuation gauge operates on a logarithmic scale from atmosphere (ATM) to 0
microns. A digital reading and currently selected vacuum units are displayed at the center of the
gauge. The needle of the evacuation adjusts in real time and can be used to visualize fluctuations
12
Page 16

in vacuum pressure during a system evacuation. Because the evacuation operates on a
logarithmic scale, the resolution of the needle movement increases in a deeper vacuum meaning
small fluctuations in vacuum pressure become more apparent in a deeper vacuum.
Interpreting the Evacuation Graph:
In addition to the evacuation gauge, evacuation mode also features a fully functional evacuation
line graph like those in Pressure/Temperature mode. Unlike the pressure and temperature
graphs, the evacuation graph features a logarithmic y-axis. This means that the evacuation graph
captures the full scale of an evacuation but is more precise in a deep vacuum allowing the user
to observe small fluctuations in vacuum pressure. An orange leader line is used to plot new data
from left to right. This function allows the user to compare old data to newer data as each
measurement is recorded and displayed. The line graph fully overwrites the old data every 200
seconds (approx. 3.5 minutes) and will begin again from the left side of the graph.
Operating the Evacuation Mode:
Before beginning an evacuation, connect the YJ vacuum probe (67030) to either the A1 or A2
connectors on the back of the device. Connect the vacuum probe to the system at a sufficient
distance from the vacuum pump such that it will not disturb the vacuum reading. Use the
“Target” and “Hold” buttons to set the target vacuum level and vacuum hold timer respectively.
Pressing each of these buttons will cycle between a range of available values, with the last value
selected being automatically saved. Target vacuum level can be adjusted in 6 increments: 200,
300, 400, 500, 750, 1000microns (or equivalent selected vacuum unit). Vacuum hold timer can
be adjusted in 7 increments: 1m, 3m, 5m, 10m, 15m, 30m, None.
The session timer, displayed in the top right corner will begin incrementing the moment
evacuation mode is entered. Use the session timer to monitor the overall length of the
evacuation session. While evacuating a system the %/min will change to reflect the current %
change in vacuum pressure every minute. A larger number will indicate a faster evacuation rate
than a lower number. Additionally, the estimated time remaining is denoted by ETR and will
adjust based on the current %/min and the target vacuum level setting.
Once the set target vacuum level has been reached, the vacuum hold timer will start to deplete.
When the hold timer reaches zero, an alarm will sound indicating the evacuation has been
completed. In addition, the user will be prompted to start a pressure hold test as shown in Figure
20. By tapping the button “Begin Pressure Hold Test?” the user will be taken to the pressure rise
setup screen and the alarm will be silenced. If the button is not selected, the user will remain on
the evacuation screen. To silence the alarm, adjust the desired target vacuum level and continue
13
Page 17
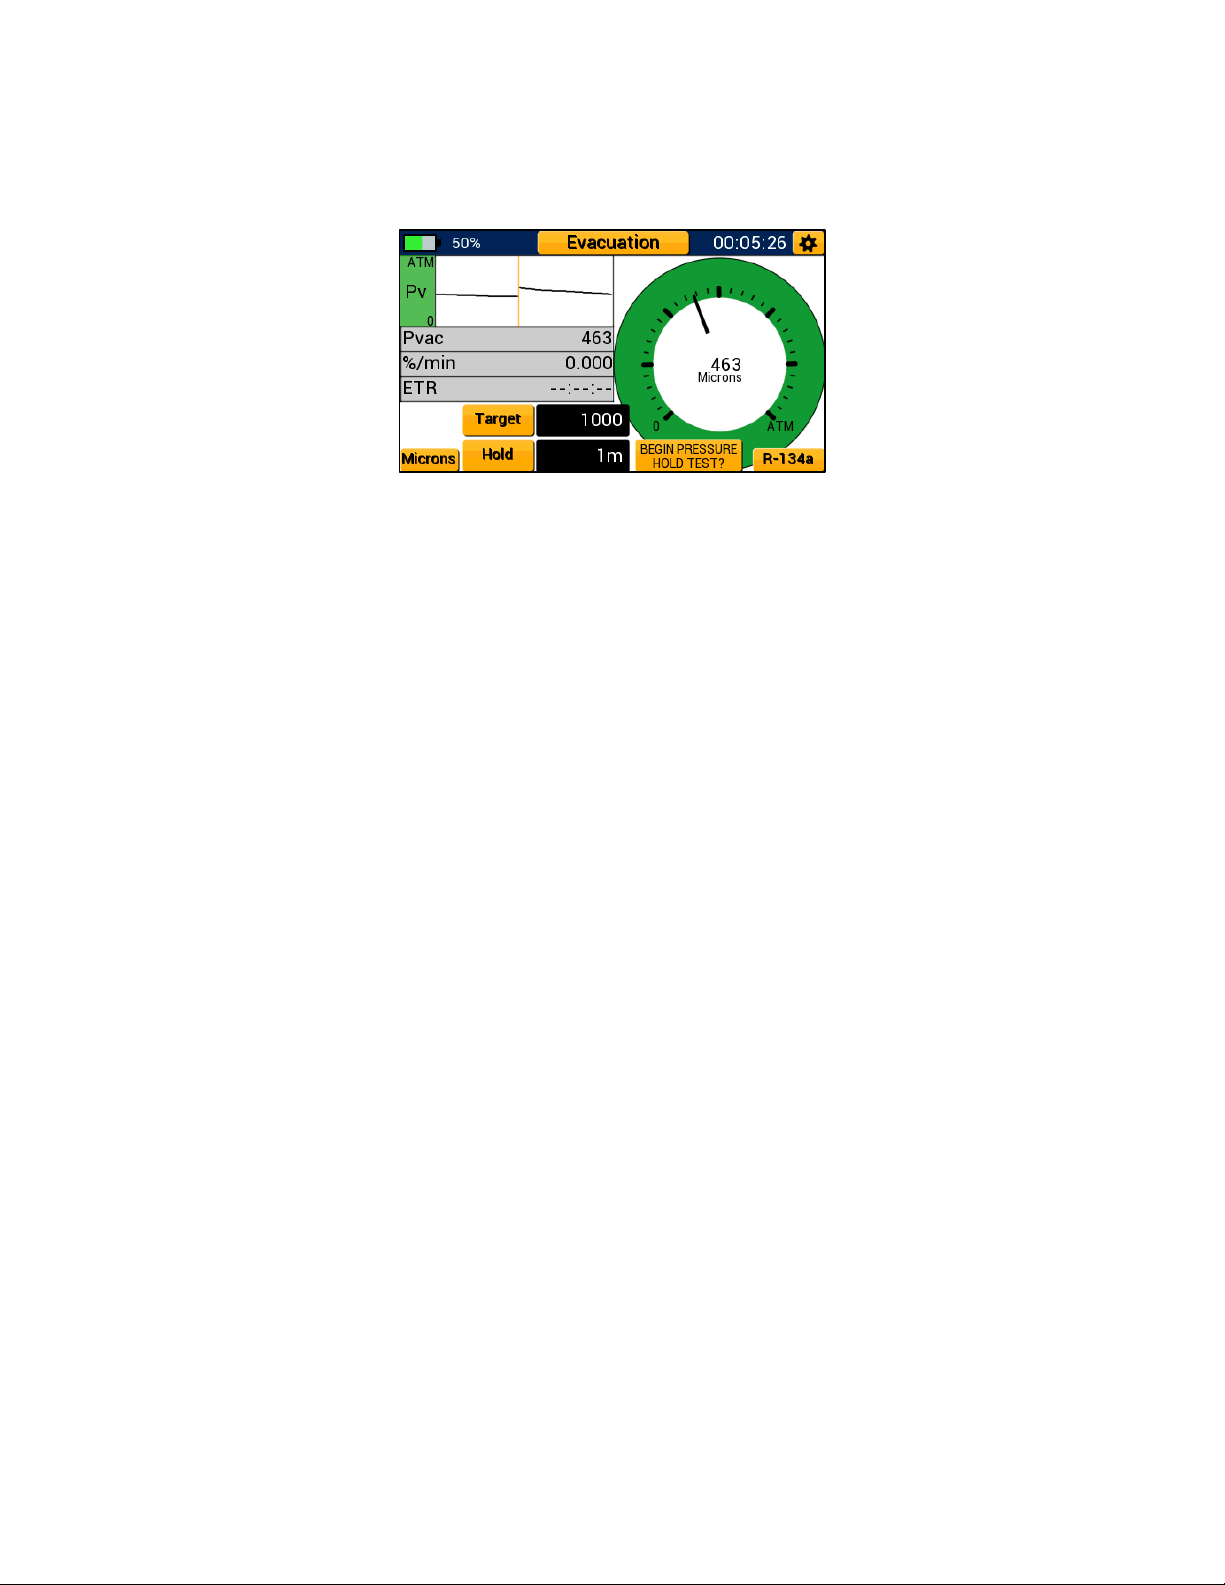
the evacuation or select a new mode of operation. If the vacuum hold timer is not desired, simply
Figure 20: Evacuation - Pressure Hold Test Prompt
tap the Hold button until NONE is displayed.
NOTE: Using the vacuum hold timer can help to ensure that all refrigerant has been evacuated
from the system and the system is free of non-condensables. Refrigerant and non-condensables
can cause the vacuum level to rise in a system giving a false positive during a leak test when no
leak is present.
Pressure Hold Mode – Pressure Decay Test
Overview:
The P51-870 TITAN™ can be used to monitor a system leak through a drop in positive pressure.
The pressure decay test displays the current system pressure (Pc), the initial pressure (Pi), the
change in pressure (Pi-Pc), the Limit Pressure (Limit), and the Rate of Change (%/min).
14
Page 18
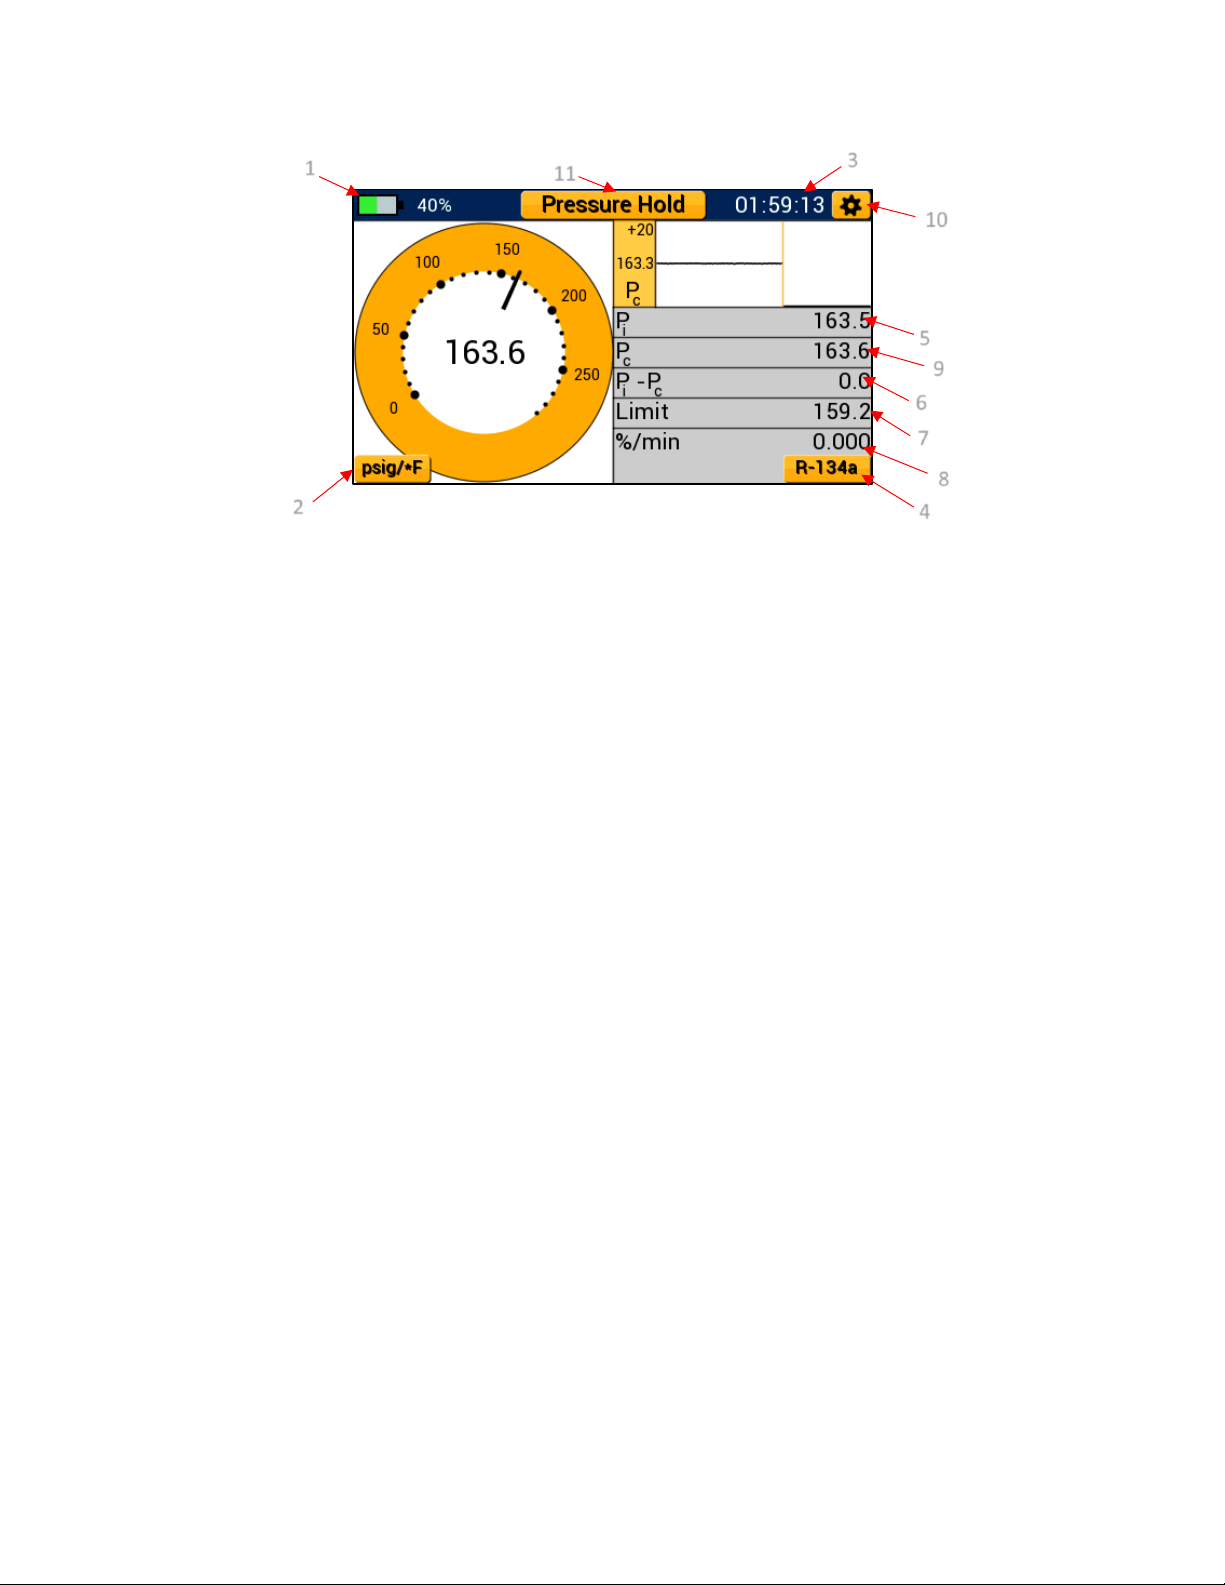
1. Battery Indicator
Figure 21: Pressure Hold – Pressure Decay
Test Diagram
1 2 3 4 5 6 7
10
11
9
8
2. Currently Selected Units – Unit Settings Menu Shortcut
3. Hold Timer
4. Currently Selected Refrigerant – Refrigerant Settings Menu Shortcut
5. Initial Pressure (Pi)
6. Change in Pressure (Pi-Pc)
7. Pressure Limit (Limit)
8. Rate of Change (%/min)
9. Current System Pressure (Pc)
10. General Settings Button
11. Currently Selected Mode – Modes Button
Live system pressure is measured and compared to initial pressure readings to determine if the
system has lost pressure over time. Current system pressure is displayed as a digital analog gauge,
a line graph, and in a digital format displayed at the center of the analog gauge.
Interpreting the Pressure Decay Gauge:
Pressure Decay mode features a digital analog pressure gauge on the left of the display. This
gauge operates on a linear scale with minor divisions displayed as small dots and major divisions
displayed as larger dots respectively. The current system pressure is displayed in a digital format
at the center of the analog gauge. Both the current pressure measurement and gauge face will
update to reflect the currently selected pressure unit. The needle of the pressure decay gauge
adjusts in real time and can be used to visualize any fluctuations in system pressure as if using a
real analog gauge.
Interpreting the Pressure Decay Graph:
Pressure Decay mode also features a line graph which plots current system pressure readings in
real time. System pressure is plotted on a linear scale and is denoted as Pc. The current system
pressure graph utilizes an orange leader to line to plot new data from left to right. Old data is
conveniently displayed to the right of the leader line such that it can be compared to newer data.
15
Page 19
Any old data will be replaced by newer data as the leader line advances to the right, the line
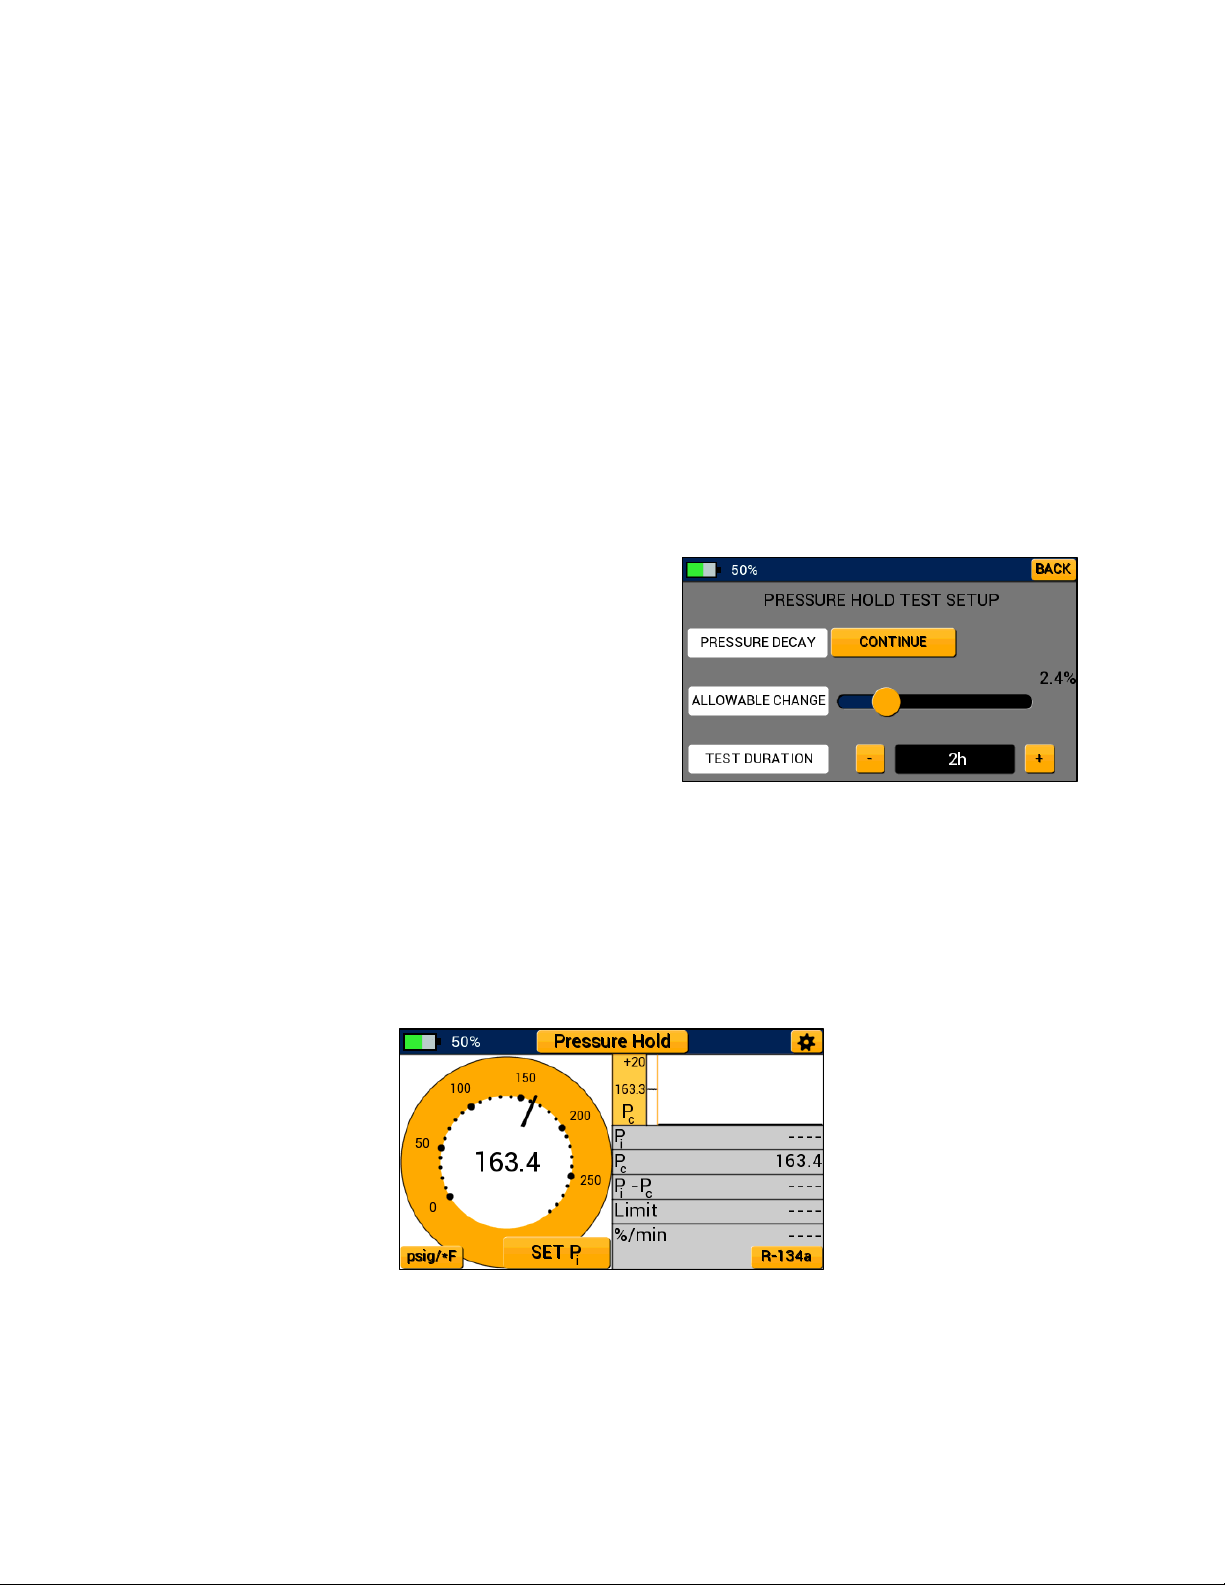
Figure 22: Pressure Decay Test Setup Menu
Figure 23: Pressure Decay Test – Set Pi
graph will completely overwrite every 200 seconds (approx. 3.5 minutes).
The line graph centers on the first pressure measurement recorded when beginning a new plot,
this value is displayed adjacent to the plot line to the left of the graph. Above this, a scaling value
is displayed. The scaling value sets the upper and lower bound of the graph based on the current
central value.
Ex. First Reading = 163.3 psig
Scaling Value = 20 psi
Upper Boundary = 163.3 psig + 20 psi = 183.3 psig
Lower Boundary = 163.3 psig – 20 psi = 143.3 psig
Operating the Pressure Decay Mode:
To conduct a pressure decay test, select “Pressure
Hold” from the modes menu, the device will advance
to the pressure hold test setup menu seen in Figure
22. This menu allows the user to adjust the allowable
change in pressure and pressure decay test duration.
Allowable change is measured as a percent of the
initial system pressure the system can drop before
the P51-870 TITAN™ deems the pressure decay test a
failure. To adjust the allowable change percent, drag the slider bar until the desired percent
change is displayed. The test duration sets the length of time the pressure decay test will be
conducted. If the pressure has not dropped below the limit pressure within the test duration, the
P51-870 TITAN™ deems the pressure decay test a pass. Tap the + and – buttons to adjust the test
duration value. When all desired settings have been set, select the continue button to advance
to the pressure decay test. The Back button can be used to return to the modes menu.
Ensure the system is properly charged to the desired test pressure and is connected to the
manifold low side transducer. Once the system is ready for the pressure decay test, tap the Set
Pi button to begin the test (shown in Figure 23). The current system pressure will be stored as Pi
and is displayed within the table directly below the pressure decay graph.
16
Page 20
During the pressure decay test, Pc will adjust as the current system pressure changes. Pi-Pc will
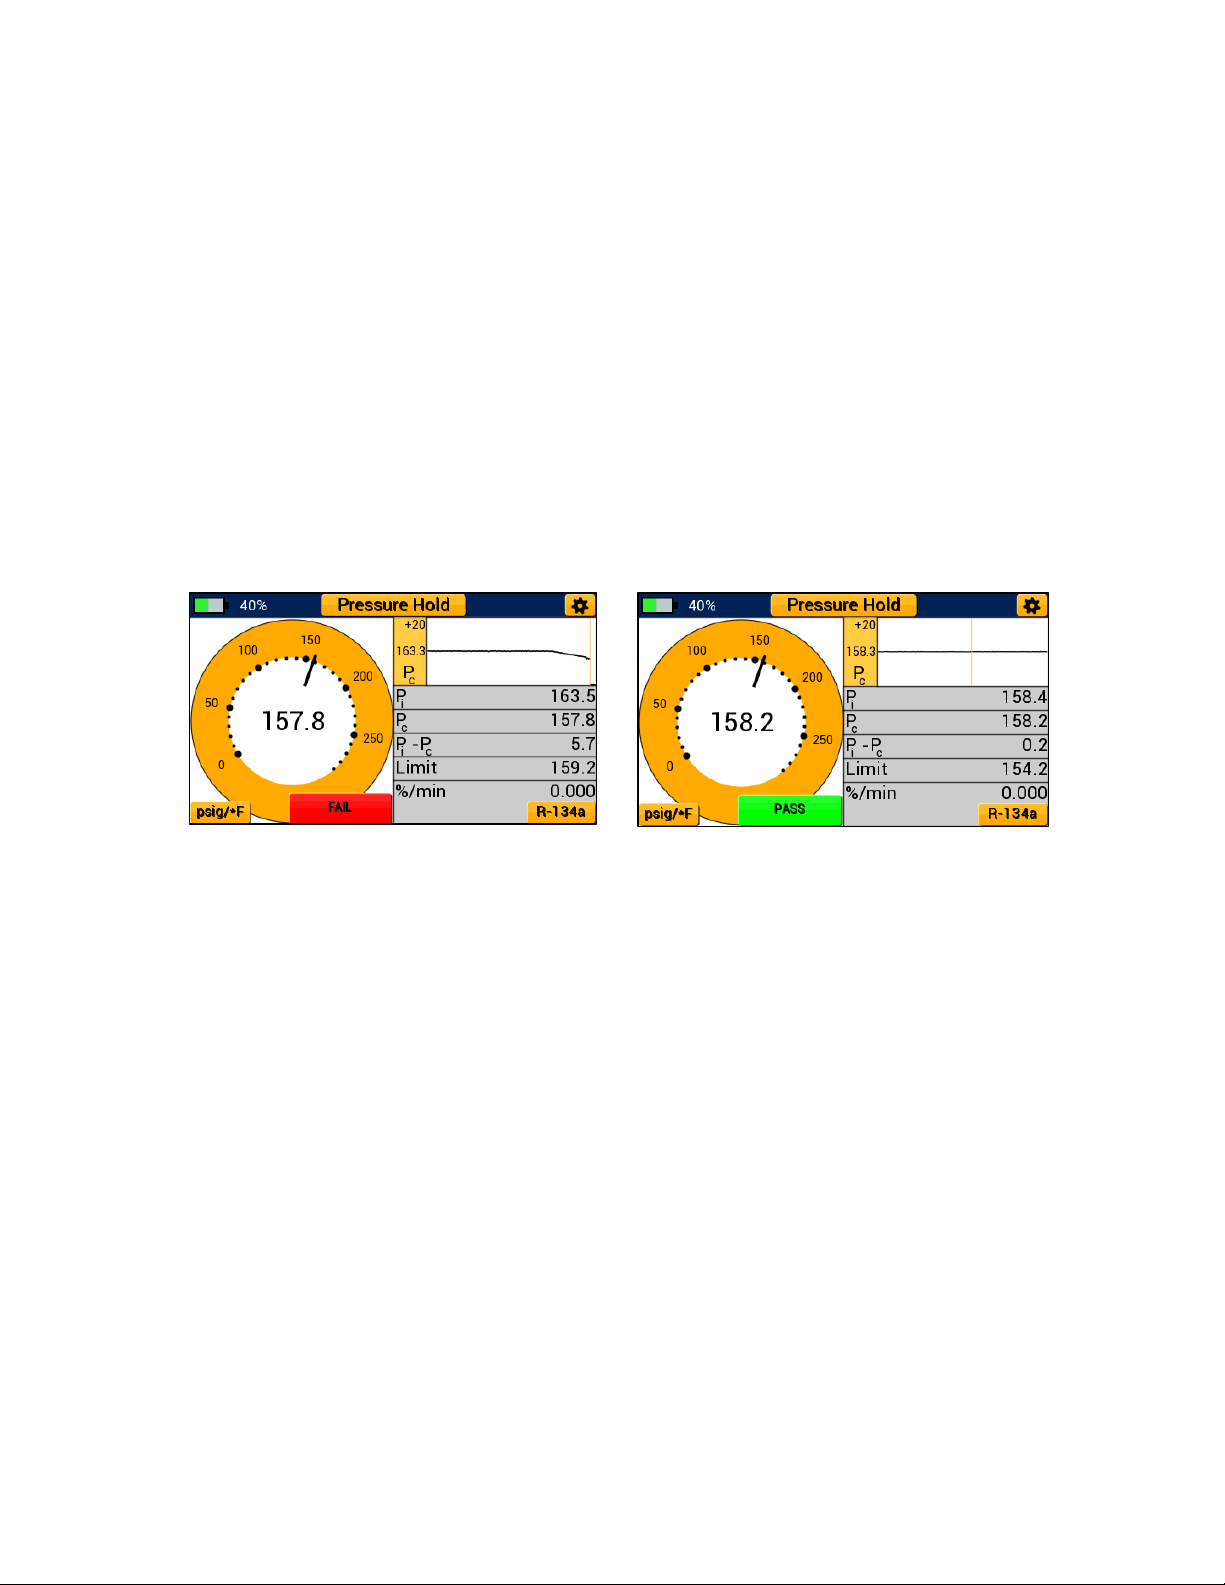
Figure 24: Pressure Decay Test - FAIL
Figure 25: Pressure Decay Test - PASS
adjust to reflect the change between the initial system pressure and current system pressure.
Limit will display the limit pressure as determined by the percent allowable change. System
pressure dropping below this value within the time limit as set by the test duration will trigger a
failure. The rate of change as denoted by %/min displays the percent change in system pressure
per minute. A large leak will be indicated by a larger %/min value, conversely a smaller %/min
indicates a small system leak.
If the system pressure falls below the limit pressure within the test time limits, the P51-870
TITAN™ will display a “FAIL” notice (Figure 24) and the buzzer will sound indicating the test is
complete. To silence the buzzer, exit the pressure decay test by selecting the modes button. If
the pressure decay test ends before the system pressure falls below the limit pressure, the device
will display a “PASS” notice and the buzzer will sound indicating the test is complete (Figure 25).
Pressure Hold Mode - Pressure Rise Test
Overview:
Pressure hold mode can also be used to monitor the system for a rise in vacuum pressure. A
pressure rise test can be helpful to determine if the system has a leak or there are noncondensables and refrigerant remaining within the system. The pressure rise test displays the
current system vacuum pressure (Pvac), the percent change per minute (%/min), the initial
pressure (Pi), the Limit pressure and test duration.
17
Page 21
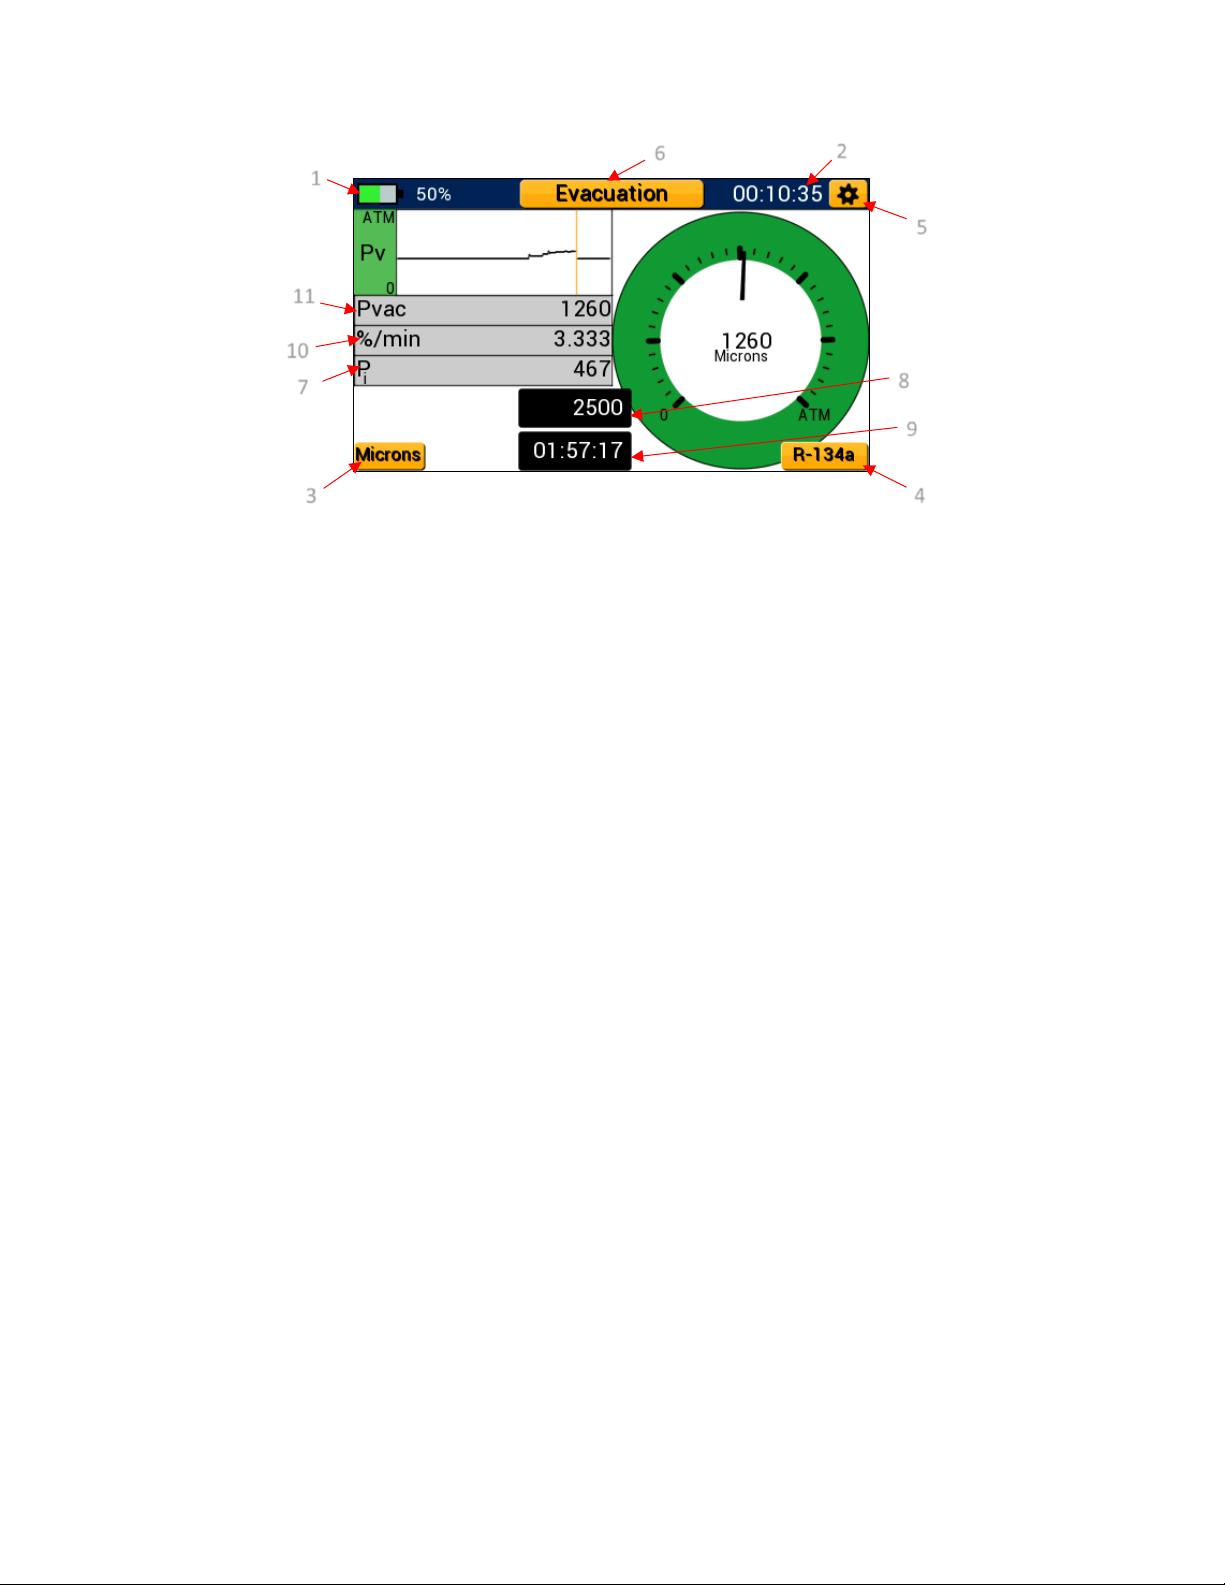
1. Battery Life Indicator
Figure 26: Pressure Hold Mode – Pressure Rise Test Diagram
1
2
3
4
5 6 7
8 9 10
11
2. Session Timer
3. Currently Selected Vacuum Units – Unit Settings Menu Shortcut
4. Currently Selected Refrigerant – Refrigerant Settings Menu Shortcut
5. General Settings Button
6. Currently Selected Mode – Modes Menu Button
7. Initial Pressure (Pi)
8. Pressure Limit
9. Test Duration
10. Percent Change per minute (%/min)
11. Current System Vacuum Pressure (Pvac)
Live system vacuum pressure is measured and compared to initial vacuum pressure readings to
determine if the system has gained pressure over time. Current system vacuum pressure is
displayed as a digital analog gauge, a line graph, and in a digital format displayed at the center of
the analog gauge.
Interpreting the Pressure Rise Gauge:
The pressure rise test features the same fully functional digital analog vacuum gauge as
evacuation mode. The pressure rise gauge operates on a logarithmic scale from atmosphere
(ATM) to 0 microns. A digital reading and currently selected vacuum units are displayed at the
center of the gauge. The needle of the pressure rise gauge adjusts in real time and can be used
to visualize fluctuations in vacuum pressure during a pressure rise test.
Interpreting the Pressure Rise Graph:
In addition to the pressure rise gauge, the pressure rise test also features the same line graph as
evacuation mode. The pressure rise graph plots in real time and features a logarithmic y-axis.
This means that the pressure rise graph captures the full scale from atmosphere to deep vacuum
but features more precision in a deeper vacuum. An orange leader line is used to plot new data
from left to right. This function allows the user to compare old data to newer data as each
18
Page 22
measurement is plotted. The line graph fully overwrites the old data every 200 seconds (approx.
Figure 27: Pressure Rise Setup Menu
3.5 minutes) and will begin again from the left side of the graph.
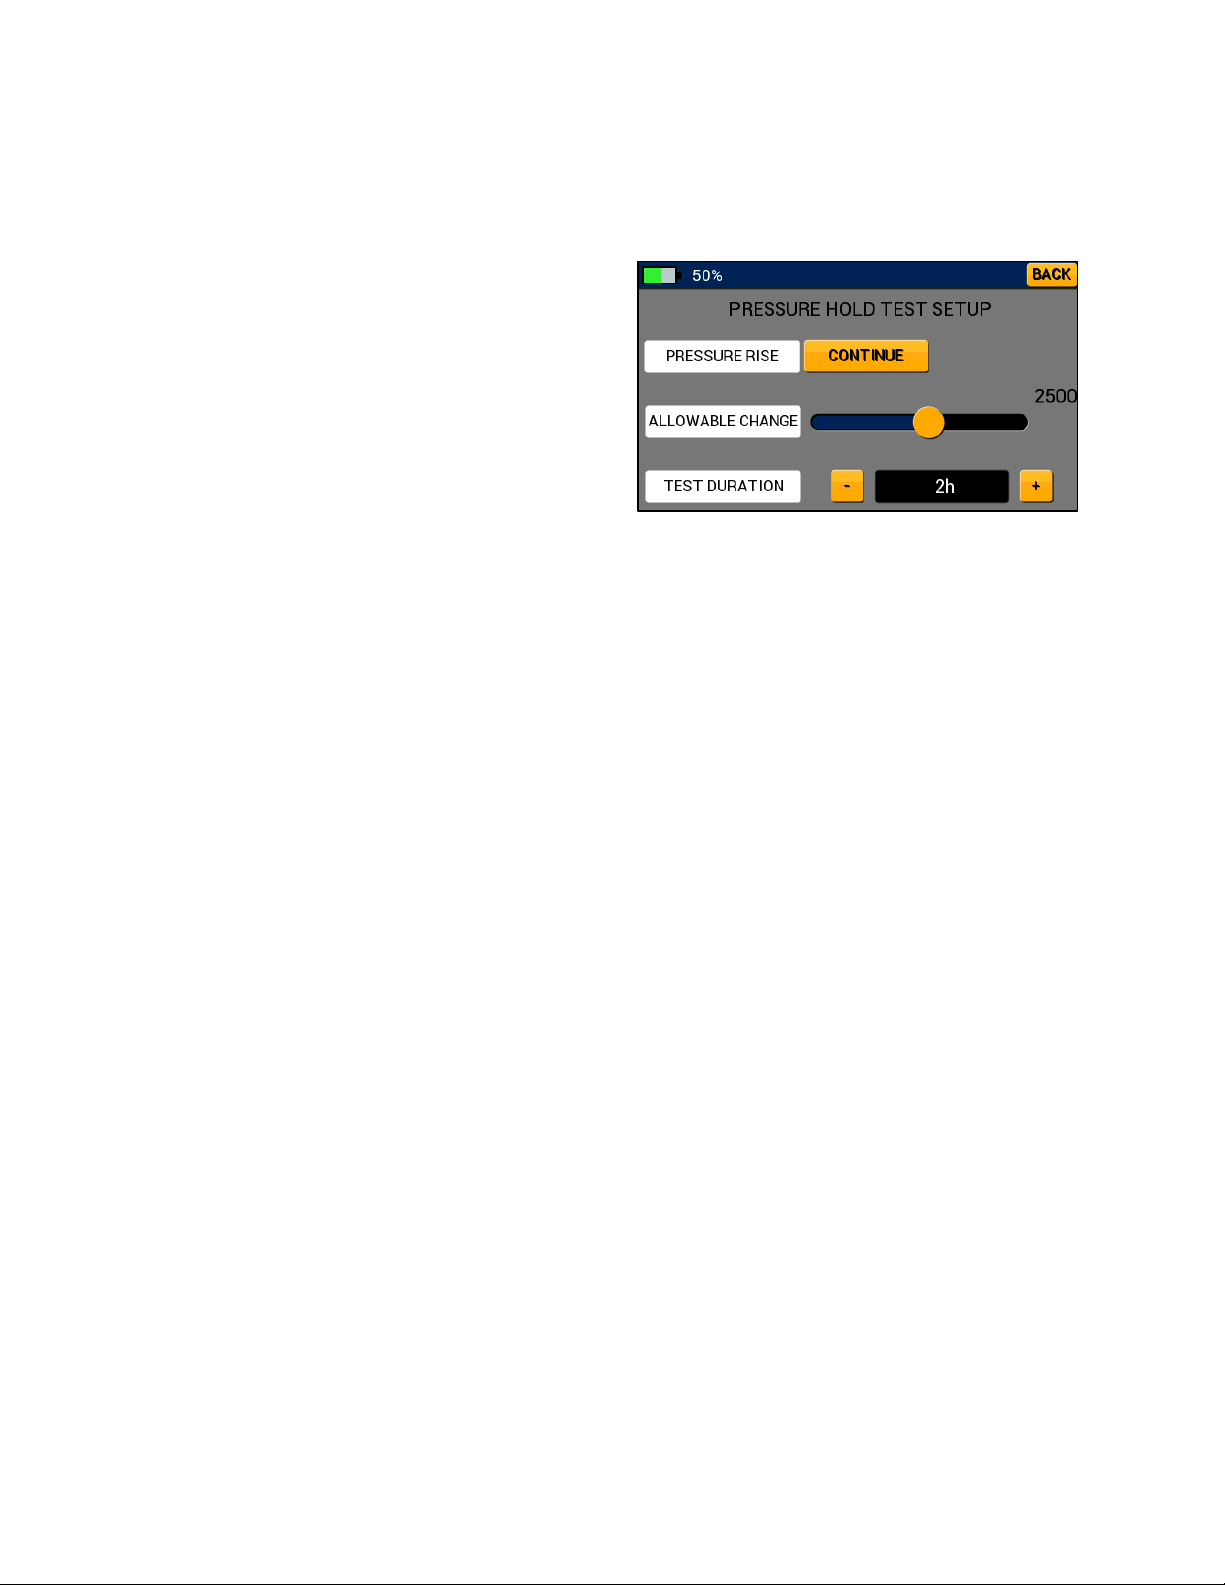
Operating the Pressure Rise Test:
The pressure rise test can be accessed through
completion of an evacuation (See page 13). Once
the evacuation has been completed, the device
prompts the user to conduct a pressure hold test.
If the button is selected, the user will be brought
to the pressure rise test setup screen shown in
Figure 27. The pressure rise setup screen allows
the user to adjust the allowable vacuum pressure
(allowable change) and test duration.
Allowable change sets the maximum allowable system vacuum pressure above which the P51870 TITAN™ will indicate a failure. Tap and drag the slider bar to adjust the allowable vacuum
pressure until the desired value is displayed. The test duration sets the length of time the
pressure rise test will be conducted. If the system vacuum pressure has not risen above the limit
pressure within the test duration, the P51-870 TITAN™ deems the pressure rise test a pass. Tap
the + and – buttons to adjust the test duration value. When all desired settings have been set,
select the continue button to advance to the pressure rise test. The back button can be used to
return to the previous evacuation screen.
After selecting the continue button, the pressure rise test commences immediately setting the
current vacuum pressure as the initial system pressure. During the pressure rise test, current
system vacuum pressure (Pvac) will be monitored and compared to the limit pressure (Set by
allowable change). The session timer will continue to increment from the previous evacuation
through the pressure rise test. The percent change per minute (%/min) will display the change in
system vacuum pressure every minute. A large %/min value indicates a rapid change in pressure,
conversely small value indicates a small fluctuation in vacuum pressure. The test duration timer
will continue to deplete until the pressure rise test is complete.
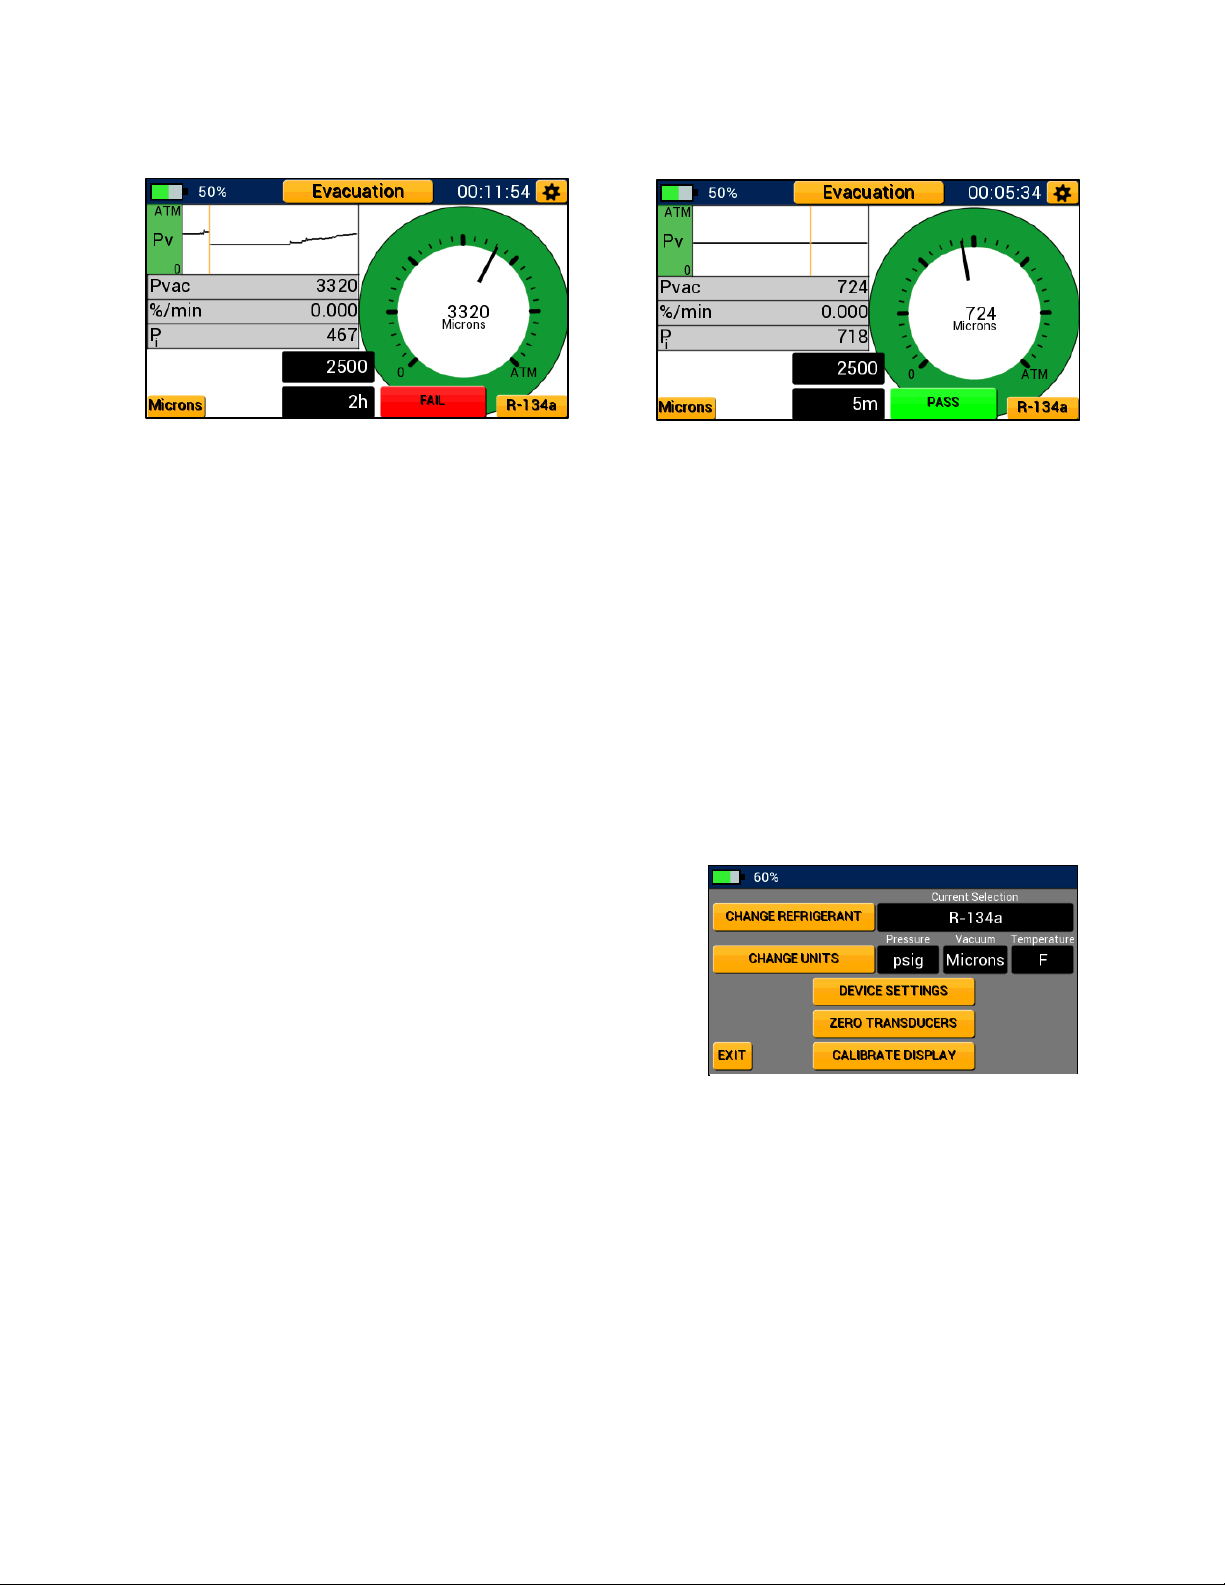
If Pvac rises above the limit pressure within the time limit set by test duration, the device will
indicate a “FAIL” and the buzzer will sound (Figure 28). To silence the buzzer, exit the pressure
rise test by selecting the modes menu button. If test duration timer fully depletes before Pvac
rises above the limit pressure, the device will indicate a “PASS” and the buzzer will sound to
indicate the test is complete (Figure 29).
19
Page 23
Chapter 4:
Figure 28: Pressure Rise Test - FAIL
Figure 29: Pressure Rise Test - PASS
Figure 30: General Settings Menu
Settings
Settings Menus Overview
The P51-870 TITAN™ settings menus are separated into four menus: unit settings, refrigerant
settings, device settings, and general settings. While on any modes screen or the modes menu,
the general settings menu can be quickly accessed by tapping the gear icon in the top right corner.
Unit and refrigerant settings can also be accessed by tapping the buttons in the bottom left and
right-hand corners of each modes screen.
General Settings Menu
The general settings menu, shown in Figure 30, allows
the user to adjust system refrigerant, enter the units and
device settings menus, zero the pressure transducers,
and calibrate the touchscreen display. To access either
the units or device settings menus, tap on the
appropriate button. The exit button in the bottom left
corner can be used to return to the previous screen at
any time.
Zeroing the Pressure Transducers:
To ensure accurate pressure readings, the pressure transducers should be re-zeroed before every
job. To correctly zero the pressure transducers, first remove any pressure from the manifold and
ensure all knobs are open such that the manifold is at current atmospheric pressure. Next,
navigate to the general settings menu and tap the “Zero Transducers” button.
If the zeroing was successful, the button will flash green. If the zeroing was unsuccessful the
button will flash red. A common issue when zeroing transducers is residual positive pressure
within the manifold. The P51-870 TITAN™ will not zero transducers if the manifold contains
pressure exceeding 30 psia.
20
Page 24
Calibrating the Touchscreen:
Figure 31: Refrigerant Settings Menu
Figure 32: Unit Settings Menu
If the touchscreen seems unresponsive or poorly aligned, it may benefit to re-calibrate the
display. The touchscreen display can be re-calibrated one of two ways: through the general
settings menu or interaction with the power button. To calibrate the display through the general
settings menu, navigate to the general settings menu and tap the “Calibrate Display” button.
Follow the onscreen prompts to power the device off and on. When the device has been powered
on it will prompt calibration. Tap the three flashing dots as they appear on the screen.
To calibrate the display through interaction with the power button, when the device is powered
on, press the power button three times in quick succession (this should power the device off).
Power the device back on and it will prompt calibration. As before, tap the three flashing dots as
they appear on the screen. When the calibration is complete the device will startup normally.
NOTE: Once the calibration has been prompted, you cannot return. The display must be recalibrated to continue normal operation. Using a fine tipped stylus can help to increase the
accuracy of the calibration.
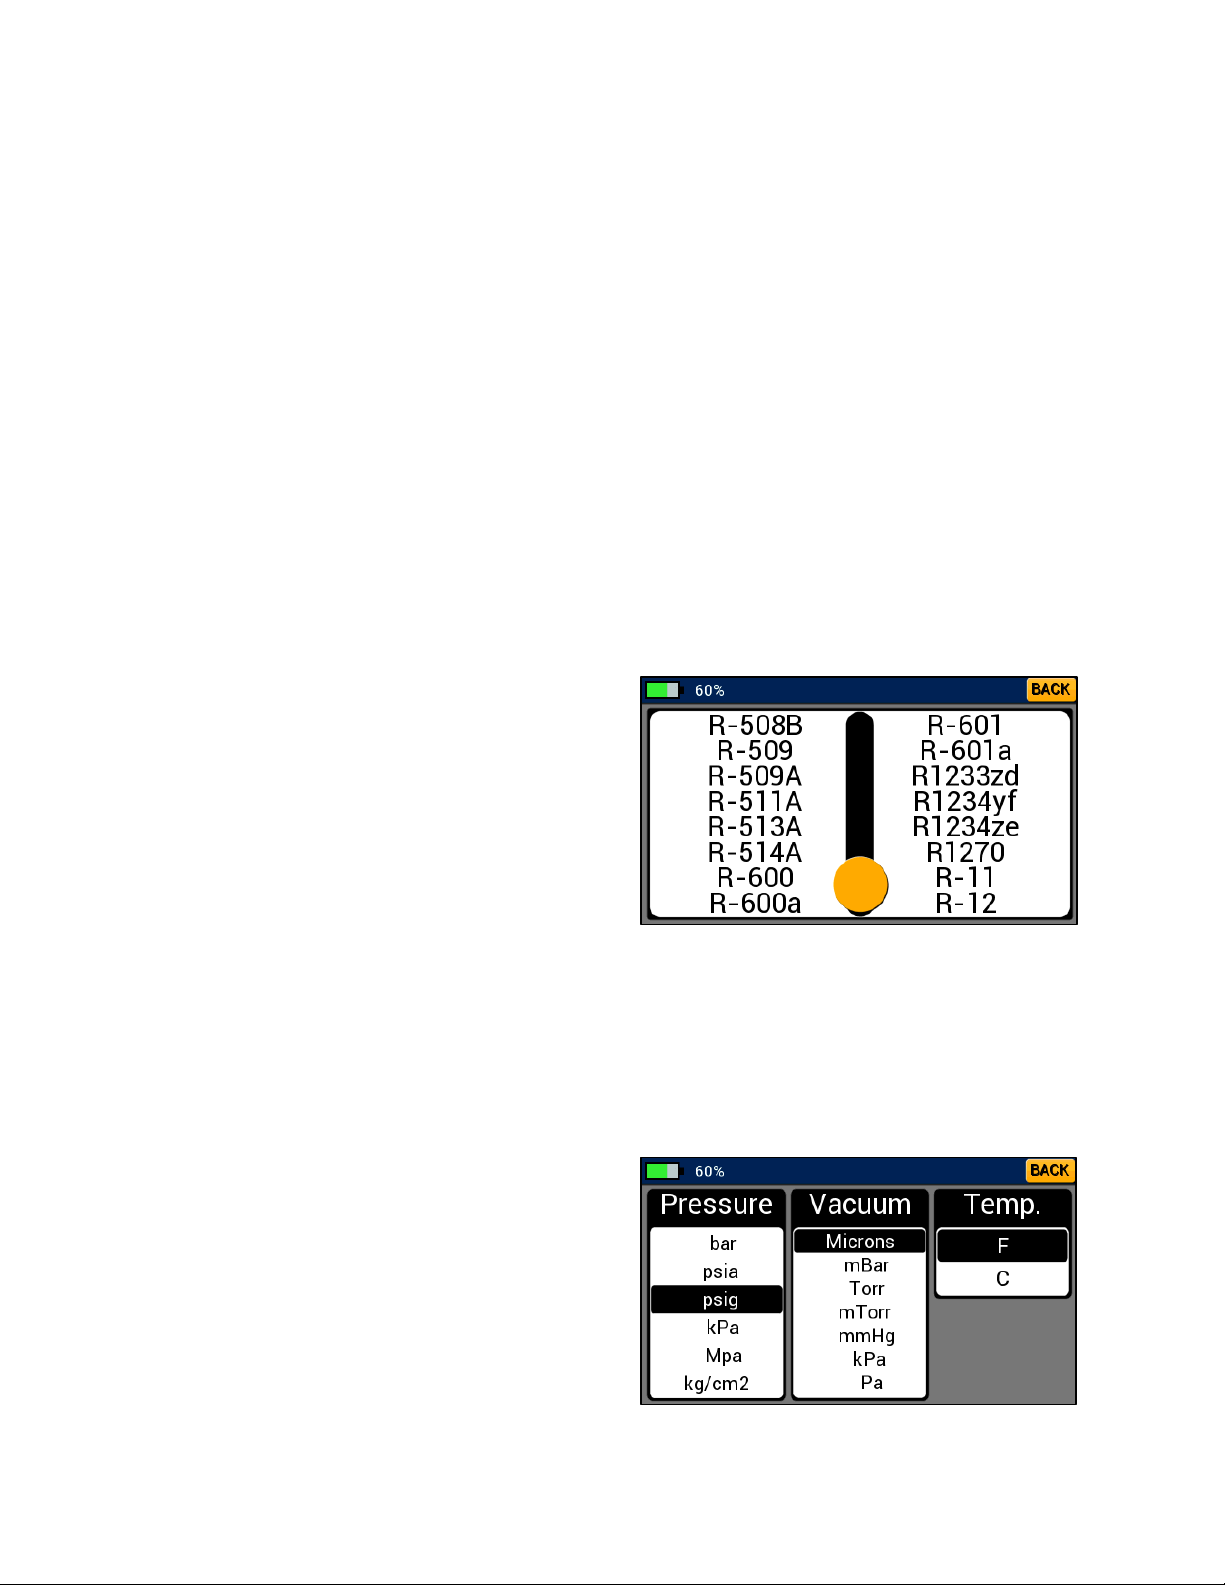
Refrigerant Settings Menu
The refrigerant settings menu, shown in Figure
31, can be accessed either by tapping on the
“Change Refrigerant” button in the general
settings menu or by tapping the button in the
bottom right corner of any modes screen labeled
with the currently selected refrigerant. To change
currently selected refrigerant, tap and drag the
slider bar to the page containing the desired
refrigerant. Tap the name of the new refrigerant
selection, the device will automatically return to
the previous screen with the new selection saved as the current refrigerant. The currently
selected refrigerant is always displayed in the box to the right of the change refrigerant button
in general settings or as the refrigerant button label on any modes screen. To exit the refrigerant
menu without saving a new selection tap the back button in the upper right corner.
Unit Settings Menu
The unit settings menu, shown in Figure 32, can
be used to quickly change currently selected
units. This menu can be accessed by either
tapping the “Change Units” button in the general
settings menu or by tapping the button in the
bottom left corner of any modes screen labeled
with the currently selected unit. To select a new
pressure, vacuum, or temperature unit, tap the
desired unit within the corresponding list. Once
21
Page 25
the desired units have been selected, tap the back button in the upper right corner to save new
Figure 33: Device Settings Menu
selections.
Pressure Units:
Pressure units are used to display pressure measurements while in pressure/temperature and
pressure decay mode. This unit can be adjusted to one of six pressure units: psig, psia, bar,
kg/cm^2, MPa, and kPa.
Temperature Units:
Temperature units are used to display temperature measurements while in
pressure/temperature mode. This unit can be adjusted to one of two temperature units: °F, and
°C.
Vacuum Units:
Vacuum units are used to display vacuum measurements while in evacuation mode. This unit can
be adjusted to one of seven vacuum units: Microns, Pa, kPa, mmHg, mTorr, Torr, and mBar.
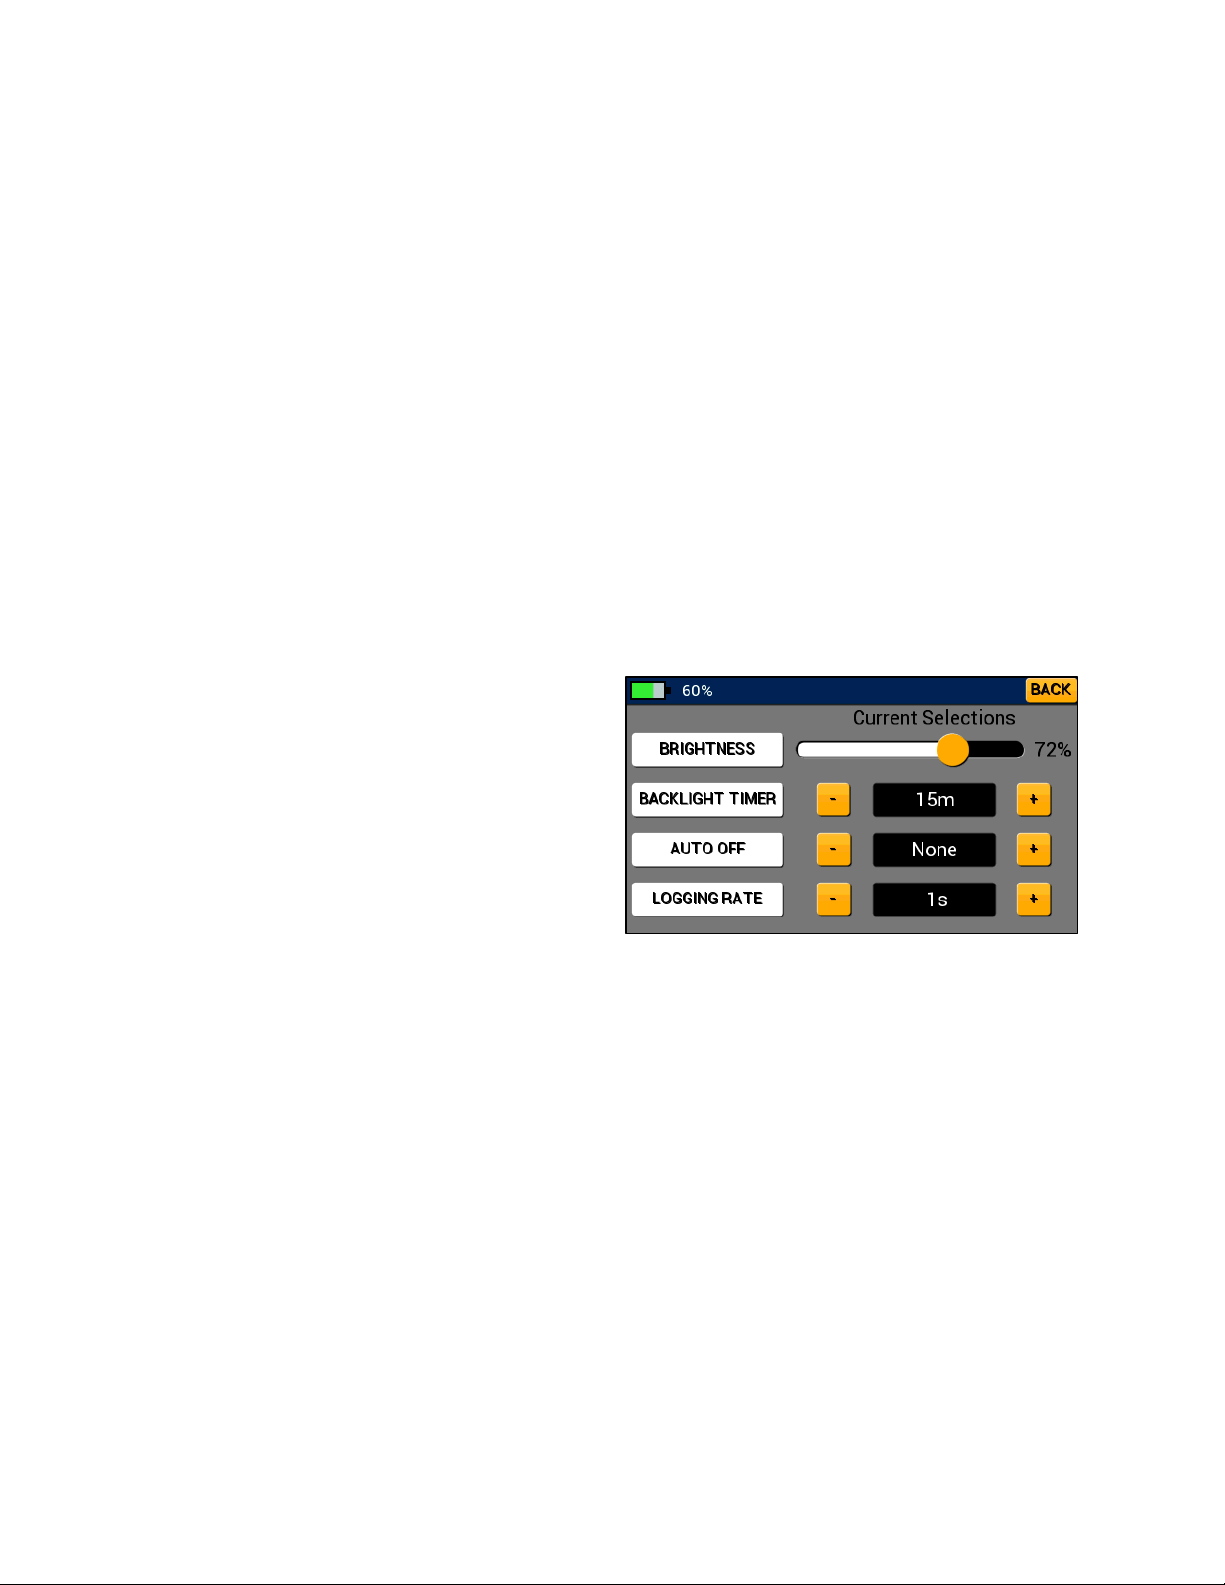
Device Settings Menu
The device settings menu, shown in Figure 33,
can be used to adjust a variety of device settings
including display brightness, backlight timer,
auto off timer, and logging rate. To access the
device settings menu, tap the “Device Settings”
button in the general settings menu. To adjust
the display brightness, tap and drag the slider
bar next to brightness until the desired
brightness is displayed. To adjust the backlight
timer, auto off timer, or logging rate, tap the +
and – buttons until the desired time is displayed. Tap the back button in the upper right corner
to save new device settings and return to the general settings menu.
Brightness:
Brightness can be used to adjust the intensity of the LCD backlight in a range of values from 6 to
100%. Increasing the backlight intensity may help viewability in different lighting but will also
decrease the battery life.
Backlight Timer:
The backlight timer sets the duration of the backlight since last user input. If the backlight timer
is set to a higher value, the backlight will remain on for a longer period but at the cost of
decreased battery life. After the backlight turns off, it can be toggled on at any time with a quick
press of the power button or a tap of the touch screen. The backlight timer can be adjusted in
eight increments: 5s, 15s, 30s, 45s, 60s, 5m, 10m, and 15m.
22
Page 26

Auto Off:
The auto off timer will automatically power the unit down if there has been no user input for the
selected duration of time. This feature can be used to significantly increase the battery life of the
manifold. The Auto Off Timer can be set to four increments: 15m, 30m, 1hr, and None. Selecting
None will prevent the unit from auto powering off.
NOTE: If attempting to capture datalogs for an extended period, ensure that the Auto off timer
is set to none. If the auto off timer is not set to none, the device will power off after the set time
interval and any additional datalogging information will be lost.
Logging Rate:
Logging rate sets the time interval for how often a data sample is stored. It may be tempting to
set the logging rate to the lowest possible time interval (1s) but this may result in extremely large
datalog files making it difficult to analyze the information. Be sure to set the logging rate to an
appropriate interval for the conditions being tested. The logging rate can be set to thirteen
different time intervals: 1s, 5s, 10s, 30s, 1m, 5m, 10m, 30m, 1hr, 2hr, 6hr, 12hr, and 24hr.
23
Page 27
Chapter 5:
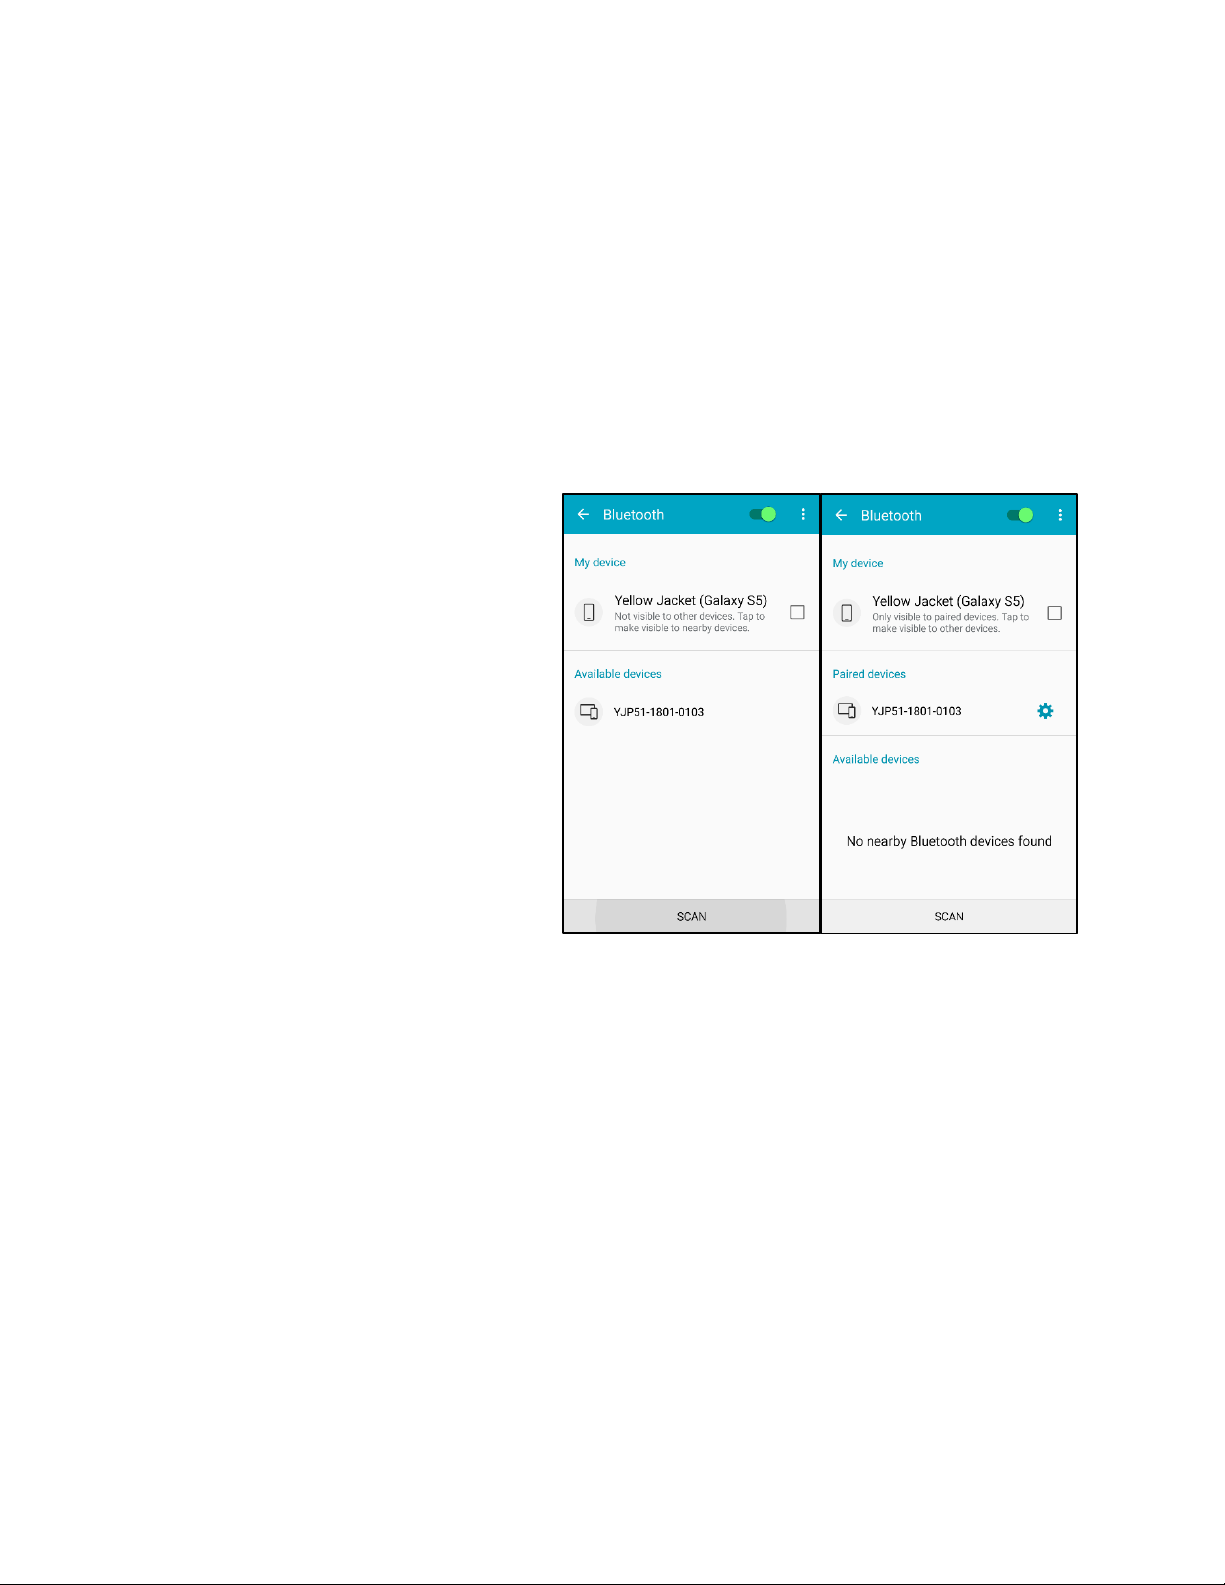
Figure 34: Android-Pairing a P51-870 TITAN™
Mantooth App Integration
Overview:
The P51-870 TITAN™ features a Bluetooth low energy radio and is fully compatible with both the
iOS and Android Mantooth™ Apps V3.0 or later. The Mantooth app in conjunction with the P51870 TITAN™ can be used to remotely monitor system pressure, temperature, vacuum, and
perform target superheat and subcool calculations. Additionally, the Mantooth app can generate
its own datalog files and job reports.
Operation of the Mantooth App with the P51-870 TITAN™:
Before the P51-870 TITAN™ can be used
with the Mantooth App, the Mantooth
App must be installed and updated to
version 3.0 or newer on the desired
mobile device. Before using the
Mantooth App, ensure that the manifold
is paired to the desired mobile device.
For Android devices, navigate to the
Bluetooth utility and make sure the
manifold is powered on. The P51-870
TITAN™ should appear in the available
devices menu as the name of the device
followed by the serial number (Ex. YJP511801-0103) as seen in Figure 34. Select
the appropriate device and it should
appear in the paired devices menu.
For iOS devices, the manifold does not need to be paired through the Bluetooth utility. The P51870 TITAN™ will be available to connect through the Mantooth App if the device is powered on
and the Mantooth App is updated to version 3.0 or newer.
For instructions on operating the Mantooth App, selecting or adjusting settings, retrieving
datalog files, generating job reports, and all other features of the Mantooth App, please see the
Mantooth User Guide by following the hyperlink below.
When the P51-870 TITAN™ is connected to a mobile device via Bluetooth, the LED will flash violet
every second.
24
Page 28

Chapter 6:
Table 6-1: Replacement Parts
UPC#
Description
67030
Vacuum Sensor
67010
Temperature Probe
67012
USB Cable
10146
Replacement Backpack
21990
(3) 60” RYB (standard Fittings); (1) 60” Y
(3/8” str x 3/8” 45° Quick Coupler)
18160
BBA-60 CHARGING HOSE
29985
3-PAK HBVV-60 -RYB-
29425
R410A-BV60 EU BLUE HOSE
29465
R410A-BV60 EU RED HOSE
Maintenance
Overview:
Basic operator maintenance is covered in this chapter. For more extensive maintenance and for
repair, contact Ritchie Customer Service. See Chapter 1 for contact information.
General Maintenance:
Since this instrument may be used in the presence of a wide range of chemical liquids and vapors,
it is recommended that the case be cleaned often with a damp cloth and mild detergent such as
dish soap.
Although the resistive display is tough and suitable for typical industrial use, take care when
cleaning the display as clarity is a critical component of this instrument:
● Normally, the display can be cleaned as one would clean plastic eyeglass lenses: Use a
soft, 100% cotton or microfiber cloth and water or eyeglass lens cleaning solution. Do not use
paper products.
● If the display is very dirty, generously soak a soft cloth with warm, soapy (dish soap) water
and place the cloth for a couple of minutes over the display to loosen any stubborn dirt. Wipe off
excess water with a clean, less dampened, 100% cotton or microfiber cloth, and complete the
cleaning using the normal display cleaning method described above.
● DO NOT place the device under running water, always use a dampened cloth to transport
liquid to and from the device.
Replacement Parts:
If parts are damaged please see Table 6-1 for replacement part numbers.
25
Page 29

Chapter 7:
Table 7-1: Physical Specifications
Maximum Pressure
700 psia (48.3 bar)
Operating Temperature
140 to -4°F (60 to -20°C)
Storage Temperature
140 to -4°F (60 to -20°C)
Battery Life
4 hrs continuous Backlight
80 hrs no Backlight
Size
Approx. 7.5" x 8.5" x 4.25"
Weight
2.63 lbs
Table 7-2: Instrument Specifications
Working Pressure
0 – 700 psia (48.3 bar)
Pressure Sensing Resolution
0.1 psi, 0.1 bar, 1 kPa
0.001 MPa, 0.01 kg/cm^2
Pressure Sensing Accuracy
0.5% of full scale at 77°F (25°C)
1% of full scale 55 to 130°F (13 to 54°C)
2% of full scale -40°F to 248°F (-40 to 120°C)
Temperature Sensing Range
Sensing element: -40 to 266°F (-40 to 130°C)
Max Cord temp: 176°F (80°C)
Max Clamp Temp: 203°F (95°C)
Temperature Sensing Resolution
0.1°F or °C
Temperature Sensing Accuracy
±0.36°F (±0.2°C)
Vacuum Sensing Range
5 to 100000 microns
Vacuum Sensing Resolution
1 micron
Device Specifications
26
Page 30
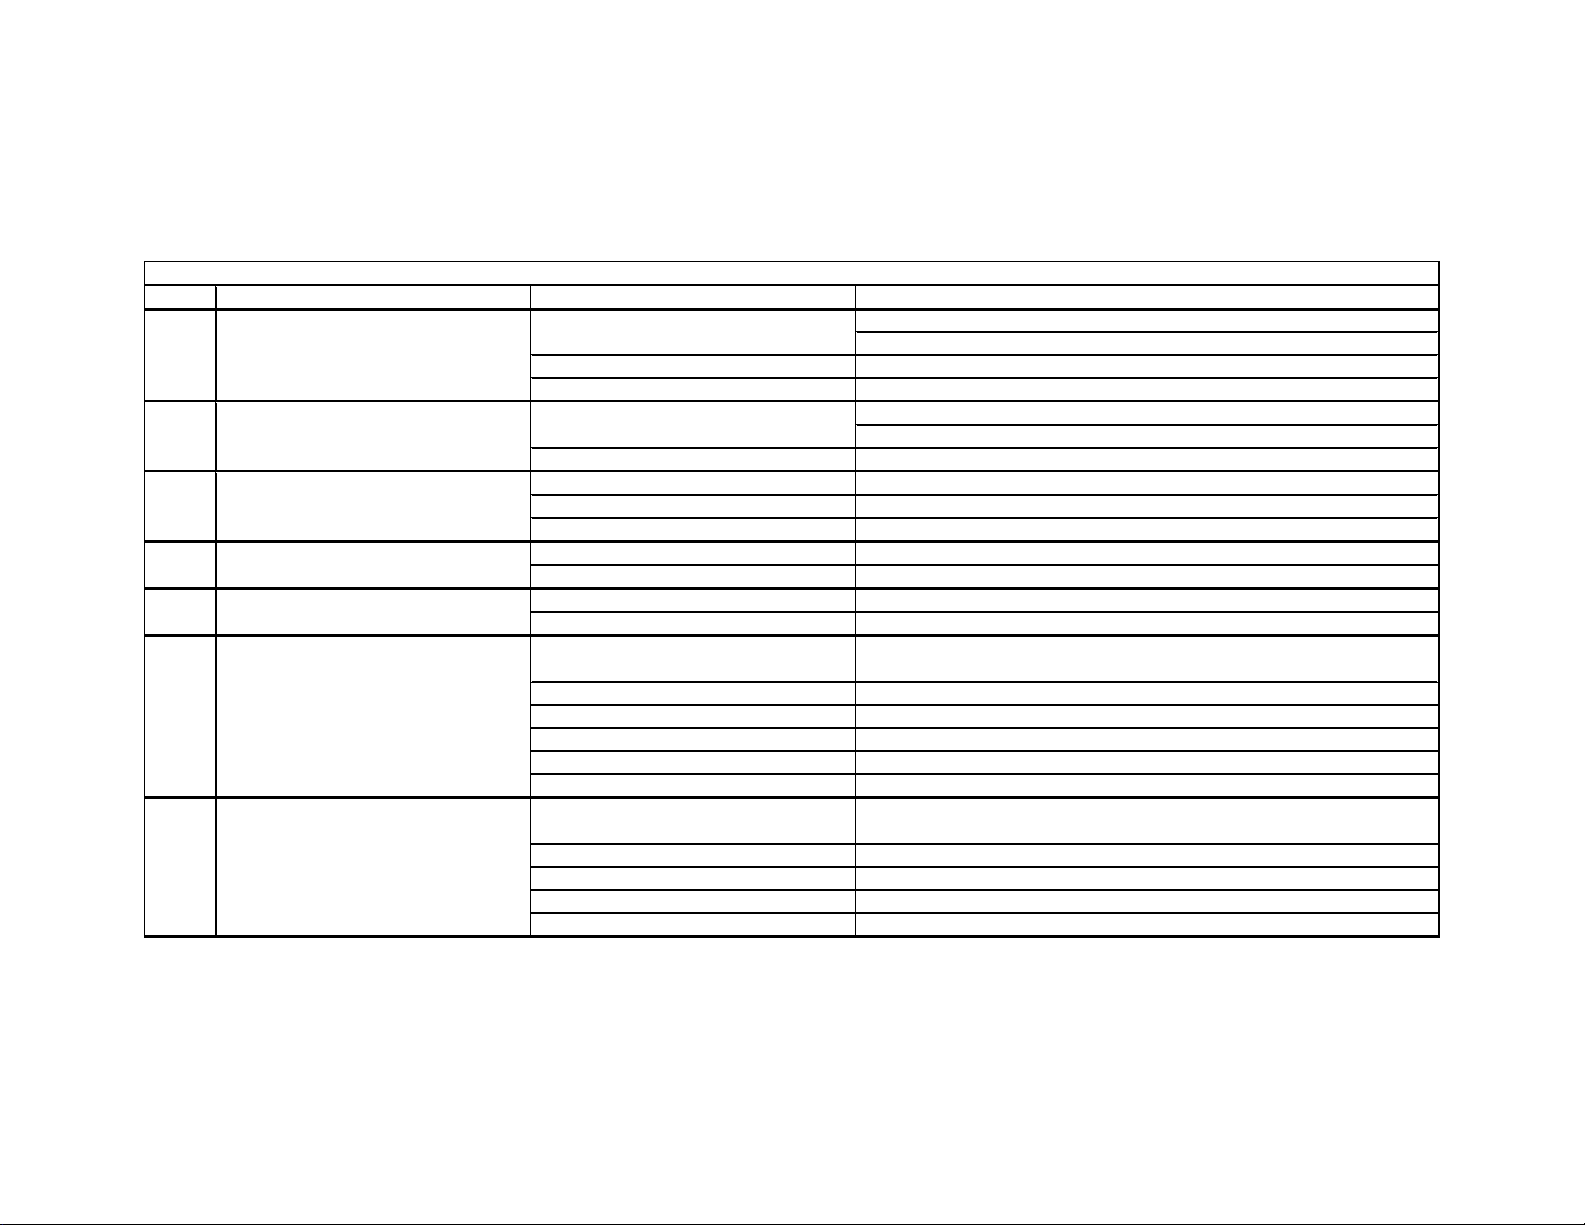
Chapter 8:
Model(s) Problem Possible Cause(s) Possible Solution(s)
Check backlight auto-dimming timer (P51-870 only)
Tap power button or anywhere on display to power on backlight (P51-870 only)
Device is not powering on Make sure manifold is sufficiently charged
Screen is damaged Contact technical support
Tap power button to power on backlight
Check backlight auto-dimming timer in device settings
Screen is damaged Contact technical support
Display not calibrated properly Recalibrate display (see User Manual/Quick Start Guide)
Display is damaged Contact technical support
Device is connected to PC Disconnect from PC
Buttons/overlay damaged Contact technical support (P51-860 only)
Device is connected to PC Disconnect from PC
Manifold is under pressure Make sure manifold is vented to atmosphere
Pressure transducers damaged Contact technical support
Temperature clamp barrel connector not
fully seated in back of manifold
Check temperature clamp connections on back of manifold
Temperature clamp/cable damaged Call technical support
Temperature clamp jacks damaged Call technical support
Clamp not properly attached to system Check clamp connections to system
Low-Side and High-Side readings reversed Make sure T1 is attached to system low-side, T2 to system high-side
Wrong PT readings mode selected Make sure Tsy mode is selected (P51-860 only)
Vacuum probe barrel connector not fully
seated in back of manifold
Check vacuum probe connections on back of manifold
Vacuum probe/cable damaged Call technical support
Vacuum probe jacks damaged Call technical support
Probe not properly attached to system Check vacuum probe connections to system
Vacuum probe plugged into wrong jack Make sure vacuum probe is plugged into A1 or A2 jacks (P51-870 only)
Backlight has turned off
Screen has dimmed
Screen is auto-dimming, backlight is off
Pressure Transducers won't zero
P51-860
P51-870
P51-860
P51-860
P51-870
Screen does not display anything
P51-860
P51-870
Device not responding to button press
Screen not responding to touch
P51-860
P51-870
Table 8-1: P51 Troubleshooting
P51-870
Vacuum reading incorrect/not displaying
Temperature reading incorrect/not
displaying
P51-860
P51-870
Troubleshooting Guide
27
Page 31
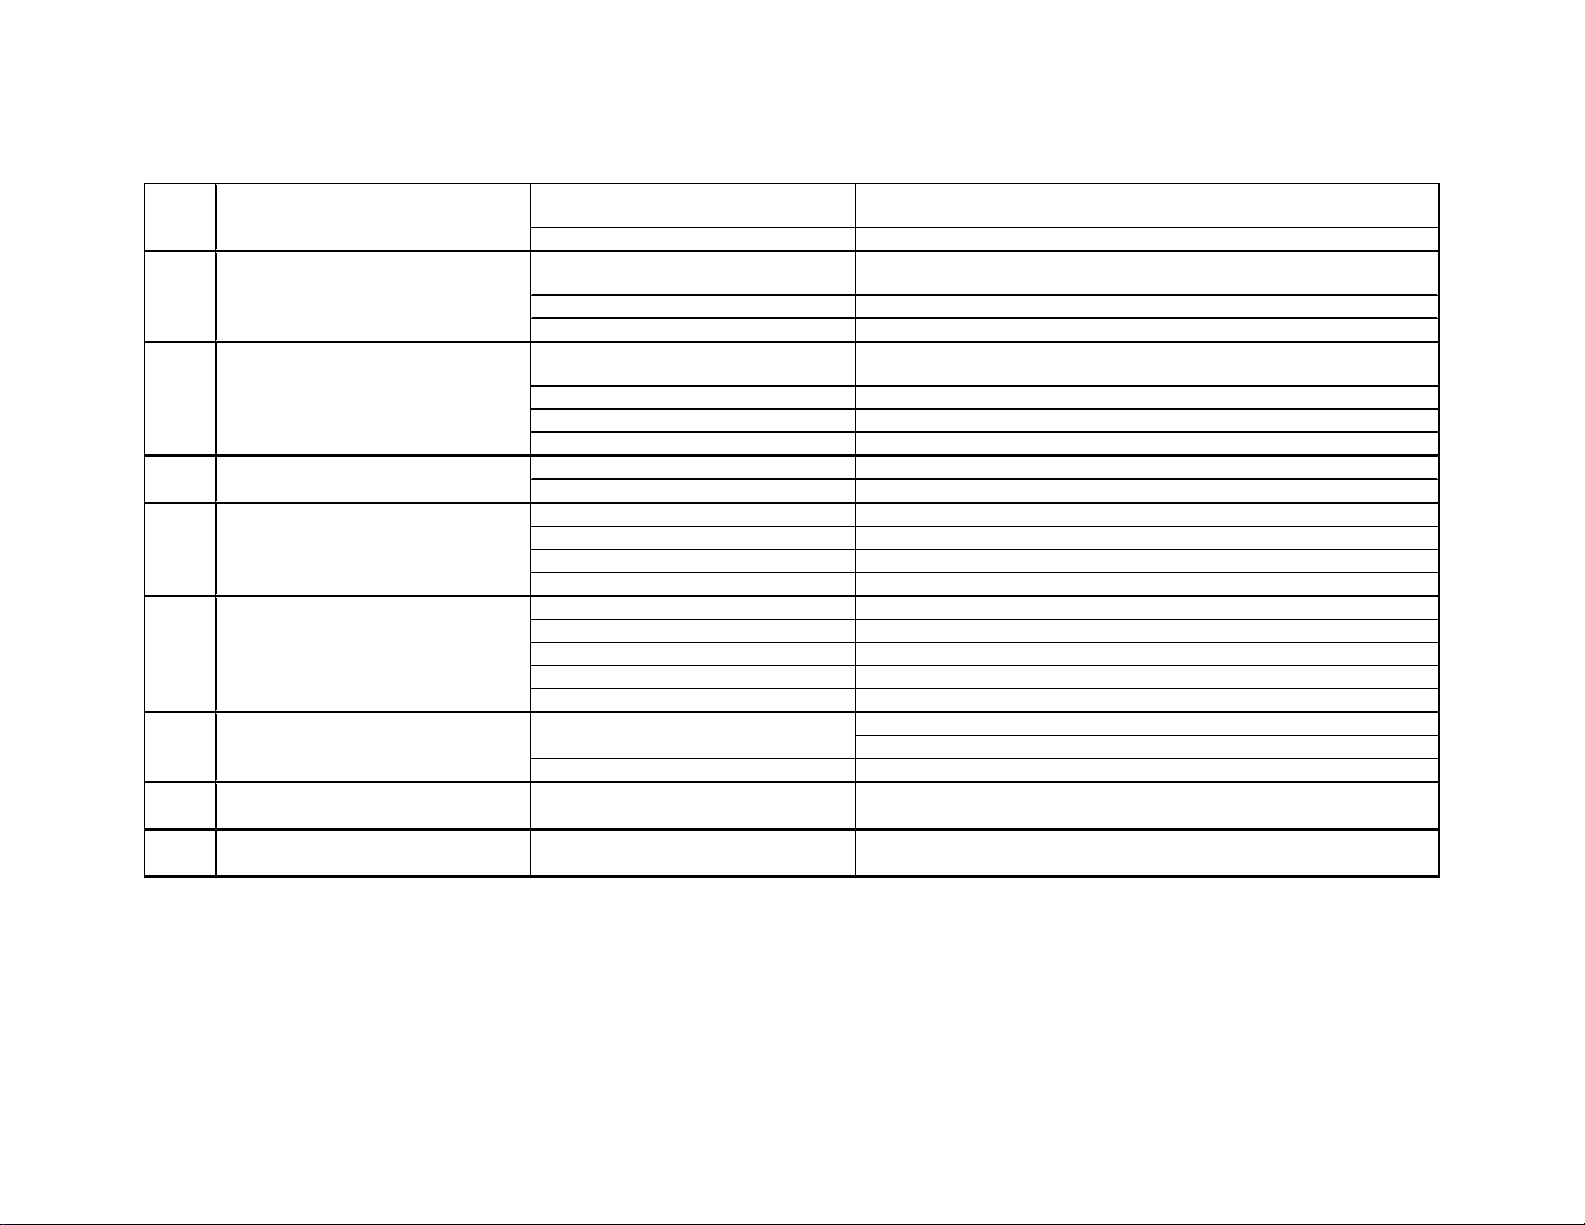
Pressure transducers not zeroed properly Make sure pressure transducers are zeroed before use
Pressure transducers damaged Call technical support
Knobs are open Check position of knobs
Manifold damaged/leaking Call technical support
Hose connections not tightened properly Check hose connections
USB cable not connected properly Check USB connection to P51 manifold and PC
Device not powered on Power on P51 manifold for data transfer
USB cable damaged Use alternate USB cable
Manifold damaged Call technical support
Device memory full Upload existing datalogs and clear system memory (upon next power up)
Manifold damaged Call technical support
USB cable not connected properly Check USB connection to P51 manifold and power source
USB cable damaged Use alternate USB cable
Device fully charged No action
Manifold damaged Call technical support
Device is not powered on Make sure P51 manifold is powered on
Bluetooth not enabled on mobile device Enable Bluetooth on the mobile device
ManTooth App old version ManTooth app must be version 3.0 or newer
Manifold not paired to mobile device Pair manifold with mobile device using Bluetooth settings utility (Android only)
Manifold not within range of mobile device Ensure manifold and mobile device are within range (~400 ft)
Adjust auto-off timer
Make sure manifold is sufficiently charged
Mobile device has moved out of range Move mobile device back into range of manifold
P51-860
P51-870
LED is flashing red and device is powering
off immediately
Battery charge is critically low Charge manifold battery
P51-860
P51-870
LED is solid purple and screen does not
display anything
User has entered updater mode Hold power button for 3 seconds until LED powers off
Manifold not holding pressure/vacuum
Pressure readings incorrect
P51-860
P51-870
P51-860
P51-870
Manifold has been powered off
Bluetooth connection lost
P51-860
P51-870
P51-860
P51-870
Unable to establish Bluetooth connection
P51-860
P51-870
P51-860
P51-870
Manifold not charging, LED not solid green
Unable to save new data logs
Device not recognized when connected to
PC
P51-860
P51-870
28
Test Equipment Depot - 800.517.8431 - 99 Washington Street Melrose, MA 02176
TestEquipmentDepot.com
 Loading...