

Page 1

CompleteView User
Analytics
Application Guide for MPS Users
Version: 1.1
Date: August 2016
Page 2

©2016 Xerox Corporation. All rights reserved. Xerox® and Xerox and Design® are
trademarks of Xerox Corporation in the United States and/or other countries.
BRXXXXX
Other company trademarks are also acknowledged.
Document Version: 1.1 (August 2016)
Page 3

i
Table of Contents
CompleteView User Analytics.................................................... 2
What is CompleteView User Analytics? .......................................... 2
Minimum Requirements ................................................................... 2
Prerequisites .................................................................................... 2
Tool and System Interaction, System Security ............................... 2
Getting Started .......................................................................................... 3
Logging in and out of the application ............................................... 3
Resetting your password ................................................................. 4
The CompleteView User Analytics System Controls Toolbar....... 4
CompleteView User Analytics Menu ........................................................ 5
The Welcome Page ......................................................................... 5
The Analysis Page – Selecting a language ..................................... 5
The Analysis Page – Selections and filters ..................................... 5
Dashboard........................................................................................ 9
User Tab......................................................................................... 10
Usage Tab...................................................................................... 16
Device Tab ..................................................................................... 19
Finance Tab ................................................................................... 21
Unprinted Tab ................................................................................ 23
Exceptions Tab .............................................................................. 24
The Download Page ...................................................................... 26
The Upload Page ........................................................................... 31
Page 4

2
CompleteView User
Analytics
What is CompleteView User Analytics?
CompleteView User Analytics enables printing data to be quickly analysed by any selected categories
such as user, department, date, time, file type, and device.
The tool allows any user to drill down into the information in order to analyse who is printing and what
is being printed.
Users can identify any print-related bottlenecks, improve their efficiency, understand the print
infrastructure, analyse user behaviour, reduce print volumes and increase general security in their
print environment.
Minimum Requirements
CompleteView User Analytics is available for use with all standard browsers on desktop and mobile
devices with an internet connection. However, there are certain prerequisites. These are explained in
the next section.
Prerequisites
Prior to the installation of User Analytics, a data communication tool needs to be set up and
configured to be able to connect with the SQL server that is hosting the source data. This is currently
done by the Systems and Integrations team at NewField IT.
Tool and System Interaction, System Security
All project data within CompleteView User Analytics is transmitted via the data communication tool,
also known as Data Communicator. Once this has been installed and the necessary software has
been implemented within the system, the data will be packaged via this tool for transfer over a secure
Page 5
3
protocol to the NewField IT server. The data is then transformed and made ready for the presentation
layer.
Getting Started
Logging in and out of the application
Follow these steps to log in to CompleteView® :
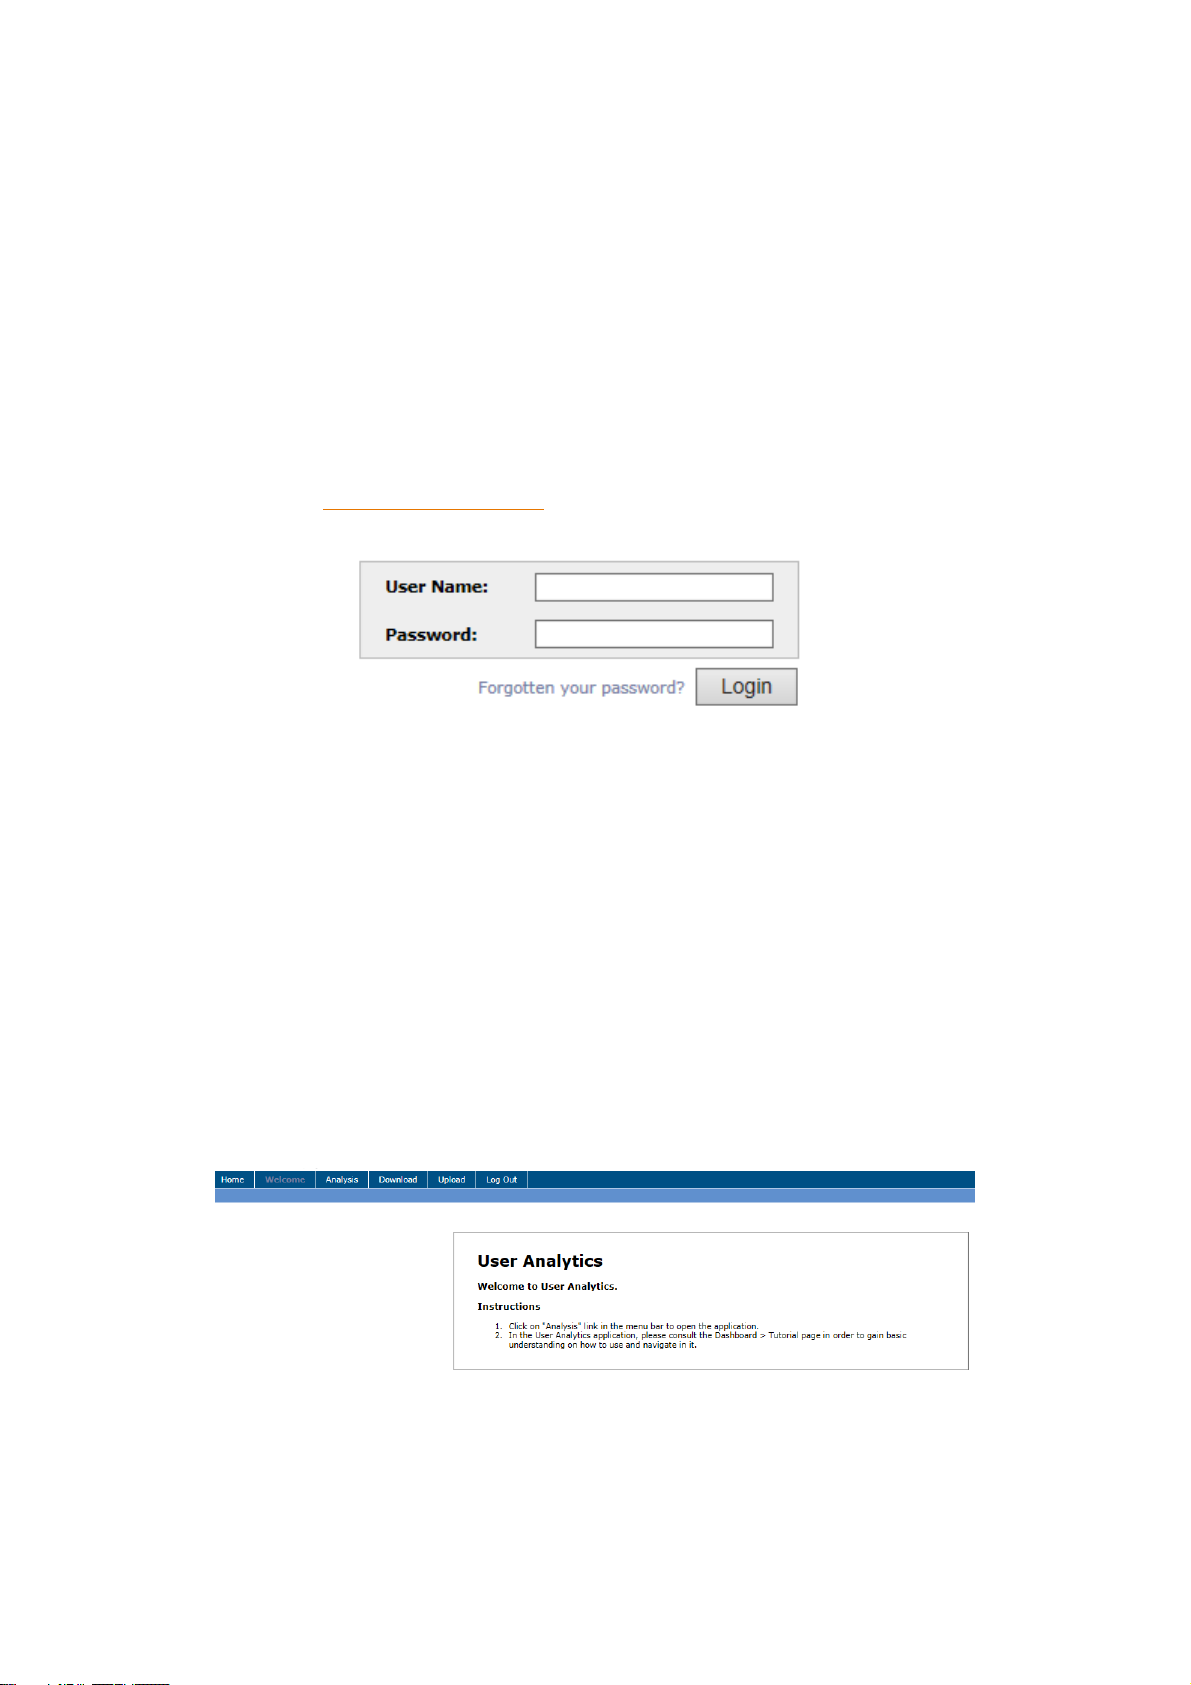
1. Navigate to www.my-completeview.com. The Login screen displays.
Figure 1. CompleteView® login screen
2. Enter your provided login credentials, which include a user name and password.
3. Click Login.
Note: Your account will be locked after three unsuccessful login attempts. In this case please contact
your local support desk.
4. Upon successful login, the Welcome window appears with a number of system options
available. These options are based on your profile and the applications to which you have
access.
5. If more than one option is available select the User Analytics option from the application
menu. If you only have access to User Analytics no application menu will be visible and you
will be directed to the User Analytics start page:
Figure 2. The Welcome page in CompleteView User Analytics
To log out of the application please select the “Logout” button on top of the page.
Page 6
4
Resetting your password
To change your password you have two options:
Option 1: Use the “Forgotten your password” function on the login page.
An automated email will be sent to your account. Please get in touch with your local support desk if
you haven’t received any emails.
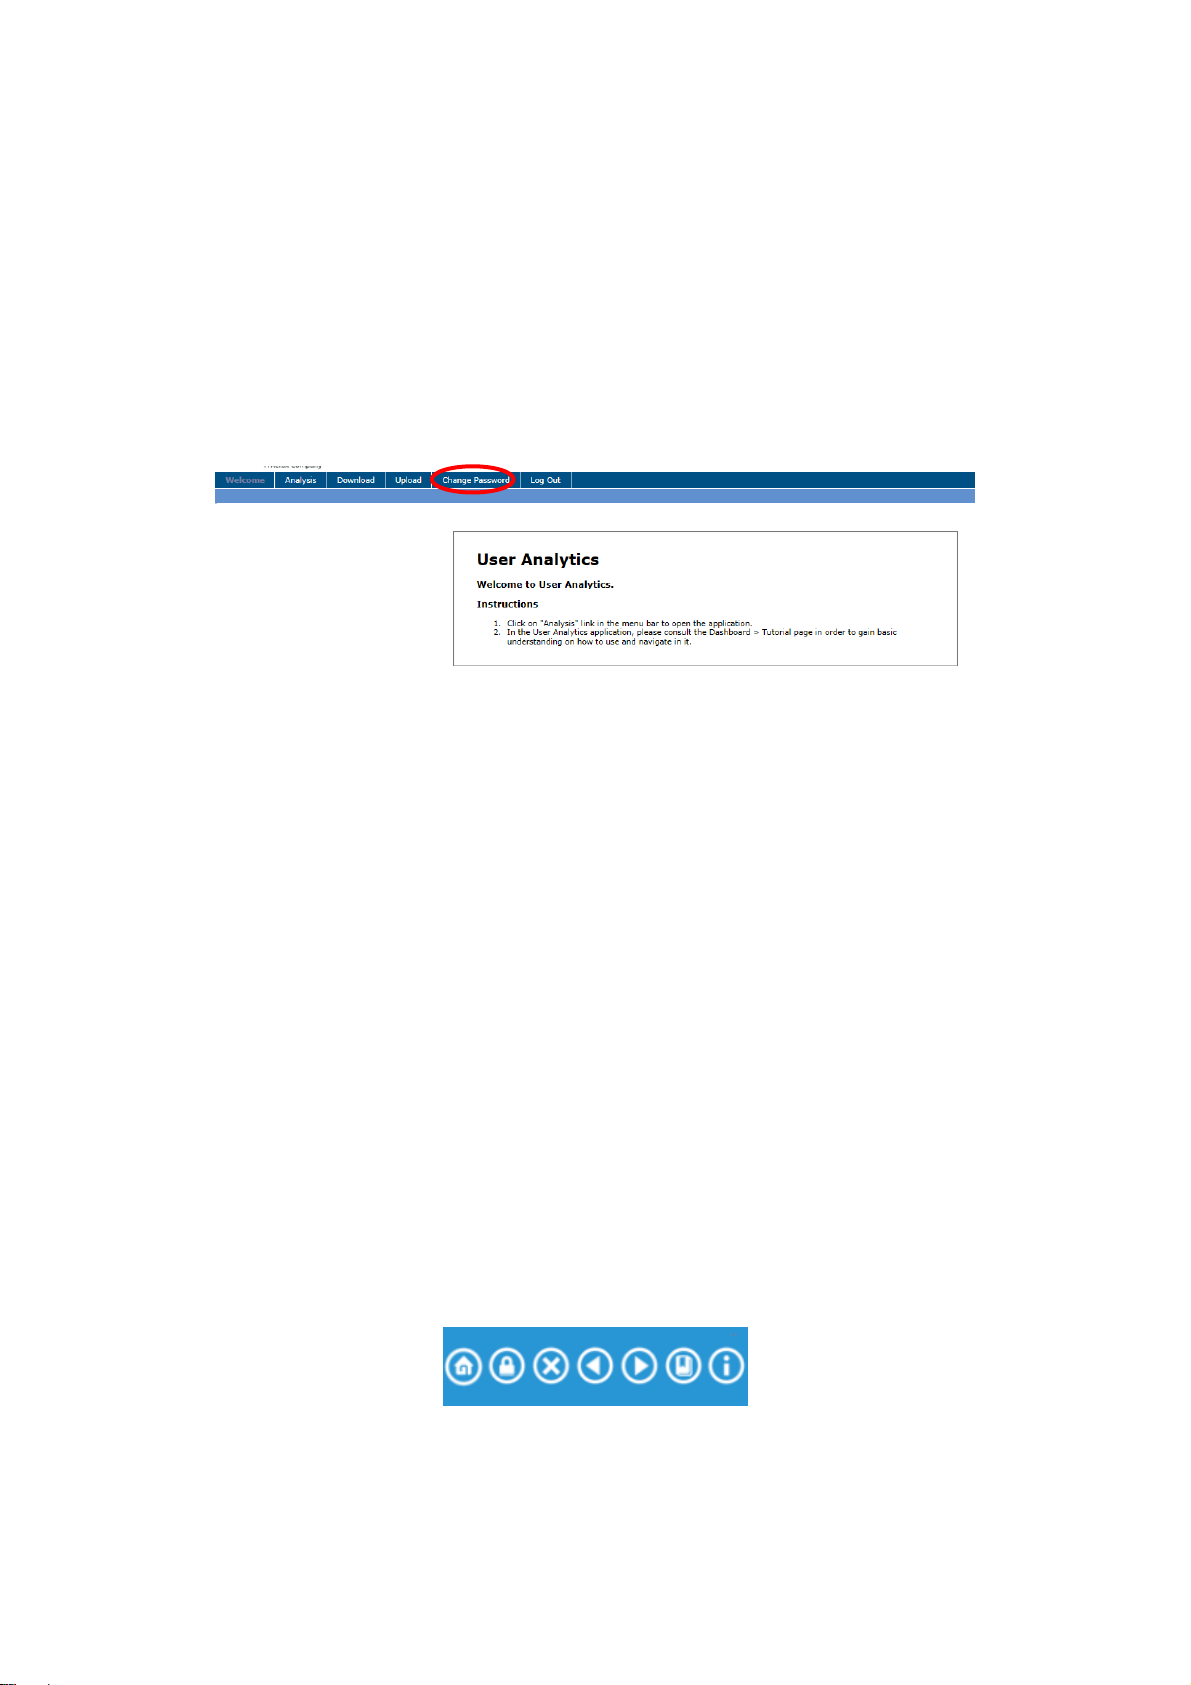
Option 2: Use the “Change password” function on top of the page after logging in.
Figure 3. Change your password when logged in
Any password criteria that need to be met to change the password will be displayed below the
password fields.
Please follow closely these instructions to change your password.
A new password should meet the following criteria:
Be at least 6 characters long
Not contain your username
Be a mixture of letters and numerals
Not be a previously used password
Not have the same character two times consecutively
Not have character sequences of more than three characters
The CompleteView User Analytics System Controls Toolbar
In the System Controls toolbar, the following options are available:
Figure 4. System Controls toolbar
The Home button returns the user to the initial screen that contains the language options.
Page 7
5
The Lock button locks any selections that have been made.
The X feature removes any selections that have been made.
The Back and Forward buttons allow users to return to previous selections/filter settings.
These work like the Back and Forward buttons on a browser.
The Bookmark feature can be used to save and remember any filter settings.
The Information button displays helpful notes on the function and purpose of each tab in the
tool. Display all notes by clicking once at it. To deactivate them, click again.
CompleteView User Analytics Menu
The Welcome Page
In the Welcome page, a short instruction is available on how to navigate the tool.
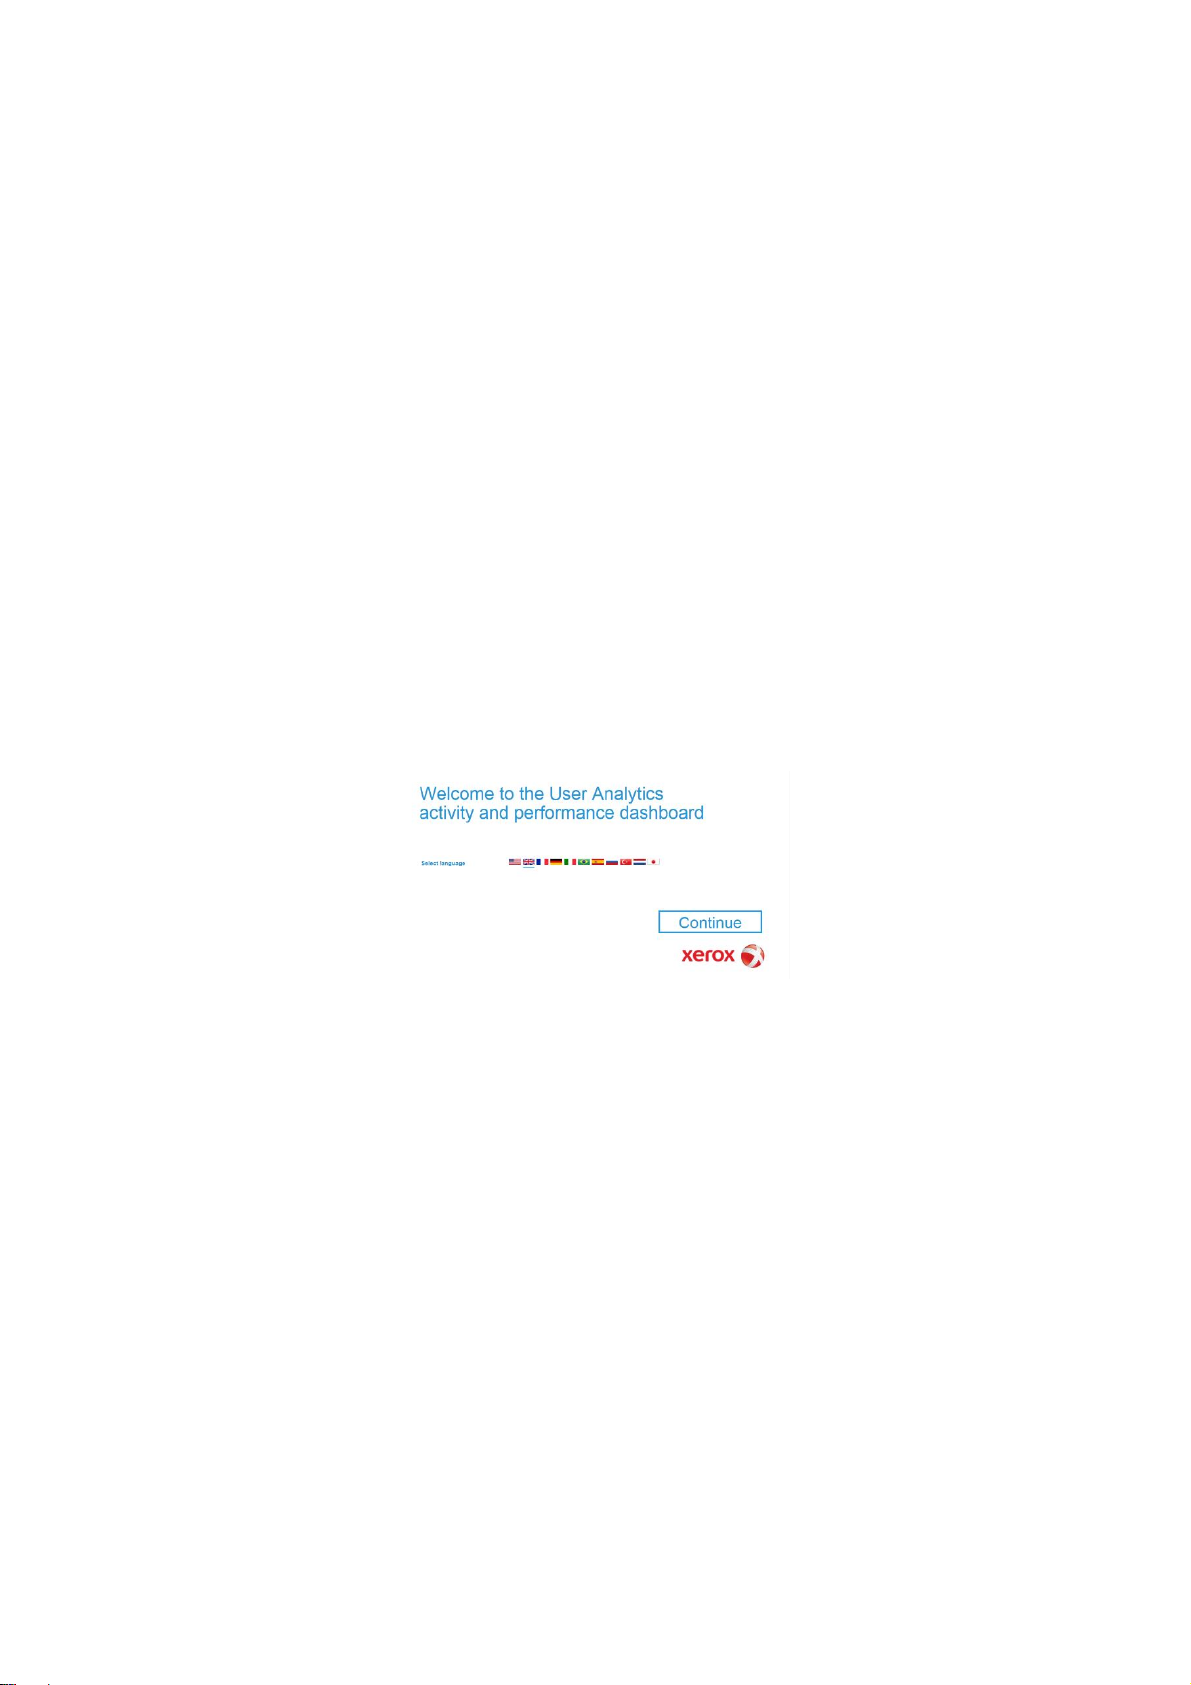
The Analysis Page – Selecting a language
After selecting the Analysis tab, the dashboard loads and the following field becomes available:
Figure 5. Language selection in the Analysis page
Select a language and click “Continue”.
User Analytics is available in the following languages: American and British English, French, German,
Italian, Brazilian Portuguese, Spanish, Dutch, Turkish, Russian, and Japanese.
The Analysis Page – Selections and filters
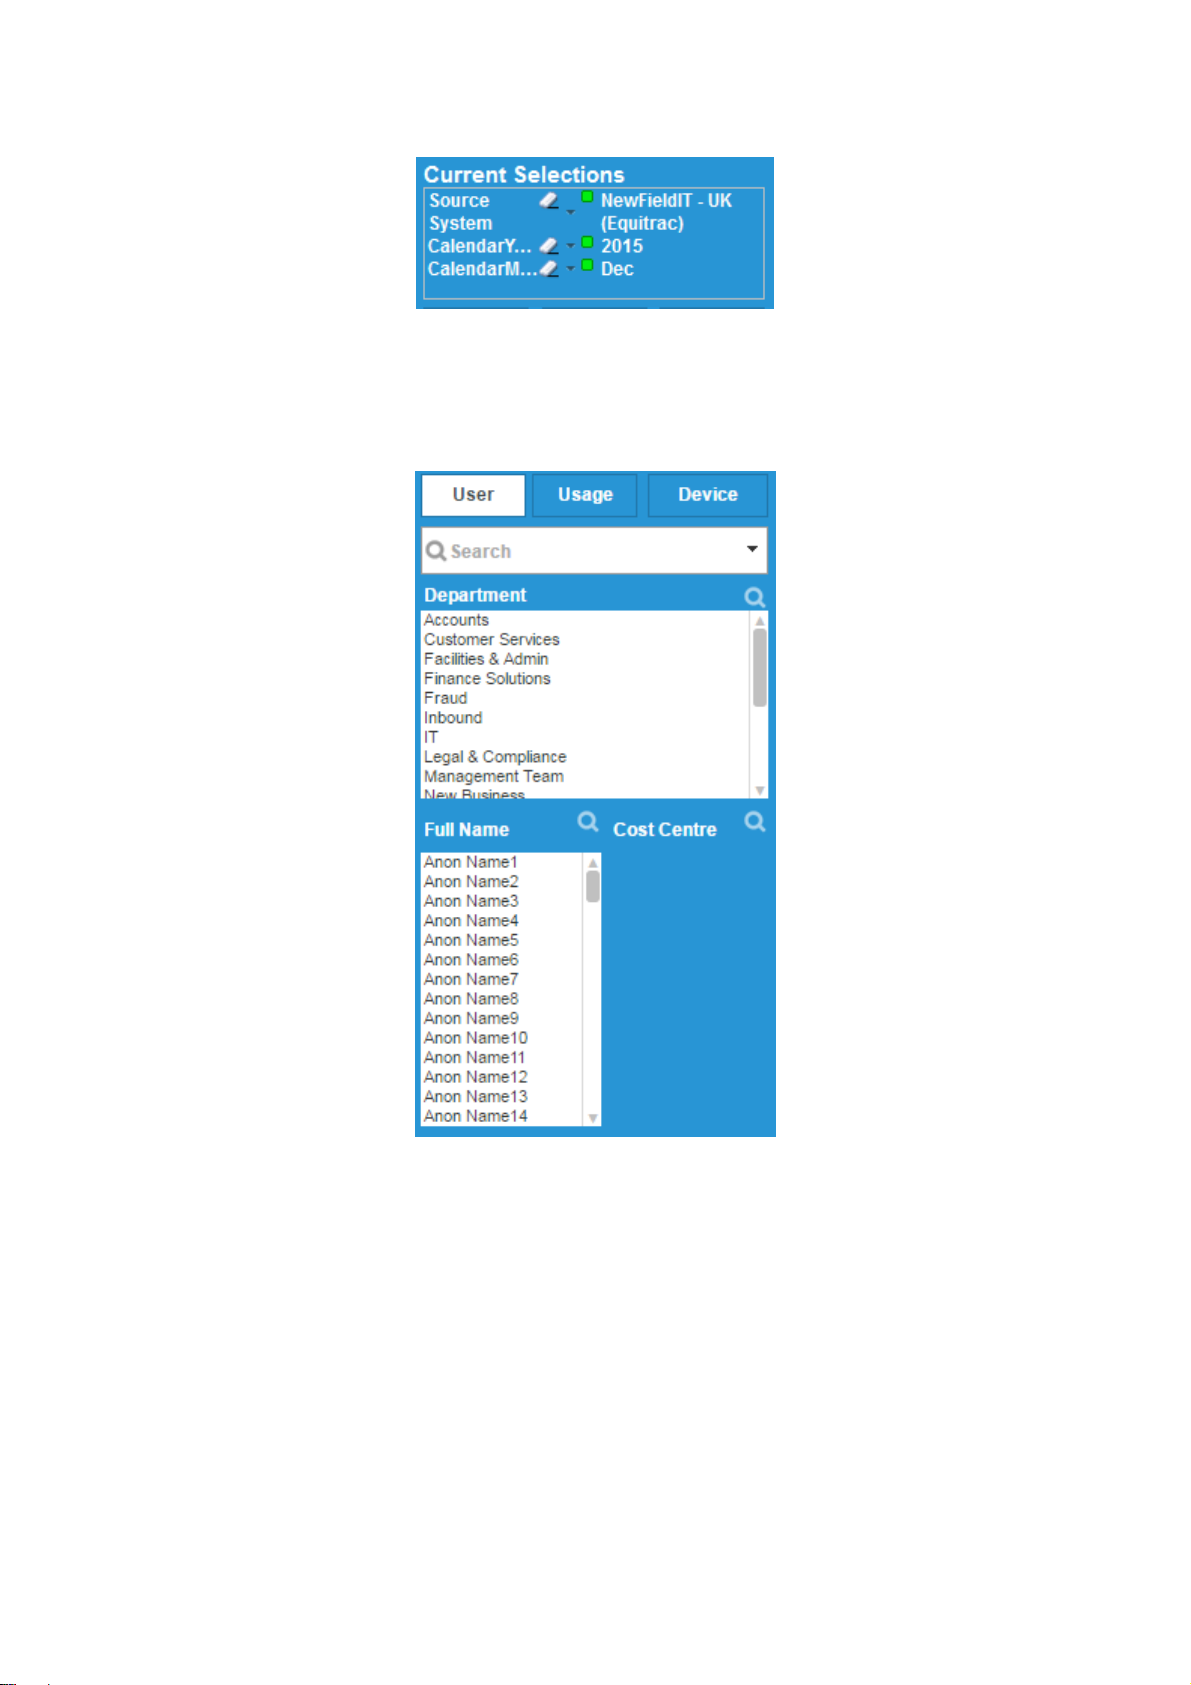
After clicking “Continue”, the Dashboard tab becomes visible. On the left hand side in the top corner is
the Current Selections box. This shows any selections currently in place and allows the user to
remove or modify them. Filters can be removed by left-clicking on the rubber or modified by clicking
on the downwards arrow and making an alternative selection.
Page 8
6
Figure 6. Current Selections box in the top-left corner of the application
More filter options are shown in Figure 7. These include the departments, the names of all users and
their cost centres.
Figure 7. User specific filters in the Analysis page
Page 9
7
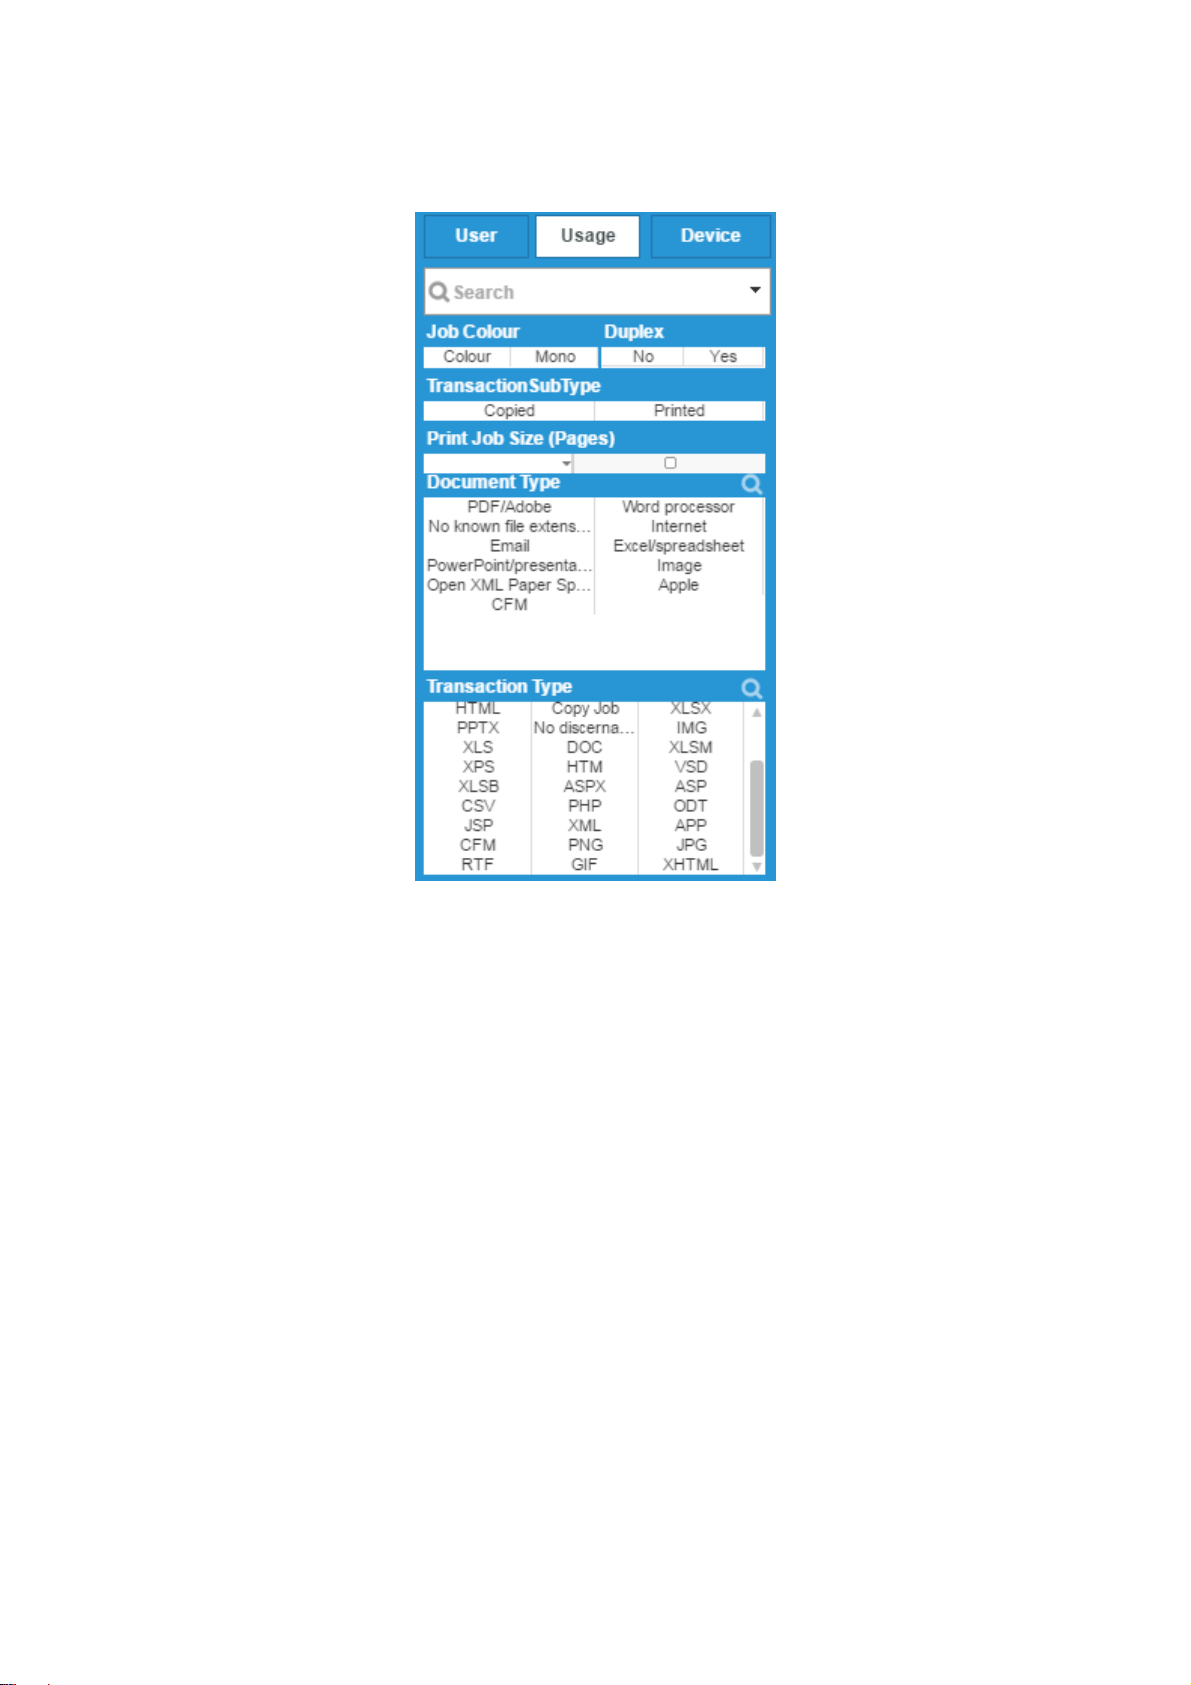
When clicking on the Usage tab, the fields shown in Figure 8 become available:
Figure 8. Usage specific filters in the Analysis page
Search field: With this field it is possible to select from all available information, e.g. it’s
possible to search for an individual account, a user name or a specific device number.
Job Colour: Show only colour or only mono print jobs.
Duplex: Show only duplex or only simplex print jobs.
Transaction Sub Type: Show only copied or only printed pages.
Print Job Size (pages): select from the drop-down menu for available options.
Document Type: All available filter options for the current selection are shown in white, while
other options that are available for the fleet but that do not apply to the current selection are
greyed out.
Transaction Type: The same applies for Transaction Type. Here all available options are also
marked in white.
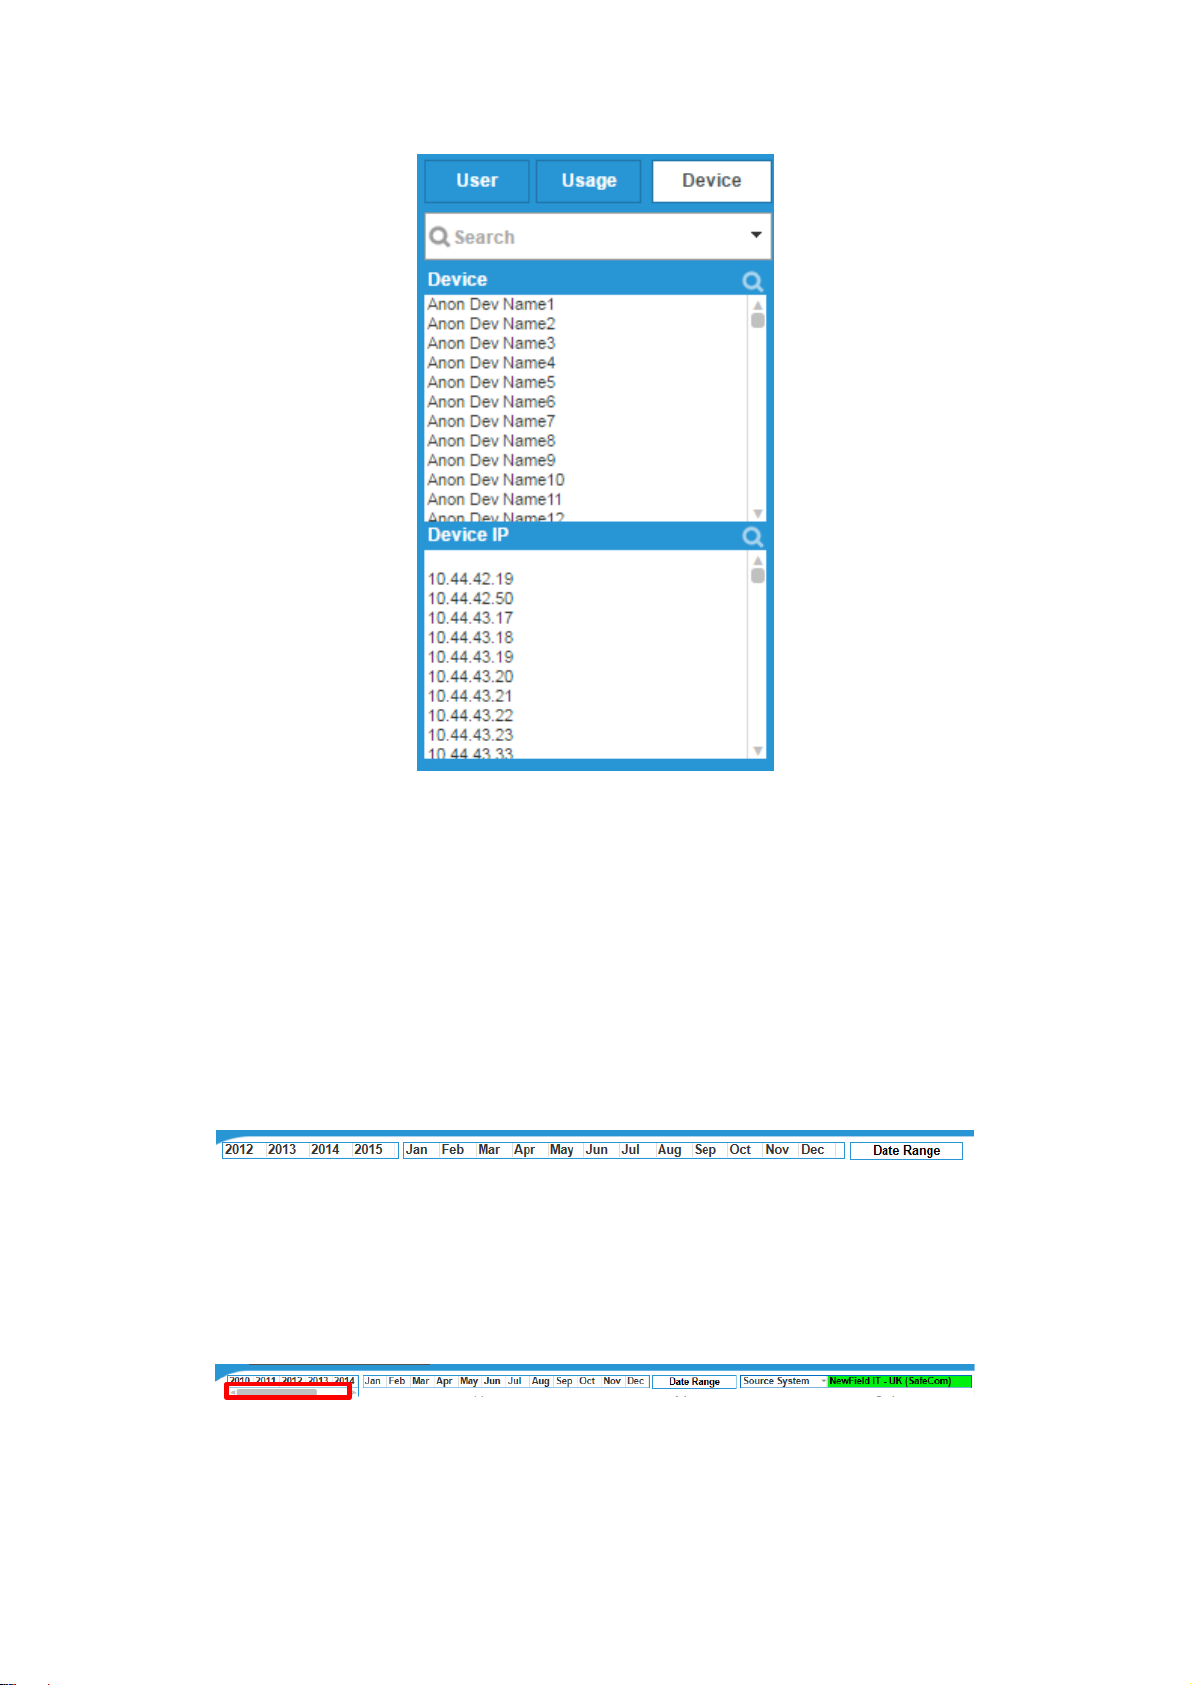
In the Device tab, all device IP addresses for the fleet are listed. Again, all white fields correspond to
options available for the current selection, while the grey fields are showing any selections that are
incompatible with the current selection.
Page 10
8
Figure 9. Device specific filters in the Analysis page
Please note that some of the fields that have been presented in this section might not be available.
The presence of certain fields depends on the information that is sent from the source system. For
example, with Papercut no IP addresses are available and the data can therefore not be filtered using
this option.
On top of the page, the year, month and date range can be selected. If there is any data range that
cannot be selected then this will be greyed out.
For example, in Figure 10, the years 2012-2015 are available. All fields are marked in white.
Figure 10. Date selection filters
The same view can vary if there is more than one source system available. In this case the source
system can be found next to the date range and the current selection is marked in green. Moreover,
there can be a scrollbar below the selected year if there is more information available.
Figure 11. Date selection filters with scroll bar
Page 11
9
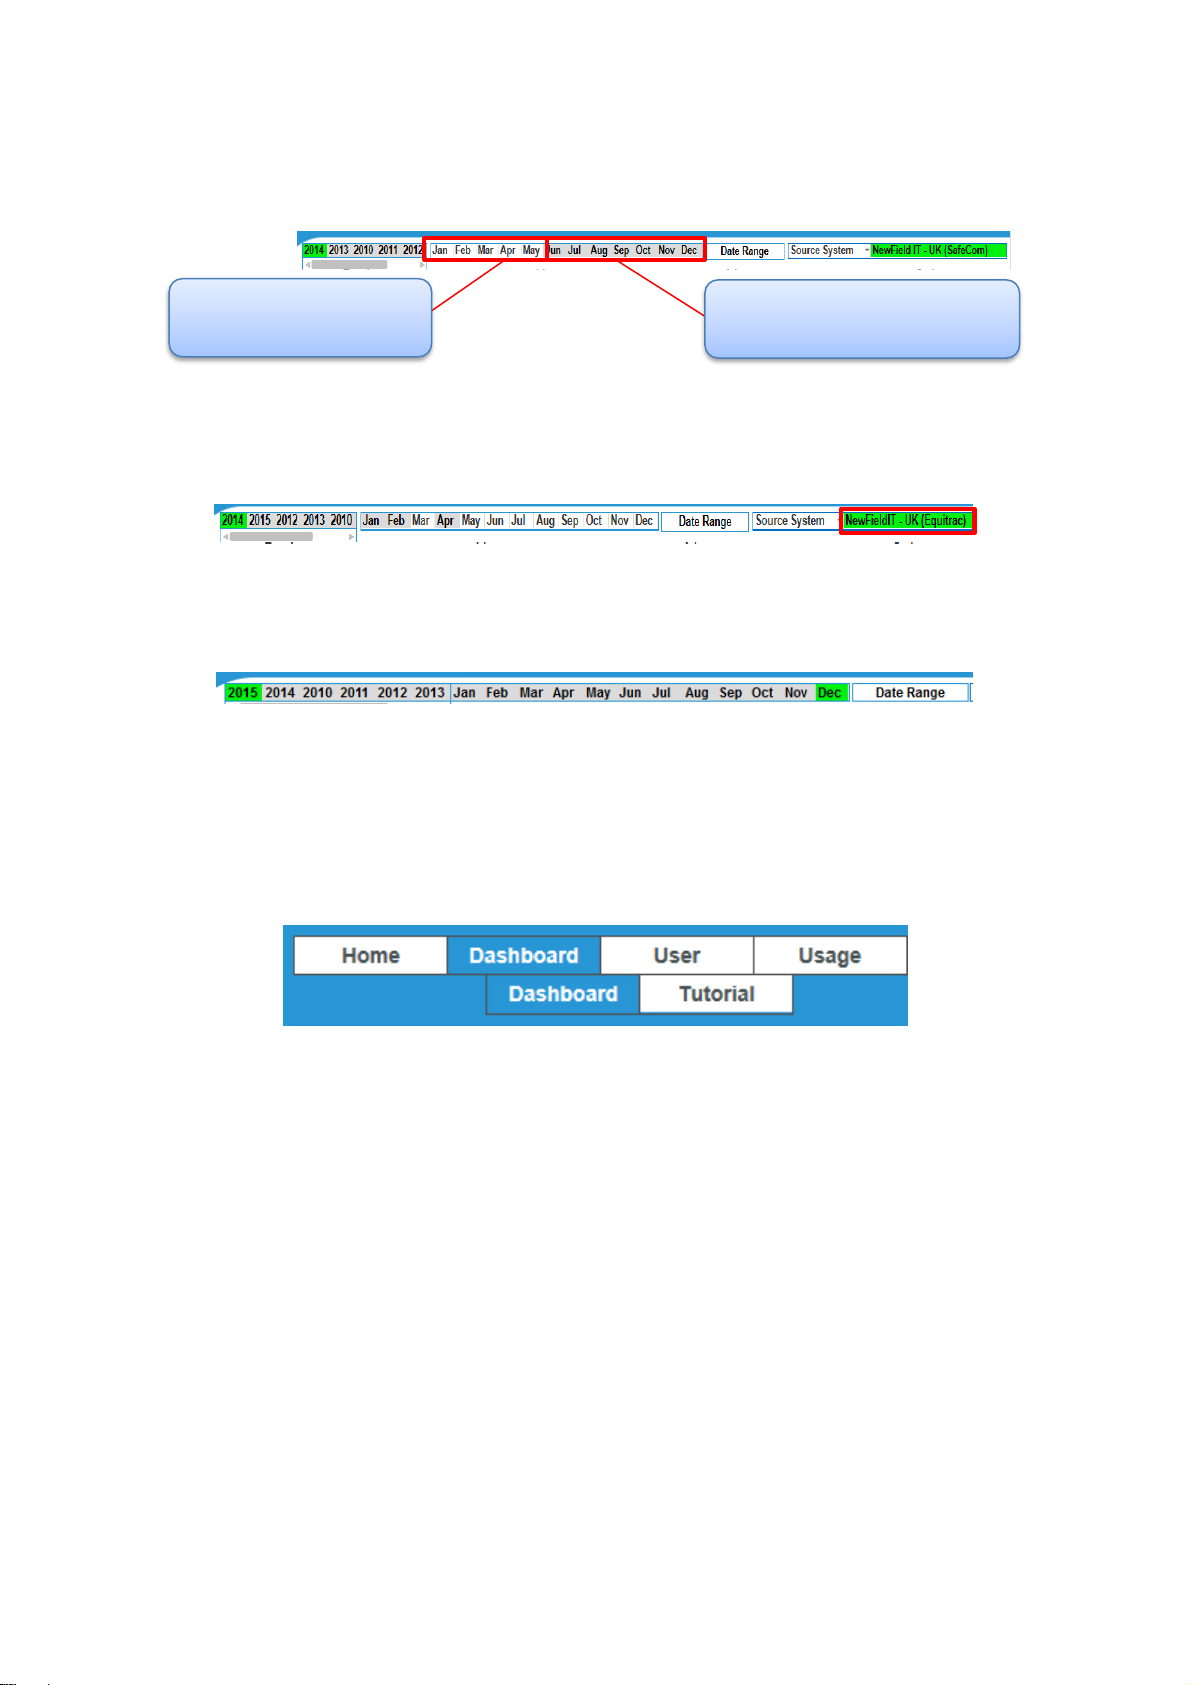
Any filter that has been selected is marked in green. Any options that aren’t available with this filter
are greyed out, see Figure 12:
Figure 12. Date selection filters with white and grey options
When switching to a different source system (if available) a different set of data and a different date
range appears, as shown in Figure 13:
Figure 13. Source system selection box
Once a specific month in a certain year has been selected then all other fields are greyed out:
Figure 14. Date selection filters with one month selected
To change the filter options simply click on a different month or year. In order to select more than one
filter hold Control and select the additional filters with a left-click of your mouse.
The tabs and sub-tabs that have been selected will appear in blue, while the other tabs appear white.
Figure 15. Tab selection
Dashboard
The Dashboard Tab
The Dashboard tab displays the following information:
- Total number of devices and average monthly volumes per device (AMPV)
- Total number of users and average monthly volumes per user (AMPV)
- Total mono pages and CPP
- Total colour pages and CPP
Unavailable options (greyed
Available options (white)
Page 12

10
- Four gauges that enable the user to simulate different Volume: Device ratios, User:Device
ratios, and a different mono/colour split by switching these volumes from mono and colour
and vice versa.
Figure 16. The Dashboard > Dashboard tab
Tutorial
This tab shows a brief tutorial which explains how the filter options work in CompleteView User
Analytics. Make a selection, then follow the instructions in this tab to find out more about the different
options that are available.
User Tab
The User tab contains three different sub-tabs: Volume, Cost, and User Details. The Volume tab is
automatically selected after choosing the User tab. While the first tab, the Dashboard, gives an
Page 13

11
overview of average monthly print volumes, all subsequent tabs provide detailed information
regarding total volumes, print jobs, departments, users and financial information.
Volume
The four different tables and graphs display various information around the print volume that is being
produced by the users.
Figure 17. The User > Volume tab
For example, the graph on the left on top of the page shows all print volumes by date. Depending on
the filter settings, all data can be reviewed or a selection for a specific year or month can be made.
Page 14

12
Figure 18. The User > Volume tab: Volume by date
On the left side of this graph, depending on the selection, the monthly or yearly volumes are
displayed. The numbers on the left indicate the volumes. The black bars display mono volume, the
blue bars colour.
When hovering over the graph, more detailed information becomes visible. For example, in the month
of January the total colour volume was 18,430 pages as shown in Figure 19.
Figure 19. The User > Volume tab: Detailed view
Page 15

13
The continuous line and the numbers on the right show the scale for number of jobs. Hover over the
knot of the continuous line to see a summary of the information in this bar as shown in the figure
below.
Figure 20. The User > Volume tab: Summarised information
The second graph on the left displays all volume by time of the day. The left side of the graph displays
the scale for mono volumes and the right side of the graph displays the colour volumes.
The up-arrow next to some of the charts enables filters to be removed from that specific chart.
When pressing the Information button on top of the page, additional information becomes
available for the individual charts:
Figure 21. “I” button information on the User > Volume tab
Page 16
14
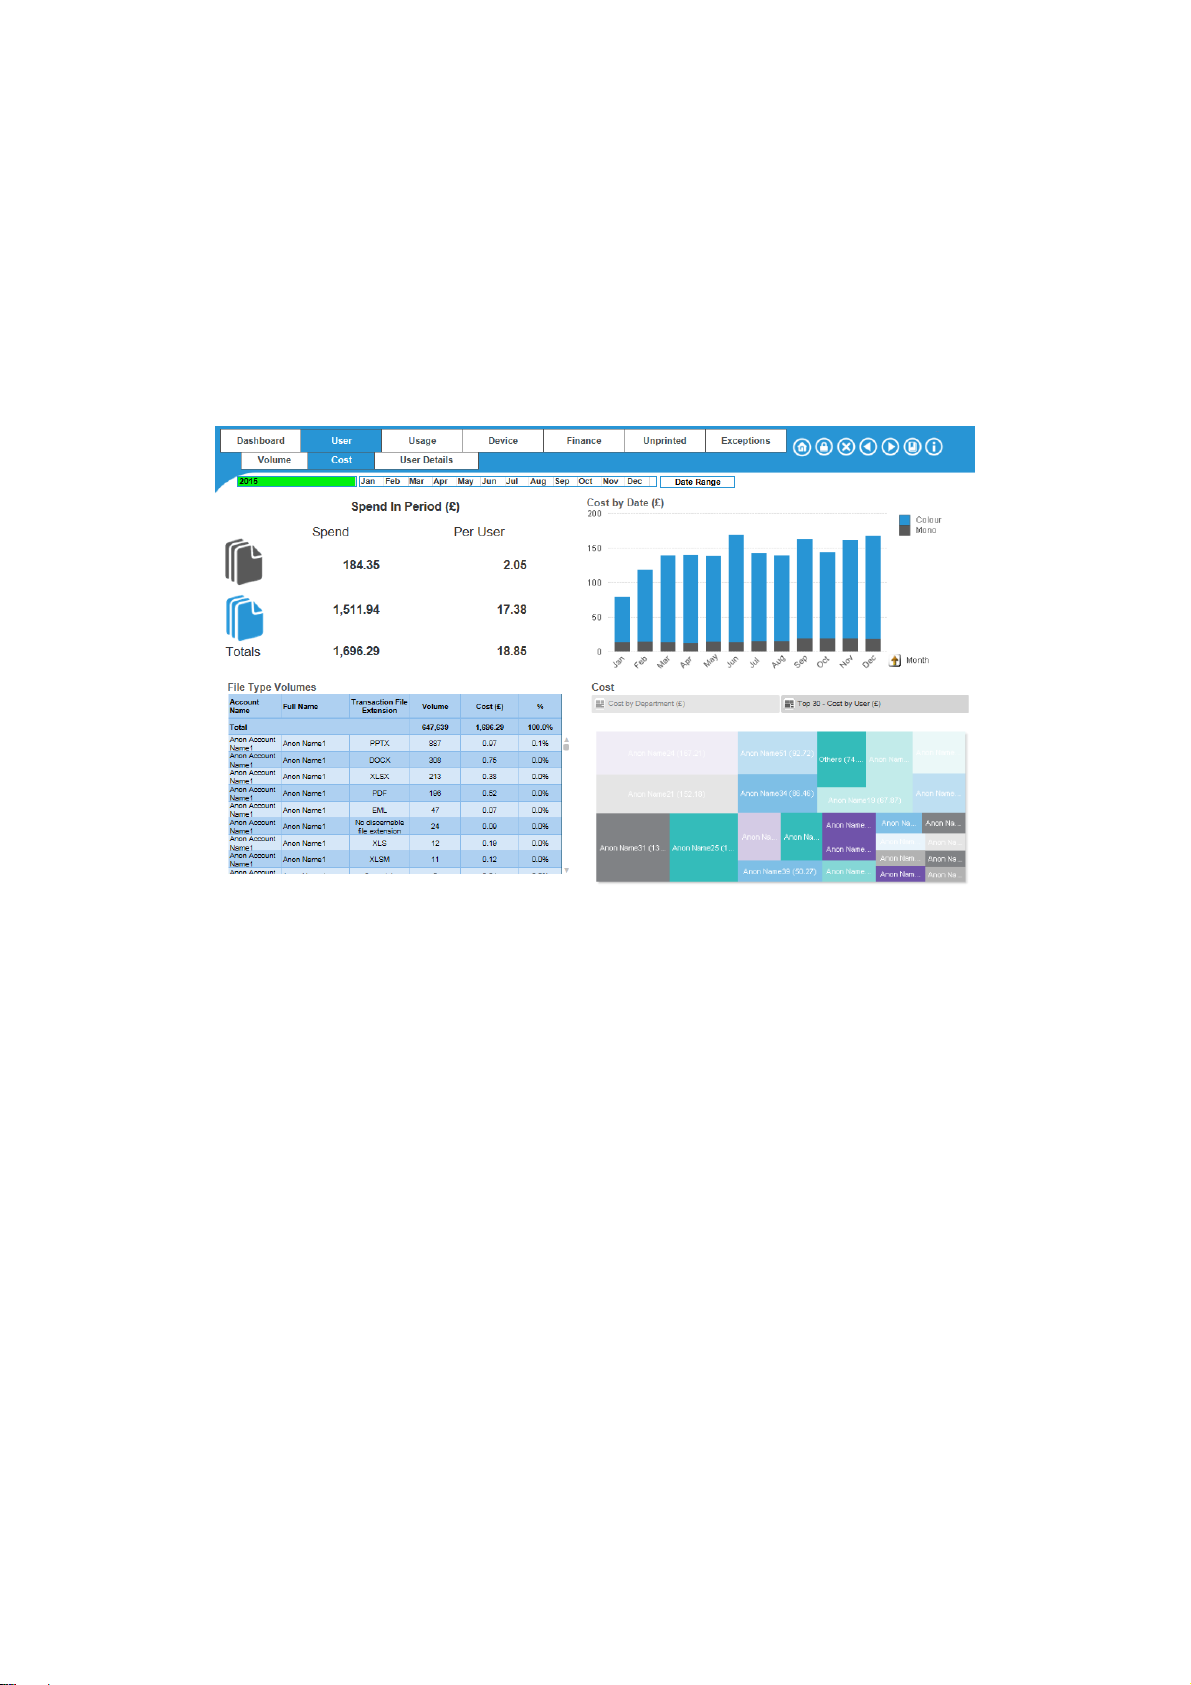
Cost
In this tab, the total spend in a certain period of time is displayed. The available charts are Spend in
Period, Cost by Date, File Type Volumes and Cost. In the Cost chart, users can switch between cost
by department and the cost by top 30 users.
The currency is determined via the source system (Equitrac, Safecom, etc) and cannot be changed in
User Analytics.
Figure 22. The User > Cost tab
Page 17

15
User Details
In this tab, two charts are available: The User Profile chart and the User Details chart. Simply click
on the title of the chart and the view will change.
The User Profile chart provides users with the colour and mono page count per department, and it
also gives the average colour and mono page count per department. The panel on the right shows the
volume, Costs Per Page (CPP) and Spend In Period split by mono and colour as well as the
average monthly volume per user.
Figure 23. The User Profile chart in User > User Details tab
When hovering over the knots in this chart more information becomes available, as shown in Figure
24.
Figure 24. Labels in User Profile chart
Page 18

16
In the User Details chart all names and email addresses of these users are listed. The listed
information is Account name, Full name, Department and Email address if available.
Figure 25. The User > Details tab
The User Details table can be exported via right-click send to Excel.
Usage Tab
The Usage tab contains three more sub-tabs. These are Documents, Cost, and Drilldown.
These will be explained further in the next three sections.
Documents
The Usage > Documents tab shows an overview of colour and mono volumes, the number of
transactions by print volumes, the volume by document type and the volume by file extension.
Page 19

17
Figure 26. The Usage > Documents tab
Depending on the filters that have been set, the data can be viewed for individual users, for
departments or a selection of users and departments.
Cost
Any costs that are shown in this tab need to be entered via the source system which can be, for
example, Equitrac or Safecom.
Users get answers to the following questions:
What is my total spend in the selected period for mono and colour?
What is the cost by date?
What are the costs for the different file and job types?
What are the costs by document type and by print job size?
Page 20

18
Figure 27. The Usage > Cost tab
Drilldown
Figure 28. The Usage > Drilldown tab > Sheets / Jobs
The Usage > Drilldown tab displays the usage by department and user. It is also possible to drill down
into different jobs and analyse them.
When choosing the option Colour / Mono instead of Sheets / Jobs, the Mono : Colour ratio by
department and by month/year becomes available.
Page 21

19
Figure 29. The Usage > Drilldown tab > Colour / Mono
Device Tab
In the device tab, two more sub-tabs are available: The Device Usage tab and the Cost tab. As with
all other tabs, the default tab selected is always the first tab from the left.
Device Usage
This tab provides detailed information regarding the number of users in relation to the volumes that
are being printed on the different devices.
The chart Volume by device & Device usage shows the correlation between the number of users
and the volume per device. Users can switch between the Device Usage by Time of Day and
Device Usage by Calendar Month graphs. These graphs shows when the highest volumes are
being printed during the corresponding day or calendar period.
The table in the bottom right corner, Print Jobs, provides detailed information on how many print jobs
each device is completing in the selected calendar period.
Page 22

20
Figure 30. The Device > Device Usage tab
Cost
In the Device Cost tab, the financial information that has been entered via the source system is
displayed. Depending on their filter settings, users can analyse their cost data via Spend period,
Cost by Date, and Cost by Device.
Figure 31. The Device > Cost tab
Page 23

21
Finance Tab
In this tab, users can review the financial data that has been uploaded via Recharge data upload. If
no data has been uploaded then these tabs don’t showing any costs.
Recharge data
In order to display the numbers for Total Spend, Variable Mono Spend, Variable Colour Spend
and Total Volume a recharge data file needs to be uploaded via the Upload section of User
Analytics.
Figure 32. Recharge Data in the Finance tab
If there is no information available and all values are set to 0, then no Recharge data has been
uploaded. This can be done via the Upload tab. Further explanations how to download and upload the
templates can be found in the Upload Tab section of this guide.
Click on the “Information” button in the top right corner to receive more details regarding the
calculations in this tab:
- All costs in the Finance area are based on the billing costs uploaded via the “Recharge –
UA.xls” file.
- Cost per page (CPP) is calculated by adding the total for mono or colour to the relative
proportion of any fixed cost divided by total mono or colour volume.
- Variable mono or colour spend equals the calculated CPP mono or colour rates multiplied by
the mono or colour volume within the selection.
Page 24

22
Time
The Time tab displays the Recharge Total Cost by billing period. This is shown in correlation with
the volumes for mono, colour and the number of print jobs.
Figure 33. The Finance > Time tab
Page 25

23
Unprinted Tab
This section of User Analytics focuses on those colour and mono pages that have not been printed.
This can be particularly interesting to observe a change in user behaviour over a certain time after
any changes have been implemented.
Transactions
Deleted transactions are shown as a chart and as a table. The table is divided into a view for Pages
and one for Cost Avoidance.
Figure 34. The Deleted Transactions (Page Count) chart
Figure 35. The Deleted Transactions (GBP) table
In both the Deleted Transactions and the Cost tab, the same table can be found for Deleted
Transactions – Pages and Deleted Transactions – Cost avoidance (see next section below).
Page 26

24
Cost
The bar chart in this section gives an overview of the Total Deleted Cost. The assumption is that any
unprinted pages equal the same amount as any printed pages. The
Figure 36. The Unprinted > Cost tab
As in the Deleted Transactions tab, users can switch between the Pages and Cost Avoidance view
in the table at the bottom.
Exceptions Tab
The default setting of the Exceptions Tab is to show any print jobs with more than 1000 pages. This
number can be changed and adjusted by clicking on the downward arrow next to the number.
The first table lists any print jobs that have been excluded because they are either incomplete, not
relevant or they contain faulty data. This information can be uploaded and adjusted via the DV data
file.
Page 27

25
Figure 37. The Exceptions tab: Print job numbers
The second table is particularly important when additional HR data needs to be uploaded.
It displays the User ID and the account name, together with the number of printed pages and the last
printout. Additionally it can display any given information that has either been made available via the
source system or via the HR upload file, such as full name, department, and email.
Figure 38. The Exceptions tab: Info for HR Spreadsheet upload
In order to be able to complete the HR upload file this table needs to be exported to Excel. None of
the User IDs should be changed. More information can be found in the training instructions that are
available in the User Analytics Upload portal.
Page 28

26
The Download Page
In the Download page, three different templates are available.
Figure 39. The Download tab
1. A word document provides detailed information how to upload the 3 User Analytics Data
Enrichment spreadsheets into User Analytics. Click on the text to download the document.
2. The second download contains the “DV- UA.xlsx” spreadsheet. Any print jobs that should be
excluded from the analysis should be listed in this spreadsheet.
3. The third download sheet contains the “HR- UA.xlsx” spreadsheet. In this document,
individual information regarding the users can be added and amended. You must export the
information from the Exceptions tab first, then complete the template with all necessary
information.
4. With the last download file allows you to amend any financial information in the Finance tab
(Recharge).
All file types are described in more detail in the next section.
Essential general guidelines for the User Analytics templates
Use the tables in the Exceptions tab in the UA application to export the base data necessary
to complete the templates.
All the blank templates required to enrich the Source System data present User Analytics
(UA) are available to download from within the UA application on the Download page in the
menu bar at the top.
All completed Excel spreadsheets should be uploaded in User Analytics via the Upload page
in the menu bar at the top. You can upload up to a maximum of 3 spreadsheets (one of each
type) in one instance. The system is built to process and overwrite data with the last uploaded
spreadsheet of each type. Therefore, if there are new updates to the data in these sheets just
upload the new batch and the User Analytics data will reflect these changes.
Page 29

27
The structure of the spreadsheet should not be altered at all (i.e. no changes to column
names, sheet names, nor changes to Excel Named Regions, if any exist). These
spreadsheets are solely meant for data entry.
When copy/paste is used in the spreadsheets, please paste “Text” only, so that no formulae
are carried through into the Excel spreadsheets.
Template 1: Data Validation – Print Job exclusion (“DV - UA.xlsx”)
The Source System database will occasionally record print jobs that were not actually produced, for a
number of reasons. Fixing this in the source database can be very difficult and time consuming, and
this kind of data will make trend analysis more difficult. To overcome this, print job references that the
user does not want to appear in the analysis can be loaded into the system, and they will be removed
from the analysis.
How to upload the Print Job Exclusions file
Go to the “Exceptions” page in User Analytics
Figure 40. Exceptions page in User Analytics
Use all usual modes of filtering in order to find the print jobs that might be erroneous.
There also 2 additional custom filters to help you (see 2. on Figure 40). The first allows you to use the
“Printed Jobs” or “Deleted Jobs” to focus on the completed print jobs or the ones that were not
collected. “Deleted Jobs” refer to the transactions shown in the UA “Unprinted” page. The “Printed
Jobs” are transactions referred to in all other UA pages.
The second allows you to focus on jobs of a specific size. Click on the drop-down to choose to “Show
Print Jobs with more pages than…” a specific volume size (see 3. on Figure 40).
The main area of focus is the “Exclude Print Job Number” column above and this information needs to
be carried through to the “DV – UA.xlsx” (see 4. on Figure 40).
Page 30

28
The print jobs you want to exclude from the analysis must have their “Exclude Print Job Number”
copied and pasted as Text only into the “DV – UA.xlsx”.
Figure 41. The DV-UA.xlsx template
If you feel more familiar or comfortable with doing your full analysis in Excel, right-click on the table in
the User Analytics application and select “Send to Excel”. When you complete your analysis,
copy/paste “Text” only into the “DV – UA.xlsx”. Do not try and save that current spreadsheet with the
name “DV – UA.xlsx”.
Figure 42. “Send to Excel” functionality in the User Analytics portal
Page 31

29
Save the spreadsheet and upload it into the portal.
Template 2: HR/User data (“HR - UA.xlsx”)
Considering Source System user data is commonly not maintained accurately, a simple Excel
spreadsheet is made available to provide accurate data. The data that can be entered in this Excel
spreadsheet are “Full Name”, “Email”, “Department Name”, and “Cost Centre”.
Please note:
“Building”, “Floor”, “Date of Birth (dd/mm/yyyy)”, “Year of Birth (yyyy)” are given as place holders for the
future UA version, but are not currently used in the application so do not need to be populated).
Important:
Please complete the “HR – UA.xslx” in such a way that it is an adequate substitute for the HR/User
data that has been taken from the underlying system(s). When an “HR – UA.xlsx” is uploaded, it
completely supersedes the HR/User information that was initially taken from the source system(s).
How to upload the HR file
Figure 43. Exceptions page in User Analytics: Information for HR Spreadsheet
1. Go to the “Exceptions” page in User Analytics.
2. Extract all the HR data in the “Info for HR Spreadsheet upload” table into Excel, either by
right-clicking on the object and selecting “Send to Excel” from the floating window or by
clicking on the Excel logo at the top right-hand corner of this table.
3. The column values that should be carried over (paste as “Text” only) to the “HR – UA.xlsx”
are “User ID”, “Account Name”, “Full Name”, “Email” and “Department Name”. The only
column where data should NOT be edited is “User ID”. These values should remain
unchanged, as this is how we identify to which user a print job is allocated to. All other fields
can be edited and you can also add “Cost Centre” as desired.
Page 32

30
4. When an “HR – UA.xlsx” is uploaded into the system, the source User data will not be
available anymore.
5. You may notice that for one system “Account Name” there are multiple (numerical) “User
IDs”. This comes from the fact that a user can be associated to multiple (database) identifiers,
e.g. a user keeps the same system account, but switches departments. One way to
differentiate which (numerical) User ID is associated to which individual and department at a
moment in time, are the 2 additional columns in the “Info for HR Spreadsheet upload”: (i)
“Last Printout” – which gives the date of the last print job sent with that “User ID” and (ii)
“Pages Printed” which gives the total amount of pages printed against that (numerical) “User
ID”.
For example, in the sample “HR – UA.xlsx” given below we can see that the (highlighted)
“Account Name” for ‘rsmith’ has two (numerical) identifiers, 2662_1680 and 2662_1681. One
was when Robert Smith was working for the IT Department and the other when he switched
to the Sales Department. This consistency and logic must be carried through in the “HR –
UA.xlsx”.
Figure 44. User details in the “HR – UA.xlsx” spreadsheet
Template 3: Billing/Recharge data (“Recharge – UA.xlsx”)
A summary of the MPS contract charges for the client (by time period) can be loaded into the application.
These are then accurately and fairly apportioned across all users for internal recharging. The mono and
colour ‘per page’ click charge is calculated based on the Total Costs (i.e. Fixed cost, Mono cost and
Colour cost) allocated for that budget period for that source system, given the respective volumes that
have been generated for that time period.
How to upload the Recharge template
Figure 45. Billing / Recharge data on the “Exceptions” page
1. Go to the “Exceptions” page in User Analytics.
Page 33

31
The “Information for Billing/Recharge” table will give you the (system) “Source Name” and its UA
unique identifier, “SourceID”, which allows us to differentiate costs attached to different systems.
Figure 46. The recharge template
The information that needs to be entered from User Analytics is the “Source ID” and the “Source
Name”.
2. Then for each billing period for each source system that you want to generate the MPS
contract charge to be able to allocate it to the individual Departments, down to the individual
and print job level, enter the “BillStartDate”, “BillEndDate” (in “dd/mm/yyyy” format only) and
the (total) Fixed, Mono and Colour cost billed to that source system.
User Analytics then calculates the click charge for a colour and mono page for that bill period and
multiplies the number of pages in a print job by that amount.
Note, as highlighted above, that the Bill Periods need to be contiguous and should not be overlapping.
If the above spreadsheet is entered and loaded, the numbers for ‘NewFieldIT - UK (Equitrac)’ will be
erroneous, as the 1st Billing Period ends on 5th of May and the 2nd billing period starts on 1st of May.
The Upload Page
In the Upload page, all uploaded templates are available in an overview and new templates can be
uploaded to enrich the data in User Analytics.
Uploading any updated spreadsheets into CompleteView User Analytics
Figure 47. The Upload page
Click on Upload in the menu bar to go to the Upload page.
Page 34

32
Figure 48. Adding a file set in the Upload page
1. Click on the "Add Fileset" button to upload a new set of User Analytics Excel spreadsheets.
2. Click on "File Upload" button to upload the files one-by-one.
3. In the "File Upload" dialog box, select the 'Data Source' from the drop-down menu that relates
to the file you want to upload.
4. Browse to the file using the "Choose File" button, select it and click on "Open".
5. Click on the "Upload" button in the "File Upload" dialog box.
6. A total of 3 spreadsheets (one of each kind) can be uploaded into one Fileset.
7. The system is set to only upload the "Current Fileset".
8. Any data that has been previously uploaded for which you have entered a new spreadsheet
will be completely overwritten by the new file(s).
9. If you want to add new information from spreadsheets you have already uploaded, click on
the "File Count" against the specific "Upload" fileset to download the related spreadsheets.
Edit these spreadsheets and upload them anew.
Your data will be ready to view within one working day.
 Loading...