

Page 1
USER GUIDE
viewLinc 4.1
Vaisala Veriteq viewLinc Software
M211519EN-A
Page 2

Copyright
Copyright 2012 Vaisala Canada Inc All rights reserved.
No copying, distribution, publication, modification, or incorporation of this document, in whole or part, is permitted for commercial purposes without the express
written permission of Vaisala Canada Inc.
Vaisala Canada Inc
13775 Commerce Parkway
Richmond, BC V6V 2V4
Canada
Trademarks
Vaisala Canada Inc, Vaisala Veriteq, Vaisala Veriteq vLog, and Vaisala Veriteq
viewLinc are trademarks of Vaisala Canada Inc.
Windows is a registered trademark of Microsoft Corporation.
All other trademarks referred to are the property of their respective owners.
Disclaimer and Limitation of Liability
Vaisala Canada Inc and its subsidiaries assume no responsibility for any damage
or loss resulting from the use of this manual.
Vaisala Canada Inc and its subsidiaries assume no responsibility for any loss or
claims by third parties which may arise through the use of this software. Vaisala
Canada Inc and its subsidiaries assume no responsibility for any damage or loss
caused by deletion of data as a result of hardware malfunction. Be sure to make
backup copies of all important data to protect against data loss.
Vaisala Canada Inc makes no warranties, either expressed or implied, regarding
Vaisala Veriteq data loggers, Vaisala 300 Series Transmitters, or software, its merchantability, or its fitness for any particular purpose. The exclusion of implied warranties is not permitted by some states. As such, the exclusion may not apply to
you.
Vaisala Veriteq viewLinc has been tested using a variety of network systems. However, the large number of possible hardware and network configurations makes
testing under every circumstance impossible. If you have trouble using Vaisala
Veriteq viewLinc software, contact Vaisala Canada Inc.
Technical Support
For technical support in North America, please call 1-866-861-3388, or for customers outside North America, see “Getting Help” on page 6.
Email: veriteqsupport@vaisala.com
Document part number: M211519EN-A
Release date: Oct 2012
Page 3

Contents
Chapter 1: Getting Started . . . . . . . . . . . . . . . . . . . . . . . . . . . . . . . . . . 1
Chapter 2: Locations . . . . . . . . . . . . . . . . . . . . . . . . . . . . . . . . . . . . . . 9
Overview . . . . . . . . . . . . . . . . . . . . . . . . . . . . . . . . . . . . . . 2
Logging in to viewLinc . . . . . . . . . . . . . . . . . . . . . . . . . . . 3
What’s New in viewLinc . . . . . . . . . . . . . . . . . . . . . . . . . . 5
Getting Help . . . . . . . . . . . . . . . . . . . . . . . . . . . . . . . . . . . 6
About Locations . . . . . . . . . . . . . . . . . . . . . . . . . . . . . . . 10
What is a Location? . . . . . . . . . . . . . . . . . . . . . . . . . . . . . . 10
Understanding the Locations Screen . . . . . . . . . . . . . . . . . 11
Understanding the Options Dropdown Menu in Locations . 13
Understanding The Tabs in Locations . . . . . . . . . . . . . . . . 14
Building a Trend with the Trend Tab . . . . . . . . . . . . . . . . . 15
Understanding the Dropdown Menus and Buttons in the Loca-
tions Tabs . . . . . . . . . . . . . . . . . . . . . . . . . . . . . . . . . . . . . . . . 16
Opening Large Popup Trend Views . . . . . . . . . . . . . . . . . . 18
Real-Time Graphs . . . . . . . . . . . . . . . . . . . . . . . . . . . . . . 19
Reading Graphs in Popup Trend View . . . . . . . . . . . . . . . . 20
Viewing Graph Detail in Large Popup Trend View . . . . . . . . 21
Acknowledging Alarms from Large Popup Trend View . . . . 21
Chapter 3: Alarms . . . . . . . . . . . . . . . . . . . . . . . . . . . . . . . . . . . . . . . 23
About Alarms . . . . . . . . . . . . . . . . . . . . . . . . . . . . . . . . . 24
What Happens When an Alarm is Triggered? . . . . . . . . . . . 25
Threshold Alarms . . . . . . . . . . . . . . . . . . . . . . . . . . . . . . 26
Acknowledging Alarms . . . . . . . . . . . . . . . . . . . . . . . . . . 27
Pausing Alarms . . . . . . . . . . . . . . . . . . . . . . . . . . . . . . . . 28
Chapter 4: Events . . . . . . . . . . . . . . . . . . . . . . . . . . . . . . . . . . . . . . . 31
Viewing Events . . . . . . . . . . . . . . . . . . . . . . . . . . . . . . . . 32
Adding Comments to Events . . . . . . . . . . . . . . . . . . . . . . 33
Adding Custom Events . . . . . . . . . . . . . . . . . . . . . . . . . . 34
viewLinc 4.1 User Guide i
Page 4

Contents
Printing Event Logs . . . . . . . . . . . . . . . . . . . . . . . . . . . . .34
Exporting Event Logs . . . . . . . . . . . . . . . . . . . . . . . . . . . .35
Chapter 5: Reports . . . . . . . . . . . . . . . . . . . . . . . . . . . . . . . . . . . . . . .37
About Reports . . . . . . . . . . . . . . . . . . . . . . . . . . . . . . . . .38
Generating Historical Data Reports . . . . . . . . . . . . . . . . . .38
Generating Alarm History Reports . . . . . . . . . . . . . . . . . . . 39
Generating Location History Reports . . . . . . . . . . . . . . . . . 41
Chapter 6: Mobile UI . . . . . . . . . . . . . . . . . . . . . . . . . . . . . . . . . . . . .45
About the Mobile UI . . . . . . . . . . . . . . . . . . . . . . . . . . . . . 46
Logging in to the the Mobile UI . . . . . . . . . . . . . . . . . . . . . 46
Working with the Mobile UI . . . . . . . . . . . . . . . . . . . . . . .47
Acknowledging Alarms with the Mobile UI . . . . . . . . . . . . . 50
Index . . . . . . . . . . . . . . . . . . . . . . . . . . . . . . . . . . . . . . . . . . . . . . . . .53
ii
© 2012 Vaisala Canada Inc
Page 5

Chapter 1: Getting Started
This section includes:
• Overview of the Vaisala Veriteq Continuous Monitoring
System (CMS)
• Logging in to viewLinc from an Internet Browser to Monitor
Conditions
• First Steps in viewLinc
• What’s New in viewLinc
• Getting Help
viewLinc 4.1 User Guide 1
Page 6

Chapter 1: Getting Started
Overview
Welcome to viewLinc 4.1, a key element in the Vaisala
Veriteq Continuous Monitoring System (CMS). Using
viewLinc you can easily monitor device readings locally on a
PC or across a network using a supported version of
Microsoft
the iPhone
administrator will determine the best way to install viewLinc
for your needs.
With viewLinc 4.1, you can:
• Monitor remote conditions in multiple languages from
multiple devices from a local or remote PC desktop
• View real-time data in a customizable graphical format
• Generate historical data and alarm reports
• Receive visual or email alarms when conditions you are
monitoring are out of compliance or if there is a network
communication problem
• Analyze automatically documented device events, such as
when alarms are triggered, acknowledged or there are
device communication problems
• Schedule transfers of Vaisala Veriteq device data (also
referred to as ‘historical data’) to be viewed and graphed
with the vLog software
• Easily identify devices and the zones in which they
operate
• Create preconfigured comments for alarm notifications
• Check readings and acknowledge alarms from your
mobile device
When installed, the Vaisala Veriteq CMS is comprised of
software components (including viewLinc), and hardware
components (including devices, a PC with a supported
Internet browser, and, depending on how you connect the
devices to your PC, various cables, Vaisala Veriteq vNet or
Digi networking devices).
® Internet Explorer® or from mobile devices like
®, Google Android®, or Blackberry®. Your
2
© 2012 Vaisala Canada Inc
Page 7
Logging in to viewLinc
viewLinc allows you to:
• watch conditions (such as temperature and relative
humidity) being recorded by devices and in the viewLinc
historical database
• receive alarms if conditions are outside limits you set or if
there is a communication problem
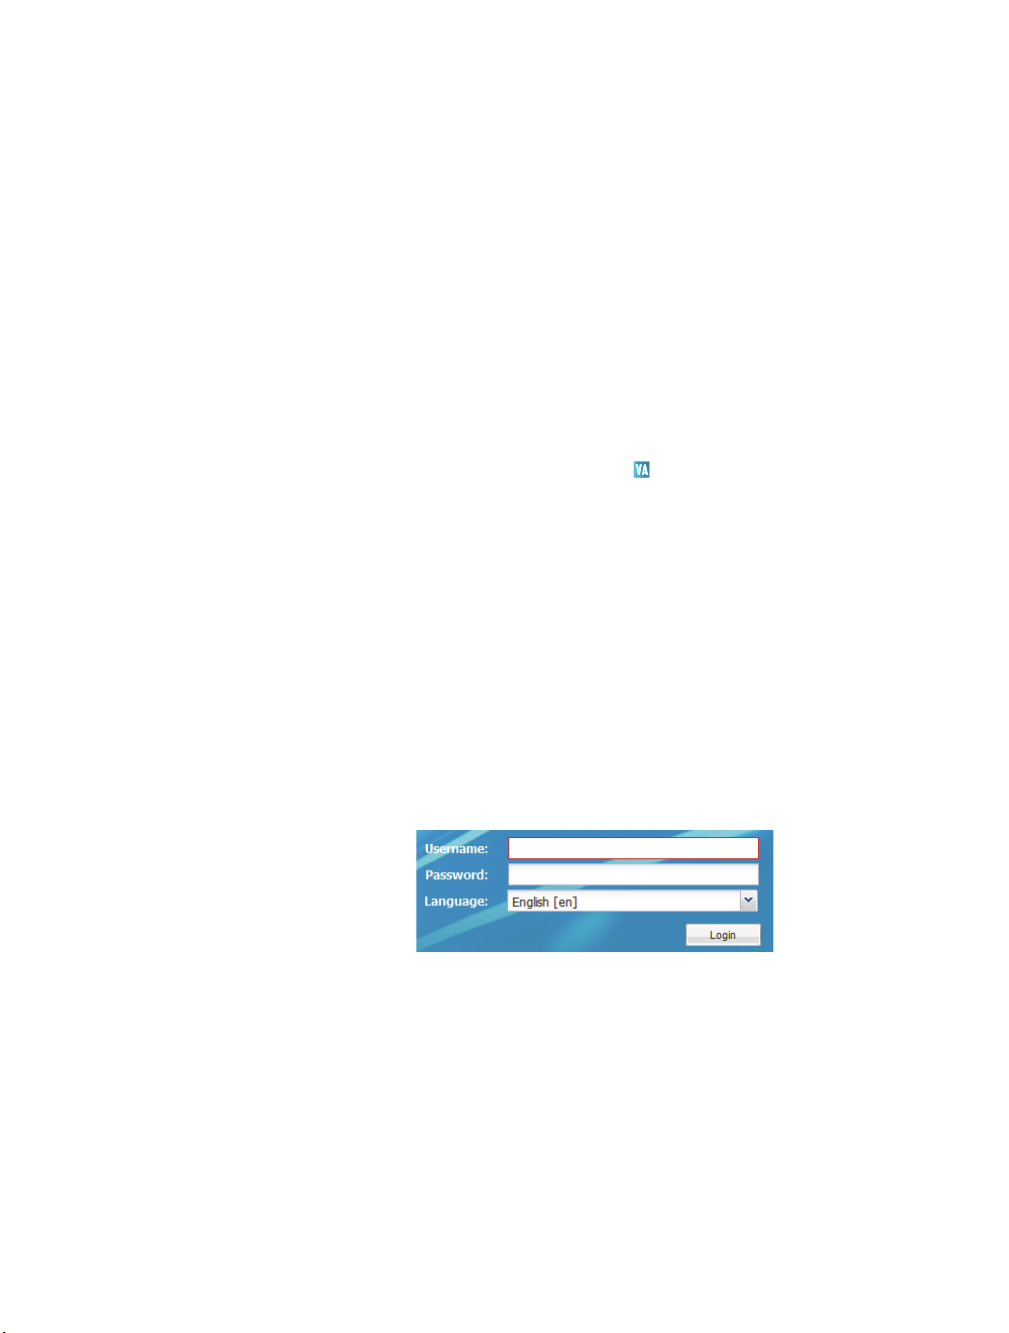
When you are ready to start using viewLinc, log in to
viewLinc from a supported Internet browser.
To log in to viewLinc:
1 Double-click the desktop icon .
2 Or, in the address box of a supported Internet browser,
enter the name or address of the machine where
viewLinc is installed, and the port number. Your
administrator will give you the correct address. For
example, http://computername:portnumber or https://
computername:portnumber if secure. (if no port number
is specified, 443 is used by default). Save this address to
your favorites or set as your homepage to easily access
viewLinc from your browser.
3 In the login screen, first select your language from the
language drop-down. When a new language is selected,
the page will automatically refresh and update
accordingly. This language setting will remain the same
as long as the browser’s cookies are kept.
Logging in to viewLinc
viewLinc 4.1 User Guide 3
Page 8

Chapter 1: Getting Started
Note: Ensure that your browser is not set to automati-
Enter your username and password. Click Login.
4
5 The main viewLinc screen appears, showing “Getting
Started” screen. To start using viewLinc, click the Options
button and choose Locations.
cally delete cookies upon exit.
6 Here you will find a tree view with your location and
device data. Expand the tree with the plus icon. If you
don’t see any Location data, click a Location from the
tree view, and select
Options | Refresh. The selected
Location’s data should appear.
If no Locations display, you may not have any Locations
assigned to you, the administrator may need to configure
the system, or there could be a problem with viewLinc
itself. Speak to your administrator.
Note: The administrator may have set up the system to
prompt for password periodically to ensure sys-
4
© 2012 Vaisala Canada Inc
Page 9

tem security. When prompted, re-enter your
password.
For more on locations, see Chapter 2: Locations.
What’s New in viewLinc
Locations: A Location is a ‘data point’ which can be linked to
any channel and is located in a hierarchical tree of zones.
The Locations feature replaces the previous channels/my
channels functionality, providing improved customization and
flexibility with more information available from the tree view.
Views: A View is a customized combination of locations
selected from all available zones by the user. They offer the
flexibility of navigating a tree view similar to the locations
view with a customized hierarchical zone organization. They
can be customized so a user can create a view of all location
readings regardless of zone. These Views remain saved and
allow each user to have the software set up in a way that
better suits their role or job function.
Trends: Trends are custom graphs which can be built with
user friendly drag and drop functionality. The trend view
allows you to combine, contrast and compare location history
in visual graphs using real-time data.
Dashboards: Dashboards provide the ability to upload a
custom image for any zone or view and place locations on
this image (for example a map or floor plan). They provide a
customized display of the current readings at several
locations at a glance.
Mobile Support: viewLinc 4.1 provides improved access from
mobile devices, allowing you to perform key tasks from your
smartphone or tablet. Apple iPhone iOS
2.1+, and BlackBerry
Device Support: viewLinc 4.1 provides support and
configuration options for all new compatible devices,
including the Vaisala HUMICAP® Wireless Humidity and
Temperature Transmitter HMT140.
® 6+ devices are supported.
What’s New in viewLinc
® 3+, Android®
viewLinc 4.1 User Guide 5
Page 10

Chapter 1: Getting Started
Getting Help
If you need help, technical support is available:
North America
Contact Vaisala Canada Inc, 8am-4pm PST Monday - Friday,
at 1-866-861-3388 (or 604-273-6850) or email
veriteqsupport@vaisala.com. See also http://
www.vaisala.com/en/lifescience.
For sales, pricing, quotations, or general information, please
call 1-800-683-8374 (or 604-273-6850).
Outside of North America:
helpdesk@vaisala.com
Vaisala Headquarters (Finland)
Vanha Nurmijärventie 21
01670 Vantaa
FINLAND
Industrial Instruments
Phone: +358 9 8949 2658
Fax: +358 9 8949 2295
Japan Service Center
42 Kagurazaka 6-Chome
Shinjuku-ku
Tokyo 162-0825
JAPAN
Phone: +81 3 3266 9611
Fax: +81 3 3266 9610
China Service Center
Floor 2, EAS Building
No. 21, Xiao Yun Road, Dongsanhuan Beilu
Chaoyang District
6
© 2012 Vaisala Canada Inc
Page 11

Beijing 100027
CHINA
Phone: +86 10 5827 4100
Fax: +86 10 8526 1155
Getting Help
viewLinc 4.1 User Guide 7
Page 12

Chapter 1: Getting Started
8
© 2012 Vaisala Canada Inc
Page 13

Chapter 2: Locations
This section is for administrators and general users.
In this section, you’ll learn about:
• Locations, Trends, and Zones
• Selecting Channels and Zones to display as Locations
• Opening Large Popup Trend Views
• Viewing and Working with Real-time Graphs in a Large
Popup Trend View
• Displaying or hiding Location information
Let’s get started learning what locations are in viewLinc.
viewLinc 4.1 User Guide 9
Page 14

Chapter 2: Locations
About Locations
What is a Location?
The Locations feature is new to viewLinc 4.1, giving the user
improved customization with more information available
more readily from the Location tree view. A Location is a
‘data point’ which can be linked to any single channel and
can be located in a hierarchical tree of zones. It removes the
hardware definition of host/device/channel from the Location
tree, allowing any channel to become a Location. Depending
on the type of Vaisala devices you have installed, a device
may have up to five active channels and up to 27 definable
channels available to measure readings such as
temperature, relative humidity, voltage, pressure, current,
etc. (one channel is used for each type of measurement).
Note: 300 Series Transmitters Output Quantities are
Using viewLinc, you can monitor any device that is
connected to the network using Locations.
When you first log in to viewLinc, you can load the Locations
function by clicking on the main screen
selecting
• zones and locations available for monitoring in an
expandable tree view
• locations available for each selected zone
• table view which allows you to view and monitor data from
zones and/or locations
• trend view which allows you to combine, contrast and
compare location history in visual graphs with real-time
data
• context-sensitive help
Locations. This window includes:
displayed as Channels. (currently 27 possible
types)
Options button and
10
© 2012 Vaisala Canada Inc
Page 15

About Locations
2
3
5
4
1
Understanding the Locations Screen
The Locations screen in viewLinc contains many important
features:
Item Details
1 - Tabs Contains main viewLinc tabs: Table View, Dash-
board, Location Alarms, Trend.
2 - Options
dropdown
Contain buttons like Refresh, Popup Trend, Pause
Alarming, etc. These menus are context-sensitive
- they change depending on which tab is open
and which item is selected within the tab.
3 - Zones area Where configuration of locations and zones takes
place. Use the locations tree to organize the locations that are connected to viewLinc into zones.
Zones are represented by folders with Locations
located below them in the tree. Locations are
found below the zones. The table view on the
right will display information about the zone or
location that you have selected.
4 - Search You can search for locations here by entering a
search term in the text box and clicking the magnifying glass icon.
Tabl e 1: Important features of the Locations screen
viewLinc 4.1 User Guide 11
Page 16

Chapter 2: Locations
Item Details
5 - Location
Details
In Table View mode, includes details on channel
configurations, paths, current data readings, latest timestamp and threshold information.
Tabl e 1: Important features of the Locations screen
The Locations screen displays general information about the
corresponding data source. When a location has no data
source associated with it, it will be displayed with a blue
exclamation mark icon. The Locations screen can also
display views by clicking anywhere in the dark grey bar
labelled “Views.” Views have the same functionality as
locations, but are customized versions of the locations tree.
Each View can also have a Trend associated with it that is
displayed in the Trend panel whenever a View is selected. A
Trend is a historical view of Location data.
Most columns in the 4 tabs (Table View, Dashboard, Location
Alarms, Trend) are easy to understand; however, here are
their definitions to help you get familiar with viewLinc. To see
all options, see “Hiding and Showing Location Columns” on
page 36:
Column Displays
12
Icon The color coded icon associated with the
location.
Location ID Device description (can be edited from the
System tab).
Device ID The number associated with the device.
Location Path The subfolders currently linked with the
location. The top folder in the path will
always be the default ‘System’.
Location Description The description for the location that was
entered at the time of creation.
Tabl e 2: Columns of information in Locations
© 2012 Vaisala Canada Inc
Page 17

About Locations
Column Displays
Device Serial Number The serial number associated with the
device.
Device Description The description that was entered for the
device at the time of configuration.
Channel ID The system defined number associated
with the channel.
Channel Number Number representing the channel for that
device (each device has 1 or more channels, and labels them 1, 2, and so on).
Channel Description Description of channel (editable from the
System tab).
Battery Status The estimated battery level or if no bat-
tery, power method. Please note that any
battery level readings are estimated readings and may not be precisely accurate.
Value Reading of that channel, for example the
temperature in Celsius.
Timestamp Time that the last reading was taken.
Device Status The current status of the device. Displays
errors if the device is inactive.
Threshold Status “OK” appears if there are no currently
active alarms. Changes to indicate if a
threshold alarm condition has been
detected.
Threshold Summary Summary of threshold status, if active.
Tabl e 2: Columns of information in Locations
Understanding the Options Dropdown Menu in
Locations
The Options dropdown menu in the left panel of Locations
allows you to select commonly used commands. Some of
viewLinc 4.1 User Guide 13
Page 18

Chapter 2: Locations
these commands will be available or greyed out depending
on the location/zone you have selected, if any. You will also
need the appropriate permissions to perform certain
commands. If you don’t have permission but think you
should, speak to your administrator. The following options
are available:
Refresh: Reloads the selected tree.
•
•
Expand/Collapse All Zones: Expands/collapses all zones
and sub-zones of the tree in the left locations panel.
Pause Threshold Alarming: Pauses the threshold alarms
•
for the zone or location selected in the tree. If a zone is
selected and there are child locations, this command will
pause alarming on all child locations within the selected
zone.
Resume Threshold Alarming: Resumes threshold alarms in
•
all data locations selected in the right panel. If a zone is
selected and there are child locations, this command will
resume alarming on all child locations within the selected
zone.
14
Understanding The Tabs in Locations
The right panel in locations is a tabbed panel consisting of
four tabs that are updated as the Locations tree is navigated.
The four tabs are as follows:
Table View Tab: Displays the location, device, threshold
•
and status information for the currently selected location.
Only locations that have channels assigned to them will be
displayed.
Dashboard Tab: Displays the dashboard for the current
•
selected location or zone and sub-zones. Locations are
displayed on the dashboard with their current reading.
Zones are displayed as a folder icon and can be opened
by double clicking this icon. Hovering over a zone or
location will cause the mouse pointer to change and will
display a tooltip with extra information.
Location Alarms Tab: All active alarms for the current
•
location or zone and sub-zones are shown under this tab.
If acknowledgement is required on an Alarm, the alarm will
be present in this window whether it is on or off. If
© 2012 Vaisala Canada Inc
Page 19

About Locations
acknowledgement is not required on an alarm, the alarm
will be present in this window only if it is currently on.
Trend Tab: When browsing the Locations tree, the trend
•
tab enables you to build and display location trends quickly
and save them as Views as follows.
Building a Trend with the Trend Tab
To create a custom trend using the trend tab:
Navigate the Locations tree to find a location you would
1
like to graph in a trend.
2 Drag and drop one or several locations from the
Locations tree onto the graph panel on the right.
3 Save the trend as a View by clicking the Options
dropdown and selecting
become available in the views section and can be
accessed any time. You can continue to build upon and
modify your trend at any time by simply dragging more
channels onto the graph and saving again.
4 Check and uncheck the ‘Selected’ column in the grid
located in the Locations tab just below the graph. Click
live button or click Options | Refresh to refresh the
the
graph and it will graph only the data you have selected
with these checkboxes.
5 Plot threshold lines on a location by checking the
‘Threshold Lines’ column and refreshing again. The
panel displays statistics information for each graph line.
6 Click on the Group Statistics tab to see the totals and
max/min ranges for all locations together.
7 Click on the Scale tab to adjust the values for the scale of
the graph. The default low/high range is set to auto.
Clicking on this ‘auto’ text enables you to enter new
values for the graph which will be applied when the graph
is refreshed or the
maximum of 16 locations (lines) per trend.
8 Click Options | Save As Report and specify a name for
your report. The report will be available with the name
you specified in the Reports section.
Save as View. The view will then
Live button is selected. There is a
viewLinc 4.1 User Guide 15
Page 20

Chapter 2: Locations
9 The trend tab also contains navigation controls which
allow you to navigate historical data trends and refresh
the view as necessary:
• Pressing on the
forward and back arrows will
adjust the start time accordingly, while pressing on the
double forward and back arrows will adjust the start
time by a greater distance.
• Pressing the
live button will fetch the most recent
data using the ‘duration’ combo box value to adjust the
start date of the graph.
• The top right check box labelled ‘Auto Refresh On’ will
toggle the auto refresh option. Uncheck it to stop
periodic updates, or check it to have the same effect as
pressing the
live button.
• Navigating or zooming within the trend will
automatically uncheck the “Auto Refresh On” option,
because when you navigate within you are then
viewing historical data.
page 19.
See “Real-Time Graphs” on
Understanding the Dropdown Menus and Buttons in
the Locations Tabs
The four tabs in the Locations panel contain various options
and control buttons to help you customize, manage and
display data.
16
© 2012 Vaisala Canada Inc
Page 21

About Locations
Table View Tab Options
• Refresh: Reloads grid data with latest information.
•
Popup Trend: Pops up the trend graph display of the
selected row.
Properties: Displays the properties window for the selected
•
row.
Pause Threshold Alarming: Pauses threshold alarming of
•
the selected row.
Resume Threshold Alarming: Resumes threshold alarming
•
of the selected row.
Pause Host Alarming: Pauses host device alarming for the
•
selected host.
Resume Host Alarming: Resumes host device alarming for
•
the selected host.
Pause Device Alarming: Pauses alarming on the selected
•
device.
Resume Device Alarming: Resumes alarming on the
•
selected device.
Dashboard Tab Options
Contains only the Refresh option, which reloads data from the
server when clicked.
Location Alarms Tab Options
• Refresh: Reloads data from server.
•
Print: Prints the Active Alarms information. The Active
alarm information will print, including all the details about
the alarms by clicking this button.
Export the Active Alarms information to Excel: All active
•
alarm information can be exported to excel with the details
about the alarms present under the Active Alarms tab.
Clicking on the Export to Excel button asks the user to
open or save the TSV file as shown.
Note: TSV format is used because it is not affected by
regional settings, unlike the CSV format.
viewLinc 4.1 User Guide 17
Page 22

Chapter 2: Locations
Trend Tab Options
• Refresh: Reloads data from server.
•
Clear: Clears all channels from the trend. This option is
visible when building trends from the ‘System view’ tree.
Save as View…: Displays a window to save the current
•
trend as a View. This option is visible when building trends
from the ‘Locations’ tree.
Save as Report…: Displays a window to save the current
•
trend as a single page ‘History Report’.
Save: Saves the current trend. This option is visible when
•
browsing trends from the View tree.
Popup in New Window: Pops up the trend in a new browser
•
window. This option is visible when browsing trends from
the View tree.
Include Realtime Samples: When checked, this option will
•
draw real time samples along with the logged data.
Show Data Markers: When checked, this option will draw
•
small markers on the trend, indicating exactly where the
readings took place.Some of these options may be
unavailable to you depending on the rights given to you by
the system administrator. If you don’t have permission to
perform a function you need, speak to your administrator.
18
Opening Large Popup Trend Views
The Large Popup Trend window contains the most current
data reading for the location, any related threshold settings, a
graphical representation of recent historical data readings,
and an area to indicate an active alarm.
Note: You can view a particular location’s data reading
in a single window, or you can open multiple
location windows. If you use Internet Explorer,
ensure your browser is set up to open new links
in a new window or tab. Go to Tools | Internet
Options, then, on the General tab in the Tabs
section, click Settings and choose to open links
from other programs in a new tab in the current
window.
© 2012 Vaisala Canada Inc
Page 23

To open a large popup trend view:
From the Options | Locations window, browse the
1
locations tree and left click to select a location you want
to view.
2 Right click Popup Trend or double click the selected
location line. A new resizeable window containing
information about the selected location appears.
3 Repeat steps 1 and 2 to view multiple large popup trend
views. Many users choose to have multiple monitors
displaying multiple trends by dragging each windows to
various monitors as desired.
To close a large popup trend view, click the close box (x) in
the top right corner of the window.
To acknowledge an alarm, see “Acknowledging Alarms” on
page 27.
Real-Time Graphs
With viewLinc, you can view live data in graphical form at any
time using the Trend tab in Locations.
To view live data as a graph:
From Options | Locations, click the Trend tab.
1
2 Expand the Locations tree on the left to find a Location
you wish to graph. Drag locations as you wish from left to
right (with a limit of 16 channels). The comparative data
of all the Locations you selected will be displayed in the
Trend tab.
3 Right click on a location and click Popup Trend. This
opens the large trend view with both a graph and current
value (for a single location only).
In this screen you can view the most recent historical trends,
and hover over specific data points for more detailed
readings.
Real-Time Graphs
viewLinc 4.1 User Guide 19
Page 24

Chapter 2: Locations
Reading Graphs in Popup Trend View
When you open a location, you can see both a numerical and
graphical representation of the device reading. Here is a
description of the key elements in the graphing area:
Title bar Displays the name of the Zone and type of
Header bar Indicates the date and time of latest read-
Numerical display area Displays most current data value in units
Graph area A graphical representation of data history
Item Description
location data reading (humidity, temperature, voltage or current).
ing; the time zone is based on the time
zone setting of the PC running the
browser. The graph header bar also displays the number of data points being
measured.
being measured, as defined by the user.
is displayed here.
20
Left-side Y-axis Shows the scale for the data displayed in
the graph.
X-Axis time scale Shows the reporting time frame ( if you
use Internet Explorer, you can only view
the last 300 data points; all other browsers will show the last 1000 points).
Graph Line Indicated by a line to show historical mea-
surement readings based on a specific
date or time frame. Move your mouse and
hover over a specific point to show the
specific X- and Y-axis values.
Table 3: Large Popup Trend view elements
© 2012 Vaisala Canada Inc
Page 25

Real-Time Graphs
Item Description
Threshold Line Indicated by a color-coded line (based on
threshold setting) to show historical
threshold values. Move your mouse and
hover over a specific point to show the
specific X- and Y-axis values.
Active Alarms area Displays active alarm details: Threshold
value and amount exceeded; alarm date
and time; whether the alarm was
acknowledged, and by whom. Permits
user to acknowledge an alarm. If you don’t
see the active alarm area, there may be no
alarms to display. It can still be shown
using the double arrows on the right hand
side of the popup trend.
Status bar Indicates channel monitoring status (OK or
Alarm/Alarm condition type).
Table 3: Large Popup Trend view elements
Viewing Graph Detail in Large Popup Trend View
With a Large Popup Trend View open, you can also zoom in
on a specific time period.
Simply click anywhere on the graph and drag your cursor to
the right to highlight the time period you want to magnify, then
release. The magnified area displays until the next live
update. To return to full view immediately, double-click
anywhere on the graph (or to zoom out, select an area, drag
cursor to the left, then release).
Acknowledging Alarms from Large Popup Trend
View
From a Large Popup Trend View window, you can
acknowledge alarms.
To acknowledge an alarm from a large popup trend view:
1
From the large popup trend view “Active Alarms” panel,
click
viewLinc 4.1 User Guide 21
Acknowledge.
Page 26

Chapter 2: Locations
2 In the Acknowledge Alarm dialog box that appears, enter
3 Click Acknowledge.
information to describe what was done to correct the
alarm situation, or a general comment. You can also
select from the dropdown of preconfigured comments if
you prefer.
22
© 2012 Vaisala Canada Inc
Page 27

Chapter 3: Alarms
Alarms and Alarm Acknowledgement are the keys to success
with the Vaisala Veriteq Continuous Monitoring system.
In this chapter, you’ll learn to:
• Understand Types of Alarms in viewLinc
• Create Alarm Templates
• Set threshold and Device Alarms
• Deactivate and Reactivate Alarms
• Acknowledge Alarms
•Pause Alarms
To learn about how to generate Alarm reports, see Chapter
5: Reports.
Let’s get started looking at alarms.
viewLinc 4.1 User Guide 23
Page 28

Chapter 3: Alarms
About Alarms
There are several types of alarms in viewLinc: threshold
alarms, communication alarms, event log validation alarms,
and device sampling alarms. If you are using validatable
devices, you may also receive device validation alarms and
calibration alarms.
Users with the appropriate ACL permissions can set
threshold alarm limits and when conditions exceed these
limits, alarms are triggered which notify key staff of the
condition. Staff with Acknowledge Alarms permissions or
higher then acknowledge the alarms in viewLinc.
All transactions are recorded in the Event Log and the
Historical database.
Threshold Alarms
Threshold Alarms notify users when conditions (such as
temperature and relative humidity) are outside acceptable
limits.
Threshold alarms are not enabled by default. To trigger
threshold alarms when certain thresholds are exceeded,
users with assigned permissions must configure them.
24
Communication Alarms
Communication Alarms notify users when communication
between a host (Device Host or viewLinc Server) and its
devices is down. This may be because viewLinc Server can
not communicate with the device, or the device connection to
a host has been severed. Communication alarms serve as a
system health test, alerting you if there is a problem that
might disrupt viewLinc monitoring and alarming.
Event Log Validation Alarms
An Event Log Validation Alarm indicates when changes have
been made to the event log from outside the viewLinc
system. Each entry in the event log has its own CRC which is
verified - if any changes have been made, an alarm is
automatically created, rendering data non-validatable. It
checks the CRC of event files, checks the CRC of event
© 2012 Vaisala Canada Inc
Page 29

About Alarms
records in the files, checks for missing records, and checks
for missing files. If any are discovered, an alarm is raised
and must be acknowledged.
Device Configuration Alarms
If you receive a Configuration Alarm, this indicates that your
device has stopped recording data history or was configured
incorrectly. This could be the result of being set to stop when
full, a delayed start, or the device could have an internal
error. This alarm can also be triggered if a channel has been
disabled in the device using vLog. To correct this issue, you
can verify or modify the Vaisala Veriteq device settings using
vLog. If the problem persists, contact your Vaisala technical
support representative. The default delay for configuration
alarms is 60 seconds. However this delay is bypassed for
certain alarm types such as Missing Channel alarms,
Configuration changes and Probe changes.
Device Validation Alarms
If you use a VL-type data logger, you’ll receive a Validation
alarm if the validation memory in the device is corrupted or
has been modified. Contact your Vaisala technical support
representative.
Device Calibration Alarms
If you use a VL-type device, Calibration Alarms send you
intermittent notification when your device is due for
calibration. You receive notifications at the following intervals:
3 months and 1 month before the calibration due date, then
again on the data logger’s scheduled recal date. This alarm
will remain active until the logger has been recalibrated.
What Happens When an Alarm is Triggered?
When an alarm is triggered, several things can happen
(depending on the configuration set by your administrator):
• A pop-up can appear showing a description of the
condition, and an alarm message. If pop-ups are blocked
viewLinc 4.1 User Guide 25
Page 30

Chapter 3: Alarms
• An email can be sent. If configured, emails are
• An application can be launched or an external device
• All of the above. Your administrator may also set up a tree
Alarms should be dealt with as soon as possible by
acknowledging them in viewLinc. All transactions are
recorded in the Event Log and Historical database and can
be viewed in an Event Log or Alarm report.
in your browser, an error message appears, prompting you
to enable pop-ups for viewLinc.
automatically sent to the address, addresses, or user
specified when threshold limits are exceeded,
communications are interrupted, or an event log or device
alarm condition is present. Alarm emails can be sent
repeatedly based on how alarm properties have been set.
turned on. If configured, an external device (such as a light
or buzzer) or a computer application (such as batch file
which can page or phone a particular number) can be
triggered when an alarm condition occurs.
alarm hierarchy, a method of notifying different individuals
of an alarm if the first notification is not acknowledged
within a specified time frame.
1 You can also list all locations and devices that are
currently using the selected template by clicking
| Devices and Locations using Template
devices using the selected template and displays their
zone/location and permissions information.
2 When you are finished creating your threshold template,
click
Save.
Threshold Alarms
Users with the correct permissions set device channel
thresholds that trigger alarms. For example:
• Greater than 23.00 C for more than 1 minute
• Less than 37.76 RH for more than 15 minutes
You can set a threshold alarm using a template (if previously
configured), or set a custom alarm.
26
Options
. This shows all
© 2012 Vaisala Canada Inc
Page 31

Acknowledging Alarms
All users can receive alarms, but only users with the correct
permission can acknowledge alarms.
If an alarm is set to require alarm acknowledgement, alarms
must be acknowledged. You must be logged in to viewLinc to
acknowledge alarms.
Acknowledgement information, such as the action taken and
any comments, is tracked in the Event Log and Historical
database. For more information, see Chapter 4: Events and
Chapter 5: Reports.
When an alarm is triggered, a new row appears in the
location alarms tab.
This section covers acknowledging alarms using the location
alarms tab. You can also acknowledge alarms from
the “Alarms” form (
trend view (see “Acknowledging Alarms from Large Popup
Trend View” on page 21).
To acknowledge alarms from the location alarms tab:
From Options | Locations, select a location or zone. Click
1
on the Location Alarms tab, select the active alarm, then
right click and select
Note: The number after the location name (i.e. Temper-
The Acknowledge Alarm dialog box appears, prompting
2
you to enter actions taken and comments.
Options | Alarms) or from a large popup
ature (15494) is the unique location ID. In case
the locations have been given the same name,
this number provides a unique ID so you can differentiate between them.
Acknowledging Alarms
Acknowledge.
3 Click Acknowledge. Your comments and actions are
added to the Event log and the Acknowledge Alarm box
closes. Locations are updated with this change in status.
viewLinc 4.1 User Guide 27
Page 32

Chapter 3: Alarms
To acknowledge alarms from the alarms list:
1
2 Select the Alarm you wish to acknowledge. If you wish to
3 If you wish to acknowledge all active alarms, you can use
4 The Acknowledge Alarm dialog box appears, prompting
Click Options | Alarms to view the list of active alarms.
acknowledge multiple alarms, you can hold the
[Shift] buttons and click to multiple select then right click
and select
and select
Acknowledge, or click the Options dropdown
Acknowledge. You may wish to uncheck the
[Ctrl] or
“Auto Refresh On” checkbox when multiple selecting as
the auto refreshing can delay the selection process.
Options dropdown and select Acknowledge All “Off”
the
Alarms
. Multiple selecting is not required in this case.
you to enter the actions taken and comments.
5 Click Acknowledge. Your comments and actions are
added to the Event log and the Acknowledge Alarm box
closes. Locations are updated with this change in status.
Pausing Alarms
You may want to pause alarms if you need to move devices,
or if a certain known situation may result in conditions
exceeding set thresholds. Pausing alarms is faster than
disabling alarms for a temporary period. You can pause an
alarm for up to 24 hours.
To pause all alarms in a zone:
Select Options | Alarms. This list will automatically
refresh with the most current alarms as long as the Auto
Refresh checkbox remains checked. You can select the
attributes that will be available for viewing in this panel by
clicking the down arrow next to any column heading and
28
© 2012 Vaisala Canada Inc
Page 33

Pausing Alarms
toggling the checkbox beside the item. The column can
then be sorted by clicking on the column header to group
the respective column items together.
Exporting alarms to Excel format:
Click the Options dropdown and select Export to Excel.
This will export all alarms in this list to a .tsv format file.
When prompted, save or open this file from your
browser.
To print all active alarms:
Click the Options dropdown and select Print. A new
browser tab will appear with a printer-friendly list of
alarms and the print dialog will pop up. Choose your
desired print settings and print the document.
viewLinc 4.1 User Guide 29
Page 34

Chapter 3: Alarms
30
© 2012 Vaisala Canada Inc
Page 35

Chapter 4: Events
All events - such as alarms, transfers of data from the device,
alarm acknowledgements, system configuration changes and
general system notifications - are tracked in viewLinc’s Event
Log under
The data tracked in Events is different from the data tracked
in a device. Where the viewLinc Event Log tracks events
occurring within the viewLinc system (such as notification of
successful transfer of data from a device to a stored local
directory), the device itself tracks the changes in
temperature, relative humidity or voltage.
To ensure viewLinc continuously monitors and stores event
history, event log validation alarms notify you when the
viewLinc event log has been modified. For more about event
log validation alarms, see Chapter 3: Alarms.
Use the Events function to analyze events and determine
when and where particular problems occurred, or to
diagnose a situation that needs troubleshooting.
In this section, you’ll learn to:
• View events
• Add comments to events
• Print event logs
• Export and save event log data into .tsv format
Options | Events.
viewLinc 4.1 User Guide 31
Page 36

Chapter 4: Events
Viewing Events
Events are viewed in an Event Log, a text-based listing of all
system events occurring with the devices on your system.
To view Events:
From viewLinc, select Options | Events. The Event Log
1
appears, displaying a list of events, and, if available,
comments on the event in the Event Details area to the
right of the event listing.
2 Using the date and time selectors, choose the period for
which you want to see events. Enter a date (using format
MM/DD/YYYY HH:MM) or use the calendar button to
specify a date range.
3 Using the buttons to the right of the date and time
selectors, select or deselect buttons to see specific types
of event details. After selecting an event type button to
filter your results, select
the list. The more buttons you deselect, the shorter the
list will be. You can choose to view:
Alarm Events. A list of alarms that were triggered during
•
the specified time period.
Admin Events. A list of administrator actions taken,
•
such as new alarm threshold settings.
Transfer Events. List of device data transfers performed
•
during the specified time period.
System Events. List of changes to configuration options
•
or any failed attempts to communicate between
viewLinc Servers and devices.
4 Filter the results by clicking on the Filters dropdown in
the upper right corner. You can select or unselect
different event types (Alarm, Admin, Transfer and
System Events) by toggling the checkboxes associated
Options | Refresh to refresh
32
© 2012 Vaisala Canada Inc
Page 37

with them. You can also filter by specific users, groups or
locations by clicking accordingly then checking or
unchecking the checkboxes for the desired users, groups
or locations. Select
Options | Refresh to refresh the
list or click outside of the filters window and the list will
refresh automatically.
Adding Comments to Events
Adding Comments to Events
You may want to add comments to the Event Log, perhaps to
outline why an event occurred or what was done in response
to an event or problem.
To add a comment to the Event Log:
1
From viewLinc, select Options | Events.
2 Highlight the row (event) to add the comment to, and
select
Options | Add Comment. The Add Custom
Comments to Event screen appears.
3 Enter your comment, then click Save.
4 To view a comment for a particular event, highlight the
row containing that event and look for the comment in the
Event Details
viewLinc 4.1 User Guide 33
area.
Page 38

Chapter 4: Events
Adding Custom Events
You may want to add comments to the Event Log, perhaps to
outline why an event occurred or what was done in response
to an event or problem.
To add a custom event:
1 From viewLinc, select Options | Events.
2 From the events window, select Options | Add Custom
Event.
3 Fill in the custom event message and details, then press
Save.
Printing Event Logs
To print the event log:
From viewLinc, select Options | Events.
1
2 Choose the date and time range you are interested in
printing. In the date/time box, enter a date and/or time in
24-hour notation, or click the calendar icons to make
your selection.
3 Using the buttons to the right of the date and time
selector, choose to either include or not include Alarm
Events, Admin Events, Transfer Events and/or System
Events.
4 From the events window, select Options | Refresh.
5 From the events window, select Options | Print.
34
© 2012 Vaisala Canada Inc
Page 39

6
In a new browser window, a printer-friendly Event Log
report opens.
7 The Print dialog box displays automatically allowing you
to set your print parameters and print the Event Log.
Exporting Event Logs
With viewLinc you can export event log data into a saved .tsv
file for analysis at a later date.
To export event logs:
1 In viewLinc, click Options | Events and choose the
date range you are interested in exporting. In the date/
time box, enter a date and/or time in 24-hour notation, or
click the calendar icons to make your selection.
2 Click the Filters dropdown to the right of the date and
time selector to choose different event types by checking
or unchecking
Events.
3 Click Options | Refresh.
4 Click Options | Export to Excel. A file download
dialog opens, prompting you to open or save the events
.tsv file (in Microsoft Excel format).
Exporting Event Logs
Alarm, Admin, Transfer, and/or System
viewLinc 4.1 User Guide 35
Page 40

Chapter 4: Events
36
© 2012 Vaisala Canada Inc
Page 41

Chapter 5: Reports
Using viewLinc, you can create graphs and reports to
analyze changes in data over time based on the historical
data collected by Vaisala devices.
In this section, you’ll learn what historical data is and how to:
• Analyze historical data
• Generate historical data reports in graphical and tabular
formats
viewLinc 4.1 User Guide 37
Page 42

Chapter 5: Reports
About Reports
Vaisala devices have the ability to store large amounts of
data inside them. Data is logged in frequencies from once
every 10 seconds to once every 24 hours. To set this
frequency (known as the sample interval) for Vaisala Veriteq
devices, refer to your vLog product guide. To set the sample
interval for 300 Series Transmitters refer to the specific
Vaisala product guide.
With viewLinc you can monitor real-time conditions for
devices over the network, analyze or graph changes in
conditions over time, or compare conditions recorded by
different devices. This analysis is performed using the
Reports function.
Generating Historical Data Reports
viewLinc provides you with a set of graphical reports which
can help you easily view trends in data readings or alarm
monitoring statistics (such as alarm trigger frequency).
• Alarm reports provide an overview of alarm events over a
period of time (events related to every alarm are grouped
together and presented in a readable form).
• Historical data reports provide a detailed history of
location values (presented in both graphical and tabular
form).
38
© 2012 Vaisala Canada Inc
Page 43

Generating Historical Data Reports
Generating Alarm History Reports
To generate an Alarm history report:
Select Options | Reports and left click to select the report
1
you want to generate from the Report Definitions tree.
The report parameters appear on the right side of your
screen (users can only view report parameters for the
reports they generate, or reports to which they have
been granted owner access).
2 Select an Alarm. On the General tab you can specify the
period you want the report to include using the default
option,
you choose a fixed date range from the Range Type
dropdown, calendars will appear to indicate from/to
dates. The Time zone dropdown box enables you to
specify a different time zone if necessary. Change this
value only if a specific time zone adjustment is required
for the report, otherwise leave it blank and it will report for
your current time zone. If you do select a different time
zone, all report dates, scheduled generation and printed
timestamps will be relevant to the selected time zone.
Most Recent Events, or a specific date range. If
3 In the Scheduled Generation area of the General tab,
you can choose the format for your report (PDF or tab-
viewLinc 4.1 User Guide 39
Page 44

Chapter 5: Reports
4
5 On the Source Data tab define the report scope. To
6 On the Page Layout tab define your report display
separate, for Excel), to automatically generate and save
the report to a specific file location, or send the report to
an email address or a list of addresses (use a comma to
separate email addresses). You can also schedule when
you want the report to generate, and how frequently you
want it generated.
Note: For large report data sets, we recommend that
you schedule report generation at a time when
few users are using the system, such as after
business hours.
On the Content tab determine whether you want a brief
report (with one line for each alarm) or a detailed report
(showing details about all alarm activities: activation,
notifications, acknowledgement, etc.).
include alarm report details from all locations, select
Locations.
You can also select specific locations and
All
zones:
a Select the option, Selected Locations and Zones.
b To select all locations in a zone, select the checkbox
corresponding to the zone name from the locations
tree.
c To select a specific location in a zone, expand the tree
to find the location, then select its checkbox.
d Repeat these steps for each location you want to in-
clude on the report. All selected locations appear in
the Selected region.
options:
a Page Header and/or Page Footer options: choose the
pages on which you want a header or footer displayed.
To define the header or footer, enter text in the Left,
Center or Right fields.
b Choose the type of paper you want to print on and the
orientation.
c You can also choose a customized icon in the left
header section by clicking “Upload” or select from a list
of provided icons by clicking the Image File dropdown.
40
© 2012 Vaisala Canada Inc
Page 45

Generating Historical Data Reports
7 From the reports window, select Save.
8 To manually generate the report, choose either Export to
Excel
(which will generate a .tsv format file) or Generate
PDF Report
from the options dropdown. The
(which generates an Adobe format .pdf file)
exclamation point
icon indicates when you have made changes that need
to be saved.
Generating Location History Reports
To generate a Location History report:
Note: viewLinc does not provide a default Location
History report. Instead, the first time you generate a Location History report, the report is automatically saved.
Select Options | Reports. In the Report Definitions tree,
1
select the report you want to generate from the Locations
History Reports section. The report details will appear on
the General tab in the right panel.
viewLinc 4.1 User Guide 41
Page 46

Chapter 5: Reports
2 On the General tab, specify the user you want to have
3 In the Scheduled Generation area, you can choose the
4 On the Content tab identify the types of data you want
5 If you include the Interval Statistics graph, use the
access to this report (if not already granted Full Control),
and the range type data based on a specific date range,
or the most recent data.
format for your report (PDF or tab-separate, for Excel), to
automatically generate and save the report to a specific
file location, or send the report to an email address or a
list of addresses (use a comma to separate email
addresses). You can also schedule when you want the
report to generate, and how frequently you want it
generated.
Note: For large report data sets, we recommend that
you schedule report generation at a time when
few users are using the system, such as after
business hours.
included in the report, including Trend Graph, Title Page,
Interval statistics graph (this allows you to change
Statistic Settings in the Statistic Settings tab), and/or
Tab u la r D a t a .
Statistics Settings tab to define how information will
display on your report, and any statistical information you
want to include:
a From Statistics Settings, select a statistics interval by
checking the Include statistics at intervals checkbox if
you want to intermittently generate statistics within the
time frame of a report. For example, if your report generates data based on a seven day (weekly) interval,
you may want to view statistics daily by selecting the
Specify Duration radio box and specifying 1 day, 0
hours.
b In the Include area, select the types of statistical data
you want to add to the report, including maximum value, average value, minimum value, standard deviation, sample count and mean kinetic temperature
(MKT):
• If you want to specify the activation energy, check
Mean kinetic temperature and specify the
activation energy as KJ/mol.
42
© 2012 Vaisala Canada Inc
Page 47

Generating Historical Data Reports
6
On the Source Data tab, define the report scope and
color spectrum. To report on all locations, select
Locations.
The screen will become greyed out to indicate
that all are included. You can also select specific
locations and zones:
a Select the option Selected Locations and Zones.
To select one or more locations in a zone, check the
b
checkbox next to the zone or expand the zone and
check the checkbox next to the location name.
c To add an index to the graph, select Show Markers.
d To specify a color to highlight a specific location’s da-
ta, select the location, then select an option from the
color dropdown. If you select Auto, viewLinc chooses
a color according to the default color spectrum:
All
e When the location line colors are set to ‘Auto’ viewLinc
assigns the next free color from a built-in palette of colors. Repeat for each location you want to include on
the report. All selected locations appear in the Selected region.
viewLinc 4.1 User Guide 43
Page 48

Chapter 5: Reports
7 Use the Page Layout tab to define the headers, footers,
8 Select Options | Save.
paper size and orientation:
a For Header or Footer options, choose to display on all
pages, on the first page only, on the last page only, or
on the first and last page.
b To define the content of your header or footer, enter
text in the Left, Center or Right fields.
c You can also choose the paper size you want to print
on and the orientation (portrait or landscape).
d Select a header image by using the Image File drop-
down (for previously used images) or upload a new image file by clicking the
Browse to locate the file.
e Select Options | Save.
f To manually generate the report, click the options
dropdown and select
Upload button and clicking
Generate PDF Report.
44
© 2012 Vaisala Canada Inc
Page 49

Chapter 6: Mobile UI
This section is for administrators and general users.
In this section, you’ll learn about:
• viewLinc 4.1’s Mobile interface
• Performing key tasks from a mobile device
Let’s get started learning about the Mobile interface in
viewLinc.
viewLinc 4.1 User Guide 45
Page 50

Chapter 6: Mobile UI
About the Mobile UI
viewLinc 4.1 provides access from Mobile devices, allowing
you to perform key tasks from your smartphone or tablet. The
look and feel of the mobile application is similar to the main
UI, however access is limited to certain key functions as
follows:
• The Locations Panel
• Popup Trends
• Alarms and alarm comments.
The Mobile UI supports the following mobile devices:
Apple iOS 3+, Android 2.1+, and BlackBerry 6+ devices.
The Mobile UI is a tool to perform basic monitoring and
maintenance tasks only, and does not support transfers,
events, or reports. These features are only available in the
main browser UI.
Logging in to the the Mobile UI
When you first load the mobile application, it will prompt you
to enter a username/password. Enter the same username/
password as used for the browser UI. You will also be able to
select the language that will be displayed throughout your
session from the dropdown box. When changing to a
language other than English, the page automatically
refreshes to display the new language.
46
© 2012 Vaisala Canada Inc
Page 51

Working with the Mobile UI
Working with the Mobile UI
The initial screen that appears after login is the system level
of the locations tree. The tree is navigated by pressing any
zone to reveal the locations below it, then pressing the top
Options menu to view the commands available.
left
There are 3 selectable views from the top right corner of the
toolbar as follows.
viewLinc 4.1 User Guide 47
Page 52

Chapter 6: Mobile UI
Mobile views
1 Locations Panel View: The default view. When a folder
2 Locations Table View: This view will display detailed
3 Alarm Grid View: This view displays alarm information for
item is pressed, the corresponding folder’s contents will
be displayed. To go up a folder, press the back arrow
under the Options button at the top left. To get further
information on a location, press to select it, then select
Options | Popup Trend.
location information for whichever location was selected
from the Locations Panel view. You can see extended
location information by pressing to select a location, then
pressing it again. Details such as device & threshold
status, path, readings and timestamp will be displayed in
an overlayed window.
whichever location was selected from the Locations
Panel view. Only locations that have alarms assigned will
be displayed. For example, if you are at the system level
when you press the alarm grid, it will show you all alarms
in the system, if any. To see complete detailed
information, press on a specific alarm and it will be
displayed in an overlayed window.
48
© 2012 Vaisala Canada Inc
Page 53

Working with the Mobile UI
To view a popup trend using the mobile UI:
Press the Locations Panel View then navigate to the
1
location by pressing on the zone containing it. Find the
location and press to highlight it.
2 Press Options | Popup Trend
3 The Popup Trend window appears. This window is
controlled using the same buttons and checkboxes as a
traditional popup trend window. See “Opening Large
Popup Trend Views” on page 18. Also see step 9 of
“Building a Trend with the Trend Tab” on page 15 for how
to use the blue arrow button controls.
To change popup trend graph settings using the mobile UI:
Press Options | Popup Trend with a location selected.
1
2 In the lower right corner of the popup trend, press
Options
Samples or Threshold Lines
viewLinc 4.1 User Guide 49
then press on the checkboxes for Realtime
.
Page 54

Chapter 6: Mobile UI
3 Press Done. The graph will automatically update to
Acknowledging Alarms with the Mobile UI
To acknowledge an alarm using the mobile UI:
1 Press the alarms button.
2 Highlight the alarm you’d like to acknowledge.
3 Press Options | Acknowledge.
4
5 Fill in the required information and press Acknowledge.
To pause or resume alarming using the mobile UI:
1
2 Press a location to pause to pause or resume alarming
reflect your changes as long as the
Auto Refresh On
checkbox in the lower right corner remains checked.
A window appears prompting you to enter the action
taken, preconfigured comments and extra user
comments.
Note: If the system setting 'Comments required on
changes' is set to 'Comments are optional' via
the main browser UI, then providing comments
from the keyboard or selecting from the Preconfigured Comments dropdown is not necessary. In
this case, the user can perform alarm acknowledgement with no comments.
Press the Locations view button.
for.
50
© 2012 Vaisala Canada Inc
Page 55

Working with the Mobile UI
3
Press Pause X Alarming or Resume X Alarming (where X
is the type of alarm you’d like to control.)
4 If you have paused alarming, it will remain paused until
you resume it. To resume alarming, follow these steps
again and select
viewLinc 4.1 User Guide 51
Resume X Alarming.
Page 56

Chapter 6: Mobile UI
52
© 2012 Vaisala Canada Inc
Page 57

Index
Numerics
300 Series Transmitters
output quantities
10
A
acknowledge an alarm 21, 27, 28
active alarms
viewing
adding comments
to event logs
alarm trigger 26
alarms 23–27
acknowledging 21, 27, 28
active
communication 24
device 25
device calibration alarms
devices 25
email notifications 26
multiple notifications 26
pausing 28
threshold 24
tree hierarchy 26
validation 24
android devices
supported
apple iOS 46
average value 42
21
33
viewing
pausing 28
configuration 25
defined
multiple notifications 26
pausing 28
21
25
46
B
blackberry devices
supported
46
C
calibration alarms 25
channel description
defined
channel number 13
color
selecting for reports
comments
adding to event logs
viewing 33
communication alarms
defined
pausing 28
configuration alarms
defined
13
43
33
24
25
D
device configuration alarms
defined
devices
calibration alarms
configuration alarms 25
25
25
E
email notifications 26
event logs 31–35
adding comments to 33
adding custom events 34
exporting 35
printing 34
saving 35
viewing 32
viewing comments 33
Excel reports 40, 41, 42
exporting
event logs
35
viewLinc 4.1 User Guide 53
Page 58

Index
G
graphs
viewing
13, 14
H
historical data 2, 37
purpose of 38
viewing 13, 14
I
iPhone 46
L
launching applications or devices 26
locations
opening
reading graphs 20
screen 11
logger validation alarms
defined
loggers
validation alarms
login screen 3
logs, event. See event logs.
13, 14
25
25
M
maximum value 42
mean kinetic temperature (MKT) 42
microsoft excel
exporting logs to
viewLinc event logs and 35
minimum value 42
mobile devices
supported
Mobile UI 45, 46
about 46
acknowledge alarms with 50
pause or resume alarming with 50
working with 46
35
46
N
new in viewLinc 5
notifications
calibration
multiple 26
25
O
opening large popup trend view 13, 14
output quantities 10
P
passwords
reconfirmation after session expiry
pausing alarms 28
PDF reports 39, 41, 42
popup trend views
acknowledging alarms from
opening 18
reading 20
viewing 21
pop-ups
for alarms
25
21
R
reading
threshold values
reading graphs
in large popup trend view
real-time graphs 19
reports 37–44
about 38
alarm history 39
color 43
Excel 40, 41, 42
generating 38, 39, 41
locations history 41
PDF 39, 41, 42
types 38
21
20
S
sample count 42
4
54
© 2012 Vaisala Canada Inc
Page 59

Index
session expiry 4
spreadsheets, event log data in 35
standard deviation 42
statistics intervals 42
statistics settings 42
status bar, defined 13
T
tabs 11
threshold alarms
defined
multiple notifications 26
pausing 28
threshold summary, defined 13
threshold values, reading 21
timestamp 13
transmitters
output quantities
24
10
U
user accounts
logging in
using color
for reports
3
43
X
xls files 35
V
validation alarms
defined
viewing
active alarms
event comments 33
locations 13, 14
viewLinc
logging in
security options 4
24, 25
21
3
W
what’s new 5
viewLinc 4.1 User Guide 55
Page 60

Index
56
© 2012 Vaisala Canada Inc
 Loading...