

Page 1
USER MANUAL
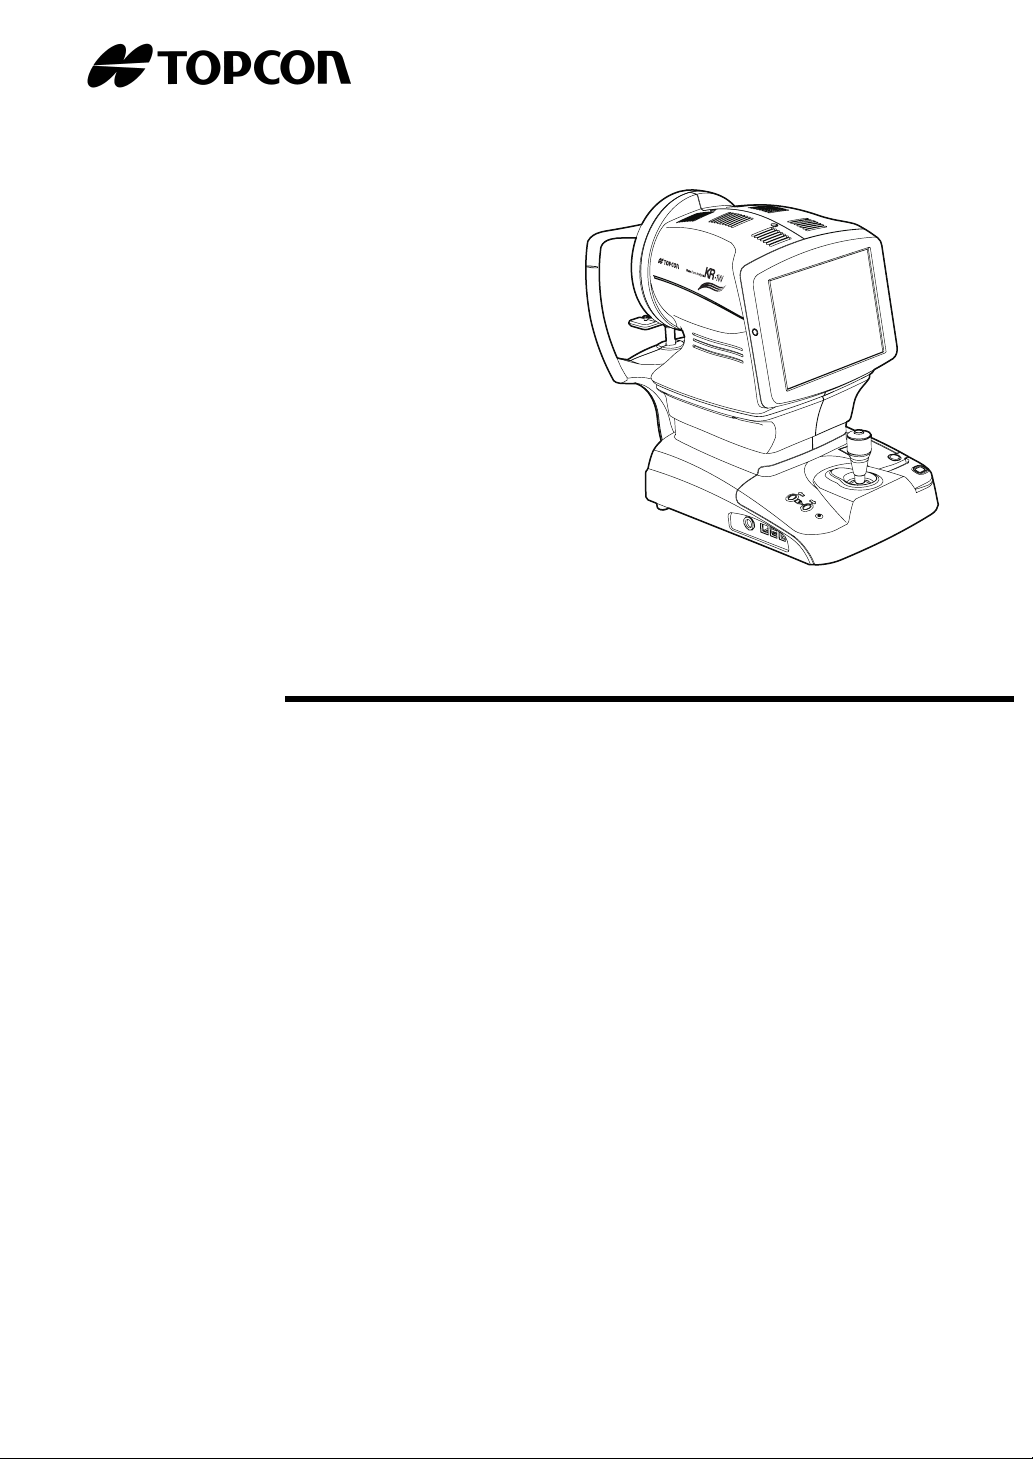
WAVE-FRONT ANALYZER
KR-1W
Page 2

Page 3

INTRODUCTION
Thank you for purchasing the TOPCON Wave-front Analyzer KR-1W.
This instrument has the following features:
• The refractive power of the eye, the curvature radius of the cornea and the pupil diameter can be determined by simple operations.
• By displaying the Hartmann image and Mire image, wavefront aberration measurement
of the eye can be done.
•
Auto alignment and auto start functions enabling quick measurement under best conditions
This text outlines the TOPCON Wave-front Analyzer KR-1W and describes basic operations, troubleshooting, checking, maintenance and cleaning.
To encourage the safe, efficient use of this instrument, carefully read "DISPLAYS FOR
SAFE USE" and "GENERAL SAFETY INFORMATION."
Also, keep this User Manual in a convenient location for your future reference.
PRECAUTIONS
• The patient who undergoes an examination by this instrument must maintain concentration for a
few minutes and keep to the following instructions:
• To fix the face to the chinrest, forehead rest, etc.
• To keep the eye open.
• To understand and follow instructions when undergoing an examination.
• To ensure smooth operation, install the instrument on a leveled stand free of vibrations. Also, do
not place any objects on the instrument.
• Connect all cables according to Preparation instructions on page 30.
• Use the specified source voltage.
• When not in use, turn off the power and put the measuring window cap and dust cover on.
• To ensure the correct reading, do not mar the measuring window with finger prints, dust, etc.
• Use this machine in a darkroom.
CAUTION : Federal laws restricts this device to the sale by or on the order of a physician.
1
Page 4
DISPOSAL
When disposing the instrument and/or parts, follow the local regulations for disposal and recycling.
This symbol is applicable for EU member countries only.
To avoid potential damage to the environment and possibly human health, this instrument should be
disposed of (i) for EU member countries - in accordance with WEEE (Directive on Waste Electrical and
Electronic Equipment), or (ii) for all other countries, in accordance with local disposal and recy cling
laws.
[WARNING]
Handling the cord on this product or cords associated with accessories sold with this product, will expose you to lead, a
chemical known to the State of California to cause birth detects or other reproductive harm. Wash hands after han-
dling.
This Product Contains Mercury in the backlighting of the LCD display. Prior to disposal remove of ot herwise ensure that
this is disposed of in accordance with Local, State and Federal Laws. This information is applicable in U.S.A only.
This product contains a CRL Litium Battery which contains Perchlorate Material-special handling may apply.
See http://www.dtsc.ca.gov/hazardouswaste/perchlorate/
Note; This is applicable to California, U.S.A. only
STORING PLACE, USAGE PERIOD
1. When storing the instrument, ensure that the following conditions are met:
(1) The instrument must not be splashed with water.
(2) Store the instrument away from environm ents where air pressur e, temperature , humidity,
ventilation, sunlight, dust, salty/sulfurous air, etc. could cause damage.
(3) Do not store or transport the instrument on a slanted or uneven surface or in an area
where it is subject to vibrations or instability.
(4) Do not store the instrument where chemicals are stored or gas is generated.
2. Normal life span of the instrument:
8 years from delivery providing regular maintenance is performed [TOPCON data]
USER MAINTENANCE
1.Regularly maintain and check the equipment and parts.
2.When resuming the u se after a long storage time, ver ify that the instrume nt operates correctly and safely.
3.To ensure the correct reading, do not soil the measuring window with finger prints or dust.
4.If the measuring windo w is soiled, clean it fol lowing the "CLEANING THE INSTRUMENT"
instructions on page 180.
2
Page 5

HOW TO READ THIS MANUAL
• Read the instructions on pages 1 to 8 before using the machine.
• Regarding connection to various devices, see "PREPARATIONS" on page 30.
• If you need to see how the machine works first of all, read "BASIC OPERATIONS"(page 37)
first.
• For setting various functi ons, see "FUNCTION SETTING US ING SETTINGS SCREEN " on
page 111.
SYMBOL IN THE TEXT
Note: contains the infor mation of us eful features to k now and cauti ons to prevent
any problems.
3
Page 6
DISPLAYS FOR SAFE USE
In order to encourage t he safe use of the machine a nd prevent any danger to the operator and
others or damage to prop ertie s, important wa rnin gs are pl aced on the produc t and i nser ted in the
user manual.
We suggest that everyone understand the meaning of the following displays and icons before
reading the "
DISPLAYS
GENERAL SAFETY INFORMATION" and the main text.
Display Meaning
WARNINGS
CAUTIONS
NOTES
Ignoring or disregarding this display may lead to death or
serious injury.
Ignoring or disregarding this display may lead to personal injury
or physical damage.
• Injury refers to cuts, bruises, sprains, fractures, burn, electric
shock, etc.
• Physical damage refers to extensive damage to buildings or
equipment and furniture.
4
Page 7
GENERAL SAFETY INFORMATION
WARNINGS
Ensuring the Safety of Patients and Operators
When operating the instrument, be not touch the patient's eye or nose.
[Inform the patient accordingly]
The safety and effectiveness of the Wave-front Analyzer KR-1W has not been establish ed for
use of the device as an acces sory interfaced to the refr active laser for the treatmen ts of the
higher order aberrati ons of the eye by photorefractive keratectomy (PRK), phototherape utic
keratectomy (PTK), or laser assisted in situ keratomileusis (LASIK).
Preventing Electric Shocks and Fires.
To avoid fire and electric shock, install the instrument in a dry place free of water and other liquids.
To avoid fire and electric shock, do not put cups or other containers with liquids near the instrument.
To avoid electric shocks, do not i nsert meta l objects into the inst rumen t body throu gh th e vent
holes or gaps.
To avoid fire in the event of an instrument malfunction, immediately turn OFF the power switch
" and disconnect the power cor d from the instrument if you see smoke coming from the
"
instrument, etc.
Don't install the instrument wh ere it is difficult to disconnect the power cord fr om the instrument. Ask your dealer for service.
5
Page 8
CAUTIONS
Ensuring the Safety of Patients and Operators
To avoid injury in changing the mea surement mode, do not place finge rs into the measuring
opening.
To avoid electric shock, do not open cover. For repair, ask a certified Topcon Service Engineer.
When changing the fuse, turn off the power, and disconnect the power cable. Use the properly
rated fuse.
Preventing Electric Shocks and burn.
To avoid injury, when moving the chinrest up/down, keep fingers away from moving parts.
When operating the instrument, be careful not to touch the patient's eye or nose.
Electromagnetic Compatibility (EMC)
This instrument has been tested (with 100/120/230V) and found to comply with IEC60601-1-2:
Ed.3.0: 2007.
This instrument may emit a radio frequency energy (within the standard) and cause an
adverse effect on the devices located nearby.
When such effect is conf irmed by the ON/OFF ope ration, a proper treatme nt a s to chan ge th e
direction, use another outle t, etc. is r ecomm ended. If the prob lem re mains un solv ed, cal l your
dealer.
6
Page 9

USAGE AND MAINTENANCE
PURPOSE
The Wave-front Analyzer K R-1W is a precision electrical i nstrument for medical use
which must be used under the guidance and instructions of a doctor.
USER MAINTENANCE
To ensure the safety and perfor mance of the i nstrument, al l maintenan ce work, u nless sp ecified in this manual, shall be conducted by trained service engineers.
The following maintenance tasks may be done by the user.
For details, see the relevant part of this manual.
CHANGING THE FUSE
The primary fuses for the main body may be changed by a non-trained service technician.
For details, refer to "REPLACING THE FUSE" on page 181.
DISCLAIMERS
• TOPCON is not responsible for damage due to fire, earthquakes, actions or inactions of third
persons or other accid ents, or damage due to negligen ce and misuse by th e user and any
use under unusual condit io ns.
• TOPCON is not responsible for damage derived from inability to properl y use this equipment, such as loss of business profits and suspension of business.
• TOPCON is not responsible for damage caused by operations other than those described in
this User Manual.
• The device does no t provide a diagnose of any conditio n or lack th ereof or any recommen dations for appropriate treatment. The relevant healthcare provider is fully responsible for all
diagnose and treatment decisions and recommendations.
7
Page 10
WARNING INDICATIONS AND POSITIONS
To ensure the safety, this machine provides warning displays.
Use the instrument c orrectly by o bserving the display instru ctions. If a ny of the foll owing display labels are missing, contact your TOPCON dealer at the address listed on the back cover.
CLASS I LASER PRODUCTS
No. Label Meaning
1
2
3
4
5
1 3 4 2 5
WARNING
To avoid injury caused by electric shock, do not open the cover.
Ask your dealer for service.
WARNING
Electric shock may cause burns or a possible fire. Turn the power
switch OFF and unplug the power cord before replacing the fuses.
Replace only with fuses of the correct rating.
CAUTION
When operating the chinrest up/down switch, be careful not to
pinch the patient's hand.
The patient may be injured.
CAUTION
Be careful not to hit the patie nt's eyes or nose wit h the instr ument
during operation.
Degree of protection against electric shock:
TYPE B EQUIPMENT
8
Page 11

CONTENT
INTRODUCTION...................................................................................................1
PRECAUTIONS.....................................................................................................1
HOW TO READ THIS MANUAL............................................................................3
DISPLAYS FOR SAFE USE..................................................................................4
GENERAL SAFETY INFORMATION ....................................................................5
USAGE AND MAINTENANCE ..............................................................................7
DISCLAIMERS ......................................................................................................7
WARNING INDICATIONS AND POSITIONS........................................................8
COMPONENTS
COMPONENT NAMES........................................................................................12
COMPOSITION OF PARTS WHICH CONTACT THE HUMAN BODY...............12
OPERATION METHOD OF CONTROL PANEL..................................................13
CONTROL PANEL COMPONENTS
(EXAMINATION PURPOSE SELECTION SCREEN)..........................................14
CONTROL PANEL COMPONENTS
(SELECTION OF EXAMINATION SCREEN) ......................................................15
CONTROL PANEL COMPONENTS
(MEASUREMENT SCREEN IN THE REF/KRT MODE) .....................................16
CONTROL PANEL COMPONENTS
(MEASUREMENT RESULT LIST SCREEN).......................................................18
CONTROL PANEL COMPONENTS (ANALYSIS RESULT SCREEN) ...............20
OTHER SCREEN DISPLAYS..............................................................................22
PRINTER OUTPUT .............................................................................................23
STANDARD ACCESSORIES..............................................................................29
PREPARATIONS
INSTALLING THE INSTRUMENT.......................................................................30
CONNECTING THE POWER CABLE.................................................................31
CONNECTING EXTERNAL I/O TERMINALS.....................................................32
SETTING THE PRINTER PAPER.......................................................................33
RESETTING FROM POWER SAVE STATUS....................................................35
OPERATING THE CONTROL LEVER................................................................35
BASIC OPERATIONS
SELECTION OF EXAMINATION INTERFACE AND
ARBITRARY OPERATION INTERFACE.............................................................37
OPERATION IN THE SELECTION OF EXAMINATION INTERFACE .....................39
POWER-ON AND MEASUREMENT COURSE SELECTION .............................39
PREPARATION BEFORE MEASUREMENT ......................................................41
MEASUREMENT.................................................................................................43
DISPLAYING MEASUREMENT VALUES...........................................................45
CLEARING ALL MEASUREMENT VALUES.......................................................45
MEASUREMENT RESULT LIST SCREEN.........................................................47
DISPLAYING THE ANALYSIS RESULT .............................................................47
COMPLETION.....................................................................................................48
9
Page 12

INDIVIDUAL OPERATIONS
OPERATION IN THE ARBITRARY OPERATION INTERFACE...............................49
MEASUREMENT MODE SELECTION................................................................49
SELECTION OF AUTO MEASUREMENT/AUTO TRACKING MEASUREMENT/
MANUAL MEASUREMENT.................................................................................50
SETTING FIXATION TARGET ILLUMINATION LEVEL.............................. ...... ..50
SETTING HARTMANN EXPOSURE TIME.........................................................51
MEASURING ONE EYE ONLY ...........................................................................52
MEASUREMENT......................................................................................................53
PREPARATION BEFORE MEASUREMENT ......................................................53
MEASUREMENT UNDER AUTO MODE ............................................................54
MEASUREMENT UNDER AUTO TRACKING MODE.........................................57
MEASUREMENT UNDER MANUAL MODE .......................................................59
DISPLAYING MEASUREMENT VALUES...........................................................61
CLEARING ALL MEASUREMENT VALUES.......................................................61
TERMINATING MEASUREMENT.......................................................................62
IN A CASE LIKE THIS .............................................................................................63
TO STOP AUTO ALIGNMENT MEASUREMENT IN THE MIDDLE....................63
TO MEASURE THE RIGHT/LEFT EYE ONLY....................................................63
ALIGNMENT DOES NOT START.......................................................................64
SERIAL (DRY EYE) MEASUREMENT................................................................66
PUPILLOMETRY.................................................................................................68
DISPLAYING ALL MEASUREMEN T DATA ......... ....... ...... ...... ....... ...... ....... ...... ..70
PRINTING MEASUREMENT VALUES ...............................................................71
INPUT/OUTPUT..................................................................................................73
DISPLAYING THE MEASUREMENT RESULT
MEASUREMENT RESULT LIST SCREEN..............................................................74
ANALYSIS RESULT SCREEN .................................................................................77
DESCRIPTION OF MAP LAYOUT......................................................................78
ENLARGEMENT DISPLAY .................................................................................94
ANALYSIS SETTING MENU...............................................................................97
TOPOMAP SMOOTHING FUNCTION................................................................99
TOPO/ABERRATION MAP OVERLAY AND MARKER OVERLAY ..................100
IOL THRESHOLD SETTING OF IOL SELECTION MAP ..................................101
DESCRIPTION ABOUT MEASUREMENT RESULTS...........................................104
ANALYSIS CENTER .........................................................................................104
DESCRIPTION ABOUT RMS DISPLAY OF OCULAR ABERRATION.............104
DESCRIPTION ABOUT RMS DISPLAY OF CORNEAL ABERRATION...........105
FUNCTION SETTING USING SETTINGS SCREEN
OPERATION METHOD OF SETTINGS SCREEN............................................111
LIST OF SETUP ITEMS ....................................................................................114
MEASURE (TEMPORARY SETTING)..............................................................124
INITIAL SETTING (INITIAL) ..............................................................................128
DISPLAY SETTING (DISPLAY) ........................................................................142
SETTING OF INTERNAL PRINTER (PRINT INT).............................................159
SETTING OF EXTERNAL PRINTER (PRINT EXT)..........................................167
10
Page 13

SETTING OF DATA COMMUNICATION (COMM)............................................168
LAN CONNECTION (NETWORK).....................................................................171
SETUP OF SELECTION OF EXAMINATION
MEASUREMENT
SCREENING SETTINGS ..................................................................................176
SETTING PUPILLOMETRY ..............................................................................178
SETTING SERIAL MEASUREMENT ................................................................178
SETTING CATARACT MEASUREMENT..........................................................178
SETTING OVER REF. MEASUREMENT..........................................................179
MAINTENANCE AND CHECKING
DAILY MEAINTENANCE........................................................................................180
CHECKING THE MEASURING ACCURACY....................................................180
CLEANING THE INSTRUMENT........................................................................180
PRINTER PAPER JAM......................................................................................180
REPLACING THE FUSE ...................................................................................181
SPECIAL NOTE OF CLEANING............................................................................182
CLEANING THE PLACHIDO RING AND OUTER COVER...............................182
CLEANING THE MONITOR SCREEN (CONTROL PANEL) ............................182
CLEANING THE COMPONENTS TOUCHING THE PATIENT.........................182
BEFORE REQUESTING SERVICE
CHECKING OPERATIONS ...............................................................................183
REFERENCES
MESSAGE LIST ................................................................................................184
DATA THAT CAN BE OUTPUT AND USABLE PRINTERS IN EACH SCREEN
OPTIONAL ACCESSORIES........................... ...... ....... ...... ...... ..........................187
ORDERING CONSUMABLE SUPPLIES...........................................................187
SHAPE OF PLUG..............................................................................................188
MARKS DISPLAYED OUTSIDE THE MAIN BODY ..........................................188
RS232C COMMUNICATION SPECIFICATIONS..............................................189
..186
SPECIFICATIONS
SPECIFICATION AND PERFORMANCE..........................................................191
ELECTROMAGNETIC COMPATIBILITY ..........................................................193
DIMENSIONS AND WEIGHT............................................................................197
PURPOSE OF USE.................... ....... ...... ....................................... ...... ....... ......197
OPERATIONS AND PRINCIPLE OF OPERATION ..........................................197
ELECTRIC RATING ..........................................................................................197
LASER ILLUMINATION SYSTEM.....................................................................197
SAFETY DESIGNATIONS PER IEC 60601-1 STANDARD ..............................198
TERMINOLOGY
DESCRIPTION OF TERMS.. ...... ....... ...... ....... ...... ....... ...... ...... ....... ...... ....... ......199
END USER LICENSE AGREEMENT...............................................................208
11
Page 14
COMPONENTS
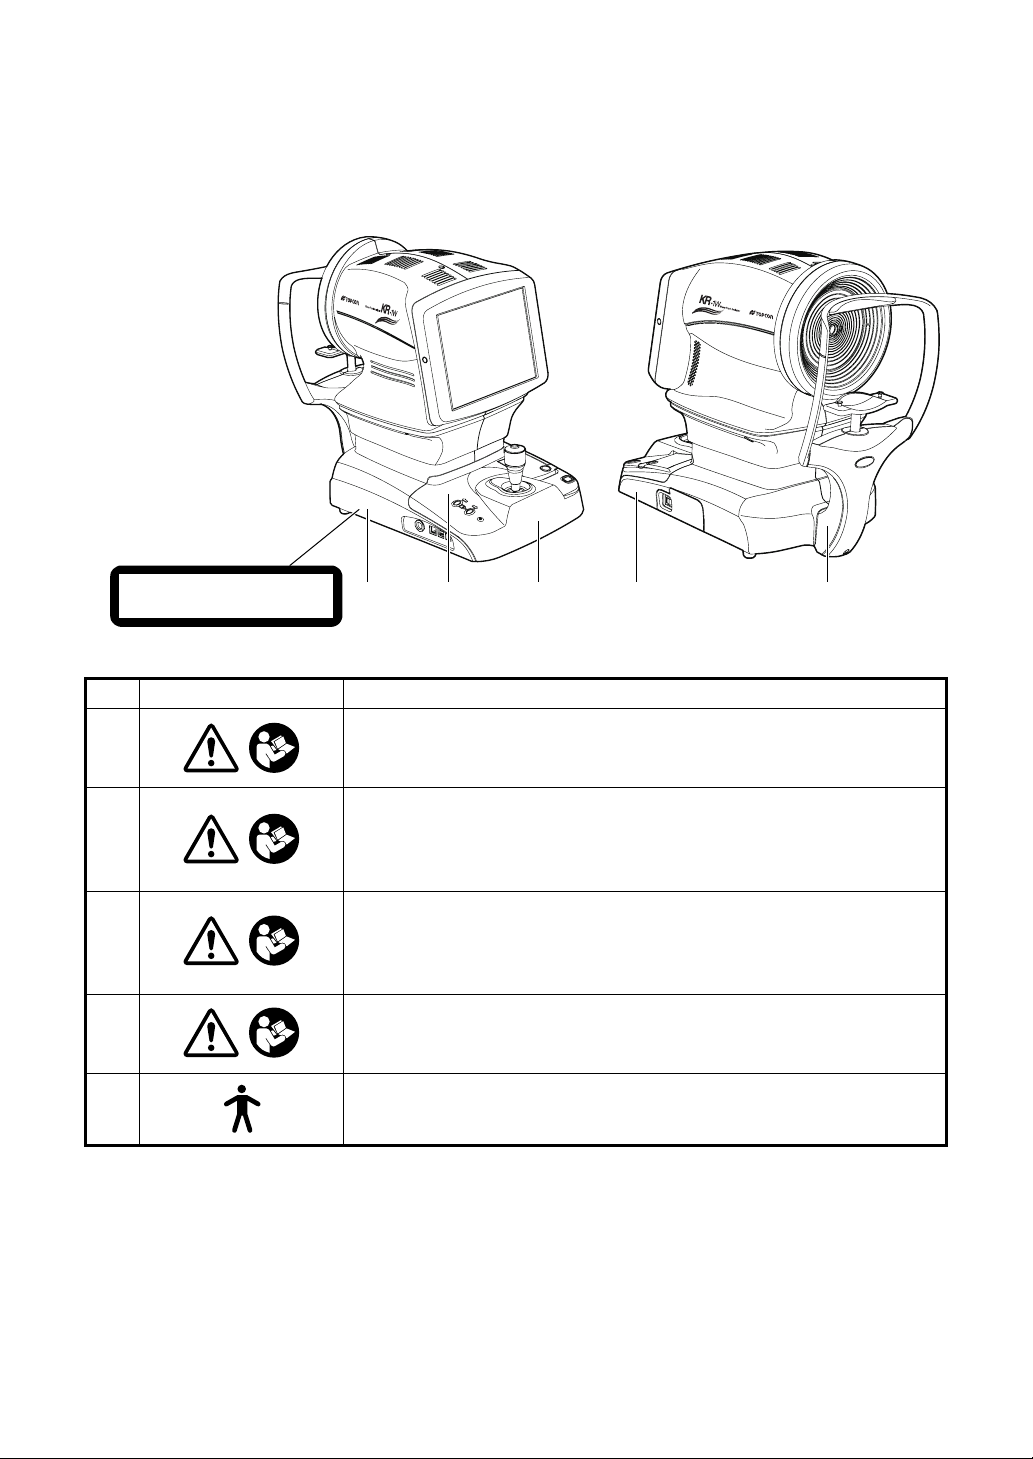
COMPONENT NAMES
Measuring head
Main body Section
Control panel
Measurement switch
Control lever
Chinrest up/down button
External I/O terminal
Power supply Section
Measuring window
Chinrest tissue stopper pin
Printer cover open button
POWER switch
Inlet cover
Chinrest Section
*1: Part where gets in contact with the patient: Type B
COMPOSITION OF PARTS WHICH CONTACT THE HUMAN BODY
Power lamp
Placido ring
Forehead rest
Height mark
Chinrest
*1
*1
Forehead rest : Silicone rubber
Chinrest : Acrylonitrile butadiene styrene resin
12
COMPONENTS
Page 15
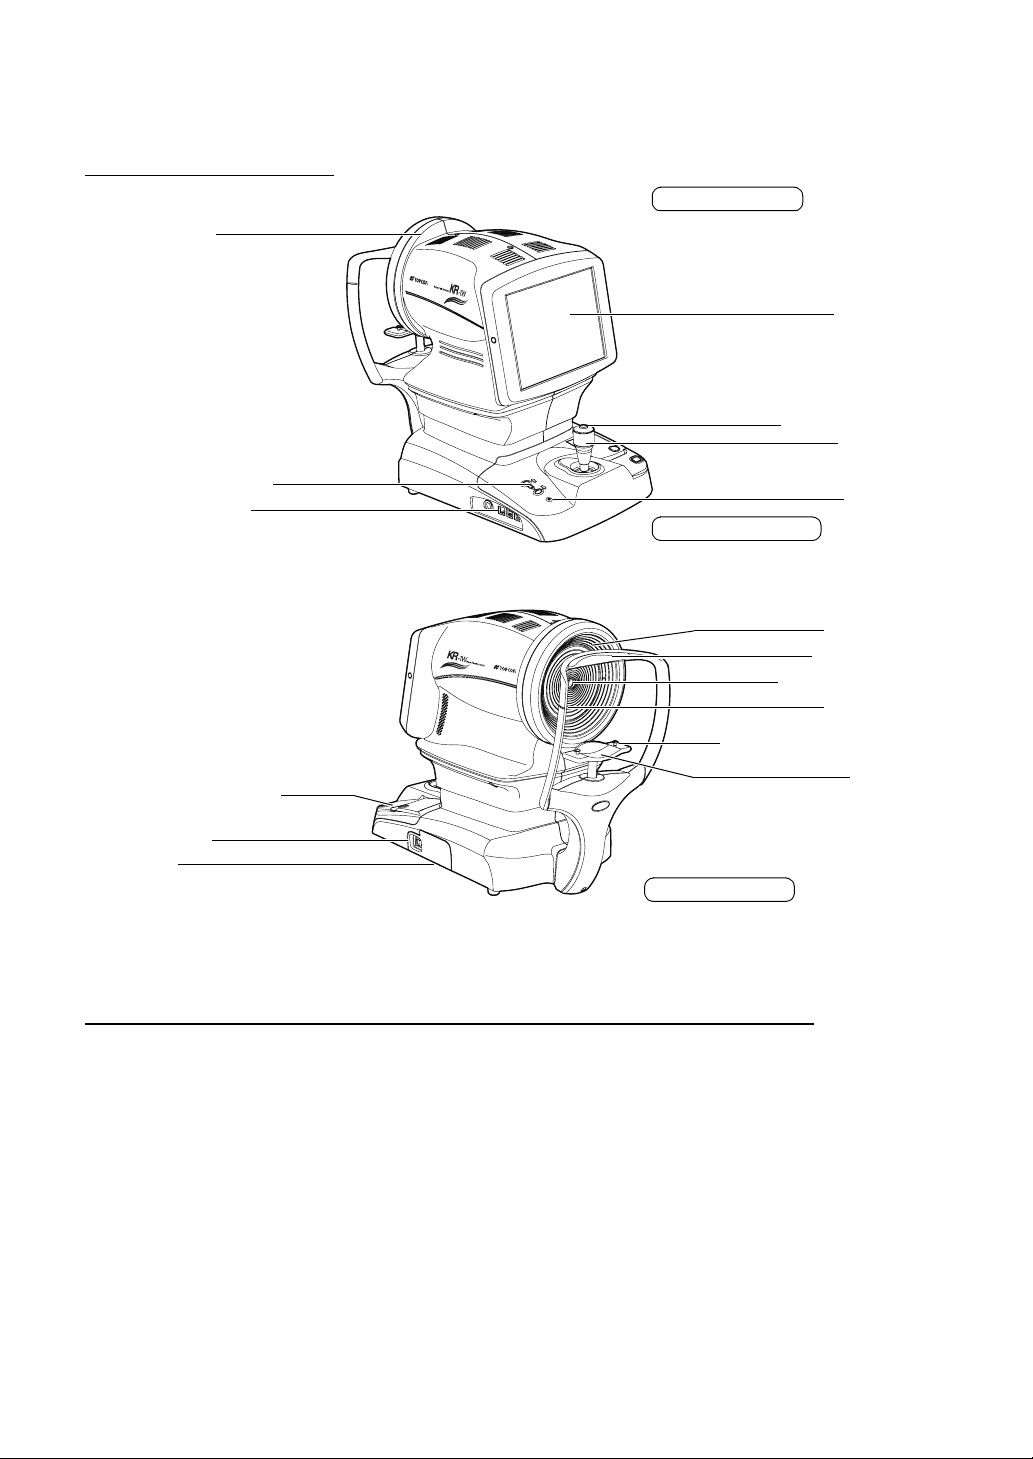
OPERATION METHOD OF CONTROL PANEL
Control panel is a touch panel performing various operations and setups by touching the
screen. It displays the information including setting con ditions and measurement results as
well as observation images.
MEMO
Tap To select any relevant item.
Touch the screen softly with a finger.
(Example)
Enlarging the image (Method 1)
When operating the control pane l, do not use any sharp tools; e.g. ball
point pen.
Drag Used to change images.
(Overlay, Reduction of image size, etc.)
Touch the screen softly and move the finger.
Reducing the image
Touch th e upper part of the ima ge and drag it
upward.
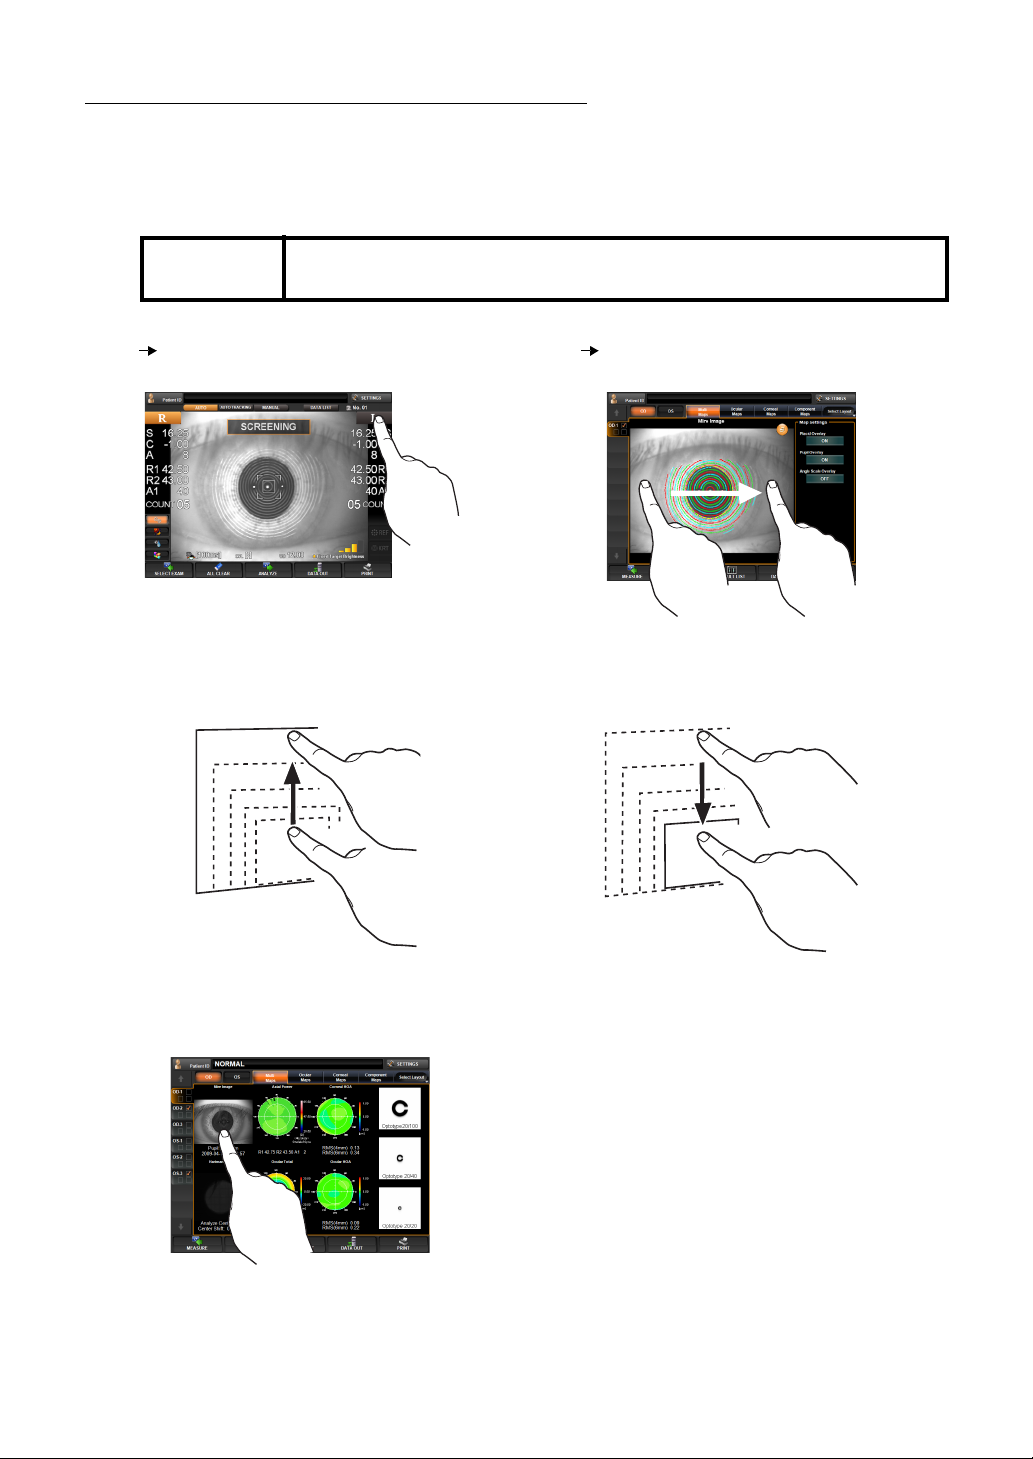
Enlarging the image (Method 2)
Tap the image.
Tou ch the upper part of the im age and drag i t
downward.
13
COMPONENTS
Page 16
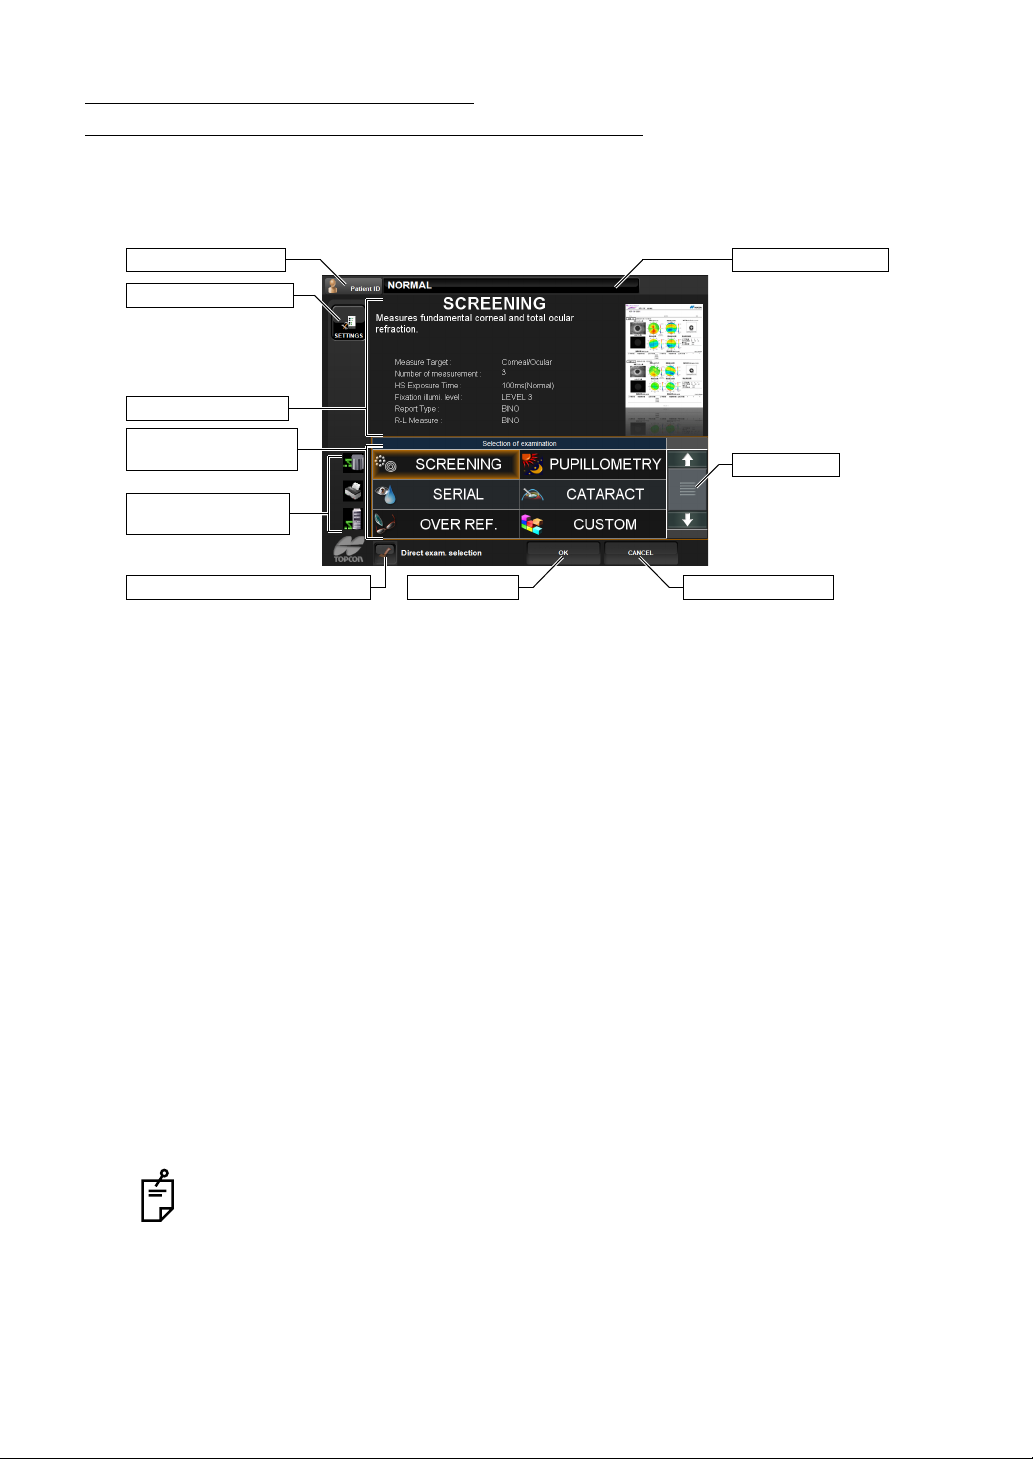
CONTROL PANEL COMPONENTS (EXAMINATION PURPOSE SELECTION SCREEN)
This is the screen to select the measurement course provided according to the examination
purpose after turning the instrument on.
(3) Patient ID button
(1) SETTINGS button
(2) Setting conditions
(4) Selection of
examination button
(8) Connection status
icons
(6) OK button(9) Direct exam. selection button
Display of patient ID
(5) Scroll bar
(7) CANCEL button
(1) SETTINGS button Used to change the setting details of each m easurement course
by examination purpose.
(2) Setting conditions Displays the current ly selected measurem ent course and its set-
ting conditions.
(3) Patient ID butt on The Patient ID INPUT s creen is displaye d. The patient ID is dis-
played on the right.
(4) Selection of examination button
Used to select the measuremen t course according to the examination purpose.
(5) Scroll bar If some measurement courses are not displayed, the next mea -
surement course can be displayed by dragging the scroll bar.
(6) OK button Confirms the selected measurement course and shifts to the
measurement screen .
(7) CANCEL button Cancels the change of the measurement course and return s to
the measurement screen with the setting before the change.
(8) Connection status icons
If any PCs and prin ters ar e con nec ted to thi s ins tr ume nt, they will
be displayed as icons.
(9) Direct exam. selection button
If checked, the s creen swit ches to t he measu rement sc reen right
after tapping the measurement mode name.
After started, the exa mination p urpose sele ction scre en will no t be displ ayed and
can be set to display the measurem ent screen directly instea d. For more details,
refer to page
TRARY OPERATION INTERFACE".
14
COMPONENTS
37, "SELECTION OF EXAMINATION INTERFACE AND ARBI-
Page 17
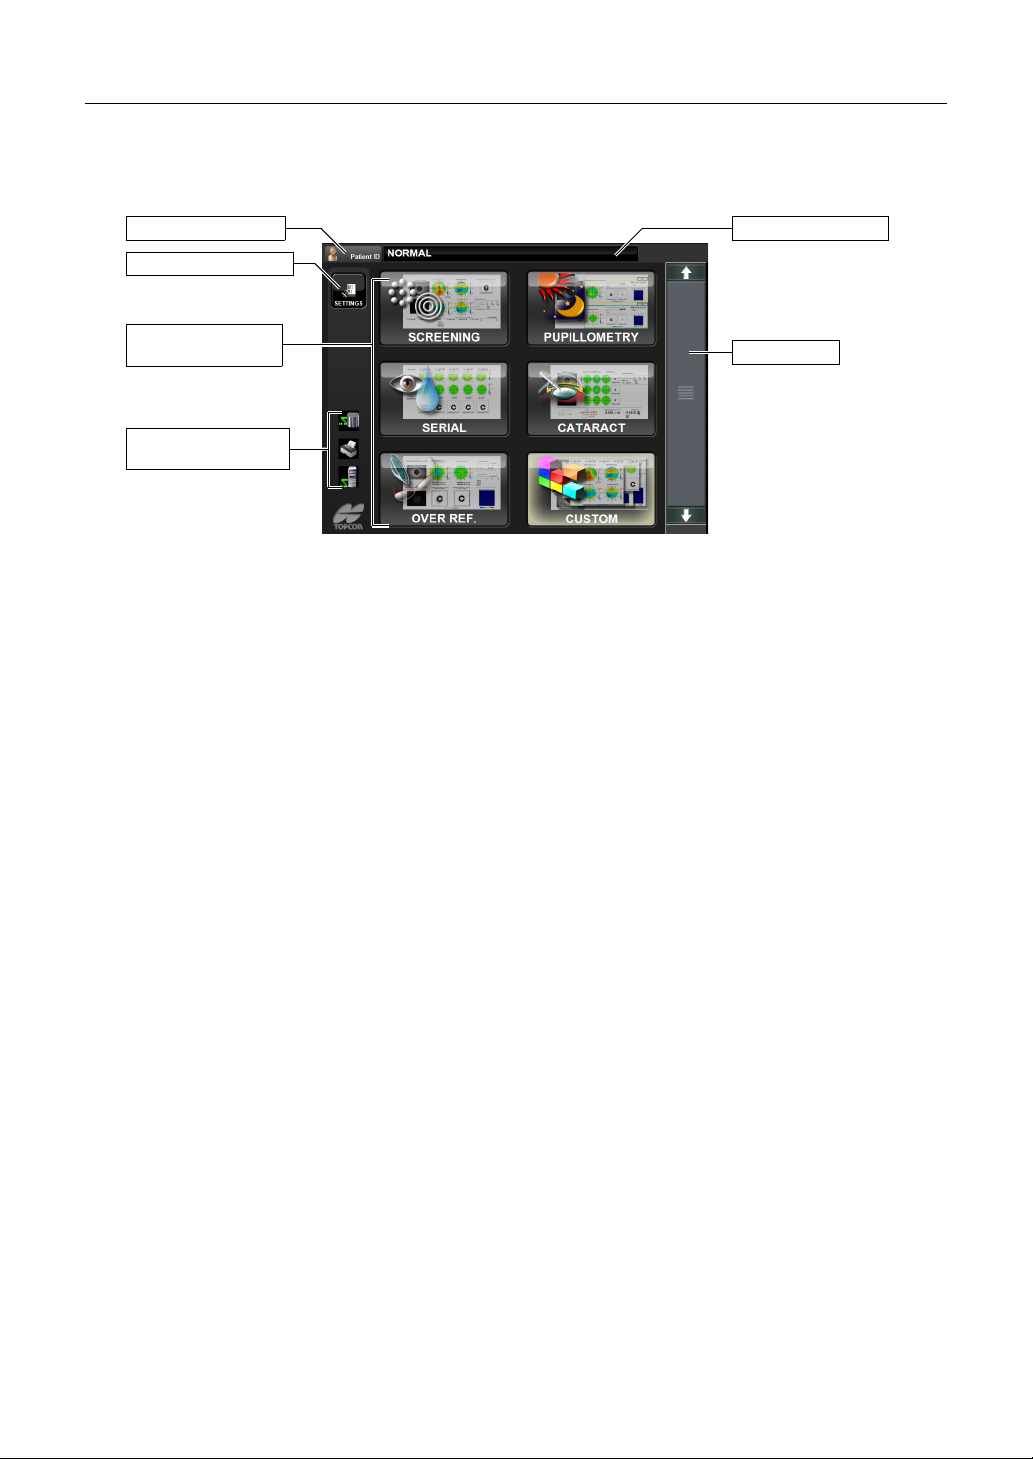
CONTROL PANEL COMPONENTS (SELECTION OF EXAMINATION SCREEN)
This is the screen to select the measurement course provided according to the report after
turning the instrument on and starting it.
(3) Patient ID button
(1) SETTINGS button
(2) Report selection
screen
(5) Connection status
icons
Display of patient ID
(4) Scroll bar
(1) SETTINGS button Used to change the setting details of each m easurement course
by examination purpose.
(2) Report selection screen
Used to select the measurement course according to the report.
(3) Patient ID butt on The Patient ID INPUT s creen is displaye d. The patient ID is dis-
played on the right.
(4) Scroll bar If some measurement courses are not displayed, the next mea -
surement course can be displayed by dragging the scroll bar.
(5) Connection status icons
If any PCs and prin ters ar e con nec ted to thi s ins tr ume nt, they will
be displayed as icons.
15
COMPONENTS
Page 18
CONTROL PANEL COMPONENTS
R
L
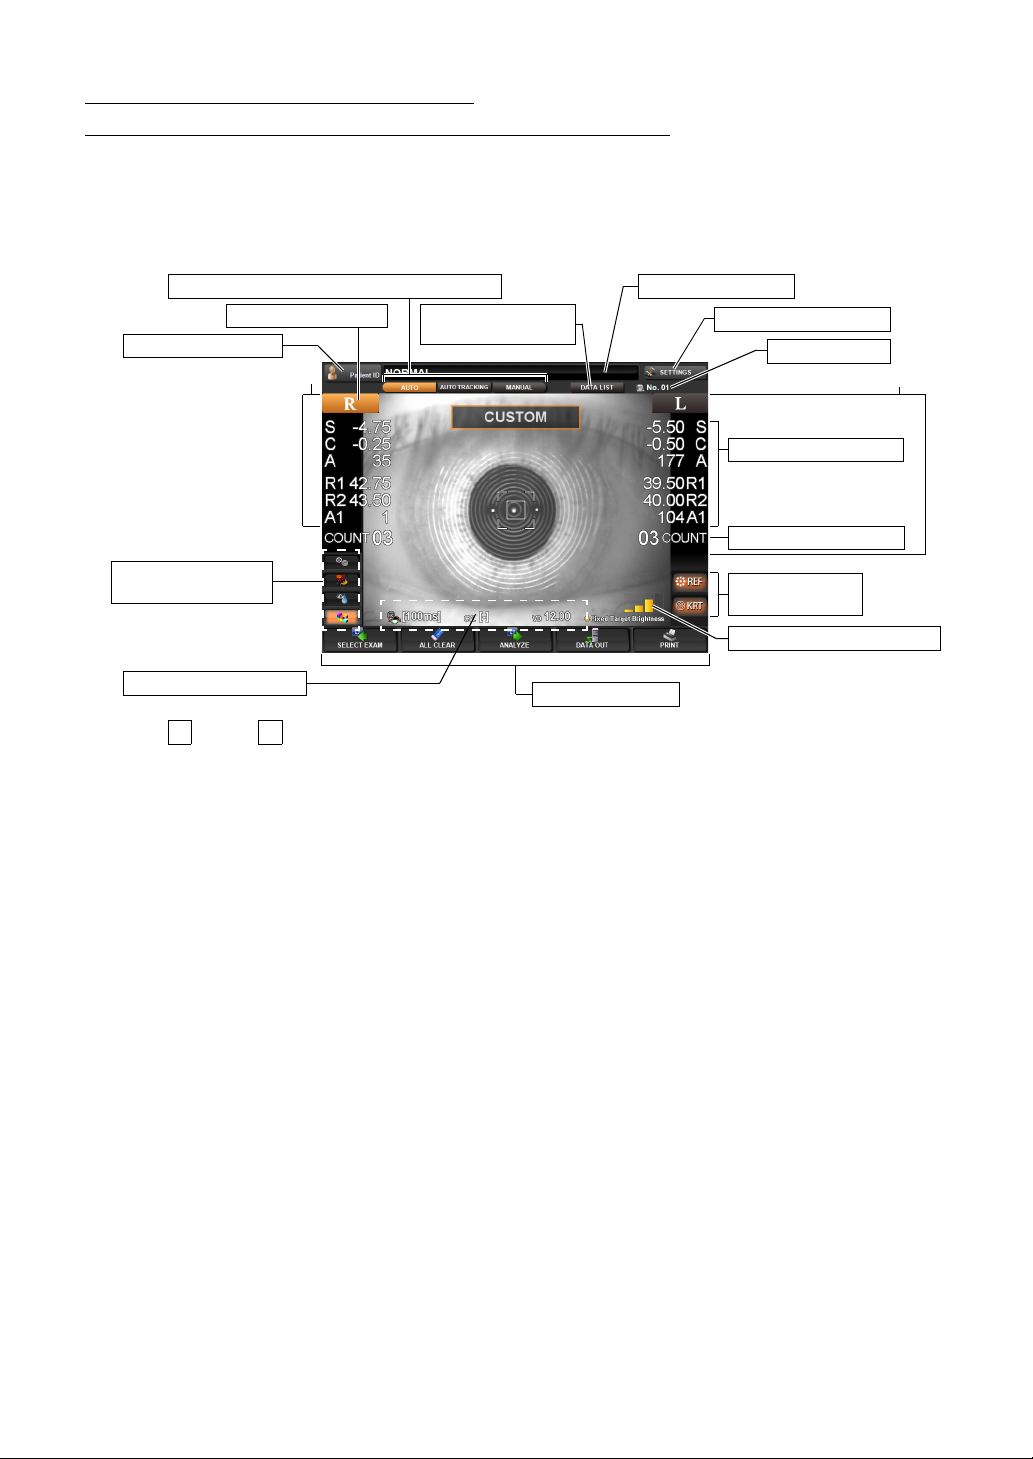
(MEASUREMENT SCREEN IN THE REF/KRT MODE)
AUTO MEASUREMENT SCREEN
The control panel di splays observation images an d shows set conditions and measurement results. The control panel is also used as a touch panel for pe rfor mi ng va rious oper ations and settings.
(8) AUTO/AUTO TRACKI NG/M ANUAL butt on
(1) R button, L button
(3) Patient ID button
Right eye
(9) Measurement
Data List button
Display of patient ID
(12) SETTINGS button
(2) Machin e No.
Left eye
(4) Measurement value
(5) Measurement count
(13) Exam purpose
shortcut button
(6) Display of set values
(7) Function button
(11) REF button,
KRT button
(10) Fixed Target Brightness
(1) button, button Select the right/left eye. When the button is tapped, the main body
moves in the selected direction. (see page 52)
The selected R/L button is displayed in orange. (see page 52)
Continuous measurements of right and left eyes and the measurement of only the right/left eye can be set.
(2) Machine No. The machine No. is displayed. This can also be hidden (see page
135).
(3) Patient ID The Patient ID INPUT s creen is displaye d. The patient ID is dis-
played on the right.
(4) Measurement value Measur ement values of REF (S, C, A) and KRT (R1, R2, A1) are
displayed.
(5) Measurement count The measurement count each of the right/left eye is displayed.
*(4)-(5) are displayed on the right/left ends of the screen.
(6) Display of set values Displaying the current setting values including the Hartmann
exposure time, astigmatism sign and vertex distance. The
Hartmann Exposure time can be changed on this screen. (see
page
51)
(7) Function button A list of operable functions is displayed. Select the relevant button
on the touch panel. (see page
17)
(8) AUTO button/AUTO TRACKING button/MANUAL button
Measurement mode is changed for AUTO, AUTO TRACKING
and MANUAL. (see page
50)
(9) Measurement Data List button
Measurement values are displayed in list form. (see page 70)
16
COMPONENTS
Page 19
(10) Fixed Targ et Brigh tnes s
ALL CLEAR
The patient fixation target brig htness can be se lected. (see page
50)
(11) REF button, KRT button
If the measurement co urse by examinatio n purpose is not used,
REF and KERATO continuous measurement (both REF and
KERATO buttons are l it), REF indi vidual m easurement (REF but
ton only is lit) and KERATO individual measurement (KERATO
button only is lit) can be set arbitrarily. (see page
: REF/KRT continuous measur e men t
Analysis of refractive wa vefront aberration and corn eal
wavefront aberration can be done using the obtained
results.
: REF measurement
Analysis of refracti ve wavefro nt aberrati on can b e done
using the obtained results.
: KRT measurement
Analysis of corneal wavefront aberration can be done
using the obtained results.
(12) SETTINGS button Various settings are available , for measur ing operation, output of
measurement value data and res ult displ ay format et c. (see page
111)
(13) Exam purpose shortcut button
A shortcut button to s elect the m easurem ent course a ccording to
the examination purpose.
49)
-
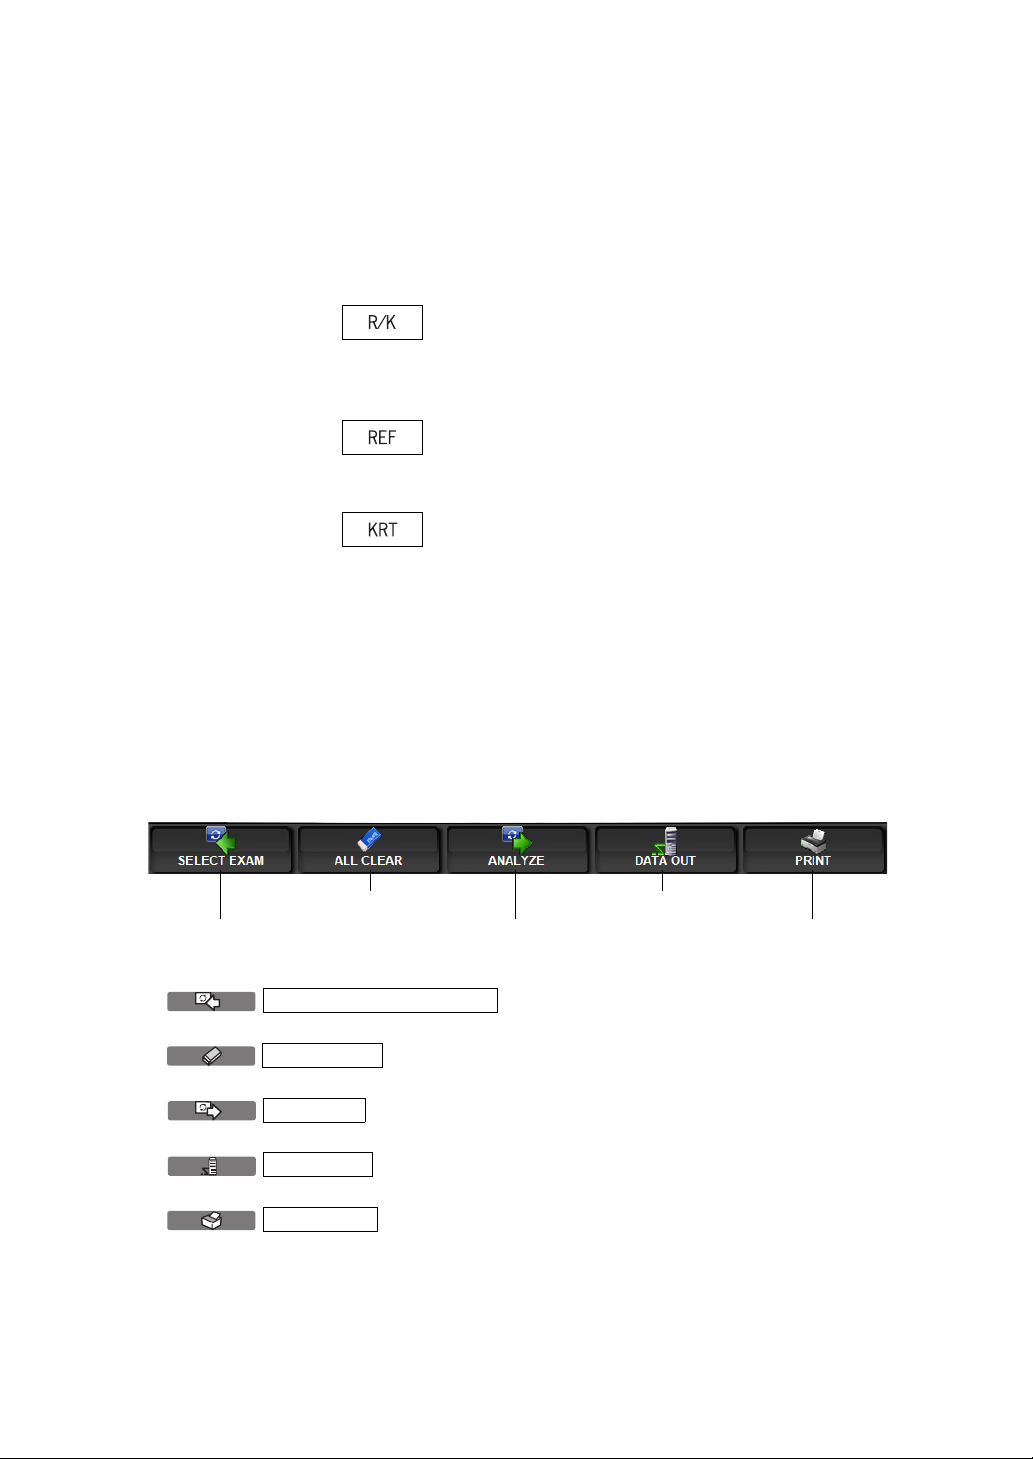
DETAILS OF FUNCTION BUTTONS
(2) ALL CLEAR button (4) DATA OUT button
(1) Selection of examination button (3) ANALYZE button (5) PRINT button
(1) button
(2) button
(3) button
(4) button
(5) button
Selection of examination
Moves to the examination purpose selection screen. (see page 14)
Clears all measurement data.
ANALYZE
The display goes to the ANALYSIS RESULT screen. (See page 77)
DATA OUT
Transfers the measurement data.
PRINT
Prints the measurement results out via the built-in printer.
17
COMPONENTS
Page 20
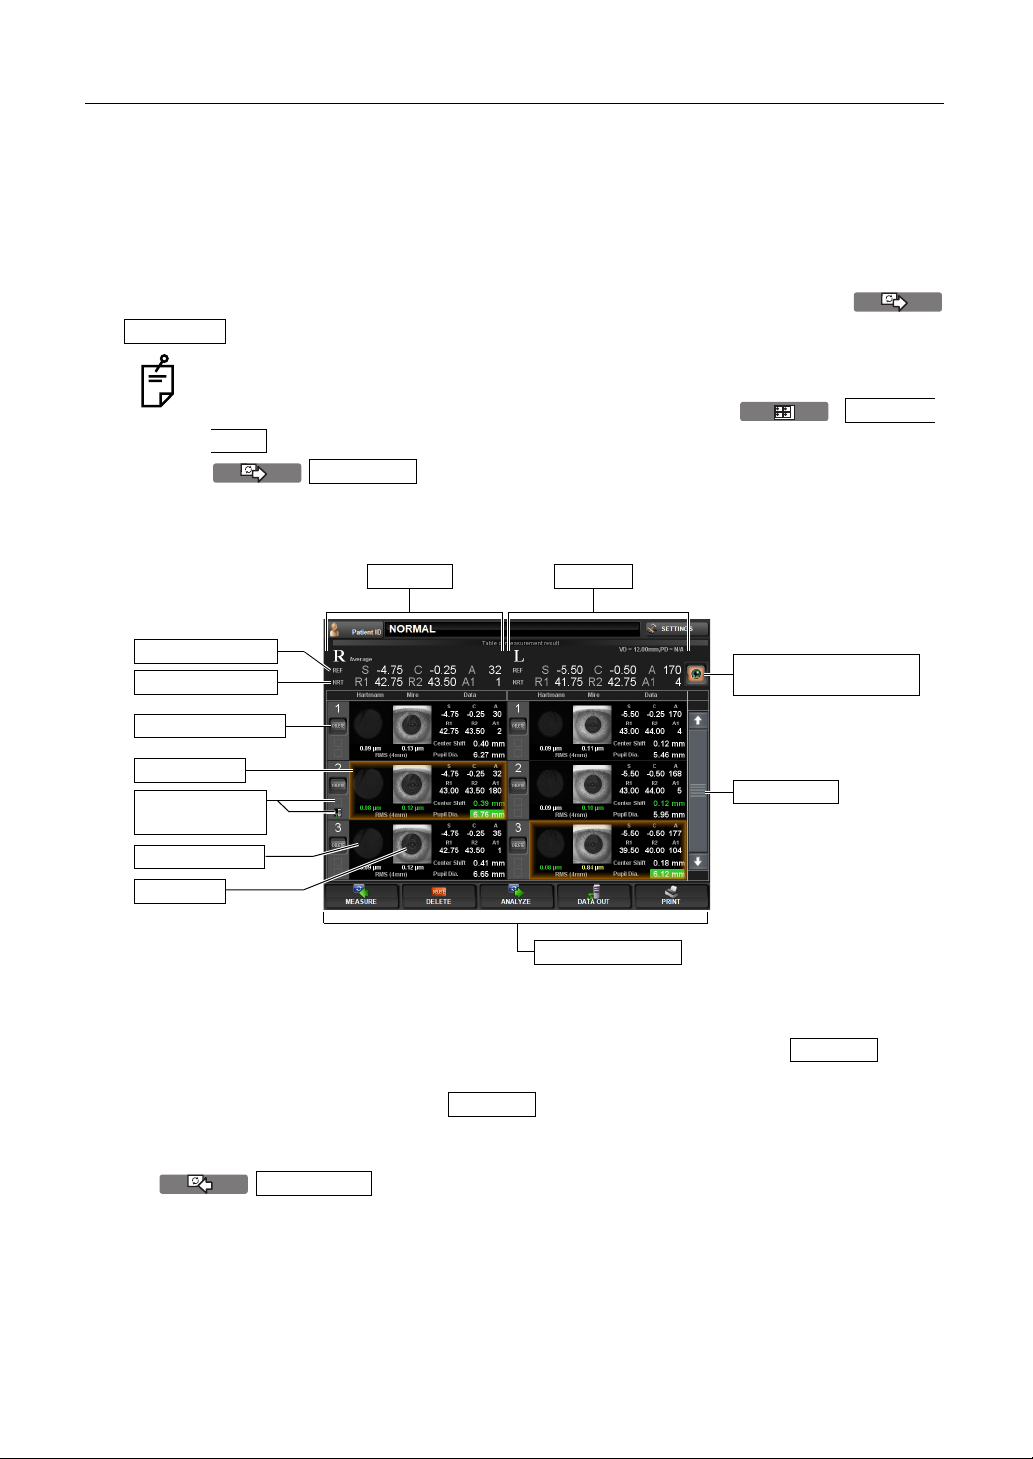
CONTROL PANEL COMPONENTS (MEASUREMENT RESULT LIST SCREEN)
T L
DELETE
MEASUREMENT RESULT LIST SCREEN
On the Measuremen t Result List s creen, a lis t of measurem ent results c an be confirm ed. By
selecting the da ta to be di spla yed, data outp ut to th e exte rnal PC, pr intin g data, initia l dis play
on the Analysis screen, and clearing data can be done.
When plural measurements are performed under Auto mode, the screen is changed automatically to the Measurement Result List screen.
In the case of Manual mode or Auto Tracking mode, it is dis played by tapp ing the
ANALYZE
button after the measurement.
In case of the seri al meas urement, the screen d oes not s hift to the Table of measurement result scree n au toma tic al ly after mea su remen t co mpl eti on. T he Table of
measurement result screen can be displayed by tapping
LIST
button on the progress measurement map displayed with tapping of the
ANALYZE
after measurement. In case of Pupillometry, the screen
RESUL
does not go automatically to the Table of measurement result screen after finishing
the measurement.
Right eye
Typical REF value
Typical KRT value
(2) DELETE button
Selected data
(4) Printed icon/
output icon
Hartmann Image
Mire Image
Left eye
(5) Recommended data
selection button
(1) Scroll bar
(3) Function button
(1) Scroll bar By scrolling t he measurement result, meas urement data can be
scrolled up and down.
(2) DELETE button Select the data to be deleted. The selected button
DELETE
turns on in orange. Under this condition, deleti on is done by tapping the button of the (3)Function button.
(3) Function button Available funct ions ar e listed . Sel ect th e corr espondin g b utton on
the touch panel.
MEASURE
button The Measurement screen is returned and an addi-
tional measurement can be done. However, if data
are outputted to the con nected PC or printed by the
internal/external printer, the display is changed to
18
COMPONENTS
Page 21
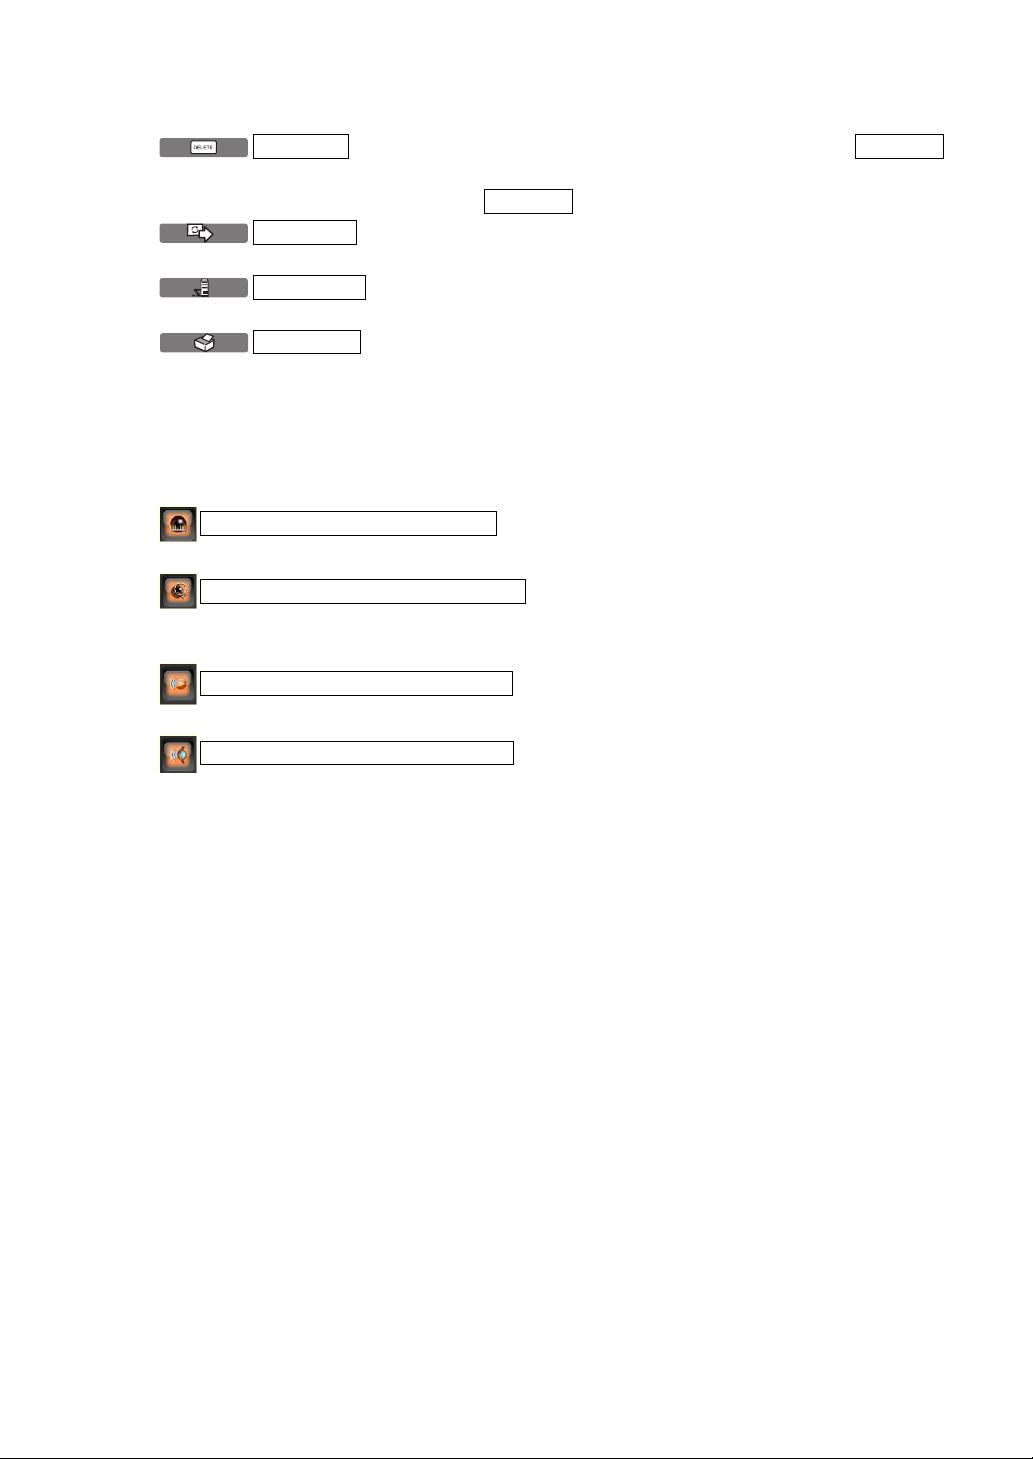
"NEXT MEASUREMENT" and a new measurement
PRINT
.
Min. ocular high-order aberration
n
is started.
DELETE DELETE
ANALYZE
DATA OUT
(4) Printed icon/output icon
(5) Recommended data selection button
button Selecting the data to be deleted by the
button, the data can be deleted by tapping the
button The screen is changed to the selected Analysis
Result screen, and the analysis result is displayed.
button Selected measurem ent result da ta can be outp utted
to the RS-232C or to the connected PC.
button Selected measurement data can be printed by the
internal printer or by the connected external printer.
A printer icon and a PC icon are displayed fo r printed data and
output data respectively.
Data are selected based on four criteria.
DELETE
button.
Max. pupil diameter selection
Min. center Movement Amount Min
Min. corneal high-order aberratio
• For details about the Measurement Result List screen, see page 74.
button
To select a maximum pupil diameter.
button
To sel ect the one with a minimum amount o f center
movement.
button
To select a minimum ocular high-order aberration.
button
To select a minimum corneal high-order aberration.
19
COMPONENTS
Page 22
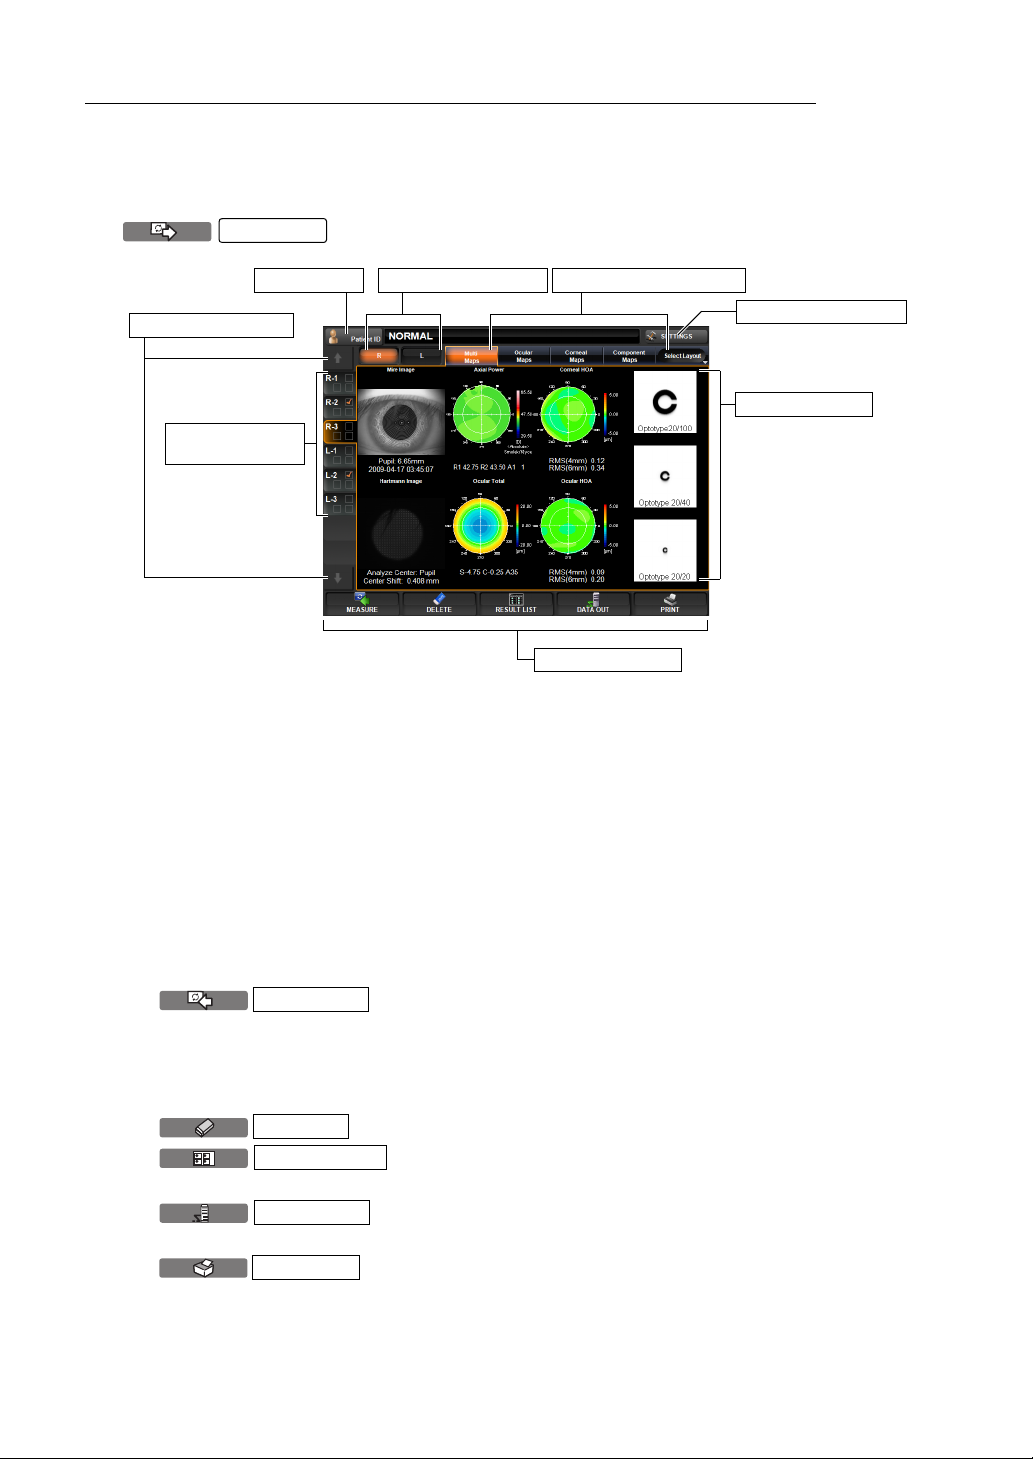
CONTROL PANEL COMPONENTS (ANALYSIS RESULT SCREEN)
T
ANALYSIS RESULT SCREEN
The KR-1W can perform REF/KRT measurements and aberration measurements by capturing
Hartmann Shack and Mire images of the patient's eye. After the measurement, tap the
ANALYZE
button to display analysis results on Measurement Result List Screen.
(4) R-L Change button
(1) Data Feed button
(7) Measurement
value data tub
(2) Layout Change button(3) Patient ID
(8) SETTINGS but ton
(6) Analysis result
(5) Function button
(1) Data feed button ( 7) If there are too many data to display on the Me asurement value
data tab, the tab of the next measur ement data is displayed or the
previous measurement value data tab is displayed.
(2) Layout Change button
Displays the measu remen t result by changin g it to the pre viously set
layout pattern. Four lay out types can be register ed. (For scre en lay
-
out, see page 142)
(3) Patient ID The Patient ID INPUT screen is displayed. The patient ID is dis-
played on the right.
(4) R-L Change button Moves to the first measured data of each of the right and left eyes.
(5) Function button A list of operable functions is displayed. Select a relevant button by
the touch panel.
MEASURE
button The screen returns to the measurement screen for addi-
tional measurements. However, note that the display
changes to start a new measurement whe n data is out
put to the connected PC and printed throught the built-in
printer and the external printer.
DELETE
RESULT LIS
button The measurement data currently displayed are cleared.
button
Changes to Result List display mode. (see page 74.)
DATA OUT
button Selected measurement r esult data can be outp utted to
the RS-232C or to the connected PC.
PRINT
button When the external pri nter is set, the displayed analys is
result can be outputted to the external printer. For
20
COMPONENTS
Page 23

details about the external printer, see "SETTING THE
EXTERNAL PRINTER (EXTERNAL PRINTER)" on
page 134. O utput layout of the external printer can be
selected. For details see page 167, SETTING OF
EXTERNAL PRINTER (PRINT EXT).
(6) Analysis result Analysis results such as Mire image , Hartm ann im age and wave -
front aberration image are displ ayed. For details abo ut displaying
the analysis results, see "
RESULT" on page 74.
(7) Measurement value data tub
Measurement data is displayed in the order of measurement from
above. The recommende d data is displ ayed with a check mark. A
printer icon and a PC icon are disp layed for prin ted data a nd out
put data respectively.
(8) SETTINGS button Various settings are available. (see page 111)
DISPLAYING THE MEASUREMENT
-
21
COMPONENTS
Page 24
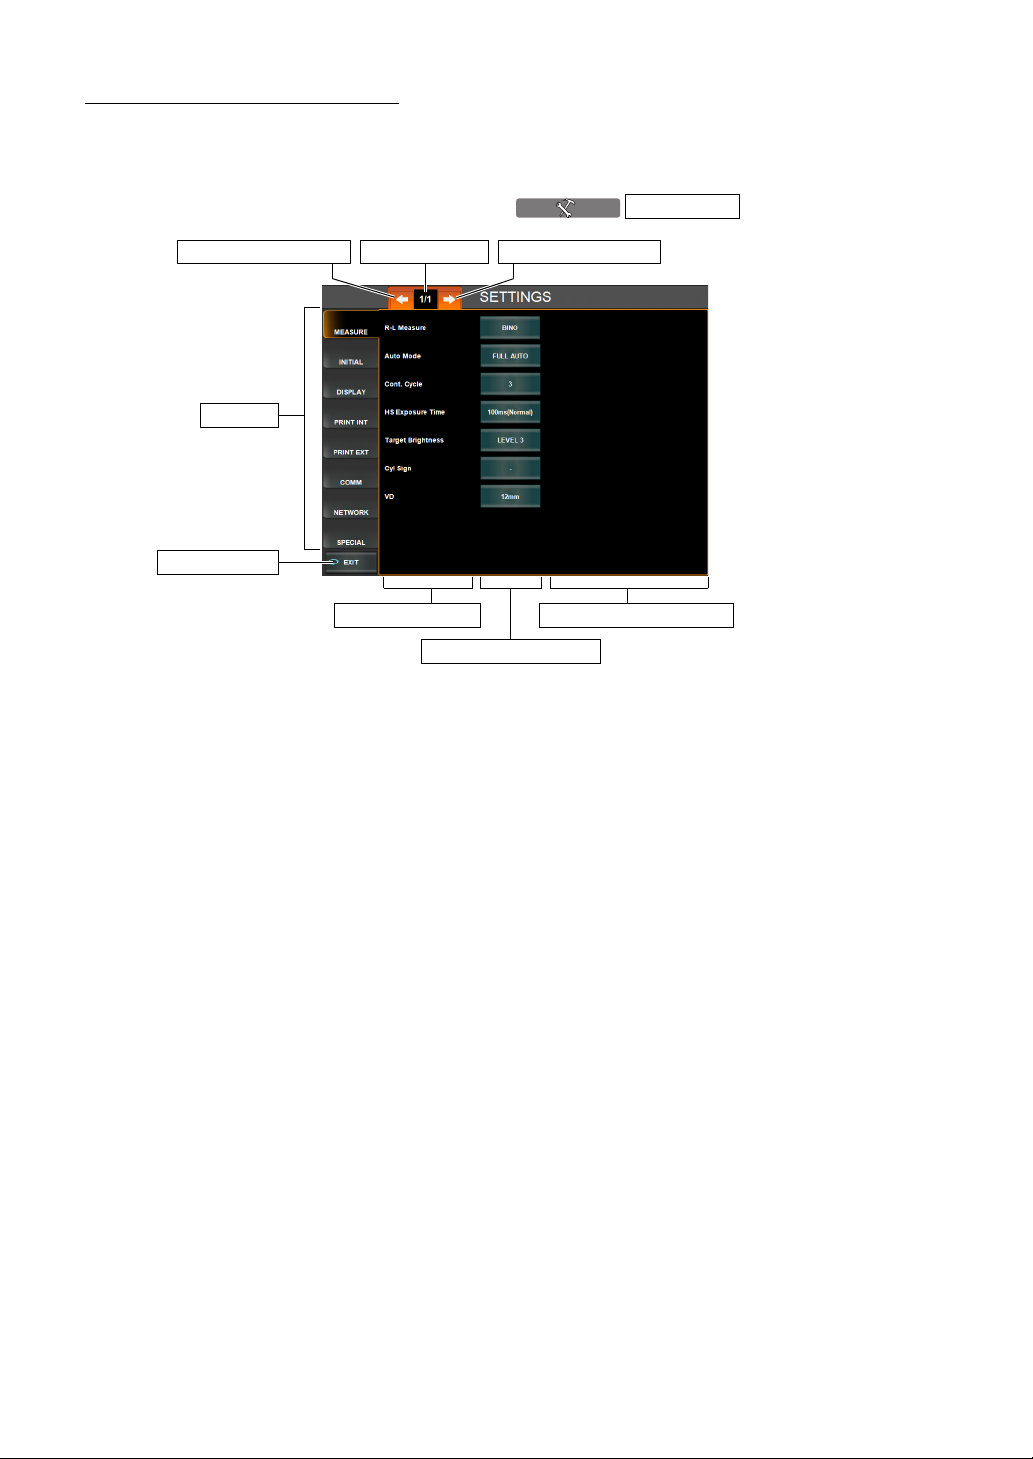
OTHER SCREEN DISPLAYS
MENU SCREEN
Various settings are done on this screen. (See page 111.)
The screen is displayed by pressing the button.
(3) Page Feed button(4) Page Return button (2) Page display
(1) Index
(8) EXIT button
SETTINGS
(5) Set Item d i s p l a y
(6) Set Condition button
(7) Setting Change button
(1) Index Set items are classified by tabs for each subject. The selected
index is highlighted in orange.
(2) Page display Indicates the page position of the displayed index page.
(3) Page Feed button Feeds index pages (when there are multiple pages in the index).
(4) Page Return button Returns the preceding page in the index.
(5) Set Item display Displays set items in the index.
(6) Set Condition button Displays the set condition of current set items. When pressed, the
color changes to orange and the Setting Change button is dis
-
played.
(7) Setting Change button Select items for changing the setting by pressing the button.
When selected, the result is reflected on the Set Condition button.
(8) EXIT button Saves the set contents and returns to the MEASUREMENT
screen.
22
COMPONENTS
Page 25
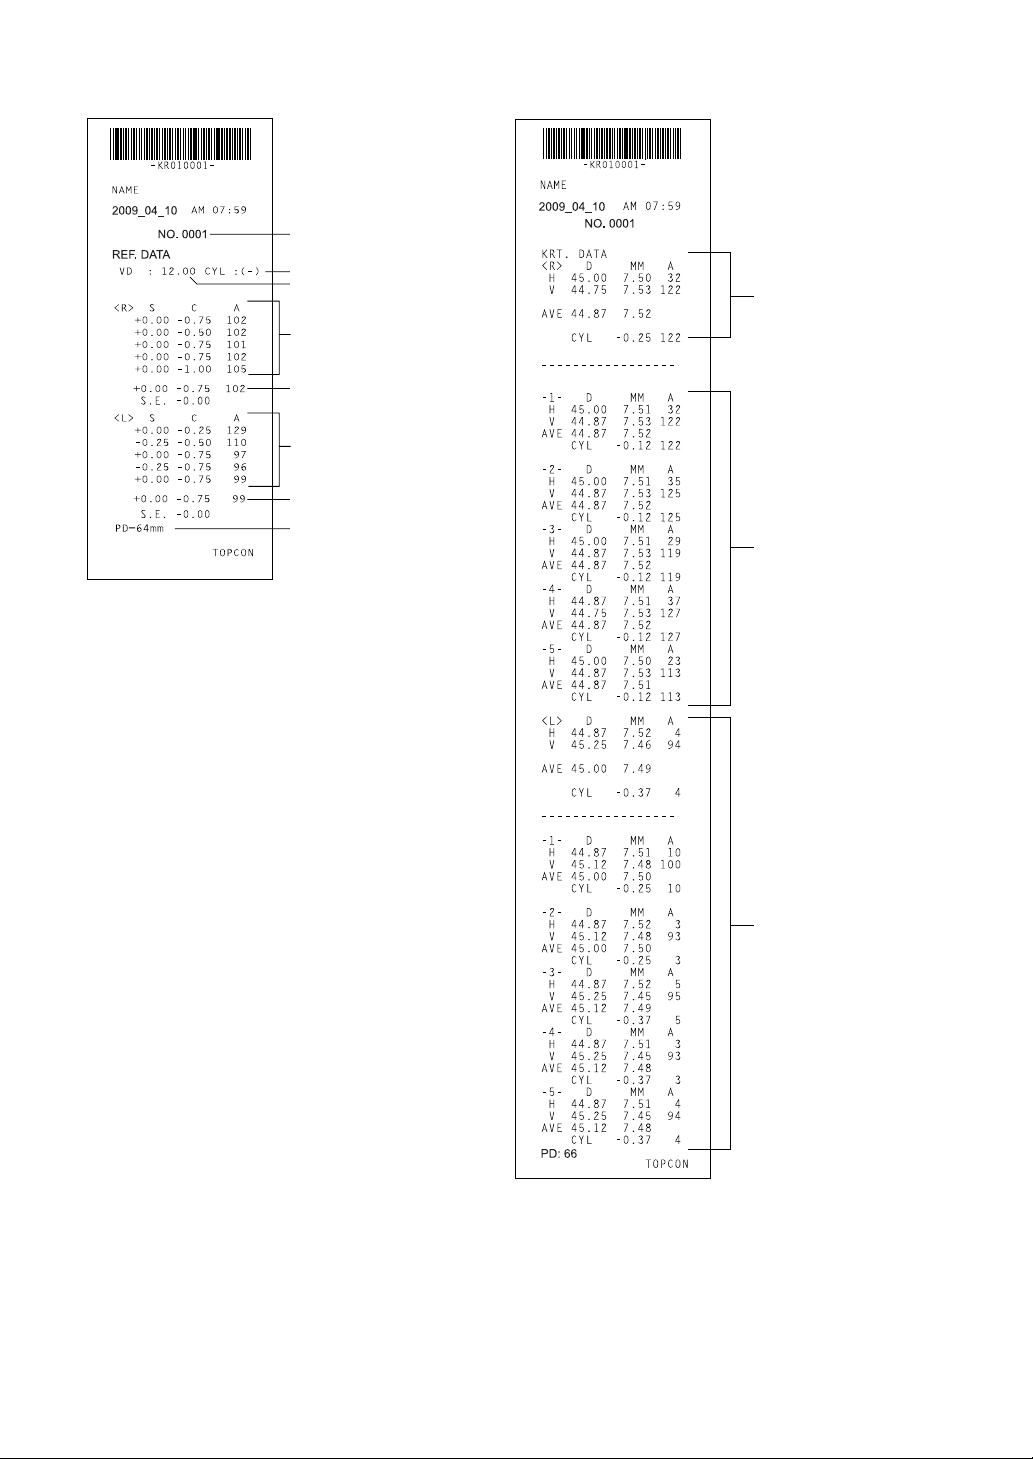
PRINTER OUTPUT
f
a
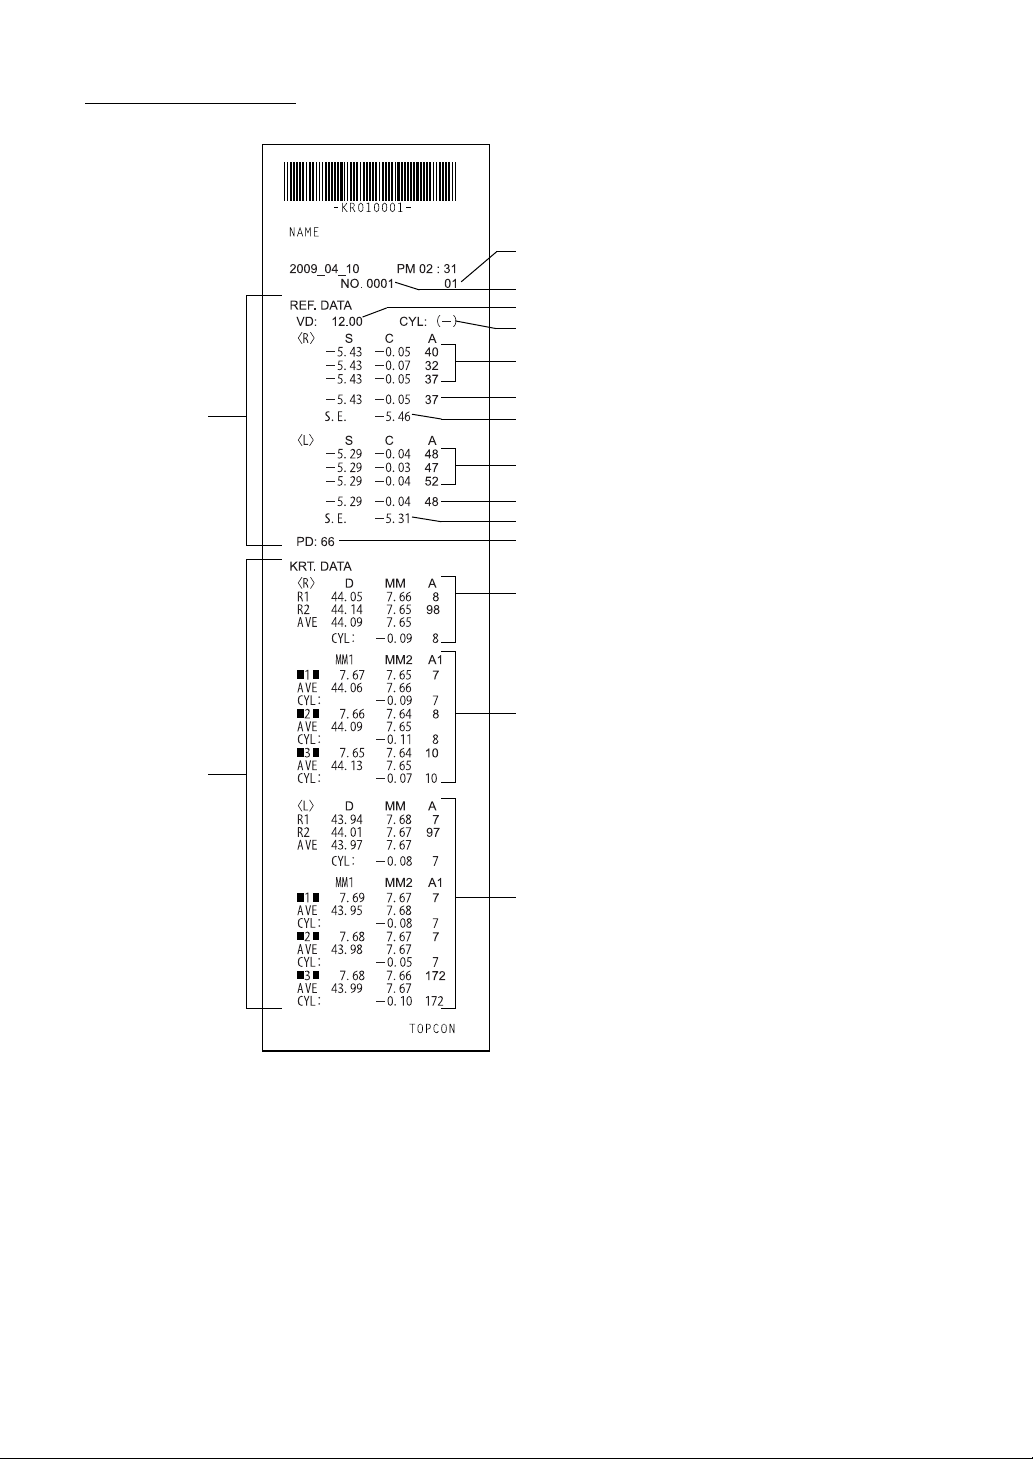
<R/K> MODE
REF
Instrument No.
Patient No.
VD (vertex distance)
Cylindrical power mark
REF Measurement Results of 3 right eye measurements
(recordable up to 10 measurements)
Typical value of right eye
SPHERICAL EQUIVALENT of right eye
REF Measurement Results of 3 left eye measurements
(recordable up to 10 measurements)
Typical value of left eye
SPHERICAL EQUIVALENT of left eye
Pupil distance (PD value)
Right
eye measurements
KRT
Results of 3 right eye corneal curvature measurements o
right eye, average value and astigmatic power of corne
(recordable up to 10 measurements each for right/left eye)
Left eye measurements
23
COMPONENTS
Page 26
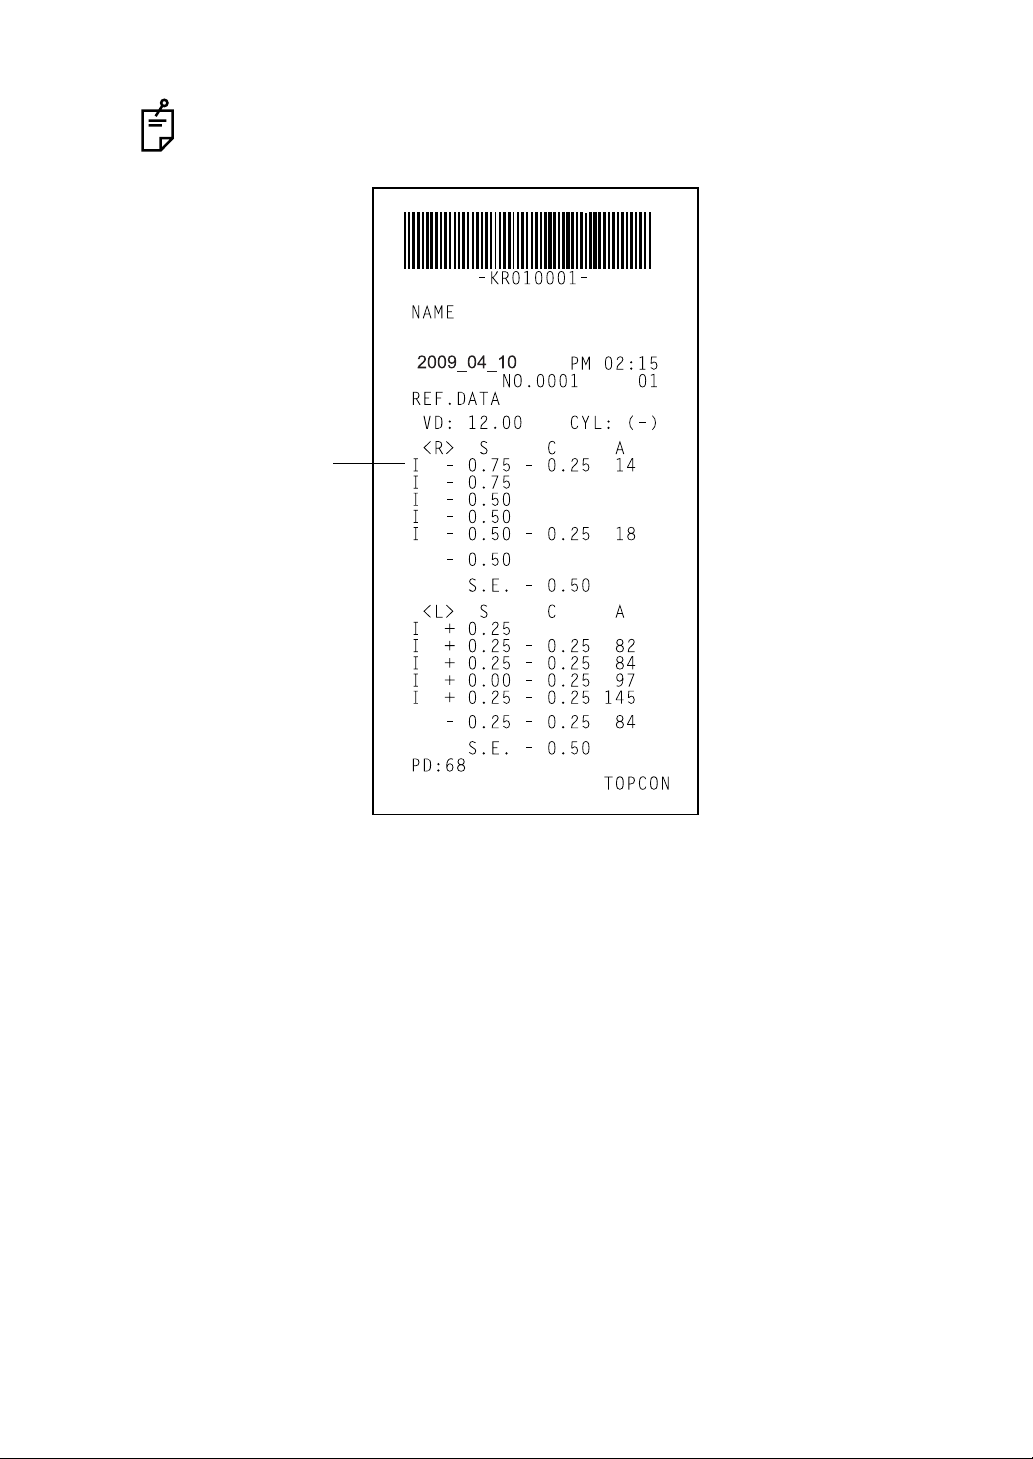
When measurement is taken after changing the Hartman n exposure time, I mark
will be printed out.
When measurement is
taken after changing the
Hartmann exposure time,
I mark will be printed out.
24
COMPONENTS
Page 27
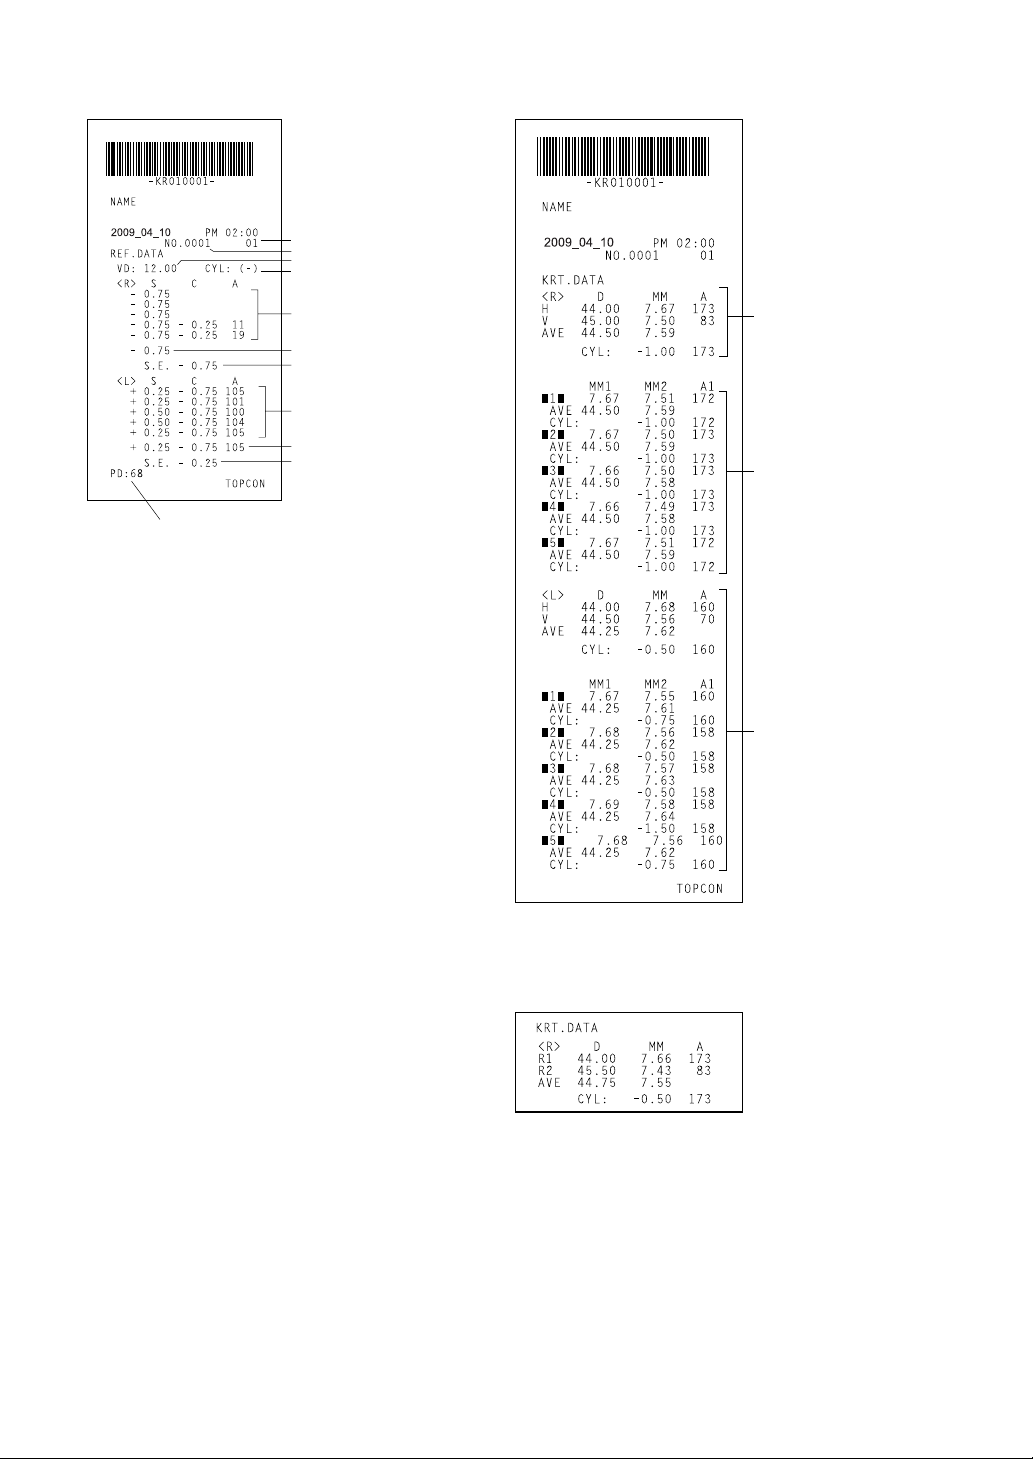
<REF> MODE <KRT> MODE
r-
,
-
a
-
t/
e
Instrument No.
Patient No.
VD (vertex distance)
Cylindrical power mark
Results of 5 refractory power measurements of right eye (r ecor dabl e
up to 10 measurements)
Typical value of right eye
Typical value of right eye
SPHERICAL EQUIVALENT
of right eye
Results of 5 refractory power measurements of left eye (recordable
up to 10 measurements)
Typical value of left eye
SPHERICAL EQUIVALENT of left eye
Near vision PD value
Pupil distance
(PD value)
Typical measured value
of right eye corneal
curvature
Measured value of right
eye cornea (mm)
Results of 5 right eye co
neal curvature measure
ments of right eye
average value and astig
matic power of corne
(recordable up to 10 mea
surements each for righ
left eye)
Measured value of left ey
<R/K> <KRT> MODE
(Kerato data is printed as below
when H/V is set to R1/R2.)
25
COMPONENTS
Page 28
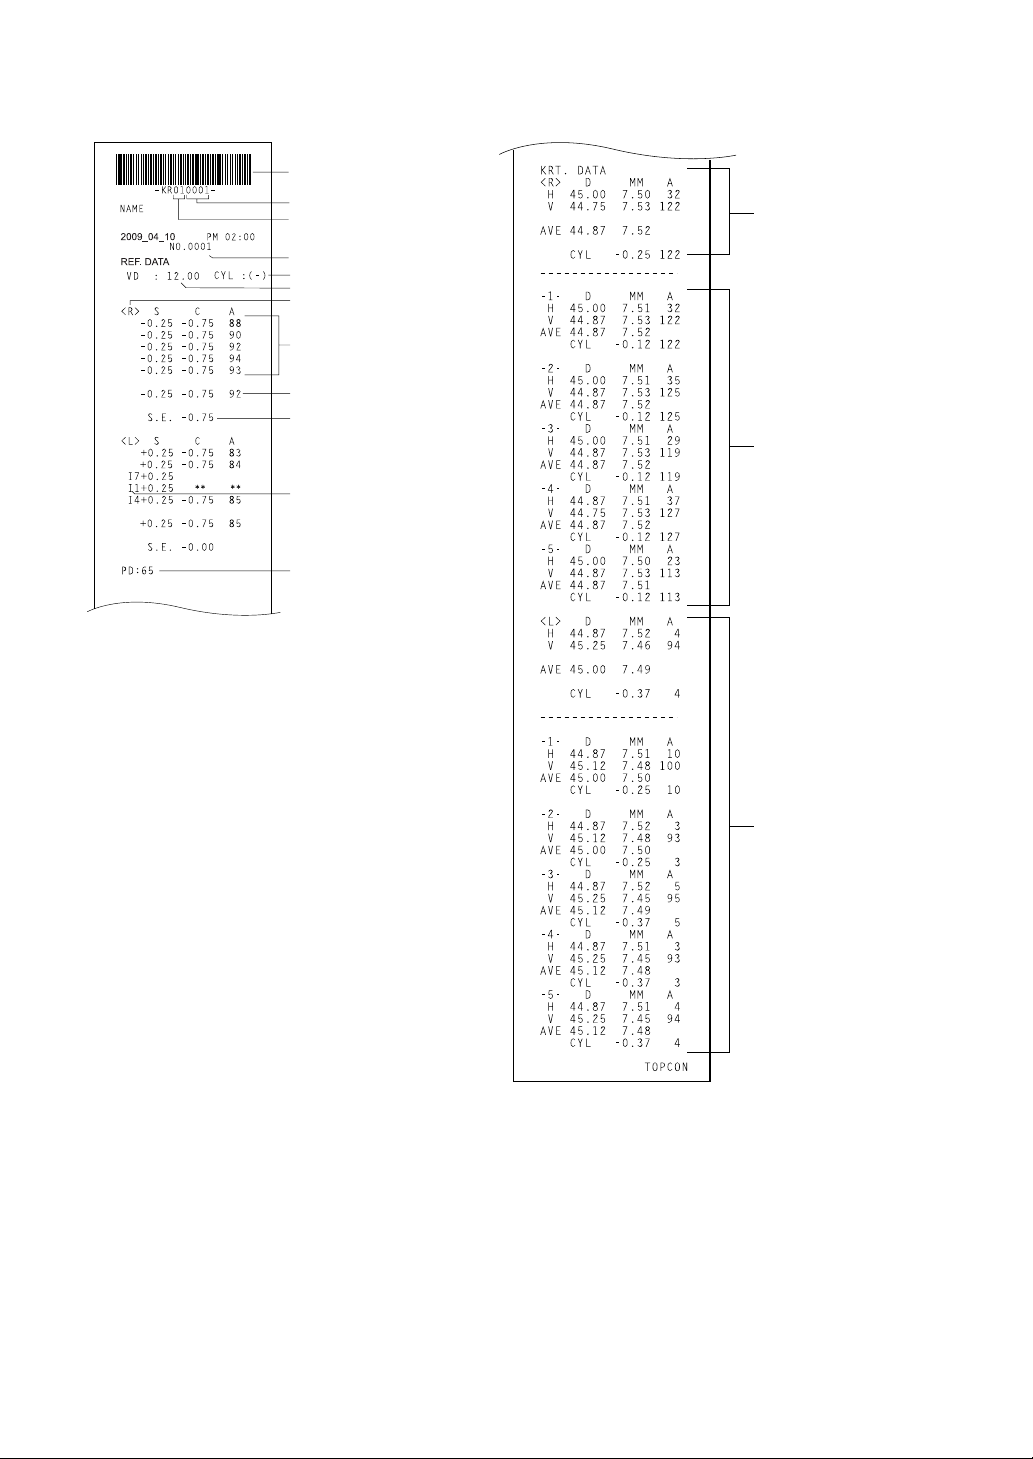
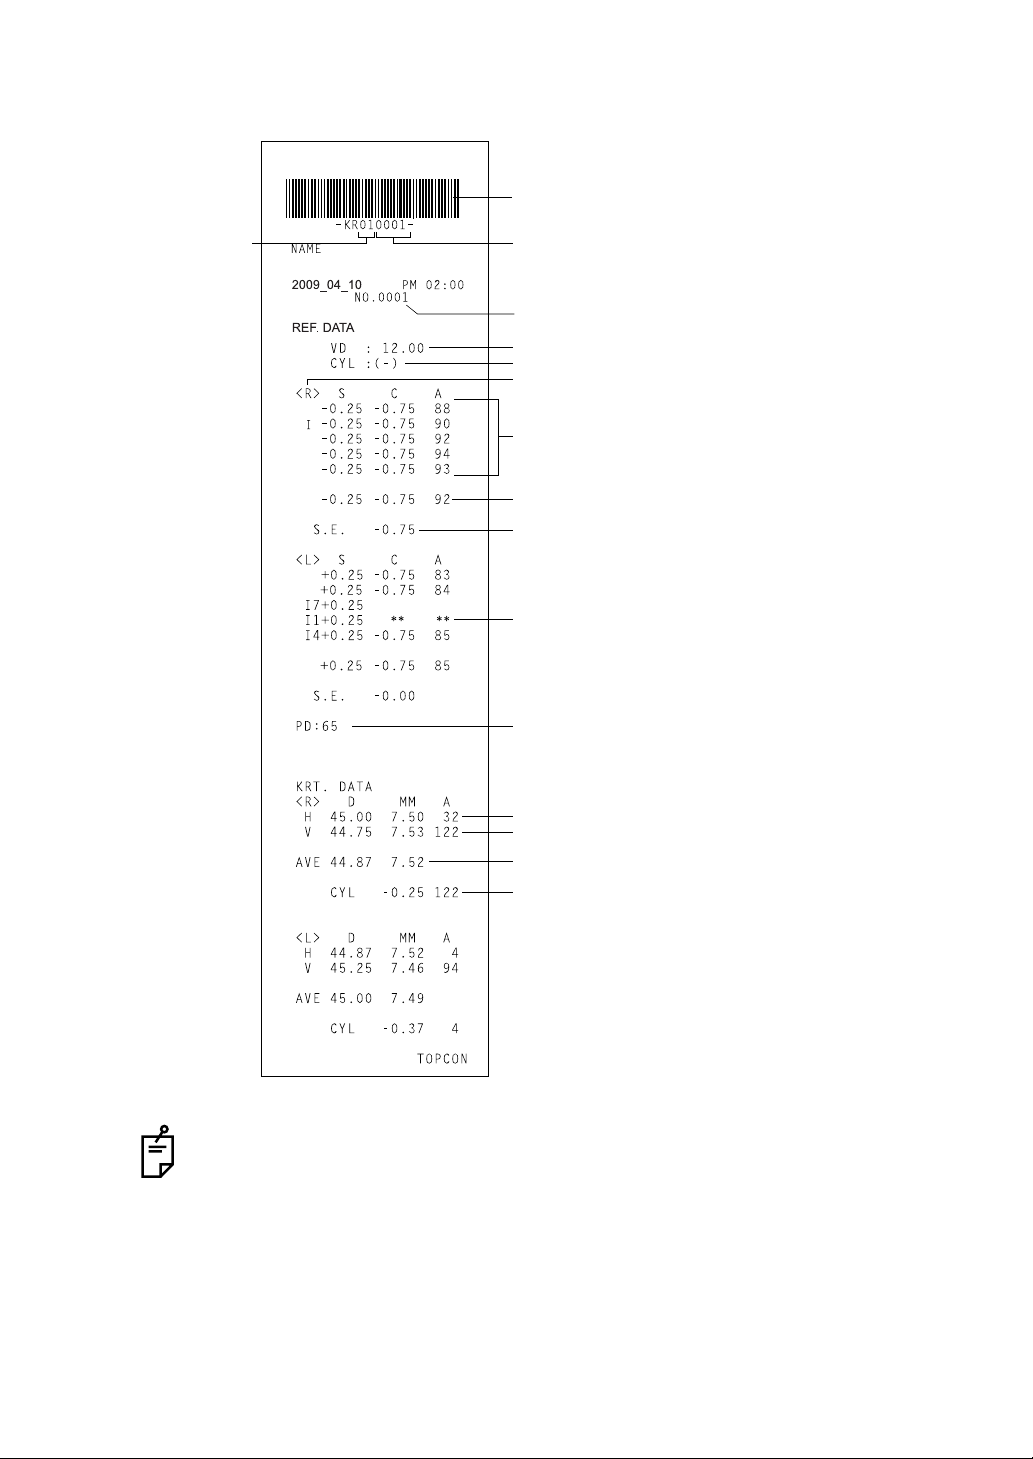
WHEN THE SETTING OF "KRT PRINT TYPE" IS CLASSIC:
-
,
-
r
e
<R/K> MODE
Barcode
Work ID No.
Instrument No.
Patient No.
Cylindrical power mark
VD (vertex distance)
Right
eye measurements
Results of 5 refractory power measurements of right eye (r ecor dabl e
up to 10 measurements)
Typical value of right eye
SPHERICAL EQUIVALENT
of right eye
When measurement is taken
after changing the Hartmann
exposure time, I mark will be
printed out.
PD value
Typical measured value
of right eye corneal
curvature
Results of 5 right eye cor
neal curvature measure
ments of right eye
average value and astig
matic power of cornea
(recordable up to 10
measurements each fo
right/left eye)
26
COMPONENTS
Measured value of left ey
ALL mode (example)
Page 29
<REF> MODE <KRT> MODE
r-
,
-
a
-
t/
e
Patient No.
Cylindrical power mark
VD (vertex distance)
Results of 5 refractory power measurements of right eye (r ecor dabl e
up to 10 measurements)
Typical value of right eye
Results of 5 refractory power measurements of left eye (recordable
up to 10 measurements)
Typical value of left eye
Pupil distance (PD value)
Typical measured value
of right eye corneal
curvature
Results of 5 right eye co
neal curvature measure
ments of right eye
average value and astig
matic power of corne
(recordable up to 10 mea
surements each for righ
left eye)
Measured value of left ey
27
COMPONENTS
Page 30
WHEN THE SETTING OF "KRT PRINT TYPE" IS CLASSIC2:
<R/K> MODE
Barcode
Instrument No.
Work ID No.
Patient No.
VD (vertex distance)
Cylindrical power mark
Right eye measurement
REF Measurement Results of 5 right eye measurements
(recordable up to 10 measurements)
Typical value of right eye
SPHERICAL EQUIVALENT of right eye
When measurement is taken after changing the Hartmann
exposure ti me, I mark will be printed out.
Pupil distance (PD value)
Horizontal cornea shape measurement values
Vertical cornea shape measurement values
Average value
Corneal astigmatic axial angle
Under REF Mode a nd KRT mode, printout example is s ame style as setting of
CLASSIC.
28
COMPONENTS
ALL mode (example)
Page 31

STANDARD ACCESSORIES
The following are standard accessories. Make sure that all these items are included (quantity).
Power cable (1) Chinrest tissue pin (2)
Printer paper (2) Monitor cleaner (1)
Chinrest tissue (1) Dust cover (1)
Fuse (2) User manual, unpacking and assembling
(1 each)
KR-1W
KR-1W
Accessory case (1) Model eye (1)
Measuring window lens cap (1)
29
COMPONENTS
Page 32
PREPARATIONS
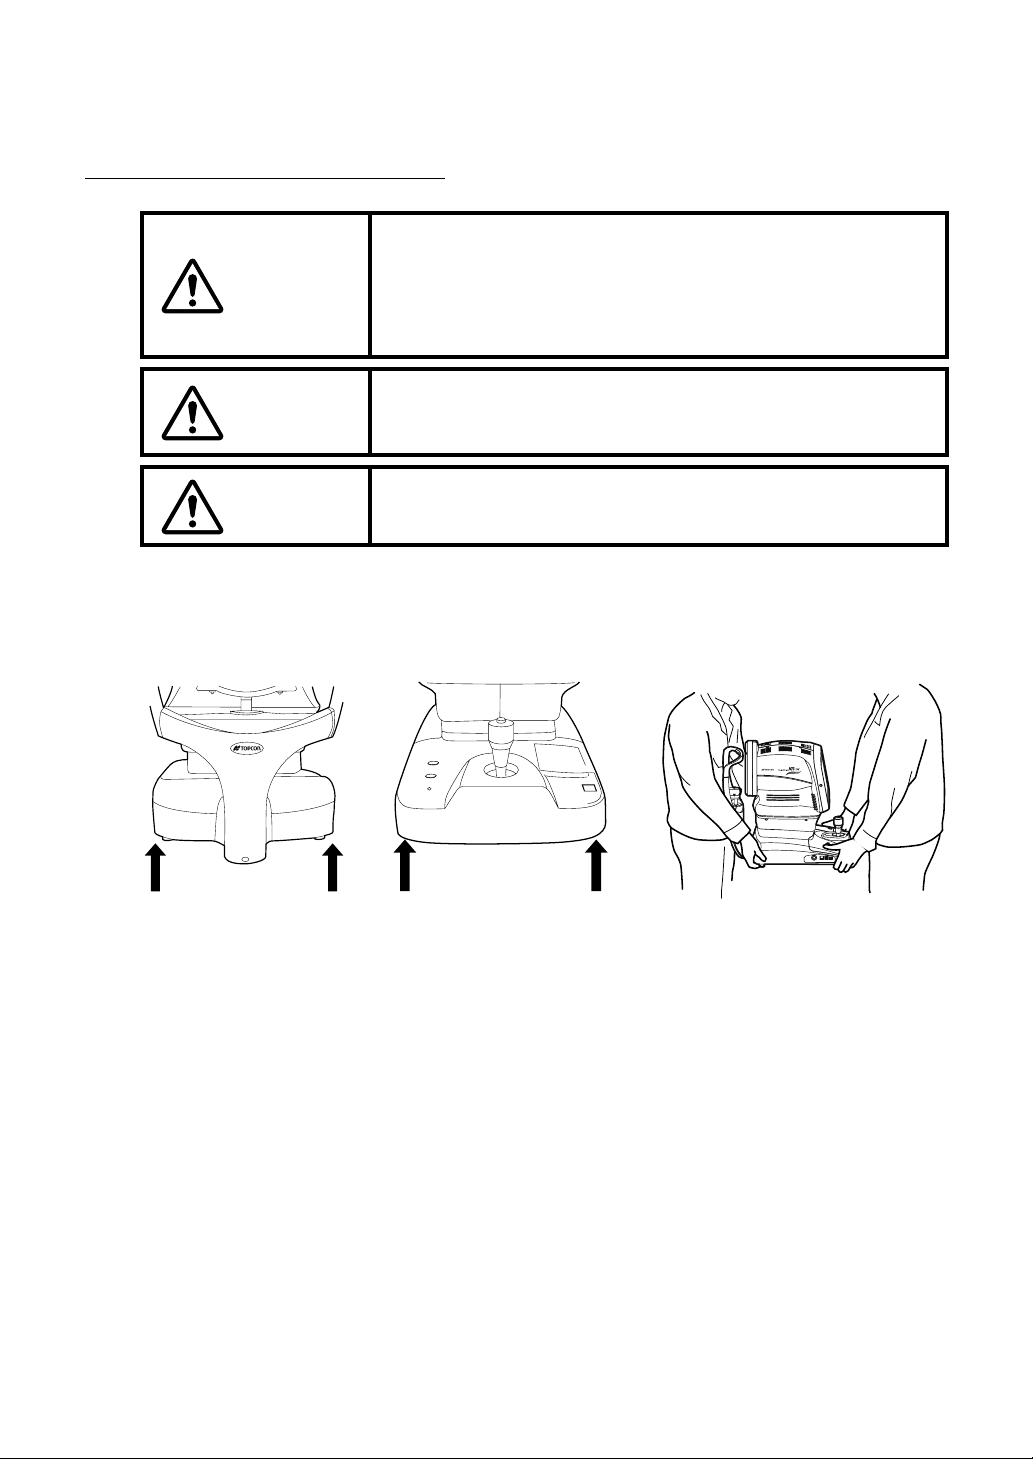
INSTALLING THE INSTRUMENT
When moving the instrument, be sure to hold it at the base with
two persons. Carrying by one person may cause harm to his
CAUTION
CAUTION
back or injury by fal ling parts. Also, holding areas other than
the base may cause inj ury, as well as damage to the instrument.
When setting an instrum ent on an instrumen t table, pay attention not to injure the patient's fingers between the inst rument
and the table.
CAUTION
To prev ent damage and injuries, do not ins tall the instrument
on an uneven, unsteady or sloped surface.
1 Hold the instrument body firmly at the speci fied positions and place it on the automatic
instrument table.
For the automatic instrument table, see "OPTIONAL ACCESSORIES" on page 187.
Holding positions Holding the instrument
2 Place the instrument horizontally, with care not to trample cables.
30
PREPARATIONS
Page 33

CONNECTING THE POWER CABLE
WARNING
CAUTION
To avoid fir e and electric sh ocks by short circ uiting, be sure to
connect the instrument into a grounded outlet.
To avoi d electrical shock, do not handle the po wer plug with
wet fingers.
1 Make sure the power switch of the instrument is OFF.
2 Remove the inlet cover.
Make sure you can see the mark "O"
(it shows power is OFF).
3 Connect the power cable to the instrument body.
4 Replace the inlet cover.
5 Plug the power cable into a 3-pin AC outlet with grounding.
31
PREPARATIONS
Page 34
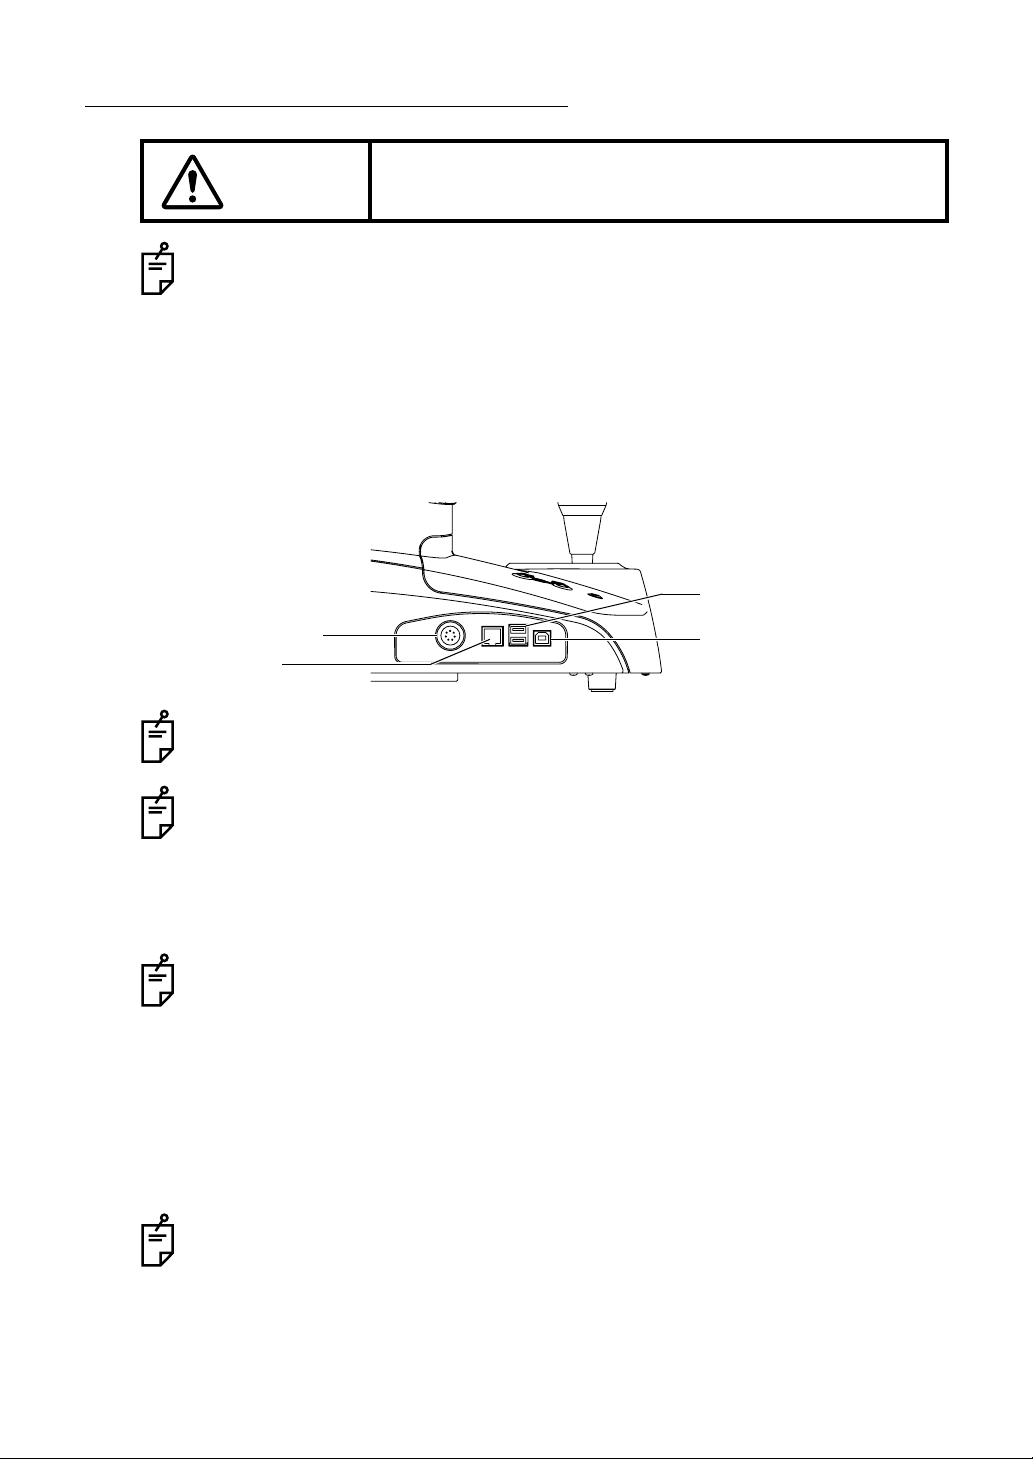
CONNECTING EXTERNAL I/O TERMINALS
CAUTION
Use the external device complying with IEC60950/IEC60950-1, UL60950/
UL60950-1 or UL60601-1.
DATA OUTPUT
This instrument can be connected to a per sonal computer and external printer etc. vi a the
RS232C or USB terminals.
To avoid electric shock, do not touch the external c onnection
terminal and the patient at the same time.
1 Connect one end of the RS232C cable to the RS232C OUT terminal on the instrument.
2 Connect the other end of the RS232C cable to the PC and other external device.
USB I/O terminal (USB A)
RS232C OUT terminal
LAN I/O terminal
The USB I/O terminal (USB A) is us ed to connect a keyboard, mouse and color
printer. The USB OUT terminal (USB B) is used to connect an external PC, etc.
When connecting a USB cable, be sure to use the cable with correct shape of plug.
USB OUT terminal (USB B)
For external pri nter inquiries, call your dealer or TOPCON at th e address printed
on the back cover of this manual.
DATA INPUT
This instrument is provided with a USB IN terminal. In addition, it supports the patient ID input
using a data bar code reader.
As for the data bar code reade r availa ble wit h this ins trument, pl ease contact with
your TOPCON dealer o r yo ur local TOPCON office listed on the back o f th is ma n
ual.
LAN OUTPUT
This instrument can be connected to a PC on local area network (IMAGEnet etc.) via the LAN
OUT terminal.
1 Connect the Ethernet cable to the LAN I/O terminal of this instrument.
2 Connect the other end of the Ethernet cable end to the external device.
For inquiries about the LAN connectivity, call your dealer or TOPCON at the
address printed on the back cover of this manual.
32
PREPARATIONS
-
Page 35

SETTING THE PRINTER PAPER
To avoid potential injury, do not touch the internal p rinter body
CAUTION
while the printer is in oper ation or when replacing the printer
paper.
CAUTION
CAUTION
MEMO
MEMO
• Note, if the printer paper roll is set with the back of the paper facing
up, printing cannot be performed.
• Please insert the paper deep enough into the printer.
• Otherwise the paper may not come out. A "PAPER END" error will be
displayed on the control panel screen.
To avoid failure or potential injury, do not open the printer cover
while the printer is in operation.
To avoid potential injury in case of malfunction, including a
paper jam, be sure to shut off the power be fore attempting to
repair it.
1 Press the printer cover OPEN button to open the printer cover.
To avoi d failure in the printer wh en opening, do not hold a ny part of the co ver. Be
sure to open the printer by pressing the opening button for the cover.
33
PREPARATIONS
Page 36

2 Set the paper into the shaft support; pay attention to the roll direction of paper. Pull the
paper 2 to 3cm forward.
Roll direction
Roll direction
3 Pull the paper along the paper guide and draw it out straightly from the cover.
Paper guide
4 Close the printer cover with the paper drawn out.
Use the recommended 58mm wide printer paper
TF50KS-E2C (Nippon Paper)
Using another paper may cause a printing noise or print errors.
Please close the printer cover until it clicks.
The message "CLO SE PRINTER COVER Push it from the top." is displaye d on
the monitor screen if the printer cover is not properly closed.
34
PREPARATIONS
Page 37
RESETTING FROM POWER SAVE STATUS
MEASUREMENT switch
This instrument us es the power save system for saving e lectric power. When the machi ne is
not in use for ap proximately 10 minutes, t he monitor screen becomes dark and the screen
saver is displayed . Und er the power save c onditi on, only the POW ER lam p is l it and th e con
trol panel screen is off.
1 Press the or tap the control panel screen.
The screen saver is released and measurement is enabled.
The time for shifting to the p ower s av e s tatus can be c ha nged by the ini ti al s et ting
"
SETTING THE POWER SAVE TIME (AUTO SHUTOFF)" (see page 137).
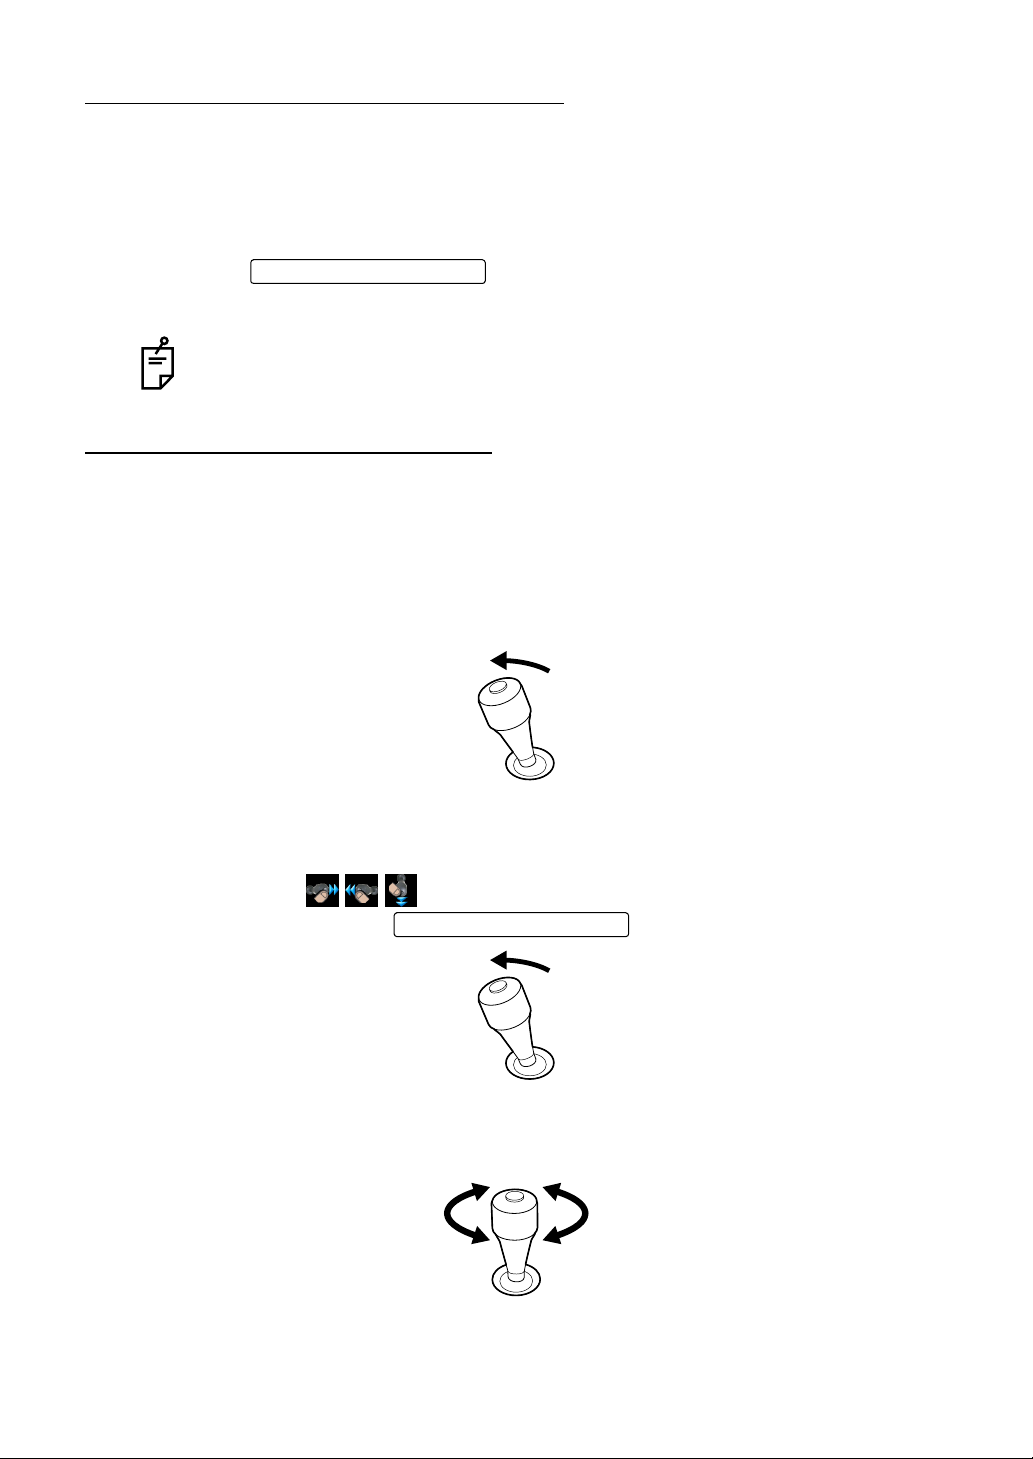
OPERATING THE CONTROL LEVER
The control lever can perform the following operations:
1 Back-forth and right-left movements
When the control lever is inclined in back-forth and right-left directions, the main body
moves toward the tilted directions. For fine adj ustment, the spee d of movement changes
with the angle of inclination: the speed increases as the angle increases.
-
2 Back-forth and right-left movements (high speed)
For right-left movements, and i n the dir ection m ovin g away from the patient , the spe ed of
the main body i ncreases a s the c ontrol lever is inclined . When th e co ntrol lev er is in cline
limit is reached,
increased by pressing the .
is displayed on th e contr ol panel : in thi s ca se, the speed is
MEASUREMENT switch
3 Vertical movement
When the control lever is rotated, the measuring head moves up and down. Turning the
lever clockwise will raise the measuring head and turning counterclockwise lowers it.
PREPARATIONS
35
Page 38

4 Measurement operation
Measurement starts by pressing the at the top of the control
lever.
MEASUREMENT switch
36
PREPARATIONS
Page 39
BASIC OPERATIONS
SELECTION OF EXAMINATION INTERFACE AND ARBITRARY OPERATION INTERFACE
This instrument provides three different user interfaces that support the first-time users as well
as skilled operators.
1 Selection of examination interface
This is the sett ing to se lect the measuremen t course p rovided ac cording t o the e xamination purpose after turning the instrument on.
After selecting the measurement course, the measurement procedure, the number of
measurements, and the repor t ou tput f or mat t hat a re opti ma l for th e ex am ina tio n pur p ose
are automatically selected.
This is good for the first-time users and those who wish to perform examination quickly.
The following measurement courses are available.
• Screening
• Pupillometry
• Serial (dry eyes)
• Cataract
• Over refraction
•Custom
37
BASIC OPERATIONS
Page 40

2 Selection of examination interface
This is the setting to select the measurement course provided according to the report after
turning the instrument on and starting it.
After selecting the measurement course, the measurement procedure, the number of
measurements, and the repor t ou tput f or mat t hat a re opti ma l for th e ex am ina tio n pur p ose
are automatically selected.
This is good for those who wish to perform examination quickly.
The following measurement courses are available.
• Screening
• Pupillometry
• Serial (dry eyes)
• Cataract
• Over refraction
•Custom
3 Arbitrary operation interface
This is the setting to displ ay the measur ement scree n immediately after the instrumen t is
turned on and started up.
After measurement, eac h it em i nc lud in g da ta sele cti on , ana ly s is and re por t o utpu t ca n be
selected arbitrarily.
This is good for those who are skilled in the operation.
• The factory setting is "Selection of examination interface". Refer to Setup, page 140,
"Selection by examination purpose" for how to change the interface.
38
BASIC OPERATIONS
Page 41

OPERATION IN THE SELECTION OF EXAMINATION INTERFACE
POWER-ON AND MEASUREMENT COURSE SELECTION
1 Make sure the power cable is properly connected.
For connection, see "CONNECTING THE POWER CABLE" on page 31.
2 Turn on the .
POWER switch
3 After the title screen is displayed, wait about on e minute. The n, the exami nation purp ose
selection screen is displayed.
The orange-colored progress bar shows the progress of startup operation.
When it reaches the rightmost position, the measurement screen is displayed.
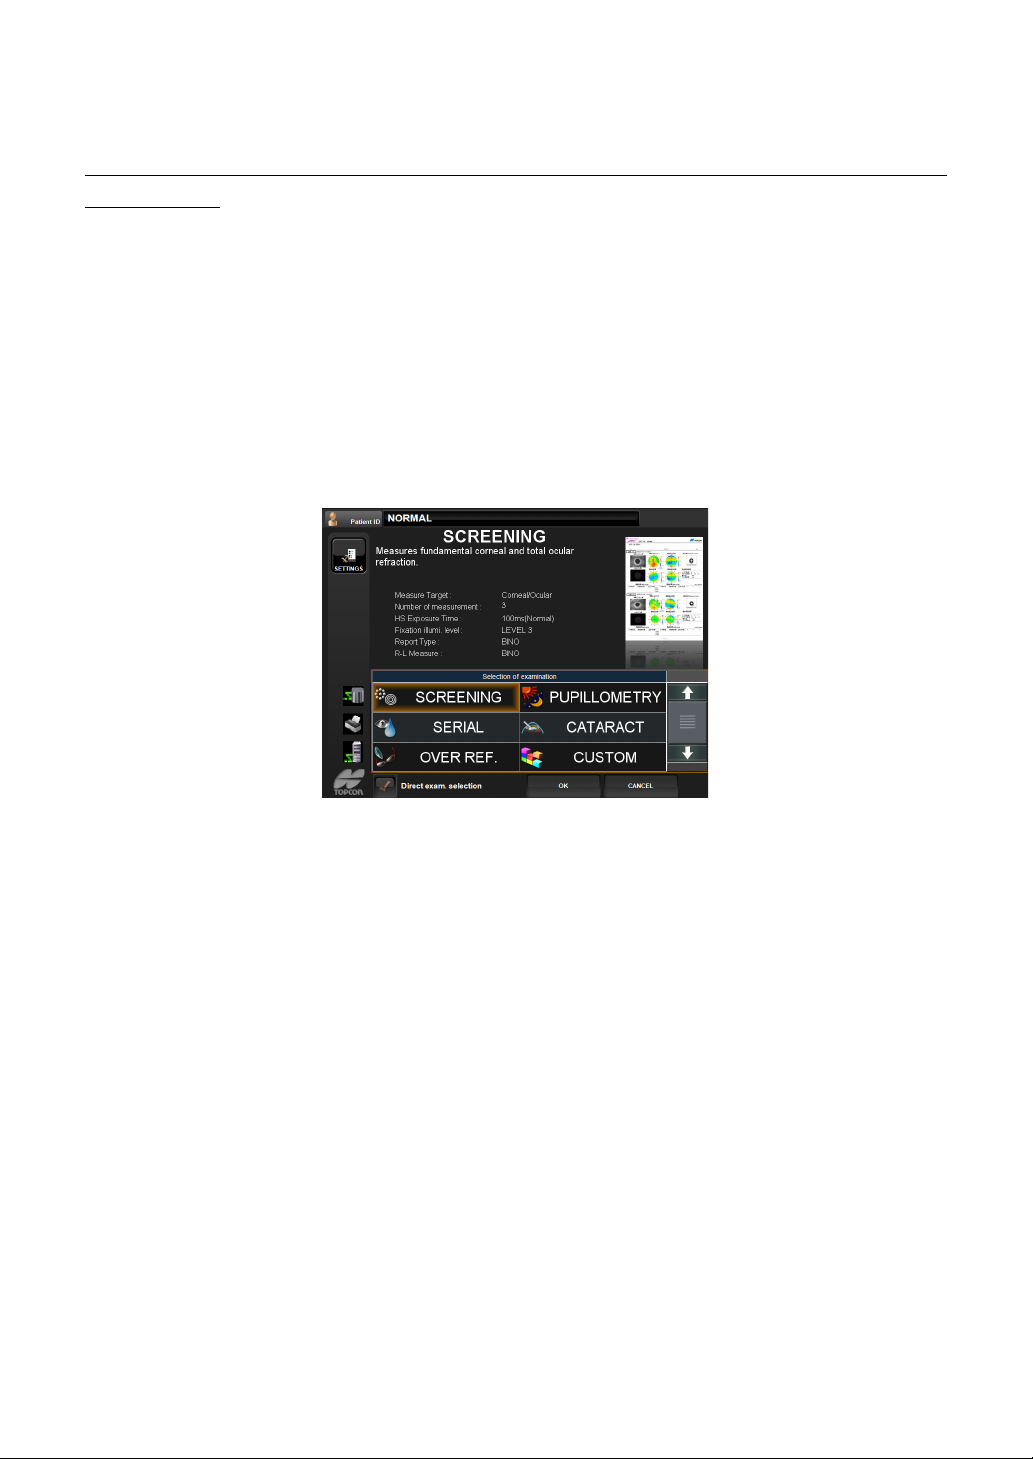
4 Select and tap the desired measurem ent cou rse from the displ ayed ex amina tion pur pose
items.
Selection of examination interface can be displayed depending on the setting.
See page 140 to change the interface.
39
BASIC OPERATIONS
Page 42

Characteristics of each examination course
Selection by examination /
purpose
Screening
Pupillometry
Dry eyes
Cataract
Over refraction Checks the condition when glasses are worn.
Custom
The details automatically set in each examination course is as shown below.
Selection by exa m -
ination/purpose
Screening
Pupillometry
Dry eyes
Cataract
Over refraction Ref only
Measures basic info r mation related to corne as a nd ent ir e oc ula r
refraction.
Measures pupil diamete rs, REF values, and high-order ab errations in dark and bright places.
Measures ten times successively in an interval of one second for
about ten seconds. This indicates progressive change in the
ocular characteristics.
Provides useful information for the best Hartmann selection
before operation as well as u se d to chec k the cond iti on a fter the
operation. It has a longer exposure time to make it easier to
measure the point image with the cataract eye.
Provides measurem ent and report output accordin g to the setting made in the Setup screen.
Measure-
ment target
Cornea/
refraction
Cornea/
refraction
Cornea/
refraction
Cornea/
(refraction)
No. of mea-
surement
3 times for
each eye
3 times for photopic/3 times
for scotopic
10 times for
each eye
3 times for
each eye
3 times for
each eye
Characteristics
Hartmann
exposure time
5: Normal
(256x64)
5: Normal
(256x64)
5: Normal
(256x64)
ON (300ms) Level 2 Both eyes
5: Normal
(256x64)
Fixation
target
Level 3 Both eyes
Automatic Both eyes
Level 3
Level 3 Both eyes
Report
format
One eye at
each time
The setting of each m easurement course can b e changed. Re fer to page 175 for
the detail.
5 Press and display the measurement screen.
OK button
In case of the Selection of exam ination interface, tap the desired measurement
course, and the measurement screen is brought up immediately .
When the check button is c hecked , tap the desi red me asureme nt cours e, and the
measurement screen is brought up immediately .
40
BASIC OPERATIONS
Page 43

6
When the init ial set ti ng is A uto mode , an d when t he MEASU REMENT scr een i s di splay ed, a
message "Get the eye aligned and p ress the MEASUREMENT switch" is displayed on the
screen: the waiting status starts.
In this case, al ignme nt operat ion is no t done even when the s etting of al ignme nt mod e is
"Auto."
The message disappears by pressing the or by touching the screen, following the message.
When the initial setting of alignment mode is "Auto," alignment operation starts.
7 Input th e patient ID as need ed. Tap th e to display the patient data
input screen. For how to op erate the patient data inpu t screen, see st ep 2 and 3 in page
135, "SETTING THE PATIENT ID".
Patient ID can be input at any time until the measurement data output.
MEASUREMENT switch
Patient ID button
PREPARATION BEFORE MEASUREMENT
Never insert your fingers under the chinrest.
CAUTION
CAUTION
MEMO
The measurement i n auto mode may not be possible due to the eyel id
and the eyelashes over to the pupil.
If this occurs, the oper at or should tell the patient to op en t hei r eye s wide
enough, or lift the eyelid to allow for measurement.
* Inform the patient of this, too.
Careless insertion of fingers may cause injury by pinching.
To avoid electric shock, do not touch the external c onnection
terminal and the patient at the same time.
Measurement in auto mode may not be pos sible due to frequen t blinks
MEMO
MEMO
MEMO
or existing abno rmalities in t he corneal s urface caused corneal dise ase
etc.
In this case, use manual mode.
When operating the instrument, be careful not to touch the patient's face
or nose. If touched, clean the instrument following "
INSTRUMENT" on page 180.
The automated alignment function might not work appropriately when
the patient is doing the shining make-up around her eyelid.
In this case, please change into the manual mode of operation.
1 Make sure the MEASUREMENT screen is on.
CLEANING THE
41
BASIC OPERATIONS
Page 44
2 Let the patient sit in front of the instrument.
3 Adju st the height of the automatic instrument table or the chair so tha t the patient can
place their chin on the chinrest comfortably.
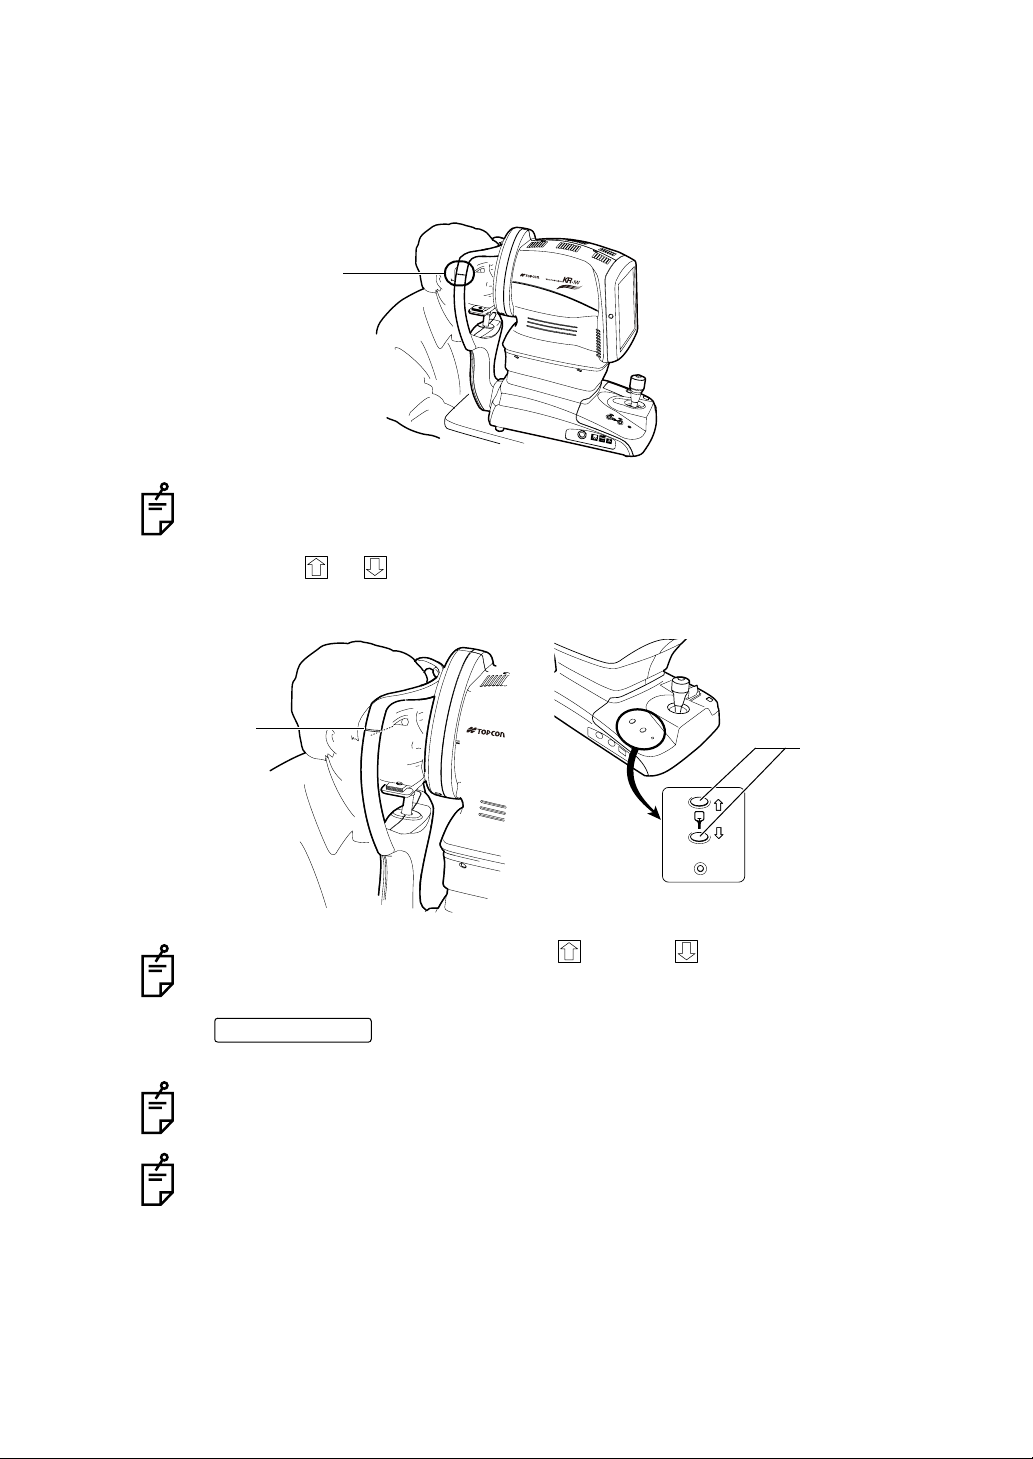
4 Let the patient place their chin on the chinrest and forehead against the forehead rest.
Height mark
Make sure the patient's face is plac ed correct ly on the chinrest, with the forehead
correctly against the forehe ad re st.
5 By pressing the or buttons of the main body section of the instrument, adjust the
height of the chinrest so that the patient's eye beco mes level with th e height mark on the
chinrest support.
Height mark
Chinrest up/down
button
The chinrest moves up/down while the button or button is pressed.
The chinrest sto ps if t he appl ied l oad exce eds the spec ified weight. If the c hinres t
does not work even after removing the chin from it, it may be at fault. Turn OFF the
POWER switch
at the address printed on the back cover of this manual.
If the applied load exceeds the specified weight, the chinrest may not work. Advise
the patient not to push down on the chinrest more than necessary.
If the patient's head is placed i n the center of the chinr est, measure ment may be
disabled with a limit message. Make sure the patient's head is placed correctly.
For details about the limit message, see "Limit message" on page 44.
and disconnect the po wer cable : Call your de aler o r TOPCON
42
BASIC OPERATIONS
Page 45
MEASUREMENT
AUTO
MEASUREMENT switch
In the Selection of examination interface, measurement is taken automatically in "Auto Mode".
When the screen is switched to the measurement screen, the measurement course in
progress (such as screen) is displayed for a few seconds at the top of the screen.
• See page 68 for the measurement operation when Pupillometry course is selected.
• See page 66 for the measurement operation when serial measurement courseis selected.
Adjust the height of the automatic instrument table so that the patient
MEMO
MEMO
MEMO
can sit on the chair comfortably and correct measurement values can be
obtained.
If measurement is n ot availabl e with aut o mode, set th e arbitrar y opera tion interface and measure the eye in manual mode.
Measurement in auto mode may not be possible due to exis ting abnormalities in the corneal surface caused corneal disease.
When operating the instrument, be careful not to touch the patient's face
or nose. If touched, clean the instrument following "
INSTRUMENT" on page 180.
CLEANING THE
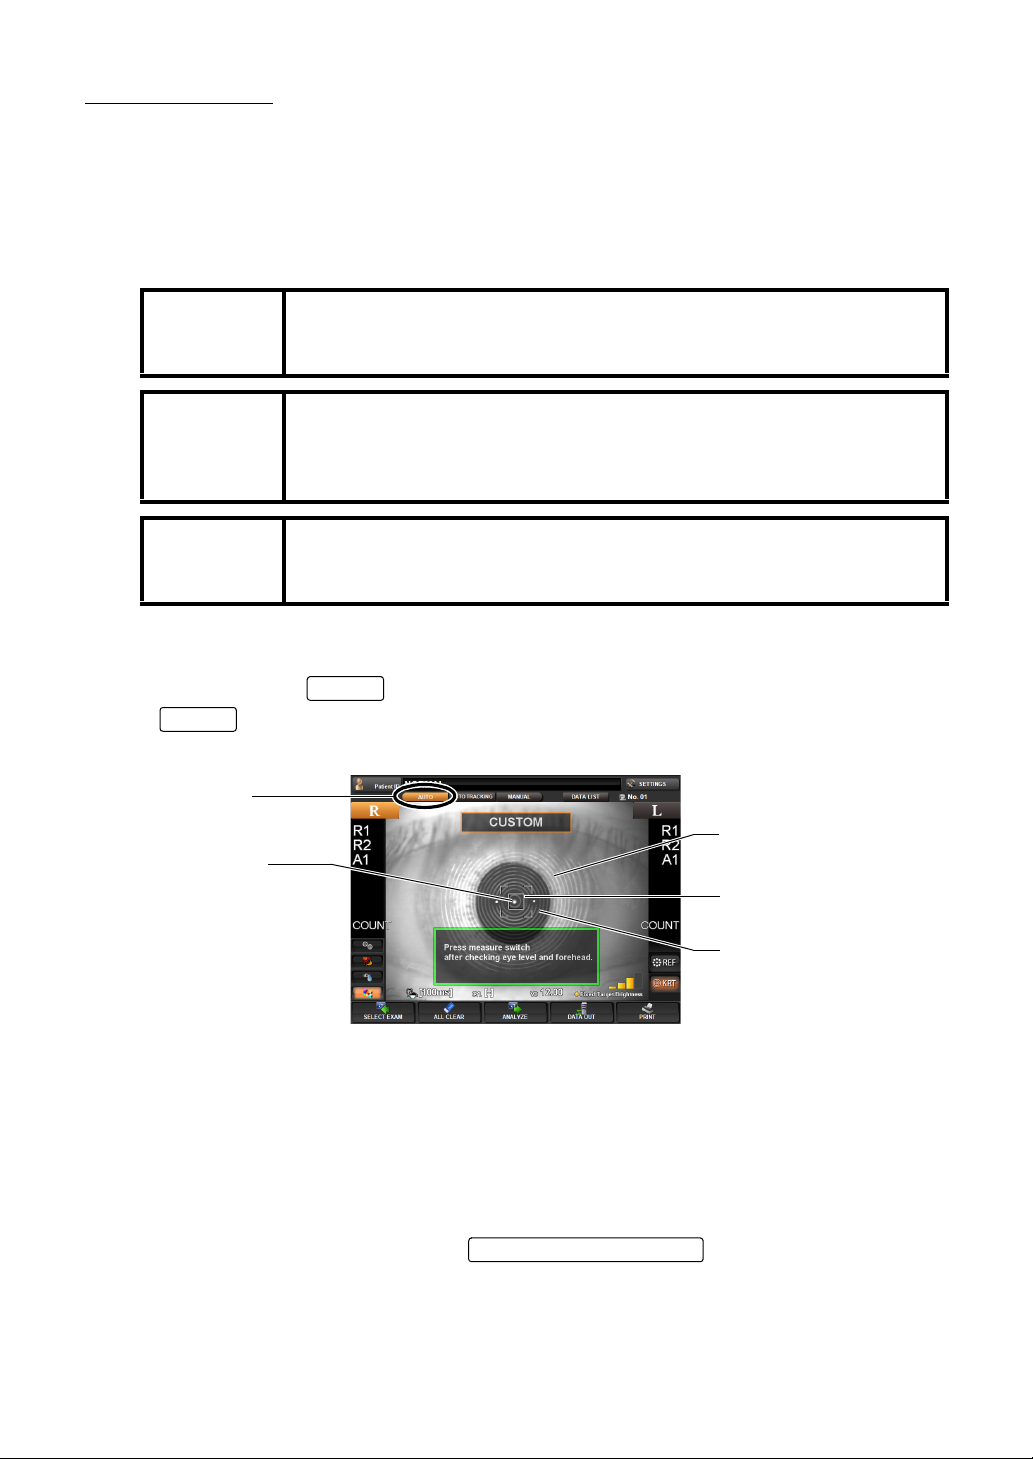
1 Confirm the waiting status for measurement.
Confirm that the button of the control panel is displayed in orange. If not, tap the
AUTO
ment.
AUTO button
Luminous point
button, select Aut o mode (Full Auto), and set th e waiting status for measure-
Pupil image
Alignment mark
Ring image
2 A message "Press measure switch after checking eye level and forehead." is displayed.
Confirm that the pupil image and luminous point are displayed on the screen.
• If the image of t he pupil i s not shown on the sc reen, use th e control lever to move the
measuring head into the proper position, locating the patient's pupil.
For the operation of the control lever, see "OPERATING THE CONTROL LEVER" on
page 35.
3 When the pupil ima ge is seen on the screen, tap the lumi nous point of the center part to
start measurement, or press the
main body will move into the po sitio n wh ere the p upil image and luminous poi nt com e on
the screen center.
on the control lever. The
43
BASIC OPERATIONS
Page 46

4 Confirm that a coaxial ring image is seen at the center of the pupil image.
• If the coaxial ring image cannot be recogn ized, it may be outside the au to alignment
range. Using the control lever, move the main body forward and into to a position where
the ring image can be seen.
If the coaxial ring image is not visi ble, measurem ent will not start automatical ly, even if
AUTO mode is set.
5 When the auto alignment range is reached, the main body performs an auto focusing
function to finalize alignment, and will start the measurement process automatically.
Even in steps 2 to 4, the main body starts measurement automatic ally when the auto
alignment range is reached.
If a limit message " " appears during aut o al ig nment, indicati ng th at th e ma in bod y h as
reached the max imum limit of moveme nt, manually operat e the unit, using th e control
lever, toward the direction of proper alignment.
Limit messa ge:
: W hen the main body exceeds the limit to the left (to t he patient's righ t eye), a
message "Move to the right" is displayed.
: W hen the main body exceeds the limit to the right (to the patient's left eye), a
message "Move to the left" is displayed.
: When the main body exceeds the limit to the front (to the operator), a message
"Push backward " is di splayed.
: W hen the main body exceeds the limit to the rear (to the patient), a message
"Pull forward" is displayed.
Auto alignment is not done while the control lever is in use.
To enable a smooth auto al ignment operat ion, do n ot utiliz e the co ntrol le ver.
When the measurement of the first eye is complete and the measuring head moves to
the other eye, a limit message may be displayed if the measuring head cannot locate the
patient's pupil on the seco nd ey e, and me asurem ent on the sec ond eye wi ll no t be per
formed. If this occurs, check to confirm the patient's head position is centered in the headrest, and the chinrest is at the proper height.
-
6 When the measurem ent of one eye is finishe d and when R/L co ntinuo us meas ureme nt is
selected, the measuring hea d moves automatically to the measurement position of the
other eye.
7 If the alig nme nt pos ition with the patient's pupil is not correct, adjus t the ali gnm ent by tap-
ping on the control screen or by operating the control lever. When realignment is complete, the final alignment and focusing operations will start automatically and
measurement is done.
8 After finishing the measurement, the results are displayed on the Control Panel screen.
• It will take a few seconds for measurement to be fully com plete, and display the final
results.
44
BASIC OPERATIONS
Page 47

9 When all the set measurements are done, the screen is changed to the Measuremen t
h
Result List screen.
Auto print (available only under Auto mode)
When the auto print function is set to "ON" in the initial settings menu, measurements will
automatically print out when the exam is completed.
Note, if the measurement to be performed is set for only the right or left eye (MONO), the
auto print function will not work. For the setting of eyes to be measured, see "
ING ONE EYE ONLY" on page 52.
It is possible to not autom atically move to the po sition for measuring the other eye after
measuring one eye. For details, see "
If MONO mode is selected, total me asurement is completed after measurement of the
selected eye is performe d.
After "FINISH" is displayed, it is possible to continue measurement by pressing the
MEASUREMENT switc
.
MEASURING ONE EYE ONLY" on page 52.
MEASUR-
To stop the auto alignment, tap and stop the auto measurement. To
resume the auto measurement, tap .
MANUAL
AUTO
DISPLAYING MEASUREMENT VALUES
Data of the latest measurements are displayed on the control panel screen.
Display of measurement values only: Measurement was done correctly.
ERROR: Measurement was not done correctly.
For messages on the control panel screen, see "MESSAGE LIST" on page 184.
It is possible to display all measurement data on the screen. For details, see "DISPLAYING ALL MEASUREMENT DATA" on p age 70.
CLEARING ALL MEASUREMENT VALUES
When multiple patien ts are measured con tinuously w ithout printi ng/transferrin g the measurement data of the previous patient, measurement values of the new patient are saved following
the measurement data of the previous patient.
It is possible to clear any unnecessary data.
45
BASIC OPERATIONS
Page 48
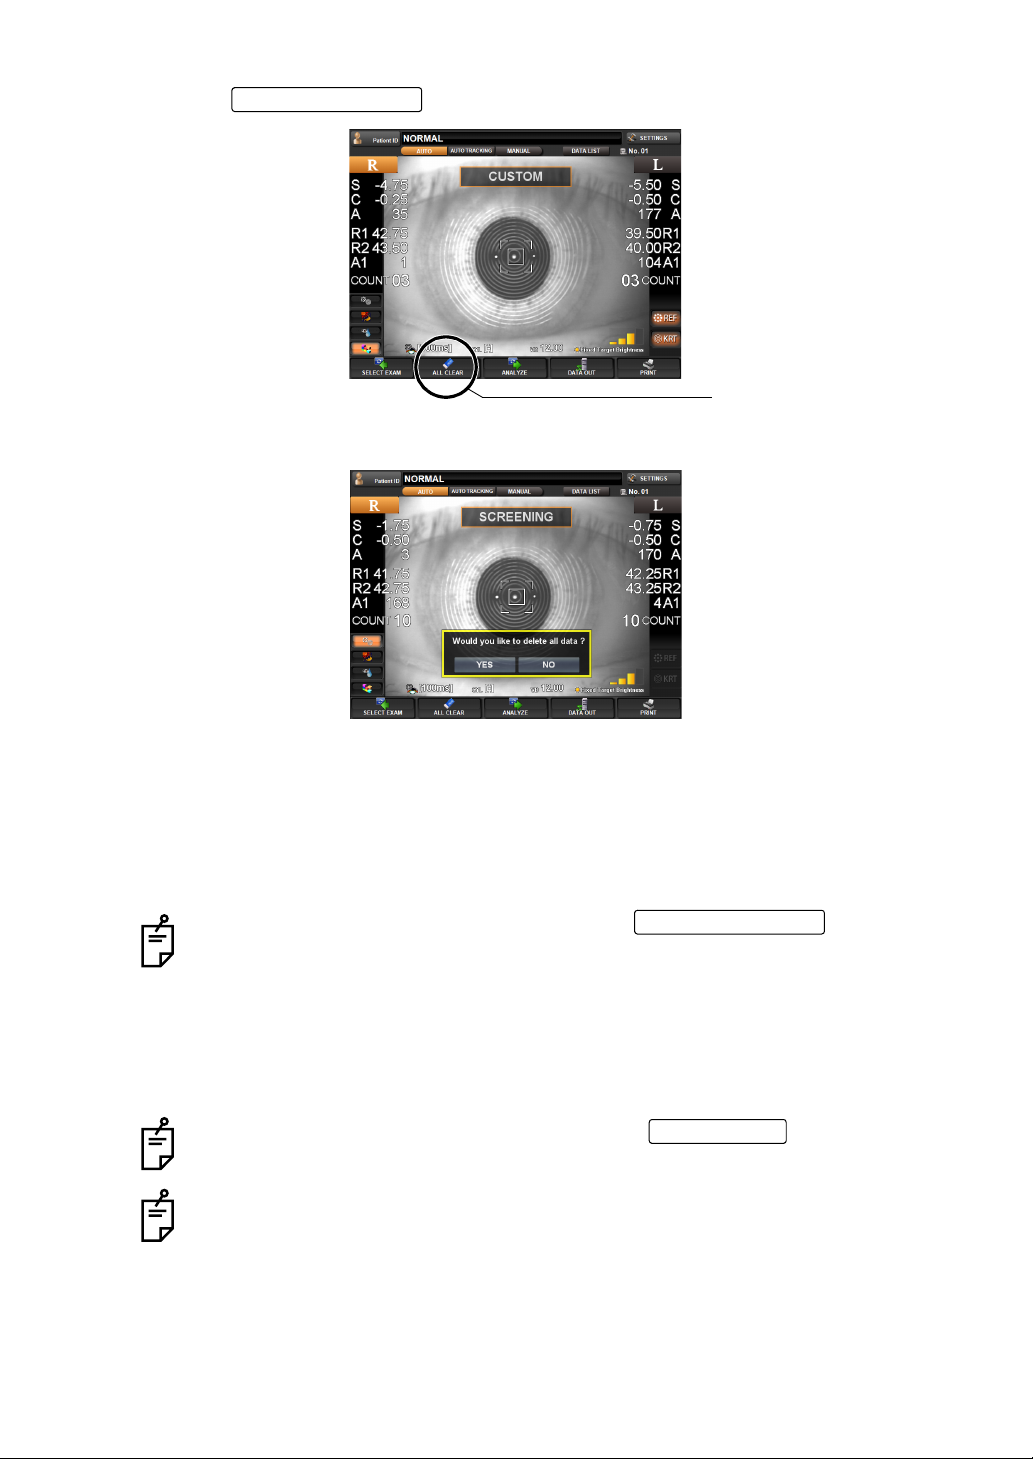
1 Tap the of the control panel.
ALL CLEAR button
2 A message "Would you like to delete all data ?" is displayed.
ALL CLEAR button
If "Yes" is selected: All measurement values are cleared.
If "No" is selected: Measurement can be continued.
3 When "Yes" is selected, a message "Clearing data..." is displayed.
4 All the measurement values for right and left eyes are cleared, and th e main body will
return to the initial power on position.
When measurement value s are cleared by the , the patient
ID may reset, depending on the setting of "RESETTING THE PATIENT ID
(PATIENT ID RESET)" (page 134).
When "Resetting the Patient ID" is "ON":
• The patient ID is reset to the initial patient ID set by "S etting the Pat ient ID"
of "Initial Setting."
When "Resetting the Patient ID" is "OFF":
• The patient ID is not reset, and the same patient ID is used.
When measurement va lue s ar e o utp utted by the , the data will be
cleared when starting the measurement of the next patient.
The screen returns to "Selection of examination screen" or "Measurement screen"
depending on the setting.
ALL CLEAR button
PRINT button
46
BASIC OPERATIONS
Page 49

MEASUREMENT RESULT LIST SCREEN
When measurement i s completed, the Table of measurement result scr een is displayed. For
the details of the screen, refer to page
74.
Right eye
Typical REF value
Typical KRT value
(2) DELETE button
Selected data
(4) Printed icon/
output icon
Hartmann Image
Mire Image
Left eye
(5) Recommended data
selection button
(1) Scroll bar
(3) Function button
• Of the data measured for several times, the most reliable data is automatica lly determined and enclosed with a brown line.
• You can tap any data to select.
• If you are not satisfied with the data, you can delete unnecessary data and tap "To measurement screen" button to take additional measurement.
• This data also allows data output and printout. The data printed or output have the
printed icon and output icon respectively.
• You can select to display or not display the result list screen when switching to the analysis screen from the m easurement screen. Refer to "DISPLAY OF TABLE OF MEASUREMENT RESULT SCREEN" in page 140.
DISPLAYING THE ANALYSIS RESULT
After selecting the data in the Table of measurement result screen, tap the "ANALYZE" button
to display the analys is result screen. In the Selection of exam ination interface, the analysis
result screen is automatically selected and displ ayed on a preferential basis from the map
best for the selected measurement course. Refer to page
for the detail of the analysis screen.
77, "ANALYSIS RESULT SCREEN"
BASIC OPERATIONS
47
Page 50

COMPLETION
1 Turn the power switch of the main unit OFF.
If the external connection device is connected to the external I/O terminal, turn the
power of the external connection device off.
If the instrument is not used for a long time, unplug the power cord and remove the
cord connected to the external I/O terminal.
2 Clean the forehead rest and the chin rest and put the dust cover on it.
If chinrest sheets are used, remove one sheet.
48
BASIC OPERATIONS
Page 51

INDIVIDUAL OPERATIONS
OPERATION IN THE ARBITRARY OPERATION INTERFACE
In the arbitrary operation interface, the measurement screen is displayed after startup.
In this interface, you can display the examination purpose selection screen to
select the course by examination purpose by tapping
MEASUREMENT MODE SELECTION
MEASURE button
.
To select measurement mode, tap or on the control panel.
There are three me asurement modes, which REF/KERATO continuous measurement , REF
measurement, or KERATO measurement can be selected.
REF/KERATO measurement mode (REF button and KRT button are lit) :
REF measurement and KERATO measurement are made continuously.
REF measurement mode (REF button only is lit) : REF measurement only.
KERATO measurement mode (KRT button only is lit) : KERATO measurement only.
1 Tap or to turn the button of the item to be measured on
REF button KRT button
(orange).
REF button KRT button
In the default setting, REF/KERATO measurement mode is set but you can
change it.
Refer to page 128 for the detail.
49
INDIVIDUAL OPERATIONS
Page 52

SELECTION OF AUTO MEASUREMENT/AUTO TRACKING MEASUREMENT/
AUTO button
AUTO T
MANUAL MEASUREMENT
Select either auto or manual measurement. To select, tap ,
RACKING button MANUAL button
"AUTO" : Alignment and measurement are automatically done.
"AUTO TRACKING" : Alignment is automatic but not measurement.
"MANUAL" : Alignment and measurement are manually done.
Auto mode setting can be mad e in the Setup Screen. Refer to page 129 for the
detail.
, or on the control panel.
SETTING FIXATION TARGET ILLUMINATION LEVEL
Brightness of a fixation target is selected. Tap on the control panel,
and the pop-up indication is displayed for about 3 seconds. Tap the indication to select.
• The lower is the brightest (all orange ) and the upper is the dar kest (the left gage only is
orange).
The fixation target brigh tness can be set in the Setup screen. R efer to page 126
for the detail.
The fixation target brightness automatically changes in the Pupillometry mode.
Fixed Target Brightness
50
INDIVIDUAL OPERATIONS
Page 53

SETTING HARTMANN EXPOSURE TIME
Hartmann exposure tim e can be sel ec ted . Prol ongi ng the exp os ur e tim e ca n reduc e the me asurement error that occurs in the hard-to-measure eye. The default setting is 100ms(Normal).
1 Tap the right side of the Hartmann icon on the control panel, and the pop-up menu is dis -
played for about 3 seconds.
2 Tap the pop-up menu and tap "100ms(Normal)", "300ms", "400ms", or "500ms" to select.
3 Setti ng is compl ete .
"100ms(Normal)": The Hartmann exposure time is set to 100ms.(Standard setting)
"300ms" : The Hartmann exposure time is set to 300ms.
"400ms" : The Hartmann exposure time is set to 400ms.
"500ms" : The Hartmann exposure time is set to 500ms.
51
INDIVIDUAL OPERATIONS
Page 54

MEASURING ONE EYE ONLY
You can measure one eye only when the measurement mode is set to auto measurement.
button and button on the orange colo r side indic ate the cur rent measure ment
position.
1 Sele ct the eye to be measured . Tap the button or button on the control
panel.
TO MEASURE THE RIGHT EYE ONLY
1 Tap the button to move the measurement head to the right.
2 When the head is moved, tap the button again. Then, the lock icon button
is displayed on the screen.
• While the lock icon is displayed, the head does not move to the other side to attempt to
measure after one eye is measured.
3 To unlock, tap button again. Then, the lock icon disappears.
TO MEASURE THE LEFT EYE ONLY
The procedure is the same as when the right eye is measured.
When the lock icon is displayed (one eye measurement mode), tap button
or button so that you can switch the eye while the head is locked.
52
INDIVIDUAL OPERATIONS
Page 55

MEASUREMENT
POWER switch
The measurement i n auto mode may not be possible due to the eyel id
MEMO
MEMO
MEMO
and the eyelashes over to the pupil.
If this occurs, the oper at or should tell the patient to op en t hei r eye s wide
enough, or lift the eyelid to allow for measurement.
The measurement in auto mode may not be possible due to the frequent
blinks or exis ting ab nor ma li tie s in the co rn eal sur fac e ca us ed b y co rn eal
disease etc.
In this case, use manual mode.
The automated alignment function might not work appropriately when
the patient is doing the shining make-up around her eyelid.
In this case, please change into the manual mode of operation.
PREPARATION BEFORE MEASUREMENT
TURN ON THE POWER
1 Make sure the power cable is properly connected.
For connection, see "CONNECTING THE POWER CABLE" on page 31.
2 Turn on the .
3 Confi rm that the t itle screen is displaye d. The MEAS UREMENT scr een will be displayed
shortly after.
The orange-colored progress bar shows the progress of startup operation.
When it reaches the rightmost position, the measurement screen is displayed.
4
When the init ial set ti ng is A uto mode , an d when t he MEASU REMENT scr een i s di splay ed, a
message "Get the eye aligned and p ress the MEASUREMENT switch" is displayed on the
screen: the waiting status starts.
In this case, al ignme nt operat ion is no t done even when the s etting of al ignme nt mod e is
"Auto."
The message disappears by pressing the or by touching the screen, following the message.
When the initial setting of alignment mode is "Auto," alignment operation starts.
MEASUREMENT switch
53
INDIVIDUAL OPERATIONS
Page 56

PREPARATION BEFORE MEASUREMENT
AUTO button
Prepares to measure the patient.
See page 41 "PREPARATION BEFORE MEASUREMENT".
MEASUREMENT UNDER AUTO MODE
Adjust the height of the automatic instrument table so that the patient
MEMO
MEMO
MEMO
SETTING THE AUTO MODE
can sit on the chair comfortably and correct measurement values can be
obtained.
Measurement in auto mode may not be pos sible due to frequen t blinks
or existing abno rmalities in t he corneal s urface caused corneal dise ase
etc.
In this case, use manual mode.
When operating the instrument, be careful not to touch the patient's face
or nose. If touched, clean the instrument following "
INSTRUMENT" on page 180.
1 Confirm the waiting status for measurement.
Confirm that the of the control panel is displayed in orange . If not, tap
the , s elect Auto mode (Full Auto), and set the wai ting status for mea-
surement.
AUTO button
CLEANING THE
AUTO button
Pupil image
Luminous point
Alignment mark
Ring image
2 A message "Press measure switch after checking eye level and forehead." is displayed.
Confirm that the pupil image and luminous point are displayed on the screen.
• If the image of t he pupil i s not shown on the sc reen, use th e control lever to move the
measuring head into the proper position, locating the patient's pupil.
For the operation of the control lever, see "OPERATING THE CONTROL LEVER" on
page 35.
3 When the pupil ima ge is seen on the screen, tap the lumi nous point of the center part to
start measurement, or press the
main body will move into the po sitio n wh ere the p upil image and luminous poi nt com e on
the screen center.
MEASUREMENT switch
on the control lever. The
4 Confirm that a coaxial ring image is seen at the center of the pupil image.
54
INDIVIDUAL OPERATIONS
Page 57

• If the coaxial ring image cannot be recogn ized, it may be outside the au to alignment
range. Using the control lever, move the main body forward and into to a position where
the ring image can be seen.
If the coaxial ring image is not visi ble, measurem ent will not start automatical ly, even if
AUTO mode is set.
5 When the auto alignment range is reached, the main body performs an auto focusing
function to finalize alignment, and will start the measurement process automatically.
Even in steps 2 to 4, the main body starts measurement automatic ally when the auto
alignment range is reached.
If a limit message " " appears during aut o al ig nment, indicati ng th at th e ma in bod y h as
reached the max imum limit of moveme nt, manually operat e the unit, using th e control
lever, toward the direction of proper alignment.
Limit messa ge:
: W hen the main body exceeds the limit to the left (to t he patient's righ t eye), a
message "Move to the right" is displayed.
: W hen the main body exceeds the limit to the right (to the patient's left eye), a
message "Move to the left" is displayed.
: When the main body exceeds the limit to the front (to the operator), a message
"Push backward " is di splayed.
: W hen the main body exceeds the limit to the rear (to the patient), a message
"Pull forward" is displayed.
Auto alignment is not done while the control lever is in use.
To enable a smooth auto al ignment operat ion, do n ot utiliz e the co ntrol le ver.
When the measurement of the first eye is complete and the measuring head moves to
the other eye, a limit message may be displayed if the measuring head cannot locate the
patient's pupil on the seco nd ey e, and me asurem ent on the sec ond eye wi ll no t be per
formed. If this occurs, check to confirm the patient's head position is centered in the headrest, and the chinrest is at the proper height.
-
6 When the measurem ent of one eye is finishe d and when R/L co ntinuo us meas ureme nt is
selected, the measuring hea d moves automatically to the measurement position of the
other eye.
7 If the alig nme nt pos ition with the patient's pupil is not correct, adjus t the ali gnm ent by tap-
ping on the control screen or by operating the control lever. When realignment is complete, the final alignment and focusing operations will start automatically and
measurement is done.
8 After finishing the measurement, the results are displayed on the Control Panel screen.
• It will take a few seconds for measurement to be fully com plete, and display the final
results.
9 When all the set measurements are done, the screen is changed to the Measuremen t
Result List screen.
55
INDIVIDUAL OPERATIONS
Page 58

Auto print (available only under Auto mode)
h
When the auto print function is set to "ON" in the initial settings menu, measurements will
automatically print out when the exam is completed.
Note, if the measurement to be performed is set for only the right or left eye (MONO), the
auto print function will not work. For the setting of eyes to be measured, see "
ING ONE EYE ONLY" on page 52.
It is possible to not autom atically move to the po sition for measuring the other eye after
measuring one eye. For details, see "
If MONO mode is selected, total me asurement is completed after measurement of the
selected eye is performe d.
After "FINISH" is displayed, it is possible to continue measurement by pressing the
MEASUREMENT switc
.
MEASURING ONE EYE ONLY" on page 52.
MEASUR-
To stop the auto alignment, tap and stop the auto measurement. To
resume the auto measurement, tap .
MANUAL
AUTO
56
INDIVIDUAL OPERATIONS
Page 59

MEASUREMENT UNDER AUTO TRACKING MODE
AUTO TRACKING
MEASUREMENT switch
Adjust the height of the automatic instrument table so that the patient
MEMO
MEMO
SETTING THE AUTO TRACKING MODE
can sit on the chair comfortably and correct measurement values can be
obtained.
When operating the instrument, be careful not to touch the patient's face
or nose. If touched, clean the instrument following "
INSTRUMENT" on page 180.
1 Confirm the waiting status for measurement.
Confirm that the button of the control panel is displayed i n orange .
If not, tap the button, select Auto tracking, and set the waiting sta-
tus for measurement.
AUTO TRACKING button
Luminous point
AUTO TRACKING
CLEANING THE
Pupil image
Alignment mark
Ring image
2 A message "Press measure switch after checking eye level and forehead." is displayed.
Confirm that the pupil image and luminous point are displayed on the screen.
• If the image of t he pupil i s not shown on the sc reen, use th e control lever to move the
measuring head into the proper position, locating the patient's pupil.
For the operation of the control lever, see "OPERATING THE CONTROL LEVER" on
page 35.
3 When the pupil ima ge is seen on the screen, tap the lumi nous point of the center part to
start measurement, or press the
main body will move into the po sitio n wh ere the p upil image and luminous poi nt com e on
the screen center.
on the control lever. The
4 Confirm that a coaxial ring image is seen at the center of the pupil image.
• If the coaxial ring image cannot be recogn ized, it may be outside the au to alignment
range. Using the control lever, move the main body forward and into to a position where
the coaxial ring image can be seen.
5 When the auto alignment range is reached, the main body performs an auto focusing
function to finalize alignment, and will start the measurement process automatically.
Even in steps 2 to 4, the main body starts measurement automatic ally when the auto
alignment range is reached.
57
INDIVIDUAL OPERATIONS
Page 60
6 When the me as uring head comes to the measu ri ng p ositi on an d al ign men t is co mpl ete , a
h
h
message "Press MEASUREMENT switch to start measurement." is displayed.
7 By pressing the , measurement is performed and measure-
ment values are displayed.
• It will take a few seconds for measurement to be fully com plete, and display the final
results.
MEASUREMENT switc
8 After finishing measurements, auto alignme nt is continued.
If a limit message " " is displayed during aut o align men t, indica ting that the me asuring head has reac hed the maximum limit of m ovement, manually oper ate the
unit, using the contr ol lev er, toward the proper d irecti on of alignm ent. F or the limi t
message, see page
Auto alignment is not complete while the control lever is in use.
To enable a smooth auto al ignment operat ion, do n ot utiliz e the co ntrol le ver.
After "FINISH" is displayed, it is possible to continue measurement by pressing the
MEASUREMENT switc
55.
.
To stop the auto alignment, tap and stop the auto alignment. To
resume the auto alignment, tap .
MANUAL
AUTO
58
INDIVIDUAL OPERATIONS
Page 61
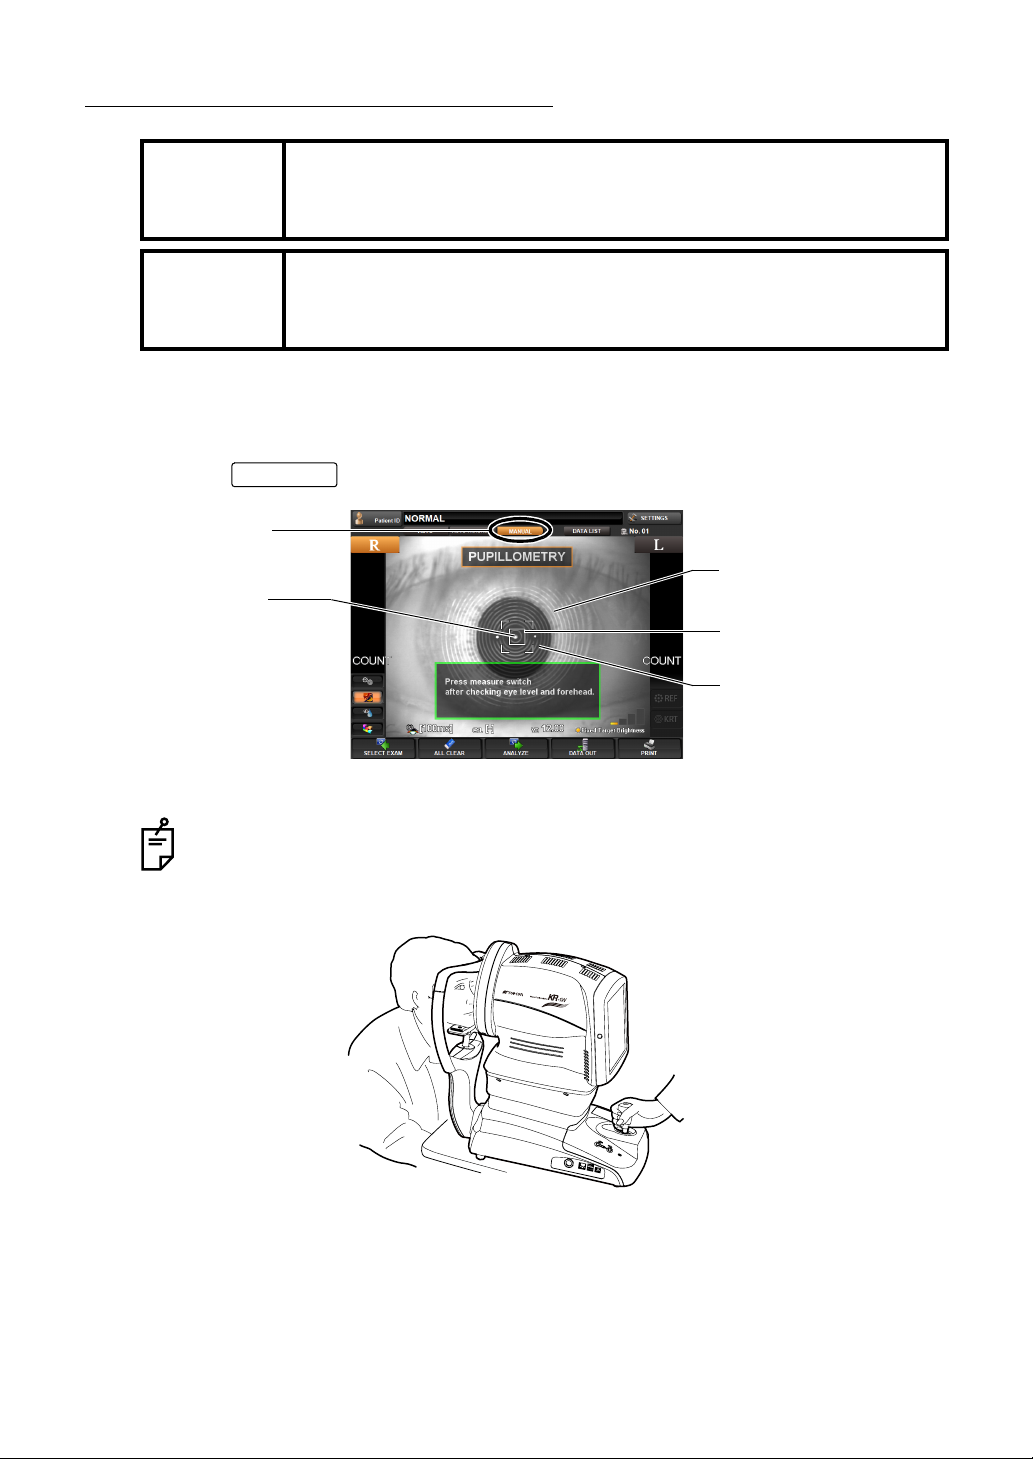
MEASUREMENT UNDER MANUAL MODE
Adjust the height of the automatic instrument table so that the patient
MEMO
MEMO
SETTING THE MANUAL MODE
can sit on the chair comfortably and correct measurement values can be
obtained.
When operating the instrument, be careful not to touch the patient's face
or nose. If touched, clean the instrument following "
INSTRUMENT" on page 180.
1 Make sure the MEASUREMENT screen is on.
CLEANING THE
2 Tap the button of the control panel, and select "Manual mode" (MANUAL).
MANUAL button
Luminous point
Under Manual mode, alignment operation is done by utilizing the control lever.
MANUAL
Pupil image
Alignment mark
Ring image
About the operation of the mai n body by the cont rol le ver, see "OPERATING THE
CONTROL LEVER" on page 35.
3 Hold the control lever and move the main body to the operator side; away from the patient.
4 Move the ma in body r ight-le ft and up-do wn by usin g the control le ver. Place the patient's
eye at the center of the Control Panel screen.
59
INDIVIDUAL OPERATIONS
Page 62

5 Tilt the control lev er toward th e patient and slowly brin g the main body i nto focus wi th the
MEASUREMENT switch
patient eye.
A luminous point and a KRT ring image are reflected off the patient's cornea. Br ing the
luminous point and KRT ring image into focus by slowly moving the main body toward the
patient.
Luminous point
Alignment mark
Ring image
6 Move the main body right-left and u p-down so that the luminous poi nt is in the cen ter of
the Control Panel screen.
Even if alignmen t is not correc t, measurem ent may be perform ed by pressin g the
MEASUREMENT switch
obtain correct alignment before starting measurement.
. To ensure accu rate measurement results, be sure to
7 By p ressing the , measurement is perfo rmed and values are
displayed.
• It will take a few seconds for measurement to be fully com plete, and display the final
results.
8 When the measurement of one ey e is complete, move the main body to the ot her eye,
either by pushing the
lever. When the main body is aligned properly, continue measurement of the second eye.
When changing between eyes with the control lever, first movement should be
away from the patient.
60
INDIVIDUAL OPERATIONS
or of the control panel or by operat ing the control
Page 63

DISPLAYING MEASUREMENT VALUES
Data of the latest measurements are displayed on the control panel screen.
Display of measurement values only: Measurement was done correctly.
ERROR: Measurement was not done correctly.
For messages on the control panel screen, see "MESSAGE LIST" on page 184.
It is possible to display all measurement data on the screen. For details, see "DISPLAYING ALL MEASUREMENT DATA" on p age 70.
CLEARING ALL MEASUREMENT VALUES
When multiple patien ts are measured con tinuously w ithout printi ng/transferrin g the measurement data of the previous patient, measurement values of the new patient are saved following
the measurement data of the previous patient.
It is possible to clear any unnecessary data.
1 Tap the of the control panel.
ALL CLEAR button
2 A message "Would you like to delete all data ?" is displayed.
ALL CLEAR button
If "Yes" is selected: All measurement values are cleared.
If "No" is selected: Measurement can be continued.
3 When "Yes" is selected, a message "Clearing data..." is displayed.
INDIVIDUAL OPERATIONS
61
Page 64
4 All the measurement values for right and left eyes are cleared, and th e main body will
return to the initial power on position.
When measurement value s are cleared by the , the patient
ID may reset, depending on the setting of "RESETTING THE PATIENT ID
(PATIENT ID RESET)" (page 134).
When "Resetting the Patient ID" is "ON":
The patient ID is reset to the initial patient ID set by "Setting the Patient ID" of
"Initial Setting."
When "Resetting the Patient ID" is "OFF":
The patient ID is not reset, and the same patient ID is used.
When measurement va lue s ar e o utp utted by the , the data will be
cleared when starting the measurement of the next patient.
ALL CLEAR button
PRINT button
TERMINATING MEASUREMENT
1 Turn off the of main body.
When external devi ces a re connec ted to e xtern al I/O ter minals, turn off the po wer
of these devices too.
When the instrument is not used for a long period, unplug the power supply cable,
and detach any cables connected to the external I/O terminal.
POWER switch
2 Clean the forehead rest and the chinrest, then cover the instrument with a dust cover.
If chinrest sheets are used, remove one sheet.
62
INDIVIDUAL OPERATIONS
Page 65

IN A CASE LIKE THIS
DATA OUT button
TO STOP AUTO ALIGNMENT MEASUREMENT IN THE MIDDLE
PRESSING THE MANUAL BUTTON TO STOP AUTO ALIGNMENT
Press the and press the : measurement operation restarts.
To finish measurement, output data by tapping the , or clear
data by tapping the .
STOP THE MEASUREMENT BY OPERATING THE CONTROL LEVER
Tilt the control lever and pull toward the operator. The main body will move away from the
patient.
To res ume measurement, tilt the control lever toward the patient, and bring the
main body slowly into focus with the patient's eye. In auto measurement mode, the
measurement operation starts automatically when focus is reached.
AUTO button MEASUREMENT switch
DATA OUT button
ALL CLEAR button
TO MEASURE THE RIGHT/LEFT EYE ONLY
To fini sh measurement, either tap the to output data, or tap
ALL CLEAR button
the to delete data.
Normally continuou s meas ureme nt is used. To measure the right or left eye only, perform
the following operations. For details, see "
MEASURING ONE EYE ONLY" on page 52.
63
INDIVIDUAL OPERATIONS
Page 66
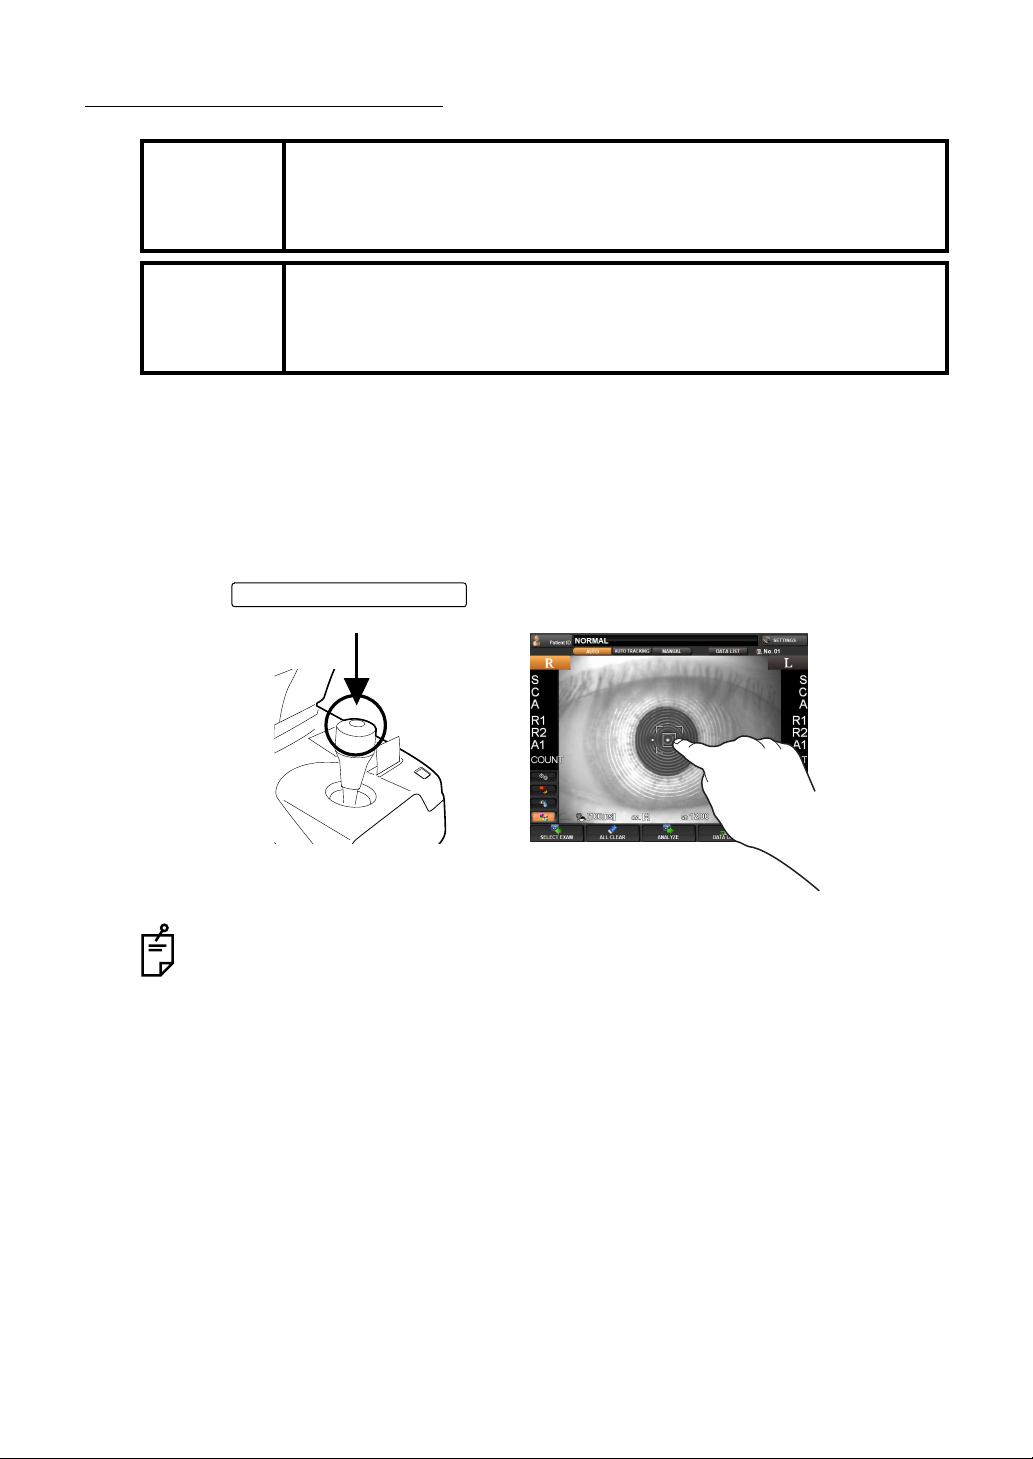
ALIGNMENT DOES NOT START
The measurement i n auto mode may not be possible due to the eyel id
MEMO
MEMO
If auto alignment does not start, any of the following items may be suspected:
THE WAITING SCREEN IS DISPLAYED
and the eyelashes over to the pupil.
If this occurs, the oper at or should tell the patient to op en t hei r eye s wide
enough, or lift the eyelid to allow for measurement.
The measurement in auto mode may not be possible due to frequent
blinks or exis ting ab nor ma li tie s in the co rn eal sur fac e ca us ed b y co rn eal
disease etc.
In this case, use manual mode.
1 If the message "CHECK EYE LEVEL AND FOREHEAD, PRESS MEASURE SW" is dis-
played on the color LCD monitor screen (waiting status), the auto alignment operation
cannot be performed.
2 Tap the to start the measurement.
MEASUREMENT switch
When tapping the screen, note that the meas uring head may move a lot depending on the tapped position.
64
INDIVIDUAL OPERATIONS
Page 67
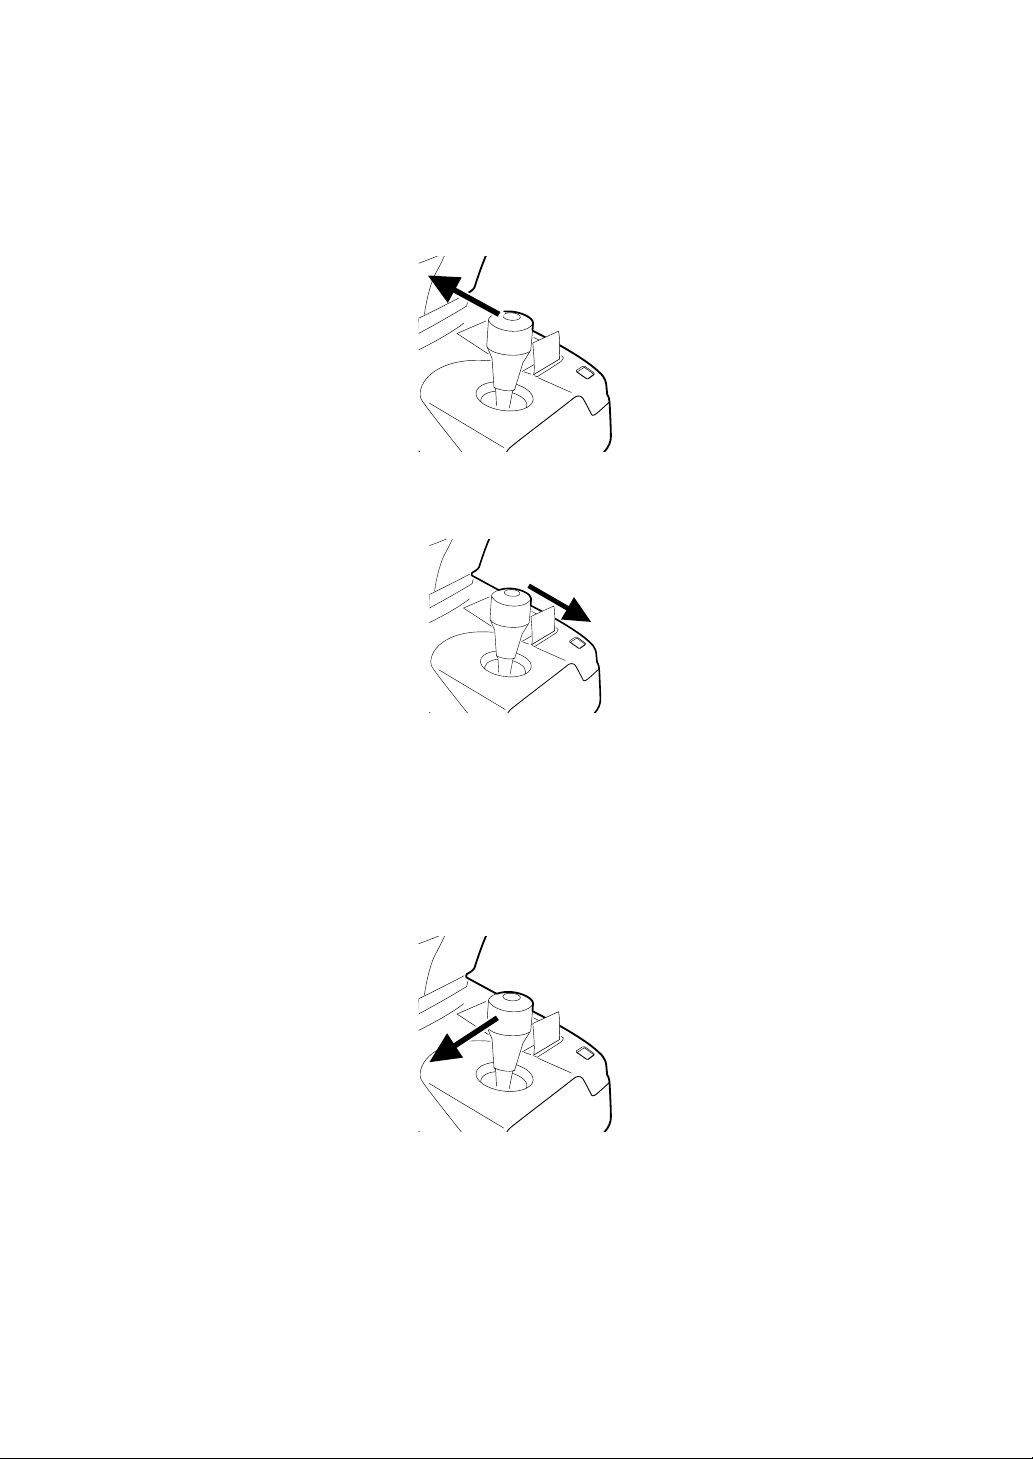
THE IMAGE OF THE PATIENT'S EYE DISPLAYED ON THE MONITOR IS NOT CLEAR
1 Chec k if th e patient's for ehe ad is pres se d aga ins t the fore hea d rest. If not, move the fore-
head forward.
2 If the patient's eye an d the main body are not aligned, tilt the control lever toward the
patient, move the main body slowly toward the patient's eye and bring it into focus.
3 If the patient's eye and the main body are too close, tilt the control lever toward the opera-
tor, slowly move the main body away from the patient's eye and bring it into focus.
THE PATIENT'S EYE IS FAR FROM THE CENTER OF THE SCREEN
If the patient's eye is far from the screen center, auto alignment may not function properly,
and manual alignment may need to be used.
1 Use the control lever to bring the patient's eye closer to the screen center.
For example, If the patient's ey e is to the left sid e of the con trol panel sc reen, tilt the co ntrol lever to the left.
65
INDIVIDUAL OPERATIONS
Page 68

SERIAL (DRY EYE) MEASUREMENT
By continuously perform ing m easurem ent for 10 s hots at a rate of 1 shot/ 1 sec ., you can see
the condition of aberration changing by elapsed time, such as dry eyes.
SETTING SERIAL MEASUREMENT FUNCTION
1 Display the examination purpose selection screen.
2 Tap and select "Serial".
3 Press to measure the measurement screen.
MEASUREMENT PREPARATION AND SERIAL MEASUREMENT
OK button
1 To prepare for the serial measurement, perform measurement once.
When a message "G et the eye aligned and press the MEAS UREMENT switch" is displayed, perform alignment and press the MEASUREMENT switch. (Since this is done
merely for preparation, the meas urement resu lts are n ot reflec ted in t he res ult of contin u
ous measurement.)
2 When a message "Press the MEASUREMENT switch again to perform 10 continuous
measurements" is displayed, press the switch.
Here the serial measurement is started. The measurement count is displayed at the count
column using large numerals.
Auto alignment is not done during the 1 0 continuous measu rements. Since me asurement values are calc ulated after finishing 10 measurements, only measurement counts are displayed and measurement values are not displayed on the
Measurement screen during the measurement.
In the case of the serial measureme nt, when the meas urement of one e ye is finished, the measuring head does not move automatically to the measurement position of the other eye under progress measurement.
In case of the serial meas urement, the screen does not go automat ically to the
Table of measurement result screen after finishing the measurement.
-
66
INDIVIDUAL OPERATIONS
Page 69

Count
R button L button
Finish
3 By tapping th e , the Progress map is displayed. Measurement data
obtained by Serial Measurement mode can be confirmed by the Progress map.
• For details about the analysis result displayed on the Progress map, see page 86.
ANALYZE button
67
INDIVIDUAL OPERATIONS
Page 70

PUPILLOMETRY
The Pupillometry function is intended to change the pupil size of the patient's eye by changing
the brightness of the fixation target, thereby measuring the pupil diameter and wavefront aber
ration.
Brightness is changed in steps automatically (under Auto mode and Auto tracking mode), and
each time measurement is performed three times.
Data of the pupillometry mode cannot be mixed with the data of other modes (R/K,
REF, KRT). Whe n the measurement mode is chang ed in the middle (such as to
measure one eye by pupil lomet ry mode and then me asur e the other ey e by R/K),
the pupillometry data are cleared.
SETTING THE PUPILLOMETRY FUNCTION
1 Display the examination purpose selection screen.
2 Tap and select "PUPILLOMETRY".
-
3 Press to measure the measurement screen.
PUPILLOMETRY (AUTO MEASUREMENT)
OK button
1 Roughl y align the patient's eye and press the Meas urement switch to start a preliminary
measurement. Brightnes s of the fixation target is cha nged to the darkest state an d starts
pupillometry.
Measurements are per formed three times with th e fixation targ et under th e darkest state
(Scotopic: dark place measurement), an d three times with the fix ation target under the
brightest state (Photopic: bright place measurement).
2 To measure the other eye, tap the R-L Ch ange button on the MEASUREM ENT screen
and change the target eye.
68
INDIVIDUAL OPERATIONS
Page 71

3 By tapping the butto n, the "Pupillometry map" is displayed. Result of the
data measured under the Pupillometry mode can be checked on the Pupillometry map.
• For the analysis result displayed on the Pupillometry map, see page 90.
In the case of Pupillometry, the screen does not go automatica lly to the Measur ement Result List screen after finishing the measurement.
When performing the pupillometry, use a darkroom.
ANALYZE
Under the Pupillometry mode, after measuring one eye shift to the other eye is not
made automatically.
When the same eye is measured repeatedly, result of the completed measurement is cleared. In this case, measurement starts from the Pupillometry
(Scotopic), without performing the preliminary measurement.
When measurement is done under the Auto Tracking mode, the waiting status
starts with the patient's eye focused by the first preliminary measurement. Start
measurement by pressing the MEASUREMENT switch.
When measurement i s done unde r the Man ual mode , the waiti ng status starts for
preliminary measurement, Scotopic and Photopic, respectively. Start measure
ment by pressing the MEASUREMENT switch.
-
69
INDIVIDUAL OPERATIONS
Page 72
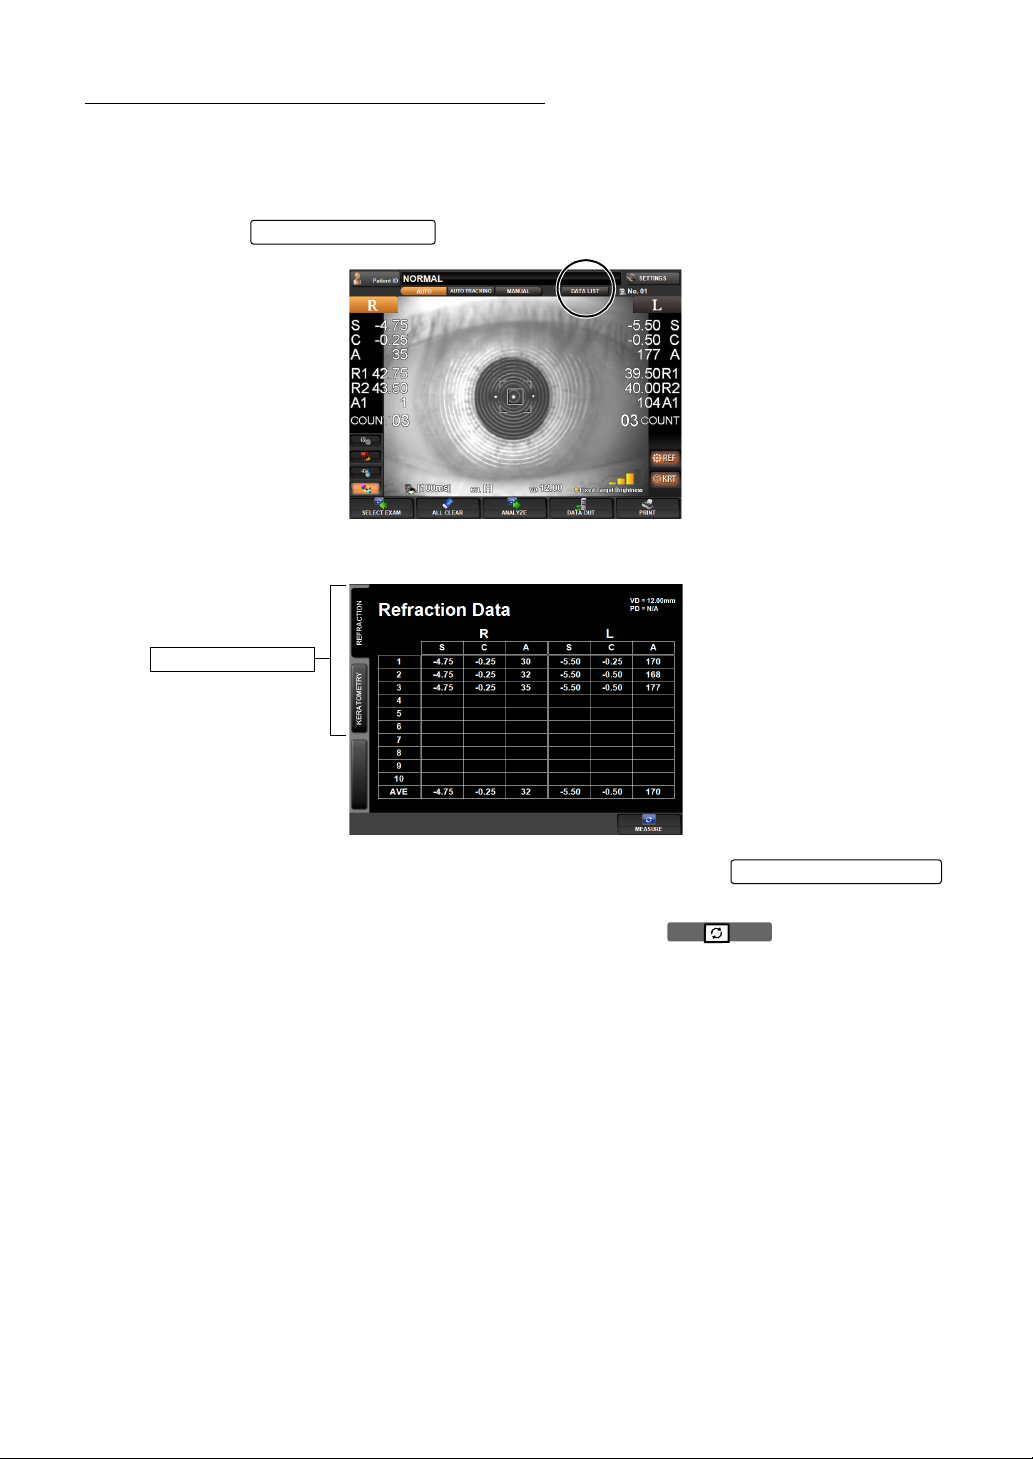
DISPLAYING ALL MEASUREMENT DATA
For measurement value s, the latest data is displayed, but it is also po ssible to confirm and
review all measurement data.
Select and display measurement data from "REF data" and "KRT data".
1 Press the of the control panel.
The DATA LIST screen is displayed.
Page Change button
DATA LIST button
2 Disp lay of measurement data can be changed by tappi ng the
(REF data, KRT data).
Page Change button
3 The MEASUREMENT screen is returned by pressing the button.
• The averag e val ue ( AVE) of REF data excludes th e hi gh est and lowest data of S (sph er ical
refractive power) from al l measurement values. When a total of 3 or more measurements
are done for one eye, AVE is displayed.
70
INDIVIDUAL OPERATIONS
Page 73

PRINTING MEASUREMENT VALUES
DATA OUT button
• To avoid paper jam in the internal printer, do not feed the paper into
the printer if it is partly cut/torn or wrinkled.
• To a void discolorati on of the pr inting paper (particul arly the reco rding
area) during storage , use a polypropylene holder; avoid a c ontainer
MEMO
This instrument is equipped with a built-in printer.
made of plasticizer (PVC, etc.).
• To a void discolorati on of the pr inting paper (particul arly the reco rding
area) after pasting, use water-soluble glue.
• Since the printer paper is ther mosensitive, it is not suitable for long
periods of storage. If necess ary to k eep rec ords fo r lon g period s, pre pare se pa rate copies.
1 Make sure the MEASUREMENT screen is on.
2 Tap the of the control panel.
printed out.
The light of is turned off.
DATA OUT button
lights, and measureme nt values on the control panel screen a re
DATA OUT button
Finish
Even after the printing operation is complete and the results displayed on the
screen is deleted, the r esults are store d within the instr ument. So you can repeat
printing out the data by tapping the
ment is started. The data is cleared at the start of new measurement.
The "ERROR" mark is not p rinted. Also, printi ng is not done if th ere are no measurement values.
When red lines appear on both sides of the printer paper, replace it with a new one
earlier. For details about the replacement of print er paper, see "
PRINTER PAPER" on page 33. Additionally, a 58mm wide printer p a pe r ( e xamp l e:
TF50KS-E2C (Nippon Paper) is recommended.
DATA OUT button
until a new measure-
SETTING THE
71
INDIVIDUAL OPERATIONS
Page 74

3 When measurement values are printed out, the paper is cut automatically.
The user may select which data items are to be printed. Refer page 159 for detail.
If the printer paper is not cut a utomaticall y at the end of printi ng the data, hol d of
the top corner of the paper and cut by pulling the paper down and diagonally.
4 When printing data is completed, the main body returns to the initial position.
The main body initial position can be changed in INITIAL SET screen.
Refer page 130 for detail.
72
INDIVIDUAL OPERATIONS
Page 75

INPUT/OUTPUT
OUTPUT USING RS-232C
This instrument can output data to PC and other devices the like via the RS-232C interface.
1 Make sure that the connection is to the RS-232C OUT.
For connection, see "CONNECTING EXTERNAL I/O TERMINALS" on page 32.
2 Check settings for data communication.
For data communication settings, see "SETTING OF DATA COMMUNICATION (COMM)"
on page 168.
OUTPUT USING USB
This instrument can output data to an external printer or PC via the USB interface.
1 Make sure that the connection is to the USB OUT.
For connection, see "CONNECTING EXTERNAL I/O TERMINALS" on page 32.
Check settings for data communication.
For data communication settings, see "SETTING OF DATA COMMUNICATION (COMM)"
on page 168.
For the usable external printer, ask your dealer or TOPCON at the address printed
on the back cover of this manual.
INPUT USING USB
This instrument can input data the USB interface.
1 Make sure that the connection is to the USB IN.
For connection, see "CONNECTING EXTERNAL I/O TERMINALS" on page 32.
Check settings for data communication.
OUTPUT USING LAN
This instrument can output data to PC on network via the LAN interface.
1 Make sure that the connection is to the LAN.
For connection, see "CONNECTING EXTERNAL I/O TERMINALS" on page 32.
Check settings for data communication.
For communication settings, see "LAN CONNECTION (NETWORK)" on page 171.
73
INDIVIDUAL OPERATIONS
Page 76
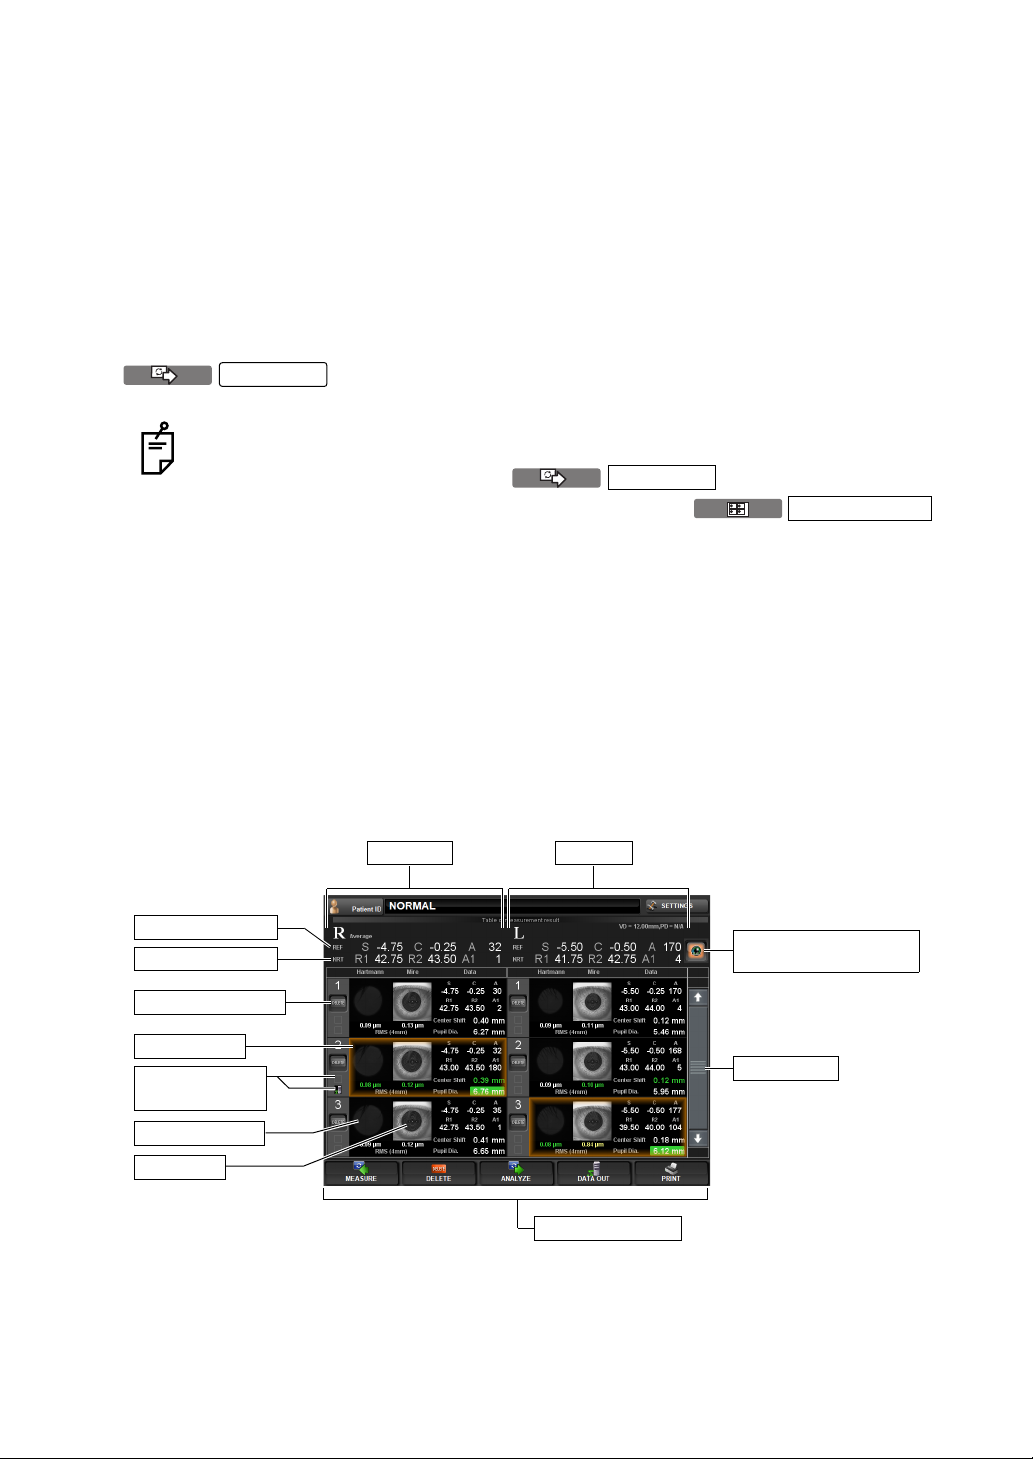
DISPLAYING THE MEASUREMENT RESULT
MEASUREMENT RESULT LIST SCREEN
On the Measuremen t Result List s creen, a lis t of measurem ent results c an be confirm ed. By
selecting the da ta to be di spla yed, data outp ut to th e exte rnal PC, pr intin g data, initia l dis play
on the Analysis screen, and clearing data can be done.
When plural measurements are performed under Auto mode, the screen is changed automatically to the Measurement Result List screen.
In the case of Manual mode or Auto Tracking mode, it is displayed by tapping the
ANALYZE
In case of the serial meas urement, the screen does not go automat ically to the
Table of measurement result screen after finishing the measurement.
After the measurement, tap the button and display the
Summary map or th e Pupillometry map, and tap the
button of the displayed map to display the Measurement Result List screen.
In case of Pupill ome tr y, the screen does no t g o a utomatically to the Table of measurement result screen after finishing the measurement.
• Selected data are displayed in brown. After changing the screen to the Measurement Result
List screen, first the data of the largest pupil diameter are selected automatically.
• On the Measurement Result List screen, typical REF/KRT values are displayed on the
screen. Also, the Hartmann Image, Mire Image, ocular high order aberration, REF/KRT
data, center shift and pupil diameter are displayed for each eye.
• When plural m easurements ar e done, the res ult of whic h the cornea l high orde r aberration
and center shift are the smallest is displayed in green. With regard to the pupil diameter, the
largest result is displayed with a green background.
button after the measurement.
ANALYZE
RESUL T LIST
Right eye
Typical REF value
Typical KRT value
(2) DELETE button
Selected data
(4) Printed icon/
output icon
Hartmann Image
Mire Image
74
DISPLAYING THE MEASUREMENT RESULT
Left eye
(5) Recommended data
selection button
(1) Scroll bar
(3) Function button
Page 77

(1) Scroll bar By scrolling t he measurement result, meas urement data can be
DELETE
ANALYZE
T
scrolled up and down.
(2) DELETE button Select the data to be deleted. The selected button
turns on in orange. Under this condition, deleti on is done by tapping the button of the (3)Function button.
(3) Function button Available funct ions ar e listed . Sel ect th e corr espondin g b utton on
the touch panel.
MEASURE
DELETE
DATA OU
button The Measurement screen is returned and an addi-
button Selecting the data to be deleted by the
button The screen is changed to the selected Analysis
button Se lected measurem ent result data can be o utputted
DELETE
tional measurement can be done. However, if data
are outputted to the con nected PC or printed by the
internal/external printer, the display is changed to
"NEXT MEASUREMENT" and a new measurement
is started.
button, the data can be deleted by tapping the
DELETE
Result screen, and the analysis result is displayed.
to the RS-232C or to the connected PC.
The following three se ttings can be assigned to the
button:
(1) KR-1W data output(1WS data)
(2) Print image output (Report image)
(3) RS-232C output(STD1)
Output data can be set on the SETTINGS screen.
Incidentally, as the "print image output," left eye/righ t
eye data framed in brown of the Measurement
Result List screen are outputted.
button.
DELETE
Also, by a long pressing of the DATAOUT button
(approx. 2 sec), the following menu is displayed,
where the desired data to be outputted can also be
selected.
* The setting here is a tempora ry setting which will
not be reflected in the following oper ations. To con
tinuously change output data, set ou tput data on the
SETTINGS screen. (See pages
168 and 172).
-
75
DISPLAYING THE MEASUREMENT RESULT
Page 78

PRINT
button Selected measurement data can be printed by the
internal printer or by the conn ected external printer.
The following two settings can be assigned to the
button:
(1) Internal thermal printer
(2) Connected external printer
Additionally, the data outputted to the external printer
are the left eye/right eye data fra med in br own of the
Measurement Result List scr een.
Also, by a long pressing of the PRINT button
(approx. 2 sec), the desired data to be outputte d can
also be selected.
* The setting here is a tempora ry setting which will
not be reflected in the following oper ations. To con
tinuously change output data, set ou tput data on the
SETTINGS screen. (See pages
133 and 134).
-
(4) Printed icon/output icon
A printer icon and a PC icon are displayed for printed data and output
data respectively.
76
DISPLAYING THE MEASUREMENT RESULT
Page 79

ANALYSIS RESULT SCREEN
.)
Select Layout button
T
The KR-1W can perform REF/KRT measurements and aberration measurements by capturing
Hartmann Shack and Mire images of the patient's eye. After the measurement, tap the
ANALYZE
button to display analysis results on Measurement Result List Screen.
(1) R-L Change button
(2) Data Feed button
(6) Measurement
value data tub
(5) Analysis result
(4) Function button
(3) Layout Change button
Pull down menu
(The figure shows a multi map
(1) R-L Change button Moves to the first measured data of each of the right and left
eyes.
(2) Data Feed button If ther e are too many data to display on the mea surement value
data tab (6), the tab of the next measurement data is displayed or
the previous measurement value data tab is displayed.
(3) Layout Change button Displays the measurement result by changing it to the previously
set layout pattern. Four la yout types can be registe red. Pressing
the
at the right most, a pull down menu
for layout selection is displayed.
(4) Function button A list of operable functions is displayed. Select a relevant button
by the touch panel.
MEASURE
button
The Measurement screen is returned and an additional
measurement can be done. Howe ver, if data are outputted
to the connected PC or printed by the internal/external
printer, the display is changed to "N EX T MEA SU R EM ENT "
and a new measurement is started.
DELETE
button
The measurement data currently displayed are cleared.
RESULT LIS
button
Changes to Result List display mode. (see page 74.)
DATA OUT
button
Selected measurement result data can be outputted to the
RS-232C or to the connected PC.
77
DISPLAYING THE MEASUREMENT RESULT
Page 80
PRINT
(5) Analysis result Analysis results such as Mire image, Hartmann image and
wavefront aberration ima ge are dis pla ye d.
(6) Measurement value data tub
Measurement data is displayed in the order of measurement from
above. The recommende d data is displ ayed with a check mark. A
printer icon and a PC icon are disp layed for prin ted data a nd out
put data respectively.
When the external printer is set, the disp layed analysis
result can be outputted to the external printer. For
details about the external printer, see "
EXTERNAL PRINTER (EXTERNAL PRINTER)" on
page 134. O utput layout of the external printer can be
selected. For details see page 167, SETTING OF
EXTERNAL PRINTER (PRINT EXT).
SETTING THE
DESCRIPTION OF MAP LAYOUT
In the measurement result display screen for displaying analysis results, various types of map
layout are prepared and can be selected.
A special toolbar is also prepared. Here, contents of display and f eatures, and the s witching
procedure are described.
The following maps are available:
-
Multi map
Ocular Aberration map
Corneal Aberration map
Component map
Zernike Vector map
Progress map
IOL Selection map
PSF/MTF map
Pupillometry map
Corneal R/L map
Ocular R/L Map
Custom map 1-4
• For Custom map 1-4, layout can be set. See "CUSTOM MAP" on page 142.
• Pupillometry map can be selected under pupillometry mode measuring only.
78
DISPLAYING THE MEASUREMENT RESULT
Page 81
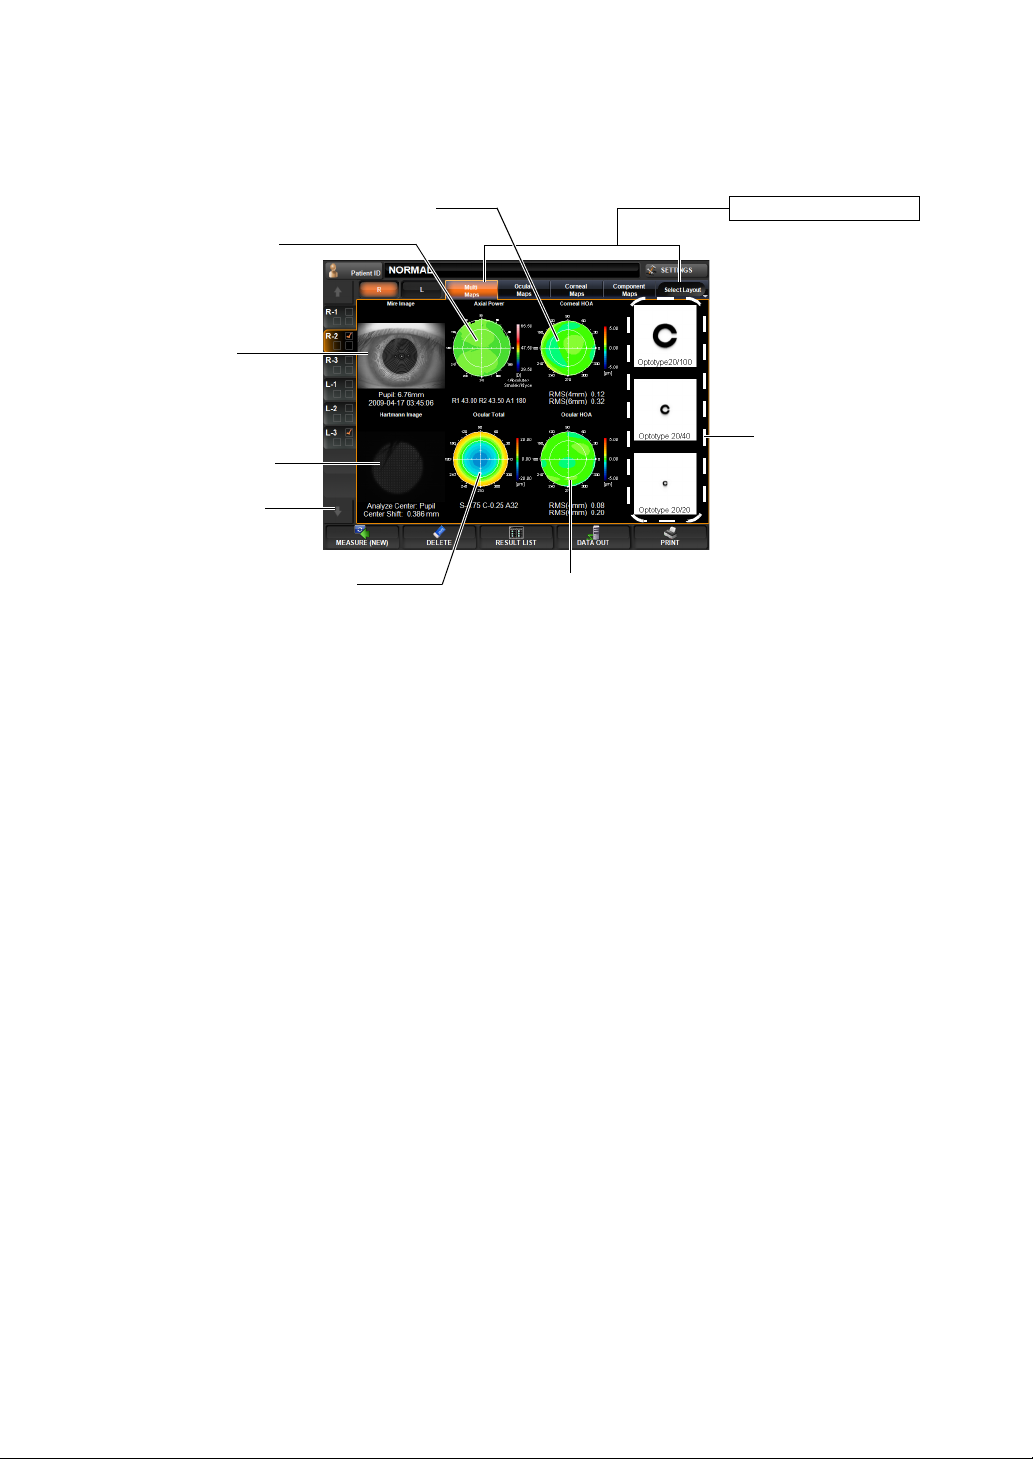
MULTI MAP DISPLAY
Both Corneal and Ocular aberration maps and Simulation are displayed.
This map display facil itates qualitative co mparison of aberration due to corneal topogra phy
and aberration of total refraction.
(3) Corneal HOA map
(2) Axial Power map
(1) Mire image
(4) Hartmann image
(8) Analysis center
(5) Ocular Total Aberration map
(6) Ocular HOA map
(3) Layout Change button
(7) Simulation
Changing to other map: Tap the Layout Change button.
Description of Each Display
(1) Mire image Image by projecting a Placido ring to the cornea. An image of corneal
surface; from this image, measurements related to the cornea are
analyzed. The pupi l diam eter is d isplaye d tog ether with the time and
date of measurement at the bottom part.
Operation: • When tapped, the image is enl arged. (See "ENLARGEMENT DIS-
PLAY" on page 94.)
• When dragged in the right-left direction, the overlay can be
changed. (See page
98.)
(2) Axial Power map A map to display the distribution of corneal refractive power.
KR values are displayed at the bottom part of the map.
Operation: • When tapped, the map is changed to the cornea ab erration map.
(See page
82.)
• The map scale can be changed. (See page 149.)
(3) Corneal HOA map A map to display corneal higher order aberrations (e.g. irregular
astigma). At the bottom part of the map, corneal higher order aberra
-
tion, 4-mm area and 6-mm area, are displayed with RMS values.
Operation: • By tapping, the map is switched to the IOL Selection map. (See
page
87.)
• The map display st ep can be changed. (See "Setting the Display
Step of High Order Aberration Astigma Map" on page
147.)
(4) Hartmann image A point image reflected from the internal ocular part through the
pupil. From this image, REF values, ocular total aberration, high
79
DISPLAYING THE MEASUREMENT RESULT
Page 82

order aberrations, et c. are cal cula ted. Des criptio n about th e analy sis
is given at the b ottom part of th e image. (An alysis center /Amount of
central movement (see page
Operation: • When tapped, the image is enl arged. (See "ENLARGEMENT DIS-
PLAY" on page 94.)
• When dragged in the right-left direction, the overlay can be
changed. (See page
(5) Ocular Total Aberration map
A total aberration map, including lower order aberration of ocular
refraction. This map can distinguish near and far vision ten dencies.
REF values are displayed at the bottom of the map.
For example, if the center of the map is cold in color (blue), near
vision tendency. If the center of the map is warm in color (red), far
vision tendency.
Operation: • When tapped, the image is change d to the ocular aberration map.
(See page
• The map display step can be changed. (See "SETTING THE
TOTAL ABERRATION MAP DISPLAY STEP (TOTAL ABERRATION MAP RANGE)" on page 146.)
(6) Ocular HOA map A map to display ocular higher order aberration (e.g. irregular
astigma). This map dis plays irregular astigma wh ich cannot be cor
rected by eyeglasses.
At the bottom part of the map, corneal higher order aberration, 4-mm
area and 6-mm area, are displayed with RMS values.
81.)
98.)
104))
-
Operation: • When tapped, the map is c hanged to the ocular aberration map.
(See page
• The map display step can be changed. (See "SETTING THE HIGH
ORDER ABERRATION ASTIGMA MAP DISPLAY S TEP" on page
147.)
(7) Simulation Simulation of the target using ocular higherorder aberration.
Visions of target by 20/100 (0.2) , 2 0/40 (0 .5) an d 2 0/20 (1 .0) are dis played, from the top stage.
Operation: • When tapped, the map is changed to the RSF/MTF map. (See
page
• The orientation of the optotypes can be changed.
(See "SETTING OPTOTYPE DIRECTION" on page 152.)
• The vision of each chart can be changed. (See "SETTING OPTOTYPE SIMULATION 1 (UPPER)" on page 151.)
• To normalize the brightness or not can be changed. (See "SETTING THE NORMALIZATION OF BRIGHTNESS OF SIMULATION
(NORMALIZE DESTINY OF SIMULATIONS)" on page 152.)
(8) Analysis center Whether the analysis center is the pupil center or the mechanical
center is shown. Also, the distance between pupil center and
mechanical center is displayed.
For details about the pupil center and the mechanical center, see
"
ANALYSIS CENTER" on page 104.)
84.)
89.)
80
DISPLAYING THE MEASUREMENT RESULT
Page 83

OCULAR ABERRATION MAP DISPLAY
This map displays information about aberration related to total refraction.
(2) Ocular total aberration map
(1) Hartmann image
(5) RMS display of
ocular aberration
To change display to another map: Tap the Layout Change button.
(1) Hartmann image (See "Hartmann image" on page 79.)
Operation: • When tapped, the image is enl arged. (See "ENLARGEMENT DIS-
PLAY" on page 94.)
• When dragged in the right-left direction, the overlay can be
changed. (See page
98.)
Layout Change button
(4) Simulation
(3) Ocular HOA map
(2) Ocular total aberration map(See "Ocular Total Aberration Map" on page 80.)
Operation: • When tapped, the image is enl arged. (See "ENLARGEMENT DIS-
PLAY" on page 94.)
• The map display step can be changed. (See "SETTING THE
TOTAL ABERRATION MAP DISPLAY STEP (TOTAL ABERRATION MAP RANGE)" on page 146.)
(3) Ocular HOA map (See "Ocular High Order Aberration Map" on page 80.)
Operation: • When tapped, the image is enl arged. (See "ENLARGEMENT DIS-
PLAY" on page 94.)
• The map display step can be changed. (See "SETTING THE HIGH
ORDER ABERRATION ASTIGMA MAP DISPLAY S TEP" on page
147.)
81
DISPLAYING THE MEASUREMENT RESULT
Page 84

(4) Simulation (See "Simulation" on page 82.)
Operation: • When tapped, the image is enl arged. (See "ENLARGEMENT DIS-
PLAY" on page 94.)
• The orientation of the optotypes can be changed.
(See page 152 "SETTING OPTOTYPE DIRECTION".)
• The vision of each chart can be changed.
(See page 151 "SETTING OPTOTYPE SIMULA TION 1 (UPPER) ".)
• To normalize the brightness or not can be changed. (See "SETTING THE NORMALIZATION OF BRIGHTNESS OF SIMULATION
(NORMALIZE DESTINY OF SIMULATIONS)" on page 152.)
(5) RMS display of ocular aberration
Ocular aberration is displayed quantitatively. (See "DESCRIPTION
ABOUT RMS DISPLAY OF OCULAR ABERRATION" (page 104)
CORNEAL ABERRATION MAP DISPLAY
This map displa ys i nfor m ati on a bou t th e c ornea, including the c orne a aberration map and the
cornea topography map.
Layout Change button
(6) Corneal Index
(1) Mire image
(5) RMS display of
corneal aberration
To change display to another map: Tap the Layout Change button.
(1) Mire image (See "Mire Image" on page 79.)
Operation: • When tapped, the image is enl arged. (See "ENLARGEMENT DIS-
PLAY" on page 94.)
• When dragged in the right-left direction, the overlay can be
changed. (See page
98.)
(2) Axial Power map (See "Axial Power Map" on page 79.)
Operation: • When tapped, the image is enl arged. (See "ENLARGEMENT DIS-
PLAY" on page 94.)
(2) Axial Power map
(3) Instantaneous Power
map
(4) Corneal HOA map
82
DISPLAYING THE MEASUREMENT RESULT
Page 85

(3) Instantaneous Power map
The corneal refrac tive power is display ed by a local power dis tribution.
Operation: • When tapped, the image is enl arged. (See "ENLARGEMENT DIS-
PLAY" on page 94.)
• The map scale can be change d. (See "SETTING THE TOPOMAP
SCALE TYPE (TOPOMAP SCALE - TYPE)" on page 149.)
(4) Corneal HOA map (See "Corneal HOA Map" on page 79.)
Operation: • When tapped, the image is enl arged. (See "ENLARGEMENT DIS-
PLAY" on page 94.)
• The map scale can be change d. (See "SETTING THE TOPOMAP
SCALE TYPE (TOPOMAP SCALE - TYPE)" on page 149.)
(5) RMS display of corneal aberration
Corneal aberration is displayed quanti tatively. (See "DESCRIPTION
ABOUT RMS DISPLAY OF CORNEAL ABERRATION" (page 105)
(6) Corneal Index Information on the cornea is displayed quantitatively.
Sim-Ks S hows the refractive power and angle of th e flat meridian of 3-mm
area on the cornea.
Sim-Kw Shows the refr ac tive power and angle of the steep meri dian of 3- mm
area on the cornea.
CYL Astigmatic axial power
e value Shows the eccentricity indicating the aspheric degree.
* For a perfect ball, e=0; fo r a shape normally flat in the periphery,
0<e<1.
Q value Asp her ic coefficient
ZRI The value which variat ion in the co rneal power in the meridia n direc -
tion from a corneal center to the perip hery is quantified. Assuming
that a ring exists for the corneal center through the periphery , it is cal
culated from the corne al power of each position. Note t hat the corneal power is cal culated with the co rneal shape fitted to 6mm sixthorder Zernike coefficient.
ZAI In order to quantify the s ymmetry of a c ornea, the difference of c or-
neal power between a c ertain point on the cornea a nd the point on
the opposite side (180
°) is added in the target area and calculated.
-
83
DISPLAYING THE MEASUREMENT RESULT
Page 86

COMPONENT MAP DISPLAY
This map displays the entire eye, cornea , behind the cornea (internal ) and important compo nents of high order aberration.
In the map, components are tabulated; 3rd-or der and 4th -o rd er aber rati ons are displa ye d ver tically, and ocular, corneal and internal aberrations vertically.
(4) Corneal HOA map
(3) Astigmatism map
(5) Third-order display
Layout Change button
(1) Ocular total
aberration map
(7) Ocular display
(8) Corneal display
(9) Internal display
(2) Axial Power map
(10) Aberration RMS
display
To change display to another map: Tap the Layout Change button.
(1) Ocular total aberration map
(See "Ocular Total Aberration Map" on page 80.)
Operation: • When tapped, the image is enl arged. (See "ENLARGEMENT DIS-
PLAY" on page 94.)
• The map display step can be changed. (See "SETTING THE
TOTAL ABERRATION MAP DISPLAY STEP (TOTAL ABERRATION MAP RANGE)" on page 146.)
(2) Axial Power map (See "Axial Power Map" on page 79.)
(6) Fourth-order display
Operation: • When tapped, the image is enl arged. (See "ENLARGEMENT DIS-
PLAY" on page 94.)
(3) Astigmatism map Distribution of low order cylindrical refractive power.
Ocular aberratio n is shown as cylindric al refractive power, and corneal aberration is shown as corneal astigmatic power.
Operation: • When tapped, the image is enl arged. (See "ENLARGEMENT DIS-
PLAY" on page 94.)
(4) Corneal HOA map (See "Corneal High Order Aberration Map" on page 79.)
Operation: • When tapped, the image is enl arged. (See "ENLARGEMENT DIS-
PLAY" on page 94.)
• The map scale can be change d. (See "SETTING THE TOPOMAP
SCALE TYPE (TOPOMAP SCALE - TYPE)" on page 149.)
(5) Third-order display Third-order aberrations of Zernike coefficient are displayed (Trefoil
and Coma aberration).
84
DISPLAYING THE MEASUREMENT RESULT
Page 87

(6) Fourth-order display
Fourth-order aberrations of Zernike coefficient are displayed (Tetrafoil, 2nd Astig. and Spherical aberration).
(7) Ocular display Aberration of the whole eyeball obtained from the Hartmann image is
displayed in 3rd and 4th-order.
(8) Corneal display Aberration of the cornea sur face obtained from th e Placido im age is
displayed in 3rd and 4th-order.
(9) Internal display In ternal aberration (aberration of whol e eyeball minus aberration of
cornea) is displayed .
(10) Aberration RMS display
RMS values (except ion: diopter for astigma tism) and angl es are displayed in analysis dia meters (4mm and 6mm). For the direction o f
RMS of each order, see "
DESCRIPTION ABOUT RMS DISPLAY OF
CORNEAL ABERRATION" on page 105).
ZERNIKE VECTOR MAP
This map displays important ocular higher order aberrations by components.
(2) Ocular total aberration map
(1) Hartmann image
(4) HOA map
(5) Simulation
Layout Change button
(3) Ocular HOA map
To ch ange displ ay: Tap the Select Layout button (at the rightmost of Layout Chan ge buttons) ,
and tap the
Zernike Vector Map
button from the pull down menu.
To change display to another map: Tap the Layout Change button.
(1) Hartmann image (See "Hartma nn Imag e" on page 79.)
Operation: • When tapped, the image is enl arged. (See "ENLARGEMENT DIS-
PLAY" on page 94.)
• When dragged in the right-left direction, the overlay can be
changed. (See page
98.)
(2) Ocular total aberration map(See "Ocular Total Aberration Map" on page 80.)
Operation: • When tapped, the image is enl arged. (See "ENLARGEMENT DIS-
PLAY" on page 94.)
• The map display step can be changed. (See "SETTING THE
TOTAL ABERRATION MAP DISPLAY STEP (TOTAL ABERRATION MAP RANGE)" on page 146.)
DISPLAYING THE MEASUREMENT RESULT
85
Page 88

(3) Ocular HOA map (See "Ocular High Order Aberration Map" on page 80.)
Operation: • When tapped, the image is enl arged. (See "ENLARGEMENT DIS-
PLAY" on page 94.)
• The map display step can be changed. (See "SETTING THE HIGH
ORDER ABERRATION ASTIGMA MAP DISPLAY S TEP" on page
147.)
(4) HOA map Aberration of each component (3rd and 4th-order) is displayed.
Operation: • When tapped, the image is enl arged. (See "ENLARGEMENT DIS-
PLAY" on page 94.)
• The map display step can be changed. (See "SETTING THE HIGH
ORDER ABERRATION ASTIGMA MAP DISPLAY S TEP" on page
147.)
(5) Simulation Simulation of each component is displayed.
Operation: (See "Simulation" on page 82.)
PROGRESS MAP
This map displays higher order a berrations wh en multiple measuremen ts are done (10 me asurements max.)
Layout Change button
(2) Measurement Result
(3) Total HOA graph
(1) Ocular HOA map
To ch ange displ ay: Tap the Select Layout button (at the rightmost of Layout Chan ge buttons) ,
and tap the
Progress Map
button from the pull down menu.
To change display to another map: Tap the Layout Change button.
(1) Ocular HOA map (See "Ocular High Order Aberration Map" on page 80.)
Operation: • When tapped, the image is enl arged. (See "ENLARGEMENT DIS-
PLAY" on page 94.)
• The map display step can be changed. (See "SETTING THE HIGH
ORDER ABERRATION ASTIGMA MAP DISPLAY S TEP" on page
147.)
(2) Measurement Result
Values of aberration in the first and last measurements are displayed.
86
DISPLAYING THE MEASUREMENT RESULT
Page 89
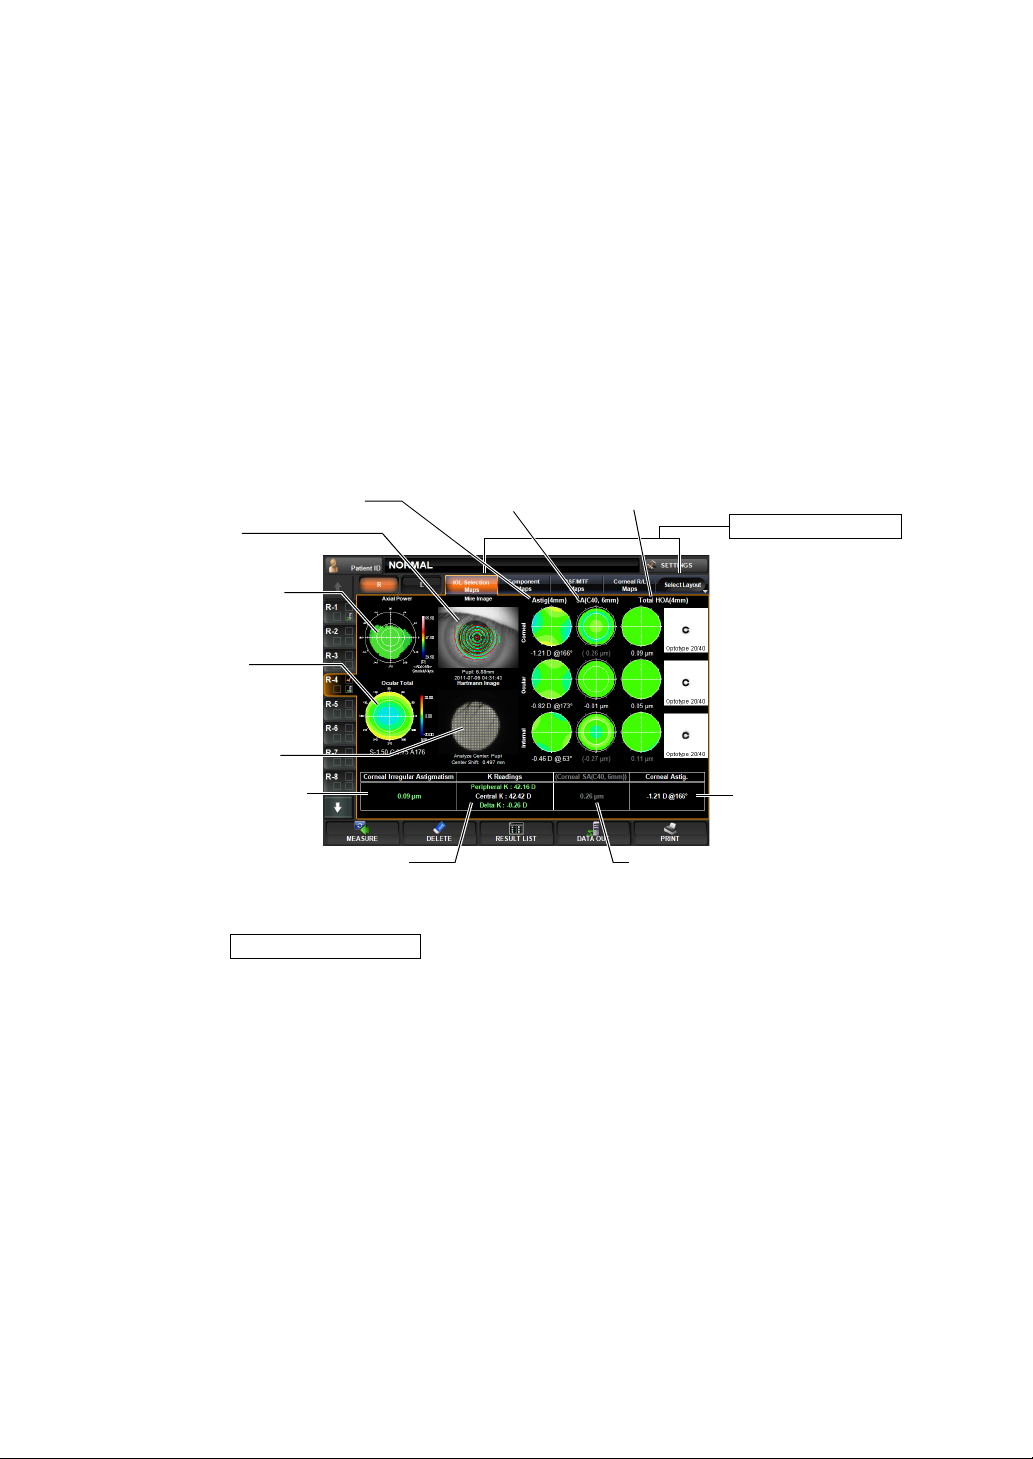
(3) Total HOA graph The horizontal axis shows the number of measurements and the ver-
n
tical axis the value of HOA (High Order Aberration).
The expression at th e top right of the graph indicates the approx imated primary line.
R2 is the determination coefficient showing the degree of applicability
of the approximation.
• The graph scale can be changed by dragging to the right/left.
• Graph setting can be also set by the item of "DISPLAY" of the
"SETTINGS screen." (See "
PROGRESS MAP GRAPH SCALE" on
page 153.)
IOL SELECTION MAP
This map displays in formation useful for the application of IOL after LASIK operation, se lection of K values, spher ical IOL and asph eric IOL in determi ning the power, application of bifocal IOL, etc.
(5) Astig (4mm) (6) SA display (7) Total HOA display
(1) Mire image
(2) Axial Power map
(3) Ocular to tal
aberration map
Layout Change button
(4) Hartmann image
(8) Corneal HOA display
(9) Display of Average K and Central K (10) Display of corneal spherical aberratio
(11) Display of corneal
astigmatic power
To ch ange displ ay: Tap the Select Layout button (at the rightmost of Layout Chan ge buttons) ,
and tap the
IOL Selection Map
button from the pull down menu.
To change display to another map: Tap the Layout Change button.
(1) Mire image (See "Mire Image" on page 79.)
Operation: • When tapped, the image is enl arged. (See "ENLARGEMENT DIS-
PLAY" on page 94.)
• When dragged in the right-left direction, the overlay can be
changed. (See page
98.)
(2) Axial Power map (See "Axial Power Map" on page 79.)
Operation: • When tapped, the image is enl arged. (See "ENLARGEMENT DIS-
PLAY" on page 94.)
87
DISPLAYING THE MEASUREMENT RESULT
Page 90

(3) Ocular total aberration map
(See "Ocular Total Aberration Map" on page 80.)
Operation: • When tapped, the image is enl arged. (See "ENLARGEMENT DIS-
PLAY" on page 94.)
• The map display step can be changed. (See "SETTING THE
TOTAL ABERRATION MAP DISPLAY STEP (TOTAL ABERRATION MAP RANGE)" on page 146.)
(4) Hartmann image (See "Hartmann Image" on page 79.)
Operation: • When tapped, the image is enl arged. (See "ENLARGEMENT DIS-
PLAY" on page 94.)
• When dragged in the right-left direction, the overlay can be
changed. (See page
(5) Astig (4mm) Map of cylindrical refractive power when the analysis diameter of
4mm is displaye d. From the top: corneal aberration, ocular aberra
tion and internal aberration.
(6) SA displa y Map of spherical aberra tion when the analysis diameter o f 6mm is
displayed. From the top: corneal aberration, ocular aberration and
internal aberration.
(7) Total HOA display Map of high or der aberration when the ana lysis diameter of 4mm is
displayed. From the top: corneal aberration, ocular aberration and
internal aberration.
(8) Corneal HOA display
Corneal higher order aberrati on is disp layed . When the corneal h igh
order aberration shows an ab norma l valu e, the correc ted visua l acu
ity may not be satisfactory ev en after applying IOL: This informa tion
may be valuable for patient treatment.
(9) Display of Average K and Central K
The Sim-K value (Average K) wi th an analy sis di ameter of 3 mm, the
Kerato value (Central K) wi th an analysis diameter of 1 mm, and the
difference are displayed: If the difference of Average K and Central K
is large, possibility of the eye is high after a LASIK operation, and this
value may be used as information for making a decision.
98.)
-
-
Operation: • When tapped, the image is enl arged. (See "ENLARGEMENT DIS-
PLAY" on page 94.)
(10) Display of corneal spherical aberration
The value of corne al spherical aberration may be used as information for making a dec ision i n appl ying an asp heric I OL o r a spher ical
IOL.
Operation: • When tapped, the image is enl arged. (See "ENLARGEMENT DIS-
PLAY" on page 94.)
88
DISPLAYING THE MEASUREMENT RESULT
Page 91
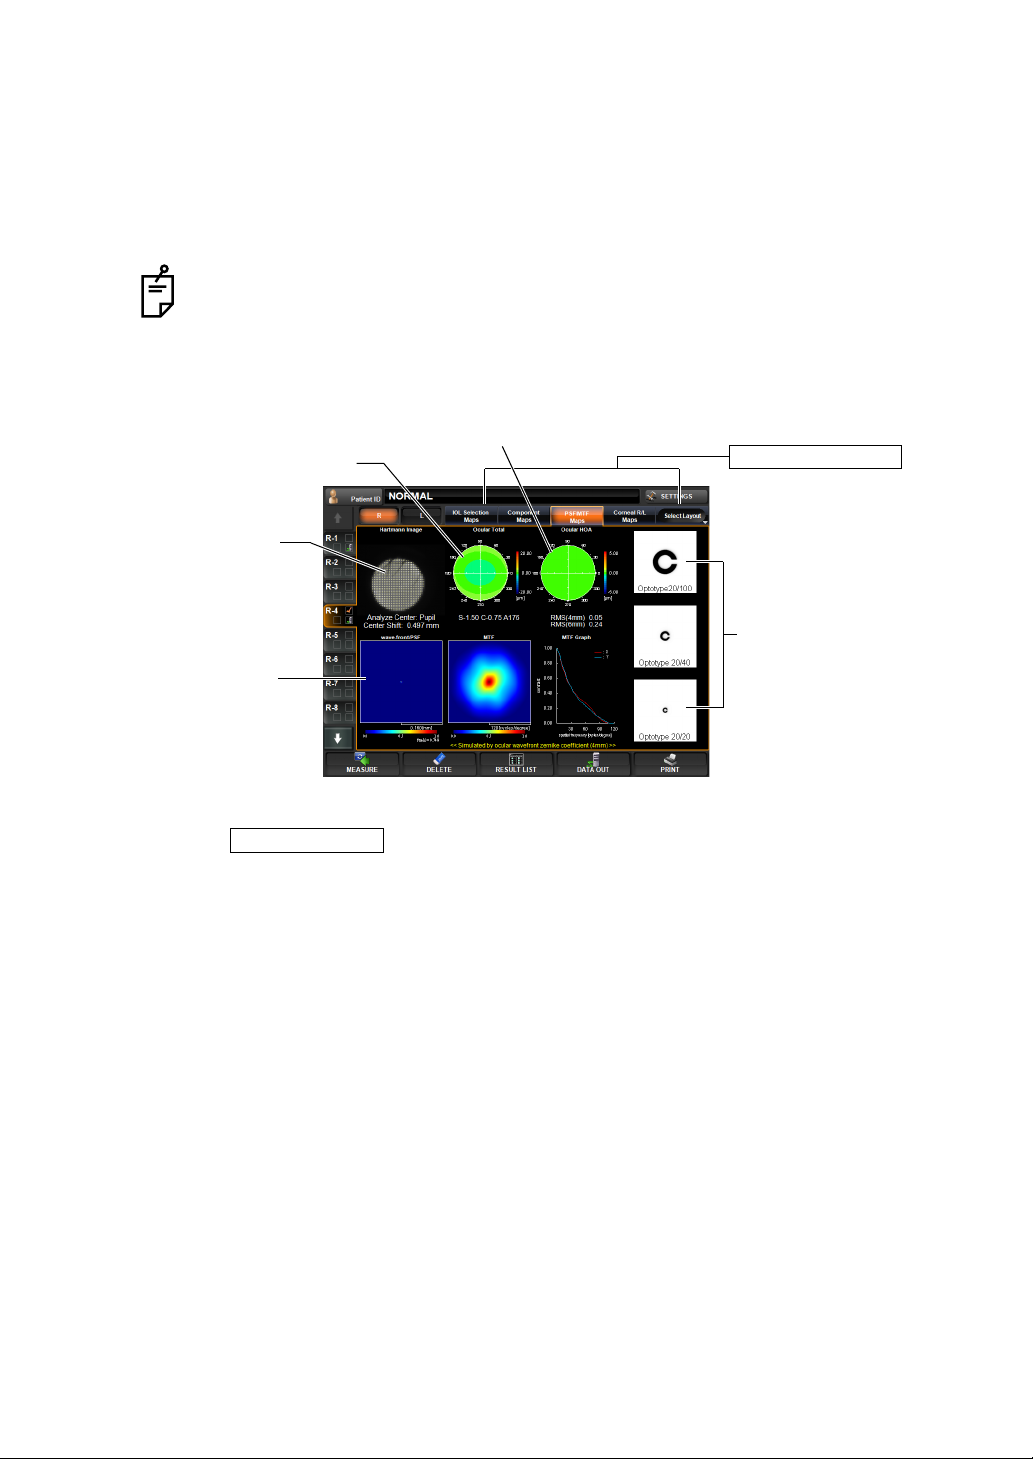
(11) Display of corneal astigmatic power
PSF/MTF Map
The value of corne al astigmatic power may be u sed as information
for making a decisio n in app lying a bifoc al IOL. The oper ation im age
can be enlarged.
Operation: • When tapped, the image is enl arged. (See "ENLARGEMENT DIS-
PLAY" on page 94.)
The Character color of measurement values of (8) to (11) can be changed when
the measurement result exceeds the set threshold value.
Refer to page 101 for concept of threshold and how to set threshold value.
PSF/MTF MAP
The PSF/MTF map can be displayed.
(2) Ocular total aberration map
(1) Hartmann image
(4) Wave-front/PSF
image, MTF image
and graph
(3) Ocular HOA map
Layout Change button
(5) Simulation
To ch ange displ ay: Tap the Select Layout button (at the rightmost of Layout Chan ge buttons) ,
and tap the
button from the pull down menu.
To change display to another map: Tap the Layout Change.
(1) Hartmann image (See "Hartma nn Imag e" on page 79.)
Operation: • When tapped, the image is enl arged. (See "ENLARGEMENT DIS-
PLAY" on page 94.)
• When dragged in the right-left direction, the overlay can be
changed. (See page
98.)
(2) Ocular total aberration map
(See "Ocular Total Aberration Map" on page 80.)
Operation: • When tapped, the image is enl arged. (See "ENLARGEMENT DIS-
PLAY" on page 94.)
• The map display step can be changed. (See "SETTING THE
TOTAL ABERRATION MAP DISPLAY STEP (TOTAL ABERRATION MAP RANGE)" on page 146.)
89
DISPLAYING THE MEASUREMENT RESULT
Page 92
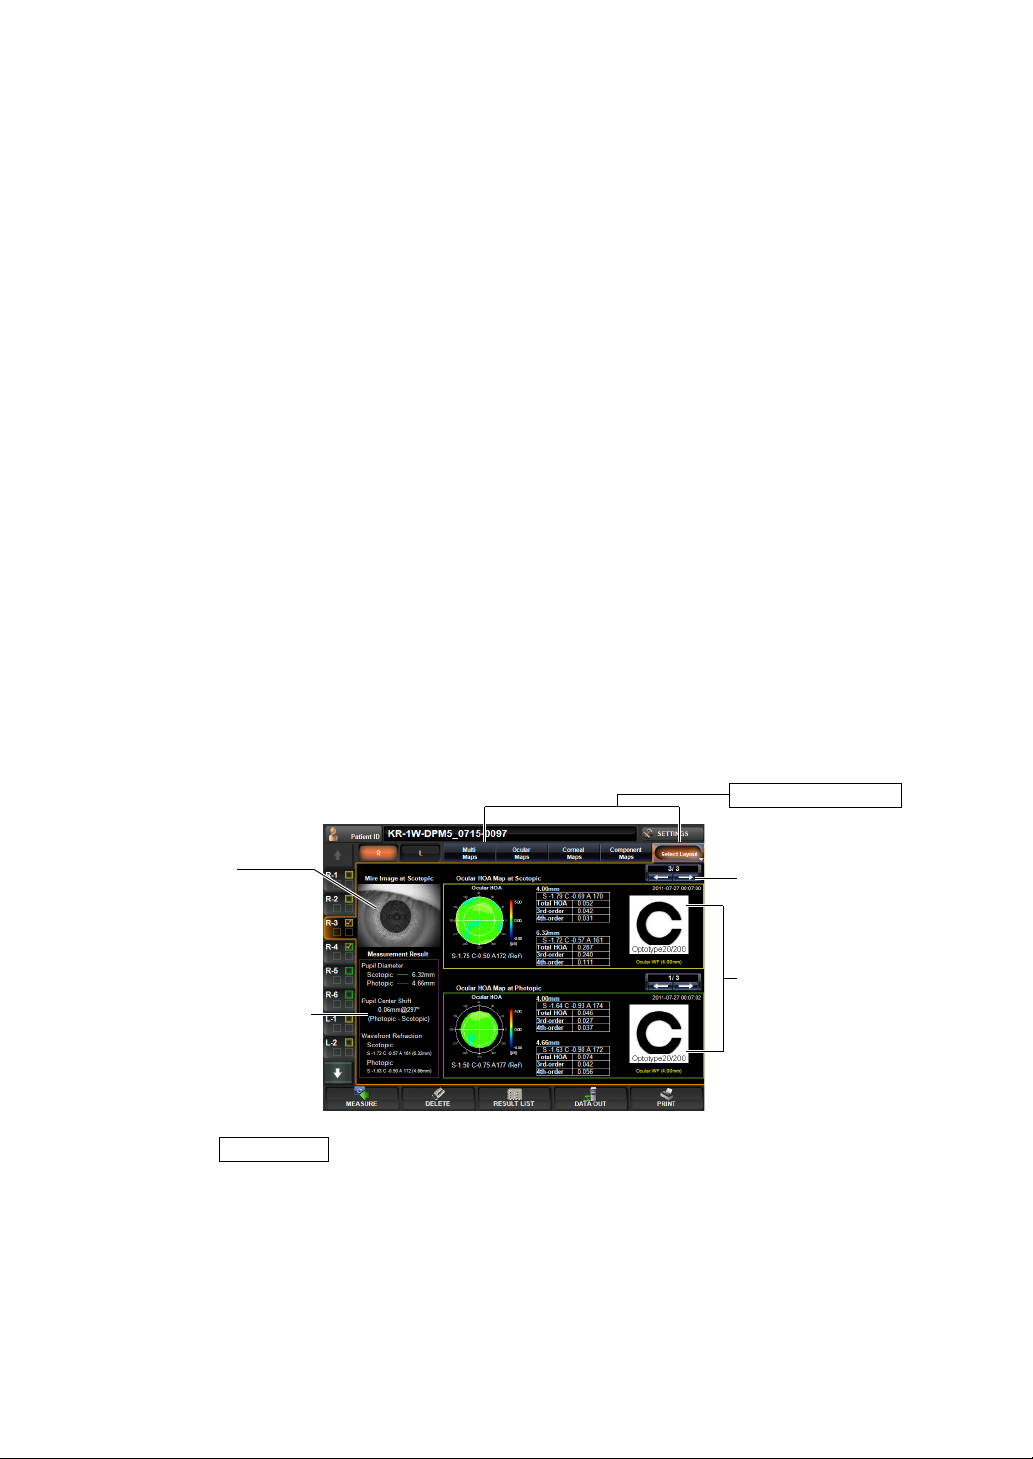
(3) Ocular HOA map (See "Ocular High Order Aberration Map" on page 80.)
ANALYZE
Operation: • When tapped, the image is enl arged. (See "ENLARGEMENT DIS-
PLAY" on page 94.)
• The map display step can be changed. (See "SETTING THE HIGH
ORDER ABERRATION ASTIGMA MAP DISPLAY S TEP" on page
147.)
(4) Wave-front/PSF image, MTF image and graph
Image formation of light on the retin a is displ ayed. (See "Referen ce:
PSF, MTF" on page
110.)
Operation: • When tapped, the image is enl arged. (See "ENLARGEMENT DIS-
PLAY" on page 94.)
(5) Simulation (See "Simulation" on page 82.)
Operation: • When tapped, the image is enl arged. (See "ENLARGEMENT DIS-
PLAY" on page 94.)
• The orientation of the optotypes can be changed.
(See "SETTING OPTOTYPE DIRECTION" on page 152.)
• The vision of each chart can be changed. (See "SETTING OPTOTYPE SIMULATION 1 (UPPER)" on page 151.)
• To normalize the brightness or not can be changed. (See "SETTING THE NORMALIZATION OF BRIGHTNESS OF SIMULATION
(NORMALIZE DESTINY OF SIMULATIONS)" on page 152.)
PUPILLOMETRY MAP
Data of measurement by the Pupillometry mode can be confirmed.
Pupillometry map can be selected under pupillometry mode measuring only.
Layout Change button
(1) Mire Image
(2) Difference information
(4) Data Feed button
(3) RMS (4mm/pupil diam-
eter), Simulation (pupil
diameter, 4th-order)
When the button i s tapped after finishing the pupil measurem ent on the Pupillometry screen, the Pupillometry map is displayed.
When the Pupillometry screen is selected, of the d ata measured by Scotopic, data with the
largest change in pupil diamet er are selec ted and displ ayed.
To change the display to other maps: Tap the Layout change button.
90
DISPLAYING THE MEASUREMENT RESULT
Page 93

(1) Mire Image (Scotopic)
(See "Mire image" on page 79.)
The data with the largest pupil diameter measured by Scotopic is displayed.
In the Mire image, a ngle scale, pu pil frame (Scotopi c and Photopic)
and pupil center posi tion are overlay-displayed in colors (Scotopic :
yellow, Photopic: green). Overlay information can be set to ON/OFF.
Operation: • When tapped, the image is enl arged. (See "ENLARGEMENT DIS-
PLAY" on page 94.)
• When dragged in the right direction, the overlay can be changed.
• TOPO MAP overlay can be displayed.(See page 100.)
Overlay information can be set to ON/OFF on the SETTINGS
screen "DISPLAY". See page
(2) Difference Information
As difference informatio n, pupil diameter by Scotopic an d Photopic,
deviation of cen ter coordinates (distance @ direc tion) and SCA cal
culated from wavefront aberration are displayed.
(3) RMS (4mm/pupil diameter), Simulation (pupil diameter, 4th-order)
From the data of three measurements performed by Scotopic and
Photopic respectiv ely, one result is sele ctively displayed. Measure
ment data can be changed by tapping the
displayed at the upper part.
(According to the selected data, information of (1) and (2) are
updated.)
For each data, HOA map, RMS (4mm/pupil diameter), Simulation
(4th order) dealing wi th pupil diameters up to 4mm as the an alysis
range, and the date of measurement are displayed.
(4) Data Feed button Moves to the analysis r esult to th e next data, or r eturns to the previ-
ous data. (The information on (1), (2) and (3) is updated according to
the selected data.)
145.
Page Change button
-
-
Simulation deals with pupil diameters up to 4mm as the analysis range. Even
when the pupil diameter is 5mm or more, the maximum analysis area is 4mm.
For the Mire image, the pupil overla y is not displ ayed when the setting is OFF. To
enable the overlay, tap the
Detection overlay " of the SET TINGS scre en "DISPLAY," and tap an d select "ON"
of the
Setting Change button
Set Condition button
.
of the set item display "Pupil
91
DISPLAYING THE MEASUREMENT RESULT
Page 94

CORNEAL R/L MAP
The Corneal R/L map can be displayed.
Layout Change button
Right eye
Typical KRT value
(1) Mire Image
(3) K RT value
(4) Measurement value
Left eye
(2) Data Feed button
To change display: Tap the Layout Select button, the rightmost button of layout
change buttons, and tap the
CORNEAL R/L MAPS
but-
ton of the displayed pull-down menu.
To change display to other map: Tap the Layout Change button.
(1) Mire Image (See "Mire image" on page 79.)
Operation: • When tapped, the image is enl arged. (See "ENLARGEMENT DIS-
PLAY" on page 94.)
• When dragged in the right direction, the overlay can be changed.
• TOPO MAP overlay can be displayed.(See page 100.)
Overlay information can be set to ON/OFF on the SETTINGS
screen "DISPLAY". See page
145.
(2) Data Feed button Moves to the analysis r esult to th e next data, or r eturns to the previ-
ous data.
(3) KRT value KRT Value of current displayed mire image.
(4) Measurement valueThe measure d pupil diameter and tables showing the coma aber ra-
tion, spherical aberration and total aberration, e-values and Q-values
in 4.00mm and 6.00 mm ana lysis zo nes are display ed. (For e-values
and Q-values, see page
83.)
When the TopoMap ove rlay (page 100) is applied to the corneal Mire i mage, a
color scale is displayed between the right and left corneal Mire images.
92
DISPLAYING THE MEASUREMENT RESULT
Page 95

OCULAR R/L MAP
The Ocular R/L map can be displayed.
Layout Change button
Right eye
Typical REF value
(2) Ocular HOA map
(4) Simulation
(5) Hartmann image
(3) RE F value
(6) Measurement value
Left ey e
(1) Data Feed button
To change display: Tap the Layout Select button, the rightmost button of layout
change buttons, a nd tap the
OCULAR R/L MAPS
of the displayed pull-down menu.
To change display to other map: Tap the Layout Change button.
(1) Data Feed button Moves to the analysis r esult to th e next data, or r eturns to the previ-
ous data.
(2) Ocular HOA map (See "Ocular HOA map" on page 86.)
button
Operation: • When tapped, the image is enl arged. (See "ENLARGEMENT DIS-
PLAY" on page 94.)
• The map display step can be changed. (See "SETTING THE HIGH
ORDER ABERRATION ASTIGMA MAP DISPLAY S TEP" on page
147.)
(3) REF Value REF Value of current displayed data.
(4) Simulation (See "Simulation" on page 82.)
Operation: • When tapped, the image is enl arged. (See "ENLARGEMENT DIS-
PLAY" on page 94.)
• The orientation of the optotypes can be changed.
(See "SETTING OPTOTYPE DIRECTION" on page 152.)
• The vision of each chart can be changed. (See "SETTING OPTOTYPE SIMULATION 1 (UPPER)" on page 151.)
• To normalize the brightness or not can be changed. (See "SETTING THE NORMALIZATION OF BRIGHTNESS OF SIMULATION
(NORMALIZE DESTINY OF SIMULATIONS)" on page 152.
(5) Hartmann image (See "Hartmann image" on page 79.)
Operation: • When tapped, the image is enl arged. (See "ENLARGEMENT DIS-
PLAY" on page 94.)
• When dragged in the righ t direction, the overlay can be changed.
(See page
98.)
93
DISPLAYING THE MEASUREMENT RESULT
Page 96

(6) Measurement valueThe measured pupil diameter, and the coma aberration, spherical
OK button
OK button
aberration, total high order aberration, and S/C/A values in 4.00mm
and 6.00mm analysis zones are displayed.
ENLARGEMENT DISPLAY
When tapped, the map display is enlarged.
• To return to the original screen, drag the map downward, or tap the .
For the operation of the control panel, see "OPERATION METHOD OF CONTROL PANEL"
on page 13.
EXAMPLE: TOTAL ABERRATION
The following items are displayed at the top left
of the screen:
• Coordinate values (distance and angular
direction from the center)
• Aberration value
Near the "Map Setting" displayed on the
right, the following display setting can be
done:
• Display step
The display step i s set.
Zoom Down button Map settings
Zoom Down button
1 By pressing the Map Range button,
ten keys are displayed.
2 Enter the number and tap the : the setting is done.
• Overlay setting
1 By pressing the Overlay settings button, the following overlay buttons are displayed:
• Map overlay (cross scale)
• Map overlay (angle scale)
• Map overlay (mm grid scale)
2 Tap on the button of the desired overlay to be turned ON, and press the : the
overlay is displayed on the map.
94
DISPLAYING THE MEASUREMENT RESULT
Page 97

EXAMPLE: HIGH ORDER ABERRATION
The following items are displayed at the top left
of the screen:
• Coordinate values (distance and angular
direction from the center)
• Aberration value
Near the "Map Setting" displayed on the
right, the following display setting can be
done:
• Display step
• Overlay setting
The contents and method of setting are the
same as "Example: Total Aberration."
Items set by "Map Settin g," dis play ed o n the ri ght sid e of th e enl ar ge men t dis pl ay,
can also be set b y the it ems of " DISPLAY" of the "SETTINGS s creen." S ee "
PLAY SETTING (DISPLAY)" on page 142.
Map settings
DIS-
EXAMPLE: AXIAL POWER MAP
The following items are displayed at the top left
of the screen:
• Distance Map Center To Pupil Center:
Pupil coordinate values (distance from the
pupil center)
• Axis Map Center To Pupil Center:
Pupil coordinate values (angular direction
from the pupil center)
• Distance Map Center:
Cornea coordinate val ues (angular di rection
from the cornea center)
• Distance Pupil Center:
Cornea coordinate values (distance from the
cornea center)
• Axis Map Center:
Pupil-cornea coordinate difference (distance)
• Axis Pupil Center :
Pupil-cornea coordinate difference (angular direction)
• Power:
Corneal refractive power
•Radius:
Corneal curvature radius.
Near the "Map Setting" displayed on the right, the following display setting can be done:
Map settings
95
DISPLAYING THE MEASUREMENT RESULT
Page 98

• Display unit
1 By pressing the button, the display unit is changed to "mm" or "D."
•Scale type
1 Each time the button is pressed, "Absolute," "Adjustable" and "Normalized" are changed.
•Step
The display step i s set.
The contents and method of setting are the same as "Example: Total Aberration."
• Overlay setting
1 By pressing the button, the following overlay buttons are displayed:
• Map overlay (cross scale)
• Map overlay (angle scale)
• Map overlay (mm grid scale)
• Map overlay (pupil)
2 Tap on the button of the desired overla y, and press the : the overlay is dis-
played on the map.
• Kerato axis
OK button
1 Each time the button is pressed, "None" and "Sim-K axis" of the Kerato axis are changed.
Items set by "Map Settin g," dis play ed o n the ri ght sid e of th e enl ar ge men t dis pl ay,
can also be set b y the it ems of " DISPLAY" of the "SETTINGS s creen." S ee "
PLAY SETTING (DISPLAY)" on page 142.
DIS-
HARTMANN IMAGE AND MIRE IMAGE
By tapping and dragging e ach image to th e right, th e context m enu related to the map is displayed for overlay-d isplaying detection c onditions, copying the ima ge, etc. (See "ANALYSIS
SETTING MENU" on page 97.)
Hartmann image Mire image
(Overlay-displayed net) (Overlay-displayed ring/pupil)
When the corneal Mir e image is enla rged and display ed from the cor neal aberration map and IOL selection ma p, the overlay cannot be ch anged by dragging the
image. Besides, part of display items of " Map Set ting" i s different. For details , see
page
100.
Map settings
Map settings
96
DISPLAYING THE MEASUREMENT RESULT
Page 99

Near the "Map Setting" displayed on the right, the following display setting can be done:
• Hartmann detection point overlay (Hartmann image)
When turned on, Hartmann detection point is displayed with a yellow cross scale.
• Hartmann detection grid overlay (Hartmann image)
When turned on, Hartmann detection grid is displayed with a white square.
• Placido ring detection overlay (Mire image)
When turned on, the detected Placido ring is displayed.
• Pupil detection overlay (Mire image)
When turned on, the detected pupil is displayed with a yellow circle.
• Angle Scale Overlay (Corneal Mire image)
When turned to ON, an angle scale is displayed.
Items set by "Map Settin g," dis play ed o n the ri ght sid e of th e enl ar ge men t dis pl ay,
can also be set b y the it ems of " DISPLAY" of the "SETTINGS s creen." S ee "
PLAY SETTING (DISPLAY)" on page 142.
ANALYSIS SETTING MENU
Settings can be changed from the SETTINGS screen.
SETTING TOPOMAP SCALE TYPE
• The map s cale can be changed in the SETTINGS menu. See "SETTING THE TOPOMAP
SCALE TYPE (TOPOMAP SCALE - TYPE)" on page 149.
DIS-
SETTING ABERRATION MAPS
• The overla y obje ct can be c hanged in the SET TINGS me nu (cross s cale, ang le scal e, mm
grid scale). See "
on page 147.
SETTING SIMULATION
Settings can be changed from the SETTINGS screen.
• Eyesight value can be changed.
See "SETTING OPTOTYPE SIMULATION 1 (UPPER)" on page 151.
• For the chart, the direction can be changed to top, bottom, left and right.
See "SETTING OPTOTYPE DIRECTION" on page 152.
• Brightness may be normalized. I n the initial state, it is not normalized. When n ormalized,
Landolt's ring is contrasted and the direction of blur is made more clearly visible. It is
assumed that, when not normalized, the image is less contrasted by blur and seen nearer.
See "SETTING THE NORMALIZATION OF BRIGHTNESS OF SIMULATION (NORMALIZE
DESTINY OF SIMULATIONS)" on page 152.
SETTING THE TOTAL ABERRATION MAP OVERLAY - CROSS SCALE"
97
DISPLAYING THE MEASUREMENT RESULT
Page 100
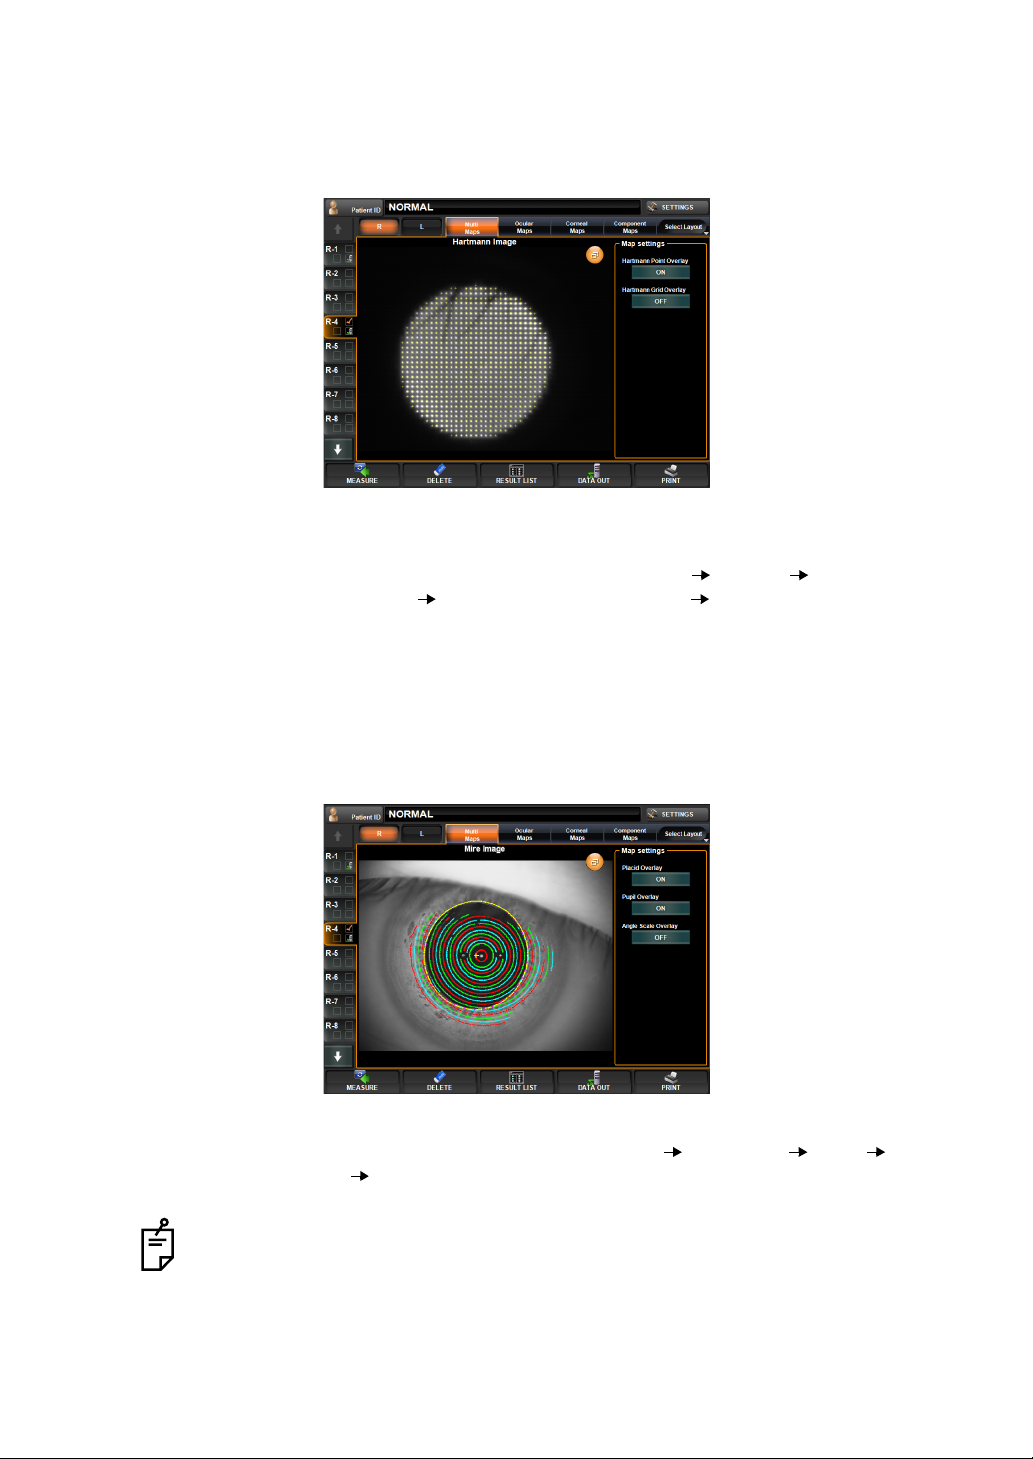
SETTING OVERLAY OF HARTMANN IMAGE, MIRE IMAGE
EXAMPLE: HARTMANN IMAGE
The image used for point image detection can be confirmed.
(Example: Overlay display)
Operation: • When the image is tapped and dragged to the right, the overlay
condition can be changed as None
square Cross/Enclose with square None in this order.
EXAMPLE: MIRE IMAGE
(Overlay-displayed ring/pupil image)
You can confirm how ring detection is performed. There are a total of 19 rings, and since rings
are colored and over la id , it is possible to c onfirm the detecti on con di tio n. Ri ngs a re co lor e d in
red, green and blue starting from the inside and mov ing out so th at the oute rmost rin g is col
ored in red. The pupil is yellow-overlayed.
Cross Enclose with
-
Operation: • When the image is tapped and dragged to the right, the overlay
condition can be changed as None
None in this order.
When the corneal Mir e image is enla rged and display ed from the cor neal aberration map and IOL selection ma p, the overlay cannot be ch anged by dragging the
image. Besides, part of display items of " Map Set ting" i s different. For details , see
page
100.
98
DISPLAYING THE MEASUREMENT RESULT
Ring/pupil Ring Pupil
 Loading...