

Page 1
Frequency Counters
SR620 Universal time interval and frequency counter
· 25 ps single-shot time resolution
· 1.3 GHz frequency range
· 11-digit frequency resolution (1 s)
· 0.001° phase resolution
· Statistical analysis & Allan variance
· Graphical output to X-Y scopes
· Hardcopy to printers and plotters
· GPIB and RS-232 interfaces
· Optional ovenized timebase
· SR620 ... $4950
(U.S. list)
The SR620 Time Interval Counter performs virtually all of the
time and frequency measurements required in a laboratory or
ATE environment. The instrument's single-shot timing
resolution and low jitter make it the counter of choice for
almost any application.
SR620 Measurements
The SR620 measures time interval, frequency, pulse-width,
rise and fall time, period, phase and events. Time intervals are
measured with 25 ps rms resolution, making the SR620 one of
the highest resolution counters available. Frequency is
measured from 0.001 Hz to 1.3 GHz, and a choice of gates
ranging from 1 period to 500 seconds is provided. The SR620
delivers up to 11 digits of frequency resolution in one second,
making it suitable for measurement applications ranging from
short-term phase locked loop jitter, to the long-term drift of
atomic clocks. All measurement modes are supported by a
wide variety of flexible arming and triggering options.
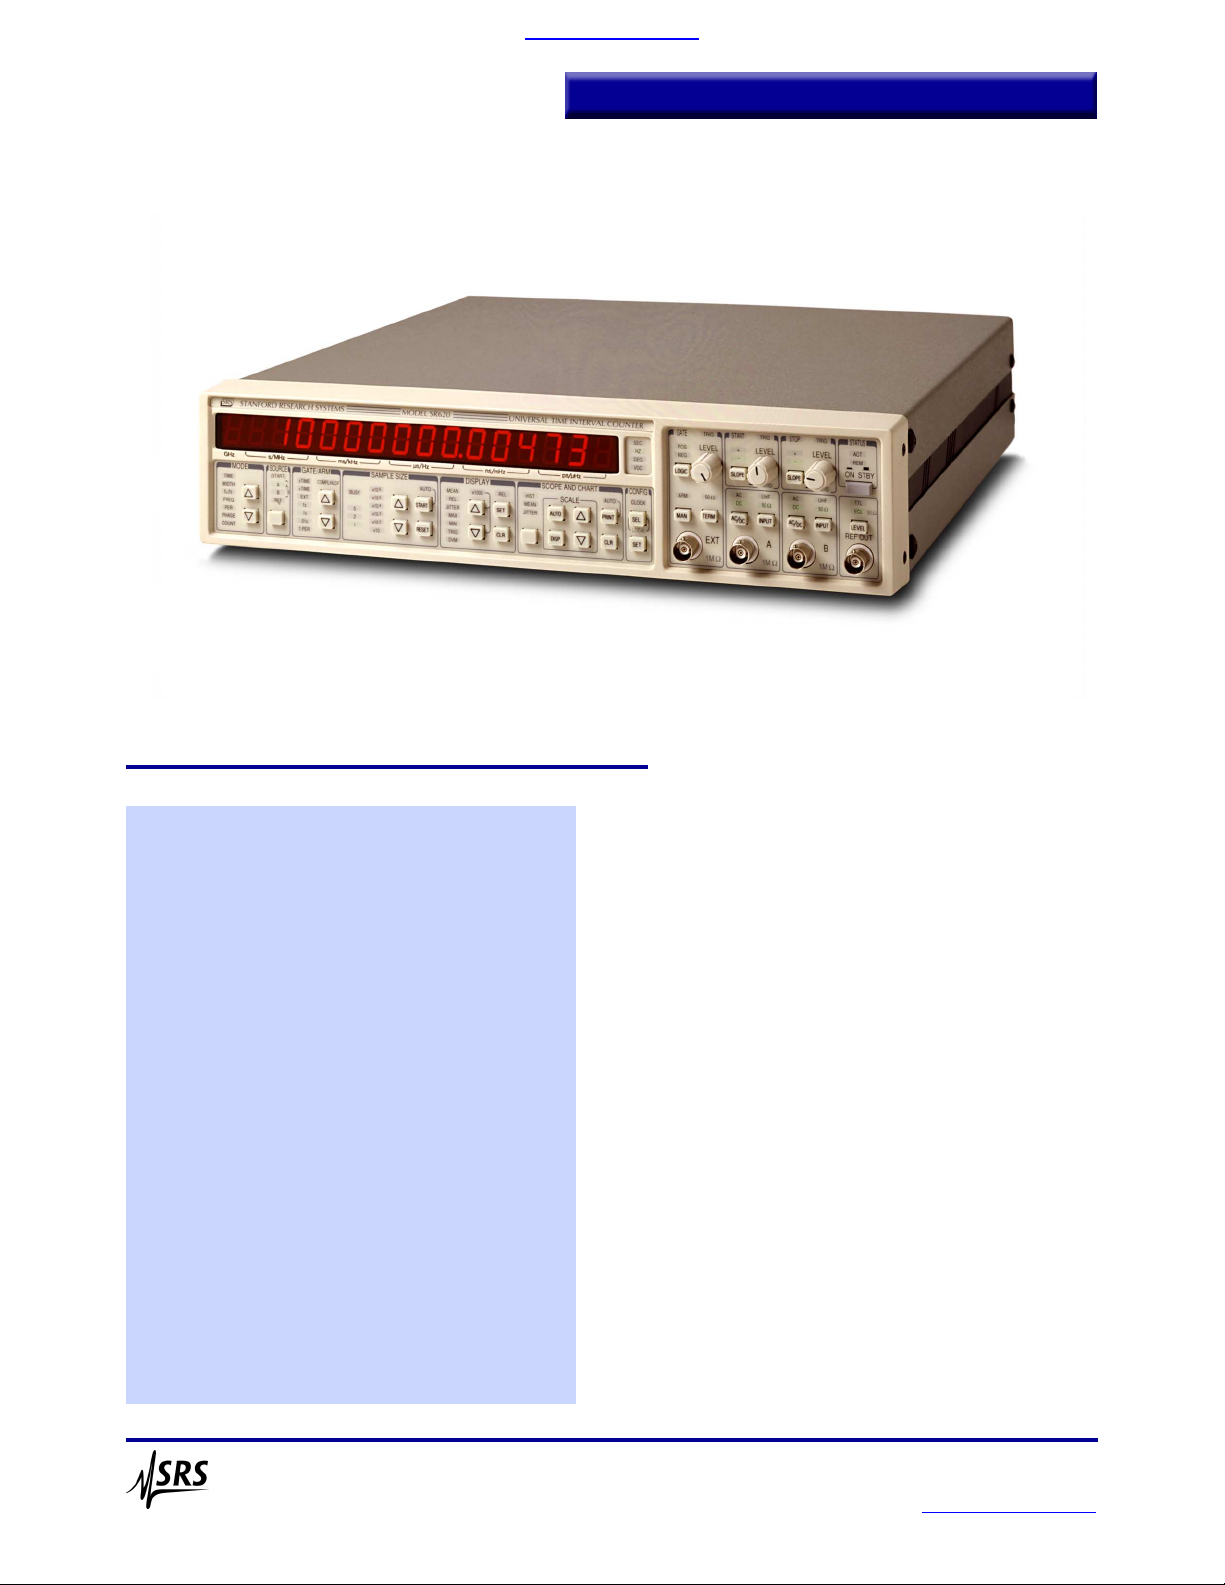
Histograms and Strip Charts
Unlike conventional counters that only have numeric displays,
the SR620 provides live, graphical displays of measurement
results. Graphical data is available in three formats: a histogram
showing the distribution of values within a set of
measurements, a strip chart of mean values from successive
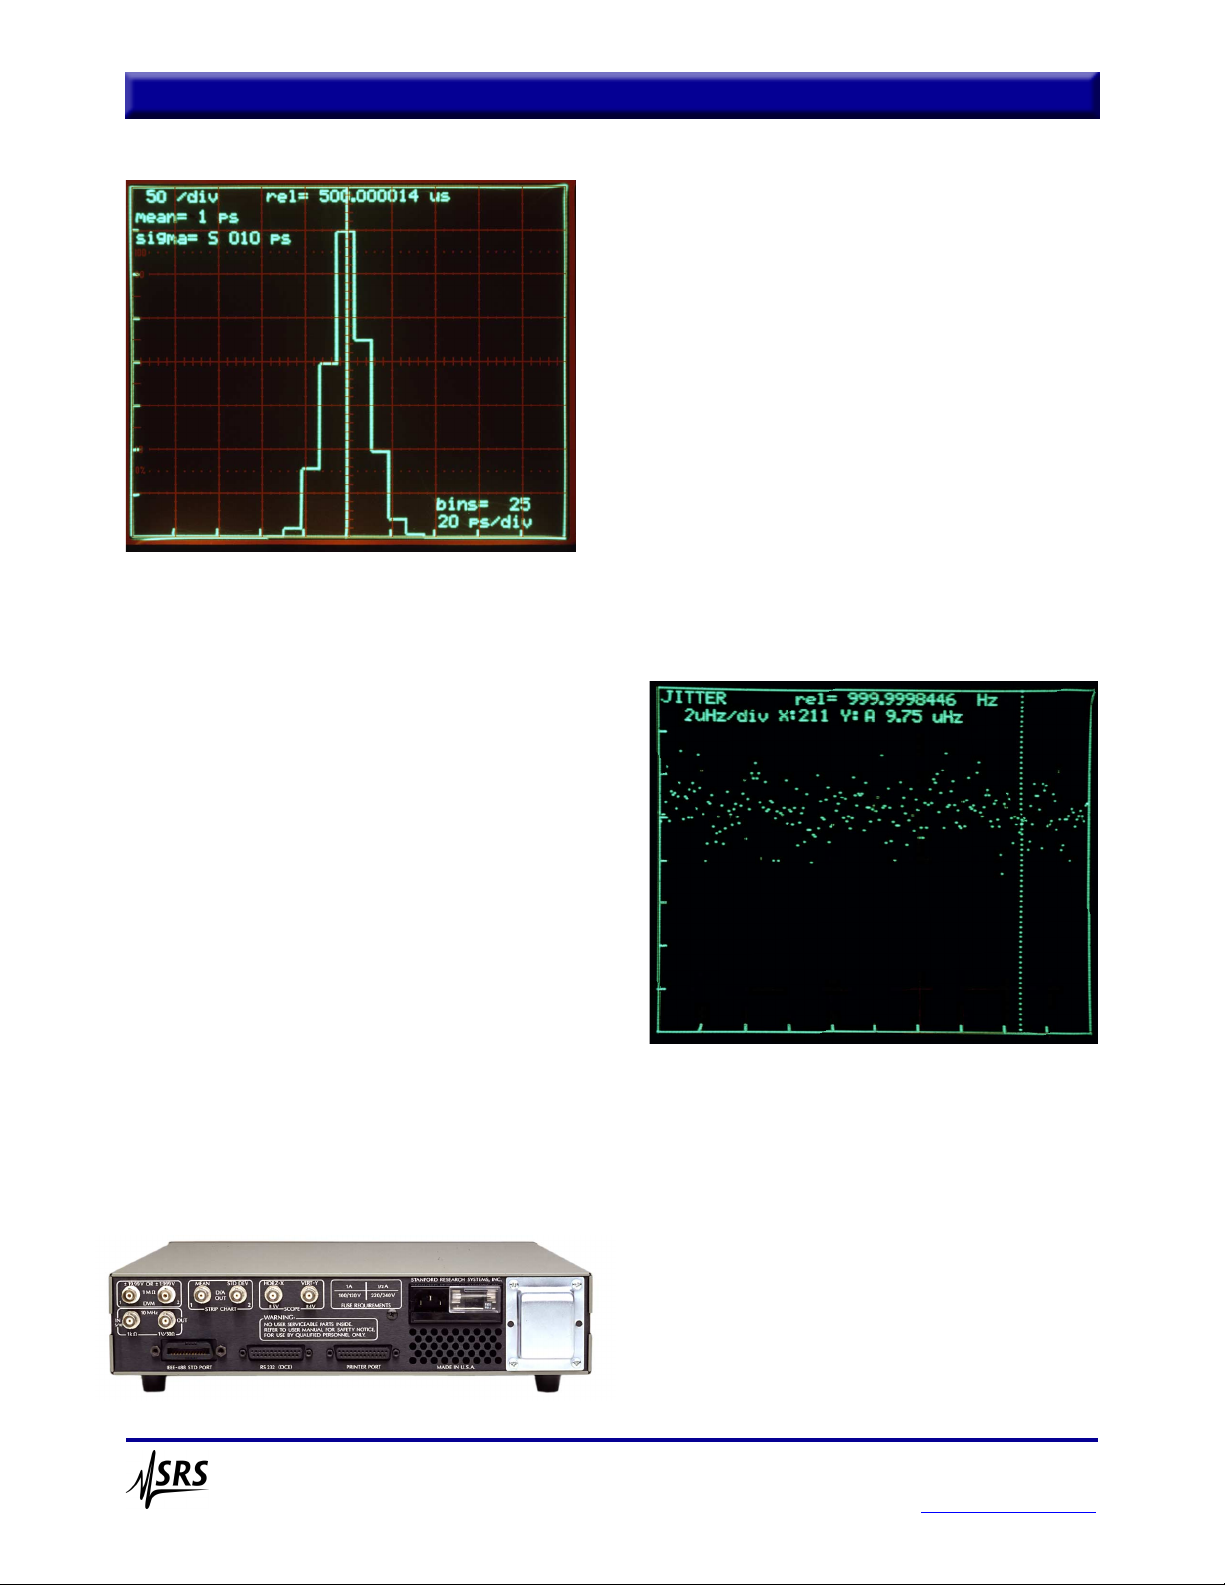
measurements, or a strip chart of jitter (standard deviation or
Allan variance) values from successive measurements. Up to
250 strip-chart points or histogram bins can be displayed.
SR620 Time Interval & Frequency Counter
www.thinkSRS.com
Stanford Research Systems phone: (408)744-9040
www.thinkSRS.com
Page 2
Both histograms and strip charts can be displayed on any
oscilloscope with an X-axis input (see pictures), or can be
plotted on an HP-GL compatible plotter or dot-matrix printer.
Convenient cursors allow you to read the value of any data
point in the histogram or strip chart. Autoscale and zoom features make it simple to display all, or any portion, of the graphs.
Complete Statistical Calculations
The SR620 can make measurements on a single-shot basis, or
calculate the statistics of a set of measurements. Sample sizes
from one to one million can be selected. The SR620 will
automatically calculate the mean, standard deviation or Allan
variance, minimum and maximum for each set of measurements.
Reference Output
A precision 50 % duty cycle square wave (1 kHz) is available
at the front-panel REF output. The REF output can be used as
a source of start or stop pulses for any of the SR620's
measurement modes. For instance, the length of a cable
connected between REF and the B input can be precisely
determined by measuring the time delay between REF and B.
Built-In DVMs and Analog Outputs
Two rear-panel DVM inputs make measurements of DC
voltages with 0.3 % accuracy (±20 VDC range). These values
may be read via the interfaces or displayed directly on the
front panel.
Two DAC outputs continuously provide voltages proportional
to the mean and the jitter of the measurement sample. These
0 to 10 V outputs can drive strip-chart recorders, or they can
be set to provide fixed or scanned output voltages.
Built-In Auto-Calibration
A sophisticated, built-in auto-calibration routine nulls
insertion delays between start and stop channels, and
compensates for the differential nonlinearites inherent in
analog time-measurement circuitry. The auto-calibration
routine takes about two minutes to perform, and should be run
every 1000 hours of operation.
10 MHz Reference
The choice of timebase affects both the resolution and
accuracy of measurements made with the SR620. SRS offers
a standard timebase with an aging coefficient of 1 × 10
−6
/year,
or an optional ovenized-oscillator timebase with only
5 × 10
−10
/day aging and about an order of magnitude better
short-term stability than the standard timebase. A rear-panel
input lets you connect any external 5 MHz or 10 MHz source
as a timebase.
Computer Interfaces
Standard GPIB (IEEE-488.2) and RS-232 interfaces allow
remote control of the SR620. All instrument functions and
configuration menu settings are accessible via the interfaces.
A fast binary dump mode outputs up to 1400 measurements
per second to a computer. A parallel printer port allows direct
printing from the instrument. Standard IEEE-488.2
communications are supported, and plotter outputs are
provided in HP-GL format. For debugging, the last 256
characters transmitted over the interfaces can be viewed on
the front panel.
SR620 Time Interval/Frequency Counter
Stanford Research Systems phone: (408)744-9040
www.thinkSRS.com
Histogram display
Allan variance plot
SR620 rear panel
Page 3

SR620 Specifications
Stanford Research Systems phone: (408)744-9040
www.thinkSRS.com
Timebase
Standard Option 01
Frequency 10.000 MHz 10.000 MHz
Type TCVCXO Ovenized VCXO
Aging 1 × 10
−6
/yr. 5 × 10
−10
/day
Allan variance (1 s) 3 × 10
−10
(typ.) <5 × 10
−12
Stability (0 to 50 °C) 1 ppm <2 × 10
−9
Settability 0.01 ppm 0.001 ppm
External timebase User may supply 5 or 10 MHz
timebase (1 V nominal)
Time Interval, Width, Rise and Fall Times
Range −1000 s to +1000 s in ±TIME mode
−1 ns to +1000 s in all others modes
Trigger rate 0 to 100 MHz
Display LSD 4 ps single sample, 1 ps with avg.
Resolution
Standard timebase (((25 ps typ. [50 ps max.])
2
+
(0.2 ppb × Interval)
2
) / N)
1/2
rms
Option 01 (((25 ps typ. [50 ps max.])
2
+
(0.05 ppb × Interval)
2
) / N)
1/2
rms,
(N = sample size)
Error <±(500 ps typ. [1 ns max.] +
Timebase Error × Interval +
Trigger Error)
Relative error <±(50 ps typ. [100 ps max.] +
Timebase Error × Interval)
Arming modes +TIME (Stop is armed by Start)
+TIME EXT (Ext arms Start)
+TIME EXT HOFF (Leading EXT
edge arms Start, trailing EXT
edge arms Stop)
±TIME (Armed by Start/Stop pair),
±TIME CMPL (Armed by
Stop/Start pair)
±TIME EXT (Armed by EXT
input edge)
EXT arming may be internally
delayed or scanned with respect to
the EXT input in variable steps. The
step size may be set in a 1−2−5
sequence from 1 µs to 10 ms. The
maximum delay is 50,000 steps.
Display 16-digit fixed point with 1 ps LSD
Sample rate N × (800 µs + measured time
interval) + calculation time
(N = sample size)
The calculation time occurs only
after N measurements are completed
and varies from zero (N = 1, no
graphics, binary) to 5 ms (N = 1, no
graphics) to 10 ms (display mean or
standard dev.) to 60 ms (histogram).
Frequency
Range 0.001 Hz to 300 MHz via comparator
inputs. 40 MHz to 1.3 GHz via
internal UHF prescalers.
RATIO A/B range: 10
−9
to 10
3
Error <±((100 ps typ. [350 ps max.]) / Gate +
Timebase Error) × Frequency
Gates External, 1 period, 1 µs to 500 s in
1−2−5 sequence. Gates may be
externally triggered with no delay.
Gates may be delayed relative to an
EXT trigger. The delay from trigger
is set from 1 to 50,000 gate widths.
Display 16-digit fixed point with
LSD = Freq. × 4 ps / Gate. 1 µHz
maximum resolution (1 nHz with
×1000 for frequencies <1 MHz)
Period
Range 0 to 1000 s
RATIO A/B range: 10
−9
to 10
3
Error <±((100 ps typ. [350 ps max.]) / Gate +
Timebase Error) × Period
Gates Same as frequency
Display 16-digit fixed point, LSD = 1 ps
(1 fs with ×1000 for periods <1 s)
Phase
Definition Phase = 360 × (T
b
− Ta) / Period A
Range −180 to +180 degrees, 0 to 100 MHz
Resolution (25 ps × Freq. × 360 + 0.001)°
Gate 0.01 seconds (1 period min.) for
period measurement and 1 sample
for time interval measurement.
Period may also be measured using
externally triggered internal gates as
in frequency mode.
Error <±(1 ns × Freq. × 360 + 0.001)°
Counts
Range 10
12
, RATIO A/B range: 10−9to 10
3
Count rate 0 to 300 MHz
Gates Same as frequency
Display 12 digits
Inputs
Bandwidth 300 MHz (1.2 ns rise time)
Threshold −5.00 to +5.00 VDC
(10 mV resolution)
Accuracy 15 mV + 0.5 % of setting
Sensitivity see graph next page
Auto level Threshold set between peak input
excursions
(f > 10 Hz, duty cycle >10
−6
)
Slope Rising or falling edge
Impedance (1 MΩ + 30 pF) or 50 Ω
50 Ω termination has SWR < 2.5:1
from 0 to 1.3 GHz
Coupling AC or DC
(Ext is always DC coupled)
Page 4

Input noise 350 µVrms (typ.)
Prescaler see graph
Protection 100 V, 50 Ω terminator is released if
input exceeds ±5 Vp
REF Output
Frequency 1.00 kHz (accuracy same as timebase)
Rise/fall time 2 ns
Amplitude TTL: 0 to 4 V (2 V into 50 Ω)
ECL: −1.8 to −0.8 V into 50 Ω
DVM Inputs
Full scale (±1.999 or ±19.99) VDC
Type Sample & hold with successive
approximation converter
Impedance 1 MΩ
Accuracy 0.3 % of full scale
Speed Approximately 5 ms
D/A Outputs
Full scale ±10.00 VDC
Resolution 5 mV
Impedance <1 Ω
Default Voltage proportional to mean
and deviation
Accuracy 0.3 % of full scale
Graphics
Scope Two rear-panel outputs to drive x-y
analog oscilloscope
Displays Histograms and strip charts of mean
and jitter
X-axis −5 V to +5 V for 10 division deflection
Y-axis −4 V to +4 V for 8 division deflection
Resolution 250 (H) × 200 (V) pixels
Hardcopy Centronics port for dot-matrix
printers. RS-232, IEEE-488.2 for
HP-GL compatible plotters.
Interfaces
RS-232 300 baud to 19.2 kbaud. All instrument
functions may be controlled.
GPIB IEEE-488.2 interface. All instrument
functions may be controlled.
Speed Approximately 150 ASCII
formatted responses per second,
1400 binary responses per second
General
Operating 0 °C to 50 °C
Power 70 W, 100/120/220/240 VAC,
50/60 Hz
Weight, dimensions 11 lbs., 14" × 3.5" × 14" (WHD)
Warranty One year parts and labor on defects
in materials and workmanship
SR620 Specifications
Stanford Research Systems phone: (408)744-9040
www.thinkSRS.com
Ordering Information
SR620 Time interval & frequency counter $4950
(with rack mount kit)
Option 01 2 ppb OCXO timebase $950
Prescaler sensitivity
Input sensitivity
1
.1
Specification Limit
Comparator Sensitivity (V rms)
Typical
.01
1
10 100 1000
Frequency (MHz)
1
.1
Specification Limit
.01
Prescaler Sensitivity (V rms)
.001
Typical
0 100 200 300 400 500 600 700 800 900 1000 1100 1200 1300
Frequency (MHz)
Page 5

Time
In its most basic measurement mode, the SR620 measures the
time interval between a start and a stop pulse. Either of the
SR620's two inputs, or its REF output, may be selected as the
source of start and stop pulses. Internal and external gating
signals can be used to holdoff the acceptance of either start or
stop pulses. The SR620 can make both positive time
measurements (in which the stop pulse follows the start pulse)
and negative time measurements (in which the stop pulse
occurs before the start pulse).
Frequency
The SR620 measures frequency by the reciprocal frequency
counting technique. In other words, the instrument measures
the time interval for some integer number of input cycles, then
computes frequency by dividing the number of cycles by the
time interval. Since no fractional cycle measurements are
involved (as would be the case if the instrument measured the
number of cycles in a fixed time interval), extremely high
frequency resolution can be achieved (11 digits in 1 s). The
diagram below illustrates this method of computing
frequency. Both internal and external gates are supported.
Pulse Width
The width of pulses at either input can be measured. Separate
start and stop voltages can be selected for pulse width
measurements. Resolution and accuracy are the same as time
measurement mode.
Stanford Research Systems phone: (408)744-9040
www.thinkSRS.com
Transition Time
Rise and fall times of either input may be measured. Start and
stop thresholds may be set between ±5 V with 10 mV resolution.
The 300 MHz input bandwidth allows measurements of rise
and fall times as small as 1 ns.
Period
The SR620 can also measure the period of waveforms. Period
is measured similarly to frequency, but the reciprocal of
frequency is computed and displayed.
Phase
The phase angle between signals on the A and B inputs can be
measured with 0.001 degree resolution. You can measure the
phase of signals (at the same frequency) from 0.001 Hz to
100 MHz. The counter actually makes two measurements: a
frequency measurement of one channel, and a time
measurement of the delay of the second channel with respect
to the first. The phase is then computed as shown below.
Event Counting
The SR620 will also count transitions (events) at either of its
inputs. As with all the other modes, event counting may be
gated internally or externally, and both the voltage threshold
and slope for a transition are adjustable. Event rates up to
300 MHz can be counted with up to 12 digits of resolution.
The unit also has a ratio mode which will compute the ratio of
the number of events counted on the A and B inputs.
SR620 Time Interval & Frequency Counter
SR620 Measurement Modes
FREQUENCY/PERIOD
SIGNAL
2nd pulse after rising edge
GATE
Freq = N/∆t
Period = ∆t/N
N cycles
∆
t
2nd pulse after falling edge
1 < N < 10
5ns < ∆t < 1000s
12
WIDTH: +Time Arming
RISE/FALL TIMES: +Time Arming
V
STOPVSTART
tt
rf
V
STOP
SIGNAL
V
START
PHASE
A
B
GATE
N cycles
∆t
1
PHASE =
360 x ∆t
∆t /N
1
∆t
2
2
SIGNAL
V
START
V
STOP
T
W
 Loading...