

Page 1

EM3555
Bi-Directional Compact Power and Energy Meter
Installation Guide
ZL0093-0A
11/2011
Page 2
EM3555
HAZARD CATEGORIES AND
SPECIAL SYMBOLS
ZL0093-0A
11/2011
Read these instructions carefully and look at the equipment to become familiar
with the device before trying to install, operate, service or maintain it. The
following special messages may appear throughout this bulletin or on the
equipment to warn of potential hazards or to call attention to information that
clarifies or simplifies a procedure.
The addition of either symbol to a “Danger” or “Warning” safety label indicates
that an electrical hazard exists which will result in personal injury if the
instructions are not followed.
This is the safety alert symbol. It is used to alert you to potential personal injury
hazards. Obey all safety messages that follow this symbol to avoid possible
injury or death.
DANGER
DANGER indicates an imminently hazardous situation which, if not
avoided, will result in death or serious injury.
WARNING
WARNING indicates a potentially hazardous situation which, if not
avoided, can result in death or serious injury.
PLEASE NOTE
FCC NOTICE
CAUTION
CAUTION indicates a potentially hazardous situation which, if not
avoided, can result in minor or moderate injury.
CAUTION
CAUTION, used without the safety alert symbol, indicates a potentially
hazardous situation which, if not avoided, can result in property
damage.
NOTE: Provides additional information to clarify or simplify a
procedure.
Electrical equipment should be installed, operated, serviced, and maintained
only by qualified personnel. No responsibility is assumed by Schneider Electric
for any consequences arising out of the use of this material.
This equipment has been tested and found to comply with the limits for a
Class B digital device, pursuant to part 15 of the FCC Rules. These limits
are designed to provide reasonable protection against harmful interference
when the equipment is operated in a residential environment. This equipment
generates, uses, and can radiate radio frequency energy and, if not installed
and used in accordance with the instruction manual, may cause harmful
interference to radio communications. Operation of this equipment in a
residential area is likely to cause harmful interference in which case the user will
be required to correct the interference at his own expense.
This Class B digital apparatus complies with Canadian ICES-003.
© 2011 Schneider Electric All Rights Reserved.
Page 3

ZL0093-0A
11/2011
EM3555
Contents
CONTENTS
Safety Precautions .............................................................................................. 1
Installation Overview ........................................................................................... 1
Specications ...................................................................................................... 2
Introduction ......................................................................................................... 4
Parts of the EM Series ........................................................................................ 4
Dimensions ......................................................................................................... 5
Data Output ........................................................................................................ 6
Installation ........................................................................................................... 7
Supported System Types .................................................................................... 8
Wiring .................................................................................................................. 9
Wiring Diagrams ............................................................................................... 10
Control Power ....................................................................................................11
Fuse Recommendations ....................................................................................11
Wiring Notes ......................................................................................................11
Display Screen Diagram ................................................................................... 12
Quick Setup Instructions ................................................................................... 13
Solid State Pulse Output ................................................................................... 14
User Interface Menu Abbreviations Dened ..................................................... 15
User Interface for Data Conguration ............................................................... 16
Alert/Reset Information ..................................................................................... 18
User Interface for Setup .................................................................................... 19
RS-485 Communications .................................................................................. 21
Data Logging .................................................................................................... 22
Standard Modbus Default Settings ................................................................... 23
Modbus Point Map ............................................................................................ 24
Troubleshooting ................................................................................................ 41
China RoHS Compliance Information ............................................................... 41
© 2011 Schneider Electric All Rights Reserved.
i
Page 4

EM3555
Contents
ZL0093-0A
11/2011
ii
© 2011 Schneider Electric All Rights Reserved.
Page 5

ZL0093-0A
11/2011
SAFETY PRECAUTIONS
INSTALLATION OVERVIEW
Safety Precautions
EM3555
DANGER
HAZARD OF ELECTRIC SHOCK, EXPLOSION, OR ARC FLASH
• Follow safe electrical work practices. See NFPA 70E in the USA or
applicable local codes.
• This equipment must only be installed and serviced by qualied
electrical personnel.
• Read, understand, and follow the instructions before installing this
product.
• Turn off all power supplying equipment before working on or inside
the equipment.
• Always use a properly rated voltage sensing device to conrm power is
off.
• DO NOT DEPEND ON THIS PRODUCT FOR VOLTAGE INDICATION.
• Only install this product on insulated conductors.
• Install device in an appropriate electrical and re enclosure per local
regulations.
• ESD sensitive equipment. Ground yourself and discharge any static
charge before handling this device.
• Any covers that may be displaced during the installation must be
reinstalled before powering the unit.
• Do not install on the load side of a Variable Frequency Drive (VFD), aka
Variable Speed Drive (VSD) or Adjustable Frequency Drive (AFD).
Failure to follow these instructions will result in death or serious injury.
NOTE: Observe correct CT orientation.
A. DIN Rail Mounting
B. Screw Mounting
The meter can be mounted in two ways: on standard 35 mm DIN rail or
screw-mounted to the interior surface of the enclosure.
1. Disconnect and lock out power. Use a properly rated voltage sensing device
to confirm power is off.
2. Attach mounting clips to the underside of the housing by sliding them into
the slots from the inside. The stopping pegs must face the housing, and the
outside edge of the clip must be flush with the outside edge of the housing.
3. Snap the clips onto the DIN rail.
4. To prevent horizontal shifting across the DIN rail, use two end stop clips.
1. Disconnect and lock out power. Use a properly rated voltage sensing device
to confirm power is off.
2. Attach the mounting clips to the underside of the housing by sliding them
into the slots from the outside. The stopping pegs must face the housing,
and the screw hole must be exposed on the outside of the housing.
3. Use three #8 screws (not supplied) to mount the meter to the inside of the
enclosure.
NOTE: For detailed instructions, please see the “Installation” section
later in this guide.
© 2011 Schneider Electric All Rights Reserved.
1
Page 6
EM3555
Specifications
SPECIFICATIONS
ZL0093-0A
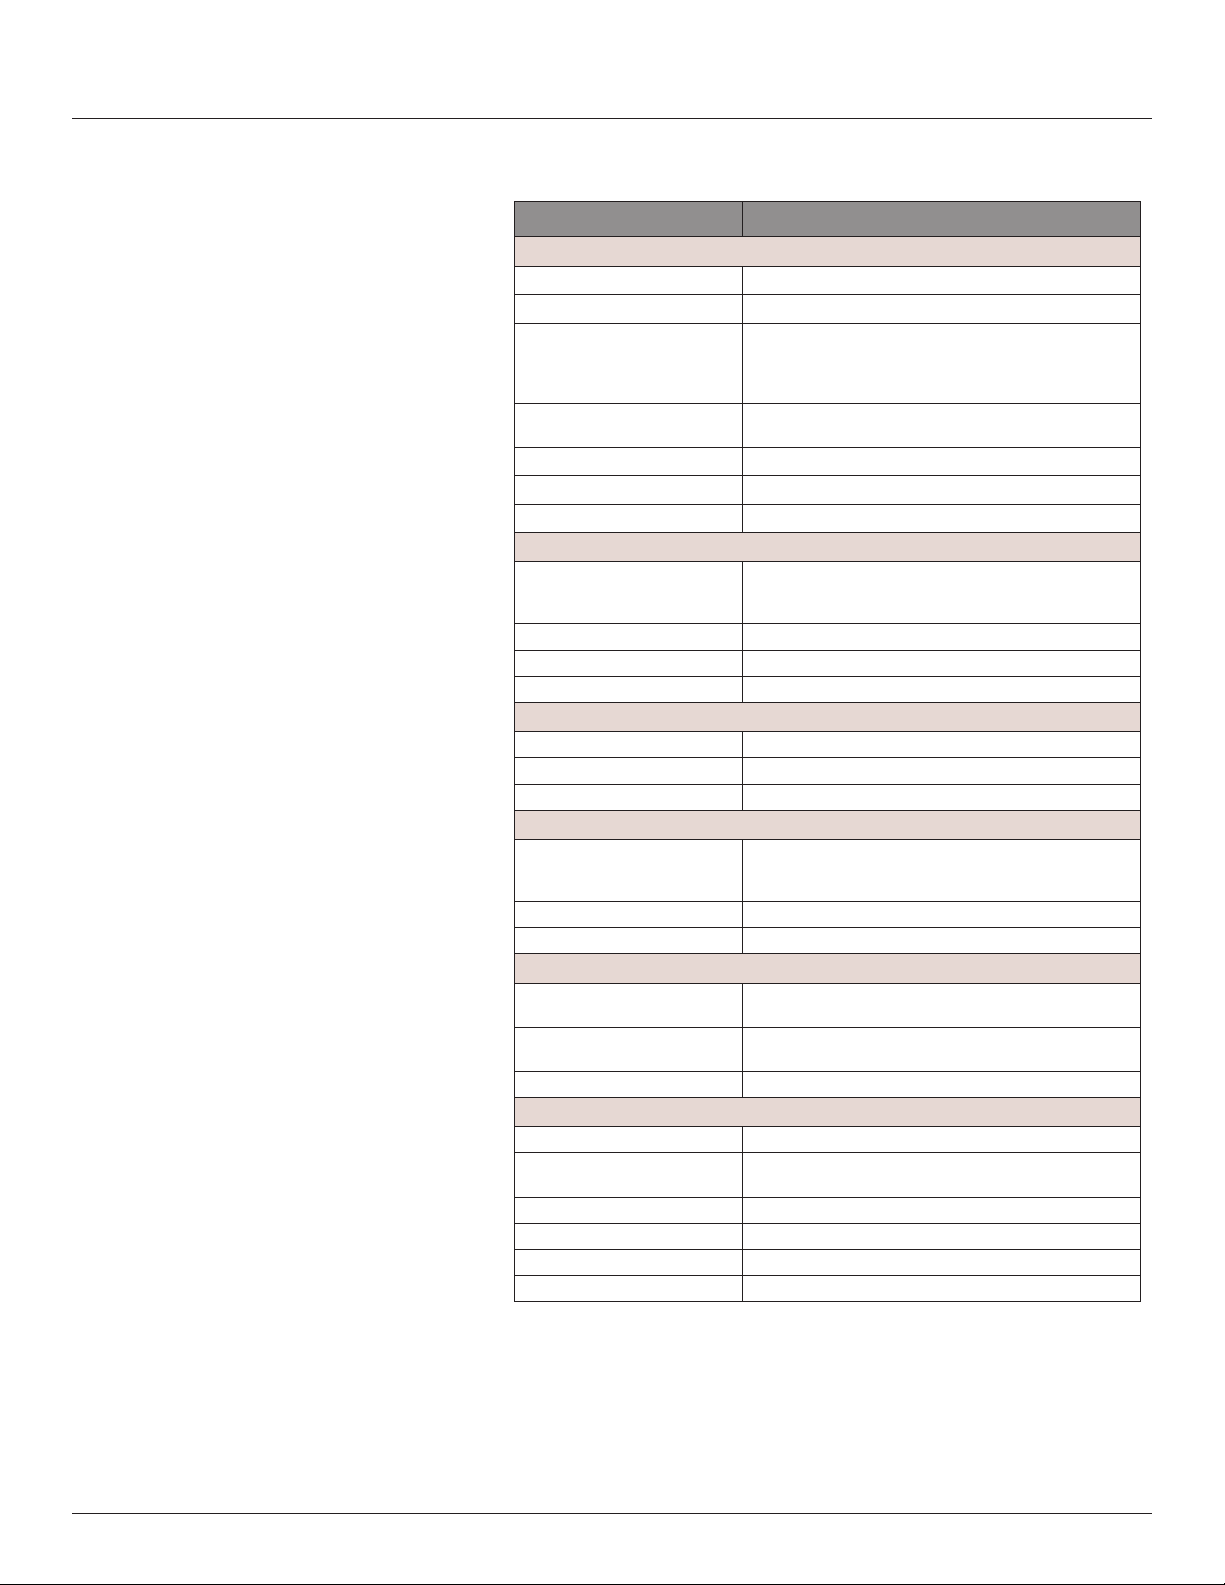
Table 1 Specifications
Type Description
Measurement Accuracy
Real Power and Energy IEC 62053-22 Class 0.5S, ANSI C12.20 0.5%
Reactive Power and Energy IEC 62053-23 Class 2, 2%
Current 0.4% (+0.015% per °C deviation from 25°C) from 5% to
Voltage 0.4% (+0.015% per °C deviation from 25°C) from 90 V
Sample Rate 2520 samples per second, no blind time
Data Update Rate 1 sec
Type of Measurement True RMS; One to three phase AC system
Input Voltage Characteristics
Measured AC Voltage Minimum 90 V
Metering Over-Range +20%
Impedance 2.5 MΩ
Frequency Range 45 to 65 Hz
Input Current Characteristics
CT Scaling Primary: Adjustable from 5 A to 32,000 A
Measurement Input Range 0 to 0.333 VAC or 0 to 1.0 VAC (+20% over-range)
Impedance 10.6 kΩ (1/3 V mode) or 32.1 kΩ (1 V mode)
Control Power
AC 5 VA max.; 90 V min.;
DC* 3 W max.; UL and CE: 125 to 300 VDC
Ride Through Time 100 msec at 120 VAC
Output
Alarm Contacts N.C., static output; (30 VAC/DC, 100 mA max. @ 25°C,
Real Energy Pulse Contacts N.O., static output; (30 VAC/DC, 100 mA max. @ 25°C,
RS-485 Port 2-wire, 1200 to 38400 baud, Modbus RTU
Mechanical Characteristics
Weight 0.62 lb (0.28 kg)
IP Degree of Protection (IEC
60529)
Display Characteristics Back-lit blue LCD
Terminal Block Screw Torque 3.5 in·lb (0.4 N·m) nominal/4.4 in·lb (0.5 N·m) max.
Terminal Block Wire Size 14 to 24 AWG
Rail T35 (35mm) DIN Rail per EN50022
100% of range;
0.8% (+0.015% per °C deviation from 25°C) from 1% to 5%
of range
600 VAC
L-L
(156 V
UL Maximums: 600 V
L-N
CE Maximums: 300 V
/5 MΩ
L-N
UL Maximums: 600 V
CE Maximums: 300 V
) for stated accuracy;
L-L
(347 V
L-L
(520 V
L-N
L-L
(347 V
L-L
(520 V
L-N
);
L-N
)
L-L
);
L-N
)
L-L
derate 0.56 mA per °C above 25°C)
derate 0.56 mA per °C above 25°C)
IP40 front display; IP20 Meter
11/2011
to
L-N
2
© 2011 Schneider Electric All Rights Reserved.
Page 7
ZL0093-0A
11/2011
Specifications
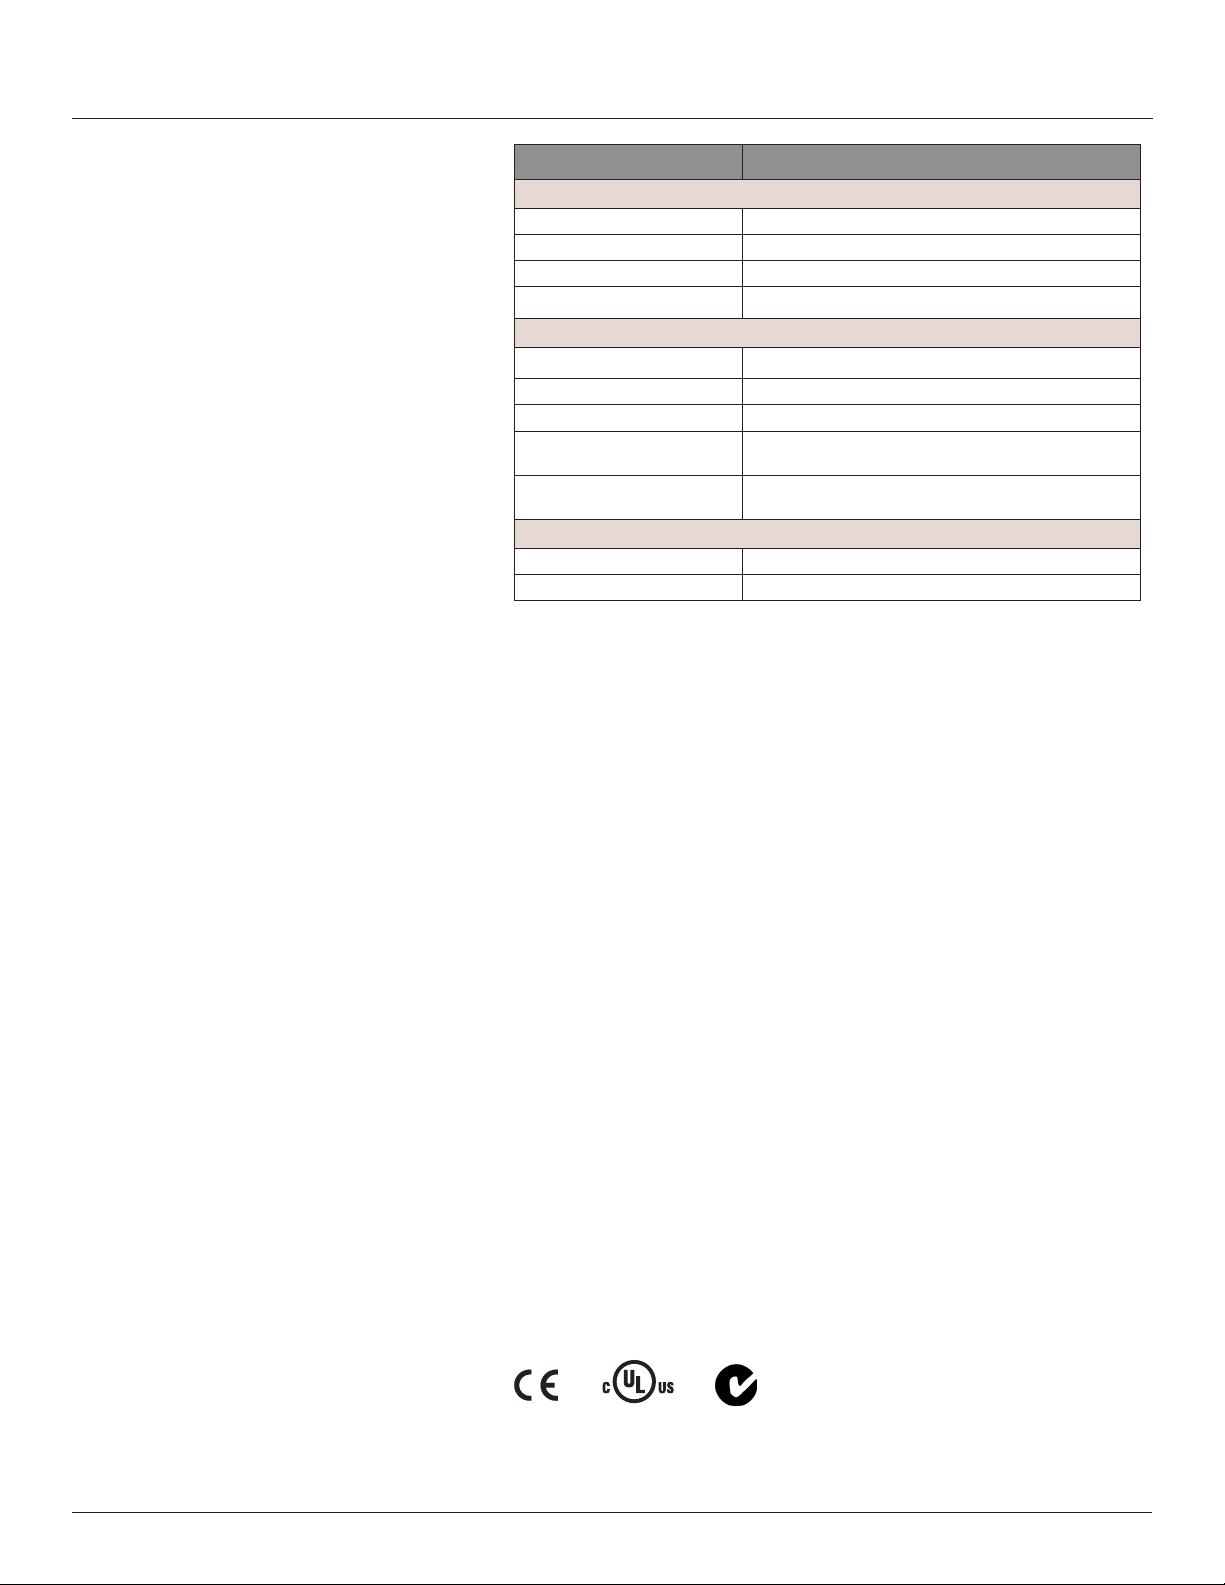
Type Description
Environmental Conditions
Operating Temperature -30° to 70°C (-22° to 158°F)
Storage Temperature -40° to 85°C (-40° to 185°F)
Humidity Range <95% RH (non-condensing)
Altitude of Operation 3 km max.
Metering Category
US and Canada CAT III; for distribution systems up to 347 V
CE CAT III; for distribution systems up to 300 V
Dielectric Withstand Per UL 508, EN61010
Conducted and Radiated
Emissions
Conducted and Radiated
Immunity
FCC part 15 Class B, EN55011/EN61000 Class B;
(residential and light industrial)
EN61000 Class A (heavy industrial)
Safety
US and Canada (cULus) UL508 (open type device)/CSA 22.2 No. 14-05
Europe (CE) EN61010-1:2001
* External DC current limiting is required, see fuse recommendations.
/600 VAC
L-N
/480 VAC
L-N
EM3555
L-L
L-L
For use in a Pollution Degree 2 or better environment only. A Pollution
Degree 2 environment must control conductive pollution and the possibility of
condensation or high humidity. Consideration must be given to the enclosure,
the correct use of ventilation, thermal properties of the equipment and the
relationship with the environment.
Always use this product in the manner specied or the protection provided by
the product may be impaired.
Provide a disconnect device to disconnect the meter from the supply source.
Place this device in close proximity to the equipment and within easy reach
of the operator, and mark it as the disconnecting device. The disconnecting
device shall meet the relevant requirements of IEC 60947-1 and IEC 60947-3
and shall be suitable for the application. In the US and Canada, disconnecting
fuse holders can be used. Provide overcurrent protection and disconecting
device for supply conductors with approved current limiting devices suitable for
protecting the wiring. If the equipment is used in a manner not specied by the
manufacturer, the protection provided by the device may be impaired.
FCC PART 15 INFORMATION
NOTE: This equipment has been tested by the manufacturer and found
to comply with the limits for a class B digital device, pursuant to part 15 of
the FCC Rules. These limits are designed to provide reasonable protection
against harmful interference when the equipment is operated in a residential
environment. This equipment generates, uses, and can radiate radio frequency
energy and, if not installed and used in accordance with the instruction
manual, may cause harmful interference to radio communications. Operation
of this equipment in a residential area may cause harmful interference in
which case the user will be required to correct the interference at his own
expense. Modications to this product without the express authorization of the
manufacturer nullify this statement.
© 2011 Schneider Electric All Rights Reserved.
N998
3
Page 8
EM3555
Loss Alarm
kWh
1234.5
Introduction
INTRODUCTION
Parts of the EM Series
ZL0093-0A
11/2011
The EM3555 DIN Rail Power Meter provides a solution for measuring energy
data with a single device. Inputs include Control Power, CTs, and 3-phase
voltage. The EM3555 supports multiple output options, including solid state
relay contacts, Modbus, data logging, and pulse. The LCD screen on the
faceplate allows instant output viewing.
The EM3555 Meter is capable of bidirectional metering. Power is monitored
in both directions (upstream and downstream from the meter). The meter is
housed in a plastic enclosure suitable for installation on T35 DIN rail according
to EN50022. The EM3555 can be mounted either on a DIN rail or in a panel.
Observe correct CT orientation when installing the device.
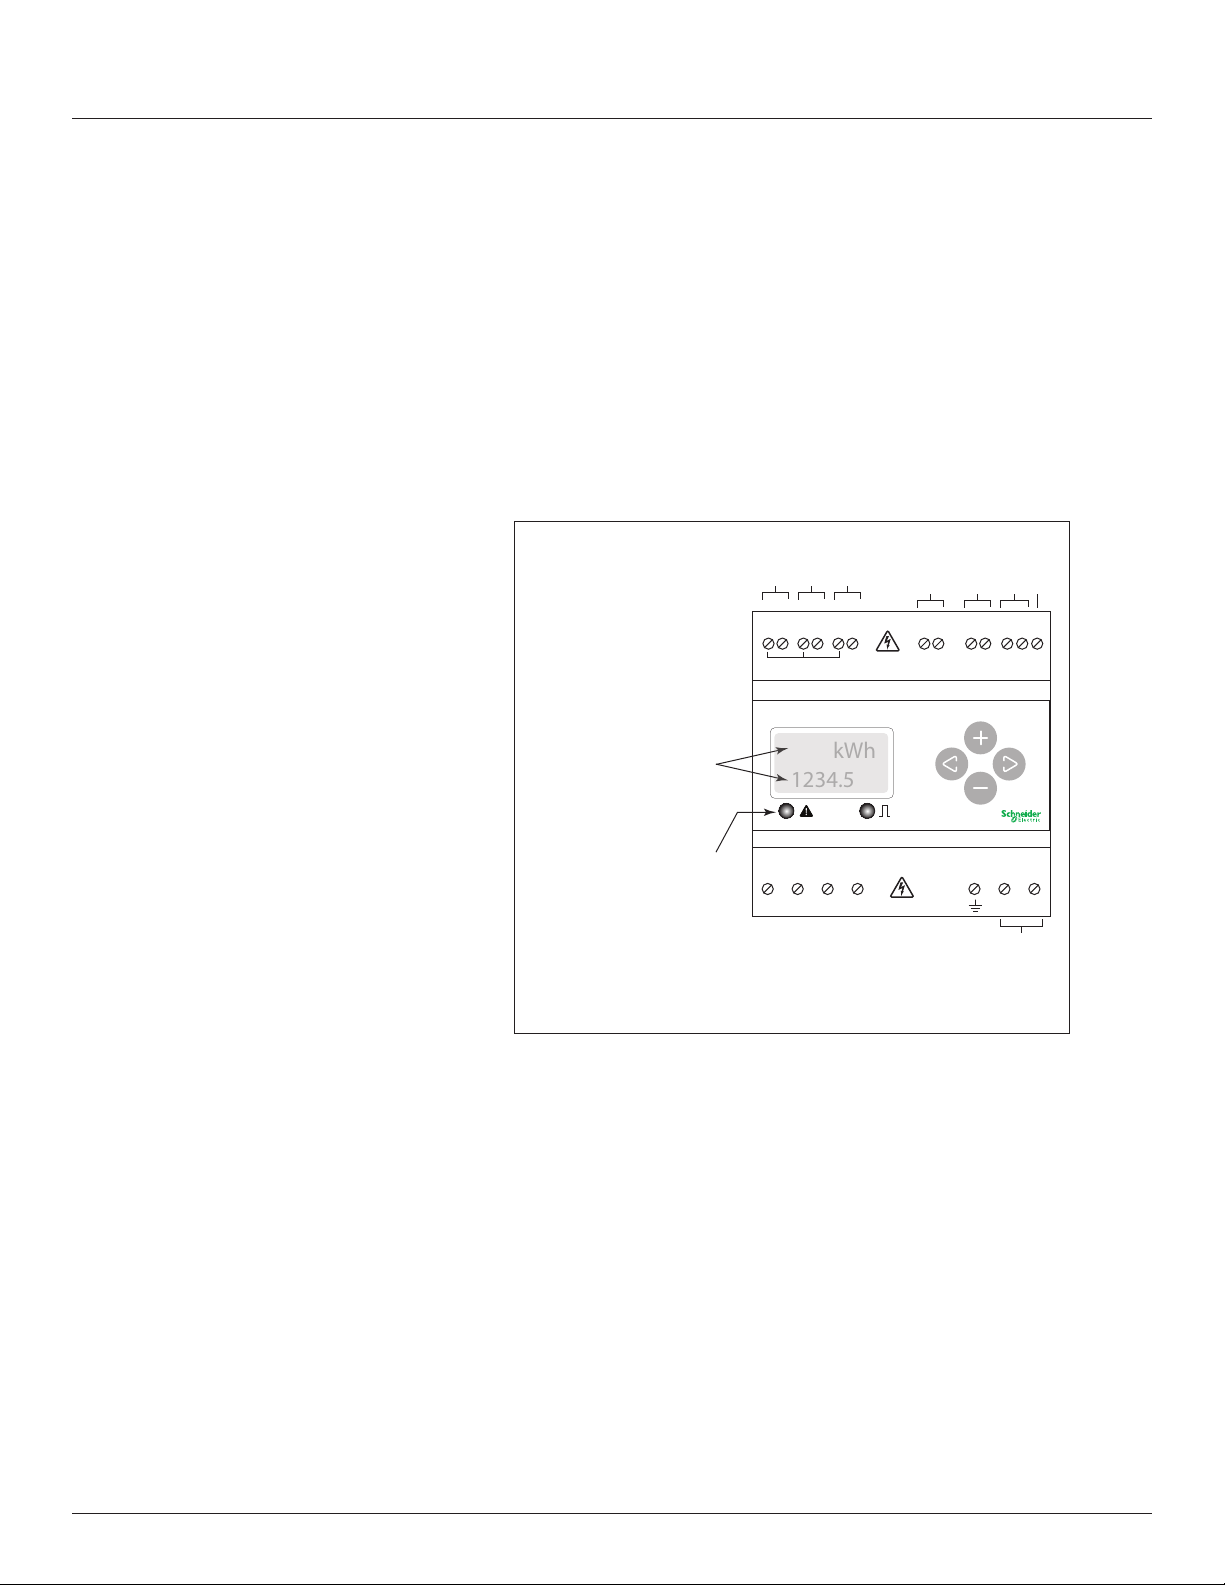
Figure 1 shows the parts of the EM Series Compact Power and Energy Meter.
Figure 1 EM Series Meter
IA
IB
IC
-+-+-
A B C Alarm Energy
+
Phase
Pulse
Modbus
OUTPUT
Shield
Two 5-character rows
of display text.
Top row alphanumeric;
Bottom row numeric
only
The red Alarm LED
lights when any of the 3
phase voltages drop
below the selected
threshold. The green
Energy LED lights
momentarily each time
the Energy output pulse
is active.
- 600V
CE: 90V
L-L
NC NO + - S
CONTROL POWER
- 300V
L-N
L-N
0.1A 50/60 Hz
Earth
Common - 1 or 1/3 VAC Input
EM35XX
VOLTAGE INPUTS
CAT III 50/60 Hz
A B C N 1 2
VA
VB
VC
UL: 90V
L-N
Neutral
Control
Power
4
© 2011 Schneider Electric All Rights Reserved.
Page 9
ZL0093-0A
11/2011
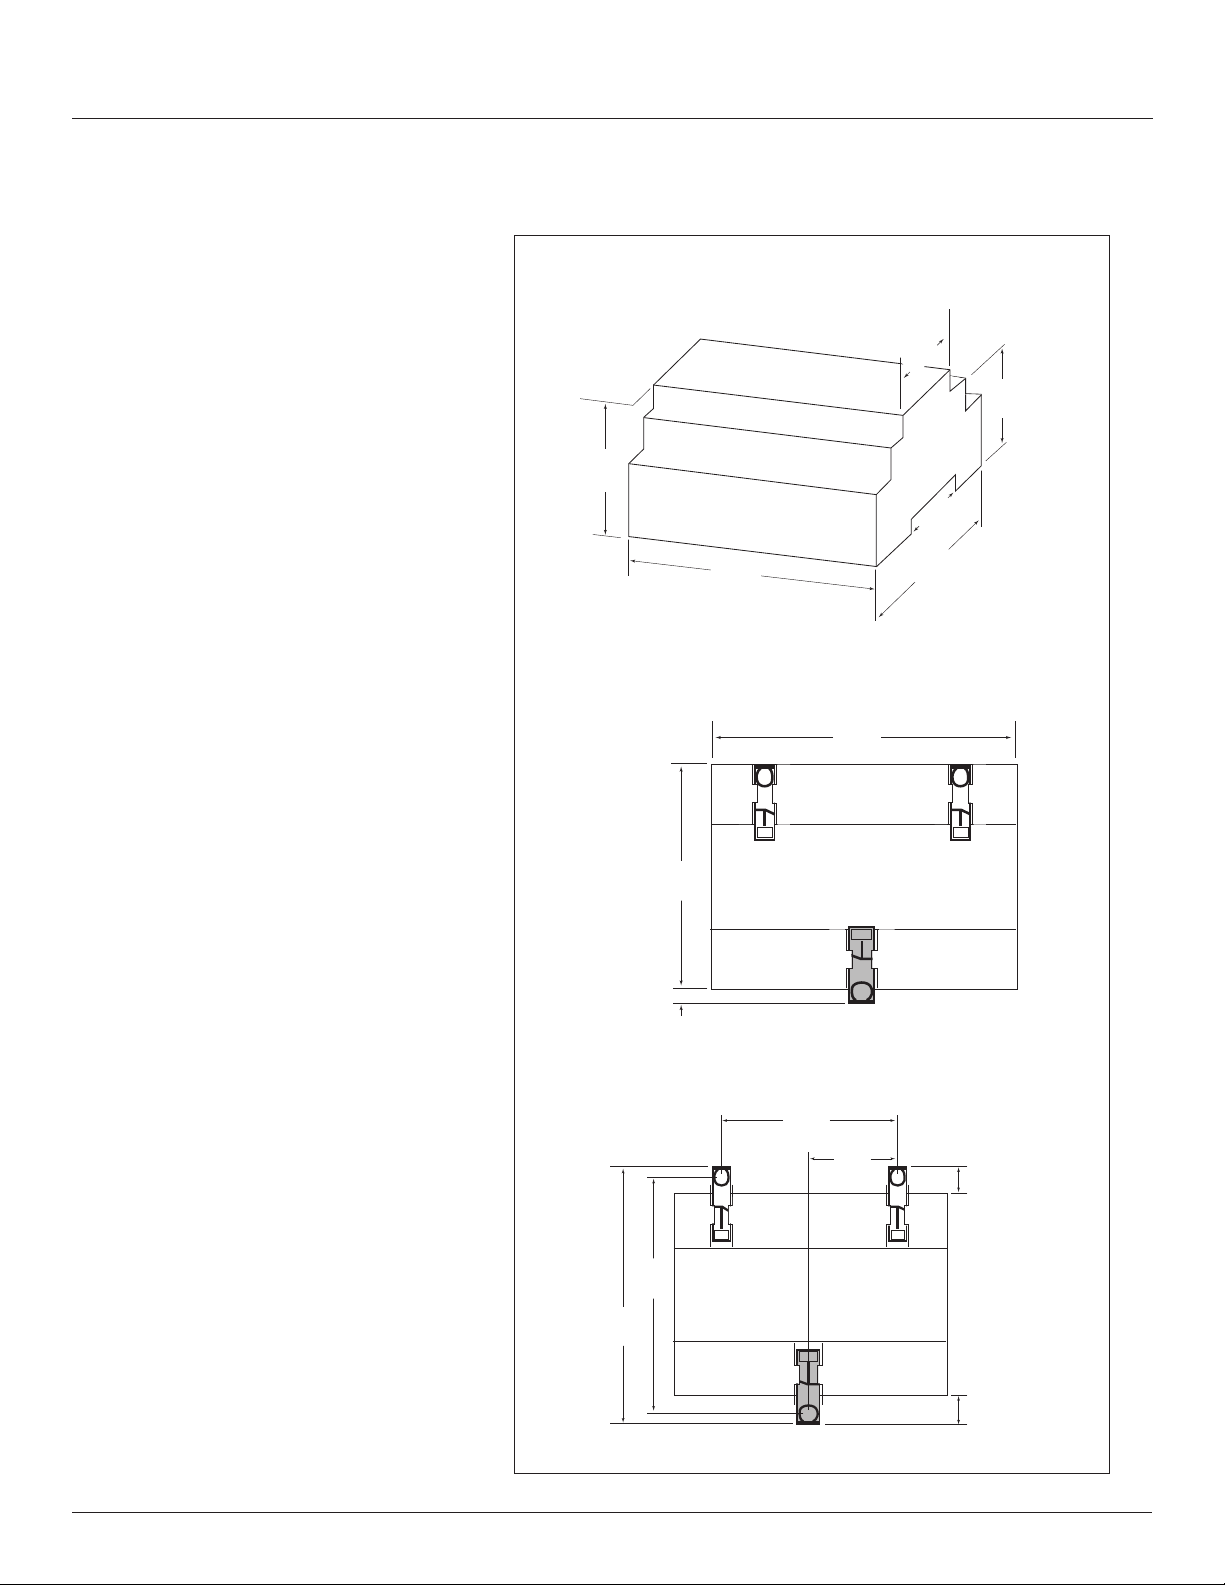
DIMENSIONS
Figure 2 EM Series Dimensions
2.3”
(59 mm)
Meter Housing
4.2”
(107 mm)
1.8”
(45 mm)
(39 mm)
3.6”
(91 mm)
1.5”
1.9”
(48 mm)
EM3555
Dimensions
Bottom View (DIN Mount Option)
3.6 “
(91 mm)
0.2 “
(4 mm)
Bottom View (Screw Mount Option)
2.4 “
(61 mm)
4.2 “
(107 mm)
1.2 “
(31 mm)
++
0.3 “
(8 mm)
© 2011 Schneider Electric All Rights Reserved.
(99 mm)
4.3 “
(109 mm)
3.9“
+
0.4 “
(10 mm)
5
Page 10

EM3555
Data Output
DATA OUTPUT
ZL0093-0A
11/2011
Table 2 Data Output
Full Data Set (FDS):
Signed Power: real, reactive, and apparent 3-phase total and per phase
Real and Apparent Energy Accumulators: import, export, and net; 3-phase total and per phase
Reactive Energy Accumulators by Quadrant: 3-phase totals and per phase
Congurable for CT & PT ratios, system type, and passwords
Diagnostic alerts
Current: 3-phase average and per phase
Volts: 3-phase average and per phase line-line and line-neutral
Power Factor: 3-phase average and per phase
Frequency
Power Demand: most recent and peak (import and export)
Demand Conguration: xed, rolling block, and external sync
Data Logging:
Real Time Clock: user congurable
10 user congurable log buffers: each buffer holds 5760 16-bit entries (user congures which 10
data points are stored in these buffers)
User congurable logging interval (when congured for a 15 minute interval, each buffer holds 60
days of data)
Continuous and Single Shot logging modes: user selectable
Auto write pause: read logs without disabling the meter’s data logging mode
6
© 2011 Schneider Electric All Rights Reserved.
Page 11
ZL0093-0A
Clip flush
11/2011
INSTALLATION
EM3555
Installation
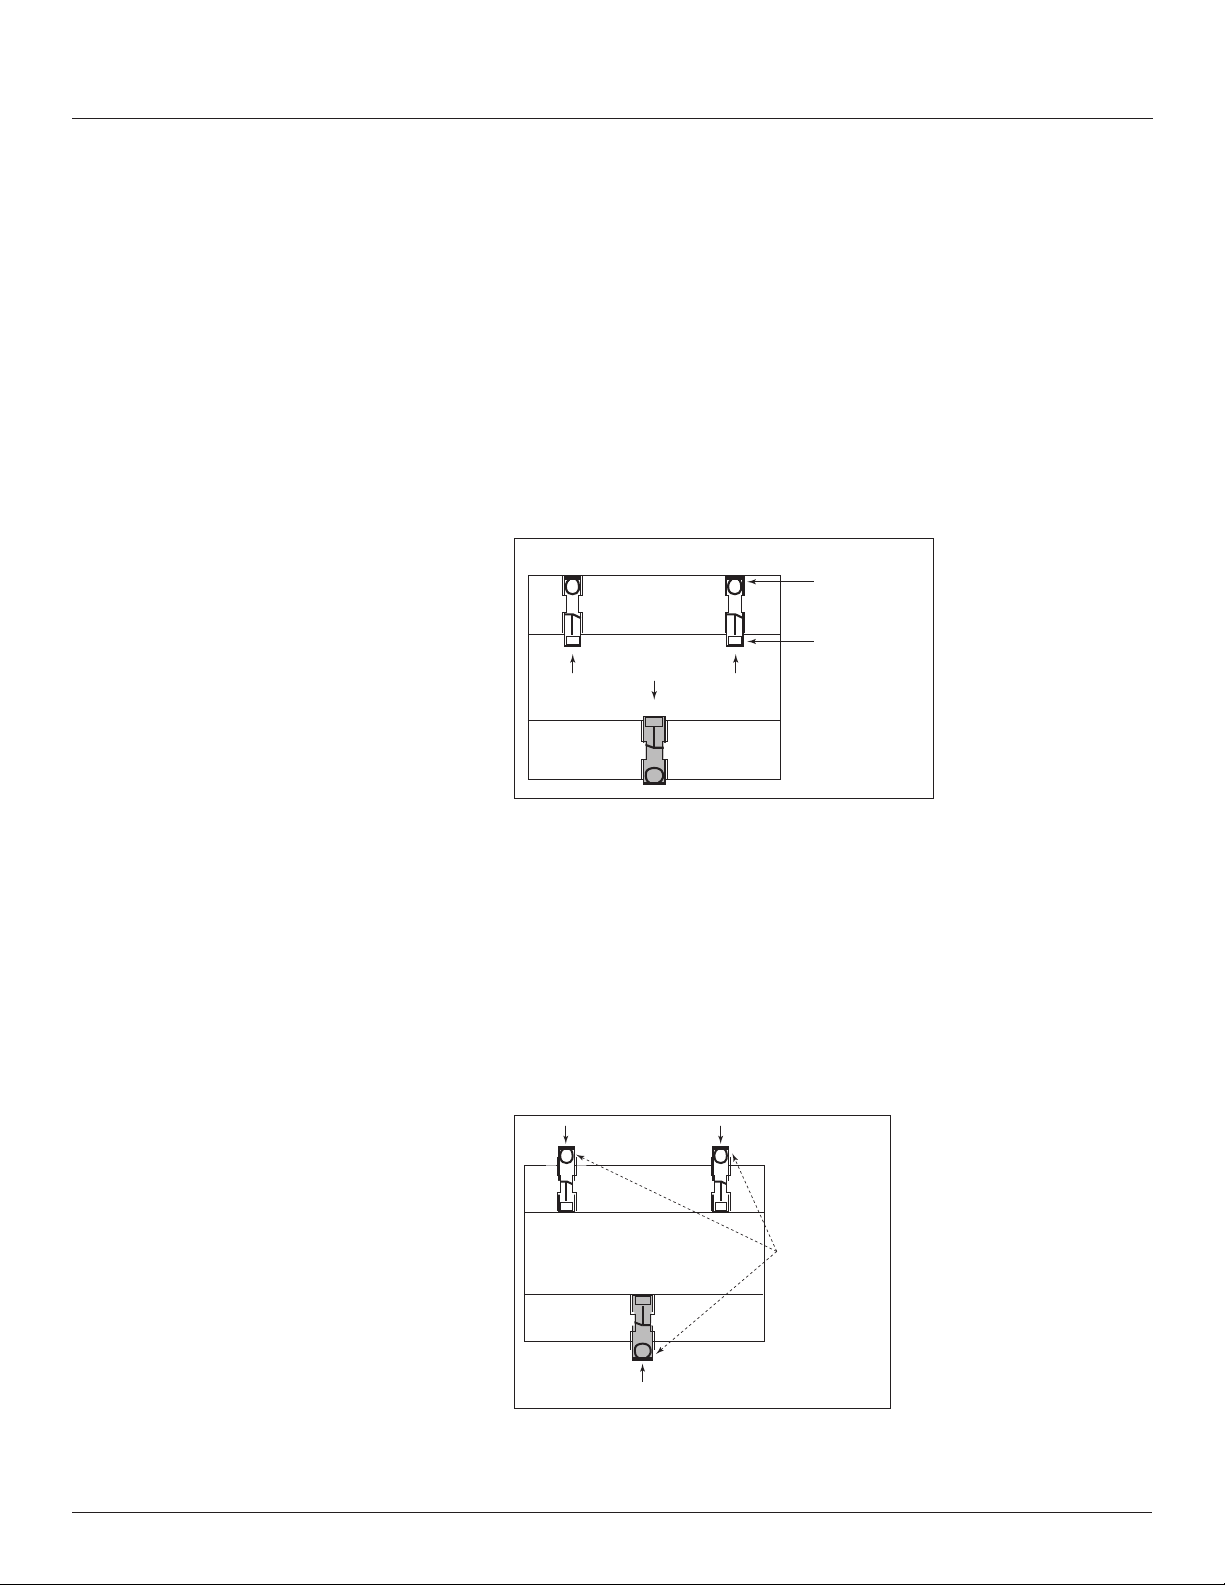
NOTE: Observe correct CT orientation.
The meter can be mounted in two ways: on standard 35 mm DIN rail or
screw-mounted to the interior surface of the enclosure.
A. DIN Rail Mounting
1. Disconnect and lock out power. Use a properly rated voltage sensing device
to confirm power is off.
2. Attach mounting clips to the underside of the housing by sliding them into
the slots from the inside. The stopping pegs must face the housing, and the
outside edge of the clip must be flush with the outside edge of the housing.
3. Snap the clips onto the DIN rail. See diagram of the underside of the
housing (Figure 3).
Figure 3 Attach mounting clips for DIN Rail
with outside
edge
Snap onto
Insert clips from
inside
DIN rail
4. To prevent horizontal shifting across the DIN rail, use two end stop clips.
B. Screw Mounting
1. Disconnect and lock out power. Use a properly rated voltage sensing device
to confirm power is off.
2. Attach the mounting clips to the underside of the housing by sliding them
into the slots from the outside. The stopping pegs must face the housing,
and the screw hole must be exposed on the outside of the housing.
3. Use three #8 screws (not supplied) to mount the meter to the inside of the
enclosure. See diagram of the underside of the housing (Figure 4).
Figure 4 Attach Clips for screw mounting
Insert clips from
outside
Screw
holes
exposed
for
mounting
© 2011 Schneider Electric All Rights Reserved.
7
Page 12
EM3555
Supported System Types
SUPPORTED SYSTEM TYPES
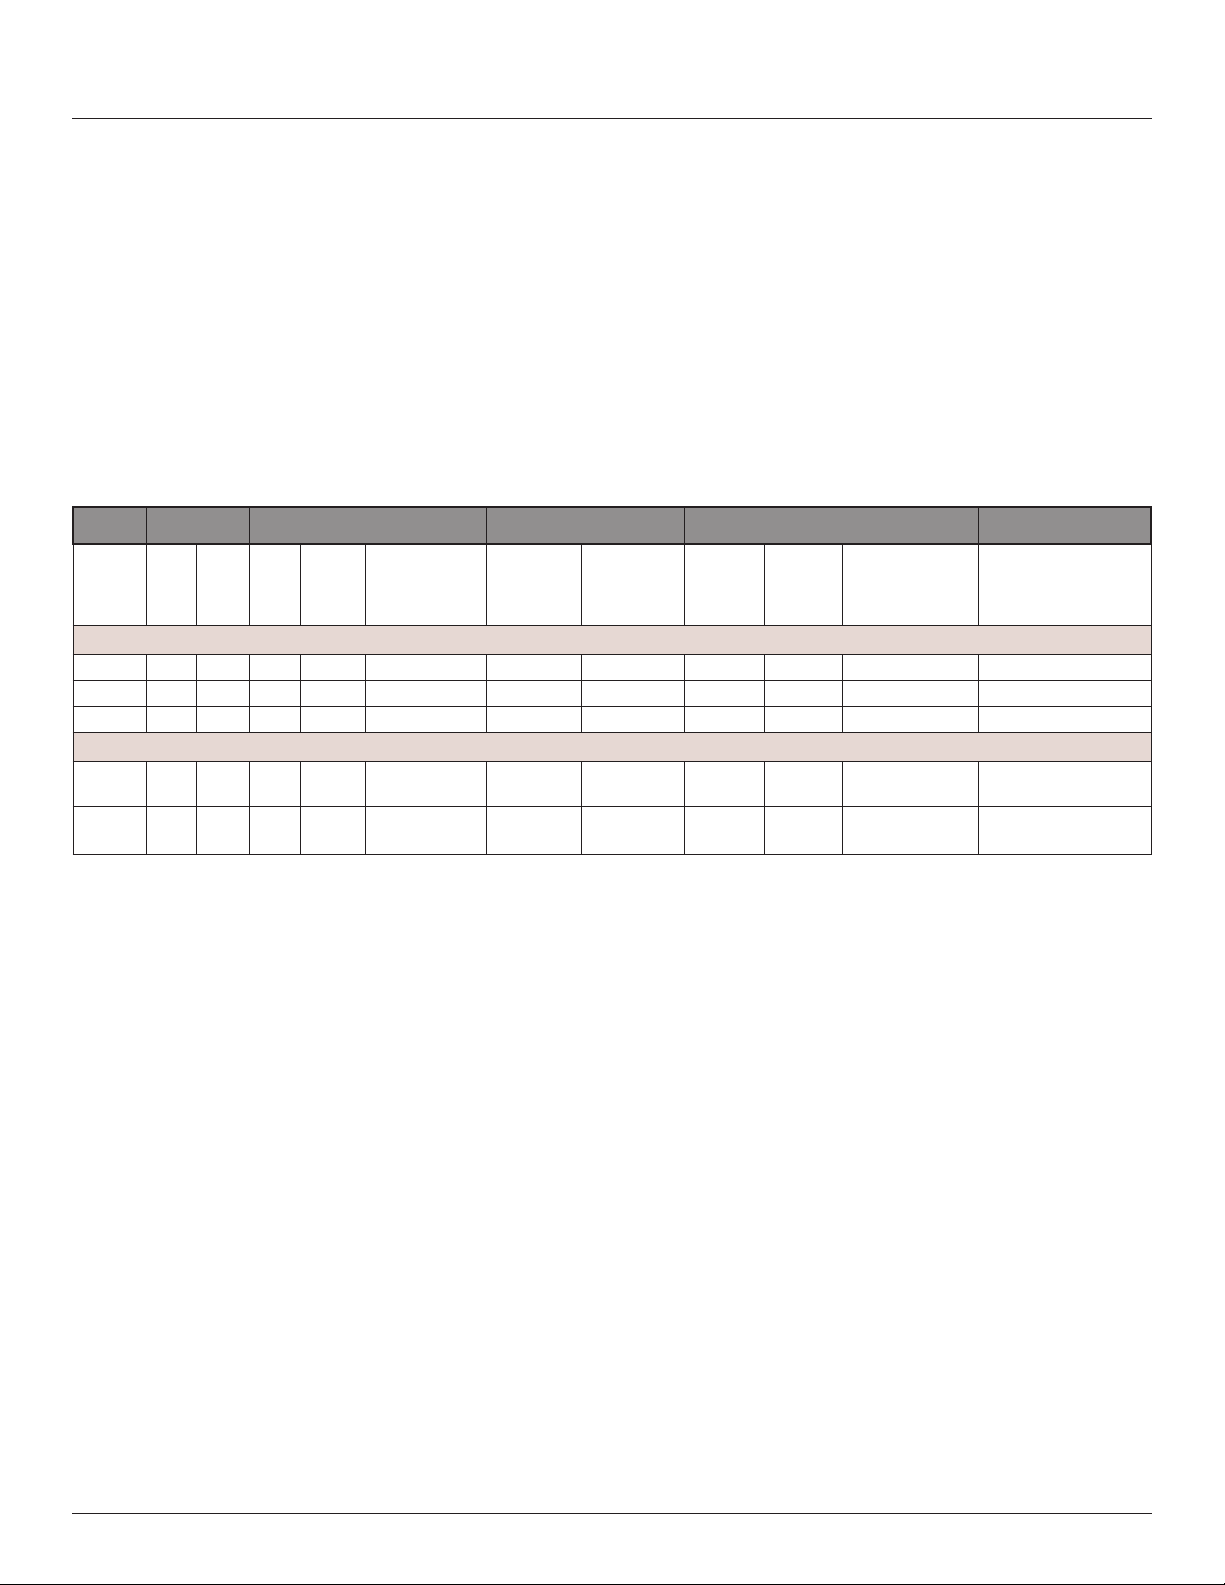
Table 3 Supported system types
CTs Voltage Connections System Type Phase Loss Measurements Wiring Diagram
ZL0093-0A
11/2011
The meter has a number of different possible system wiring congurations (see
Wiring Diagrams). To congure the meter, set the System Type via the User
Interface or Modbus register 130. The System Type tells the meter which of
its current and voltage inputs are valid, which are to be ignored, and if neutral
is connected. Setting the correct System Type prevents unwanted energy
accumulation on unused inputs, selects the formula to calculate the Theoretical
Maximum System Power, and determines which phase loss algorithm is to be
used. The phase loss algorithm is congured as a percent of the Line-to-Line
System Voltage (except when in System Type 10) and also calculates the
expected Line to Neutral voltages for system types that have Neutral (12 & 40).
Values that are not valid in a particular System Type will display as “----” on the
User Interface or as QNAN in the Modbus registers.
Number
of wires
Qty ID Qty ID Type Modbus
Register
130
User
Interface:
SETUP>
S SYS
VLL VLN Balance Diagram number
Single-Phase Wiring
2 1 A 2 A, N L-N 10 1L + 1n AN 1
2 1 A 2 A, B L-L 11 2L AB 2
3 2 A, B 3 A, B, N L-L with N 12 2L + 1n AB AN, BN AN-BN 3
Three-Phase Wiring
3 3 A, B, C3 A, B, C Delta 31 3L AB, BC,
4 3 A, B, C4 A, B,
C, N
Grounded Wye 40 3L + 1n AB, BC, CAAN, BN, CNAN-BN-CN &
CA
AB-BC-CA 4
AB-BC-CA
5, 6
8
© 2011 Schneider Electric All Rights Reserved.
Page 13
ZL0093-0A
11/2011
WIRING
HAZARD OF ELECTRIC SHOCK, EXPLOSION, OR ARC FLASH
• Apply appropriate personal protective equipment (PPE) and follow safe
electrical work practices. See NFPA 70E in the USA or applicable local
codes.
• This equipment must only be installed and serviced by qualied electrical
personnel.
• Turn off all power supplying equipment before working on or inside the
equipment.
• Always use a properly rated voltage sensing device to conrm power is
off.
• Read, understand, and follow the instructions before installing this
product.
Failure to follow these instructions will result in death or serious injury.
To avoid distortion, use parallel wires for control power and voltage inputs.
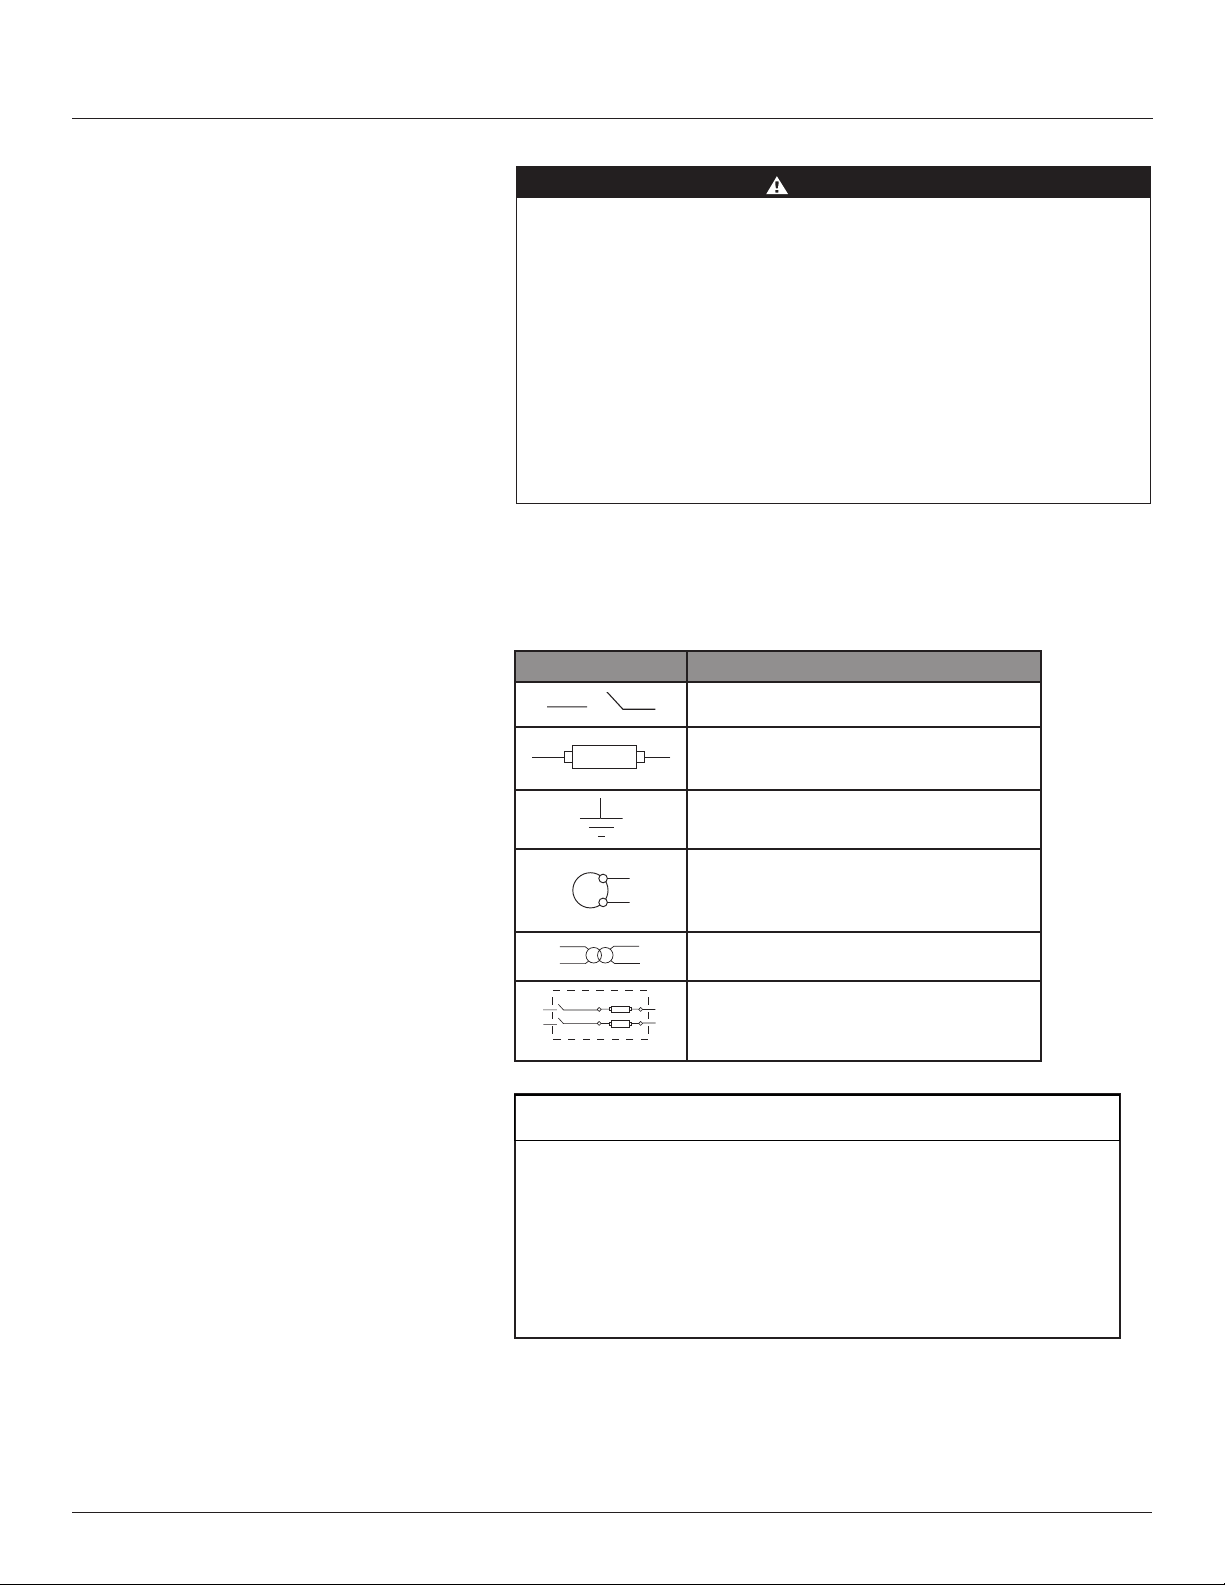
The following symbols are used in the wiring diagrams on the following pages.
Table 5 Wiring Symbols
EM3555
Wiring
DANGER
Symbol Description
Voltage Disconnect Switch
Fuse (installer is responsible for ensuring compliance
with local requirements. No fuses are included with
the meter.)
Earth ground
S1
S2
Current Transducer
Potential Transformer
Protection device containing a voltage disconnect
switch with a fuse or disconnect circuit breaker. The
protection device must be rated for the available
short-circuit current at the connection point.
CAUTION
RISK OF EQUIPMENT DAMAGE
• This product is designed only for use with 1V or 0.33V current
transducers (CTs).
• DO NOT USE CURRENT OUTPUT (e.g. 5A) CTs ON THIS
PRODUCT.
Failure to follow these instructions can result in overheating and
permanent equipment damage.
© 2011 Schneider Electric All Rights Reserved.
9
Page 14
EM3555
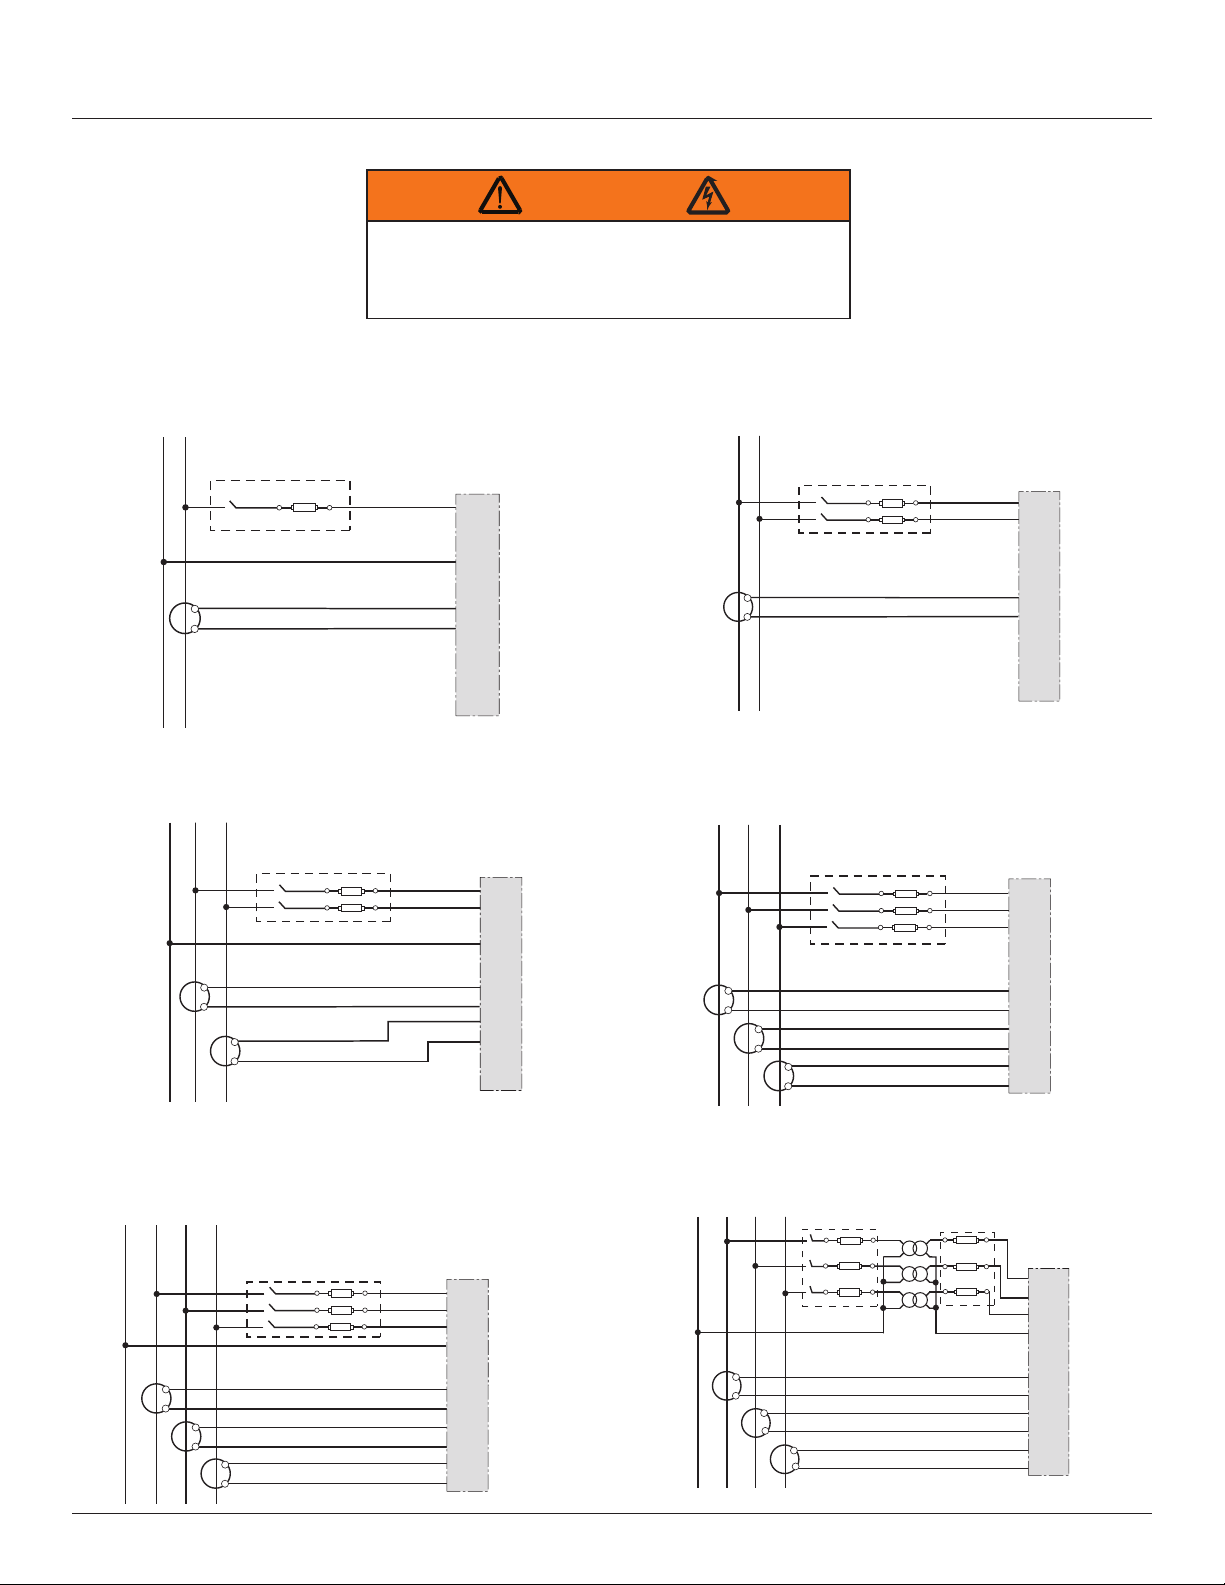
Wiring Diagrams
WIRING DIAGRAMS
WARNING
RISK OF ELECTRIC SHOCK
CT negative terminals are referenced to the meter’s neutral and may be at elevated voltages
· Do not contact meter terminals while the unit is connected
· Do not connect or short other circuits to the CT terminals
Failure to follow these instructions can result in death or serious injury.
Diagram 1: 1-Phase Line-to-Neutral 2- Wire System 1 CT Diagram 2: 1-Phase Line-to-Line 2-Wire System 1 CT
Use System Type 10 (1L + 1n)
N L1
Use System Type 11 (2L)
L1 L2
ZL0093-0A
11/2011
A
B
C
N
X1
X2
White
Black
+
A
-
+
B
-
+
C
-
Diagram 3: 1-Phase Direct Voltage Connection 2 CT
Use System Type 12 (2L + 1n) Use System Type 31 (3L)
L1 L2
N
A
B
C
N
X1
X2
X1
X2
White
Black
White
Black
+
A
-
+
B
-
+
C
-
X1
White
Black
X2
Diagram 4: 3-Phase 3-Wire 3 CT no PT
L1 L2 L3
X1
White
Black
X1
X2
White
Black
X1
X2
White
Black
X2
A
B
C
N
+
A
-
+
B
-
+
C
-
A
B
C
N
+
A
-
+
B
-
+
C
-
Diagram 5: 3-Phase 4-Wire Wye Direct Voltage Input Connection
3 CT
Use System Type 40 (3L + 1n)
L1N L2 L3
A
B
C
N
X1
X2
X1
X2
X1
X2
White
Black
White
Black
White
Black
+
A
-
+
B
-
+
C
-
10
Diagram 6: 3-Phase 4-Wire Wye Connection 3 CT 3 PT
Use System Type 40 (3L + 1n)
L1N L2 L3
A
B
C
N
X1
X1
X2
X2
X1
X2
White
Black
White
Black
White
Black
© 2011 Schneider Electric All Rights Reserved.
+
A
-
+
B
-
+
C
-
Page 15

ZL0093-0A
11/2011
CONTROL POWER
EM3555
Control Power
Direct Connect Control Power (Line to Line)
1 2G
L1
L2 L3
Line to Line from 90VAC to 600 VAC (UL) (520 VAC for CE). In UL installations the
lines may be oating (such as a delta). If any lines are tied to an earth (such as a corner
grounded delta), see the Line to Neutral installation limits. In CE compliant installations,
the lines must be neutral (earth) referenced at less than 300 VAC
L-N
Direct Connect Control Power (DC Control Power)
1 2G
Direct Connect Control Power (Line to Neutral)
1 2G
L1N L2 L3
Line to Neutral from 90 VAC to 347 VAC (UL) or 300 VAC (CE)
Control Power Transformer (CPT) Connection
1 2G
L1N L2 L3
DC Control Power from 125 VDC to 300 VDC (UL and CE max.)
FUSE RECOMMENDATIONS
WIRING NOTES
The Control Power Transformer may be wired L-N or L-L. Output to meet meter input requirements
Keep the fuses close to the power source (obey local and national code
requirements).
For selecting fuses and circuit breakers, use the following criteria:
• Select current interrupt capacity based on the installation category
and fault current capability.
• Select over-current protection with a time delay.
• The voltage rating should be sufcient for the input voltage applied.
• Provide overcurrent protection and disconnecting means to protect
the wiring. For DC installations, external circuit protection must be
provided. Suggested: 0.5 A, time delay fuses.
• The earth connection is required for electromagnetic compatibility
(EMC) and is not a protective earth ground.
• Use 14-24 gauge wire for all connections.
• When tightening terminals, ensure that the correct torque is applied:
3.5 - 4.4 in·lb (0.4-0.5 N·m).
© 2011 Schneider Electric All Rights Reserved.
11
Page 16

EM3555
Display Screen Diagram
DISPLAY SCREEN DIAGRAM
Figure 5 Display Screen
LCD Screen:
Screen Name or Units
Diagnostic
Alert
Numeric
Data
Buttons:
Select
(Up)
♥
Tx
Rx
ERR
ZL0093-0A
11/2011
Alive Indicator
Export
Import
Transmit Data
Receive Data
Receive Data Error
(Left)
Back
(Right)
Next
(Down)
Select
12
© 2011 Schneider Electric All Rights Reserved.
Page 17

ZL0093-0A
11/2011
QUICK SETUP INSTRUCTIONS
Quick Setup Instructions
EM3555
These instructions assume the meter is set to factory defaults. If it has been
previously congured, all optional values should be checked.
1. Press the + or – button repeatedly until SETUP screen appears.
2. Press to the PASWD screen.
3. Press through the digits. Press + or – to select the password (the default
is 00000). Exit the screen to the right.
4. Press + or – to select the parameter to configure.
5. The first Setup screen is S COM (set RS-485 communications).
a. Press to the ADD R screen and through the address digits. Press +
or – to select the Modbus address.
b. Press to the BAUD screen. Press + or – to select the baud rate.
c. Press to the PAR screen. Press + or – to select the parity.
d. Press back to the S COM screen.
6. Press – to the S CT (Set Current Transducer) screen.
a. Press to the CT V screen. Press + or – to select the voltage mode
Current Transducer output voltage (default is 0.33).
b. Press to the CT SZ screen and through the digits. Press + or – to
select the CT size in amps.
c. Press back to the S CT screen.
7. Press – to the S SYS (Set System) screen.
a. Press to the S Y STM screen. Press + or – to select the System Type
(see wiring diagrams).
b. Press back to the S SYS screen.
8. (Optional) Press – to the S PT (Set Potential Transformer) screen. If PTs
are not used, then skip this step.
a. to the R ATIO screen and through the digits. Use the + or – buttons
to select the Potential Transformer step down ratio.
b. back to the S PT screen.
9. – to the S V (Set System Voltage) screen.
a. to the VLL (or VLN if system is 1L-1n) screen and through the digits.
Use the + or – buttons to select the Line to Line System Voltage.
b. back to the S V screen.
10. Use the to exit the setup screen and then SETUP.
11. Check that the wrench is not displayed on the LCD.
© 2011 Schneider Electric All Rights Reserved.
a. If the wrench is displayed, press + or – to nd the A LERT screen.
b. Press through the screens to see which alert is on.
For full setup instructions, see the conguration instructions on the following
pages.
13
Page 18

EM3555
Solid-state Pulse Output
SOLID-STATE PULSE OUTPUT
ZL0093-0A
11/2011
The meter has one normally open (N.O.) KY Form A output and one normally
closed (N.C.) solid-state output.* One is dedicated to import energy (Wh), and
the other to Alarm. See the Setup section for conguration information.
Figure 6 Solid State Pulse Outputs
Over-Current Protective
Device** (not supplied)
≤ 100 mA
Power Source
~
3-30 VDC
=
6-30 VAC
≤ 100 mA
Power Source
~
3-30 VDC
=
6-30 VAC
Alarm
+ – S
Energy Output
The solid state pulse outputs are rated for 30 VAC/DC nom.
Maximum load current is 100 mA at 25°C. Derate 0.56 mA per °C above 25°C.
* While the relay used for the Phase Loss contact is Normally Closed (contacts
are closed when the meter is not powered), closure indicates the presence of an
alarm; either loss of phase, when the meter is powered, or loss of power when
the meter is not. The contacts are open when the meter is powered and no
phase loss alarm conditions are present.
** The over-current protective device must be rated for the short circuit current
at the connection point.
14
© 2011 Schneider Electric All Rights Reserved.
Page 19

ZL0093-0A
11/2011
UI MENU ABBREVIATIONS DEFINED
UI Menu Abbreviations Defined
The user can set the display mode to IEC or IEEE notation in the SETUP
menu.
Table 6 IEC and IEEE Abbreviations
Main Menu
IEC IEEE Description
D D Demand
MAX M Maximum Demand
P W Present Real Power
Q VA R Present Reactive Power
S VA Present Apparent Power
A A Amps
UAB, UBC,
UAC
V VLN Voltage Line-to-Neutral
PF PF Power Factor
U VLL Voltage Line-to-Line
HZ HZ Frequency
KSh KVAh Accumulated Apparent Energy
KQh KVARh Accumulated Reactive Energy
KPh KWh Accumulated Real Energy
PLOSS PLOSS Phase Loss
LOWPF LOWPF Low Power Factor Error
F ERR F ERR Frequency Error
I OVR I OVR Over Current
V OVR V OVR Over Voltage
PULSE PULSE kWh Pulse Output Overrun (conguration error)
_PHASE _PHASE Summary Data for 1, 2, or 3 active phases
ALERT ALERT Diagnostic Alert Status
INFO INFO Unit Information
MODEL MODEL Model Number
OS OS Operating System
RS RS Reset System
SN SN Serial Number
RESET RESET Reset Data
PASWD PASWD Enter Reset or Setup Password
ENERG ENERG Reset Energy Accumulators
DEMND DEMND Reset Demand Maximums
PULS_ PULS_ Pulse Counter (if equipped)
VAB, VBC,
VAC
Voltage Line-to-Line
Import
Export
EM3555
© 2011 Schneider Electric All Rights Reserved.
15
Page 20

EM3555
User Interface for Data Configuration
USER INTERFACE FOR DATA CONFIGURATION
_PHAS
HZ
DEMND
CPHAS
BPHAS
APHAS
Frequency
ZL0093-0A
11/2011
ENRGY
(Export Wh)
PULS2
Pulse Counter 2
for Pulse Value
PULS1
See SETUP > SPULS > Wh/P
(Import Wh)
Pulse Counter 1
KVAh
Export
Apparent Energy
Power (S)
M KVA
Export Demand
Maximum Apparent
Power (Q)
MKVAR
Export Demand
Maximum Reactive
Power (P)
M KW
Maximum Real
Export Demand
Power (S)
M KVA
Import Demand
Maximum Apparent
MKVAR
Power (Q)
Import Demand
Maximum Reactive
M KW
IEEE Display Mode
Power (P)
Import Demand
Maximum Real
Present
D KVA
Demand (S)
Apparent Power
C -KWh
C +KWh
C PF
C KVA
CKVAR
C KW
C VLN
B -KWh
B +KWh
B PF
B KVA
BKVAR
B KWB VLN
A -KWh
A +KWh
A PF
A KVA
AKVAR
A KW
A VLN
3 -KWh
Total Export
Total Import
3 +KWh
3 PF
Power Factor
3 KVA
Total Apparent
3KVAR
Total Reactive
3 KW
Total Real
3 VLN
Volts Line-Neutral (V)
Real Energy
Real Energy
(Average of
Active Phases)
Power (S)
Power (Q)
>>> Scroll When Idle >>>
Power (P)
Phases)
(Average of Active
Import
KVAh
Apparent Energy
KVAh
Signed Net
Apparent Energy
Energy
KVAR4
Quadrant 4
Export Reactive
Energy
KVAR3
Quadrant 3
Export Reactive
Energy
KVAR2
Quadrant 2
Import Reactive
Energy
KVAR1
Quadrant 1
Import Reactive
Export
3 -KWh
Real Energy
To:
Present
Demand (Q)
DKVAR
Reactive Power
Present
Real Power
Demand (P)
D KW
SETUP
DEMND
Demand
Phase C:
C VAC
C A
CPHAS
3 Phase
B VBC
B A
BPHAS
Phase B:
2 & 3 Phase
Systems Only
A VAB
A A
APHAS
Phase A:
Systems Only
3 VLL
Phases)
(Average of Active
Volts Line-Line (U)
3 A
Amps (A)
(Average of
Active Phases)
_PHAS
All Systems
Summary Data
1, 2, or 3 Phase
16
Energy
Import
3 +KWh
3 KWh
Signed Net
ENRGY
and Counters
Accumulators
Real Energy
Real Energy
To:
ALERT
© 2011 Schneider Electric All Rights Reserved.
Page 21

ZL0093-0A
11/2011
User Interface for Data Configuration
EM3555
ENRGY
(Export Ph)
PULS2
Pulse Counter 2
for Pulse Value
PULS1
See SETUP > SPULS > Wh/P
(Import Ph)
_PHAS
HZ
DEMND
CPHAS
BPHAS
APHAS
Frequency
Pulse Counter 1
Export
E KSh
Apparent Energy
IEC Display Mode
Power (S)
M KS
Export Demand
Maximum Apparent
Power (Q)
M KQ
Export Demand
Maximum Reactive
Demand
M KP
Power Export
Maximum Real
Power
M KS
Import Demand
Maximum Apparent
Power
M KQ
Import Demand
Maximum Reactive
Demand
M KP
Power Import
Maximum Real
Present
Demand
D KS
Apparent Power
C -KPh
C +KPh
C PF
C KS
C KQ
C KPC V
B -KPh
B +KPh
B PF
B KS
B KQ
B KP
B V
A -KPh
A +KPh
A PF
A KS
A KQ
A KP
A V
3 -KPh
Total Export
Total Import
3 +KPh
3 PF
(Average of
Power Factor
3 KS
Total Apparent
3 KQ
Total Reactive
3 KP
Total Real
3 V
Volts Line-Neutral (V)
Real Energy
Real Energy
Active Phases)
Power (S)
Power (Q)
>>> Scroll When Idle >>>
Power (P)
Phases)
(Average of Active
Import
E KSh
Apparent Energy
E KSh
Signed Net
Apparent Energy
Energy
Q4 Qh
Quadrant 4
Export Reactive
Energy
Q3 Qh
Quadrant 3
Export Reactive
Energy
Q2 Qh
Quadrant 2
Import Reactive
Energy
Q1 Qh
Quadrant 1
Import Reactive
Export
E -KPh
Real Energy
Volts CA
Present
Demand
D KQ
Reactive Power
Present
Demand
Real Power
D KP
To:
SETUP
DEMND
Demand
C U
C A
CPHAS
3 Phase
Phase C:
Systems Only
© 2011 Schneider Electric All Rights Reserved.
Phase B:
Volts BC
B U
B A
BPHAS
2 & 3 Phase
Systems Only
A U
A A
APHAS
Phase A:
All Systems
Volts AB
3 U
3 A
_PHAS
Phases)
(Average of Active
Volts Line-Line (U)
Amps (A)
(Average of
Active Phases)
Import
E +KPh
Real Energy
E KPh
Signed Net
Real Energy
To:
ENRGY
ALERT
Energy
and Counters
1, 2, or 3 Phase
Summary Data
Accumulators
17
Page 22

EM3555
Alert/Reset Information
ALERT/RESET INFORMATION
To: ENRGY
ZL0093-0A
11/2011
Alert Status
(check if
Wrench on
LCD)
Unit
Information
Reset
Data
Setup
Meter
ALERT
INFO
RESET
SETUP
PLOSS
-------A b C
Phase Loss
A B C
LOWPF
-------A b C
Low Power Factor
A B C
F ERR
-------A
Frequency Out
of Range
A
Display “nOnE” if no alerts
MODEL OS SNRS
Model
Number
Operating
System
Reset
System
Back
PASWD
--------
0
0000
Enter Reset
Password
ENERG
--------
rES
Reset Energy
Accumulators to 0
Reset Demand
Maximums to Present
PASWD
--------
0
0000
Enter Setup
Password
DEMND
--------
rES
I OVR
-------A b C
Over Current
(Clipping)
A B C
Serial
Number
COUNT
rES
Reset Pulse
Counters to 0
--------
V OVR
-------A b C
Over Voltage
(Clipping)
A B C
INFO
RESET
To Setup
PULSE
------- Error
Energy Pulse Output:
Error = Overrun Error
ConF = Configuration Error
ALERT
PASWD – Enter the Reset Password
(configured in the setup menu).
ENERG – Reset all Energy
Accumulators (Wh, VARh, VAh) to 0.
Press “+” or “-“ to Reset.
DEMND – Reset all Maximum
Demand (W, VAR, VA) to the present
Demand. Hit “+” or “-“ to Reset.
COUNT – Reset the pulse counters.
Press “+” or “-“ to Reset.
To: DEMND
18
© 2011 Schneider Electric All Rights Reserved.
Page 23

ZL0093-0A
11/2011
USER INTERFACE FOR SETUP
To Setup p. 2 “SPASS”
Back S COM
From:
SETUP > PASWD
RS-485
Output
ADDR
--------
0
01
BAUD
-------38400
19200
9600
4800
2400
1200
Next
PAR
-------nOnE
EvEn
Odd
User Interface for Setup
EM3555
Set Communications Parameters:
ADDR - Modbus Address: 1 – 247.
Press + to increment the selected (blinking) digit.
Press - to select the digit to the left.
BAUD - Baud Rate: 1200 – 38400 Baud
PAR - Parity: Odd, Even, None
Press + or - to step through the options.
Transformer
Back To SETUP
Back
Current
Back
System
Type
Back
Potential
Transformer
Back
Sytem
Voltage
S CT
S SYS
S PT
S V
CT V
--------
1.0
.33
SYSTM
--------
3L-1n
3L
2L-1n
2L
1L-1n
RATIO
--------
001
V LL
--------
0
0600
Next
.00
Next
Next
CT SZ
--------
00
1
Next
Set System Configuration:
SYSTM: + or – to step through the following System Type options:
System
3L-1n 40 3 Wye Three Phase: A, B, & C with Neutral (Default).
3L 31 3 Delta Three Phase: A, B & C; no Neutral
2L-1n 12 2 Single Split Phase: A & B with Neutral
2L 11 1 Single Phase: A & B; no Neutral
1L-1n 10 1 Single Phase: A to Neutral
Set Potential Transfomer Ratio:
RATIO – Potential transformer step down is RATIO:1. Default is 1:1
(No PT installed). See Install for wiring diagrams. This value must be
set before the System Voltage (if used).
Set System Voltage:
V LL – The nominal Line to Line Voltage for the system. This is used
by the meter to calculate the theoretical maximum system power, and
as the reference voltage for setting the Phase Loss threshold.
Maximum is 32000 Volts. For system type 1+N (10), this is a Line to
Neutral Voltage, indicated by “V LN”. Note: the meter will reject settings
that are not within the meter’s operating range when divided by the PT
ratio.
Set Current Transducer:
CT V - CT Input Voltage: + or – to Select 1.0 or 0.33V.
CT SZ - CT Size: in Amps. Maximum is 32000 Amps.
Reg 130 CTs Description
Back
S PWR
Sytem
Voltage
To Setup p. 2 “SPLOS”
© 2011 Schneider Electric All Rights Reserved.
MX KW
--------
103.92
Next
System Power:
MX KW – The theoretical Maximum System Power is calculated by the
meter from the System Voltage, CT size, and System Type. Power
Factor is assumed to be unity. The value of System Power is used to
determine which combinations of pulse weight and duration are valid
and will keep up with the maximum power the meter will see. This value
is read only.
Note: Bold is the Default.
19
Page 24

EM3555
User Interface for Setup
ZL0093-0A
11/2011
To Setup p. 1 “S PWR”
mS/P
-------500
250
100
50
25
10
Next
IMBAL
--------
0.2
Next
SEC
--------
0
0900
Next
5
Max
PPS
--------
10
20
50
VOLTS
Back
Back
Back To SETUP
Back
SPLOS
Phase
Loss
SPULS
Pulse
Output
SDMND
Demand
--------
0.1
Wh/P
-------10000
1000
100
10
INTRV
--------
0
6
5
4
3
2
1
Set Phase Loss:
VOLTS - Phase Loss Voltage: The fraction of the system
voltage below which Phase Loss Alarm is on. For system
types with neutral, the Line to Neutral voltage is also
calculated and tested. If the System Voltage is 600 and the
fraction is set to 0.10, then the Phase Loss threshold will be
60 volts.
IMBAL - Phase Loss Imbalance: The fractional difference
in Line to Line voltages above which Phase Loss Alarm is
on. For system types with neutral, the Line to Neutral
voltages are also tested. For system types 1+N (10) and 2
(11) , imbalance is not tested.
Set Pulse:
The System Type , CT size, PT Ratio, and System Voltage must
all be configured before setting the Pulse Energy. If any of these
parameters are changed, the meter will hunt for a new Pulse
Duration, but will not change the Pulse Energy. If it cannot find a
solution, the meter will display the wrench, show “ConF” in the
ALARM -> PULSE screen, and enable Energy pulse output
configuration error bit in the Modbus Diagnostic Alert Bitmap (if
1
equipped).
2
Wh/P - Set Pulse Energy: In Watt Hours (& VAR Hours, if
5
present) per Pulse. When moving down to a smaller energy, the
meter will not allow the selection if it cannot find a pulse duration
that will allow the pulse output to keep up with Theoretical
Maximum System Power (see S_PWR screen). When moving
up to a larger energy, the meter will jump to the first value where
it can find a valid solution.
mS/P – Minimum Pulse Duration Time: This read only value
is set by the meter to the slowest duration (in mS per closure)
that will keep up with the Theoretical Maximum System Power.
The open time is greater than or equal to the closure time. The
maximum Pulses Per Second (PPS) is shown in yellow.
Set Demand Interval:
INTRV - The number of Sub-Intervals (1 to 6) in a Demand Interval.
Default is 1 (block demand).
SEC - Sub-Interval length in seconds. Default is 900 (15 minutes).
Set to 0 for external sync-to-comms (Modbus units only).
Back
Back
Passwords
To Setup page 1 “S COM”
S DIS
Display
Units
SPASS
Setup
20
UNITS
--------
IEEE
IEC
Next
SETUP
--------
0
0000
RESET
--------
0
0000
Next
Set Display Units: +/- to switch between:
IEEE – VLL VLN W VAR VA Units.
IEC - U V P Q S Units.
Set Passwords:
SETUP - The Password to enter the SETUP menu.
RESET - The Password to enter the RESET menu.
© 2011 Schneider Electric All Rights Reserved.
Page 25

ZL0093-0A
11/2011
RS-485 COMMUNICATIONS
Daisy-chaining Devices to the Power Meter
RS-485 Communications
The RS-485 slave port allows the power meter to be connected in a daisy chain
with up to 63 2-wire devices. In this bulletin, communications link refers to a
chain of devices that are connected by a communications cable.
Figure 7 Daisy-chaining multiple devices
Belden 1120 A or equivalent (600 V)
120 Ω terminator
on the rst and
last device of the
daisy chain
EM3555
+
–
S
Shield wire
• The terminal’s voltage and current ratings are compliant with the
requirements of the EIA RS-485 communications standard.
• The RS-485 transceivers are ¼ unit load or less.
• RS-485+ has a 47 kΩ pull up to +5V, and RS-485- has a 47 kΩ pull
down to Shield (RS-485 signal ground).
• Wire the RS-485 bus as a daisy chain from device to device, without
any stubs. Use 120 Ω termination resistors at each end of the bus (not
included).
• Shield is not internally connected to Earth Ground.
• Connect Shield to Earth Ground somewhere on the RS-485 bus.
• Use 14-24 gauge wire for all connections.
• When tightening terminals, ensure that the correct torque is applied:
3.5 - 4.4 in·lb (0.4-0.5 N·m).
© 2011 Schneider Electric All Rights Reserved.
Figure 8 Torque requirements
3.5–4.4 in•lb
(0.4–0.5 N•m)
+
–
S
Use 14-24 gauge wire
Red
Black
Gray
21
Page 26

EM3555
Data Logging
DATA LO GGIN G
Configuration
ZL0093-0A
11/2011
The EM3555 includes a data logging feature that records 10 meter parameters,
each in its own buffer.
Use register 150 to set the data logging time subinterval. Writing to the storage
buffer is triggered by the subinterval timer. The default subinterval is 15 minutes
(at a 15 minute interval setting, the buffers hold 60 days of data). An external
timer can be used over Modbus by setting this register to 0.
Use register 159 to turn on data logging and select either Single Shot or
Continuous mode. The default settings are data logging on and set to
Continuous mode. In Single Shot mode, the meter records data until the buffer
is full. When the buffer is full, the meter stops recording new readings. Data
for this time period is kept, but newer energy information is lost. In Continuous
mode, the meter continues to record energy data as long as the meter is
operating. The buffer can only hold 5760 entries at one time, however, so when
the number of records exceeds 5760, the oldest entry is deleted to make room
for the newest.
Registers 169-178 contain the pointers to 10 data storage buffers. Each buffer
is user-congurable with the Modbus address of the 16-bit data output to be
stored. Measurement variables with 32-bit data, such as oating point data or
32-bit integer energy accumulators, require two buffers. However, the lower 16
bits of an integer energy accumulator can be stored in a single buffer (optional).
Reading Data
Read/Write Collision
When the EM3555 is rst installed, the buffers contain QNAN data, with a value
of 0x8000. This data is considered invalid. If the buffer is reset at any point, all
entries in the buffers are overwritten with this 0x8000 value, indicating that it is
invalid. All invalid data is overwritten as the meter lls the buffer with new data
entries.
Use register 158 to choose which buffer to read. When this register value is set
to 0, the meter is in data logging mode. Changing this value from 0 (to 1 through
10) switches the meter to reading mode and selects a buffer to read. Data from
the selected buffer appears in registers 8000 to 13760.
If the demand sub-interval timeout occurs while the user is reading a page
(register 158 ≠ 0), the log data will be held in RAM until the next demand
subinterval. At that time, both the saved data from the previous cycle and
the new data will be written to the log, whether the page register has been
set back to 0 or not. Error bits in the Log Status Register (160) track these
conditions. Subsequent log writes will proceed normally. Provided the log read
is concluded in less time than the demand sub-interval, this mechanism handles
the occasional collision and prevents the user from reading data as the buffer is
being updated.
The Log Status Register has additional error ag bits that indicate whether
logging has been reset or interrupted (power cycle, etc.) during the previous
demand sub-interval, and whether the Real Time Clock has been changed
(re-initialized to default date/time due to a power-cycle or modied via Modbus
commands).
22
© 2011 Schneider Electric All Rights Reserved.
Page 27

ZL0093-0A
11/2011
STANDARD MODBUS DEFAULT SETTINGS
Table 7 Modbus Default Settings
Setup Password 00000 –
Reset Password 00000 –
System Type 40 (3 + N) Wye 130
CT Primary Ratio (if CTs
are not included)
CT Secondary Ratio 0.33 V 132
PT Ratio 1:1 (none) 133
System Voltage 600 V L-L 134
Max. Theoretical Power
(Analog Output: full scale
(20mA or 5V))
Display Mode 1 (IEEE) 137
Phase Loss 10% of System Voltage (60V), 25%
Pulse Energy 1 (kWh/pulse) 144
Demand: number of
sub-intervals per interval
Demand: sub-interval
length
Modbus Address 001 –
Modbus Baud Rate 19200 baud –
Modbus Parity Even –
Log Read Page 0 158
Logging Conguration
Register
Log Register Pointer 1 1 (Real Energy MSR) 169
Log Register Pointer 2 2 (Real Energy LSR) 170
Log Register Pointer 3 29 (Reactive Energy MSR) 171
Log Register Pointer 4 30 (Reactive Energy LSR) 172
Log Register Pointer 5 37 (Real Demand) 173
Log Register Pointer 6 38 (Reactive Demand) 174
Log Register Pointer 7 39 (Apparent Demand) 175
Log Register Pointer 8 155 (Month/Day) 176
Log Register Pointer 9 156 (Year/Hour) 177
Log Register Pointer 10 157 (Minutes/Seconds) 178
Standard Modbus Default Settings
EM3555
Setting Value Modbus
Register
100 A 131
104 kW 135
142, 143
Phase to Phase Imbalance
1 (block mode) 149
900 sec (15 min) 150
0 159
© 2011 Schneider Electric All Rights Reserved.
23
Page 28

EM3555
Modbus Point Map
MODBUS POINT MAP
Supported Modbus Commands
ZL0093-0A
11/2011
The EM3555 Full Data Set (FDS) features data outputs such as demand
calculations, per phase signed watts VA and VAR, import/export Wh and VAh,
and VARh accumulators by quadrant. The Data Logging function adds log
conguration registers 155-178 and log buffer reading at registers 8000-13760.
The meter supports variable CTs and PTs, allowing a much wider range of
operation from 90V x 5A up to 32000V x 32000A. To promote this, the meter
permits variable scaling of the 16-bit integer registers via the scale registers.
The 32-bit oating point registers do not need to be scaled.
Integer registers begin at 001 (0x001). Floats at 257 (0x101). Conguration
registers at 129 (0x081). Values not supported in a particular System Type
conguration will report QNAN (0x8000 in Integer Registers, 0x7FC00000 in
Floating Point Registers). Register addresses are in PLC style base 1 notation.
Subtract 1 from all addresses for the base 0 value used on the Modbus RS-485
link.
Note: ID String information varies from model to model. Text shown here is an
example.
Table 8 Supported Commands
Command Description
0x03 Read Holding Registers
0x04 Read Input Registers
0x06 Preset Single Register
0x10 Preset Multiple Registers
Report ID
Return string:
byte0: address
byte1: 0x11
0x11
0x2B
byte2: #bytes following w/out crc
byte3: ID byte = 247
byte4: status = 0xFF if the operating system is used; status =
0x00 if the reset system is used
bytes5+: ID string = “Schneider Electric EM3555 Power Meter
Full Data Set” or “Schneider Electric EM3555 Power Meter RESET SYSTEM RUNNING RS Version x.xxx” last 2 bytes: CRC
Read Device Identication, BASIC implementation (0x00, 0x01
and 0x02 data), Conformity Level 1.
Object values:
0x01: “Schneider Electric EM”
0x02: “3555”
0x03: “Vxx.yyy”, where xx.yyy is the OS version number
(reformatted version of the Modbus register #7001, (Firmware
Version, Operating System).
If register #7001 == 12345, then the 0x03 data would be
“V12.345”).
24
© 2011 Schneider Electric All Rights Reserved.
Page 29

ZL0093-0A
11/2011
Legend
Modbus Point Map
EM3555
The following table lists the addresses assigned to each data point. For oating
point format variables, each data point appears twice because two 16-bit
addresses are required to hold a 32-bit oat value. Negative signed integers are
2’s complement.
R/W
NV
Format
Units Lists the physical units that a register holds.
Scale
Factor
Range Denes the limit of the values that a register can contain.
R=read only
R/W=read from either integer or oat formats, write only to integer
format.
Value is stored in non-volatile memory. The value will still be available if
the meter experiences a power loss and reset.
UInt Unsigned 16-bit integer.
SInt Signed 16-bit integer.
ULong Unsigned 32-bit integer; Upper 16-bits (MSR) in lowest
numbered / rst listed register (001/002 = MSR/LSR).
SLong Signed 32-bit integer; Upper 16-bits (MSR) in lowest
numbered / rst listed register (001/002 = MSR/LSR).
Float 32-bit oating point; Upper 16-bits (MSR) in lowest numbered
/ rst listed register (257/258 = MSR/LSR). Encoding is per
IEEE standard 754 single precision.
Some Integer values must be multiplied by a constant scale factor
(typically a fraction), to be read correctly. This is done to allow integer
numbers to represent fractional numbers.
SunSpec Alliance Interoperability Specification Compliance
This meter implements the draft SunSpec 1.0 common elements starting at
base 1 address 40001, and the proposed SunSpec 1.1 meter model at 40070
(these addresses are not in Modicon notation). See www.sunspec.org for copies
of these specications.
© 2011 Schneider Electric All Rights Reserved.
25
Page 30

EM3555
Modbus Point Map
ZL0093-0A
11/2011
R/W
NV
Format
Units
Scale
Range
Description
REGISTER
Integer Data: Summary of Active Phases
001
R NV SLong kWh E
002 LSR
003
R NV ULong kWh E
004 LSR
005
R NV ULong kWh E
006 LSR
007
R NV ULong kVARh E
008 LSR
009
R NV ULong kVARh E
010 LSR
011
R NV ULong kVARh E
012 LSR
013
R NV ULong kVARh E
014 LSR
015
R NV SLong kVAh E
016 LSR
017
R NV ULong kVAh E
018 LSR
019
R NV ULong kVAh E
020 LSR
021 R SInt kW W
-2147483647
to
+2147483647
0 to
0xFFFFFFFF
0 to
0xFFFFFFFF
0 to
0xFFFFFFFF
0 to
0xFFFFFFFF
0 to
0xFFFFFFFF
0 to
0xFFFFFFFF
-2147483647
to
+2147483647
0 to
0xFFFFFFFF
0 to
0xFFFFFFFF
-32767 to
+32767
Real Energy: Net (Import - Export)
Real Energy: Quadrants 1 & 4
Import
Real Energy: Quadrants 2 & 3
Export
Reactive Energy - Quadrant 1:
Lags Import Real Energy (IEC) Inductive (IEEE)
Reactive Energy - Quadrant 2:
Leads Export Real Energy (IEC) Inductive (IEEE)
Reactive Energy - Quadrant 3:
Lags Export Real Energy (IEC) Capacitive (IEEE)
Reactive Energy - Quadrant 4:
Leads Import Real Energy (IEC) Capacitive (IEEE)
Apparent Energy: Net (Import - Export)
Apparent: Quadrants 1 & 4
Import
Apparent: Quadrants 2 & 3
Export
Total Instantaneous Real (P) Power
MSR
MSR
MSR
MSR
MSR
MSR
MSR
MSR
MSR
MSR
Accumulated Real
Energy (Ph)
Accumulated
Reactive Energy
(Qh):
Quadrants 1 + 2 =
Import
Quadrants 3 + 4 =
Export
Accumulated
Apparent Energy
(Sh):
Import and Export
correspond with Real
Energy
Clear via reset
register 129
022 R SInt kVAR W 0 to 32767 Total Instantaneous Reactive (Q) Power
023 R UInt k VA W 0 to 32767 Total Instantaneous Apparent (S) Power (vector sum)
024 R SInt Ratio 0.0001
025 R UInt Volt V 0 to 32767 Voltage, L-L (U), average of active phases
026 R UInt Volt V 0 to 32767 Voltage, L-N (V), average of active phases
027 R UInt Amp I 0 to 32767 Current, average of active phases
028 UInt Hz 0.01 4500 to 6500 Frequency
029 R SInt kW W
030 SInt kVAR W
031 R SInt kVA W
-10000 to
+10000
-32767 to
+32767
-32767 to
+32767
-32767 to
+32767
Total Power Factor (total kW / total kVA)
Total Real Power Present Demand
Total Reactive Power Present Demand
Total Apparent Power Present Demand
26
© 2011 Schneider Electric All Rights Reserved.
Page 31

ZL0093-0A
11/2011
Modbus Point Map
EM3555
NV
R/W
Format
Units
Scale
Range
REGISTER
032 R NV SInt kW W
033 R NV SInt kVAR W
034 R NV SInt kVA W
035 R NV SInt kW W
037 R NV SInt kVA W
038 R UInt Reserved (returns 0x8000 - QNAN)
039
040 LSR
041
042 LSR
043
044 LSR
045
046 LSR
047
048 LSR
049
050 LSR
051
052 LSR
053
054
R NV ULong
R NV ULong
R NV ULong kWh E
R NV ULong kWh E
R NV ULong kWh E
R NV ULong kWh E
R NV ULong kWh E
R NV ULong kWh E
-32767 to
+32767
-32767 to
+32767
-32767 to
+32767
-32767 to
+32767
-32767 to
+32767
-32767 to
+32767
0 to
0xFFFFFFFF
0 to
0xFFFFFFFF
0 to
0xFFFFFFFF
0 to
0xFFFFFFFF
0 to
0xFFFFFFFF
0 to
0xFFFFFFFF
0 to
0xFFFFFFFF
0 to
0xFFFFFFFF
Total Real Power Max. Demand
Total Reactive Power Max. Demand
Total Apparent Power Max. Demand
Total Real Power Max. Demand
Total Reactive Power Max. Demand
Total Apparent Power Max. Demand
Pulse Counter 1
(Import Real Energy)
Pulse Counter 2
(Export Real Energy)
Accumulated Real Energy,
Phase A
Accumulated Real Energy,
Phase B
Accumulated Real Energy,
Phase C
Accumulated Real Energy,
Phase A
Accumulated Real Energy,
Phase B
Accumulated Real Energy,
Phase C
MSR
MSR
MSR
MSR
MSR
MSR
MSR
MSR
LSR
Description
Import
Reset via register
129
Export036 R NV SInt kVAR W
Contact Closure Counters. Valid for both pulse
inputs and outputs. EM3555 counts are shown in
parentheses. See register 144 - Energy Per Pulse
for the Wh per pulse count.
Import
Accumulated Real
Energy (Ph), per
phase
Export
© 2011 Schneider Electric All Rights Reserved.
27
Page 32

EM3555
Modbus Point Map
ZL0093-0A
11/2011
REGISTER
055
056
057
058
059
060
061
062
063
064
065
066
067
068
069
070
071
072
073
074
075
076
077
078
NV
R/W
R NV ULong kVARh E
R NV ULong kVARh E
R NV ULong kVARh E
R NV ULong kVARh E
R NV ULong kVARh E
R NV ULong kVARh E
R NV ULong kVARh E
R NV ULong kVARh E
R NV ULong kVARh E
R NV ULong kVARh E
R NV ULong kVARh E
R NV ULong kVARh E
Format
Units
Scale
0 to
0xFFFFFFFF
0 to
0xFFFFFFFF
0 to
0xFFFFFFFF
0 to
0xFFFFFFFF
0 to
0xFFFFFFFF
0 to
0xFFFFFFFF
0 to
0xFFFFFFFF
0 to
0xFFFFFFFF
0 to
0xFFFFFFFF
0 to
0xFFFFFFFF
0 to
0xFFFFFFFF
0 to
0xFFFFFFFF
Range
Accumulated Q1 Reactive
Energy, Phase A
Accumulated Q1 Reactive
Energy, Phase B
Accumulated Q1 Reactive
Energy, Phase C
Accumulated Q2 Reactive
Energy, Phase A
Accumulated Q2 Reactive
Energy, Phase B
Accumulated Q2 Reactive
Energy, Phase C
Accumulated Q3 Reactive
Energy, Phase A
Accumulated Q3 Reactive
Energy, Phase B
Accumulated Q3 Reactive
Energy, Phase C
Accumulated Q4 Reactive
Energy, Phase A
Accumulated Q4 Reactive
Energy, Phase B
Accumulated Q4 Reactive
Energy, Phase C
MSR
LSR
MSR
LSR
MSR
LSR
MSR
LSR
MSR
LSR
MSR
LSR
MSR
LSR
MSR
LSR
MSR
LSR
MSR
LSR
MSR
LSR
MSR
LSR
Description
Import
Accumulated
Reactive Energy
(Qh), Per Phase
Export
28
© 2011 Schneider Electric All Rights Reserved.
Page 33

ZL0093-0A
11/2011
Modbus Point Map
EM3555
NV
R/W
Format
Units
Scale
Range
REGISTER
079
080 LSR
081
082 LSR
083
084 LSR
085
086 LSR
087
088 LSR
089
090 LSR
091 R SInt kW W
093 R SInt kW W
094 R SInt kVAR W
096 R SInt kVAR W
R NV ULong kVAh E
R NV ULong kVAh E
R NV ULong kVAh E
R NV ULong kVAh E
R NV ULong kVAh E
R NV ULong kVAh E
0 to
0xFFFFFFFF
0 to
0xFFFFFFFF
0 to
0xFFFFFFFF
0 to
0xFFFFFFFF
0 to
0xFFFFFFFF
0 to
0xFFFFFFFF
-32767 to
+32767
-32767 to
+32767
-32767 to
+32767
-32767 to
+32767
-32767 to
+32767
-32767 to
+32767
Accumulated Apparent
Energy, Phase A
Accumulated Apparent
Energy, Phase B
Accumulated Apparent
Energy, Phase C
Accumulated Apparent
Energy, Phase A
Accumulated Apparent
Energy, Phase B
Accumulated Apparent
Energy, Phase C
Real Power (P), Phase A
Real Power (P), Phase B
Real Power (P), Phase C
Reactive Power (Q), Phase A
Reactive Power (Q), Phase B
Reactive Power (Q), Phase C
MSR
MSR
MSR
MSR
MSR
MSR
Description
Import
Accumulated
Apparent Energy
(Sh), Per Phase
Export
Real Power (P)092 R SInt kW W
Reactive Power (Q)095 R SInt kVAR W
097 R UInt k VA W 0 to 32767 Apparent Power (S), Phase A
099 R UInt k VA W 0 to 32767 Apparent Power (S), Phase C
100 R SInt Ratio 0.0001
102 R SInt Ratio 0.0001
103 R UInt Volt V 0 to 32767 Voltage (U), Phase A-B
105 R UInt Volt V 0 to 32767 Voltage (U), Phase A-C
106 R UInt Volt V 0 to 32767 Voltage (V), Phase A-N
108 R UInt Volt V 0 to 32767 Voltage (V), Phase C-N
109 R UInt Amp I 0 to 32767 Current, Phase A
111 R UInt Amp I 0 to 32767 Current, Phase C
112 R UInt Reserved (returns 0x8000 - QNAN)
-10000 to
+10000
-10000 to
+10000
-10000 to
+10000
Power Factor (PF), Phase A
Power Factor (PF), Phase B
Power Factor (PF), Phase C
Apparent Power (S)098 R UInt k VA W 0 to 32767 Apparent Power (S), Phase B
Power Factor (PF)101 R SInt Ratio 0.0001
Line-to-Line voltage (U)104 R UInt Volt V 0 to 32767 Voltage (U), Phase B-C
Line-to-Neutral voltage (V)107 R UInt Volt V 0 to 32767 Voltage (V), Phase B-N
Current110 R UInt Amp I 0 to 32767 Current, Phase B
© 2011 Schneider Electric All Rights Reserved.
29
Page 34

EM3555
Modbus Point Map
ZL0093-0A
11/2011
NV
R/W
Format
Units
Scale
Range
REGISTER
Reset:
- Write 30078 (0x757E) to clear all energy accumulators to 0 (all).
- Write 21211 (0x52DB) to begin new demand sub-interval calculation cycle. Takes effect at the end of
129 R/W UInt N/A
10,
130 R/W NV UInt
131 R/W NV UInt Amps 1-32000 CT Ratio – Primary
132 R/W NV UInt 1, 3
133 R/W NV UInt 100 0.01-320.00
134 R/W NV UInt 82-32000
135 R NV UInt kW W 1-32767
136 R UInt Reserved (returns 0)
11,
12,
31,
40
the next 1 second calculation cycle. Write no more frequently than every 10 seconds.
- Write 21212 (0x52DC) to reset max. demand values to present demand values. Takes effect at the end
of the next 1 second calculation cycle. Write no more frequently than every 10 seconds.
- Write 16640 (0x4100) to reset logging.
- Write 16498 (0x4072) to clear pulse counts to zero.
- Read (returns 0).
Single Phase: A + N
Single Phase: A + B
Single Split Phase: A + B + N
3 phase ∆, A + B + C, no N
3 phase Y, A + B + C + N
CT Ratio – Secondary Interface (1 or 1/3 V, may not be user
congurable)
PT Ratio: The meter scales this value by 100 (i.e. entering 200 yields a potential transformer ratio of
2:1). The default is 100 (1.00:1), which is with no PT attached. Set this value before setting the system
voltage (below).
System Voltage: This voltage is line to line, unless in system type 10 (register 130), which is line to
neutral. The meter uses this value to calculate the full scale power for the pulse conguration (below),
and as full scale for phase loss (register 142). The meter will refuse voltages that are outside the range
of 82-660 volts when divided by the PT Ratio (above).
Theoretical Maximum System Power – This read only register is the theoretical maximum power the
meter expects to see on a service. It is calculated by the meter from the system type (register 130), CT
size (register 131), and system voltage (register 134) and is updated whenever the user changes any of
these parameters. It is used to determine the maximum power the pulse outputs can keep up with. This
integer register has the same scale as other integer power registers (see register 140 for power scaling).
Description
System Type
(Note: only the indicated phases are
monitored for phase loss)
Current inputs
137 R/W NV UInt 0,1 Display Units: 0 = IEC (U, V, P, Q, S), 1 = IEEE (default: VLL, VLN, W, VAR, VA)
138 R SInt
139 R SInt Scale Factor V (Voltage)
140 R SInt Scale Factor W (Power)
141 R SInt Scale Factor E (Energy)
-4 0.0001
-3 0.001
-2 0.01
-1 0.1
0 1.0
1 10.0
2 100.0
3 1000.0
4 10000.0
Scale Factor I (Current)
30
Scale Factors
Note: These registers contain a signed integer,
which scales the corresponding integer
registers. Floating point registers are not
scaled. Scaling is recalculated when the meter
conguration is changed.
© 2011 Schneider Electric All Rights Reserved.
Page 35

ZL0093-0A
11/2011
Modbus Point Map
EM3555
NV
R/W
Format
Units
Scale
Range
REGISTER
Phase Loss Voltage Threshold in percent of system
voltage (register 134). Default value is 10 (%). Any
phase (as congured in register 130) whose level
drops below this threshold triggers a phase loss alert,
142 R/W NV UInt % 1-99
143 R/W NV UInt % 1-99
10000,
144 R/W NV UInt Wh
145 R NV UInt msec
146 R UInt
147 R NV UInt 0-32767 Count of Energy Accumulator resets
1000,
100,
10
500,
250,
100,
50,
25,
10
i.e., if the system voltage is set to 480 V L-L, the L-N
voltage for each phase should be 277 V. When the
threshold is set to 10%, if any phase drops more
than 10% below 277 V, (less than 249 V), or if any
L-L voltage drops more than 10% below 480 V (less
than 432 V) the corresponding phase loss alarm bit in
register 146 will be true.
Phase Loss Imbalance Threshold in Percent. Default
is 25% phase to phase difference. For a 3-phase Y (3
+ N) system type (40 in register 130), both line-to-neutral and line-to-line voltages are tested. In a 3-phase
system type (31 in register 130), only line-to-line
voltages are examined. In a single split-phase (2 + N)
system type (12 in register 130), just the line-to-neutral
voltage are compared.
Wh (& VARh, if equipped)
Energy per Pulse Output
Contact Closure. If the meter
cannot nd a pulse duration
that will keep up with the
max. system power (register
135), it will reject the new
value. Check the meter
conguration and/or try a
larger value.
Pulse Contact Closure
Duration in msec. Read-only.
Set to the slowest duration
that will keep up with the
theoretical max. system
power (register 135). The
open time ≥ the closure
time, so the max. pulse
rate (pulses per sec) is the
inverse of double the pulse
time.
Error Bitmap. 1 = Active:
Bit 0: Phase A Voltage out of range
Bit 1: Phase B Voltage out of range
Bit 2: Phase C Voltage out of range
Bit 3: Phase A Current out of range
Bit 4: Phase B Current out of range
Bit 5: Phase C Current out of range
Bit 6: Frequency out of the range of 45 to 65 Hz -OR- insufcient voltage to determine frequency.
Bit 7: Reserved for future use
Bit 8: Phase Loss A
Bit 9: Phase Loss B
Bit 10: Phase Loss C
Bit 11: Low Power Factor on A with one or more phases having a PF less than 0.5 due to mis-wiring of
phases
Bit 12: Low Power Factor on B
Bit 13: Low Power Factor on C
Bit 14: Energy pulse output overrun error. The pulse outputs are unable to keep up with the total real
power (registers 3 and 261/262). To x, increase the pulse energy register (register 144) and reset the
energy accumulators (see reset register 129).
Bit 15: Energy pulse output conguration error (present pulse energy setting may not keep up with the
theoretical max. system power; see register 135). To x, increase the pulse energy (register 144).
kWh (& VARh, if equipped) Pulse Contacts
Note: The kWh pulse contact can keep up with a maximum power (Watts)
of 1800000 x Wh pulse weight ÷ contact closure duration (in msec).
Description
Phase Loss Output
Note: The phases tested are determined by the
system type.
148 R UInt Reserved (returns 0)
© 2011 Schneider Electric All Rights Reserved.
31
Page 36

EM3555
Modbus Point Map
ZL0093-0A
11/2011
NV
R/W
Format
Units
Scale
Range
REGISTER
Number of Sub-Intervals per Demand Interval. Sets the number of sub-intervals
149 R/W NV UInt 1-6
150 R/W NV UInt Seconds 0, 10-32767
151 R/W UInt 1-32767 Reserved (returns 0)
152 R NV UInt 0-32767 Power Up Counter
153 R NV UInt 0-32767
154 R UInt Reserved (returns 0)
Logging Conguration and Status
155 R/W NV UInt
156 R/W NV UInt
157 R/W NV UInt
158 R/W NV UInt 0-10
159 R/W NV UInt
160 R NV UInt
Day /
Month
Hour /
Year
Seconds
/
Minutes
See Bytes
See Bytes Hour 0-23 (0x00-0x17)
See Bytes Seconds 0-59 (0x00-0x3B)
that make a single demand interval. For block demand, set this to 1. Default is
1. When sub-interval length register #150 is set to 0 (sync-to-comms mode), this
register is ignored.
Sub-Interval Length in seconds. For sync-to-comms, set this to 0 and use the reset
register (129) to externally re-start the sub-interval. This is also the logging interval.
Output Conguration. EM3555 units have a N.O. energy contact and N.C. (Form B) phase loss contact,
so this register will always return a “0”.
Most Signicant Byte (MSB)
Day 1-31 (0x01-0x1F)
Logging Read Page Register. Selects which of the register logs to read (see registers 169-178). 1-10
are valid entries that put the meter into log reading mode, temporarily pausing logging. When set to 0
(no variable selected for reading), normal logging resumes. The meter will buffer one set of log entries
while in reading mode if a sub-interval timeout occurs (read/write collision). Default is 0.
Note: this buffered data will be written to the log, and logging will resume on the following sub-interval
timeout whether the page register has been cleared or not, resulting in the appearance of data moving
in the buffer during reads. To avoid this, log buffer reads should be completed and this register set back
to 0 in less time than the demand sub-interval (preferred) or logging should be halted by setting Bit 1 in
register 158 (logs may be missed).
Logging Conguration Register (Bit Mapped):
Bit 0: Clear to 0 for circular log buffer mode. Set to 1 for single shot logging mode. Default is 0 (Circular).
Bit 1: Clear to 0 to enable Logging. Set to 1 to halt logging. Default is 0 (Log).
Logging Status Register (Bit Mapped):
Bit 0: Log buffer full – Set to 1 when one single shot mode has lled the log buffer. In this condition,
the Logged Entry Count will continue to increment. Cleared to 0 when logging is restarted (see reset
command register 129).
Bit 1: Log Buffer Read Collision 1 – Set to 1 if the meter tried to save log data while the user was
reading the log (Logging Page Register has been set to something other than 0). On the rst collision,
the meter holds the data until the next sub-interval and then writes the saved data to the log as well as
the data for that interval. This bit is cleared to 0 on the rst demand interval with Logging Page Register
= 0.
Bit 2: Log Buffer Read Collision 2 – Set to 1 on the 2nd attempt to save log data while the user is
reading the log (Logging Page Register is set to something other than 0). At this point the meter ignores
the read condition and does a double write, rst of the values saved from the previous cycle, and then
the present values. If the read condition is not removed the meter continues to write the log data as it
normally would. This bit is cleared to 0 on the rst demand interval with Logging Page Register = 0.
Bit 3: Logging Reset – The log has been reset during the previous demand sub-interval.
Bit 4: Logging Interrupted – logging has been interrupted (power cycled, log conguration change, etc.)
during the previous demand sub-interval.
Bit 5: RTC Changed – The real time clock had been changed during the previous demand sub-interval.
Bit 6: RTC Reset - The real time clock has been reset to the year 2000 and needs to be re-initialized.
Description
Least Signicant Byte
(LSB)
Month 1-12
(0x01-0x0C)
Year 0-199
(0x00-0xC7)
Minutes 0-59
(0x00-0x3B)
Demand
Calculation
Date / Time Clock. Following a power cycle, resets
to:
Day 01 Month 01
Hour 00 Year (20) 00
32
© 2011 Schneider Electric All Rights Reserved.
Page 37

ZL0093-0A
11/2011
Modbus Point Map
EM3555
NV
R/W
Format
Units
Scale
REGISTER
161 R NV UInt 0-32767
162 R NV UInt 0-32767
163 R NV UInt 0-32767
164
R NV ULong kWh E
165 0-0xFFFF
166 R NV UInt
167 R NV UInt
168 R NV UInt
169 R/W NV UInt
170 R/W NV UInt
171 R/W NV UInt
172 R/W NV UInt
173 R/W NV UInt
174 R/W NV UInt
175 R/W NV UInt
176 R/W NV UInt
Month /
Day
Year /
Hour
Minutes
/
Seconds
0-0xFFFF
See Bytes
See Bytes Hour 0-23 (0x00-0x17)
See Bytes Seconds 0-59 (0x00-0x3B)
1-42,
146,
155-157,
257-336
Description
Range
Log Buffer Wrap / Missed Log Counter. In continuous mode, this counter increments each time the
internal circular log buffer wraps and overwrites old data. The total number of logged entries since the
last log reset is: (Register 161 x 5760) + Register 163. In single shot mode this counter is the number of
log entries lost due to the buffer being full. The counter is cleared on logging reset.
Max Number of Logging Days. Based on the Sub-Interval Length and the depth of the log buffer, this
register shows the maximum number of days that data will be logged following a reset until the Buffer is
full (Single Shot Mode) or overwrites old data (Continuous).
Number of Logged Entries since the log buffer wrapped or was reset. In single shot mode, this is the
total number of valid entries in the buffer. Any entries beyond this will read back as QNAN (0x8000).
Real Energy Consumption
(MSR)
Real Energy Consumption
(LSR)
Most Signicant Byte (MSB)
Day 1-31 (0x01-0x1F)
Log Register 1 –
Default is 3 (Import Real
Energy MSR)
Log Register 2 –
Default is 4 (Import Real
Energy LSR)
Log Register 3 –
Default is 5 (Export Real
Energy MSR)
Log Register 4 –
Default is 6 (Export Real
Energy LSR)
Log Register 5 –
Default is 29 (Real Demand)
Log Register 6 –
Default is 30 (Reactive
Demand)
Log Register 7 –
Default is 31 (Apparent
Demand)
Log Register 8 –
Default is 155 (Month/Day)
Real Energy (Register 001/002) starting value. Corresponds to when
logging is started, reset, or rolls.
Least Signicant Byte
(LSB)
Month 1-12
(0x01-0x0C)
Year 0-199
(0x00-0xC7)
Minutes 0-59
(0x00-0x3B)
Log Register Selection – Write the number of the 16 bit register to be
logged. To log a 32 bit value (such as accumulators and oating point
values) two log registers must be used, one each for the most and least
signicant register (MSR & LSR).
Date & Time of the newest entry in the log. After a
power cycle, resets to:
Day 01 Month 01
Hour 00 Year (20) 00
177 R/W NV UInt
178 R/W NV UInt
© 2011 Schneider Electric All Rights Reserved.
Log Register 9 –
Default is 156 (Year/Hour)
Log Register 10 –
Default is 157 (Minutes/
Seconds)
33
Page 38

EM3555
Modbus Point Map
ZL0093-0A
11/2011
R/W
NV
Format
Units
Scale
Range
Description
REGISTER
Floating Point Data: Summary of Active Phases
257/258 R NV Float kWh Accumulated Real Energy: Net (Import - Export)
259/260 R NV Float kWh
261/262 R Float kWh
263/264 R Float kVARh
265/266 R Float kVARh
267/268 R Float kVARh
269/270 R Float kVARh
271/272 R NV Float kVAh Apparent Energy: Net (Import - Export)
273/274 R NV Float kVAh
275/276 R NV Float kVAh
277/278 R Float kW Total Net Instantaneous Real (P) Power
279/280 R Float kVAR Total Net Instantaneous Reactive (Q) Power
Real Energy: Quadrants 1 & 4
Import
Real Energy: Quadrants 2 & 3
Export
Reactive Energy: Quadrant 1
Lags Import Real Energy (IEC) Inductive (IEEE)
Reactive Energy: Quadrant 2
Leads Export Real Energy (IEC) Inductive (IEEE)
Reactive Energy: Quadrant 3
Lags Export Real Energy (IEC) Capacitive (IEEE)
Reactive Energy: Quadrant 4
Leads Import Real Energy (IEC) Capacitive (IEEE)
Apparent Energy: Quadrants 1 & 4
Import
Apparent Energy: Quadrants 2 & 3
Export
Accumulated Real Energy
(Ph)
Accumulated Reactive
Energy (Qh):
Quadrants 1+2= Import
Quadrants 3+4= Export
Accumulated Apparent
Energy (Sh): Import and
Export correspond with Real
Energy
Clear via register
129
281/282 R Float k VA Total Net Instantaneous Apparent (S) Power
283/284 R Float Ratio 0.0-1.0 Total Power Factor (Total kW / Total kVA)
285/286 R Float Volt Voltage, L-L (U), average of active phases
287/288 R Float Volt Voltage, L-N (V), average of active phases
289/290 R Float Amp Current, average of active phases
291/292 R Float Hz 45.0-65.0 Frequency
293/294 R Float kW Total Real Power Present Demand
295/296 R Float kVAR Total Reactive Power Present Demand
297/298 R Float k VA Total Apparent Power Present Demand
299/300 R NV Float kW Total Real Power Max. Demand
303/304 R NV Float kVA Total Apparent Power Max. Demand
305/306 R NV Float kW Total Real Power Max. Demand
309/310 R NV Float kVA Total Apparent Power Max. Demand
311/312 R Float Reserved (reports QNAN - 0x7FC00000)
313/314 R Float 1 0-4294967040 Pulse Counter 1 (Import Real Energy)
315/316 R Float 1 0-4294967040 Pulse Counter 2 (Export Reactive Energy)
Import301/302 R NV Float kVAR Total Reactive Power Max. Demand
Export307/308 R NV Float kVAR Total Reactive Power Max. Demand
Contact closure counters. Valid for both pulse
inputs and outputs. EM3555 counts are shown in
parentheses. See register 144 for the weight of
each pulse output count. These values are derived
from the 32 bit integer counter and will roll over to
0 when the integer counters do. Inputs are user
dened.
34
© 2011 Schneider Electric All Rights Reserved.
Page 39

ZL0093-0A
11/2011
Modbus Point Map
EM3555
NV
R/W
Format
Units
Scale
Range
REGISTER
Floating Point Data: Per Phase
317/318 R Float kWh Accumulated Real Energy, Phase A
319/320 R Float kWh Accumulated Real Energy, Phase B
321/322 R Float kWh Accumulated Real Energy, Phase C
323/324 R Float kWh Accumulated Real Energy, Phase A
327/328 R Float kWh Accumulated Real Energy, Phase C
329/330 R Float kVARh Accumulated Q1 Reactive Energy, Phase A
331/332 R Float kVARh Accumulated Q1 Reactive Energy, Phase B
333/334 R Float kVARh Accumulated Q1 Reactive Energy, Phase C
335/336 R Float kVARh Accumulated Q2 Reactive Energy, Phase A
339/340 R Float kVARh Accumulated Q2 Reactive Energy, Phase C
341/342 R Float kVARh Accumulated Q3 Reactive Energy, Phase A
343/344 R Float kVARh Accumulated Q3 Reactive Energy, Phase B
Description
Import
Accumulated Real Energy (Ph)
Export325/326 R Float kWh Accumulated Real Energy, Phase B
Quadrant 1
Import
Quadrant 2337/338 R Float kVARh Accumulated Q2 Reactive Energy, Phase B
Accumulated
Reactive Energy
(Qh)
Quadrant 3
345/346 R Float kVARh Accumulated Q3 Reactive Energy, Phase C
347/348 R Float kVARh Accumulated Q4 Reactive Energy, Phase A
351/352 R Float kVARh Accumulated Q4 Reactive Energy, Phase C
353/354 R Float kVAh Accumulated Apparent Energy, Phase A
355/356 R Float kVAh Accumulated Apparent Energy, Phase B
357/358 R Float kVAh Accumulated Apparent Energy, Phase C
359/360 R Float kVAh Accumulated Apparent Energy, Phase A
363/364 R Float kVAh Accumulated Apparent Energy, Phase C
365/366 R Float kW Real Power, Phase A
369/370 R Float kW Real Power, Phase C
371/372 R Float kVAR Reactive Power, Phase A
375/376 R Float kVAR Reactive Power, Phase C
377/378 R Float k VA Apparent Power, Phase A
Export
Quadrant 4349/350 R Float kVARh Accumulated Q4 Reactive Energy, Phase B
Import
Accumulated Apparent Energy (Sh)
Export361/362 R Float kVAh Accumulated Apparent Energy, Phase B
Real Power (P)367/368 R Float kW Real Power, Phase B
Reactive Power (Q)373/374 R Float kVAR Reactive Power, Phase B
Apparent Power (S)379/380 R Float k VA Apparent Power, Phase B
381/382 R Float k VA Apparent Power, Phase C
© 2011 Schneider Electric All Rights Reserved.
35
Page 40

EM3555
Modbus Point Map
ZL0093-0A
11/2011
NV
R/W
Format
Units
Scale
Range
REGISTER
383/384 R Float Ratio 0.0-1.0 Power Factor, Phase A
387/388 R Float Ratio 0.0-1.0 Power Factor, Phase C
389/390 R Float Volt Voltage, Phase A-B
393/394 R Float Volt Voltage, Phase A-C
395/396 R Float Volt Voltage, Phase A-N
399/400 R Float Volt Voltage, Phase C-N
401/402 R Float Amp Current, Phase A
405/406 R Float Amp Current, Phase C
407/408 R Float Reserved (reports QNAN - 0x7FC00000)
Logging Interface
8000 R NV Newest Logged Data Entry
Description
Power Factor (PF)385/386 R Float Ratio 0.0-1.0 Power Factor, Phase B
Line to Line Voltage (U)391/392 R Float Volt Voltage, Phase B-C
Line to Neutral (V)397/398 R Float Volt Voltage, Phase B-N
Current403/404 R Float Amp Current, Phase B
5760 entries total (60 days at a 15 minute sub-interval)(to) (to)
13760 R NV Oldest Logged Data Entry
Invalid or Quiet Not A Number (QNAN) conditions are indicated by 0x8000 (negative zero) for 16 bit integers and 0x7FC00000 for 32 bit oating point numbers.
Floating point numbers are encoded per the IEEE 754 32-bit specications.
36
© 2011 Schneider Electric All Rights Reserved.
Page 41

ZL0093-0A
11/2011
SunSpec Compliant Common and Meter Model Register Blocks
SUNSPEC COMPLIANT COMMON AND METER MODEL REGISTER BLOCKS
Table 9 SunSpec Compliance Information (see www.sunspec.org for the original specifications)
EM3555
Register
R/W
NV
Format
Units
Scale
Range
SunSpec
Name
Description
SunSpec 1.0 Common Model
40001
40002
40003 R NV UInt 1 C_SunSpec_DID SunSpec common model Device ID
40004 R NV UInt 65
40005 to 40020 R NV String (32) ASCII C_Manufacturer
40021 to 40036 R NV String (32) ASCII C_Model null terminated ASCII text string = “EM3555”
40037 to 40044 R NV String (16) ASCII C_Options null terminated ASCII text string
40045 to 40052 R NV String (16) ASCII C_Version null terminated ASCII text string
40053 to 40068 R NV String (32) ASCII C_SerialNumber null terminated ASCII text string
40068 R NV UInt ASCII
R NV ULong
0x5375
6e53
C_SunSpec_ID
C_SunSpec_
Length
C_SunSpec_
Length
ASCII “SunS”. Identies this as the beginning of a
SunSpec Modbus point
Length of the common model block
null terminated ASCII text string = “Schneider
Electric”
Modbus address
SunSpec 1.1 Integer Meter Model
Identication
SunSpec Integer meter model device IDs. Meter
conguration by device ID:
40070 R NV UInt 201 to 204 C_SunSpec_DID
40071 R NV UInt 105
Current
40072 R SInt Amps M_AC_Current_SF -32767 to +32767 M_AC_Current AC Current (sum of active phases)
40073 R SInt Amps M_AC_Current_SF -32767 to +32767 M_AC_Current_A Phase A AC current
40074 R SInt Amps M_AC_Current_SF -32767 to +32767 M_AC_Current_B Phase B AC current
40075 R SInt Amps M_AC_Current_SF -32767 to +32767 M_AC_Current_C Phase C AC current
40076 R NV SInt 1 M_AC_Current_CN AC Current Scale Factor
Voltage: Line to Neutral
40077 R SInt Volts M_AC_Voltage_SF -32767 to +32767 M_AC_Voltage_LN
40078 R SInt Volts M_AC_Voltage_SF -32767 to +32767 M_AC_Voltage_AN Phase A to Neutral AC Voltage
40079 R SInt Volts M_AC_Voltage_SF -32767 to +32767 M_AC_Voltage_BN Phase B to Neutral AC Voltage
40080 R SInt Volts M_AC_Voltage_SF -32767 to +32767 M_AC_Voltage_CN Phase C to Neutral AC Voltage
Voltage: Line to Line
40081 R SInt Volts M_AC_Voltage_SF -32767 to +32767 M_AC_Voltage_LL Line to Line AC voltage (average of active phases)
40082 R SInt Volts M_AC_Voltage_SF -32767 to +32767 M_AC_Voltage_AB Phase A to Phase B AC Voltage
40083 R SInt Volts M_AC_Voltage_SF -32767 to +32767 M_AC_Voltage_BC Phase B to Phase C AC Voltage
40084 R SInt Volts M_AC_Voltage_SF -32767 to +32767 M_AC_Voltage_CA Phase C to Phase A AC Voltage
40085 R NV SInt 1 M_AC_Voltage_SF AC Voltage Scale Factor
Frequency
40086 R SInt Hertz M_AC_Freq_SF -32767 to +32767 M_AC_Freq AC Frequency
40087 R NV SInt SF 1 M_AC_Freq_SF AC Frequency Scale Factor
C_SunSpec_
Length
201 = single phase (A-N or A-B) meter
202 = split single phase (A-B-N) meter
203 = Wye-connect 3-phase (ABCN) meter
204 = delta-connect 3-phase (ABC) meter
Length of the meter model block
Line to Neutral AC voltage (average of active
phases)
© 2011 Schneider Electric All Rights Reserved.
37
Page 42

EM3555
SunSpec Compliant Common and Meter Model Register Blocks
ZL0093-0A
11/2011
NV
R/W
Register
40088 R SInt Watts M_AC_Power_SF -32767 to +32767 M_AC_Power Total Real Power (sum of active phases)
40089 R SInt Watts M_AC_Power_SF -32767 to +32767 M_AC_Power_A Phase A AC Real Power
40090 R SInt Watts M_AC_Power_SF -32767 to +32767 M_AC_Power_B Phase B AC Real Power
40091 R SInt Watts M_AC_Power_SF -32767 to +32767 M_AC_Power_C Phase A AC Real Power
40092 R NV SInt SF 1 M_AC_Power_SF AC Real Power Scale Factor
40093 R SInt Volt-Amps M_AC_VA_SF -32767 to +32767 M_AC_VA Total AC Apparent Power (sum of active phases)
40094 R SInt Volt-Amps M_AC_VA_SF -32767 to +32767 M_AC_VA_A Phase A AC Apparent Power
40095 R SInt Volt-Amps M_AC_VA_SF -32767 to +32767 M_AC_VA_B Phase B AC Apparent Power
40096 R SInt Volt-Amps M_AC_VA_SF -32767 to +32767 M_AC_VA_C Phase A AC Apparent Power
40097 R NV SInt SF 1 M_AC_VA_SF AC Apparent Power Scale Factor
40098 R SInt VA R M_AC_VAR_SF -32767 to +32767 M_AC_VAR Total AC Reactive Power (sum of active phases)
40099 R SInt VA R M_AC_VAR_SF -32767 to +32767 M_AC_VAR_A Phase A AC Reactive Power
40100 R SInt VA R M_AC_VAR_SF -32767 to +32767 M_AC_VAR_B Phase B AC Reactive Power
40101 R SInt VA R M_AC_VAR_SF -32767 to +32767 M_AC_VAR_C Phase A AC Reactive Power
40102 R NV SInt SF 1 M_AC_VAR_SF AC Reactive Power Scale Factor
40103 R SInt % M_AC_PF_SF -32767 to +32767 M_AC_PF Average Power Factor (average of active phases)
40104 R SInt % M_AC_PF_SF -32767 to +32767 M_AC_PF_A Phase A Power Factor
40105 R SInt % M_AC_PF_SF -32767 to +32767 M_AC_PF_B Phase B Power Factor
40106 R SInt % M_AC_PF_SF -32767 to +32767 M_AC_PF_C Phase A Power Factor
40107 R NV SInt SF 1 M_AC_PF_SF AC Power Factor Scale Factor
40108
40109
40110
40 111
40112
40113
40114
40115
40116
40117
40118
40119
40120
40121
40122
40123
40124 R NV SF SF 1 M_Energy_W_SF Real Energy Scale Factor
R NV ULong Watt-hours M_Energy_W_SF 0x0 to 0xFFFFFFFF M_Exported_W Total Exported Real Energy
R NV ULong Watt-hours M_Energy_W_SF 0x0 to 0xFFFFFFFF M_Exported_W_A Phase A Exported Real Energy
R NV ULong Watt-hours M_Energy_W_SF 0x0 to 0xFFFFFFFF M_Exported_W_B Phase B Exported Real Energy
R NV ULong Watt-hours M_Energy_W_SF 0x0 to 0xFFFFFFFF M_Exported_W_C Phase C Exported Real Energy
R NV ULong Watt-hours M_Energy_W_SF 0x0 to 0xFFFFFFFF M_Imported_W Total Imported Real Energy
R NV ULong Watt-hours M_Energy_W_SF 0x0 to 0xFFFFFFFF M_Imported_W_A Phase A Imported Real Energy
R NV ULong Watt-hours M_Energy_W_SF 0x0 to 0xFFFFFFFF M_Imported_W_B Phase B Imported Real Energy
R NV ULong Watt-hours M_Energy_W_SF 0x0 to 0xFFFFFFFF M_Imported_W_C Phase C Imported Real Energy
Format
Units
Scale
Accumulated Energy
Range
Power
Real Power
Apparent Power
Reactive Power
Power Factor
Real Energy
Name
SunSpec
Description
38
© 2011 Schneider Electric All Rights Reserved.
Page 43

ZL0093-0A
11/2011
SunSpec Compliant Common and Meter Model Register Blocks
EM3555
NV
R/W
Register
40125
40126
40127
40128
40129
40130
40131
40132
40133
40134
40135
40136
40137
40138
40139
40140
40141 R NV UInt SF 1 M_Energy_VA_SF Real Energy Scale Factor
40142
40143
40144
40145
40146
40147
40148
40149
40150
40151
40152
40153
40154
40155
40156
40157
40158
40159
40160
40161
40162
40163
40164
40165
40166
40167
40168
40169
40170
40171
40172
40173
40174 R NV UInt SF 1 M_Energy_VA_SF Reactive Energy Scale Factor
R NV ULong VA-hours M_Energy_VA_SF 0x0 to 0xFFFFFFFF M_Exported_VA Total Exported Apparent Energy
R NV ULong VA-hours M_Energy_VA_SF 0x0 to 0xFFFFFFFF M_Exported_VA_A Phase A Exported Apparent Energy
R NV ULong VA-hours M_Energy_VA_SF 0x0 to 0xFFFFFFFF M_Exported_VA_B Phase B Exported Apparent Energy
R NV ULong VA-hours M_Energy_VA_SF 0x0 to 0xFFFFFFFF M_Exported_VA_C Phase C Exported Apparent Energy
R NV ULong VA-hours M_Energy_VA_SF 0x0 to 0xFFFFFFFF M_Imported_VA Total Imported Apparent Energy
R NV ULong VA-hours M_Energy_VA_SF 0x0 to 0xFFFFFFFF M_Imported_VA_A Phase A Imported Apparent Energy
R NV ULong VA-hours M_Energy_VA_SF 0x0 to 0xFFFFFFFF M_Imported_VA_B Phase B Imported Apparent Energy
R NV ULong VA-hours M_Energy_VA_SF 0x0 to 0xFFFFFFFF M_Imported_VA_C Phase C Imported Apparent Energy
R NV ULong VAR-hours M_Energy_VAR_SF 0x0 to 0xFFFFFFFF
R NV ULong VAR-hours M_Energy_VAR_SF 0x0 to 0xFFFFFFFF
R NV ULong VAR-hours M_Energy_VAR_SF 0x0 to 0xFFFFFFFF
R NV ULong VAR-hours M_Energy_VAR_SF 0x0 to 0xFFFFFFFF
R NV ULong VAR-hours M_Energy_VAR_SF 0x0 to 0xFFFFFFFF
R NV ULong VAR-hours M_Energy_VAR_SF 0x0 to 0xFFFFFFFF
R NV ULong VAR-hours M_Energy_VAR_SF 0x0 to 0xFFFFFFFF
R NV ULong VAR-hours M_Energy_VAR_SF 0x0 to 0xFFFFFFFF
R NV ULong VAR-hours M_Energy_VAR_SF 0x0 to 0xFFFFFFFF
R NV ULong VAR-hours M_Energy_VAR_SF 0x0 to 0xFFFFFFFF
R NV ULong VAR-hours M_Energy_VAR_SF 0x0 to 0xFFFFFFFF
R NV ULong VAR-hours M_Energy_VAR_SF 0x0 to 0xFFFFFFFF
R NV ULong VAR-hours M_Energy_VAR_SF 0x0 to 0xFFFFFFFF
R NV ULong VAR-hours M_Energy_VAR_SF 0x0 to 0xFFFFFFFF
R NV ULong VAR-hours M_Energy_VAR_SF 0x0 to 0xFFFFFFFF
R NV ULong VAR-hours M_Energy_VAR_SF 0x0 to 0xFFFFFFFF
Format
Units
Scale
Range
Apparent Energy
Reactive Energy
Name
M_Import_VARh_
Q1
M_Import_VARh_
Q1A
M_Import_VARh_
Q1B
M_Import_VARh_
Q1C
M_Import_VARh_
Q2
M_Import_VARh_
Q2A
M_Import_VARh_
Q2B
M_Import_VARh_
Q2C
M_Export_VARh_
Q3
M_Export_VARh_
Q3A
M_Export_VARh_
Q3B
M_Export_VARh_
Q3C
M_Export_VARh_
Q4
M_Export_VARh_
Q4A
M_Export_VARh_
Q4B
M_Export_VARh_
Q4C
Quadrant 1: Total Imported Reactive Energy
Phase A - Quadrant 1: Total Imported Reactive
Energy
Phase B - Quadrant 1: Total Imported Reactive
Energy
Phase C - Quadrant 1: Total Imported Reactive
Energy
Quadrant 2: Total Imported Reactive Energy
Phase A - Quadrant 2: Total Imported Reactive
Energy
Phase B - Quadrant 2: Total Imported Reactive
Energy
Phase C - Quadrant 2: Total Imported Reactive
Energy
Quadrant 3: Total Exported Reactive Energy
Phase A - Quadrant 3: Total Exported Reactive
Energy
Phase B - Quadrant 3: Total Exported Reactive
Energy
Phase C - Quadrant 3: Total Exported Reactive
Energy
Quadrant 4: Total Exported Reactive Energy
Phase A - Quadrant 4: Total Exported Reactive
Energy
Phase B - Quadrant 4: Total Exported Reactive
Energy
Phase C - Quadrant 4: Total Exported Reactive
Energy
SunSpec
Description
© 2011 Schneider Electric All Rights Reserved.
39
Page 44

EM3555
SunSpec Compliant Common and Meter Model Register Blocks
ZL0093-0A
11/2011
NV
R/W
Register
40175
40176
40177 R NV UInt 0xFFFF
40178 R NV UInt 0x0000
R NV ULong Flags
Format
Units
Scale
Events
End of SunSpec Block
Range
SunSpec
Name
M_Events Bit Map. See M_EVENT_ags. 0 = no event
Description
Event Bit Description
M_EVENT_Power_
Failure
M_EVENT_Under_
Voltage
M_EVENT_Low_PF 0x00000010 Power factor below threshold
M_EVENT_Over_
Current
M_EVENT_Over_
Voltage
M_EVENT_
Missing_Sensor
M_EVENT_
Reserved1-8
M_EVENT_
OEM1-15
0x00000004 Loss of power or phase
0x00000008 Voltage below threshold
0x00000020 Current input over threshold
0x00000040 Voltage input over threshold
0x00000080 Sensor not connected (not
0x00000100
to
0x00008000
0x7FFF000 Reserved for OEMs (not
C_SunSpec_DID = 0xFFFF
Uniquely identies this as the last SunSpec block
C_SunSpec_Length = 0
Last block has no length
(phase loss)
(can indicate misassociated
voltage and current inputs in
3-phase systems)
(out of measurement range)
(out of measurement range)
supported)
Reserved for future SunSpec
use
used)
40
© 2011 Schneider Electric All Rights Reserved.
Page 45

ZL0093-0A
11/2011
TROUBLESHOOTING
Table 10 Troubleshooting
Problem Cause Solution
The maintenance wrench
icon appears in the power
meter display.
The display is blank after
applying control power to
the meter.
The data displayed is
inaccurate.
Cannot communicate with
power meter from a remote
personal computer.
Sign of one phase (real
power) is incorrect
There is a problem with the
inputs to the power meter.
The meter is not receiving
adequate power.
Incorrect setup values Verify the values entered for power meter setup parameters (CT and PT
Incorrect voltage inputs Check power meter voltage input terminals to verify adequate voltage.
Power meter is wired
improperly.
Power meter address is
incorrect.
Power meter baud rate is
incorrect.
Communications lines are
improperly connected.
CT orientation reversed Remove CT, reverse orientation, reconnect (qualied personnel only)
See the Alert sub-menu or the Diagnostic Alert Modbus Register 146
Verify that the meter control power is receiving the required voltage.
Verify that the heart icon is blinking.
Check the fuse.
ratings, system type, etc., see Setup section).
Check all CTs and PTs to verify correct connection to the same service,
CT and PT polarity, and adequate powering (see Wiring Diagrams
section).
Verify that the meter is correctly addressed (see Setup section).
Verify that the baud rate of the meter matches that of all other devices
on its communications link (see Setup section).
Verify the power meter communications connections (see
Communications section).
Verify the terminating resistors are properly installed on both ends
of a chain of units. Units in the middle of a chain should not have a
terminator.
Verify the shield ground is connected between all units.
Troubleshooting
EM3555
CHINA ROHS COMPLIANCE INFORMATION (EFUP TABLE)
产品中有毒有害物质或元素的名称及含量Substances
部件名称
铅 (Pb) 汞 (Hg) 镉 (Cd) 六价铬 (Cr(VI)) 多溴联苯(PBB) 多溴二苯醚(PBDE)
电子线路板 X O O O O O
O = 表示该有毒有害物质在该部件所有均质材料中的含量均在 SJ/T11363-2006 标准规定的限量要求以下.
X = 表示该有毒有害物质至少在该部件的某一均质材料中的含量超出SJ/T11363-2006标准规定的限量要求.
Z000057-0A
© 2011 Schneider Electric All Rights Reserved.
41
Page 46

EM3555
Installation Guide
Schneider Electric
295 Tech Park Dr. Suite 100
La Vergne TN, 37086
For technical support:
Global-PMC-Tech-suppor t@schneider-electric.com
(00) + 1 250 544 3010
Contact your local Schneider Electric sales
representative for assistance or go to
www.schneider-electric.com
ION, Modbus, and PowerLogic are either trademarks or registered trademarks of Schneider
Electric in France, the USA and other countries. Other trademarks used are the property of their
respective owners.
Electrical equipment should be installed, operated, serviced, and maintained only by qualified
personnel. No responsibility is assumed by Schneider Electric for any consequences arising out of
the use of this material.
ZL0093-0A 11/2011
© 2011 Schneider Electric. All Rights Reserved.
 Loading...