

Page 1
63230-300-212
Instruction Bulletin
POWERLOGIC®Circuit Monitor
Series 4000
Reference Manual
Retain for future use
April 2001
Page 2
NOTICE
Read these instructions carefully and look at the equipment to become
familiar with the device before trying to install, operate, service, or maintain
it. The following special messages may appear throughout this bulletin or on
the equipment to warn of potential hazards or to call attention to information
that clarifies or simplifies a procedure.
The addition of either symbol to a “Danger” or “Warning” safety label
indicates that an electrical hazard exists which will result in personal injury if
the instructions are not followed.
This is the safety alert symbol. It is used to alert you to potential personal
injury hazards. Obey all safety messages that follow this symbol to avoid
possible injury or death.
DANGER
DANGER indicates an imminently hazardous situation which, if not
avoided, will result in death or serious injury.
WARNING
WARNING indicates a potentially hazardous situation which, if not
avoided, can result in death or serious injury.
PLEASE NOTE
Class A FCC Statement
CAUTION
CAUTION indicates a potentially hazardous situation which, if not
avoided, can result in minor or moderate injury.
CAUTION
CAUTION, used without the safety alert symbol, indicates a potentially
hazardous situation which, if not avoided, can result in property damage.
NOTE: Provides additional information to clarify or simplify a procedure.
Electrical equipment should be installed, operated, serviced, and maintained
only by qualified personnel. This document is not intended as an instruction
manual for untrained persons. No responsibility is assumed by Square D for
any consequences arising out of the use of this manual.
This equipment has been tested and found to comply with the limits for a
Class A digital device, pursuant to part 15 of the FCC Rules. These limits are
designated to provide reasonable protection against harmful interference
when the equipment is operated in a commercial environment. This
equipment generates, uses, and can radiate radio frequency energy and, if
not installed and used in accordance with the instruction manual, may cause
harmful interference to radio communications. Operation of this equipment in
a residential area is likely to cause harmful interference in which case the
user will be required to correct the interference at his own expense.
© 2000 Schneider Electric All Rights Reser ved
Page 3

63230-300-212 POWERLOGIC® Circuit Monitor Series 4000 Reference Manual
April 2 001 Contents
CONTENTS
CONTENTS ................................................ I
LISTOFFIGURES ..........................................VII
LISTOFTABLES ...........................................IX
CHAPTER 1—INTRODUCTION ................................1
CHAPTERCONTENTS .......................................1
WHATISTHECIRCUITMONITOR? .............................2
AccessoriesandOptionsfortheCircuitMonitor .................3
Features................................................4
TOPICSNOTCOVEREDINTHISBULLETIN ......................4
FIRMWARE ................................................5
CHAPTER 2—SAFETY PRECAUTIONS ..........................7
CHAPTER 3—OPERATION ....................................9
CHAPTERCONTENTS .......................................9
OPERATINGTHEDISPLAY ..................................10
HowtheButtonsWork ....................................10
DisplayMenuConventions ................................11
SelectingaMenuOption ..............................11
Changing a Value ....................................11
MAINMENUOVERVIEW .....................................12
CONFIGURING THE CIRCUIT MONITOR USING THE
SETUPMENU .............................................13
SettingUptheDisplay ....................................13
SettingUptheCommunications ............................14
SettingtheDeviceAddress ............................14
RS-485, RS-232, and Infrared Port Communications Setup . . . 15
EthernetCommunicationsCard(ECC)Setup ..............16
SettingUptheMeteringFunctionsoftheCircuitMonitor .........16
SettingUpAlarms .......................................18
CreatingaNewCustomAlarm ..........................19
SettingUpandEditingAlarms ..........................21
SettingUpI/Os .........................................23
Selecting I/O Modules . ...............................23
ConfiguringI/OModules ...............................25
SettingUpPasswords ....................................27
AdvancedSetupFeatures .................................28
CreatingCustomQuantitiestobeDisplayed ...............28
CreatingCustomScreens .............................31
Viewing Custom Screens ..............................34
AdvancedMeterSetup ................................34
RESETTINGMIN/MAX,DEMAND,ANDENERGYVALUES .........37
VIEWINGMETEREDDATA ...................................38
ViewingMeteredDatafromtheMetersMenu ..................38
Viewing Minimum and Maximum Values from the
Min/MaxMenu ..........................................39
© 2001 Schneider Electric All Rights Reserved
i
Page 4

POWERLOGIC® Circuit Monitor Series 4000 Reference Manual 63230-300-212
Contents April 2001
VIEWINGALARMS ..........................................41
ViewingActiveAlarms ....................................42
View and Acknowledging High Priority Alarms .................42
VIEWINGI/OSTATUS .......................................43
READINGANDWRITINGREGISTERS ..........................44
PERFORMINGAWIRINGERRORTEST ........................45
Running the Diagnostics Wiring Error Test . . ..................46
CHAPTER 4—METERING CAPABILITIES .......................51
CHAPTERCONTENTS ......................................51
REAL-TIMEREADINGS ......................................52
MIN/MAXVALUESFORREAL-TIMEREADINGS ..................53
PowerFactorMin/MaxConventions .........................54
VARSignConventions ................................55
DEMANDREADINGS........................................56
Demand Power Calculation Methods . ........................57
BlockIntervalDemand ................................57
SynchronizedDemand ................................59
DemandCurrent ........................................59
DemandVoltage ........................................59
ThermalDemand ........................................60
PredictedDemand .......................................60
PeakDemand ..........................................61
GenericDemand ........................................61
InputPulseDemandMetering ..............................62
ENERGYREADINGS ........................................64
POWERANALYSISVALUES..................................66
CHAPTER 5—INPUT/OUTPUT CAPABILITIES . ..................69
CHAPTERCONTENTS ......................................69
I/OOPTIONS ..............................................70
DIGITALINPUTS ...........................................71
DEMANDSYNCHPULSEINPUT ..............................72
ANALOGINPUTS ...........................................73
AnalogInputExample ....................................74
RELAYOUTPUTOPERATINGMODES .........................75
MECHANICALRELAYOUTPUTS ..............................77
Setpoint-controlledRelayFunctions .........................78
SOLID-STATEKYZPULSEOUTPUT ...........................78
2-WirePulseInitiator .....................................79
3-WirePulseInitiator .....................................79
CALCULATINGTHEKILOWATTHOUR-PER-PULSEVALUE.........80
ANALOGOUTPUTS .........................................81
AnalogOutputExample ...................................82
ii
© 2001 Schneider Electric All Rights Reser ved
Page 5

63230-300-212 POWERLOGIC® Circuit Monitor Series 4000 Reference Manual
April 2 001 Contents
CHAPTER 6—ALARMS . .....................................83
CHAPTERCONTENTS ......................................83
ABOUTALARMS ...........................................84
AlarmsGroups ..........................................84
Setpoint-DrivenAlarms ...................................85
Priorities ...............................................87
AlarmLevels ...........................................87
CUSTOMALARMS..........................................88
SETPOINT-CONTROLLEDRELAYFUNCTIONS ..................88
TypesofSetpoint-ControlledRelayFunctions .................89
SCALEFACTORS ..........................................91
SCALINGALARMSETPOINTS ................................92
ALARMCONDITIONSANDALARMNUMBERS ...................93
CHAPTER 7—LOGGING . ....................................99
CHAPTERCONTENTS ......................................99
ALARMLOG ..............................................100
AlarmLogStorage ......................................100
DATALOGS ..............................................100
Alarm-DrivenDataLogEntries ............................101
OrganizingDataLogFiles ................................101
DataLogStorage.......................................101
MIN/MAXLOGS ...........................................102
Min/MaxLog ..........................................102
IntervalMin/Max/AverageLog .............................102
IntervalMin/Max/AverageLogStorage ..................103
MAINTENANCELOG .......................................103
© 2001 Schneider Electric All Rights Reserved
MEMORYALLOCATION ....................................104
CHAPTER 8—WAVEFORM AND EVENT CAPTURE .............107
CHAPTERCONTENTS .....................................107
TYPES OF WAVEFORM CAPTURES . . ........................108
Steady-stateWaveformCapture ...........................108
InitiatingaSteady-stateWaveform......................108
DisturbanceWaveformCapture ...........................108
Adaptive Waveform Capture ..............................109
100ms rms Event Recording ..............................110
SETTING UP THE CIRCUIT MONITOR FOR AUTOMATIC EVENT
CAPTURE................................................111
Setting Up Alarm-Triggered Event Capture . ..................111
SettingUpInput-TriggeredEventCapture ...................111
WAVEFORM STORAGE . ...................................111
HOW THE CIRCUIT MONITOR CAPTURES AN EVENT ...........112
iii
Page 6

POWERLOGIC® Circuit Monitor Series 4000 Reference Manual 63230-300-212
Contents April 2001
CHAPTER 9—DISTURBANCE MONITORING . . .................113
CHAPTERCONTENTS .....................................113
ABOUTDISTURBANCEMONITORING.........................114
CAPABILITIES OF THE CIRCUIT MONITOR DURING AN EVENT . . .117
USING THE CIRCUIT MONITOR WITH SMS TO PERFORM
DISTURBANCEMONITORING ...............................118
UNDERSTANDING THE ALARM LOG . . . .......................119
CHAPTER 10—MAINTENANCE AND TROUBLESHOOTING . ......121
CHAPTERCONTENTS .....................................121
CIRCUIT MONITOR MEMORY . . .............................123
UpgradingMemoryintheCircuitMonitor ....................123
IDENTIFYINGTHEFIRMWAREVERSION ......................124
VIEWINGTHEDISPLAYINDIFFERENTLANGUAGES ............124
CALIBRATION OF THE CURRENT/VOLTAGE MODULE (CVM) . . . .124
GETTING TECHNICAL SUPPORT ............................124
TROUBLESHOOTING ......................................125
APPENDIX A—ABBREVIATED REGISTER LISTING . ............127
CONTENTS ..............................................127
ABOUTREGISTERS .......................................127
HOWPOWERFACTORISSTOREDINTHEREGISTER...........128
HOWDATEANDTIMEARESTOREDINTHEREGISTER .........129
REGISTERLISTING ........................................130
APPENDIXB—USINGTHECOMMANDINTERFACE .............181
CONTENTS ..............................................181
OVERVIEWOFTHECOMMANDINTERFACE ...................182
IssuingCommands .....................................183
I/OPOINTNUMBERS ......................................186
OPERATINGOUTPUTSFROMTHECOMMANDINTERFACE ......187
USING THE COMMAND INTERFACE TO CHANGE CONFIGURATION
REGISTERS ..............................................187
CONDITIONALENERGY ....................................188
CommandInterfaceControl ...............................188
Digital Input Control . . . ..................................188
INCREMENTAL ENERGY . ..................................189
UsingIncrementalEnergy ................................189
SETTINGUPINDIVIDUALHARMONICCALCULATIONS ..........190
CHANGINGSCALEFACTORS ...............................191
iv
© 2001 Schneider Electric All Rights Reser ved
Page 7

63230-300-212 POWERLOGIC® Circuit Monitor Series 4000 Reference Manual
April 2 001 Contents
GLOSSARY ..............................................193
INDEX...................................................197
© 2001 Schneider Electric All Rights Reserved
v
Page 8

POWERLOGIC® Circuit Monitor Series 4000 Reference Manual 63230-300-212
Contents April 2001
vi
© 2001 Schneider Electric All Rights Reser ved
Page 9

63230-300-212 List of Figures
April 2 001
LIST OF FIGURES
Figure 3–1: Arrowonthedisplayscreen........................ 10
Figure 3–2: Displaybuttons.................................. 10
Figure 3–3: Partsofamenu ................................. 11
Figure 3–4: MenuoptionsontheMainMenu .................... 12
Figure 3–5: Menusthatcanbepasswordprotected............... 27
Figure 3–6: PerformingresetsfromtheResetmenu .............. 37
Figure 3–7: Viewing metered data on the Meters and Min/Max
menus......................................... 38
Figure 3–8: ViewAlarmsmenu............................... 41
Figure 3–9: DiagnosticsMenuaccessedfromtheMainMenu....... 44
Figure 3–10: Wiring Error Test option on the Diagnostics menu. ...... 45
Figure 4–1: Powerfactormin/maxexample ..................... 54
Figure 4–2: Reactive Power—VARsignconvention............... 55
Figure 4–3: BlockIntervalDemandExamples ................... 58
Figure 4–4: ThermalDemandExample......................... 60
Figure 4–5: PredictedDemandExample........................ 60
Figure 4–6: Channel pulse metering example. . .................. 63
Figure 4–7: Reactiveenergyaccumulatesinfourquadrants ........ 65
Figure 5–1: Demandsynchpulsetiming........................ 72
Figure 5–2: Analoginputexample............................. 74
Figure 5–3: Two-wirepulsetrain.............................. 79
Figure 5–4: Three-wirepulsetrain............................. 79
Figure 5–5: Analogoutputexample............................ 82
Figure 6–1: Samplealarmlogentry ........................... 86
Figure 6–2: How the circuit monitor handles setpoint-driven alarms. . . 86
Figure 6–3: Two alarms set up for the same quantity with different
pickup and dropout set points 87
Figure 7–1: Memoryallocationexample....................... 104
Figure 7–2: MemoryallocationinSMS........................ 105
Figure 8–1: Event capture initiated from a high-speed input. . ...... 112
Figure 9–1: A fault can cause voltage sag on the whole system. . . . . 115
Figure 9–2: Waveform showing voltage sag, which was caused by a
remote fault and lasted five cycles. 115
Figure 9–3: OnboardFilestab............................... 118
Figure 9–4: OnboardAlarms/Eventstab....................... 118
Figure 9–5: Eventlogentriesexample ........................ 119
Figure 9–6: Samplealarmlogentry .......................... 119
Figure 10–1: Memorychiplocationinthecircuitmonitor ........... 123
Figure A–1: Bitsinaregister................................ 128
Figure A–2: Powerfactorregisterformat....................... 128
Figure B–1: CommandInterfacePointerRegisters............... 182
Figure B–2: Identifying I/Os for the command interface............ 186
Figure B–3: IncrementEnergyExample ....................... 189
© 2001 Schneider Electric All Rights Reserved
vii
Page 10

List of Figures 63230-300-212
April 2001
viii
© 2001 Schneider Electric All Rights Reserved
Page 11

63230-300-212 List of Tables
April 2 001
LIST OF TABLES
Table 1–1: SummaryofCircuitMonitorInstrumentation ............ 2
Table 1–2: Circuit Monitor Parts, Accessories, and Custom Cables . . . 3
Table 3–1: FactoryDefaultsfortheDisplaySettings.............. 14
Table 3–2: OptionsforCommunicationsSetup.................. 15
Table 3–3: OptionsforMeterSetup........................... 17
Table 3–4: OptionsforCreatinganAlarm ...................... 20
Table 3–5: OptionsforEditinganAlarm ....................... 22
Table 3–6: I/ODescriptions ................................. 24
Table 3–7: OptionsforPasswordSetup........................ 27
Table 3–8: OptionsforCustomQuantities...................... 30
Table 3–9: Available Default Quantities ........................ 33
Table 3–10: OptionsforAdvancedMeterSetup .................. 36
Table 3–11: Read/WriteRegisterOptions....................... 44
Table 3–12: Wiring Error Messages............................ 48
Table 4–1: One-Second, Real-Time Readings Samples ........... 52
Table 4–2: 100msReal-TimeReadings ....................... 53
Table 4–3: DemandReadings............................... 56
Table 4–4: EnergyReadings ................................ 64
Table 4–5: PowerAnalysisValues............................ 68
Table 5–1: I/ O Extender Options ............................. 70
Table 5–2: Sample register readings for analog inputs ............ 74
Table 5–3: Sample register readings for analog output ............ 82
Table 6–1: Scale Groups ................................... 91
Table 6–2: ScaleGroupRegisterNumbers..................... 92
Table 6–3: ListofDefaultAlarmsbyAlarmNumber .............. 94
Table 6–4: AlarmTypes.................................... 96
Table 7–1: Values Stored in Maintenance Log ................. 103
Table 8–1: Available Resolutions for Disturbance Waveform
Captures...................................... 108
Table 8–2: Available Resolutions for Adaptive Waveform
Captures...................................... 109
Table 8–3: 100ms rms Quantities ........................... 110
Table 9–1: Capability of the circuit monitor to measure electromagnetic
phenomena . .................................. 117
Table 10–1: Troubleshooting . . . ............................. 125
Table A–1: DateandTimeFormat........................... 129
Table A–2: DateandTimeByteExample...................... 129
Table A–3: AbbreviatedRegisterList......................... 130
Table A–4: AbbreviatedRegisterListforI/OStatus.............. 166
Table A–5: Registers for Alarm Position Counters . . . ............ 173
Table A–6: Spectral Components ............................ 178
Table B– 1: Locationofthecommandinterface ................. 182
Table B– 2: CommandCodes............................... 183
Table B– 3: RegistersforHarmonicCalculations ................ 190
© 2001 Schneider Electric All Rights Reserved
ix
Page 12

List of Tables 63230-300-212
April 2001
x
© 2001 Schneider Electric All Rights Reserved
Page 13

63230-300-212 Chapter 1—Introduction
C
April 2 001 Chapter Contents
CHAPTER 1—INTRODUCTION
This chapter offers a general description of the Series 4000 Circuit Monitor,
tells how to best use this bulletin, and lists related documents.
HAPTER CONTENTS
CHAPTERCONTENTS .......................................1
WHATISTHECIRCUITMONITOR? .............................2
AccessoriesandOptionsfortheCircuitMonitor .................3
Features................................................4
TOPICSNOTCOVEREDINTHISBULLETIN ......................4
FIRMWARE ................................................5
© 2001 Schneider Electric All Rights Reserved
1
Page 14

Chapter 1—Introduction 63230-300-212
W
What is the Circuit Monitor? April 2001
HAT IS T HE CIRCUIT MONITOR?
Table 1–1: Summary of Circuit Monitor Instrumentation
• Current (per phase, N, G, 3-Phase)
• Voltage ( L–L, L–N, N–G, 3-Phase)
• Real Power (per phase, 3-Phase
• Reactive Power (per phase, 3-Phase)
• Apparent Power (per phase, 3-Phase)
• Power Factor (per phase, 3-Phase)
• Frequency
• Temperature (internal ambient)
• THD (current and voltage)
• K-Factor (per phase)
• Demand Current (per phase present, 3-Phase avg.)
• Demand Voltage (per phase present, 3-Phase avg.)
• Average Power Factor (3-Phase total)
• Demand Real Power (per phase present, peak)
• Demand Reactive Power (per phase present, peak)
• Demand Apparent Power (per phase present, peak)
• Coincident Readings
• Predicted Power Demands
The circuit monitor is a multifunction, digital instrumentation, data acquisition
and control device. It can replace a variety of meters, relays, transducers and
other components. The circuit monitor can be located at the service entrance
to monitor the cost and quality of power, and can be used to evaluate the
utility service. When located at equipment mains, the circuit monitor can
detect voltage-based disturbances that cause costly equipment downtime.
The circuit monitor is equipped with
RS-485 and RS-232 communications for
integration into any power monitoring and control system. However, System
Manager™ software (
SMS)fromPOWERLOGIC, which is written specifically
for power monitoring and control, best supports the circuit monitor’s
advanced features.
The circuit monitor is a true rms meter capable of exceptionally accurate
measurement of highly nonlinear loads. A sophisticated sampling technique
enables accurate, true rms measurement through the 255th harmonic. You
can view over 50 metered values plus extensive minimum and maximum data
from the display or remotely using software. Table 1–1 summarizes the
readings available from the circuit monitor.
Real-Time Readings Energy Readings
• Accumulated Energy, Real
• Accumulated Energy, Reactive
)
DemandReadings Power Analysis Values
• Accumulated Energy, Apparent
• Bidirectional Readings
• Reactive Energy by Quadrant
• Incremental Energy
• Conditional Energy
• Crest Factor (per phase)
• Displacement Power Factor (per phase, 3-Phase
• Fundamental Voltages (per phase)
• Fundamental Currents (per phase)
• Fundamental Real Power (per phase)
• Fundamental Reactive Power (per phase)
• Harmonic Power
• Unbalance (current and voltage)
• Phase Rotation
• Harmonic Magnitudes & Angles (per phase)
• Sequence Components
)
2
© 2001 Schneider Electric All Rights Reserved
Page 15

63230-300-212 Chapter 1—Introduction
April 2 001 What is the Circuit Monitor?
Accessories and Options for the Circuit Monitor
The circuit monitor has a modular design to maximize its usability. In addition
to the main meter, the circuit monitor has plug-on modules and accessories,
including:
• Current/voltage module (CVM). A standard part of the circuit monitor is
the current/voltage module where all metering data acquisition occurs.
• Remote display . The optional remote 4-line display is available with a
back-lit liquid crystal display (LCD) or a vacuum fluorescent display (VFD).
The VFD model includes an infrared port that can be used to
communicate directly with the circuit monitor from a laptop and can be
used to download firmware, which keeps the circuit monitor up to date with
the latest system enhancements.
• I/O Extender. The I/O extender, located on the side of the circuit monitor,
enables you to “plug in” up to 8 industry-standard inputs and outputs.
Several preconfigured combinations are available, or you can create a
custom configuration.
• Digital I/O Card. You can further expand the I/O capabilities of the circuit
monitor by adding a digital I/O card (4 inputs and 4 outputs). This card fits
into one of the option slots on the top of the circuit monitor.
• Ethernet Communications Card. The Ethernet communications card
provides an Ethernet port that accepts a 100 Mbps fiber optic cable or a
10/100 Mbps UTP and provides an RS-485 master port to extend the
circuit monitor communications options. This card is easily installed into
option slot A on the top of the circuit monitor.
Table 1–2 lists the circuit monitor parts and accessories and their associated
instruction bulletins.
Table 1–2: Circuit Monitor Parts, Accessories, and Custom Cables
Description Part Number Document Number
Circuit Monitor CM4000 63230-300-200
Current/Voltage Module CVM 63230-301-200
VFD Display with infrared (IR) port and proximity sensor CMDVF
LCD Display CMDLC
Optical Communications Interface (for use with the VFD display only) OCIVF 63230-306-200
I/O Extender Module
with no preinstalled I/ Os, accepts up to 8 individual I/O modules with a
maximum of 4 analog I / Os
with 4 digital inputs (32 Vdc), 2 digital outputs ( 60 Vdc),
1 analog output (4–20 mA), and 1 analog input (0–5Vdc)
with 4 analog inputs (4–20 mA) and 4 digital inputs (120 Vac) IOX0404
with 8 digital inputs (120 Vac) IOX08
Digital I/O Card
Field installable with 4 digital inputs (120 Vac), 3 (10 A) relay outputs (120Vac),
1 pulse output (KYZ)
Ethernet Communications Card with
100 Mbps fiber or 10/100 Mbps UTP Ethernet port and 1 RS-485 master port
Optical Communications Interface OCIVG 63230-306-200
Memory Expansion Kit (16 MB and 32 MB kits)
For parts list of individual inputs and outputs, see Table 5–1onpage70.
IOX
IOX2411
IOC44 63230-303-200
ECC21 63230-304-200
CM4MEM16M
CM4MEM32M
63230-305-200
63230-302-200
63230-300-205
© 2001 Schneider Electric All Rights Reserved
3
Page 16

Chapter 1—Introduction 63230-300-212
Topics Not Covered in This Bulletin April 2001
Table 1–2: Circuit Monitor Parts, Accessories, and Custom Cables
63230-204-316
CM4 Mounting Adapters CM4MA
4-ft display cable (1.2 m) CAB-4
12-ft display cable (3.6 m) CAB-12
30-ft display cable (9.1 m) CAB-30
10-ftRS-232cable(3m) CAB-106
For parts list of individual inputs and outputs, see Table 5–1onpage70.
63230-300-206
63230-305-201
N/A
Features
Some of the circuit monitor’s many features include:
• True rms metering to the 255th harmonic
• Accepts standard CT and PT inputs
• 600 volt direct connection on metering inputs
• Certified ANSI C12.20 revenue accuracy and IEC 687.2 class revenue
accuracy
• High accuracy—0.04% current and voltage
• Min/max readings of metered data
• Power quality readings—THD, K-factor, crest factor
• Real-time harmonic magnitudes and angles to the 63rd harmonic
• Current and voltage sag/ swell detection and recording
• Downloadable firmware
• Easy setup through the optional remote display (password protected)
where you can view metered values
• Setpoint-controlled alarm and relay functions
• Onboard alarm and data logging
• Wide operating temperature range –25° to 70°C
• Modular, field-installable digital and analog I/O modules
• Flexible communications—RS-485 and RS-232 communications are
standard, optional Ethernet communications card available with fiber optic
connection
• Two option card slots for field-installable I/O and Ethernet capabilities
• Standard 8MB onboard logging memory (field upgradable to 16 MB, 32
MB, and higher
• CT and PT wiring diagnostics
• Revenue security with utility sealing capability
TOPICS NOT COVERED IN THIS BULLETIN
4
Some of the circuit monitor’s advanced features, such as onboard data logs
and alarm log files, can only be set up over the communications link using
SMS. SMS versions 3.12 and higher support the CM4000 device type.This
circuit monitor instruction bulletin describes these advanced features, but
does not tell how to set them up. For instructions on using
SMS online help and the
SMS-3000 Setup Guide,
which is available in
SMS,refertothe
English (63220-060-200), French (63220-060-201), and Spanish (63220060-202). For information about related instruction bulletins, see Table 1–2
on page 3.
© 2001 Schneider Electric All Rights Reserved
Page 17

63230-300-212 Chapter 1—Introduction
April 2 001 FirmwAre
FIRMWARE
This instruction bulletin is written to be used with firmware version 11.000 or
higher. See “Identifying the Firmware Version” on page 124 for instructions
on how to determine the firmware version.
© 2001 Schneider Electric All Rights Reserved
5
Page 18

Chapter 1—Introduction 63230-300-212
FirmwAre April 2001
6
© 2001 Schneider Electric All Rights Reserved
Page 19

63230-300-212 Chapter 2—Safety Precautions
April 2 001
CHAPTER 2—SAFETY PRECAUTIONS
This chapter contains important safety precautions that must be followed
before attempting to install, service, or maintain electrical equipment.
Carefully read and follow the safety precautions outlined below.
DANGER
HAZARD OF ELECTRIC SHOCK, BURN, OR EXPLOSION
• Only qualified workers should install this equipment. Such work
should be performed only after reading this entire set of instructions.
• NEVER work alone.
• Before performing visual inspections, tests, or maintenance on this
equipment, disconnect all sources of electric power. Assume that all
circuits are live until they have been completely de-energized, tested,
and tagged. Pay particular attention to the design of the power
system. Consider all sources of power, including the possibility of
backfeeding.
• Turn off all power supplying this equipment before working on or
inside.
• Always use a properly rated voltage sensing device to confirm that all
power is off.
• Beware of potential hazards, wear personal protective equipment,
carefully inspect the work area for tools and objects that may have
been left inside the equipment.
• Use caution while removing or installing panels so that they do not
extend into the energized bus; avoid handling the panels, which could
cause personal injury.
• The successful operation of this equipment depends upon proper
handling, installation, and operation. Neglecting fundamental
installation requirements may lead to personal injury as well as
damage to electrical equipment or other property.
• Before performing Dielectric (Hi-Pot) or Megger testing on any
equipment in which the circuit monitor is installed, disconnect all input
and output wires to the circuit monitor. High voltage testing may
damage electronic components contained in the circuit monitor.
© 2001 Schneider Electric All Rights Reserved
Failure to follow these instructions will result in death or
serious injury.
7
Page 20

Chapter 2—Safety Precautions 63230-300-212
April 2001
8
© 2001 Schneider Electric All Rights Reserved
Page 21

63230-300-212 Chapter 3—Operation
April 2 001 Chapter Contents
CHAPTER 3—OPERATION
This chapter tells how to set up the circuit monitor from the display only.
Some advanced features, such as configuring the onboard logs of the circuit
monitor, must be set up over the communications link using
SMS instruction bulletin and online help file for instructions on setting up
advanced features not accessible from the display.
SMS. Refer to the
CHAPTER CONTENTS
CHAPTERCONTENTS .......................................9
OPERATINGTHEDISPLAY ..................................10
HowtheButtonsWork ....................................10
DisplayMenuConventions ................................11
SelectingaMenuOption ..............................11
Changing a Value ....................................11
MAINMENUOVERVIEW .....................................12
CONFIGURING THE CIRCUIT MONITOR USING THE SETUP MENU . 13
SettingUptheDisplay ....................................13
SettingUptheCommunications ............................14
SettingtheDeviceAddress ............................14
RS-485, RS-232, and Infrared Port Communications Setup . . . 15
EthernetCommunicationsCard(ECC)Setup ..............16
SettingUptheMeteringFunctionsoftheCircuitMonitor .........16
SettingUpAlarms .......................................18
CreatingaNewCustomAlarm ..........................19
SettingUpandEditingAlarms ..........................21
SettingUpI/Os .........................................23
Selecting I/O Modules . ...............................23
ConfiguringI/OModules ...............................25
SettingUpPasswords ....................................27
AdvancedSetupFeatures .................................28
CreatingCustomQuantitiestobeDisplayed ...............28
CreatingCustomScreens .............................31
Viewing Custom Screens ..............................34
AdvancedMeterSetup ................................34
RESETTINGMIN/MAX,DEMAND,ANDENERGYVALUES .........37
© 2001 Schneider Electric All Rights Reserved
VIEWINGMETEREDDATA ...................................38
ViewingMeteredDatafromtheMetersMenu ..................38
Viewing Minimum and Maximum Values from the Min/Max Menu . . 39
VIEWINGALARMS..........................................41
ViewingActiveAlarms ....................................42
View and Acknowledging High Priority Alarms . . . ..............42
VIEWINGI/OSTATUS .......................................43
READINGANDWRITINGREGISTERS..........................44
PERFORMINGAWIRINGERRORTEST ........................45
Running the Diagnostics Wiring Error Test . ...................46
9
Page 22
Chapter 3—Operation 63230-300-212
Operating the Display April 2001
OPERATING THE DISPLAY
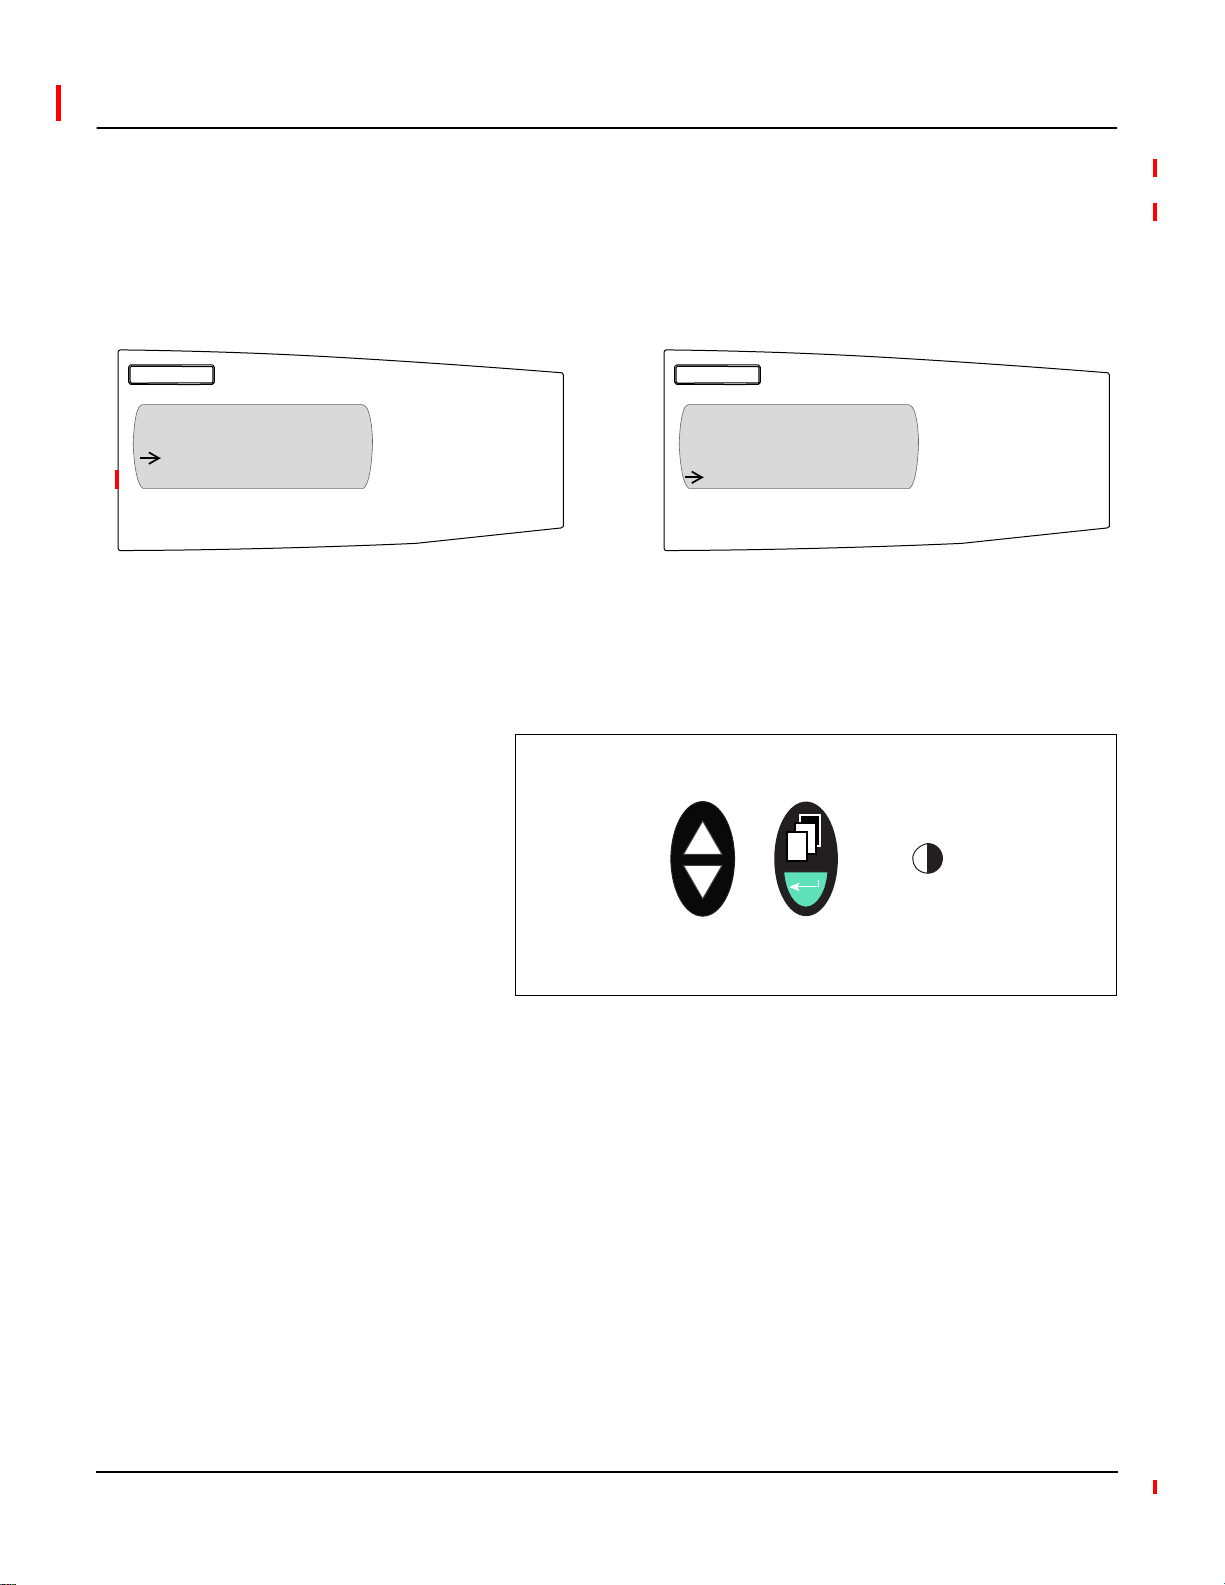
MAIN MENU
Meters
Min/Max
View Alarms
How the But tons Work
The display shows four lines of information at a time. Notice the arrow on the
left of the display screen. This arrow indicates that you can scroll up or down
to view more information. For example, on the Main Menu you can view the
Resets, Setup, and Diagnostics menu options only if you scroll down to
display them. When at the top of a list, the arrow moves to the top line. When
the last line of information is displayed, the arrow moves to the bottom as
illustrated in Figure 3–1.
MAIN MENU
Resets
Setup
Diagnostics
Figure 3–1: Arrowon the display screen
The buttons on the display let you scroll through and select information, move
from menu to menu, and adjust the contrast. Figure 3–2 shows the buttons.
Menu button
Arrow buttons
Contrast button
Enter button
Figure 3–2: Display buttons
The buttons are used in the following way:
• Arrow buttons. Use the arrow buttons to scroll up and down the options
on a menu. Also, when a value can be changed, use the arrow buttons to
scroll through the values that are available. If the value is a number,
holding the arrow button down increases the speed in which the numbers
increase or decrease.
• Menu button. Each time you press the menu button, it takes you back one
menu level. The menu button also prompts you to save if you’ve made
changes to any options within that menu structure.
• Enter button. Use the enter button to select an option on a menu or select
a value to be edited.
• Contrast button. Press the contrast button to darken or lighten the
display. On the LCD model, press any button once to activate the back
light.
10
© 2001 Schneider Electric All Rights Reserved
Page 23
63230-300-212 Chapter 3—Operation
April 2 001 Operating the Display
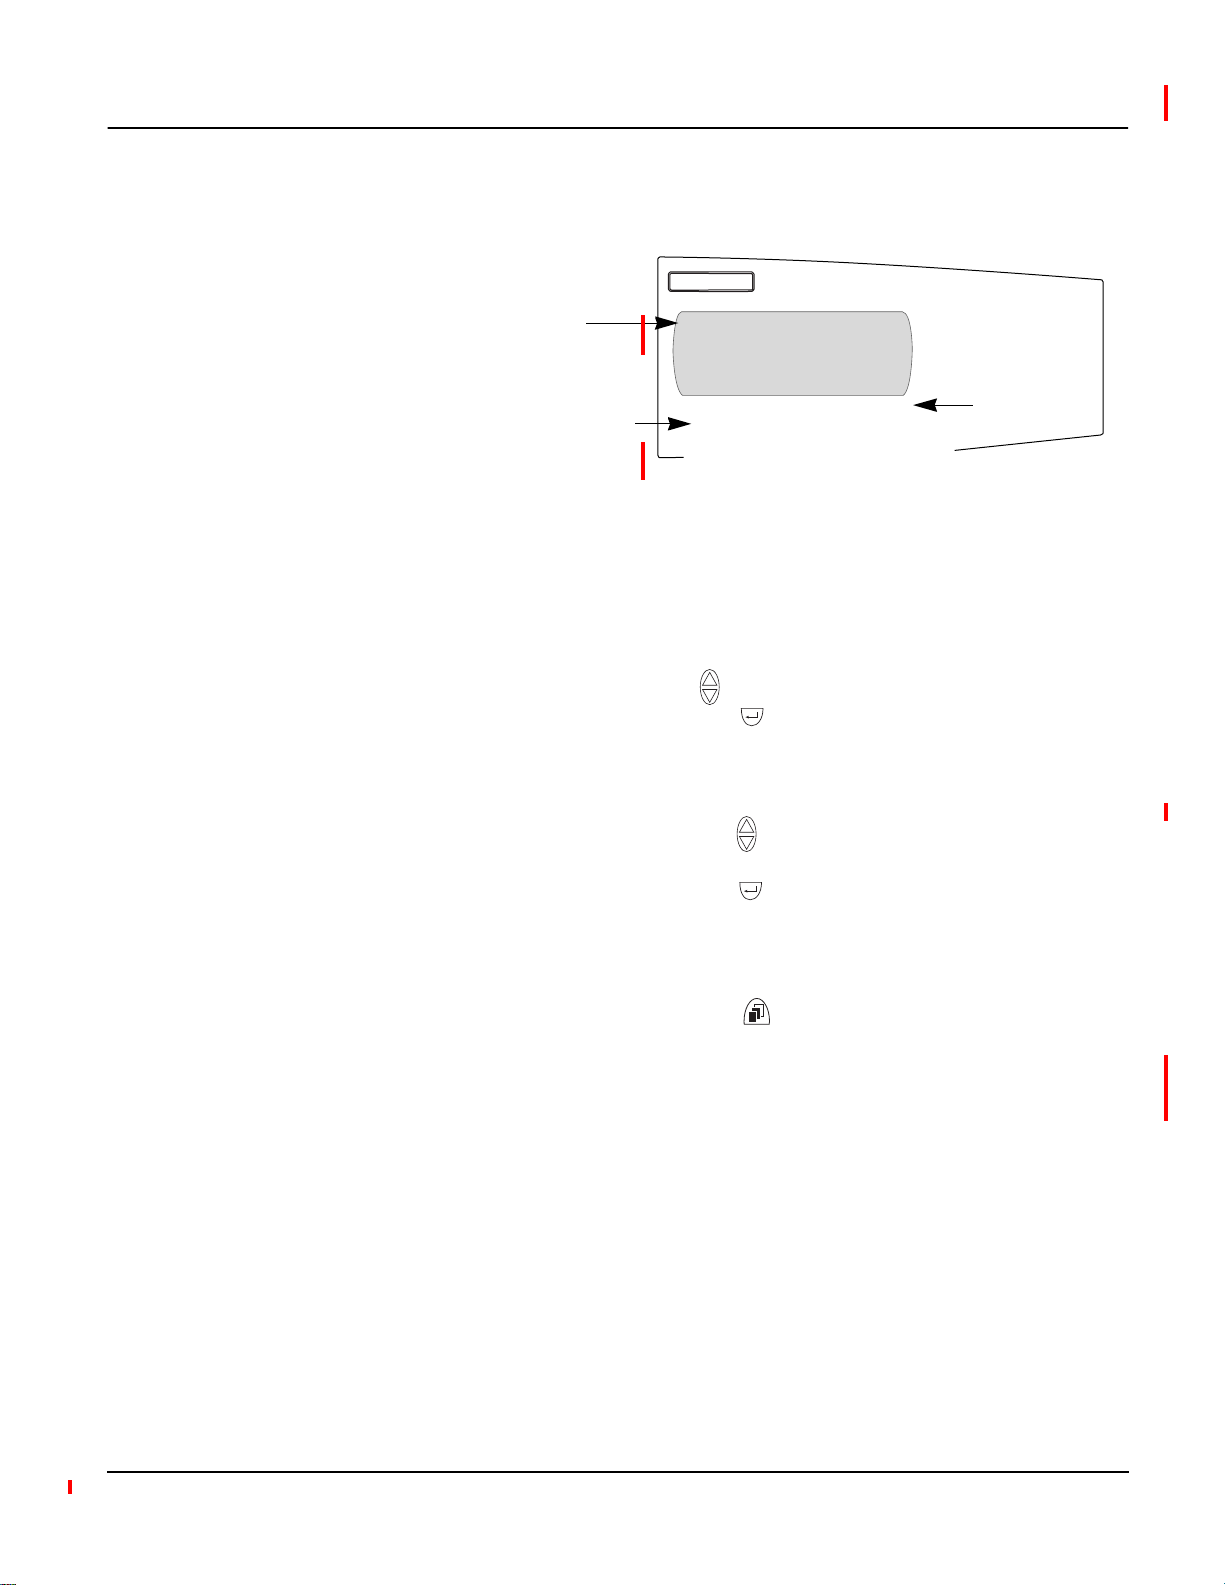
Display Menu Conventions
Selecting a Menu Option
This section explains a few conventions that were developed to streamline
instructions in this chapter. Figure 3–3 shows the parts of a menu.
Menu
DISPLAY
Language English
Date MM/DD/YYYY
Time Format 2400hr
Menu Option
VFD Sensitivity 3
Display Timer 1 Min
Value
Custom Quantity
Custom Screen
Figure 3–3: Parts of a menu
Each time you read “select” in this manual, choose the option from the menu
by doing this:
1. Press the arrows to highlight the menu option.
2. Press the enter button to select that option.
Changinga Value
To change a value, the procedure is the same on every menu:
1. Use the arrow buttons to scroll to the menu option you want to
change.
2. Press the enter button to select the value. The value begins to blink.
3. Press the arrow buttons to scroll through the possible values. To select
the new value, press the enter button.
4. Press the arrow buttons to move up and down the menu options. You can
change one value or all of the values on a menu. To save the changes,
press the menu button until the circuit monitor displays:
“Save changes? No”
NOTE: Pressing the menu button while a value is blinking will return that
value to its most current setting.
5. Press the arrow to change to “Ye s, ” then press the enter button to save
the changes.
© 2001 Schneider Electric All Rights Reserved
11
Page 24
Chapter 3—Operation 63230-300-212
Main Menu Overview April 2001
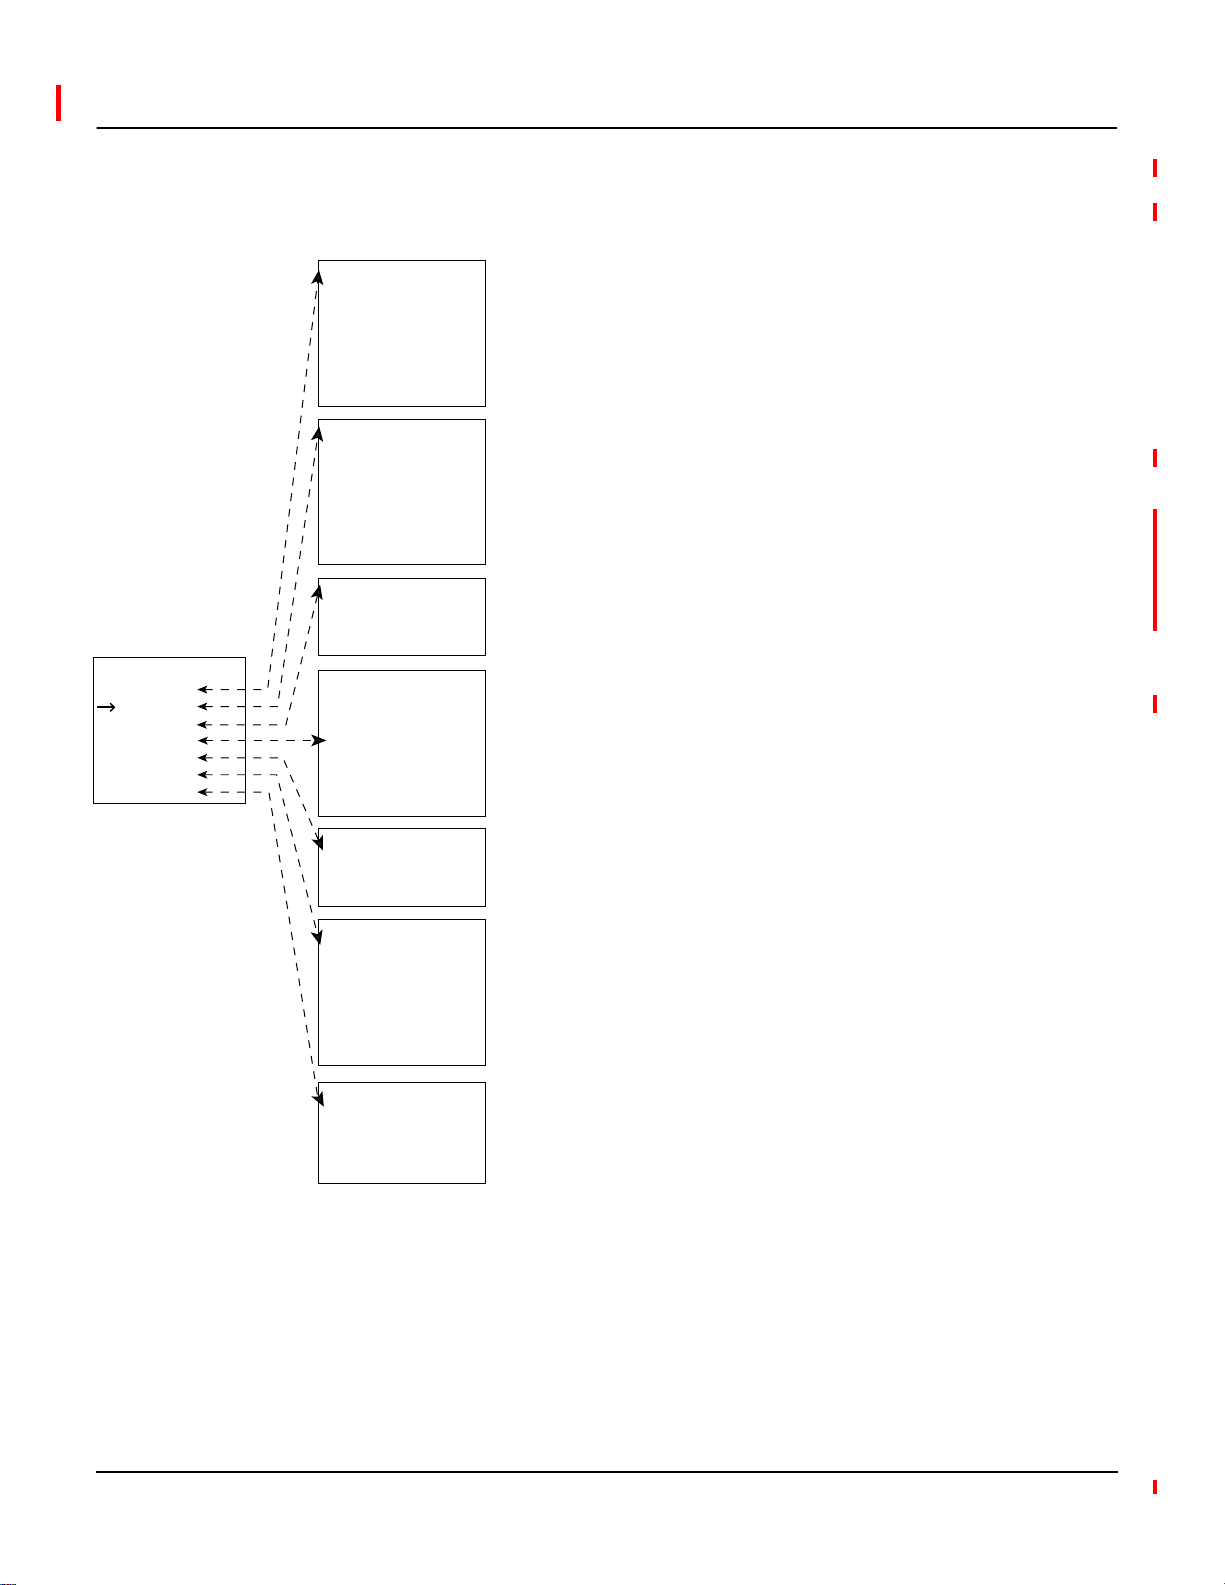
MAIN MENU OVERVIEW
MAIN MENU
Meters
Min/Max
View Alarms
I/O Display
Resets
Setup
Diagnostics
METERS
Summary
Powe r
Power Quality
Energy
Power Demand
Current Demand
Custom
MIN / MAX
Current
Voltage
Frequency
Powe r
Power Factor
THD
VIEW ALARMS
Active Alarms List
High Priority Log
I/O DISPLAY
Digital Inputs
Analog Inputs
Digital Outputs
Analog Outputs
RESETS
Energy
Demand
Min/Max
The Main Menu on the display contains the menu options that you use to set
up and control the circuit monitor and its accessories and view metered data
andalarms.Figure3–4 on the left shows the options on the Main Menu. The
menus are briefly described below:
• Meters. This menu lets you view metered values that provide information
about power usage and power quality.
• Min/Max. This menu lets you view the minimum and maximum metered
values since the last reset of the min/max values with their associated
dates and times.
• View Alarms. This menu lets you view a list of all active alarms,
regardless of the priority. In addition, you can view a log of high priority
alarms, which contains the ten most recent high priority alarms.
• I/O Display. From this menu, you can view the designation and status of
each input or output. This menu will only display the I/Os present, so you
might not see all of the available menu items if you do not have a particular
I/O installed.
• Resets. This menu lets you reset energy, peak demand, and minimum/
maximum values.
• Setup. From this menu, you define the settings for the display such as
selecting the date format to be displayed. Creating custom quantities and
custom screens are also options on this menu. In addition, use this menu
to set up the circuit monitor parameters such as the CT and PT ratios. The
Setup menu is also where you define the communications, alarms, I/Os
and passwords.
• Diagnostics. From this menu, you can initiate the wiring error test. Also,
use this menu to read and write registers and view information about the
circuit monitor such as its firmware version and serial number.
SETUP
Date & Time
Display
Communications
Meter
Alarm
I/O
Passwords
DIAGNOSTICS
Meter Information
CVM Information
Read/Write Regs
Wiring Error Test
Figure 3–4: Menuoptions on the Main Menu
12
© 2001 Schneider Electric All Rights Reserved
Page 25

63230-300-212 Chapter 3—Operation
April 2 001 Configuring the Circuit Monitor Using the Setup Menu
CONFIGURINGTHE CIRCUIT MONITOR USING THE SETUP MENU
Setting Up the Display
Before you can access the Setup menu from the Main Menu, you must enter
the Setup password. Thedefault password is 0. To change the password, see
“Setting Up Passwords” on page 27. The Setup menu has the following
options:
• Date & Time
• Display
• Communications
• Meter
• Alarm
• I/O
• Passwords
Each of these options is described in the sections that follow.
Setting up the display involves, for example, choosing a date and time format
that you want to be displayed. To set up the display, follow these steps:
1. From the Main Menu, select Setup > Display.
The Display Setup menudisplays. Table 3–1 describes the options on this
menu.
DISPLAY
Language English
Date MM/DD/YYYY
Time Format AM/PM
VFD Sensitivity 2
Display Timer 5
Custom Quantity
Custom Screen
© 2001 Schneider Electric All Rights Reserved
2. Use the arrow buttons to scroll to the menu option you want to change.
3. Press the enter button to select the value.The value begins to blink. Use
the arrow buttons to scroll through the available values. Then, press the
enter button to select the new value.
4. Use the arrow buttons to scroll through the other options on the menu, or
if you are finished, press the menu button to save.
13
Page 26

Chapter 3—Operation 63230-300-212
Configuring the Circuit Monitor Using The Setup Menu April 2001
Table 3–1: Factory Defaults for the Display Settings
Option Available Values Selection Description Default
Language English
Francais
Espanol
Date MM/DD/YYYY
YYYY/MM/DD
DD/MM/YYYY
Time Format 2400hr
AM/PM
VFD Sensitivity Off
1=0–6ft(0–15 m)
2=0–12 ft (0–31 m)
3=0–20 ft (0–51 m)
Display Timer 1, 5, 10, or 15 minutes Number of minutes the display remains illuminated
Custom Quantity Creating custom quantities is an advanced feature that is not required for basic setup. To learn more about this
feature, see “Creating Custom Quantities to be Displayed” on page 28.
Custom Screen Creating custom screens is an advanced feature that is not required for basic setup. To learn more about this
feature, see “Creating Custom Screens” on page 31.
Language used by the display. English
Data format for all date-related values of the circuit
monitor.
Time format can be 24-hour military time or 12-hour
clock with AM and PM.
Sensitivity value for the proximity sensor (for the VFD
display only).
after inactivity.
MM/DD/YYYY
2400hr
2
5
Setting Up the Communications
Setting the Device Address
The Communications menu lets you set up the following communications:
•
RS-485
monitor and other
RS-232
•
the circuit monitor and a host device, such as a
Infrared Port
•
computer (available only on the
•
Ethernet Options
communications for daisy-chain communication of the circuit
RS-485 devices.
communications for point-to-point communication between the
PC or modem.
communications between the circuit monitor and a laptop
VFD display).
for Ethernet communications between the circuit
monitor and your Ethernet network when an Ethernet Communications
Card (
ECC)ispresent.
Each of these options is described in the sections that follow.
Each
POWERLOGIC device on a communications link must have a unique
device address. The term communications link refers to 1–32
POWERLOGIC
compatible devices daisy-chained to a single communications port. If the
communications link has only a single device, assign it address 1. By
networking groups of devices,
POWERLOGIC systems can support avirtually
unlimited number of devices.
14
© 2001 Schneider Electric All Rights Reserved
Page 27

63230-300-212 Chapter 3—Operation
April 2 001 Configuring the Circuit Monitor Using The Setup Menu
RS-485, RS-232, and Infrared Port Communications Setup
To se t up RS-485, RS-232, or the infrared port communications, set the
address, baud rate, and parity. Follow these steps:
1. From the Main Menu, select Setup > Communications.
The Communications Setup screen displays.
COMMUNICATIONS
RS-485
RS-232
Infrared Port
Ethernet Option
NOTE: You can set up infrared communications only if the circuit monitor
is equipped with a VFD display. Also, you can set up Ethernet
communications only if the circuit monitor is equipped with an
ECC
card.
2. From the Comms Setup menu, select the type of communications that
you are using. Depending on what you select, the screen for that
communications setup displays, as shown below.Table 3–2 describes the
options on this menu.
RS-485
Protocol Modbus
Address 1
Baud Rate 9600
Parity Even
3. Use the arrow buttons to scroll to the menu option you want to change.
4. Press the enter button to select the value.The value begins to blink. Use
5. Use the arrow buttons to scroll through the other options on the menu, or
Table 3–2: Options for Com munications Setup
Option Available Values Selection Description Default
Protocol
Address 1–255 Device address of the circuit monitor.
Baud
Rate
RS-232
Protocol Modbus
Address 1
Baud Rate 9600
Parity Even
INFRARED PORT
Protocol Modbus
Address 1
Baud Rate 9600
Parity Even
the arrow buttons to scroll through the available values. Then, press the
enter button to select the new value.
if you are finished, press the menu button to save.
MODBUS
JBUS
1200
2400
4800
9600
19200
38400
Select MODBUS or JBUS protocol. MODBUS
See “Setting the Device Address” on
page 14 for requirements of device
addressing.
Speed at which the devices will
communicate. The baud rate must
match all devices on the
communications link.
1
9600
© 2001 Schneider Electric All Rights Reserved
15
Page 28

Chapter 3—Operation 63230-300-212
Configuring the Circuit Monitor Using The Setup Menu April 2001
Table 3–2: Options for Communications Setup
Parity Even, Odd, or
None
Parity at which the circuit monitor will
communicate.
Even
EthernetCommunications Card (ECC) Setup
Setting Up the Metering Functions of the Circuit Monitor
Ethernet communications is available only if you have an optional Ethernet
Communications Card (
ECC) that fits into slot A on the top of the circuit
monitor. See “Option Cards” on page 28 in Chapter 4—Installation of the
installation manual for more information. To set up the Ethernet
communications between the circuit monitor and the network, refer to
instruction bulletin no. 63230-304-200 provided with the
ECC.
To set up the metering within the circuit monitor, you must configure the
following items on the Meter setup screen for basic setup:
• CT and PT ratios
• System type
• Frequency
The power demand method, interval and subinterval, and advanced setup
options are also accessible from the Meter Setup menu, but are not required
for basic setup if you are accepting the factory defaults already defined in the
circuit monitor. Follow these steps to set up the circuit monitor:
1. From the Main Menu, select Setup > Meter.
The Meter setup screen displays. Table 3–3 describes the options on this
menu.
METER
Ø CT Primary 5
Ø CT Secondary 5
N CT Primary 5
N CT Secondary 5
PT Pri Scale x1
PT Primary 120
PT Secondary 120
Sys Type 3Ø4W3CT
Required for
basic setup
Frequency (Hz) 60
Pwr Dmd Meth Slide
Pwr Dmd Int 15
Pwr Dmd Sub Int 1
Advanced
2. Use the arrow buttons to scroll to the menu option you want to change.
3. Press the enter button to select the value. The value begins to blink. Use
the arrow buttons to scroll through the available values. Then, press the
enter button to select the new value.
4. Use the arrow buttons to scroll through the other options on the menu, or
if you are finished, press the menu button to save.
16
© 2001 Schneider Electric All Rights Reserved
Page 29

63230-300-212 Chapter 3—Operation
April 2 001 Configuring the Circuit Monitor Using The Setup Menu
Table 3–3: Options for Meter Setup
Option Available Values Selection Description Default
CT Primary 1–32,767 Set the rating for the CT primary. The circuit monitor supports two primary CT
ratings: one for the phase CTs and the other for the neutral CT.
CT Secondary 1 or 5 Set the rating for the CT secondaries. 5
PT Pri Scale x1
x10
x100
No PT
PT Primary 1–32,767 Set the rating for the PT primary. 120
PT Secondary 100
110
115
120
Sys Type 3Ø3W2CT
3Ø3W3CT
3Ø4W3CT
3Ø4W4CT
3Ø4W3CT2PT
3Ø4W4CT2PT
Frequency (Hz) 50, 60, or 400 Hz Frequency of the system. 60
Pwr Dmd Meth Select the power demand calculation method. The circuit monitor supports several methods to calculate
average demand of real power. See “Demand Power Calculation Methods” on page 57 for a detailed
description.
Slide—Sliding Block Demand
Slave—Slave Block Demand
Therm—Thermal Demand
RComms—Command-Synchronized Rolling Block Demand
Comms—Command-Synchronized Block Demand
RInput—Input-Synchronized Rolling Block Demand
Input—Input-Synchronized Block Demand
RClock—Clock-Synchronized Rolling Block Demand
Clock—Clock-Synchronized Block Demand
RBlock—Rolling Block Demand
Block—Fixed Block Demand
IncEngy—Synch to Incremental Energy Interval
Pwr Dmd Int 1–60 Power demand interval—set the time in minutes in which the circuit monitor
Pwr Dmd Sub Interval 1–60 Power demand subinterval—period of time within the demand interval in which the
Advanced See “Advanced Meter Setup” on page 34 in this chapter for more information.
Set the value to which the PT Primary is to be scaled if the PT Primary is larger
than 32,767. For example, setting the scale to x10 multiplies the PT Primary
number by 10.
For a direct-current installation, select “No PT.”
Set the rating for the PT secondaries. 120
3Ø3W2CT is system type 30
3Ø3W3CT is system type 31
3Ø4W3CT is system type 40
3Ø4W4CT is system type 41
3Ø4W3CT2PT is system type 42
3Ø4W4CT2PT is system type 43
Set the system type. A system type code is assigned to each type of system
connection. See Table 5–2 on page 38 of the installation manual for a description
of system connection types.
calculates the demand.
demand calculation is updated. Set the subinterval only for methods that will
accept a subinterval. The subinterval must be evenly divisible into the interval.
5
x1
3Ø4W3CT (40)
Slide
15
N/A
© 2001 Schneider Electric All Rights Reserved
17
Page 30

Chapter 3—Operation 63230-300-212
Configuring the Circuit Monitor Using The Setup Menu April 2001
Setting Up Alarms
This section describes how to setup alarms and create your own custom
alarms. For a detailed description of alarm capabilities, see Chapter 6—
Alarms on page 83. The circuit monitor can detect over 100 alarm
conditions, including over/under conditions, status input changes, phase
unbalance conditions, and more. Some alarms are preconfigured and
enabled at the factory. See “Factory Defaults” on page 11 in Chapter 3—
Getting Started of the installation manual for information about
preconfigured alarms. You can edit the parameters of any preconfigured
alarm from the display.
For each alarm that you set up, do the following:
• Select the alarm group that defines the type of alarm:
—
Standard speed
alarms have a detection rate of one second and are
useful for detecting conditions such as over current and under voltage.
Up to 80 alarms can be set up in this group.
—
High speed
alarms have a detection rate of 100 milliseconds and are
useful for detecting voltage sags and swells that last a few cycles. Up
to 20 alarms can be set up in this group.
—
Disturbance monitoring
alarms have a detection rate of one cycle and
are useful for detecting voltage sags and swells. Up to 20 alarms can
be set up in this group.
—
Digital
alarms are triggered by an exception such as the transition of a
status input or the end of an incremental energy interval. Up to 40
alarms can be set up in this group.
—
Boolean
alarms have a detection rate of the alarms used as inputs.
They are used to combine specific alarms into summary alarm
information.
• Select the alarm that you want to configure. Keep the default name or
enter a new name with up to 15 characters.
• Enable the alarm.
• Assign a priority to the alarm. Refer to “Viewing Alarms” on page 41 for
information about the alarm priority levels.
• Define any required pickup and dropout setpoints, and pickup and dropout
time delays (for standard, high speed, and disturbance alarm groups only,
refer to “Setpoint-Driven Alarms” on page 85 in Chapter 6—Alarms).
18
© 2001 Schneider Electric All Rights Reserved
Page 31

63230-300-212 Chapter 3—Operation
April 2 001 Configuring the Circuit Monitor Using The Setup Menu
Creating a New Custom Alarm
In addition to editing an alarm, you can also create new custom alarms by
performing two steps:
1. Create the custom alarm.
2. Setup and enable the new alarm.
To use custom alarms, you must first create a custom alarm and then set up
the alarm to be used by the circuit monitor. Creating an alarm defines
information about the alarm including:
• Alarm group (standard, high speed, disturbance, digital, or boolean)
• Name of the alarm
• Type (such as whether it alarms on an over or under condition)
• Register number of the value that will be alarmed upon
To create an alarm, follow these steps:
1. From the Main Menu, select Setup > Alarm > Create Custom.
The Create Custom screen displays.
CREATE CUSTOM
Standard 1 sec
High Speed 100ms
Disturbance <1cycle
Digital
Boolean
2. Select the Alarm Group for the alarm that you are creating:
• Standard—detection rate of 1 second
• High Speed—detection rate of 100 millisecond
• Disturbance—detection rate of less than 1 cycle
• Digital—triggered by an exception such as a status input or the end of
an interval
• Boolean—triggered by condition of alarms used as inputs
The Select Position screen displays and jumps to the first open position
in the alarm list.
SELECT POSITION
*43 Over THD Vbc
*44 Over THD Vca
45
3. Select the position of the new alarm.
The Alarm Parameters screen displays.
© 2001 Schneider Electric All Rights Reserved
19
Page 32

Chapter 3—Operation 63230-300-212
Configuring the Circuit Monitor Using The Setup Menu April 2001
ALARM PARAMETERS
Lbl: Over THD Vbc
Type Over Val
Qty THD Vbc
Ta b le 3 –4 on page 20 describes the options on this menu.
Table 3–4: Options for Creating an Alarm
Option Available Values Selection Description Default
Label—name of the alarm. Press the down arrow button to scroll through the alphabet. The lower
Lbl Alphanumeric
Selectthetypeofalarmthatyouarecreating.
Note: For digital alarms, the type is either ON state, OFF state, or Unary to describe the state of the digital input. Unary
is available for digital alarms only.
Over Val—over value
Over Pwr—over power
Over Rev Pwr—over reverse power
Under Val—under value
Ty p e
Qty
Under Pwr—under power
Phs Rev—phase reversal
Phs Loss Volt—phase loss, voltage
Phs Loss Cur—phase loss, current
PF Lead—leading power factor
PF Lag—lagging power factor
Binary
Time of Day
See Table 6–4 on page 96 for a description of alarm types.
For standard or high speed alarms this is the quantity to be evaluated. While selected, press the arrow buttons to scroll
through the following quantity options: Current, Voltage, Demand, Unbalance, Frequency, Power Quality, THD,
Harmonics, Temperature, Custom, and Register. Pressing the enter key while an option is displayed will activate that
option’s list of values. Use the arrow keys to scroll through the list of options, selecting an option by pressing the enter key.
Unary is a special type of alarm used for ”end of” digital alarms. It does not apply to setting up alarms for digital inputs.
case letters are presented first, then uppercase, then numbers and symbols. Press the enter button
to select a letter and move to the next character field. To move to the next option, press the menu
button.
—
Undefined
Undefined
20
4. Press the menu button until “Save Changes? No” flashes on the display.
Select Yes with the arrow button, then press the enter button to save the
changes. Now, you are ready to set up the newly created custom alarm.
© 2001 Schneider Electric All Rights Reserved
Page 33

63230-300-212 Chapter 3—Operation
April 2 001 Configuring the Circuit Monitor Using The Setup Menu
Setting Up and Editing Alarms
To set up a newly created custom alarm for use by the circuit monitor, use the
Edit Parameters option on the Alarm screen. You can also change
parameters of any alarm, new or existing. For example, using the Edit option
you can enable or disable an alarm, change its priority, and change its pickup
and dropout setpoints.
Follow these instructions to set up or edit an alarm:
1. From the Main Menu, select Setup > Alarm > Edit Parameters.
The Edit Parameters screen displays.
EDIT PARAMETERS
Standard 1 sec
High Speed 100ms
Disturbance <1cycle
Digital
Boolean
2. Select the Alarm Group:
• Standard
• High Speed
• Disturbance
• Digital
• Boolean
The Select Alarm screen displays.
SELECT ALARM
*01 Over Ia
02 Over Ib
03 Over Ic
NOTE: If you are setting up or editing a digital alarm, alarm names such
as Breaker 1 trip, Breaker 1 reset will display instead.
3. Select the alarm you want to set up or edit.
The Edit Alarm screen with the alarm parameters displays. Table 3–5
describes the options on this menu.
EDIT ALARM
Lbl:Over Ia
Enable No
Priority None
Setpoint Mode Abs
Pickup 0
PU Dly seconds 0
Dropout 0
DO Dly seconds 0
© 2001 Schneider Electric All Rights Reserved
21
Page 34

Chapter 3—Operation 63230-300-212
Configuring the Circuit Monitor Using The Setup Menu April 2001
NOTE: If you are setting up or editing a digital alarm, fields related to
pickup and dropout are not applicable and will not be displayed.
4. Use the arrow buttons to scroll to the menu option you want to change,
then edit the alarm options.
5. When you are finished with all changes, press the menu button until
“Save Changes? No” flashes on the display. Select Yes with the arrow
button, then press the enter button to save the changes.
NOTE: An asterisk next to the alarm in the alarm list indicates that the
alarm is enabled.
Table 3–5: Options for Editing an Alarm
Option Available Values Selection Description Default
Label—name of the alarm assigned to this position. Press the down arrow button
Lbl Alphanumeric
Enable
Priority
Setpoint Mode
Pickup 1–32,767
PU Dly
Seconds
Dropout 1–32,767
DO Dly
Seconds
Ye s
No
None
Low
Med
High
Abs
Rel
Pickup Delay
1–32,767
Dropout Delay
1–32,767
to scroll through the alphabet. The lower case letters are presented first, then
uppercase, then numbers and symbols. Press the enter button to select a letter
and move to the next character field. To move to the next option, press the menu
button.
Y
Select
preconfigured alarms, the alarm may already be enabled.
Select
Low
the active alarm in the list of high priority alarms. To view this list from the Main
Menu, select Alarms > High Priority Alarms. For more information, see “Viewing
Alarms” on page 41.
Selecting Abs indicates that the pickup and dropout setpoints are absolute values.
Rel indicates that the pickup and dropout setpoints are a percentage of a running
average, the relative value, of the test value.
When you enter a delay time, the number is multiples of time. For example, for
standard speed the time is 2 for 2 seconds, 3 for 3 seconds, etc. For high speed
alarms, 1 indicates a 100 ms delay, 2 indicates a 200 ms delay, and so forth. For
disturbance the time unit is 1 cycle. See “Setpoint-Driven Alarms” on page 85 for
an explanation of pickup and dropout setpoints.
to make the alarm available for use by the circuit monitor. On
N
to makes the alarm function unavailable to the circuit monitor.
is the lowest priority alarm.
High
is the highest priority alarm and also places
Name of the alarm
assigned to this position.
Depends on individual
alarm.
Depends on individual
alarm.
Depends on individual
alarm.
22
© 2001 Schneider Electric All Rights Reserved
Page 35

63230-300-212 Chapter 3—Operation
April 2 001 Configuring the Circuit Monitor Using The Setup Menu
Setting Up I/Os
Selecting I/O Modules
TosetupanI/O,youmustdothefollowing:
1. Install the I/O option module following the instructions provided with the
product.
2. Use the display to select which
IOX option is installed.
3. Use the display to configure each individual input and output. You can
also use
SMS to configure inputs and outputs.
NOTE: After selecting which IOX option is installed, you can’t configure the
module until you have saved the changes. After saving the changes, you then
can configure the inputs and outputs.
For a description of I/O options, see Chapter 5—Input/Output Capabilities
on page 69. To view the status of an I/O, see “Viewing I/O Status” on page
43. You need to know the position number of the I/O to set it up. See “I/O Point
Numbers” on page 186 to determine this number. To set up an I/O, follow
these steps:
1. From the Main Menu, select Setup.
The password prompt displays.
2. Select your password. The default password is 0.
The Setup menu displays.
SETUP
Date & Time
Display
Communications
Meter
Alarm
I/O
Passwords
© 2001 Schneider Electric All Rights Reserved
3. Select I/O.
TheI/OSetupmenudisplays.
I/O
KYZ
I/O Extender
NOTE: Other option modules will be displayed in the I/O menu if they
are installed
4. Select the I/O option that you have installed. In this example, we selected
the I/O Extender.
23
Page 36

Chapter 3—Operation 63230-300-212
Configuring the Circuit Monitor Using The Setup Menu April 2001
The I/O Extender Setup menu displays.
I/O EXTENDER SETUP
Select Modules
Configure Modules
5. Select the Select Modules menu option.
The IOX Select Modules menu displays.
IOX SELECT MODULES
IOX-08
IOX-0404
IOX-2411
Custom
6. If you have the IOX-08, IOX-0404, or IOX-2411, select the option you
have installed. A pound sign (#) appears next to the option to indicate that
the circuit monitor has recognized the module. If you installed individual
custom I/Os, select Custom on the IOX Select Modules menu.
The Custom Extender menu displays.
CUSTOM
Position 1 DI120AC
Position 2 AI420
Position 3 DI120AC
Position 4 AI420
Position 5 DI120AC
Position 6 AI420
Position 7 DI120AC
Position 8 AI420
7. Select the position in which the I/O is installed. Then, select which I/O
module is located in that position using the arrow keys to scroll through
the available I/Os. The individual I/Os are described in Table 3–6.
Table 3–6: I/O Descriptions
I/O Name Description
DigitalI/Os
DI32DC 32 Vdc input (0.2ms turn on) polarized
DI120AC 120 Vac input
DO120AC 120 Vac output
DI240AC 240 Vac input
DO60DC 60 Vdc output
DO200DC 200 Vdc output
24
© 2001 Schneider Electric All Rights Reserved
Page 37

63230-300-212 Chapter 3—Operation
April 2 001 Configuring the Circuit Monitor Using The Setup Menu
Table 3–6: I/O Descriptions
I/O Name Description
DO240AC 240 Vac output
Analog I/Os
AI05 0to5Vdcanaloginput
AI420 4 to 20 mA analog input
AO420 4 to 20 mA analog output
8. Press the menu button until “Save Changes? No” flashes on the display.
Select Yes with the arrow button, then press the enter button to save the
changes.
Configuring I/O Modules
After selecting the I/O modules used with your circuit monitor, you can
configure the I/O modules. Follow the steps below to configure the inputs and
outputs for the I/O module you selected.
1. From the Main Menu, select Setup.
The password prompt displays
2. Select your password. The default password is 0.
The Setup menu displays.
SETUP
Date & Time
Display
Communications
Meter
Alarm
I/O
Passwords
3. Select I/O.
TheI/OSetupmenudisplays.
I/O
KYZ
I/O Extender
© 2001 Schneider Electric All Rights Reserved
4. Select the I/O option that you have installed. In this example, we selected
the I/O Extender.
25
Page 38

Chapter 3—Operation 63230-300-212
Configuring the Circuit Monitor Using The Setup Menu April 2001
The I/O Extender Setup selection menu displays.
I/O EXTENDER SETUP
Select Modules
Configure Modules
5. Select the Configure Modules menu option.
The IOX Setup menu displays according to the IOX previously selected.
In this example the IOX Custom Setup menu displays.
IOX CUSTOM SETUP
Position 1
Position 2
Position 3
Position 4
Position 5
Position 6
Position 7
Position 8
ANALOG INPUT SETUP
Lbl: Analog In C02
Type 4-20mA Input
I/O Point # 36
Multiplier 1
Lower Limit 400
Upper Limit 2000
6. Select the position in which the I/O is installed.
The I/O module’s setup menu displays based on the type of module
installed in the selected position.
ANALOG OUTPUT SETUP
Lbl: Analog OutC04
Type 4-20mA Output
I/O Point # 38
Reference Reg 100
Lower Limit 400
Upper Limit 2000
NOTE: For a description of the I/O options displayed above, refer to
Chapter 5—Input/Output Capabilities
DIGITAL INPUT SETUP
Lbl: Dig In C01
Type 120Vac Input
I/O Point # 35
Mode Normal
DIGITAL OUTPUT SETUP
Lbl: Dig Out C03
Type 120 Vac Output
I/O Point # 37
Mode Normal
Pulse Const ****
Timer (secs) 0
Control External
Associate Alarm
on page 69.
26
© 2001 Schneider Electric All Rights Reserved
Page 39

63230-300-212 Chapter 3—Operation
April 2 001 Configuring the Circuit Monitor Using The Setup Menu
Setting Up Passwords
MAIN MENU
Meters
Min/Max
View Alarms
I/O Display
Resets
Setup
Diagnostics
Passwords can be set
up for Resets, Setup,
and Diagnostics menus
METERS
Summary
Powe r
Power Quality
Energy
Power Demand
Amp Demand
Custom
MIN/MAX
Amps
Volts
Frequency
Powe r
Power Factor
THD
VIEW ALARMS
Active Alarms
High Priority Alarms
I/O DISPLAY
Digital Inputs
Analog Inputs
Digital Outputs
Analog Outputs
RESETS
Energy
Demand
Min/Max
SETUP
Display
Communications
Meter
Alarm
I/O
Passwords
DIAGNOSTICS
Meter Information
CVM Information
Read/Write Regs
Wiring Error Test
A password is always required to access the following menus from the
Main Menu:
• Resets (a separate password can be set up for Energy/Demand Reset
and Min/Max Reset)
• Setup
• Read/Write Regs on the Diagnostics Menu
The default password is 0. Therefore, when you receive a new circuit monitor,
the password for the Setup, Diagnostics, and Reset menu is 0. If you choose
to set up passwords, you can set up a different password for each of the four
menus options listed above.
To set up a password, follow these instructions:
1. From the Main Menu, select Setup.
The password prompt displays.
2. Select 0, the default password.
The Setup menu displays.
SETUP
Date & Time
Display
Communications
Meter
Alarm
I/O
Passwords
3. Select Passwords.
The Password Setup menu displays. Table 3–7 describes the options.
PASSWORDS
Setup 0
Diagnostics 0
Engy/Dmd Reset 0
Min/Max Reset 0
Figure 3–5: Menus that can be
password protected
© 2001 Schneider Electric All Rights Reserved
Table 3–7: Options for Password Setup
Option Available Values Description
EnterapasswordintheSetupfieldtocreate
Setup 0–9998
Diagnostics 0–9998
a password for the Setup option on the Main
Menu.
Enter a password in the Diagnostics field to
create a password for the Diagnostics option
on the Main Menu.
27
Page 40

Chapter 3—Operation 63230-300-212
Configuring the Circuit Monitor Using The Setup Menu April 2001
Table 3–7: Options for Password Setup
Enter a passwordin the Engy/DmdReset field
Engy/Dmd
Q
Reset
Min/Max Reset
QThe word “Locked” appears next to a reset option that is inaccessible. If all of the
reset opt ions are locked, “Locked” will appear next to the Resets option in the Main
Menu, and the Resets menu will be inaccessible.
Q
0–9998
0–9998
to create a password for resetting Energy and
Demand. These options appear on the Reset
menu, and they can also be locked. See
“Advanced Meter Setup” on page 34 for
instructions.
Enter a password in the Min/Max Reset field
to create a password for resetting the Min/
Max, which appears on the Reset menu. This
optioncanalsobelocked.See“Advanced
Meter Setup” on page 34 for instructions.
Advanced Setup Features
Creating Custom Quantities to be Displayed
The features discussed in this section are not required for basic circuit
monitor setup, but can be used to customize your circuit monitor to suit your
needs.
Any quantity that is stored in a register in the circuit monitor can be displayed
on the remote display. The circuit monitor has a list of viewable quantities
already defined such as average current, power factor total, and so forth. In
addition to these predefined values, you can define custom quantities that
can be displayed on a custom screen. For example, if your facility uses
different types of utility services such as water, gas, and steam, you may want
to track usage of the three services on oneconvenient screen. To dothis, you
could set up inputs to receive pulses from each utility meter, then display the
scaled register quantity.
For the circuit monitor display, custom quantities can be used to display a
value. Don’t confuse this feature with
quantities are used to add new parameters which
functions.
new
into
SMS custom quantities are defined, for example, when you add a
POWERLOGIC-compatible device to SMS or if you want to import data
SMS from another software package. You can use the SMS custom
SMS custom quantities. SMS custom
SMS can use to perform
quantitiesin custom tables and interactivegraphics diagrams, but you cannot
use circuit monitor display custom quantities in this way.
that you define for display from the circuit monitor are not available to
Custom quantities
SMS
They must be defined separately in SMS.
.
28
To use a custom quantity, perform these tasks:
1. Create the custom quantity as described in this section.
2. Create a custom screen on which the custom quantity can be displayed.
See “Creating Custom Screens” on page 31 in the following section. You
can view the custom screen by selecting from the Main Menu, Meters >
Custom. See “Viewing Custom Screens” on page 34 for more
information.
To create a custom quantity, follow these steps:
1. From the Main Menu, select Setup.
The password prompt displays.
© 2001 Schneider Electric All Rights Reserved
Page 41

63230-300-212 Chapter 3—Operation
April 2 001 Configuring the Circuit Monitor Using The Setup Menu
2. Select your password. The default password is 0.
The Setup menu displays.
SETUP
Date & Time
Display
Communications
Meter
Alarm
I/O
Passwords
3. Select Display.
The Display Setup menu displays.
DISPLAY
Language English
Date MM/DD/YYYY
Time Format AM/PM
VFD Sensitivity 2
Display Timer 5 Min
Custom Quantity
Custom Screen
4. Select Custom Quantity.
The Custom Quantity Setup screen displays.
© 2001 Schneider Electric All Rights Reserved
CUSTOM QUANT SETUP
Custom Quantity 1
Custom Quantity 2
Custom Quantity 3
Custom Quantity 4
Custom Quantity 5
Custom Quantity 6
Custom Quantity 7
Custom Quantity 8
Custom Quantity 9
Custom Quantity 10
5. Select a custom quantity.
29
Page 42

Chapter 3—Operation 63230-300-212
Configuring the Circuit Monitor Using The Setup Menu April 2001
In this example, we selected Custom Quantity 1. Table 3–8showsthe
available values.
Custom Quantity 1
Lbl:
Register 1,000
Scale 1,000
Format Integer
6. Use the arrow buttons to scroll to the menu option you want to change.
7. Press the enter button to select the value. The value begins to blink. Use
the arrow buttons to scroll through the available values. Then, press the
enter button to select the new value.
8. Use the arrow buttons to scroll through the other options on the menu, or
if you are finished, press the menu button to save.
Table 3–8: Options for Custom Quantities
Option Available Values Default
Lbl Name of the quantity up to 10 characters. Press the arrow
Register 4- or 5-digit number of the register in which the quantity
Scale Multiplier of the register value can be one ofthe following:
Format Integer
buttons to scroll through the characters. To move to the
next option, press the menu button.
1,000
exists.
1,000
.001, .01, .1, 1.0, 10, 100 or 1,000. See “Scale Factors” on
page 91 for more information.
Integer
D/T—date and time
MOD10L4—Modulo 10,000 with 4 registers
MOD10L3—Modulo 10,000 with 3 registers
MOD10L2—Modulo 10,000 with 2 registers
Label
Modulo 10,000 is used to store energy. See the SMS online help for more.
Use the Label format only when a label has been defined with no corresponding register.
30
An asterisk (*) next to the quantity indicates that the quantity has been added
to the list.
9. To save the changes to the Display Setup screen, press the menu button.
The custom quantity is added to the Quantities List in the Custom Screen
Setup. The new quantity appears at the end of this list after the standard
quantities. After creating the custom quantity, you must create a custom
screen to be able to view the new quantity.
© 2001 Schneider Electric All Rights Reserved
Page 43

63230-300-212 Chapter 3—Operation
April 2 001 Configuring the Circuit Monitor Using The Setup Menu
CreatingCustom Screens
You choose the quantities that are to be displayed on a custom screen. The
quantities can be standard or custom quantities. If you want to display a
custom quantity, you must first create the custom quantity so that it appears
on the Quantities List. See “Creating Custom Quantities to be Displayed” on
page 28 for instructions.
To create a custom screen, follow these steps:
1. From the Main Menu, select Setup.
The password prompt displays.
2. Select your password. The default password is 0.
The Setup menu displays.
SETUP
Date & Time
Display
Communications
Meter
Alarm
I/O
Passwords
3. Select Display.
The Display Setup menu displays.
DISPLAY
Language English
Date MM/DD/YYYY
Time Format AM/PM
VFD Sensitivity 2
Display Timer 5 Min
Custom Quantity
Custom Screen
4. Select Custom Screen.
The Custom Screen Setup screen displays.
CUSTOM SCREEN SETUP
Custom Screen 1
Custom Screen 2
Custom Screen 3
Custom Screen 4
Custom Screen 5
5. Select a custom screen.
In this example, we selected Custom Screen 1.
© 2001 Schneider Electric All Rights Reserved
31
Page 44

Chapter 3—Operation 63230-300-212
Configuring the Circuit Monitor Using The Setup Menu April 2001
SCREEN 1
Screen 1
Blank Line
Blank Line
Blank Line
The cursor begins to blink.
6. Create a name for the custom screen. Press the arrow buttons to scroll
through the alphabet. Press the enter button to move to the next
character field.
7. When you have finished naming the screen, press the menu button, then
select the first blank line.
The first blank line begins to blink.
SCREEN 1
Monthly Energy Cost
Blank Line
Blank Line
Blank Line
8. Use the arrow buttons to select one of the following quantity types:
• Current
• Vol t age
• Frequency
• Power Factor
• Power
• THD
• Energy
• Demand
• Harmonics
• Unbalance
• Custom
To view the quantities of a quantity type, press the enter button.
The first quantity flashes on the display.
Screen 1
Monthly Energy Cost
Ia ****A
Blank Line
Blank Line
32
© 2001 Schneider Electric All Rights Reserved
Page 45

63230-300-212 Chapter 3—Operation
April 2 001 Configuring the Circuit Monitor Using The Setup Menu
9. Use the arrow buttons to scroll through the list of quantities. Select the
quantity that you want for your custom screen by pressing the enter
button.
Tab le 3–9 lists the default quantities. If you have created a custom
quantity, it will be displayed at the bottom of this list.
Table 3–9: Available Default Quantities
Quantity TypeQQuantity Label
Current Current A Ia
Current B Ib
Current C Ic
Current N In
Current G Ig
Current Average I Avg
Voltage Voltage A–BVab
Vol tage B–CVbc
Vol tage C-A Vca
Vol tage L–LAverage VL-LAvg
Vol tage A–NVan
Vol tage B–NVbn
Vol tage C–NVcn
Vol tage L–NAverage VL-NAvg
Frequency Frequency Freq
Power Factor Power Factor Total PF Total
Displacement Power Factor Total Dis PF Tot
Power Real Power Total kW Total
Reactive Power Total kVAR Total
Apparent Power Total kVA Total
THD THD Current A THD Ia
THD Current B THD Ib
THD Current C THD Ic
THD Current N THD In
THD Voltage A–NTHDVan
THD Voltage B–NTHDVbn
THD Voltage C–NTHDVcn
THD Voltage A–BTHDVab
THD Voltage B–CTHDVbc
THD Voltage C–ATHDVca
Energy Real Energy, Total kWHr Tot
Reactive Energy, Total kVARHr Tot
Apparent Energy, Total kVAHr Tot
Demand Demand Current Average Dmd I Avg
Demand Current A Dmd Ia
Demand Current B Dmd Ib
Demand Current C Dmd Ic
Demand Current N Dmd In
Demand Voltage A–NDmdVan
Demand Voltage B–NDmdVbn
Demand Voltage C–NDmdVcn
Demand Voltage L–N Average Dmd V L-N
Demand Voltage A–BDmdVab
Demand Voltage B–CDmdVbc
Demand Voltage C–ADmdVca
Q
© 2001 Schneider Electric All Rights Reserved
33
Page 46

Chapter 3—Operation 63230-300-212
Configuring the Circuit Monitor Using The Setup Menu April 2001
Table 3–9: Available Default Quantities
Quantity TypeQQuantity Label
Demand Voltage L–LAvg DmdVL-L
Demand Real Power (kWD) Dmd kW
Demand Reactive Power (kVARD) Dmd kVAR
Demand Apparent Power (kVA) Dmd kVA
Harmonics 3rd Harmonic Magnitude Voltage A Van 3rd
5th Harmonic Magnitude Voltage A Van 5th
7th Harmonic Magnitude Voltage A Van 7th
3rd Harmonic Magnitude Voltage B Vbn 3rd
5th Harmonic Magnitude Voltage B Vbn 5th
7th Harmonic Magnitude Voltage B Vbn 7th
3rd Harmonic Magnitude Voltage C Vcn 3rd
5th Harmonic Magnitude Voltage C Vcn 5th
7th Harmonic Magnitude Voltage C Vcn 7th
Unbalance Current Unbalance Max I Unbl Mx
Voltage Unbalance Max L-L V Unbl Mx L–L
Voltage Unbalance Max L-N V Unbl Mx L–N
Q
Q D isplayed on the screen.
ViewingCustom Screens
Advanced Meter Setup
10. Press the menu button until “Save Changes? No” flashes on the display.
Select Yes, then press the enter button to save the custom screen.
If you have a custom screen setup, a “Custom” option will be displayed on the
Meters menu.
To view a custom screen, from the Main Menu select Meters > Custom. In
this example, a custom screen was created for monthly energy cost. Press
the arrow button to view the next custom screen. Press the menu button to
exit and return to the Meters Menu.
Monthly Energy Cost
Dollars 8632
The Advanced option on the Meter Setup screen lets you perform
miscellaneous advanced setup functions on the metering portion of the
circuit monitor. For example, on this menuyou can change the phase rotation
or the VAR sign convention. The advanced options are described below.
1. From the Main Menu, select Setup.
The password prompt displays.
2. Select your password. The default password is 0.
The Setup menu displays.
34
© 2001 Schneider Electric All Rights Reserved
Page 47

63230-300-212 Chapter 3—Operation
April 2 001 Configuring the Circuit Monitor Using The Setup Menu
SETUP
Date & Time
Display
Communications
Meter
Alarm
I/O
Passwords
3. Select Meter.
The Meter Setup screen displays.
METER
Ø CT Primary 5
Ø CT Secondary 5
N CT Primary 5
N CT Secondary 5
PT Pri Scale x1
PT Primary 120
PT Secondary 120
Sys Type 3Ø4W3CT
Frequency (Hz) 60
Pwr Dmd Meth Slide
Pwr Dmd Int 15
Pwr Dmd Sub Int 1
Advanced
4. Scroll to the bottom of the list and select Advanced.
The Advanced Meter Setup screen displays. Table 3–10 on page 36
describes the options on this menu.
ADVANCED METER SETUP
Phase Rotation ABC
Incr Energy Int 60
THD Meth THD(%Fund)
VAR Sign IEEE/IEC
Lock Energy Reset N
Lock Pk Dmd Reset N
Lock M/M Reset N
5. Change the desired options and press the menu button to save.
© 2001 Schneider Electric All Rights Reserved
35
Page 48

Chapter 3—Operation 63230-300-212
Configuring the Circuit Monitor Using The Setup Menu April 2001
Table 3–10: Options for Advanced Meter Setup
Option Available Values Selection Description Default
Phase Rotation ABC or CBA Set the phase rotation to match the system. ABC
Incr Energy Int 0–1440 Set incremental energy interval in minutes. The interval must be evenly divisible into
THD Meth THD(%Fund) or
thd(%RMS)
VARSign IEEE/IECor
ALT(CM1)
Lock Energy Reset Y or N Lock the reset of the accumulated energy. If set to Y (yes), the Energy option on the
Lock Pk Dmd Reset Y or N Lock the reset of peak demand. If set to Y (yes), the Demand option on the Reset
Lock M/M Reset Y or N Lock the reset of themin/max values.If set to Y (yes), the Min/Max option onthe Reset
24 hours.
Set the calculation for total harmonic distortion. See “Power Analysis Values” on page
66 for a detailed description.
Set the VAR sign convention. See “VAR Sign Conventions” on page 55 fora discussion
about VAR sign convention.
Reset menu will be locked so that the value cannot be reset from the display, even if a
password has been set up for the Reset option. See “Resetting Min/Max, Demand, and
Energy Values” on page 37 for more information.
menu will be locked so that the value cannot be reset from the display, even if a
password has been set up for the Reset option. See “Resetting Min/Max, Demand, and
Energy Values” on page 37 for more information.
menu will be locked so that the value cannot be reset from the display, even if a
password has been set up for the Reset option. See “Resetting Min/Max, Demand, and
Energy Values” on page 37 for more information.
60
THD
Standard
N
N
N
36
© 2001 Schneider Electric All Rights Reserved
Page 49

63230-300-212 Chapter 3—Operation
April 2 001 Resetting Min/Max, Demand, and Energy Values
RESETTING MIN/MAX, DEMAND, AND ENERGY VALUES
MAIN MENU
Meters
Min/Max
View Alarms
I/O Display
Resets
Setup
Diagnostics
A reset clears the circuit monitor’s memory of the last recorded value. For
example, you might need to reset monthly peak demand power. From the
Reset menu, shown in Figure 3–6, you can reset the following values:
• Energy—accumulated energy and conditional energy
• Demand—peak power demand and peak current demand
• Min/Max—minimum and maximum values for all real-time readings
RESETS
Energy
Demand
Min/Max
Figure 3–6: Performing resets from the Reset menu
A password is required to reset any of the options on the Reset menu. The
default password is 0. See “Setting Up Passwords” on page 27 for more
information about passwords.
You can perform resets from the circuit monitor as described in this section
or if you are using
automatically at a specified time. See the
SMS, you can set up a task to perform the reset
SMS online help for instructions.
NOTE: To stop users from using the display to reset energy, peak demand,
and min/max values, see“Advanced Meter Setup” on page 34 for instructions
on using the reset locking feature.
To perform resets, follow these steps:
1. From the Main Menu, select Resets.
2. Use the arrow buttons to scroll through the menu options on the
RESET ENERGY
Accumulated No
The Resets menu displays.
RESETS
Energy
Demand
Min/Max
Resets menu. To select a menu option, press the enter button.
Depending on the option you selected, the screen for that value displays.
RESET DEMAND
PK Power Demand No
RESET MIN/MAX
Min/Max No
PK Amp Demand No
© 2001 Schneider Electric All Rights Reserved
37
Page 50

Chapter 3—Operation 63230-300-212
Viewing Metered Data April 2001
3. Select the option you would like to reset and change No to Yes by
pressing the arrow button.
4. Press Enter to move to the next option or press the menu button to reset
the value.
VIEWING METERED DATA
The Meters menu and the Min/Max menu, shown in Figure 3–7, are view-only
menus where you can view metered data in real time.
METERS
Summary
MAIN MENU
Meters
Min/Max
View Alarms
I/O Display
Resets
Setup
Diagnostics
Powe r
Power Quality
Energy
Power Demand
Current Demand
MIN/MAX
Current
Voltage
Frequency
Powe r
Power Factor
THD
Figure 3–7: Viewingmetered data on the Meters and Min/Max menus
Use the arrow buttons to scroll through the menu options on the Meters
menu. To select a menu option, press the enter button. To select another
option, press the menu button.
Viewing Metered Data from the Meters Menu
38
From the Meters menu you can view the following information.
• Summary—lets you quickly move through and view the following:
— Summary total of volts, amperes, and kW.
— Amperes and voltsfor all three phases, neutral and ground, line to line,
line to neutral.
— Power kW, kVAR, and kVA (real, reactive, and apparent power)
3-phase totals.
— Power factor (true and displacement) 3-phase totals.
— Total energy kWh, kVARh, andkVAh 3-phase totals (real, reactive, and
apparent energy).
— Frequency in hertz.
• Power—is available only if the circuit monitor is configured for 4-wire
system; it will not appear for 3-wire systems. If you are using a 4-wire
system, you can view the leading and lagging values for true and
displacement power factor. Also this option lets you view power per-phase
kW, kVAR, and kVA (real, reactive, and apparent power).
• Power Quality—shows the following values per phase:
— THD voltage line to neutral and line to line.
— THD amperes
— K-factor
© 2001 Schneider Electric All Rights Reserved
Page 51

63230-300-212 Chapter 3—Operation
April 2 001 Viewing Metered Data
— Fundamental volts and phase angle
— Fundamental amperes and phase angle
• Energy—shows accumulated and incremental readings for real and
reactive energy into and out of the load, and the real, reactive, and
apparent total of all three phases.
• Power Demand—displays total and peak power demand kW, kVAR, and
kVA (real, reactive, and apparent power) for the last completed demand
interval. It also shows the peak power demand kW, kVAR, and kVA with
date, time, and coincident power factor (leading and lagging) associated
with that peak.
• Current Demand—shows total and peak demand current for all three
phases, neutral, and ground. It also shows the date and time of the peak
demand current.
Viewing Minimum and Maximum Values from the Min/Max Menu
From the Min/Max menu you can view the minimum and maximum values
recorded by the circuit monitor, and the date and time when that min or max
value occurred. These values that can be view are:
• Current
• Voltage
• Frequency
• Power
• Power Factor
• THD
To use the Min/Max menu, follow these steps:
1. Use the arrow buttons to scroll through the menu options on the Min/Max
menu.
MIN/MAX
Current
Voltage
Frequency
Power
Power Factor
THD
© 2001 Schneider Electric All Rights Reserved
2. To select a menu option, press the enter button.
The screen for that value displays. Press the arrow buttons to scroll
through the min/max quantities.
CURRENT A
Min 0A
Max 0A
Press Enter for D/T
39
Page 52

Chapter 3—Operation 63230-300-212
Viewing Metered Data April 2001
3. To view the date and time when the minimum and maximum value was
reached, press the enter button. Press the arrow buttons to scroll through
the dates and times.
CURRENT A
Mn 01/22/20001:59A
Mx 01/22/20008:15A
4. Press the enter button to return to the Min/Max values
5. Press the menu button to return to the Min/Max menu.
40
© 2001 Schneider Electric All Rights Reserved
Page 53

63230-300-212 Chapter 3—Operation
April 2 001 Viewing Alarms
VIEWING ALARMS
MAIN MENU
Meters
Min/Max
View Alarms
I/O Display
Resets
Setup
Diagnostics
TheAlarmsmenushowninFigure3–8, lets you view active and high priority
alarms.
VIEW ALARMS
Active Alarms List
High Priority Log
Figure 3–8: View Alarms menu
When an alarm is first set up, an alarm priority is selected. Four alarm levels
are available:
• High priority—if high priority alarm occurs, the display informs you in
two ways:
— The
LED on the display flashes while the alarm is active and until you
acknowledge the alarm
— A message displays whether the alarm is active or unacknowledged.
• Medium pr iority—if medium priority alarm occurs, the
LED flashes and a
message displays only while the alarm is active. Once the alarm becomes
inactive, the
• Low priority—if low priority alarm occurs, the
LED and message stop.
LED on the display flashes
only while the alarm is active. No alarm message is displayed.
• No priority—if an alarm is setup with no priority, no visible representation
will appear on the display.
If multiple alarms with different priorities are active at the same time, the
display shows the alarm message for the last alarm.
© 2001 Schneider Electric All Rights Reserved
Each time an alarm occurs, the circuit monitor does the following:
• Puts the alarm in the list of active alarms. See “ViewingActiveAlarms” on
page 42 for more about active alarms.
• Performs any assigned action. The action could be one of the following:
— Operate one or more relays (you can view the status from the display)
— Force data log entries into the user-defined data log files (1–14 data
logscanbeviewedfrom
— Performawaveformcapture(canbeviewedfrom
SMS)
SMS)
• Records the occurrence of high, medium, and low priority events in the
circuit monitor’s alarm Log (can be viewed using
Also, the display
LED and alarm messages will operate according to the
SMS).
priority selected when an alarm occurs.
41
Page 54

Chapter 3—Operation 63230-300-212
Viewing Alarms April 2001
Viewing Active Alarms
View and Acknowledging High Priority Alarms
The Active Alarms List displays currently active alarms, regardless of their
priority. You can view all active alarms from the Main Menu by selecting View
Alarms > Active Alarms List. The Active Alarm screen displays. Use the
arrow buttons to scroll through the alarms that are active.
Alarm Number/
To t a l A l ar m s
ACTIVE ALARMS LIST 1/1
Alarm Name
Over Van
Priority High
Alarm Priority
Relay assigned No
Indicates whether a
relay is assigned or not
To view high priority alarms, from the Main Menu select View Alarms >
High Priority Log. The High Priority Log screen displays. Use the arrow
buttons to scroll through the alarms.
Log Position
Alarm Name
HIGH PRIORITY LOG 1
Alarm Name
Over Van
Unacknowledged
Relay Assigned No
Indicates alarm is
unacknowledged
Indicates whether a relay
is assigned or not
The High Priority Alarms screen displays the ten most recent, high-priority
alarms. When you acknowledge the high priority alarms, all digital outputs
(relays) that are configured for latched mode will be released. To
acknowledge all high priority alarms follow these steps:
1. After viewing the alarms, press the menu button to exit.
The display asks you whether you would like to acknowledge the alarm.
HIGH PRIORITY ALARMS
Acknowledge
Alarms? No
2. To acknowledge the alarms, press the arrow button to change No to Yes.
Then, press the enter button.
3. Press the menu button to exit.
42
NOTE: You have acknowledged the alarms, but the LED will continue to
flash as long as any high priority alarm is active.
© 2001 Schneider Electric All Rights Reserved
Page 55

63230-300-212 Chapter 3—Operation
April 2 001 Viewing I/O Status
VIEWING I/O STATUS
TheI/ODisplaymenushowstheON or OFF status of the digital inputs or
outputs. For analog inputs and outputs, it displays the present value. To view
the status of inputs and outputs:
1. From the Main Menu, select I/O Display.
The I/O Display screen displays.
I/O DISPLAY
Digital Inputs
Analog Inputs
Digital Outputs
Analog Outputs
2. Select the input or output on which you’d like to view the status. In this
example, we selected Digital Outputs to display the status of the
KYZ
output.
DIGITAL OUTPUTS
KYZ OFF
3. Press the menu button to exit.
© 2001 Schneider Electric All Rights Reserved
43
Page 56

Chapter 3—Operation 63230-300-212
Reading and Writing Registers April 2001
READING AND WRITING REGISTERS
METERS
Summary
Powe r
Power Quality
Energy
Power Demand
Current Demand
Custom
MIN/MAX
Current
Voltage
Frequency
Powe r
Power Factor
THD
VIEW ALARMS
Active Alarms List
High Priority Log
MAIN MENU
Meters
Min/Max
View Alarms
I/O Display
Resets
Setup
Diagnostics
I/O DISPLAY
Digital Inputs
Analog Inputs
Digital Outputs
Analog Outputs
You can access the read and write register menu option on the circuit
monitor’s display by selecting from the Main Menu > Diagnostics > Read/
Write Regs as shown in Figure 3–9. This option lets you read and write circuit
monitor registers from the display. This capability is most useful to users who
1) need to set up an advanced feature which is beyond the circuit monitor’s
normal front panel setup mode, and 2) do not have access to
SMS to set up
the feature.
For example, the default operating mode for a circuit monitor relay output is
normal
. To change a relay’s operating mode from normal to another mode
(for example, latched mode), use either
SMS or the Read/Write Regs option
of the Diagnostics menu.
NOTE: Use this feature with caution. Writing an incorrect value, or writing to
the wrong register could affect the intended operation of the circuit monitor
or its accessories.
To read or write registers, follow these steps:
1. From the Main Menu, select Diagnostics.
The Diagnostics menu displays.
DIAGNOSTICS
Meter Information
CVM Information
Read/Write Regs
Wiring Error Test
RESETS
Meters
Min/Max
Demand
Energy
SETUP
Display
Communications
Meter
Alarm
I/O
Passwords
DIAGNOSTICS
Meter Information
CVM Information
Read/Write Regs
Wiring Error Test
Figure 3–9: Diagnostics Menu accessed
from the Main M enu
2. Select Read/Write Regs.
The password prompt displays.
3. Select your password. The default password is 0.
The Read/Write Registers screen displays. Table 3–11 describes the
options on this screen.
READ/WRITE REGS
Reg Hex Dec
1003 000A 10
Table 3–11: Read/Write Register Options
Option Available Values
Reg List the register numbers.
Hex List the hexidecimal value of that register.
Dec List the decimal value of that register.
44
© 2001 Schneider Electric All Rights Reserved
Page 57

63230-300-212 Chapter 3—Operation
April 2 001 Performing a Wiring Check
If you are viewing a metered value, such as voltage, the circuit monitor
updates the displayed value as the register contents change. Note that
scale factors are not taken into account automatically when viewing
register contents.
4. To scroll through the register numbers, use the arrow buttons.
5. To change the value in the register, press the enter button.
The Hex and Dec values begin to blink. Use the arrow buttons to scroll
through the numeric values available.
NOTE: Some circuit monitor registers are read/write,someareread
only. You can write to read/write registers only.
6. When you are finished making changes to that register, press the enter
button to continue to the next register or press the menu button to save
the changes.
PERFORMING A WIRING E RROR TES T
MAIN MENU
Meters
Min/Max
View Alarms
I/O Display
Resets
Setup
Diagnostics
The circuit monitor has the ability to perform a wiring diagnostic self-check
when you select the Diagnostic > Wiring Error Test from the Main Menu as
showninFigure3–10.
DIAGNOSTICS
Meter Information
CVM Information
Read/Write Regs
Wiring Error Test
Figure 3–10: Wiring Error Test option on the Diagnostics menu.
The circuit monitor can diagnose possible wiring errors when you initiate the
wiring test on the Diagnostics menu. Running the test is not required, but may
help you to pinpoint a potentially miswired connection. Before running the
wiring test, you must first wire the circuit monitor and perform the minimum
set up of the circuit monitor, which includes setting up these parameters:
© 2001 Schneider Electric All Rights Reserved
• CT primary and secondary
• PT primary and secondary
• System type
• Frequency
After you have wired and completed the minimum set up, run the wiring test
to verify proper wiring of your circuit monitor. The wiring test assumes that
the following is true about your system:
45
Page 58

Chapter 3—Operation 63230-300-212
Performing a Wiring Check April 2001
• Voltage connection Van(4-wire) or Vab(3-wire) is correct. This connection
must be properly wired for the wiring check program to work.
• 3-phase system. The system must be a 3-phase system. You cannot
perform a wiring check on a single-phase system.
• System type. The wiring check can be performed only on the six possible
system types: 3∅3W2CT, 3∅3W3CT, 3∅4W3CT, 3∅4W4CT,
3∅4W3CT2PT, and 3∅4W4CT2PT (see Table 5–2 on page 38 of the
installation manual for a description of system types).
• Expected displacement power factor is between .60 lagging and .99
leading.
• The load must be at least 1% of the CT Primary setting.
This wiring error program is based on the assumptions above and based on
a typical wiring system, results may vary depending on your system and
some errors may not apply to your system. When the wiring test is run, the
program performs the following checks in this order:
1. Verifies that the system type is one of those listed above.
2. Verifies that the frequency is within ±5% of the frequency that you
selected in circuit monitor set up.
3. Verifies that the voltage phase angles are 120° apart. If the voltage
connections are correct, the phase angles will be 120° apart.
If the voltage connections are correct, the test continues.
4. Verifies that the measured phase rotation is the same as the phase
rotation set up in the circuit monitor.
5. Verifies the magnitude of the currents to see if there is enough load on
each phase input to perform the check.
6. Indicates if the 3-phase real power (kW) total is negative, which could
indicate a possible wiring error.
7. Compares each current angle to its respective voltage.
Running t he Diagnostics Wiring Error Test
46
When the circuit monitor detects a possible error, you can find and correct the
problem and then run the check again. Repeat the procedure until no error
messages are displayed. To perform a wiring diagnostic test, follow these
steps:
1. From the Main Menu, select Diagnostics.
The Diagnostics menu displays.
DIAGNOSTICS
Meter Information
CVM Information
Read/Write Regs
Wiring Error Test
© 2001 Schneider Electric All Rights Reserved
Page 59

63230-300-212 Chapter 3—Operation
April 2 001 Performing a Wiring Check
2. Select Wiring Error Test from the menu.
The circuit monitor asks if the wiring matches the test assumptions.
Test Assumptions:
Va and Vn for 4wire
Va and Vb for 3wire
are correct.
3. Press the down arrow button.
The circuit monitor asks if the expected displacement power factor is
between 0.60 lagging and 0.99 leading.
Test Assumptions:
Displacement PF is
between 0.60 lag
and 0.99 lead.
4. Press the down arrow button, again.
The circuit monitor asks if you’dliketoperformawiringcheck.
Perform Test No
5. Select “Yes ” to perform the test by pressing the up arrow button and then
pressing the enter button.
The circuit monitor performs the wiring test.
If it doesn’t find any errors, the circuit monitor displays “Wire test
complete. No errors found!”. If it finds possible errors, it displays “Error
detected. See following screens for details.”
6. Press the arrow buttons to scroll through the wiring error messages.
Tab le 3–12 on page 48 explains the possible wiring error messages.
7. Turn off all power supplying the circuit monitor. Verify that the power is off
using a properly rated voltage testing device.
© 2001 Schneider Electric All Rights Reserved
47
Page 60

Chapter 3—Operation 63230-300-212
Performing a Wiring Check April 2001
DANGER
HAZARD OF ELECTRIC SHOCK, BURN, OR EXPLOSION
• Turn off all power supplying the circuit monitor and the
equipment in which it is installed before working on it.
• Use a properly rated voltage testing device to verify that the
power is off.
• Never short the secondary of a PT.
• Never open circuit a CT; use the shorting block to short circuit
the leads of the CT before removing the connection from the
circuit monitor.
Failure to follow this instruction will result in death or
serious injury.
8. Correct the wiring errors.
9. Repeat these steps until all errors are corrected.
Table 3–12: Wiring Error M essages
Message Description
Invalid system type
Frequency out of range
Voltage not present on all phases No voltage metered on one or more phases.
Severe voltage unbalance present Voltage unbalance on any phase greater than 70%.
Not enough load to check wiring Metered current below deadband on one or more phases.
Suspected error: Check meter configuration for direct connection Set up for voltage input should be “No PT.”
Suspected error: Reverse polarity on all current inputs Check polarities. Polarities on all CTs could be reversed.
Phase rotation does not match meter setup
Negative kW, check CT & VT polarities
NovoltagemeteredonV1–n NovoltagemeteredonV1–non4-wiresystemonly.
NovoltagemeteredonV2–n NovoltagemeteredonV2–non4-wiresystemonly.
NovoltagemeteredonV3–n NovoltagemeteredonV3–non4-wiresystemonly.
NovoltagemeteredonV1–2 NovoltagemeteredonV1–2.
NovoltagemeteredonV2–3 NovoltagemeteredonV2–3.
No voltage metered on V3-1 No voltage metered on V3-1.
V2–n phase angle out of range V2–n phase angle out of expected range.
V3–n phase angle out of range V3–n phase angle out of expected range.
V2–3 phase angle out of range V2–3 phase angle out of expected range.
V3–1 phase angle out of range V3–1 phase angle out of expected range.
Suspected error: Reverse polarity on V2–n VT Polarity of V2–n VT could be reversed. Check polarity.
Suspected error: Reverse polarity on V3–n VT Polarity of V3–n VT could be reversed. Check polarity.
Suspected error: Reverse polarity on V2–3 VT Polarity of V2–3 VT could be reversed. Check polarity.
The circuit monitor is set up for a system type that the wiring test
does not support.
Actual frequency of the system is not the same as the selected
frequency configured for the circuit monitor.
Metered phase rotation is different than phase rotation selected in
the circuit monitor set up.
Metered kW is negative, which could indicate swapped polarities
on any CT or VT.
48
© 2001 Schneider Electric All Rights Reserved
Page 61

63230-300-212 Chapter 3—Operation
April 2 001 Performing a Wiring Check
Table 3–12: Wiring Error Messages
Message Description
Suspected error: Polarity on V3–1VT PolarityofV3–1 VT could be reversed. Check polarity.
Suspected er ror: Check V1 input, may be V2 VT Phase 2 VT may actually be connected to input V1.
Suspected er ror: Check V2 input, may be V3 VT Phase 3 VT may actually be connected to input V12
Suspected er ror: Check V3 input, may be V1 VT Phase 1 VT may actually be connected to input V3.
Suspected er ror: Check V1 input, may be V3 VT Phase 3 VT may actually be connected to input V1.
Suspected er ror: Check V2 input, may be V1 VT Phase 1 VT may actually be connected to input V2.
Suspected er ror: Check V3 input, may be V2 VT Phase 2 VT may actually be connected to input V3.
I1 load current less than 1% CT Metered current on I1 less than 1% of CT. Test could not continue.
I2 load current less than 1% CT Metered current on I2 less than 1% of CT. Test could not continue.
I3 load current less than 1% CT Metered current on I3 less than 1% of CT. Test could not continue.
I1 phase angle out of range. Cause of error unknown.
I2 phase angle out of range. Cause of error unknown
I3 phase angle out of range. Cause of error unknown.
Suspected er ror: Reverse polarity on I1 CT. Polarity of I1 CT could be reversed. Check polarity.
Suspected error: Reverse polarity on I2 CT Polarity of I2 CT could be reversed. Check polarity.
Suspected error: Reverse polarity on I3 CT Polarity of I3 CT could be reversed. Check polarity.
Suspected error: Check I1 input, may be I2 CT Phase 2 CT may actually be connected to input I1.
Suspected error: Check I2 input, may be I3 CT Phase 3 CT may actually be connected to input I2.
Suspected error: Check I3 input, may be I1 CT Phase 1 CT may actually be connected to input I3.
Suspected error: Check I1 input, may be I3 CT Phase 3 CT may actually be connected to input I1.
Suspected error: Check I2 input, may be I1 CT Phase 1 CT may actually be connected to input I2.
Suspected error: Check I3 input, may be I2 CT Phase 2 CT may actually be connected to input I3.
Suspected er ror: Check I1 input, may be I2 CT with reverse polarity
Suspected er ror: Check I2 input, may be I3 CT with reverse polarity
Suspected er ror: Check I3 input, may be I1 CT with reverse polarity
Suspected er ror: Check I1 input, may be I3 CT with reverse polarity
Suspected er ror: Check I2 input, may be I1 CT with reverse polarity
Suspected error. Check I3 input, may be I2 CT with reverse polarity
I1 phase angle is out of expected range. Cause of error unable to
be determined.
I2 phase angle is out of expected range. Cause of error unable to
be determined.
I3 phase angle is out of expected range. Cause of error unable to
be determined.
Phase 2 CT may actually be connected to input I1, and the CT
polarity may also be reversed.
Phase 3 CT may actually be connected to input I21, and the CT
polarity may also be reversed.
Phase 1 CT may actually be connected to input I3, and the CT
polarity may also be reversed.
Phase 3 CT may actually be connected to input I1, and the CT
polarity may also be reversed.
Phase 1 CT may actually be connected to input I2, and the CT
polarity may also be reversed.
Phase 2 CT may actually be connected to input I3, and the CT
polarity may also be reversed.
© 2001 Schneider Electric All Rights Reserved
49
Page 62

Chapter 3—Operation 63230-300-212
Performing a Wiring Check April 2001
50
© 2001 Schneider Electric All Rights Reserved
Page 63

63230-300-212 Chapter 4—Metering Capabilities
April 2 001 Chapter Contents
CHAPTER 4—METERING CAPABILITIES
This chapter details the types of meter readings you can obtain from the
circuit monitor.
CHAPTER CONTENTS
CHAPTERCONTENTS ......................................51
REAL-TIMEREADINGS ......................................52
MIN/MAXVALUESFORREAL-TIMEREADINGS..................53
PowerFactorMin/MaxConventions .........................54
VARSignConventions ................................55
DEMANDREADINGS........................................56
DemandPowerCalculationMethods ........................57
BlockIntervalDemand ................................57
SynchronizedDemand ................................59
DemandCurrent ........................................59
DemandVoltage ........................................59
ThermalDemand ........................................60
PredictedDemand .......................................60
PeakDemand ..........................................61
Generic Demand ........................................61
InputPulseDemandMetering ..............................62
ENERGYREADINGS ........................................64
POWERANALYSISVALUES..................................66
© 2001 Schneider Electric All Rights Reserved
51
Page 64

Chapter 4—Metering Capabilities 63230-300-212
Real-Time Readings April 2001
REAL-TIME READINGS
The circuit monitor measures currents and voltages and reports in real time
the rms values for all three phases, neutral, and ground current. In addition,
the circuit monitor calculates power factor, real power, reactive power,
and more.
Ta b le 4 –1 lists some of the real-time readings that are updated every second
along with their reportable ranges. When you are viewing real-time readings
from the remote display or
SMS, the circuit monitor is displaying 100-ms
readings.
Table 4–1: One-Second, Real-Time Readings Samples
Real-Time Readings Reportable Range
Current
Per-Phase 0 to 32,767 A
Neutral
Ground
3-PhaseAverage 0to32,767A
Apparent rms 0 to 32,767 A
% Unbalance 0 to ±100.0%
Vol tag e
Line-to-Line, Per-Phase 0 to 1,200 kV
Line-to-Line, 3-P hase Average 0 to 1,200 kV
Line-to-Neutral, Per-Phase
Neutral to Ground
Line-to-Neutral, 3-Phase Average 0 to 1,200 kV
% Unbalance
Real Power
Per-Phase
3-Phase Total 0 to ± 3,276.70 MW
Reactive Power
Per-Phase
3-Phase Total 0 to ± 3,276.70 MVAR
Apparent Power
Per-Phase
3-Phase Total 0 to ± 3,276.70 MVA
PowerFactor(True)
Per-Phase
3-Phase Total –0.010 to 1.000 to +0.010
PowerFactor(Displacement)
Per-Phase
3-Phase Total –0.010 to 1.000 to +0.010
Frequency
45–65 Hz 23.00 to 67.00 Hz
350–450Hz 350.00to450.00Hz
Temperature (Internal Ambient) –100.00°C to +100.00°C
Wye systems only.
0to32,767A
0to32,767A
0to1,200kV
0to1,200kV
0to100.0%
0 to ± 3,276.70 MW
0 to ± 3,276.70 MVAR
0 to ± 3,276.70 MVA
–0.010 to 1.000 to +0.010
–0.010 to 1.000 to +0.010
52
© 2001 Schneider Electric All Rights Reserved
Page 65

63230-300-212 Chapter 4—Metering Capabilities
April 2 001 Min/Max Values for Real-time Readings
The circuit monitor also has the capability of 100 ms updates. The 100 ms
readings listed in Table 4–2 can be communicated over
MODBUS TCP and
are useful for rms event recording and high-speed alarms.
Table 4–2: 100 ms Real-Time Readings
Real-Time Readings Reportable Range
Current
Per-Phase 0 to 32,767 A
Neutral
Ground
3-Phase Average 0 to 32,767 A
Apparent rms 0 to 32,767 A
Voltage
Line-to-Line, Per-Phase 0 to 1,200 kV
Line-to-Line, 3-Phase Average 0 to 1,200 kV
Line-to-Neutral, Per-Phase
Neutral to Ground
Line-to-Neutral, 3-Phase Average
Real Power
Per-Phase
3-Phase Total 0 to ± 3,276.70 MW
Reactive Power
Per-Phase
3-Phase Total 0 to ± 3,276.70 MVAR
Apparent Power
Per-Phase
3-Phase Total 0 to ± 3,276.70 MVA
Power Fa cto r
3-Phase Total –0.010 to 1.000 to +0.010
Wye systems only.
0to32,767A
0to32,767A
0to1,200kV
0to1,200kV
0to1,200kV
0 to ± 3,276.70 MW
0 to ± 3,276.70 MVAR
0 to ± 3,276.70 MVA
MIN/MAX VALUES FOR REAL-TIME READINGS
© 2001 Schneider Electric All Rights Reserved
When any one-second real-time reading reaches its highest or lowest value,
the circuit monitor saves the value in its nonvolatile memory. These values
are called the minimum and maximum (min/max) values. Two logs are
associated with min/max values. The Min/Max Log stores the minimum and
maximum values since the last reset of the min/max values. The other log,
the Interval Min/Max/Average Log, determines min/max values over a
specified interval and records the minimum, maximum, and average values
for pre-defined quantities over that specified interval. For example, the circuit
monitor could record the min, max, and average every 1440 minutes (total
minutes in a day) to record the daily value of quantities such as kW demand.
See Chapter 7—Logging on page 99 for more about the Min/Max/Average
log.
From the circuit monitor display you can:
• View all min/max values since the last reset and view their associated
dates and times. See “Viewing Minimum and Maximum Values from the
Min/Max Menu” on page 39 for instructions.
• Resetmin/maxvalues.See“Resetting Min/Max, Demand, and Energy
Values” on page 37 for reset instructions.
Using
SMS you can also upload both onboard logs—and their associated
dates and times—from the circuit monitor and save them to disk. For
53
Page 66

Chapter 4—Metering Capabilities 63230-300-212
Min/Max Values for Real-time Readings April 2001
instructions on working with logs using SMS, refer to the SMS online help file
included with the software.
Power Factor Min/Max Conventions
All running min/max values, except for power factor, are arithmetic minimum
and maximum values. For example, the minimum phase A–Bvoltageisthe
lowest value in the range 0 to 1200 kV that has occurred since the
min/max values were last reset. In contrast, because the power factor’s
midpoint is unity (equal to one), the power factor min/max values are not true
arithmetic minimums and maximums. Instead, the minimum value represents
the measurement closest to –0 on a continuous scale for all real-time
readings –0 to 1.00 to +0. The maximum value is the measurement closest
to+0onthesamescale.
Figure 4–1 below shows the min/max values in a typical environment in
which a positive power flow is assumed. In the figure, the minimum power
fact or is –.7 (lagging) and the maximum is .8 (leading). Note that the
minimum power factor need not be lagging, and the maximum power factor
need not be leading. For example, if the power factor values ranged from
–.75 to –.95, then the minimum power factor would be –.75 (lagging) and the
maximum power factor would be –.95 (lagging). Both would be negative.
Likewise, if the power factor ranged from +.9 to +.95, the minimum would be
+.95 (leading) and the maximum would be +.90 (leading). Both would be
positive in this case.
Minimum
Power Factor
–.7 (lagging)
Range of
Power Factor
Values
Unity
1.00
.8
Maximum
Power Factor
.8 (leading)
.8
Lag
(–)
.6
.4
.2
–0
Note: Assumes a positive power flow
.6
Lead
.4
(+)
.2
+0
Figure 4–1: Power factor min/max example
An alternate power factor storage method is also available for use with
analog outputs and trending. See the footnotes in Appendix A—
Abbreviated Register Listing on page 127 for the applicable registers.
54
© 2001 Schneider Electric All Rights Reserved
Page 67

63230-300-212 Chapter 4—Metering Capabilities
April 2 001 Min/Max Values for Real-time Readings
VAR Sign Conventions
Quadrant
2
watts negative (–)
vars negative (–)
power factor leading (+)
Reverse Power Flow Normal Power Flow
watts negative (–)
vars positive (+)
power factor lagging (–)
Reactive
Power In
Quadrant
1
watts positive (+)
vars negative (–)
power factor lagging (–)
watts postive (+)
vars positive (+)
power factor leading (+)
The circuit monitor can be set to one of two VAR sign conventions, the
standard IEEE or the ALT (CM1). Circuit monitors manufactured before
March 2000 default to the ALT VAR sign convention.The Series 4000 Circuit
Monitor defaults to the IEEE VAR sign convention. Figure 4–2 illustrates the
VAR sign convention defined by IEEE and the default used by previous model
circuit monitors (CM1). For instructions on changing the VAR sign
convention, refer to “Advanced Meter Setup” on page 34.
Reactive
Power In
Quadrant
1
watts positive (+)
vars positive (+)
power factor lagging (–)
watts positive (+)
vars negative (–)
power factor leading (+)
Real
Power
In
Real
Power
In
Quadrant
2
watts negative (–)
vars positive (+)
power factor leading (+)
Reverse Power Flow Normal Power Flow
watts negative (–)
vars negative (–)
power factor lagging (–)
Quadrant
3
Quadrant
4
Quadrant
3
Quadrant
4
ALT (CM1) VAR Sign Convention IEEE/IEC VAR Sign Convention
(Series 4000 Circuit Monitor Default)
Figure 4–2: Reactive Power—VAR sign convention
© 2001 Schneider Electric All Rights Reserved
55
Page 68

Chapter 4—Metering Capabilities 63230-300-212
Demand Readings April 2001
DEMAND READINGS
The circuit monitor provides a variety of demand readings, including
coincident readings and predicted demands. Table 4–3liststheavailable
demand readings and their reportable ranges.
Table 4–3: Demand Readings
Demand Readings Reportable Range
Demand Current, Per-Phase, 3Ø Average, Neutral
Last Complete Interval 0 to 32,767 A
Peak 0 to 32,767 A
Demand Voltage, L–N, L–L, Per-phase, Average, N-G
Last Complete Interval 0 to 1200 kV
Minimum 0 to 1200 kV
Pea k
Average Power Factor (True), 3Ø To t al
Last Complete Interval
Coincident with kW Peak
Coincident with kVAR Peak
Coincident with kVA Peak
Demand Real Power, 3Ø To t a l
Last Complete Interval
Predicted
Pea k
Coincident kVA Demand
Coincident kVAR Demand
Demand Reactive Power, 3Ø To t al
Last Complete Interval
Predicted
Pea k
Coincident kVA Demand
Coincident kW Demand
Demand Apparent Power, 3Ø To ta l
Last Complete Interval
Predicted
Pea k
Coincident kW Demand
Coincident kVAR Demand
0to1200kV
–0.010 to 1.000 to +0.010
–0.010 to 1.000 to +0.010
–0.010 to 1.000 to +0.010
–0.010 to 1.000 to +0.010
0 to ± 3276.70 MW
0 to ± 3276.70 MW
0 to ± 3276.70 MW
0 to ± 3276.70 MVA
0 to ± 3276.70 MVAR
0 to ± 3276.70 MVAR
0 to ± 3276.70 MVAR
0 to ± 3276.70 MVAR
0 to ± 3276.70 MVA
0 to ± 3276.70 MW
0 to ± 3276.70 MVA
0 to ± 3276.70 MVA
0 to ± 3276.70 MVA
0 to ± 3276.70 MW
0 to ± 3276.70 MVAR
56
© 2001 Schneider Electric All Rights Reserved
Page 69

63230-300-212 Chapter 4—Metering Capabilities
April 2 001 Demand Readings
Demand Power Calculation Methods
Block Interval Demand
Demand power is the energy accumulated during a specified period divided
by the length of that period. How the circuit monitor performs this calculation
depends on the method you select. To be compatible with electric utility billing
practices, the circuit monitor provides the following types of demand power
calculations:
• Block Interval Demand
• Synchronized Demand
The default demand calculation is set to sliding block with a 15 minute
interval. You can set up any of the demand power calculation methods from
the display or from
SMS. For instructions on how to setup the demand
calculation from the display, see “Setting Up the Metering Functions of the
Circuit Monitor” on page 16. See the
SMS online help to perform the set up
using the software.
In the block interval demand method, you select a “block” of time that the
circuit monitor uses for the demand calculation. You choose how the circuit
monitor handles that block of time (interval). Three different modes are
possible:
• Sliding Block. In the sliding block interval, you select an interval from 1 to
60 minutes (in 1-minute increments). If the interval is between 1 and 15
minutes, the demand calculation
is between 16 and 60 minutes, the demand calculation
seconds
. The circuit monitor displays the demand value for the last
updates every 15 seconds
updates every 60
.Iftheinterval
completed interval.
• Fixed Block. In the fixed block interval, you select an interval from 1 to 60
minutes (in 1-minute increments). The circuit monitor calculates and
updates the demand at the end of each interval.
• Rolling Block. In the rolling block interval, you select an interval and a
subinterval. The subinterval must divide evenly into the interval. For
example, you might set three 5-minute subintervals for a 15-minute
interval. Demand is
updated at each subinterval
. The circuit monitor
displays the demand value for the last completed interval.
© 2001 Schneider Electric All Rights Reserved
Figure 4–3 below illustrates the three ways to calculate demand power using
the block method. For illustration purposes, the interval is set to 15 minutes.
57
Page 70

Chapter 4—Metering Capabilities 63230-300-212
Demand Readings April 2001
Calculation updates
every 15 or
60 seconds
15 30 45
60 . . .
15-minute interval
Sliding Block
Calculation updates
at the end of the interval
15-minute interval15-minute interval
15 30 45
Fixed Block
Demand value is
the average for
the last completed
interval
Time
(sec)
Demand value
is the average
for last
completed
interval
15-min
Time
(min)
Calculation updates at
the end of the subinterval (5 min.)
15-minute interval
20 35 4025
15
Figure 4–3: Block Interval Demand Examples
30 45
Rolling Block
Demand value
is the average
for last
completed
interval
Time
(min)
58
© 2001 Schneider Electric All Rights Reserved
Page 71

63230-300-212 Chapter 4—Metering Capabilities
April 2 001 Demand Readings
Synchronized Demand
The demand calculations can be synchronized by accepting an external
pulse input, a command sent over communications, or by synchronizing to
the internal real-time clock.
• Input Synchronized Demand. You can set up the circuit monitor to
accept an input such as a demand synch pulse from an external source.
The circuit monitor then uses the same time interval as the other meter for
each demand calculation. You can use any digital input installed on the
meter to receive the synch pulse. When setting up this type of demand,
you select whether it will be input-synchronized block or inputsynchronized rolling block demand. The rolling block demand requires
that you choose a subinterval.
• Command Synchronized Demand. Using command synchronized
demand, you can synchronize the demand intervals of multiple meters on
a communications network. For example, if a PLC input is monitoring a
pulse at the end of a demand interval on a utility revenue meter, you could
program the PLC to issue a command to multiple meters whenever the
utility meter starts a new demand interval. Each time the command is
issued, the demand readings of each meter are calculated for the same
interval. When setting up this type of demand, you select whether it will be
command-synchronized block or command-synchronized rolling block
demand. The rolling block demandrequires that you choose a subinterval.
See Appendix B—Using the Command Interface on page 181 for
more information.
• Clock SynchronizedDemand. You can synchronize the demand interval
to the internal real-time clock in the circuit monitor. This enables you to
synchronize the demand to a particular time, typically on the hour. The
default time is 12:00 am. If you select another time of day when the
demand intervals are to be synchronized, the time must be in minutes
from midnight. For example, to synchronize at 8:00 am, select 480
minutes. When setting up this type of demand, you select whether it will
be clock-synchronized block or clock-synchronized rolling block demand.
The rolling block demand requires that you choose a subinterval.
Demand Current
Demand Voltage
© 2001 Schneider Electric All Rights Reserved
The circuit monitor calculates demand current using the thermal demand
method. The default interval is 15 minutes, but you can set the demand
current interval between 1 and 60 minutes in 1-minute increments.
The circuit monitor calculates demand voltage. The default voltage demand
mode is thermal demand with a 15-minute demand interval. You can also set
the demand voltage to any of the block interval demand modes described in
“Block Interval Demand” on page 57.
59
Page 72

Chapter 4—Metering Capabilities 63230-300-212
Demand Readings April 2001
Thermal Demand
Predicted Demand
The thermal demand method calculates the demand based on a thermal
response, which mimics thermal demand meters. The demand calculation
updates at the end of each interval. You select the demand interval from 1 to
60 minutes (in 1-minute increments). In Figure 4–4 the interval is set to 15
minutes for illustration purposes.
The interval is a window of time that moves across the timeline.
99%
90%
Last completed
demand interval
% of Load
0%
15-minute
interval
Calculation updates at the end of each interval
next
15-minute
interval
Time
(minutes)
Figure 4–4: Thermal Demand Example
The circuit monitor calculates predicted demand for the end of the present
interval for kW, kVAR, and kVA demand. This prediction takes into account
the energy consumption thus far within the present (partial) interval and the
present rate of consumption. The prediction is updated every second.
Demand for
last completed
interval
Figure 4–5 illustrates how a change in load can affect predicted demand for
the interval.
Predicted demand is updated every second.
Beginning
of interval
15-minute interval
Partial Interval
Demand
1:00 1:06 1:15
Change in Load
Figure 4–5: Predicted Demand Example
Predicted demand if load is
added during interval,
predicted demand increases
to reflect increased demand
Predicted demand if no load added
Time
60
© 2001 Schneider Electric All Rights Reserved
Page 73

63230-300-212 Chapter 4—Metering Capabilities
April 2 001 Demand Readings
Peak Demand
Generic Demand
In nonvolatile memory, the circuit monitor maintains a running maximum for
power demand values, called “peak demand.” The peak is the highest
average for each of these readings: kWD, kVARD, and kVAD since the last
reset. The circuit monitor also stores the date and time when the peak
demand occurred. In addition to the peak demand, the circuit monitor also
stores the coinciding average 3-phase power factor. The average 3-phase
power factor is defined as “demand kW/demand kVA” for the peak demand
interval. Table 4–3 on page 56 lists the available peak demand readings from
the circuit monitor.
You can reset peak demand values from the circuit monitor display. From the
Main Menu, select Resets > Demand. You can also reset the values over the
communications link by using
SMS.SeetheSMS online help for instructions.
NOTE: You should reset peak demand after changes to basic meter setup,
such as CT ratio or system type.
The circuit monitor also stores the peak demand during the last incremental
energy interval. See “Energy Readings” on page 64 for more about
incremental energy readings.
The circuit monitor can perform any of the demand calculation methods,
described earlier in this chapter, on up to 20 quantities that you choose. In
SMS the quantities are divided into two groups of 10, so you can set up two
different demand “profiles.” For each profile, you do the following in
SMS:
• Select the demand calculation method (thermal, block interval, or
synchronized).
• Select the demandinterval (from 5–60 minutes in 1–minute increments)
and select the demand subinterval (if applicable).
• Select the quantities on which to perform the demand calculation. You
must also select the units and scale factor for each quantity.
Use the Device Setup > Basic Setup tab in
SMS to create the generic
demand profiles. For example, you might set up a profile to calculate the
15-minute average value of an analog input. To do this, select a fixed-block
demand interval with a 15-minute interval for the analog input.
For each quantity in the demand profile, the circuit monitor stores four values:
• Partial interval demand value
• Last completed demand interval value
• Minimum values (date and time for each is also stored)
• Peak demand value (date and time for each is also stored)
You can reset the minimum and peak values of the quantities in a generic
demand profile by using one of two methods:
• Use
SMS (see the SMS online help file), or
• Use the command interface.
Command 5115 resets the generic demand profile 1.
Command 5116 resets the generic demand profile 2.
See Appendix B—Using the Command Interface on page 181 for
more about the command interface.
© 2001 Schneider Electric All Rights Reserved
61
Page 74

Chapter 4—Metering Capabilities 63230-300-212
Demand Readings April 2001
Input Pulse Demand Metering
The circuit monitor has ten input pulse metering channels. The channels
count pulses received from one or more digital inputs assigned to that
channel. Each channel requires a consumption pulse weight, consumption
scale factor, demand pulse weight, and demand scale factor. The
consumption pulse weight is the number of watt-hours or kilowatt-hours per
pulse. The consumption scale factor is a factor of 10 multiplier that
determines the format of the value. For example, if each incoming pulse
represents 125 Wh, and you want consumption data in watt-hours, the
consumption pulse weight is 125 and the consumption scale factor is zero.
The resulting calculation is 125 x 10
0
, which equals 125 watt-hoursper pulse.
If you want the consumption data in kilowatt-hours, the calculation is 125 x
-3
10
, which equals 0.125 kilowatt-hours per pulse.
Time must be taken into account for demand data so you begin by calculating
demand pulse weight using the following formula:
watts =
watt-hours x 3600 seconds x pulse
per pulse per hour per second
If each incoming pulse represents 125 Wh, using the formula above you get
450,000 watts. If you want demand data in watts, the demand pulse weight
is 450 and the demand scale factor is three. The calculation is 450 x 10
3
,
which equals 450,000 watts. If you want the demand data in kilowatts, the
calculation is 450 x 10
0
, which equals 450 kilowatts.
The circuit monitor counts each input transition as a pulse. Therefore, for an
input transition of OFF-to-ON and ON-to-OFF will be counted as two pulses.
For each channel, the circuit monitor maintains the following information:
• Total consumption
• Last completed interval demand—calculated demand for the last
completed interval.
• Partial interval demand—demand calculation up to the present point
during the interval.
• Peak demand—highest demand value since the last reset of the input
pulse demand. The date and time of the peak demand is also saved.
• Minimum demand—lowest demand value since the last reset of the input
pulse demand. The date and time of the minimum demand is also saved.
For example, you can use channels to verify utility charges. In Figure 4–6,
Channel 1 is adding demand from two utility feeders to track total
consumption and demand for the building. This information could be viewed
in
SMS and compared against the utility charges.
To use the channels feature, first set up the digital inputs from the display or
from
SMS.See“SettingUpI/Os” on page 23 in Chapter 3—Operation for
instructions. Then using
SMS, you must set the I/O operating mode to Normal
and set up the channels. The demand method and interval that you select
applies to all channels. See the
SMS online help for instructions on device set
up of the CM4000 Circuit Monitor.
62
© 2001 Schneider Electric All Rights Reserved
Page 75

63230-300-212 Chapter 4—Metering Capabilities
April 2 001 Demand Readings
Building A
For all channels
To Utility Meter on Feeder 1
To Utility Meter on Feeder 2
Units: kWh for consumption data
kW for demand data
Fixed block demand with 15 min interval
Channel 1
Pulses from
both inputs
are totaled
An SMS table
Channel 2
Pulses from
shows the demand
calculation results
by channel
only one input
Figure 4–6: Channel pulse metering example
© 2001 Schneider Electric All Rights Reserved
63
Page 76

Chapter 4—Metering Capabilities 63230-300-212
Energy Readings April 2001
ENERGY READINGS
The circuit monitor calculates and stores accumulated energy values for real
and reactive energy (kWh and kVARh) both into and out of the load, and also
accumulates absolute apparent energy. Table 4–4 lists the energy values the
circuit monitor can accumulate.
Table 4–4: Energy Readings
Energy Reading, 3-Phase Reportable Range Shown on the Display
Accumulated Energy
Real (Signed/Absolute)
Reactive (Signed/Absolute)
Real (In)
Real (Out) 0 to 9,999,999,999,999,999 Wh
Reactive (In) 0 to 9,999,999,999,999,999 VARh
Reactive (Out) 0 to 9,999,999,999,999,999 VARh
Apparent 0 to 9,999,999,999,999,999 VAh
Accumulated Energy, Conditional
Real (In)
Real (Out)
Reactive (In)
Reactive (Out)
Apparent
Accumulated Energy, Incremental
Real (In) 0 to 999,999,999,999 Wh
Real (Out) 0 to 999,999,999,999 Wh
Reactive (In) 0 to 999,999,999,999 VARh
Reactive (Out) 0 to 999,999,999,999 VARh
Apparent 0 to 999,999,999,999 VAh
Reactive Energy
Quadrant 1
Quadrant 2
Quadrant 3
Quadrant 4
Values can be displayed on the screen by creating custom quantities and custom displays.
-9,999,999,999,999,999 to
9,999,999,999,999,999 Wh
-9,999,999,999,999,999 to
9,999,999,999,999,999 VARh
0 to 9,999,999,999,999,999 Wh
0 to 9,999,999,999,999,999 Wh
0 to 9,999,999,999,999,999 Wh
0 to 9,999,999,999,999,999 VARh
0 to 9,999,999,999,999,999 VARh
0 to 9,999,999,999,999,999 VAh
0 to 999,999,999,999 VARh
0 to 999,999,999,999 VARh
0 to 999,999,999,999 VARh
0 to 999,999,999,999 VARh
0000.000kWh to 99,999.99 MWh and
0000.000 to 99,999.99 MVARh
0000.000kWh to 99,999.99 MWh and
0000.000 to 99,999.99 MVARh
Not shown on the display. Readings
are obtained only through the
communications link.
0000.000kWh to 99,999.99 MWh and
0000.000 to 99,999.99 MVARh
Not shown on the display. Readings
are obtained only through the
communications link.
64
The circuit monitor can accumulate the energy values shown in Table 4–4in
one of two modes: signed or unsigned (absolute). In signed mode, the circuit
monitor considers the direction of power flow, allowing the magnitude of
accumulated energy to increase and decrease. In unsigned mode, the circuit
monitor accumulates energy as a positive value, regardless of the direction
of power flow. In other words, the energy value increases, even during
reverse power flow. The default accumulation mode is unsigned.
You can view accumulated energy from the display. The resolution of the
energy value will automatically change through the range of 000.000 kWh to
000,000 MWh (000.000 to 000,000 MVARh), or it can be fixed.
See Appendix A—Abbreviated Register Listing on page 127 for the
contents of the registers.
© 2001 Schneider Electric All Rights Reserved
Page 77

63230-300-212 Chapter 4—Metering Capabilities
April 2 001 Energy Readings
For conditional accumulated energy readings, you can set the real, reactive,
and apparent energy accumulation to
OFF or ON when a particular condition
occurs. You can do this over the communications link, using a command, or
from a digital input change. For example, you may want to track accumulated
energy values during a particular process that is controlled by a PLC. The
circuit monitor stores the date and time of the last reset of conditional energy
in nonvolatile memory.
Also, the circuit monitor provides an additional energy reading that is only
available over the communications link:
• Four-quadrant r eactive accumulated energy readings. The circuit
monitor accumulates reactive energy (kVARh) in four quadrants as shown
in Figure 4–7. The registers operate in unsigned (absolute) mode in which
the circuit monitor accumulates energy as positive.
NOTE: The reactive accumulated energy is not affected by the VAR sign
convention and will remain as shown in the image below.
Reactive
Power In
Quadrant
2
Quadrant
1
watts negative (–)
vars positive (+)
power factor leading (+)
Reverse Power Flow Normal Power Flow
watts positive (+)
vars positive (+)
power factor lagging (–)
Real
Power
watts negative (–)
vars negative (–)
power factor lagging (–)
Quadrant
3
watts positive (+)
vars negative (–)
power factor leading (+)
Quadrant
4
In
Figure 4–7: Reactive energy accumulates in four quadrants
© 2001 Schneider Electric All Rights Reserved
65
Page 78

Chapter 4—Metering Capabilities 63230-300-212
Power Analysis Values April 2001
POWER ANALYSIS VALUES
The circuit monitor provides a number of power analysis values that can be
used to detect power quality problems, diagnose wiring problems, and more.
Ta b le 4 –5 on page 68 summarizes the power analysis values.
• THD. Total Harmonic Distortion (THD) is a quick measure of the total
distortion present in a waveform and is the ratio of harmonic content to the
fundamental. It provides a general indication of the “quality” of a
waveform. THD is calculated for both voltage and current. The circuit
monitor uses the following equation to calculate THD where H is the
harmonic distortion:
THD =
2
H
2
2
++
H
3
H
1
2
H
4
+
x
100%
• thd. An alternate method for calculating Total Harmonic Distortion, used
widely in Europe. It considers the total harmonic current and the total rms
content rather than fundamental content in the calculation. The circuit
monitor calculates thd for both voltage and current. The circuit monitor
uses the following equation to calculate thd where H is the harmonic
distortion:
thd =
2
H
2
2
++
H
3
H
4
2
+
x
100%
Total rms
• TDD. Total Demand Distortion (TDD) is used to evaluate the harmonic
voltages and currents between an end user and a power source. The
harmonic values are based on a point of common coupling (PCC), which
is a common point that each user receives power from the power source.
The following equation is used to calculate TDD where I
of individual harmonic components, h is the harmonic order, and I
is the magnitude
h
is the
L
maximum demand load current in register 3233:
255
2
I
h
Σ
TDD =
• K-factor. K-factor is a simple numerical rating used to specify
transformers for nonlinear loads. The rating describes a transformer’s
ability to serve nonlinear loads without exceeding rated temperature rise
limits. The higher the K-factor rating, the better the transformer’s ability to
handle the harmonics. The circuit monitor uses the following equation to
calculate K-factor where I
order:
h=2
I
L
is harmonic current and h is the harmonic
h
K =
SUM
SUM
(I
I
2
h
2
rms
h )
x
100%
2
66
© 2001 Schneider Electric All Rights Reserved
Page 79

63230-300-212 Chapter 4—Metering Capabilities
April 2 001 Power Analysis Values
• Displacement PowerFactor. Power factor (PF) represents the degree to
which voltage and current coming into a load are out of phase. When true
power factor is based on the angle between the fundamental components
of current and voltage.
• Harmonic Values. Harmonics can reduce the capacity of the power
system. The circuit monitor determines the individual per-phase harmonic
magnitudes and angles through the 63rd harmonic for all currents and
voltages. The harmonic magnitudes can be formatted as either a
percentage of the fundamental (default) or a percentage of the rms value.
Refer to “Setting Up Individual Harmonic Calculations” on page 190 in
Appendix B—Using the Command Interface for information on how to
configure harmonic calculations.
• Harmonic Power. Harmonic power is an indication of the non-
fundamental components of current and power in the electrical circuit.The
circuit monitor uses the following equation to calculate harmonic power.
Harmonic Power =
Overall Power
2
Fundamental Power
2
• Distortion Power Factor.Distortion power factor is an indication of the
distortion power content of non-linear loads. Linear loads do not contribute
to distortion power even when harmonics are present. Distortion power
factor provides a way to describe distortion in terms of its total contribution
to apparent power. The circuit monitor uses the following equation to
calculate the distortion power factor.
Distortion Power Factor =
Overall Power Power Factor
Fundamental Power Power Factor
© 2001 Schneider Electric All Rights Reserved
67
Page 80

Chapter 4—Metering Capabilities 63230-300-212
Power Analysis Values April 2001
Table 4–5: Power Analysis Values
Value Reportable Range
THD—Voltage, Current
3-phase, per-phase, neutral 0 to 3,276.7%
thd—Voltage, Current
3-phase, per-phase, neutral 0 to 3,276.7%
Total Demand Distortion 0 to 10,000
K-Factor (per phase)
K-Factor Demand (per phase)
Crest Factor (per phase)
Displacement P.F. (per phase, 3-phase)
Fundamental Voltages (per phase)
Magnitude 0 to 1,200 kV
Angle 0.0 to 359.9°
Fundamental Currents (per phase)
Magnitude 0 to 32,767 A
Angle 0.0 to 359.9°
Fundamental Real Power (per phase, 3-phase)
Fundamental Reactive Power (per phase)
Harmonic Power (per phase, 3-phase)
Phase Rotation ABC or CBA
Unbalance (current and voltage)
Individual Harmonic Magnitudes
Individual Harmonic Angles
Distortion Power –32,767 to 32,767
Distortion Power Factor 0 to 1,000
Readings are obtained only through communications.
K-Factor not available at 400Hz.
Harmonic magnitudes and angles through the 63rd harmonic at 50Hz and 60Hz;
harmonic magnitudes and angles through the 7th harmonic at 400Hz.
0.0to100.0
0.0to100.0
0.0to100.0
–0.010 to 1.000 to +0.010
0to32,767kW
0 to 32,767 kVAR
0 to 32,767 kW
0.0to100.0%
0to327.67%
0.0° to 359.9°
68
© 2001 Schneider Electric All Rights Reserved
Page 81

63230-300-212 Chapter 5—Input/Output Capabilities
April 2 001 Chapter Contents
CHAPTER 5—INPUT/OUTPUT CAPABILITIES
This chapter explains the input and output (I/O) capabilities of the circuit
monitor and its optional I/O accessories. For module installation instructions
and detailed technical specifications, refer to the individual instruction
bulletins that ship with the product. For a list of these publications, see Table
1–2 on page 3 of this bulletin.
CHAPTER CONTENTS
CHAPTERCONTENTS ......................................69
I/OOPTIONS ..............................................70
DIGITALINPUTS ...........................................71
DEMANDSYNCHPULSEINPUT ..............................72
ANALOGINPUTS...........................................73
AnalogInputExample ....................................74
RELAYOUTPUTOPERATINGMODES .........................75
MECHANICALRELAYOUTPUTS ..............................77
Setpoint-controlledRelayFunctions .........................78
SOLID-STATEKYZPULSEOUTPUT ...........................78
2-WirePulseInitiator .....................................79
3-WirePulseInitiator .....................................79
CALCULATINGTHEKILOWATTHOUR-PER-PULSEVALUE ........80
ANALOGOUTPUTS.........................................81
AnalogOutputExample ...................................82
© 2001 Schneider Electric All Rights Reserved
69
Page 82

Chapter 5—Input/Output Capabilities 63230-300-212
I/O Options April 2001
I/O OPTIONS
The circuit monitor supports a variety of input and output options including:
• Digital Inputs
• Analog Inputs
• Mechanical Relay Outputs
• Solid State KYZ Pulse Outputs
• Analog Outputs
The circuit monitor has one KYZ output as standard. You can expand the I/O
capabilities by adding the optional I/O Extender (IOX) and the digital I/O
option card (IOC-44). Table 5–1 lists the many available I/O options. The I/O
options are explained in detail in the sections that follow.
Table 5–1: I/O Extender Options
I/O Extender Options Part Number
with no preinstalled I/ Os, accepts up to 8 individual I/O
modules with a maximum of 4 analog I/ Os
with 4 digital inputs (32 Vdc), 2 digital outputs (60 Vdc),
1analogoutput(4–20 mA), and 1 analog input (0–5Vdc)
with 4 digital inputs (120 Vac) and 4 analog inputs
(4–20 mA)
with 8 digital inputs (120 Vac) IOX08
Individual I/O Modules
DigitalI/Os
120 Vac input DI120AC
240 Vac input DI240AC
32 Vdc input (0.2ms turn on) polarized DI32DC
120 Vac output (3.5A maximum) DO120AC
200 Vdc output (3.5A maximum) DO200DC
240 Vac output (3.5A maximum) DO240AC
60 Vdc output (3.5A maximum) DO60DC
Analog I/Os
0 to 5 Vdc analog input AI05
4 to 20 mA analog input AI420
4to20mAanalogoutput AO420
The circuit monitor must be equipped with the I/O Extender (IOX) to install the
modules.
IOX
IOX2411
IOX0404
Part Number
70
© 2001 Schneider Electric All Rights Reserved
Page 83

63230-300-212 Chapter 5—Input/Output Capabilities
April 2 001 Digital Inputs
DIGITAL INPUTS
The circuit monitor can accept up to 16 digital inputs depending on the I/O
accessories you select. Digital inputs are used to detect digital signals. For
example, the digital input can be used to determine circuit breaker status,
count pulses, or count motor starts. Digital inputs canalso be associated with
an external relay, which can trigger a waveform capture in the circuit monitor.
You can log digital input transitions as events in the circuit monitor’s on-board
alarm Log. The event is date and time stamped with resolution to the
millisecond, for sequence of events recording. The circuit monitor counts
OFF-to-ON transitions for each input, and you can reset this value using the
command interface.
Digital inputs have four operating modes:
• Normal—Use the normal mode for simple on/off digital inputs. In normal
mode, digital inputs can be used to count KYZ pulses for demand and
energy calculation. Using the input pulse demand feature, you can map
multiple inputs to the same channel where the circuit monitor can total
pulses from multiple inputs (see“Input Pulse Demand Metering” on page
62 in Chapter 4—Metering Capabilities for more information). To
accurately count pulses, set the time between transitions from
OFF to ON
and ON to OFF to at least 20 milliseconds.
• Demand Interval Synch Pul se—you can configure any digital input to
accept a demand synch pulse from a utility demand meter (see “Demand
Synch Pulse Input” on page 72 of this chapter for more about this topic).
For each demand profile, you can designate only one input as a demand
synch input.
• Time Synch—you can configure one digital input to receive a signal from
a GPS receiver that provides a serial pulse stream in accordance to the
DCF-77 format to synchronize the internal clock of the circuit monitor.
• Conditional Energy Control—you can configure one digital input to
control conditional energy (see “Energy Readings” on page 64 in Chapter
4—Metering Capabilities for more about conditional energy).
© 2001 Schneider Electric All Rights Reserved
To set up a digital input on the I/O extender, you must first define it from the
display. From the main menu, select Setup > I/O. Select the appropriate
digital input option. For example, if you are using IOX-2411 option of the I/O
Extender, select IOX-2411. For detailed instructions, see “Setting Up I/Os” on
page 23 in Chapter 3—Operation. Then using SMS, define the name and
operating mode of the digital input. The name is a 16-character label that
identifies the digital input. The operating mode is one of those listed above.
See the SMS online help for instructions on device set up of the circuit
monitor.
71
Page 84

Chapter 5—Input/Output Capabilities 63230-300-212
Demand Synch Pulse Input April 2001
DEMAND SYNCH PULSE INPUT
You can configure the circuit monitor to accept a demand synch pulse from
an external source such as another demand meter. By accepting demand
synch pulses through a digital input, the circuit monitor can make its demand
interval “window” match the other meter’s demand interval “window.” The
circuit monitor does this by “watching” the digital input for a pulse from the
other demand meter. When it sees a pulse, it starts a new demand interval
and calculates the demand for the preceding interval. The circuit monitor
then uses the same time interval as the other meter for each demand
calculation. Figure 5–1 illustrates this point. See “Synchronized Demand” on
page 59 in Chapter 4—Metering Capabilities for more about demand
calculations.
When in demand synch pulse operating mode, the circuit monitor will not
start or stop a demand interval without a pulse. The maximum allowable time
between pulses is 60 minutes. If 66 minutes (110% of the demand interval)
pass before a synch pulse is received, the circuit monitor throws out the
demand calculations and begins a new calculation when the next pulse is
received. Once in synch with the billingmeter, the circuit monitor can be used
to verify peak demand charges.
Important facts about the circuit monitor’s demand synch feature are listed
below:
• Any installed digital input can be set to accept a demand synch pulse.
• Each system can choose whether to use an external synch pulse, but only
one demand synch pulse can be brought into the meter for each demand
system. One input can be used to synchronize any combination of the
demand systems.
• The demand synch feature can be set up from
SMS. See the SMS online
help for instructions on device set up of the circuit monitor.
Normal Demand Mode
Billing Meter
Demand Timing
Circuit Monitor
Demand Timing
External Synch Pulse Demand Timing
Utility Meter
Synch Pulse
Figure 5–1: Demand synch pulse timing
Billing Meter
Demand Timing
Circuit Monitor
Demand Timing
(Slaved to Master)
72
© 2001 Schneider Electric All Rights Reserved
Page 85

63230-300-212 Chapter 5—Input/Output Capabilities
April 2 001 Analog Inputs
ANALOG INPUTS
Depending on the I/O modules you select, the circuit monitor can accept
either voltage or current signals through its analog inputs. See Table 5–1on
page 70 for a list of I/O options. The circuit monitor stores a minimum and a
maximum value for each analog input.
For technical specifications and instructions on installing I/O modules, refer
to the instruction bulletin that ships with the I/O (see Table 1–2onpage3for
a list of these publications). To set up analog inputs, you must first set it up
from the display. From the main menu, select Setup > I/O, then select the
appropriate analog input option. For example, if you are using the
IOX0404
option of the I/O Extender, select IOX-0404. For detailed instructions, see
“SettingUpI/Os” on page 23 in Chapter 3—Operation. Then, in
SMS define
the following values for each analog input:
• Name—a 16-character label used to identify the analog input.
• Units—the units of the monitored analog value (for example, “psi”).
• Scale factor—multiplies the units by this value (such as tenths or
hundreths).
• Report Range Lower Limit—the value the circuit monitor reports when
the input reaches a minimum value. When the input current is below the
lowest valid reading, the circuit monitor reports the lower limit.
• Report Range Upper Limit—the value the circuit monitor reports when
the input reaches the maximum value. When the input current is above
highest valid reading, the circuit monitor reports the upper limit.
For instructions on setting up analog inputs in
circuit monitor in the
SMS online help.
SMS,seedevicesetupofthe
© 2001 Schneider Electric All Rights Reserved
73
Page 86

Chapter 5—Input/Output Capabilities 63230-300-212
Analog Inputs April 2001
Analog I nput Example
Figure 5–2 shows an analog input example. In this example, the analog input
has been configured as follows:
Upper Limit: 500
Lower Limit: 100
Units: psi
Ta b le 5 –2 shows circuit monitor readings at various input currents.
Table 5–2: Sample register readings for analog inputs
Input Current (mA) Circuit Monitor Reading (psi)
3 (invalid) 100
4100
8200
10 250
20 500
21 (invalid) 500
Circuit Monitor
Reading
Upper
()
Lower
()
Figure 5–2: Analog input example
Limit
Limit
500 psi
100 psi
4 mA 20 mA
Minimum
Input Current
()
Input Current
Maximum
Input Current
()
74
© 2001 Schneider Electric All Rights Reserved
Page 87

63230-300-212 Chapter 5—Input/Output Capabilities
April 2 001 Relay Output Operating Modes
RELAY OUTPUT OPERATING MODES
Before we describe the 11 available relay operating modes, it is important to
understand the difference between a relay configured for remote (external)
control and a relay configured for circuit monitor (internal) control.
Each relay output defaults to external control, but you can choose whether
the relay is set to external or internal control:
• Remote (external)control—the relay is controlled either from a
SMS or a programmable logic controller using commands via
PC using
communications.
• Circuit monitor (internal) control—the relay is controlled by the circuit
monitor in response to a set-point controlled alarm condition, or as a pulse
initiator output. Once you’ve set up a relay for circuit monitor control, you
can no longer operate the relay remotely. However, you can temporarily
override the relay, using
SMS.
NOTE: If any basic setup parameters or I/O setup parameters are modified,
all relay outputs will be de-energized.
The 11 relay operating modes are as follows:
• Normal
Remotely Controlled:
—
a remote
PC or programmable controller. The relay remains energized
until a command to de-energize is issued from the remote
Energize the relay by issuing a command from
PC or
programmable controller, or until the circuit monitor loses control
power. When control power is restored, the relay will be re-energized.
—
Circuit Monitor Controlled:
When an alarm condition assigned to the
relay occurs, the relay is energized. The relay is not de-energized until
all
alarm conditions assigned to the relay have dropped out, the circuit
monitor loses control power, or the alarms are over-ridden using SMS
software. If the alarm condition is still true when the circuit monitor
regains control power, the relay will be re-energized.
• Latched
—
Remotely Controlled:
a remote
PC or programmable controller. The relay remains energized
until a command to de-energize is issued from a remote
Energize the relay by issuing a command from
PC or
programmable controller, or until the circuit monitor loses control
power. When control power is restored, the relay will not be reenergized.
—
Circuit Monitor Controlled:
When an alarm condition assigned to the
relay occurs, the relay is energized. The relay remains energized—
even after all alarm conditions assigned to the relay have dropped
out—until a command to de-energize is issued from a remote PC or
programmable controller, until the high priority alarm log is cleared
from the display, or until the circuit monitor loses control power. When
control power is restored, the relay will not be re-energized if the alarm
condition is not TRUE.
© 2001 Schneider Electric All Rights Reserved
75
Page 88

Chapter 5—Input/Output Capabilities 63230-300-212
Relay Output Operating Modes April 2001
• Timed
Remotely Controlled:
—
Energize the relay by issuing a
command from a remote PC or programmable controller. The relay
remains energized until the timer expires, or until the circuit monitor
loses control power. If a new command to energize the relay is issued
before the timer expires, the timer restarts. If the circuit monitor loses
control power, the relay will be re-energized when control power is
restored and the timer will reset to zero and begin timing again.
—
Circuit Monitor Controlled:
When an alarm condition assigned to the
relay occurs, the relay is energized. The relay remains energized for
the duration of the timer. When the timer expires, the relay will deenergize and remain de-energized. If the relay is on and the circuit
monitor loses control power, the relay will be re-energized when
control power is restored and the timer will reset to zero and begin
timing again.
• End Of Power Demand Interval
This mode assigns the relay to operate as a synch pulse to another
device. The output operates in timed mode using the timer setting and
turns on at the end of a power demand interval. It turns off when the
timer expires. Because of it’s long life, this mode should be used with solid
state relay outputs.
• Absolute kW h Pulse
This mode assigns the relay to operate as a pulse initiator with a
user-defined number of kWh per pulse. In this mode, both forward and
reverse real energy are treated as additive (as in a tie circuit breaker).
• Absolute kVARh Pulse
This mode assigns the relay to operate as a pulse initiator with a
user-defined number of kVARh per pulse. In this mode, both forward and
reverse reactive energy are treated as additive (as in a tie circuit breaker).
• kVAhPulse
This mode assigns the relay to operate as a pulse initiator with a
user-defined number of kVAh per pulse. Since kVA has no sign, the kVAh
pulse has only one mode.
• kWhInPulse
This mode assigns the relay to operate as a pulse initiator with a
user-defined number ofkWh per pulse. In this mode, only the kWh flowing
into the load is considered.
• kVARh In Pulse
This mode assigns the relay to operate as a pulse initiator with a
user-defined number of kVARh per pulse. In this mode, only the kVARh
flowing into the load is considered.
• kWh Out Pulse
This mode assigns the relay to operate as a pulse initiator with a
user-defined number ofkWh per pulse. In this mode, only the kWh flowing
out of the load is considered.
• kVARhOut Pulse
This mode assigns the relay to operate as a pulse initiator with a
user-defined number of kVARh per pulse. In this mode, only the kVARh
flowing out of the load is considered.
76
© 2001 Schneider Electric All Rights Reserved
Page 89

63230-300-212 Chapter 5—Input/Output Capabilities
April 2 001 Mechanical Relay Outputs
MECHANICAL RELAY OUTPUTS
The optional Input/Output Card IOC44 provides three Form-C, 10 A
mechanical relays that can be used to open or close circuit breakers,
annunciate alarms, and more.
The mechanical output relays of the circuit monitor can be configured to
operate in one of 11 operating modes:
• Normal
• Latched (electrically held)
• Timed
• End of power demand interval
• Absolute kWh pulse
• Absolute kVARh pulse
• kVAh pulse
• kWh in pulse
• kVARh in pulse
• kWh out pulse
• kVARh out pulse
See the previous section “Relay Output Operating Modes” on page 75 for a
description of the modes.
The last seven modes in the list above are for pulse initiator applications. All
Series 4000 Circuit Monitors are equipped with one solid-state
output rated at 96 mA and an additional
IOC44 card. The solid-state KYZ output provides the long life—billions of
KYZ pulse output is available on the
KYZ pulse
operations—required for pulse initiator applications. The mechanical relay
outputs have limited lives: 10 million operations under no load; 100,000
under load. For maximum life, use the solid-state
KYZ pulse output for pulse
initiation, except when a rating higher than 96 mA is required. See“SolidState KYZ Pulse Output” on page 78 in this chapter for a description of the
solid-state
KYZ pulse output.
© 2001 Schneider Electric All Rights Reserved
To set up a mechanical relay output, from the Main Menu, select Setup >
I/O.
Select input option IOC44. For detailed instructions, see “Setting Up I/Os” on
page 23 in Chapter 3—Operation.Thenusing
SMS, you must define the
following values for each mechanical relay output:
• Name—A 16-character label used to identify the digital output.
• Mode—Select one of the operating modes listed above.
• Pulse Weight—You must set the pulse weight, the multiplier of the unit
being measured, if you select any of the pulse modes (last 7 listed above).
• Timer—You must set the timer if you select the timed mode or end of
power demand interval mode (in seconds).
• Control—You must set the relay to be controlled either remotely or
internally (from the circuit monitor) if you select the normal, latched, or
timed mode.
For instructions on setting up digital
I/OsinSMS,seetheSMS online help on
device set up of the circuit monitor.
NOTE: The IOC44 can be set up using the display or SMS. The IOX must be
identified using the display, then set up using the display or SMS.
77
Page 90

Chapter 5—Input/Output Capabilities 63230-300-212
Solid-State KYZ Pulse Output April 2001
Setpoint-controlled Relay Functions
SOLID-STATE KYZ PULSE O UTPUT
The circuit monitor can detect over 100 alarm conditions, including over/
under conditions, digital input changes, phase unbalance conditions, and
more (see Chapter 6—Alarms on page 83 for more about alarms). Using
SMS, you can configure a relay to operate when an alarm condition is true.
For example, you could set up the three relays on the
IOC44 card to operate
at each occurrence of “Undervoltage Phase A.” Then, each time the alarm
condition occurs—that is, each time the setpoints and time delays assigned
to Undervoltage Phase A are satisfied—the circuit monitor automatically
operates relays R1, R2, and R3 according to their configured mode of
operation. See “Relay Output Operating Modes” on page 75 of this chapter
for a description of the operating modes.
Also, you can assign multiple alarm conditions to a relay. For example, relay
AR1 on the IOC-44 card could have “Undervoltage Phase A” and
“Undervoltage Phase B” assigned to it. The relay would operate whenever
either condition occurred.
NOTE: Setpoint-controlled relay operation can be used for some types of
non-time-critical relaying. For more information, see “Setpoint-Controlled
Relay Functions” on page 88 in
Chapter 6—Alarms
.
This section describes the pulse output capabilities of the circuit monitor. For
instructions on wiring the
KYZ pulse output, see “Wiring the Solid-State KYZ
Output” on page 55 in Chapter 5—Wiring of the installation manual.
The circuit monitor is equipped with one solid-state
KYZ pulse output located
near the option card slots. The IOC44 option card also has a solid-state KYZ
output. The solid-state relays provides the extremely long life—billions of
operations—required for pulse initiator applications.
The
KYZ output is a Form-C contact with a maximum rating of 96 mA.
Because most pulse initiator applications feed solid-state receivers with low
burdens, this 96 mA rating is adequate for most applications. For applications
where a higher rating is required, the
ampere ratings. Use
SMS or the display to configure any of the 10 ampere
IOC44 card provides 3 relays with 10
relays as a pulse initiator output. Keep in mind that the 10 ampere relays are
mechanical relays with limited life—10 million operations under no load;
100,000 under load.
78
To set the kilowatthour-per-pulsevalue, use SMS or the display. When setting
the kWh/pulse value, set the value based on a 3-wire pulse output. For
instructions on calculating the correct value, see “Calculating the
Kilowatthour-Per-Pulse Value” on page 80 in this chapter.
The circuit monitor can be used in 2-wire or 3-wire pulse initiator applications.
Each of these applications is described in the sections that follow.
The
KYZ pulse output can be configured to operate in one of 11 operating
modes. See “Relay Output Operating Modes” on page 75 for a description of
the modes.
The setup in
SMS or at the circuit monitor display is the same as a
mechanical relay. See the previous section “Mechanical Relay Outputs” on
page 77, for the values you must set up in
SMS.
© 2001 Schneider Electric All Rights Reserved
Page 91

63230-300-212 Chapter 5—Input/Output Capabilities
April 2 001 Solid-State KYZ Pulse Output
2-Wire Pulse Initiator
Most digital inputs in energy management systems use only two of the three
wires provided with a KYZ pulse initiator. This is called a 2-wire pulse initiator
application. Figure 5–3 shows a pulse train from a 2-wire pulse initiator
application.
In a 2-wire application, the pulse train looks like the alternating open and
closed states of a Form-A contact. Most 2-wire pulse initiator applications
use a Form-C contact, but tie into only one side of the Form-C contact where
the pulse is the transition from OFF to ON of that side of the Form-C relay. In
Figure 5–3, the transitions are marked as 1 and 2. Each transition represents
the time when the relay transitions from KZ to KY. Each time the relay
transitions, the receiver counts a pulse. The circuit monitor can deliver up to
25 pulses per second in a 2-wire application.
Y
K
Z
12
3
KY
KZ
D
T
3-Wire Pulse Initiator
Figure 5–3: Two-wire pulse train
Some applications require the use of all three wires provided with the KYZ
pulse initiator. This is called a 3-wire pulse initiator application. Figure 5–4
shows a pulse train for a 3-wire pulse initiator application.
Three-wire KYZ pulses are the transitions between KY and KZ. These
transitions are the alternate contact closures of a Form-C contact. In Figure
5–4, the transitions are marked as 1, 2, 3, and 4. The receiver counts a pulse
at each transition. That is, each time the Form-C contact changes state from
KY to KZ, or from KZ to KY, the receiver counts a pulse.The circuit monitor
can deliver up to 50 pulses per second in a 3-wire application.
Y
K
Z
1 3 42
65
KY
KZ
D
T
© 2001 Schneider Electric All Rights Reserved
Figure 5–4: Thr ee-wire pulse train
79
Page 92

Chapter 5—Input/Output Capabilities 63230-300-212
Calculating the Watthour-Per-Pulse Value April 2001
CALCULATING THE KILOWATTHOUR-PER-PULSE VALUE
This section shows an example of how to calculate kilowatthours per pulse.
To calculate this value, first determine the highest kW value you can expect
and the required pulse rate. In this example, the following assumptions are
made:
• The metered load should not exceed 1600 kW.
• About two KYZ pulses per second should occur at full scale.
Step 1: Convert 1600 kW load into kWh/second.
(1600 kW) (1 Hr) = 1600 kWh
(1600 kWh) = “X” kWh
1 hour
1 second
(1600 kWh) = “X” kWh
3600 seconds
1 second
X = 1600/3600 = 0.4444 kWh/second
Step 2: Calculate the kWh required per pulse.
0.4444 kWh/second
= 0.2222 kWh/pulse
2 pulses/second
Step 3: Round to nearest hundreth, since the circuit monitor only accepts
0.01 kWh increments.
Ke = 0.22 kWh/pulse
Summary:
• 3-wire application—0.22 kWh/pulse provides approximately 2 pulses per
second at full scale.
• 2-wire application—0.11 kWh/pulse provides approximately 2 pulses per
second at full scale. (To convert to the kWh/pulse required for a 2-wire
application, divide Ke by 2. This is necessary because the circuit monitor
Form C relay generates two pulses—KY and KZ—for every pulse that is
counted.)
80
© 2001 Schneider Electric All Rights Reserved
Page 93

63230-300-212 Chapter 5—Input/Output Capabilities
April 2 001 Analog Outputs
ANALOG OUTPUTS
This section describes the circuit monitor’s analog output capabilities. For
technical specifications and instructions on installing the I/O Extender or
analog output modules, refer to the instruction bulletin that ships with the I/O
(see Table 1–2 on page 3 for a list of these publications).
To set up analog outputs, you must first define it from the display. From the
main menu, select Setup > I/O. Select the appropriate analog output option.
For example, if you are using the IOX0404 option of the I/O Extender, select
IOX0404. For detailed instructions, see “SettingUpI/Os” on page 23
in Chapter 3—Operation.Thenusing
values for each analog output:
• Name—A 16-character label used to identify the output. Default names
are assigned, but can be customized
• Output register—The circuit monitor register assigned to the analog
output.
• Lower Limit—The value equivalent to the minimum output current. When
the register value is below the lower limit, the circuit monitor outputs the
minimum output current.
• Upper Limit—The value equivalent to the maximum output current. When
the register value is above the upper limit, the circuit monitor outputs the
maximum output current.
For instructions on setting up an analog output in
help on device set up of the circuit monitor.
SMS, you must define the following
SMS,seetheSMS online
CAUTION
HAZARD OF EQUIPMENT DAMAGE
Each analog output represents an individual 2-wire current loop;
therefore, use an isolated receiver for
on the I/O Extender (IOX).
Failure to observe this instruction can result in equipment damage.
each
individual analog output
© 2001 Schneider Electric All Rights Reserved
81
Page 94

Chapter 5—Input/Output Capabilities 63230-300-212
Analog Outputs April 2001
Analog Out put Example
Figure 5–5 illustrates the relationship between the output range of current (in
milliamperes) and the upper and lower limit of power usage (real power in
kW). In this example, the analog output has been configured as follows:
Register Number: 1143 (Real Power, 3-Phase Total)
Lower Limit: 100 kW
Upper Limit: 500 kW
Ta b le 5 –3 shows the output current at various register readings.
Table 5–3: Sample register readings for analog output
RegisterReading (kW) OutputCurrent (mA)
50 4
100 4
200 8
250 10
500 20
550 20
Output
Current
Maximum
()
Output Current
Minimum
()
Output Current
20 mA
4 mA
100 kW 500 kW
Lower
()
Limit
Figure 5–5: Analog output example
Upper
()
Limit
Real Power, 3Ø Total
(from register 1143)
82
© 2001 Schneider Electric All Rights Reserved
Page 95

63230-300-212 Chapter 6—Alarms
April 2 001 Chapter Contents
CHAPTER 6—ALARMS
This chapter provides a detailed discussion of the alarm capabilities of the
circuit monitor.
CHAPTER CONTENTS
CHAPTERCONTENTS ......................................83
ABOUTALARMS ...........................................84
AlarmsGroups ..........................................84
Setpoint-DrivenAlarms ...................................85
Priorities ...............................................87
AlarmLevels ...........................................87
CUSTOMALARMS..........................................88
SETPOINT-CONTROLLEDRELAYFUNCTIONS ..................88
TypesofSetpoint-ControlledRelayFunctions .................89
SCALEFACTORS ..........................................91
SCALINGALARMSETPOINTS ................................92
ALARMCONDITIONSANDALARMNUMBERS ...................93
© 2001 Schneider Electric All Rights Reserved
83
Page 96

Chapter 6—Alarms 63230-300-212
About Alarms April 2001
ABOUT ALARMS
Alarms Groups
The circuit monitor can detect over 100 alarm conditions, including over or
under conditions, digital input changes, phase unbalance conditions, and
more. It also maintains a counter for each alarm to keep track of the total
number of occurrences. A complete list of default alarm configurations are
described in Table 6–3 on page 94. In addition, you can set up your own
custom alarms and set up relays to operate on alarm conditions.
When one or more alarm conditions are true, the circuit monitor will execute
a task automatically. Using
SMS or the display, you can set up each alarm
condition to perform these tasks:
• Force data log entries in up to 14 user-defined data log files. See Chapter
7—Logging on page 99 for more about data logging.
• Perform event captures. See Chapter8—Waveform and Event Capture
on page 107 for more about event recording.
• Operate relays. Using
SMS you can assign one or more relays to operate
when an alarm condition is true. See the SMS online help for more about
this topic.
Whether you are using a default alarm or creating a custom alarm, you first
choose the alarm group that is appropriate for the application. Each alarm
condition is assigned to one of these alarm groups:
• Standard—Standard alarms have a detection rate of 1 second and are
useful for detecting conditions such as over current and under voltage. Up
to 80 alarms can be set up in this alarm group
• High Speed—High speed alarms have a detection rate of 100
milliseconds and are useful for detecting voltage sags and swells lasting
only a few cycles. Up to 20 alarms can be set up in this group.
• Disturbance—Disturbance alarms have a detection rate one cycle and
are useful for detecting voltage sags and swells. Up to 20 alarms can be
set up in this group. See Chapter 9—Disturbance Monitoring on page
113 for more about disturbance monitoring.
• Digital—Digital alarms are triggered by an exception such as the
transition of a digital input or the end of an incremental energy interval. Up
to 40 alarms can be set up in this group.
• Boolean—Boolean alarms use Boolean logic to combine up to four
enabled alarms. You can choose from the Boolean logic operands:
NAND, OR, NOR
,orXOR to combine your alarms. Up to 15 alarms can be
AND,
set up in this group.
84
Use either
SMS or the display to set up any of the alarms.
© 2001 Schneider Electric All Rights Reserved
Page 97

63230-300-212 Chapter 6—Alarms
April 2 001 About Alarms
Setpoint-Driven Alarms
Many of the alarm conditions require that you define setpoints. This includes
all alarms for over, under, and phase unbalance alarm conditions. Other
alarm conditions such as digital input transitions and phase reversals do not
require setpoints. For those alarm conditions that require setpoints, you must
define the following information:
• Pickup Setpoint
• Pickup Delay (depending on the alarm group, you choose the time in
seconds, 100 ms increments, or cycles)
• Dropout Setpoint
• Dropout Delay (depending on the alarm group, you choose the time in
seconds, 100 ms increments, or cycles)
NOTE: Alarms with both Pickup and Dropout setpoints set to zero are invalid.
To understand how the circuit monitor handles setpoint-driven alarms, see
Figure 6–2 on page 86. Figure 6–1 shows what the actual alarm Log entries
for Figure 6–2 might look like, as displayed by
SMS.
NOTE: The software does not actually display the codes in parentheses—
EV1, EV2, Max1, Max2. These are references to the codes in Figure 6–2.
© 2001 Schneider Electric All Rights Reserved
85
Page 98

Chapter 6—Alarms 63230-300-212
About Alarms April 2001
(EV2)
(EV1)
Pickup Setpoint
Dropout Setpoint
(Max2)
(Max1)
Figure 6–1: Sample alarm log entry
Max2
Max1
∆T ∆T
Pickup Delay
EV1
Alarm Period
Figure 6–2: How the circuit monitor handles setpoint-driven alarms
EV1—The circuit monitor records the date and time that the pickup setpoint
and time delay were satisfied, and the maximum value reached (Max1)
during the pickup delay period (∆T). Also, the circuit monitor performs any
tasks assigned to the event such as waveform captures or forced data log
entries.
EV2—The circuit monitor records the date and time that the dropout setpoint
and time delay were satisfied, and the maximum value reached (Max2)
during the alarm period.
The circuit monitor also stores a correlationsequence number (
event (such as
Dropout
can sort pickups and dropouts by
of a particular alarm. The pickup and dropout entries of an alarm will have
the same
pickups and dropouts with the same
Under Voltage Phase A Pickup, Under Voltage Phase A
). The CSN lets you relate pickups and dropouts in the alarm log. You
CSN to correlate the pickups and dropouts
CSN. You can also calculate the duration of an event by looking at
CSN.
Dropout Delay
EV2
CSN) for each
86
© 2001 Schneider Electric All Rights Reserved
Page 99

63230-300-212 Chapter 6—Alarms
April 2 001 About Alarms
Priorities
Alarm Levels
Each alarm also has a priority level. Use the priorities to distinguish between
events that require immediate action and those that do not require action.
• High priority—if a high priority alarm occurs, the display informs you in
two ways: the LED onthe display flashes until you acknowledge the alarm
and a message displays while the alarm is active.
• Medium pr iority—if a medium priority alarm occurs, the LED flashes and
a message displays only while the alarm is active. Once the alarm
becomes inactive, the LED stops flashing.
• Low priority—if a low priority alarm occurs, the LED on the display
flashes only while the alarm is active. No alarm message is displayed.
• No priority—if an alarm is setup with no priority, no visible representation
will appear on the display. Alarms with no priority are not entered in the
Alarm Log. See Chapter 7—Logging for alarm logging information.
If multiple alarms with different priorities are active at the same time, the
display shows the alarm message for the last alarm that occurred. For
instructions on setting up alarms from the circuit monitor display, see “Setting
Up and Editing Alarms” on page 21.
From the display or
SMS, multiple alarms can be set up for one particular
quantity (parameter) to create alarm “levels”. You can take different actions
depending on the severity of the alarm.
For example, you could set up two alarms for kW Demand. A default alarm
already exists for kW Demand (no. 26 in the alarm list), but you could create
another custom alarm for kW Demand, selecting different pickup points for it.
The custom kW Demand alarm, once created, will appear in the standard
alarm list. For illustration purposes, let’s set the default kW Demand alarm to
120 kW and the new custom alarm to 150 kW. One alarm named
Demand
; the other
kW Demand 150kW
as shown in Figure 6–3. Note that if
kW
you choose to set up two alarms for the same quantity, use slightly different
names to distinguish which alarm is active. The display can hold up to 15
characters for each name. You can create up to 10 alarm levels for each
quantity.
© 2001 Schneider Electric All Rights Reserved
kW Demand
150 Alarm #43 Pick Up
140
130
120
100
Demand OK Demand OK
kW Demand (default)
Alarm #26 kW Demand with
pickup of 120 kWd, medium priority
Alarm #26 Pick Up
Approaching
Peak Demand
Peak Demand
Exceeded
kW Demand 150kW (custom)
Alarm #43 kW Demand with
pickup of 150 kWd, high priority
Alarm # 43 Drop Out
Alarm #26 Drop Out
Below Peak
Demand
Time
Figure 6–3: Two alarms set up for the same quantity wi th different
pickup and dropout set points
87
Page 100

Chapter 6—Alarms 63230-300-212
Custom Alarms April 2001
CUSTOM ALARMS
SETPOINT-CONTROLLED RELAY FUNCTIONS
The circuit monitor has many pre-defined alarms, but you can also set up
your own custom alarms. For example, you may need to alarm on the ON-toOFF transition of a digital input. To create this type of custom alarm:
1. Select the appropriate alarm group (digital in this case).
2. Select the type of alarm (described in Table 6–4 on page 96).
3. Give the alarm a name.
After creating a custom alarm, you can configure it by applying priorities,
setting pickups and dropouts (if applicable), and so forth. For instructions on
creating custom alarms, see “Creating a New Custom Alarm” on page 19
in Chapter 3—Operation.
NOTE: The circuit monitor will automatically create alarms for the IOC44 and
the IOX when the modules are identified. These are OFF-to-ON alarms.
A circuit monitor can mimic the functions of certain motor management
devices to detect and respond to conditions such as phase loss,
undervoltage, or reverse phase relays. While the circuit monitor is not a
primary protective device, it can detect abnormal conditions and respond by
operating one or more Form-C output contacts. These outputs can be used
to operate an alarm horn or bell to annunciate the alarm condition.
NOTE: The circuit monitor is not designed for use as a primary protective
relay. While its setpoint-controlled functions may be acceptable for certain
applications, it should not be considered a substitute for proper circuit
protection.
If you determine that the circuit monitor’s performance is acceptable for the
application, the output contacts can be used to mimic some functions of a
motor management device. When deciding if the circuit monitor is acceptable
for these applications, keep the following points in mind:
• Circuit monitors require control power to operate properly.
• Circuit monitors may take up to 5 seconds after control power is applied
before setpoint-controlled functions are activated. If this is too long, a
reliable source of control power is required.
• When control power is interrupted for more than approximately 100
milliseconds, the circuit monitor releases all energized output contacts.
• Standard setpoint-controlled functions may take 1–2 seconds to operate,
in addition to the intended delay.
• A password is required to program the circuit monitor’s setpoint controlled
relay functions.
• Changing certain setup parameters after installation may operate relays in
a manner inconsistent with the requirements of the application.
For instructions on configuring setpoint-controlled alarms or relays from the
circuit monitor’s display, see “Setting Up and Editing Alarms” on page 21. The
types of available alarms are described later in this chapter in
Ta b le 6 –3 on page 94.
88
© 2001 Schneider Electric All Rights Reserved
 Loading...