

Page 1

USER GUIDE
Rockwell Automation Publication RPTEXP-UM001H-EN-P-June 2014
Supersedes Publication RPTEXP-UM001G-EN-P-June 2013
Page 2

Contacting Rockwell
Customer Support Telephone — 1.440.646.3434
Online Support — http://www.rockwellautomation.com/support/overview.page
Copyright Notice
Trademark Notices
Other Trademarks
© 2014 Rockwell Automation Technologies, Inc. All Rights Reserved.
This document and any accompanying Rockwell Software products are copyrighted by Rockwell Automation,
Inc. Any reproduction and/or distribution without prior written consent from Rockwell Automation, Inc. is
strictly prohibited. Please refer to the license agreement for details.
FactoryTalk, FactoryTalk Activation, FactoryTalk Diagnostics, FactoryTalk Directory, FactoryTalk Live Data,
FactoryTalk Metrics, FactoryTalk Services Platform, FactoryTalk Transaction Manager, FactoryTalk
VantagePoint, FactoryTalk ProductionCentre, Report Expert, Rockwell, Rockwell Automation, Rockwell
Software, and RSBizWare are trademarks of Rockwell Automation, Inc.
Any Rockwell Automation logo, software or hardware not mentioned herein is also a trademark, registered or
otherwise, of Rockwell Automation, Inc.
For a complete list of products and their respective trademarks, go to
http://www.rockwellautomation.com/rockwellautomation/legal-notices/overview.page?%23tab4#/tab4.
ActiveX, Microsoft, Microsoft Access, SQL Server, Visual Basic, Visual C++, Visual SourceSafe, Windows,
Windows ME, Windows NT, Windows 2000, Windows Server-, Windows XP, Windows 7, Windows Vista,
Windows 8 are either registered trademarks or trademarks of Microsoft Corporation in the United States
and/or other countries.
Adobe, Acrobat, and Reader are either registered trademarks or trademarks of Adobe Systems Incorporated in
the United States and/or other countries.
ControlNet is a registered trademark of ControlNet International.
DeviceNet is a trademark of the Open DeviceNet Vendor Association, Inc. (ODVA)
Warranty
OLE for Process Control (OPC) is a registered trademark of the OPC Foundation.
Oracle, SQL*Net, and SQL*Plus are registered trademarks of Oracle Corporation.
All other trademarks are the property of their respective holders and are hereby acknowledged.
This product is warranted in accordance with the product license. The product’s performance may be affected
by system configuration, the application being performed, operator control, maintenance, and other related
factors. Rockwell Automation is not responsible for these intervening factors. The instructions in this
document do not cover all the details or variations in the equipment, procedure, or process described, nor do
they provide directions for meeting every possible contingency during installation, operation, or
maintenance. This product’s implementation may vary among users.
This document is current as of the time of release of the product; however, the accompanying software may
have changed since the release. Rockwell Automation, Inc. reserves the right to change any information
contained in this document or the software at any time without prior notice. It is your responsibility to obtain
the most current information available from Rockwell when installing or using this product.
Page 3

Chapter 1
Table of Contents
Welcome to Report Expert
Report Expert Prerequisites
Installing Report Expert
Getting Started
Features of Report Expert.......................................................................... 12
Benefits of Report Expert .......................................................................... 13
Intended Audience ...................................................................................... 13
Report Expert Establishers ................................................................... 13
Report Expert Administrators ............................................................ 14
Report Expert Users .............................................................................. 14
Where Can I Go for Help? ....................................................................... 14
Chapter 2
Hardware and Software Requirements .................................................. 18
Chapter 3
Installing or Upgrading Report Expert .................................................. 19
Removing Report Expert ........................................................................... 22
Chapter 4
Understanding the Report Expert Architecture .................................. 25
Connecting to Report Expert ................................................................... 27
Settings Specific to Internet Explorer 10 .......................................... 28
Add the Report Expert Site to the Trusted Sites Zone............ 28
Open the Report Expert Site in Compatibility View .............. 29
Navigating Report Expert.......................................................................... 29
Administration Page ............................................................................. 30
Manual Data Editor .............................................................................. 31
Parameters Page for the Editor ...................................................... 32
Editor Page ......................................................................................... 32
Report Viewer ......................................................................................... 33
Parameters Page for the Viewer ..................................................... 33
Explorer Page ..................................................................................... 34
Troubleshooting .......................................................................................... 34
Chapter 5
Understanding Report
Templates
Rockwell Automation Publication RPTEXP-UM001H-EN-P-June 2014 3
Drillthrough ................................................................................................. 37
Report Templates ........................................................................................ 38
Dashboard ................................................................................................ 39
OEE % Widget .................................................................................. 40
Page 4

Table of Contents
3 OEE Components Widget ......................................................... 40
Last State Widget.............................................................................. 40
Production Summary Widget ....................................................... 41
Uptime Summary Widget .............................................................. 41
Fault Summary Widget ................................................................... 42
Good Parts vs. Scrap Parts Widget ............................................... 42
Uptime vs. Downtime Widget ...................................................... 43
Machine States Widget ................................................................... 43
Event Count and Duration Widget ............................................. 43
Parameter Settings and Widgets ......................................................... 44
Event All Detail ...................................................................................... 44
Event Chart ............................................................................................. 46
Event Configuration ............................................................................. 48
Event Detail ............................................................................................. 49
Event Detail Paged ................................................................................. 50
Event History String/Value ................................................................. 51
Event Overview ...................................................................................... 52
Event Summary ...................................................................................... 53
Fault 54
Performance ............................................................................................ 56
Production ............................................................................................... 59
Production Overview ............................................................................ 60
Quality ...................................................................................................... 63
Root Cause Analysis .............................................................................. 64
State Detail .............................................................................................. 65
State Summary ........................................................................................ 67
Throughput ............................................................................................. 68
Uptime...................................................................................................... 70
Query Fields .................................................................................................. 72
Raw Data ....................................................................................................... 76
Chapter 6
Understanding Parameter Sets
4 Rockwell Automation Publication RPTEXP-UM001H-EN-P-June 2014
Using the Date / Time / Shift Parameter .............................................. 77
Start and End Times .............................................................................. 78
Selecting Date/Time ............................................................................. 79
Selecting Shift ......................................................................................... 82
Page 5

Table of Contents
Using the Grouping Parameter ................................................................ 83
Selecting the Grouping Field ............................................................... 85
Selecting the Grouping Type .............................................................. 85
Selecting the Grouping Expansion Type .......................................... 87
Deleting a Grouping .............................................................................. 88
Using the Sorting Parameter .................................................................... 88
Selecting the Sorting Field ................................................................... 89
Selecting the Sorting Method ............................................................. 90
Deleting a Sorting .................................................................................. 90
Using the Plant Model Parameter ........................................................... 90
Using the Filtering Parameter .................................................................. 91
Selecting the Filtering Field and Value ............................................. 92
Deleting a Filter ...................................................................................... 93
Using the TOP N Parameter .................................................................... 93
Using the Terminology Parameter .......................................................... 94
Viewing and Generating
Reports
Editing Event and Production
Data
Chapter 7
Viewing Saved Reports on the Explorer Page ....................................... 97
Generating Reports Using the Parameters Page .................................. 97
Generating Reports with Existing Parameter Sets ......................... 98
Generating Reports with Temporarily Customized Parameter
Sets 98
Creating New Parameter Sets for Reports ....................................... 99
Viewing and Using Reports ...................................................................... 99
Navigating Reports ............................................................................. 100
Exporting Reports ............................................................................... 100
Printing Reports .................................................................................. 101
Chapter 8
Displaying Data ........................................................................................ 103
Edit Events ............................................................................................ 104
Parameter Set Information Panel .............................................. 104
Event Details Panel ....................................................................... 104
Event List Panel ............................................................................. 105
Edit Production Data ......................................................................... 107
Parameter Set Information Panel .............................................. 107
Activity Area Details Panel ......................................................... 108
Rockwell Automation Publication RPTEXP-UM001H-EN-P-June 2014 5
Page 6

Table of Contents
Production Data List Panel ......................................................... 109
Edit Shift Information ....................................................................... 111
Parameter Set Information Panel .............................................. 111
Shift Information List Panel ....................................................... 111
Enter Data Manually .......................................................................... 112
Parameter Set Information Panel .............................................. 113
Select Area and Shift Details Panel............................................ 113
Shift Summary Panel..................................................................... 114
Creating Events ......................................................................................... 115
Creating Events From Scratch ......................................................... 115
Creating Events From Existing Events .......................................... 116
Editing Events ........................................................................................... 117
Editing the Category - Name ........................................................... 118
Editing the Start/End Time ............................................................. 119
Editing the Start/End Value ............................................................. 121
Editing the Start/End Value of Events With a Value Lookup
List 122
Editing the Start/End Value of Events without a Value
Lookup List ..................................................................................... 122
Splitting Events ......................................................................................... 123
Deleting Events ......................................................................................... 124
Editing Production Data ........................................................................ 125
Editing the Number of Good and Scrap Parts ............................. 125
Editing the Part Id .............................................................................. 126
Editing the Ideal Cycle Time ........................................................... 127
Editing the Values of the User-Defined Summarization Fields 127
Splitting Production Data ...................................................................... 129
Editing Shift Instances ............................................................................ 130
Splitting Shift Instances .......................................................................... 131
Chapter 9
Administering Report Expert
6 Rockwell Automation Publication RPTEXP-UM001H-EN-P-June 2014
Configuring Security for Report Expert ............................................. 134
Setting up Security for Report Expert Editors ............................. 134
Setting up Security for Report Expert Administrators .............. 136
Disabling Security ............................................................................... 137
Configuring Report Expert Settings .................................................... 138
Page 7

Table of Contents
Modifying the RptSetting Table ..................................................... 143
Communicating With SQL Server Reporting Services (SSRS)144
Configuring the Report Tree of the Explorer Page .......................... 146
Adding Tree Items .............................................................................. 146
Copying Tree Items ............................................................................ 148
Editing Tree Items .............................................................................. 148
Organizing Tree Items ....................................................................... 149
Deleting Tree Items ............................................................................ 149
Configuring the Quick Web ................................................................. 149
Configuring Report Subscriptions ....................................................... 150
Creating Shared Schedules in SQL Server Reporting Services
(SSRS) .................................................................................................... 151
Adding Report Subscriptions ........................................................... 151
Modifying Report Subscriptions ..................................................... 152
Deleting Report Subscriptions ......................................................... 154
Configuring Parameter Sets ................................................................... 154
Adding Parameter Sets ....................................................................... 154
Copying Parameter Sets .................................................................... 155
Modifying Parameter Sets ................................................................. 156
Deleting Parameter Sets .................................................................... 157
Configuring Terminologies ................................................................... 157
Domain Terminology ........................................................................ 157
Creating Domain Terminologies .................................................... 158
Adding Terms Terminologies .......................................................... 159
Editing Terms ...................................................................................... 160
Deleting Terms .................................................................................... 161
Copying Terminologies to Other Cultures .................................. 161
Deleting Terminologies ..................................................................... 162
Deleting Cultures from Domain Terminologies ......................... 163
Synchronizing Terminology Changes with Report Server ....... 163
Configuring the Line Order .................................................................. 164
Chapter 10
Glossary of Fields
Rockwell Automation Publication RPTEXP-UM001H-EN-P-June 2014 7
Area 165
Availability ................................................................................................. 165
Available Time .......................................................................................... 165
Page 8

Table of Contents
Average Duration ..................................................................................... 165
Avg. Duration/Event End Num ........................................................... 165
Cycle Time Diff. ....................................................................................... 166
Cycle Time Diff. % .................................................................................. 166
Downtime .................................................................................................. 166
Duration ..................................................................................................... 166
End Time .................................................................................................... 166
End Value ................................................................................................... 167
Enterprise ................................................................................................... 167
Event Category .......................................................................................... 167
Event Comment ....................................................................................... 167
Event Count .............................................................................................. 167
Event During Num .................................................................................. 167
Event During Scheduled Time .............................................................. 167
Event End Num ........................................................................................ 168
Event Is Fault ............................................................................................. 168
Event Name ............................................................................................... 168
Event Occurrence ..................................................................................... 168
Event Occurrence Count/Id ................................................................. 168
Event Reason ............................................................................................. 168
Event Reason Code .................................................................................. 168
Event Severity ............................................................................................ 168
Event Start Num ....................................................................................... 169
Event Trigger ............................................................................................. 169
Event Trigger Expression ........................................................................ 169
Event Value ................................................................................................ 169
Event Value Expression ........................................................................... 169
Event Value Lookup List Name ............................................................ 169
Fault % ........................................................................................................ 169
Fault Count ............................................................................................... 170
Fault Metric Use ....................................................................................... 170
Fault Time .................................................................................................. 170
Faults ........................................................................................................... 170
Faults per Hour ......................................................................................... 170
Good Parts ................................................................................................. 170
Ideal Cycle Time ....................................................................................... 170
8 Rockwell Automation Publication RPTEXP-UM001H-EN-P-June 2014
Page 9

Table of Contents
Ideal % ......................................................................................................... 171
Ideal Parts ................................................................................................... 171
Line 171
Machine State Name ............................................................................... 171
Max Duration ............................................................................................ 171
Max. Duration/Event Start Num ......................................................... 171
Min Duration ............................................................................................ 171
Min. Duration/Event Severity .............................................................. 172
MTBF ......................................................................................................... 172
MTTR ......................................................................................................... 172
OEE % ......................................................................................................... 172
Part Description ....................................................................................... 173
PartId ........................................................................................................... 173
Quality % .................................................................................................... 173
Realized Cycle Time ................................................................................ 173
Record State ............................................................................................... 173
Reporting Value ........................................................................................ 173
Running Time ........................................................................................... 173
Scheduled Unavailable Time ................................................................. 174
Scrap % ........................................................................................................ 174
Scrap Parts .................................................................................................. 174
Shift 174
Shift Name ................................................................................................. 174
Shift Number ............................................................................................ 174
Shift Start ................................................................................................... 174
Site 175
Start Time .................................................................................................. 175
Start Value .................................................................................................. 175
State Count ................................................................................................ 175
State Name ................................................................................................. 175
TEEP ........................................................................................................... 175
Throughput % ........................................................................................... 175
Time in Event ............................................................................................ 176
Total Duration .......................................................................................... 176
Total Parts .................................................................................................. 176
Uptime ........................................................................................................ 176
Rockwell Automation Publication RPTEXP-UM001H-EN-P-June 2014 9
Page 10

Table of Contents
Uptime % ................................................................................................... 176
Work Cell................................................................................................... 176
10 Rockwell Automation Publication RPTEXP-UM001H-EN-P-June 2014
Page 11

Chapter 1
Welcome to Report Expert
Report Expert is a new reporting environment based on SQL Server
Reporting Services (SSRS) for Microsoft SQL Server that allows you
to report on data generated by FactoryTalk Metrics.
Report Expert is an optional component that is installed separately
from RSBizWare and the FactoryTalk Metrics software. To use
Report Expert, you must install one of the supported versions of
Microsoft SQL Server (see "Report Expert Prerequisites (page 17)").
Read the release notes (located on your Report Expert CD) to learn
about software/hardware requirements.
Report Expert provides a web interface to view and interact with
three types of reports that display FactoryTalk Metrics data:
• Quick Web reports, which are created with the RSBizWare
and FactoryTalk Metrics report authoring tools.
• SQL Server Reporting Services reports, which are created
using the SSRS report designer tools.
• Report Expert report templates (page 38), which are specially
modified SSRS reports.
A fixed number of Report Expert report templates are installed
automatically with Report Expert. These report templates, when
combined with parameter sets you can create, will satisfy a wide
range of reporting requirements. You can also create new Report
Expert report templates using SSRS. Creating new reports is an
advanced topic that is not covered in this user guide.
Rockwell Automation Publication RPTEXP-UM001H-EN-P-June 2014 11
Page 12

Chapter 1 Welcome to Report Expert
Features of Report Expert
Report Expert provides the following features:
• Uses standard SQL Server Reporting Services (SSRS) for
Microsoft SQL Server.
• Includes SSRS for Microsoft SQL Server, and appropriate
client licenses.
• Includes value-added content not available in SSRS, such as:
• Interactive filtering using the plant model and other
FactoryTalk Metrics key fields (for example, any of the five
flex fields).
• Dynamic grouping and sorting.
• Expanded date and time filtering, including shift filtering.
• Pre-defined named filters such as Today, Yesterday, and
This Week.
• Drilldown and drillthrough.
• Allows you to:
• View Report Expert report templates, standard SSRS
reports, and Quick Web reports through a single web
interface.
• Create a custom reporting tree.
• Create parameter sets that define filtering, grouping, and
sorting behaviors and apply these to report templates to
create custom reports.
• Create and modify your own report parameter sets, as well
as save parameter sets with report templates to create
custom reports.
• Use the parameter settings interactively to perform ad-hoc
reporting.
12 Rockwell Automation Publication RPTEXP-UM001H-EN-P-June 2014
Page 13

Welcome to Report Expert Chapter 1
Intended Audience
• Modify standard SSRS RDL reports to take advantage of
Report Expert parameter passing (passing values from the
Report Expert parameter set into the report).
• Enter event and production data manually.
• View and modify event and production data.
• View and modify shift information.
Benefits of Report Expert
Report Expert uses an industry-standard reporting package from
Microsoft, not a proprietary reporting package from Rockwell
Automation. This means it can be much easier and more
cost-effective for you to create and maintain a reporting system.
Expertise on SSRS can be obtained from Microsoft training classes,
publications, and contractors. SSRS could be the reporting standard
for other applications in your company, allowing for easier
integration of FactoryTalk Metrics data with other data and
applications.
The user guide is designed to help you understand how to install,
configure, access, use, and maintain your Report Expert software.
The document is intended for the following three types of users:
• Report Expert Establisher (page 13)
• Report Expert Administrator (page 14)
Report Expert Establishers
Rockwell Automation Publication RPTEXP-UM001H-EN-P-June 2014 13
• Report Expert User (page 14)
Report Expert establishers install Report Expert and set it up for use
by the administrator and other users.
They should be familiar with:
• Microsoft Windows operating systems.
Page 14

Chapter 1 Welcome to Report Expert
• Microsoft SQL Server (including SQL Server Reporting
Services (SSRS)).
• Microsoft Internet Information Services (IIS).
Report Expert Administrators
Report Expert Users
Report Expert administrators define the parameter sets and reports
accessible to Report Expert users.
They should be familiar with:
• The layout and content of the lines and plant for which the
reports will provide information.
• Microsoft Windows operating systems.
• Microsoft Internet Explorer.
• Microsoft SQL Server (including SQL Server Reporting
Services (SSRS)).
Report Expert users use the reports created by the administrator in
order to perform their job.
They should be familiar with:
• Microsoft Windows operating systems.
• Microsoft Internet Explorer.
Where Can I Go for Help?
Consult the following resources for additional information about
the product:
• Release Notes
The release notes contain current information about the
product, including hardware and software requirements, new
features, known and fixed anomalies.
• RSBizWare Administration Guide
14 Rockwell Automation Publication RPTEXP-UM001H-EN-P-June 2014
Page 15

Welcome to Report Expert Chapter 1
The administration guide helps the RSBizWare administrator
install and configure the software as well as understand the
architecture of the RSBizWare suite and its components.
• Online help
The online help provides general information and step-by-step
procedures for working with the product.
• Rockwell Automation Support Center
The support center provides a variety of services, such as
trainings, webinars, and online support that will improve your
experience using the RSBizWare suite.
Rockwell Automation Publication RPTEXP-UM001H-EN-P-June 2014 15
Page 16

Chapter 1 Welcome to Report Expert
16 Rockwell Automation Publication RPTEXP-UM001H-EN-P-June 2014
Page 17

Chapter 2
Report Expert Prerequisites
Before you install Report Expert, keep the following in mind:
• Report Expert must be installed on the same computer as SQL
Server Reporting Services (SSRS).
• Make sure you have configured your System DSN (Data
Source Name) in your ODBC Data Source Administrator.
If you have RSBizWare installed, you may already have System
DSN configured.
To verify the System DSN configuration on Microsoft Windows
Server:
1. In the file explorer, go to the following directory:
%windir%\SysWOW64\
2. Double-click odbcad32.exe.
The ODBC Data Source Administrators (32-bit) dialog box
appears.
3. Click the System DSN tab.
If the system DSN is configured, your RSBizWare database is
listed under System Data Sources.
If the System DSN is not configured, create a DSN for the
RSBizWare database on the server containing the Report
Expert web site. For more information on creating a DSN, see
the Report Expert Release Notes, section "Prerequisites for
Windows Server 2012 for FactoryTalk Metrics and Report
Expert".
Rockwell Automation Publication RPTEXP-UM001H-EN-P-June 2014 17
Page 18

Chapter 2 Report Expert Prerequisites
Hardware and Software Requirements
For up-to-date information on hardware and software requirements
of Report Expert, refer to the Report Expert Release Notes, available
on the RSBizWare installation DVD.
18 Rockwell Automation Publication RPTEXP-UM001H-EN-P-June 2014
Page 19

contains information that can help identify the cause of your installation
Expert report templates, those reports in your currently installed version
Chapter 3
Installing Report Expert
This chapter describes how to install the Report Expert software.
If you are installing Report Expert, you must have the Windows
System Administrator privileges, and your user account must be a
member of the local administrator user group.
Installing or Upgrading Report Expert
IMPORTANT
If you encounter problems during the Report Expert installation and
need to call support, make sure that you have access to the log files
created during installation. These files are named Rockwell - Report
Expert 3.20 Install.log and Rockwell - Report Expert Deployment 3.0.log.
Depending on your installation options, only one of these files may
appear.
The log files are usually located in the \Documents and
Settings\username\Local Settings\Temp folder, where username is
the name of the installing user. However, this location can vary
depending on the value of the %TEMP% environment variable. This file
problem.
You must have the administrator privileges to perform any of the
following actions.
NOTE
If you are going to perform an upgrade to Report Expert 3.20, you may
want to first rename standard reports if you changed any of the reports
to meet your specific needs. If you do not rename the standard Report
To install or upgrade Report Expert on the server:
1. Close the SSRS web site, if it is open.
Rockwell Automation Publication RPTEXP-UM001H-EN-P-June 2014 19
of Report Expert will be removed and replaced by new versions of the
Report Expert report templates.
Page 20
Chapter 3 Installing Report Expert
2. Run the RSBizWare installation DVD.
The RSBizWare installation wizard appears.
3. On the Welcome page, click FactoryTalk Metrics >
Installation > Install Report Expert.
The installation program checks for installed applications.
4. On the Welcome page, click Next.
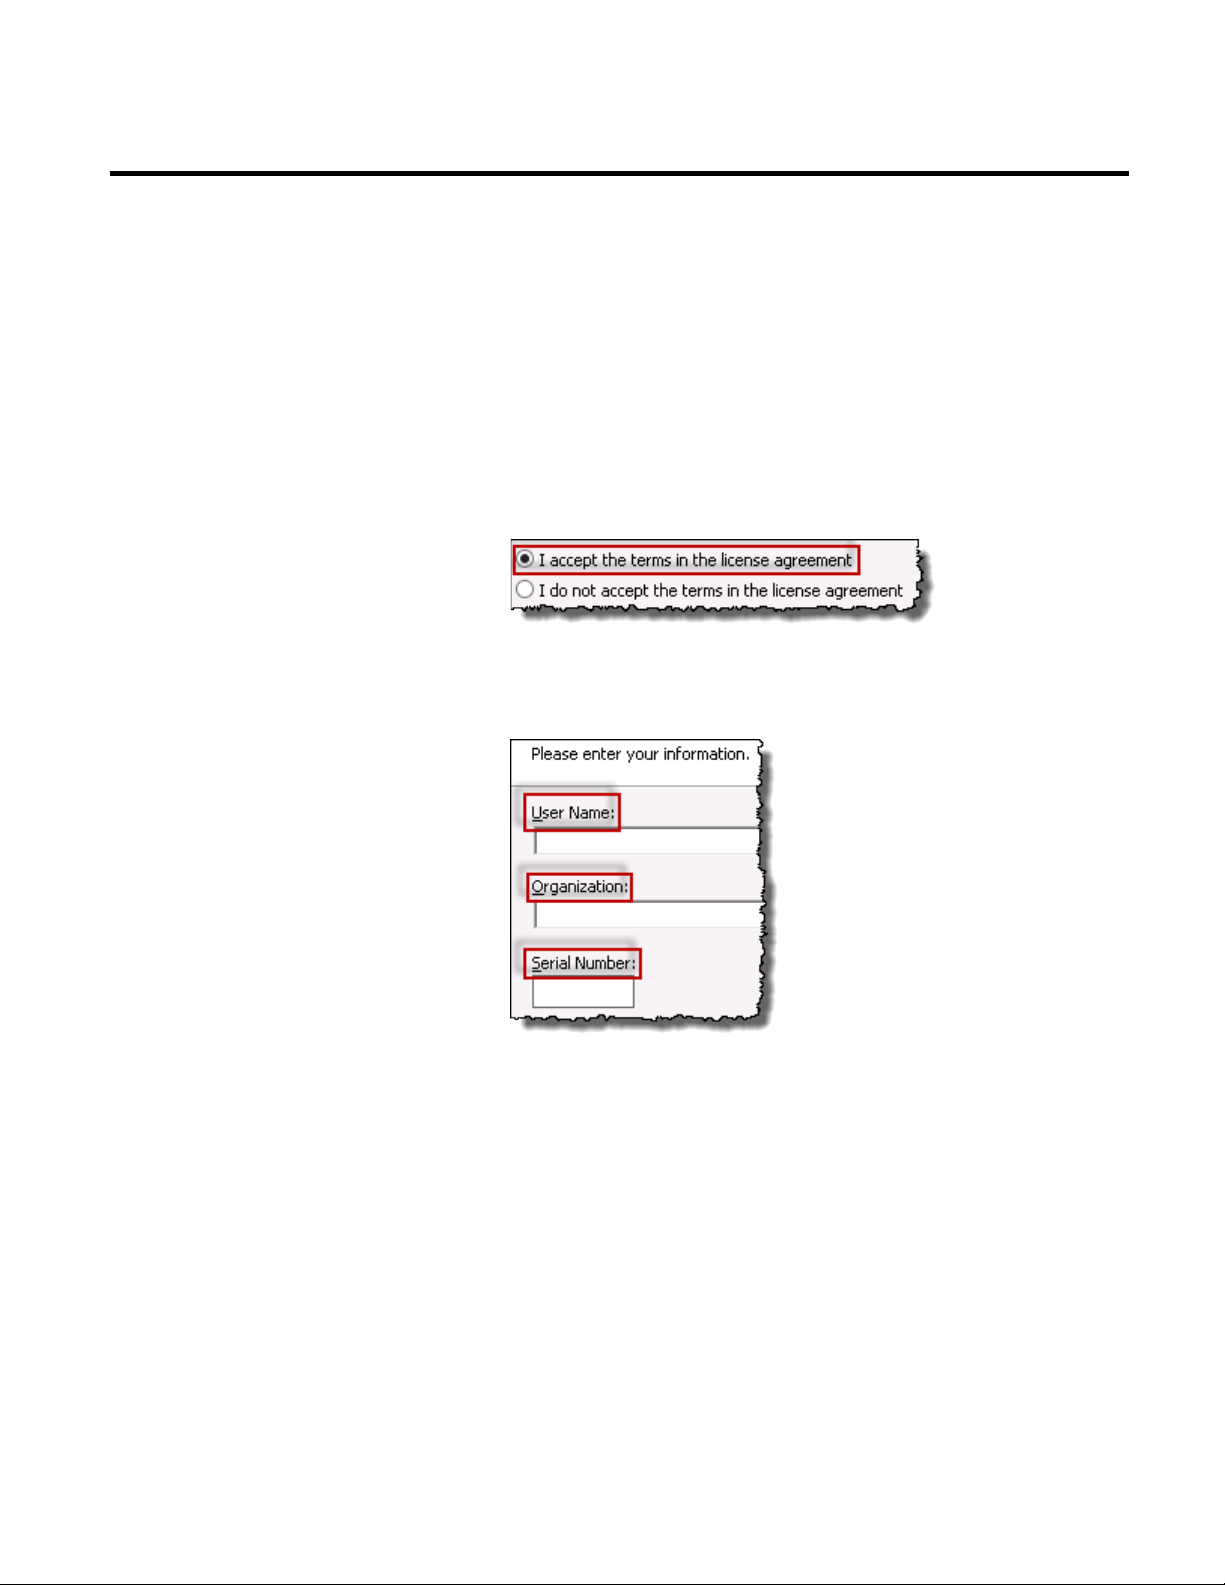
5. On the License Agreement page, click:
6. Click Next.
7. On the Customer Information page, type the following:
8. Click Next.
9. On the Setup Type wizard page, select:
• Complete, if you want to install all the features.
• Custom, if you want to install specific components.
If you choose this option, the Custom Setup page appears.
Select the components that you want to install and their
locations on the computer.
10. Click Next.
20 Rockwell Automation Publication RPTEXP-UM001H-EN-P-June 2014
Page 21
Installing Report Expert Chapter 3
The Virtual directory information page appears. It displays
the default virtual directory of the Report Expert web site:
http://localhost/RockwellSoftware/ReportExpert
11. Click Next.
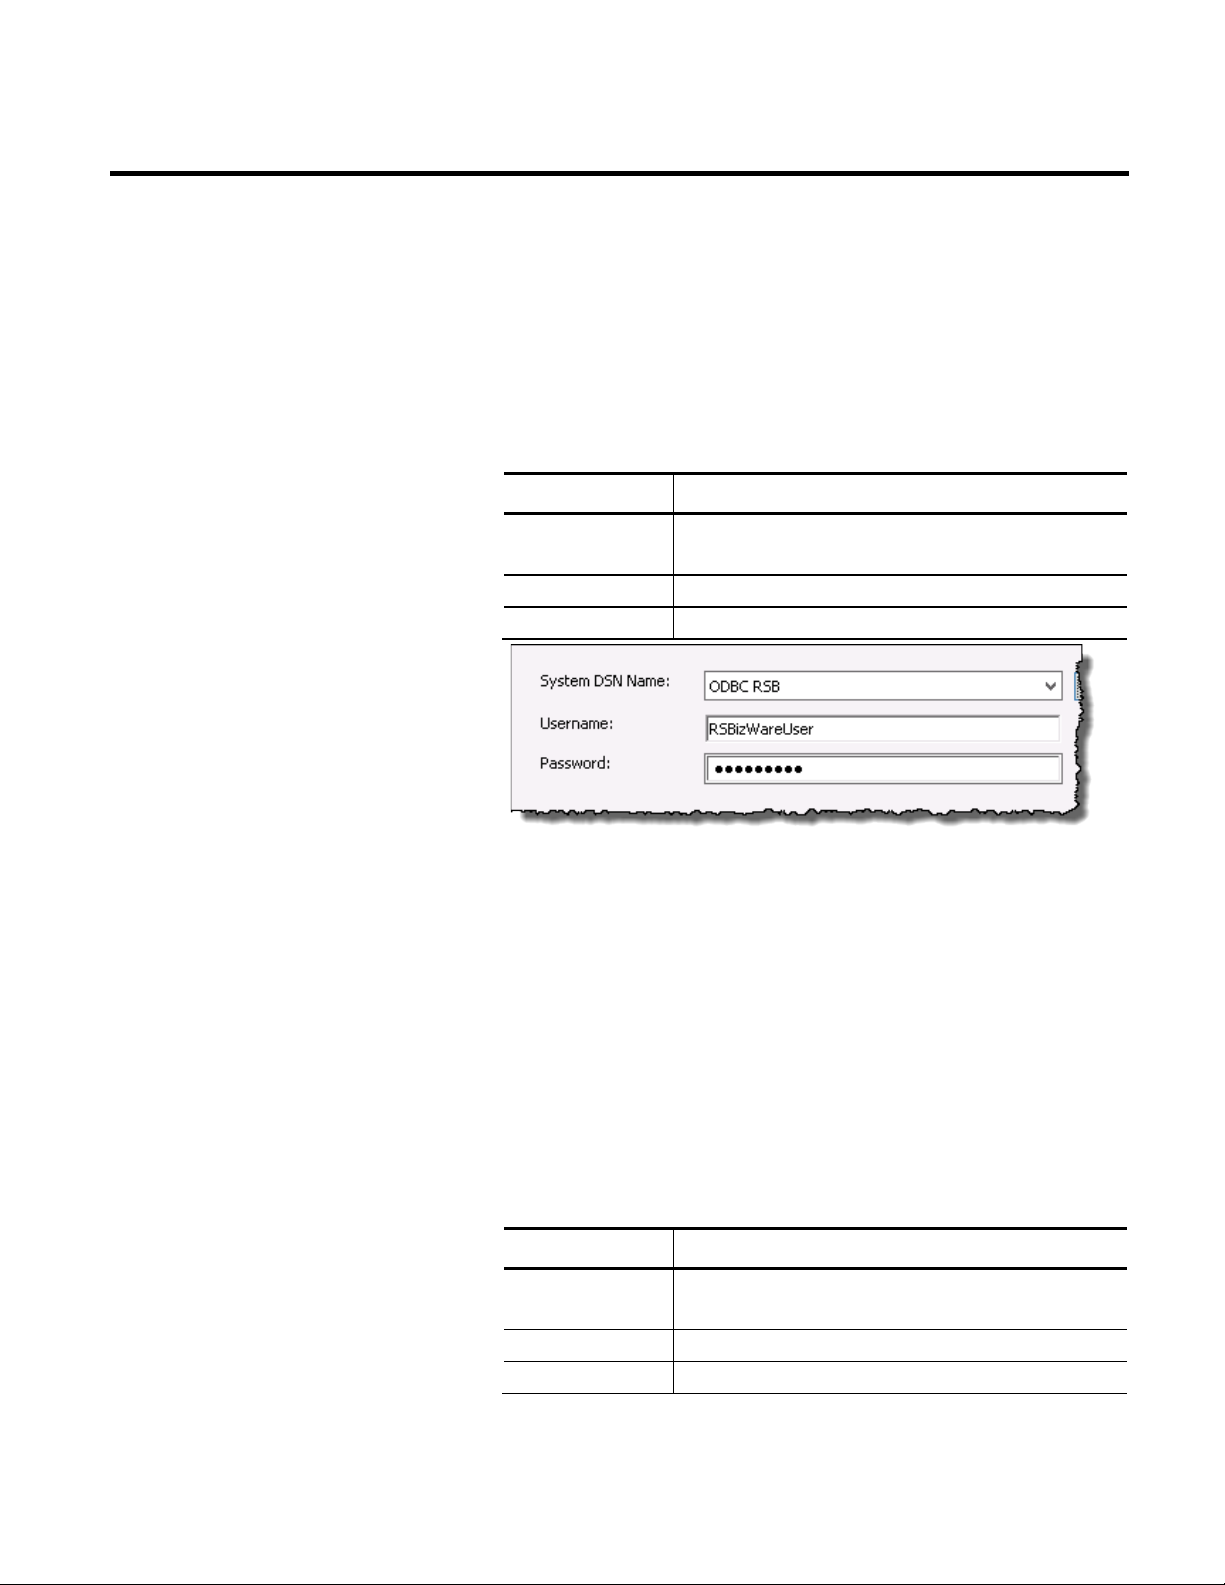
12. On the Database connection information page, provide the
following information:
Item Description
System DSN Name Select the name of the ODBC data source that you have
configured for your RSBizWare SQL Server database.
Username Type the user name of your RSBizWare database.
Password Type the password for the RSBizWare database user.
13. Click Next.
14. On the Ready to Install the Program page, click Install.
The Installing... page presenting the installation status
appears.
15. On the InstallShield Wizard Completed page, click Finish.
The Database Load and Update wizard appears.
16. On the Welcome page, click Next.
17. On the Product and Database Connection page, provide the
following information:
Item Description
ODBC DSN Select the name of the ODBC data source that you have
configured for your RSBizWare SQL Server database.
User Type the user name of your RSBizWare database.
Password Type the password for the RSBizWare database user.
Rockwell Automation Publication RPTEXP-UM001H-EN-P-June 2014 21
Page 22
Chapter 3 Installing Report Expert
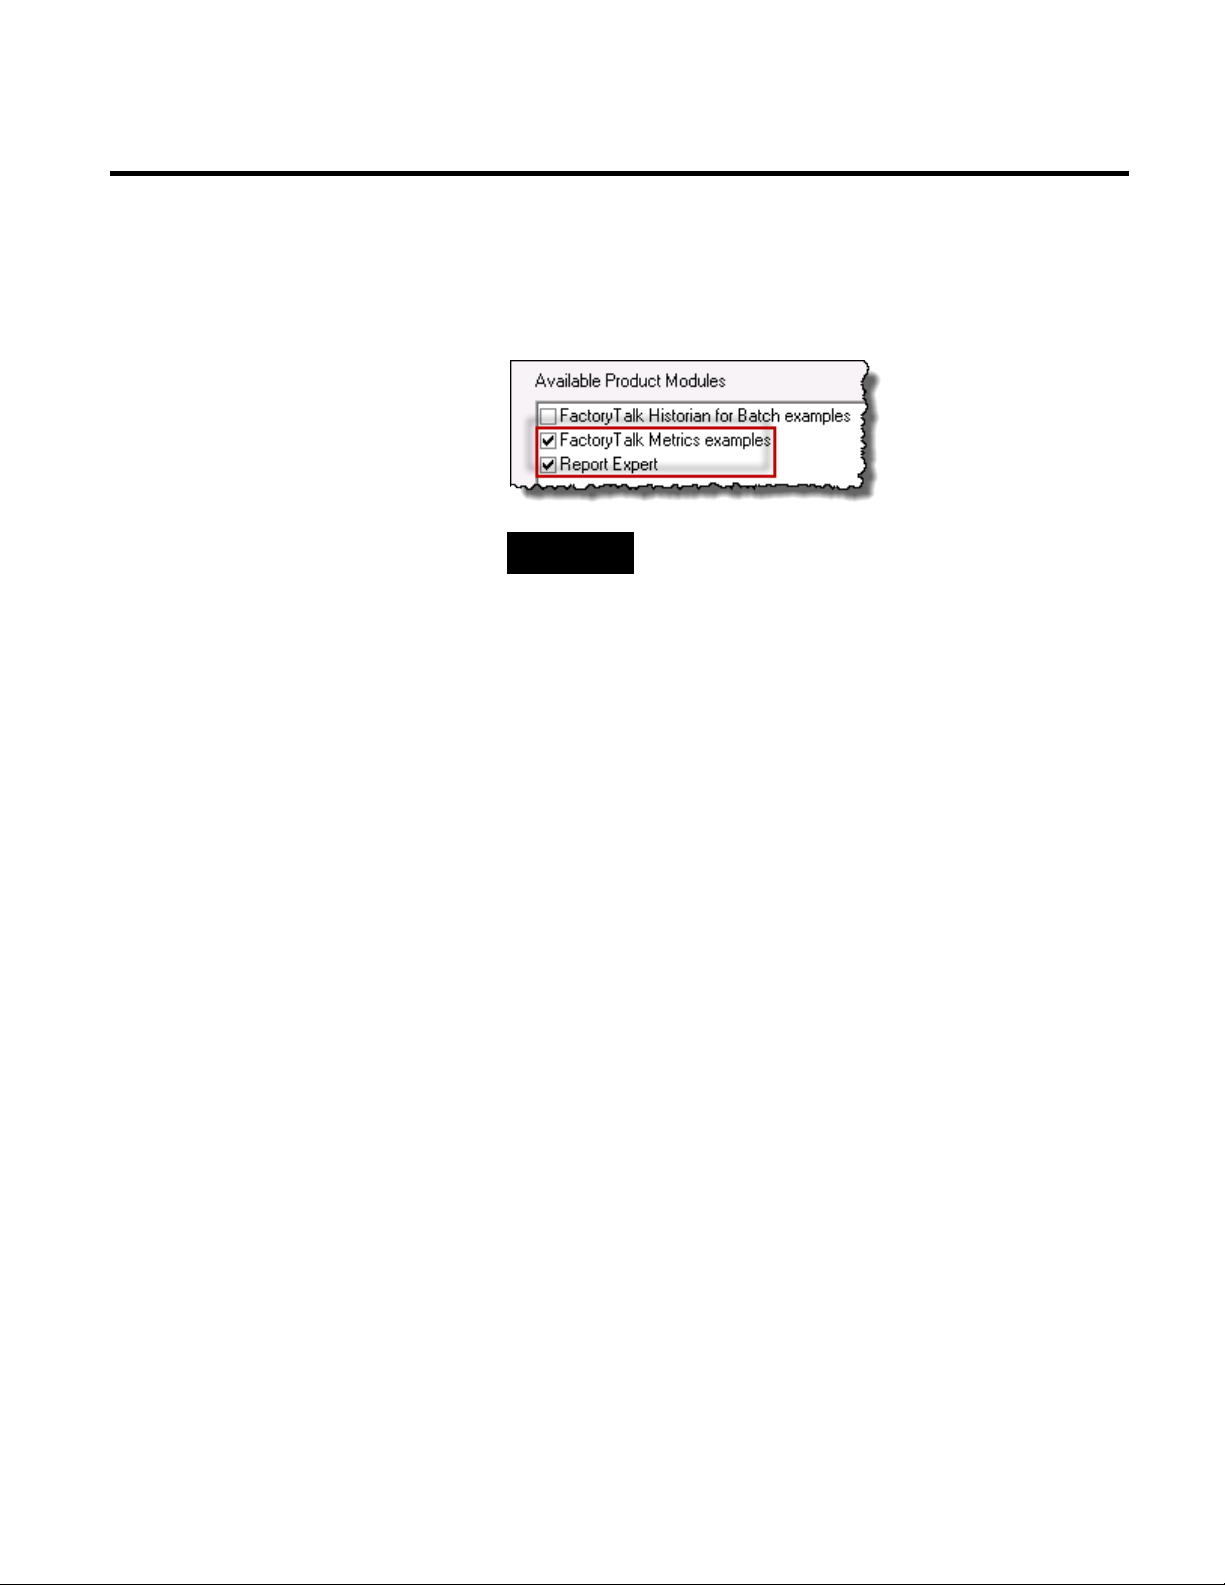
18. Click Connect. The Available Product Modules list is
populated with FactoryTalk components.
19. Under Available Product Modules, select these options:
Removing Report Expert
TIP
Select both options so that you have access to FactoryTalk
Metrics and Report Expert sample data.
20. Click Finish to load data.
21. Click Close to exit the wizard.
Before removing Report Expert, you must delete all of the scheduled
reports you created while using Report Expert. You can delete the
reports from the Subscriptions tab (see "Deleting Report
Subscriptions (page 154)") or you can stop the Microsoft SQL
Server Agent (MSSQLSERVER) service (note that
MSSQLSERVER is the default Microsoft SQL Server instance
name that needs to be replaced with an appropriate one).
To stop the SQL Server agent service:
1. Go to Start > Administrative tools > Services. The Services
dialog box appears.
2. Right-click the SQL Server Agent service, and click Stop.
To remove Report Expert from the computer:
• Run the Report Expert installation again, click Next, and then
select Remove.
• Select Start > Settings > Control Panel > Add/Remove
Programs. The Windows Add/Remove Programs utility
22 Rockwell Automation Publication RPTEXP-UM001H-EN-P-June 2014
Page 23

Installing Report Expert Chapter 3
appears. To remove Report Expert, select Report Expert and
click Remove.
Rockwell Automation Publication RPTEXP-UM001H-EN-P-June 2014 23
Page 24

Chapter 3 Installing Report Expert
24 Rockwell Automation Publication RPTEXP-UM001H-EN-P-June 2014
Page 25
Chapter 4
Getting Started
In this chapter you will learn the following:
• What are the components of the Report Expert architecture
(page 25).
Understanding the Report Expert Architecture
• How to connect to Report Expert (page 27).
• What are the components of the Report Expert web page
(page 29).
• Where Report Expert-related errors are logged (page 34).
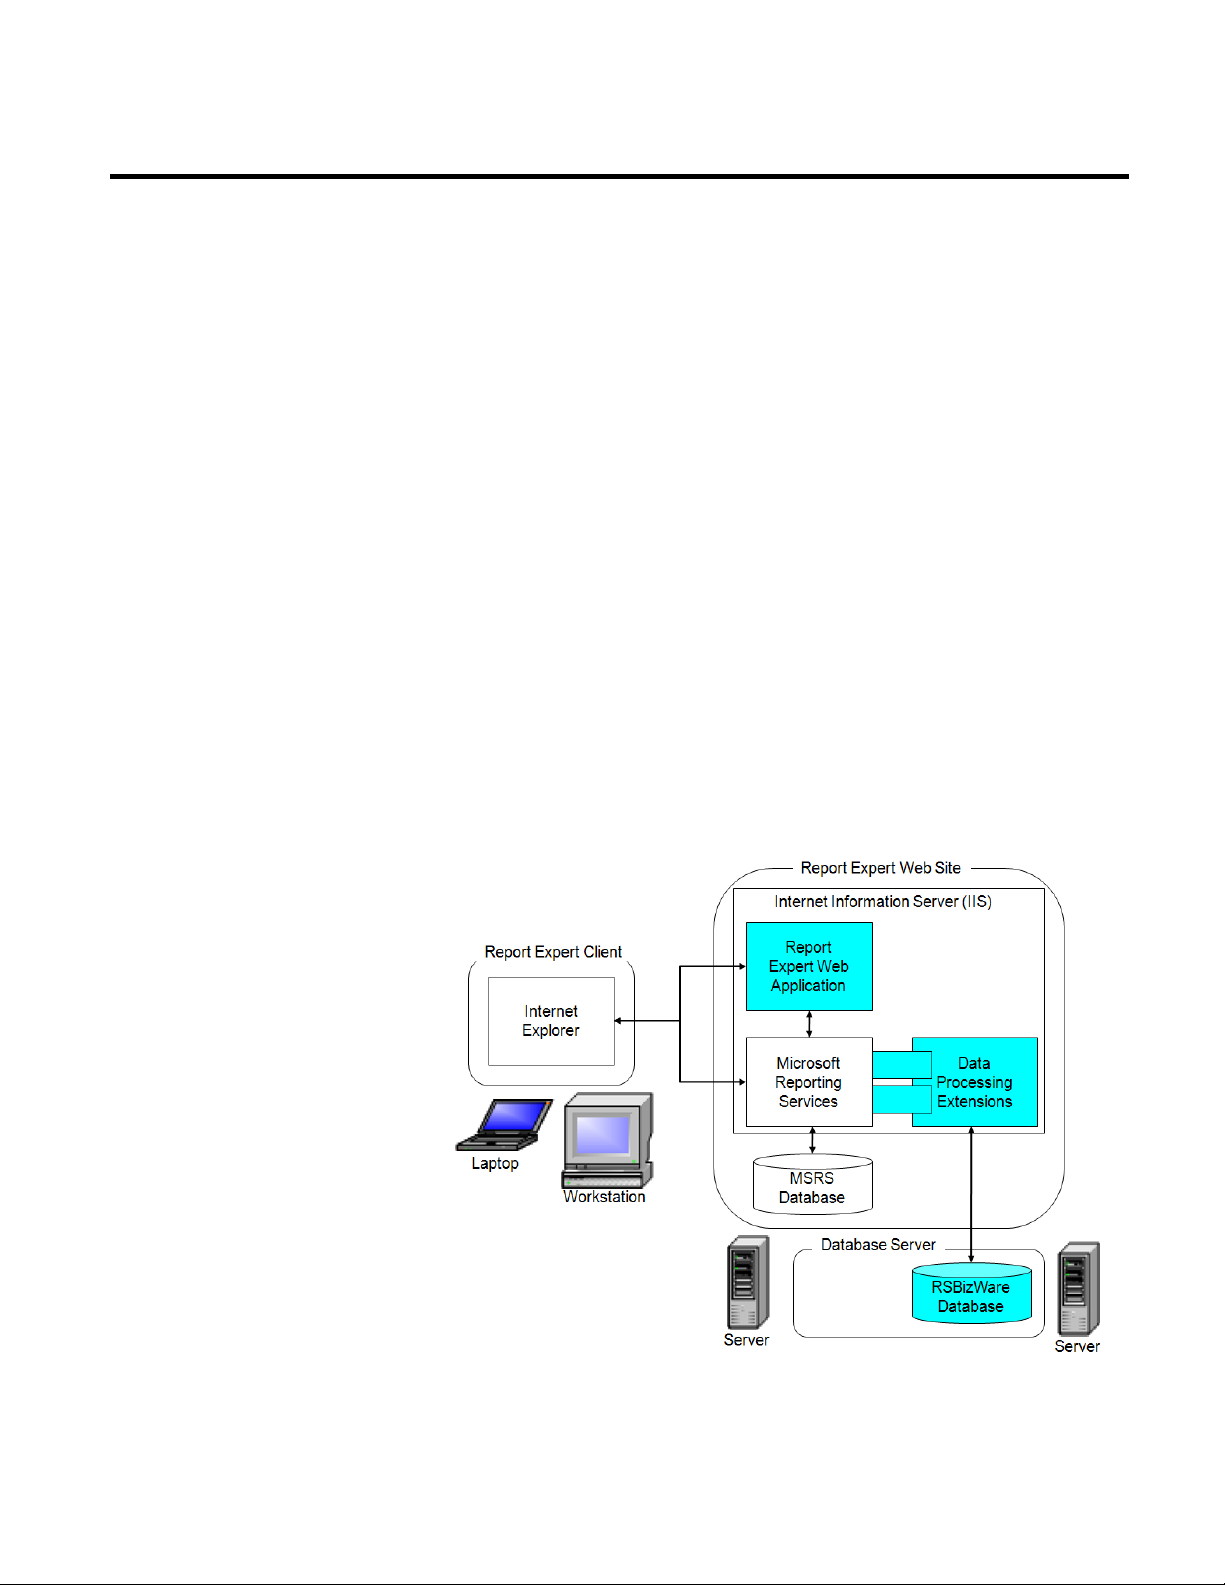
The following diagram provides a high-level architecture of Report
Expert.
Rockwell Automation Publication RPTEXP-UM001H-EN-P-June 2014 25
Page 26
Chapter 4 Getting Started
The Report Expert architecture is a scalable, multi-tiered,
distributed architecture consisting of the following main
components:
Item Description
Report Expert client (One or more.) A laptop or workstation running Internet Explorer.
Report Expert web
site
A server computer running Microsoft SQL Server with SQL Server
Reporting Services (SSRS) and Internet Information Server (IIS).
Database server A server computer running Microsoft SQL Server. This computer
contains the RSBizWare database with the FactoryTalk Metrics data
from which the content of Report Expert report templates are
derived.
The Report Expert components can be configured to run on a single
computer, or it can be distributed across multiple computers. In the
simplest case, the Report Expert web site can be installed on the
same machine as the database server and a user can access the Report
Expert client on the same server computer. In a distributed setting,
these components may reside on separate computers.
The Report Expert client connects to the Report Expert service to
view an HTML report, while it connects directly to the SQL Server
Reporting Services (SSRS) to generate a PDF or an Excel version of a
report or to print a report. The scalability of the Report Expert
architecture allows many clients to connect to a single Report Expert
web site.
The Report Expert web application interacts with the SSRS web
application. The SSRS web application uses the FactoryTalk Metrics
Data Provider (a SSRS Data Processing Extension) to retrieve
FactoryTalk Metrics data.
To generate FactoryTalk Metrics-related Report Expert report
templates, the Report Expert Service must have a connection to the
RSBizWare database containing the FactoryTalk Metrics tables and
views. In addition, SSRS need access to its own separate database at
run time.
26 Rockwell Automation Publication RPTEXP-UM001H-EN-P-June 2014
Page 27

Getting Started Chapter 4
NOTE
The same instance of Microsoft SQL Server can host both the SSRS
database and the RSBizWare database. However, only one instance of
Microsoft SQL Server is licensed with a FactoryTalk Metrics server.
Therefore, if you want to distribute the two databases across two
different computers, you must acquire an additional Microsoft SQL
Server license.
Connecting to Report Expert
Use Microsoft Internet Explorer to connect to Report Expert.
To start Report Expert do either of the following:
• Go to Start > All Programs > Rockwell Software > Report
Expert > Report Expert.
• Open Internet Explorer.
Go to:
http://hostcomputer:8001/rockwellsoftware/reportexpert
where hostcomputer is the name of the computer on which
Report Expert is installed.
NOTES
In order to display drill-down report data correctly, make
sure your Internet Explorer setting for refreshing pages is
set up correctly.
• In Internet Explorer 7.0, select Tools > Options.
Under Temporary Internet Files, click Settings
and select Every time I visit the webpage.
• In Internet Explorer 8.0 or 9.0, select Tools >
Internet Options. Under Browsing history, click
Settings and select Every time I visit the
webpage.
Report Expert administrators should open Report Expert in
Internet Explorer using the Run as administrator option so that the
Administration page is visible. For more details, see "Administering
Report Expert (page 133)".
Rockwell Automation Publication RPTEXP-UM001H-EN-P-June 2014 27
Page 28
Chapter 4 Getting Started
TIP
If you use Internet Explorer 10, see "Settings Specific to Internet Explorer
10 (page 28)" to learn how to configure your browser to work with
Report Expert.
Settings Specific to Internet Explorer 10
Add the Report Expert Site to the Trusted Sites Zone
To make sure that Report Expert is displayed correctly in Internet
Explorer 10, configure the following:
• Add the Report Expert site to the Trusted sites zone. (page 28)
• Set Internet Explorer 10 to open the Report Expert site in
Compatibility View. (page 29)
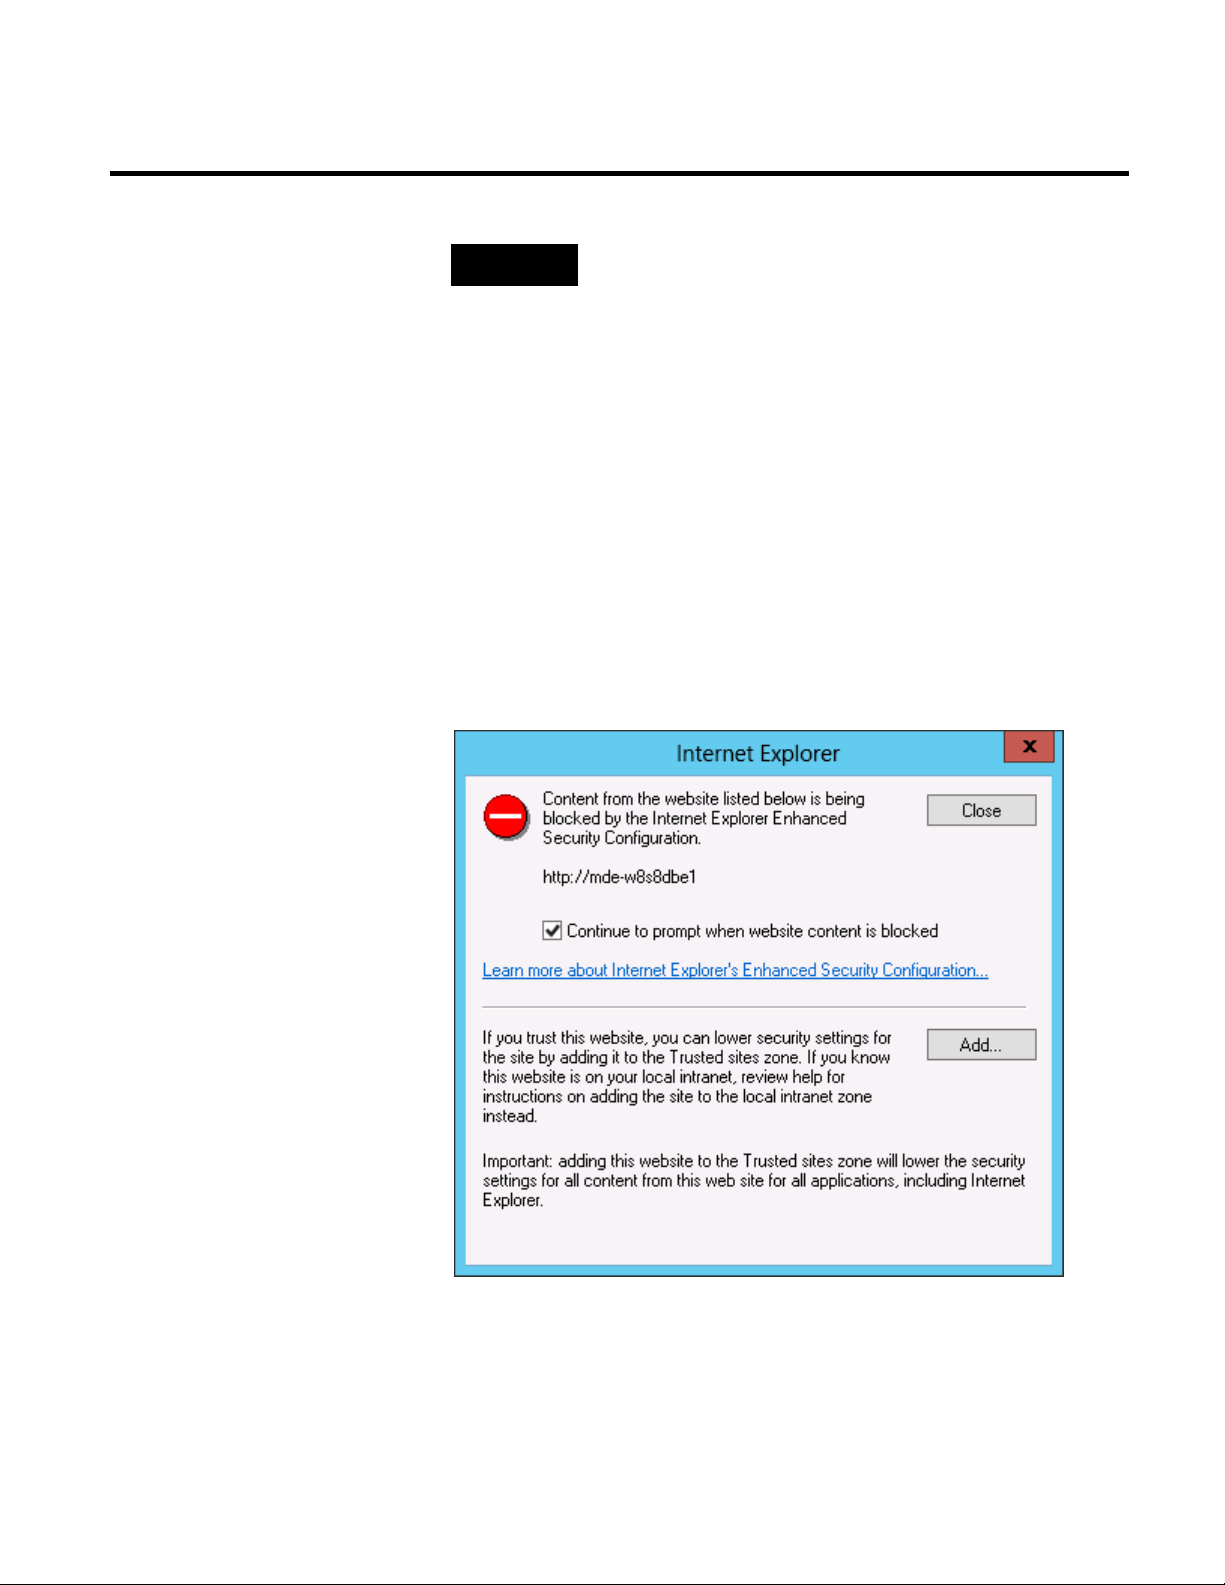
When you open the Report Expert site in Internet Explorer 10 for
the first time, the following message is displayed:
To prevent Internet Explorer 10 from blocking Report Expert, add
the Report Expert site to the Trusted sites zone.
28 Rockwell Automation Publication RPTEXP-UM001H-EN-P-June 2014
Page 29

Getting Started Chapter 4
To add the Report Expert to the Trusted sites zone:
1. In the dialog box displayed above, click Add.
The Trusted sites dialog box appears.
The address of the Report Expert site appears under Add this
website to the zone.
2. Click Add.
The site is added to the Websites list.
3. Click Close.
The Report Expert site is reloaded and is displayed in the
browser with its content.
Open the Report Expert Site in Compatibility View
To open the Report Expert site in Compatibility View:
1. Open Report Expert in Internet Explorer 10.
2. Right-click the window bar of Internet Explorer, and click
Menu bar.
The menu bar appears.
3. On the Tools menu, click Compatibility View settings.
The Compatibility View Settings dialog box appears.
The address of the Report Expert site appears under Add this
website.
4. Click Add.
The site is added to the Websites you've added to
Compatibility View list.
5. Click Close.
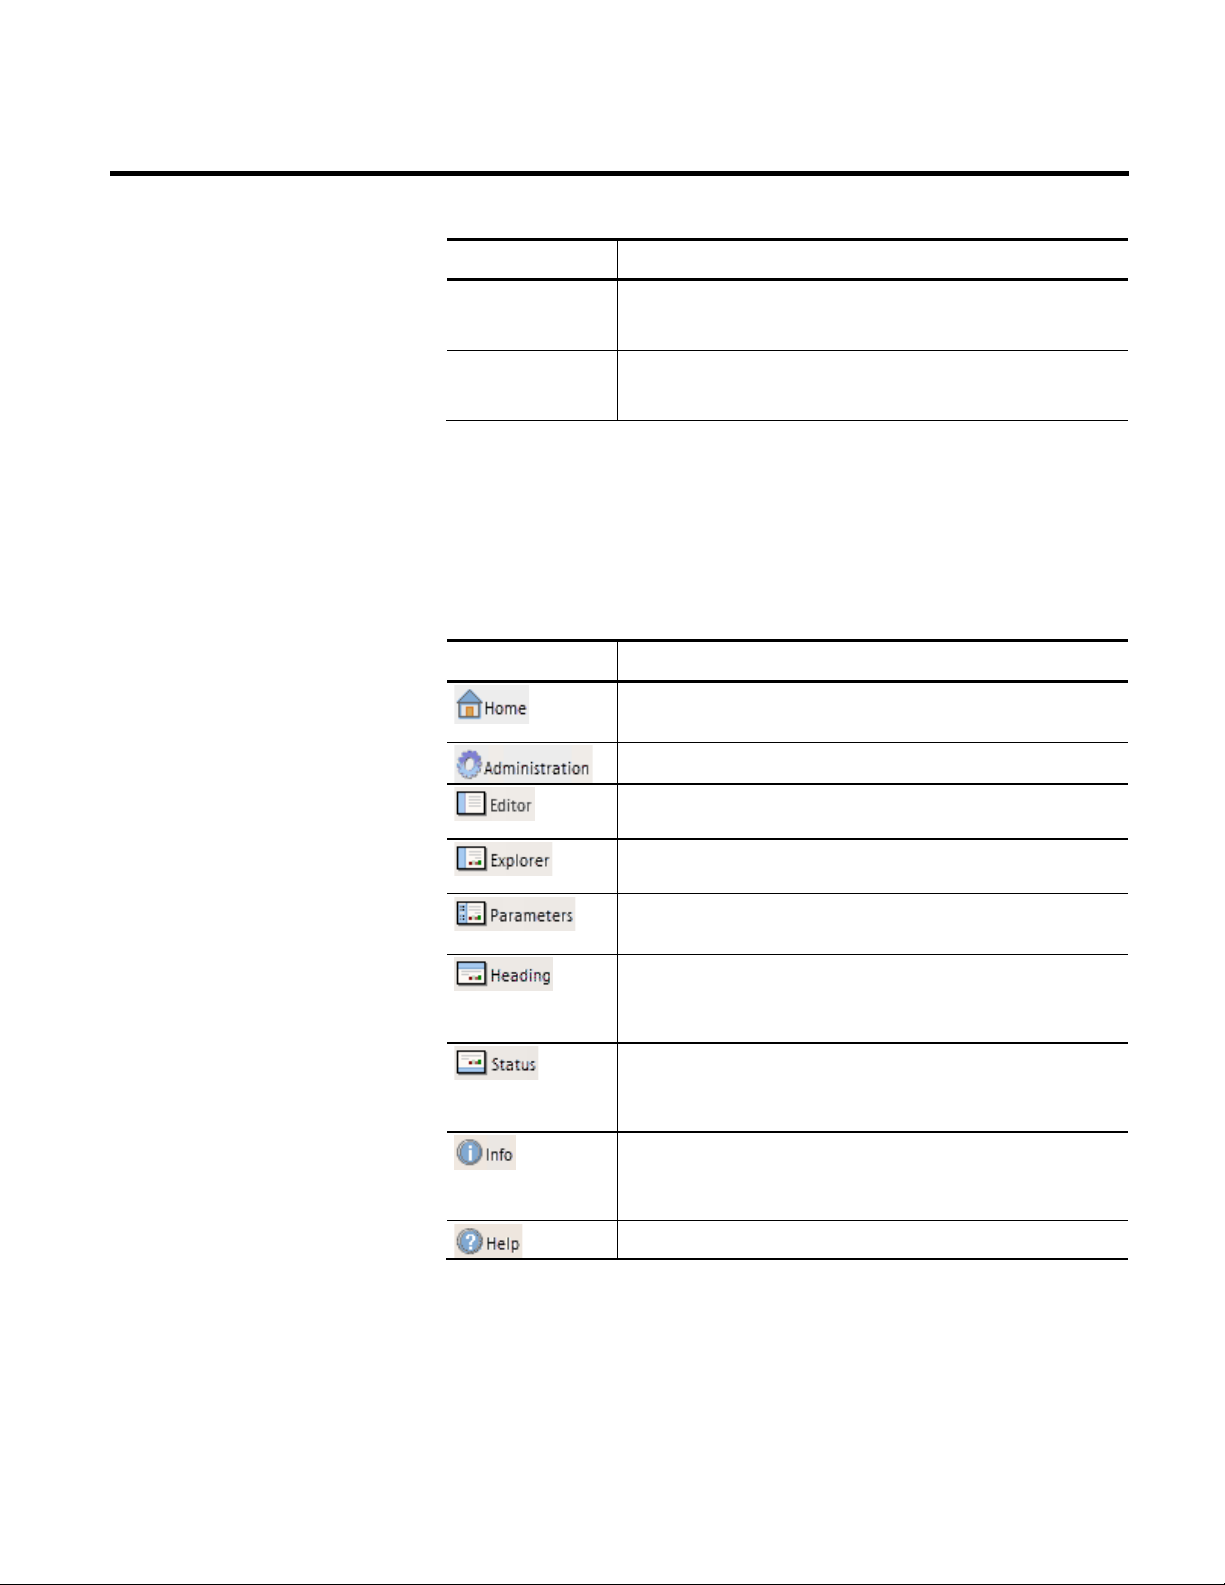
Navigating Report Expert
Report Expert consists of the following modules and pages:
This module: Contains these pages:
Administration Administration
Rockwell Automation Publication RPTEXP-UM001H-EN-P-June 2014 29
Page 30
Chapter 4 Getting Started
ay or hide the red status bar at the bottom of the Report Expert
This module: Contains these pages:
Manual Data Editor
• Parameters
• Editor
Report Viewer
• Parameters
• Explorer
Use the toolbar at the top of the Report Expert page to navigate to
different areas of the product, and to control which components are
displayed.
The toolbar contains the following icons:
Click this button To:
Open the Report Expert home page. By default, it is the Report
Viewer's Parameters page.
Open the Administration (page 30) page.
Open the Editor (page 32) page.
Open the Explorer (page 34) page.
Administration Page
30 Rockwell Automation Publication RPTEXP-UM001H-EN-P-June 2014
Display or hide the Parameters page for either the Manual Data
Editor (page 32) or the Report Viewer (page 33).
Display or hide the red heading bar at the top of the Report Expert
web page. The heading bar indicates your current location within
the Report Expert.
Displ
web page. The status bar shows tool tips and messages as you work
within Report Expert.
Display a new browser window containing a list of the various
components (and their version numbers) being used by Report
Expert, and the version number of Report Expert.
Display the help for Report Expert.
Page 31

Getting Started Chapter 4
On the Administration page, administrators can:
• Manage the content of the tree on the Explorer page.
• Configure the RSBizWare QuickWeb for Report Expert.
• Configure report subscriptions.
• Schedule reports for future delivery.
• Configure the way parameter sets are displayed on the web
page.
• Configure a line order for work cells.
Manual Data Editor
To open the Administration page, click
on the
Report Expert toolbar.
For more information on using the Administration page, see
"Administering Report Expert (page 133)".
The Manual Data Editor allows you to display and modify
production data from a FactoryTalk Metrics database. It consists of
the following pages:
• Parameters page (page 32).
• Editor page (page 32).
For more information on using the Editor, see "Editing Event and
Production Data (page 103)".
Rockwell Automation Publication RPTEXP-UM001H-EN-P-June 2014 31
Page 32

Chapter 4 Getting Started
Parameters Page for the Editor
On the Parameters page, you can select operations and the
parameter sets for which you want to perform the operations.
To open the Parameters page for the Manual Data Editor for the
first time, click
To show or hide the Parameters page, click
on the Report Expert toolbar.
on the
Report Expert toolbar.
Editor Page
On the Editor page, you can perform various operations on the
production data you have selected:
• Edit events.
• Edit production data.
• Edit shift information.
32 Rockwell Automation Publication RPTEXP-UM001H-EN-P-June 2014
Page 33

• Enter data manually.
Getting Started Chapter 4
Report Viewer
Parameters Page for the Viewer
To open the Editor page, click
on the Report Expert
toolbar.
The Report Viewer allows you to view available reports. It consists
of the following pages:
• Parameters page (page 33).
• Explorer page (page 34).
For more information on using the Viewer, see "Viewing and
Generating Reports (page 97)".
On the Parameters page, you can associate report templates with
parameter sets and generate ad-hoc reports.
Rockwell Automation Publication RPTEXP-UM001H-EN-P-June 2014 33
Page 34

Chapter 4 Getting Started
To show or hide the Parameters page, click on the
Report Expert toolbar.
For more information on using the Parameters page, see "Generating
Reports Using the Parameters Page (page 97)".
Explorer Page
On the Explorer page, you can select a report from the tree to
automatically display that report in the display area.
To open the Explorer page, click
on the Report Expert
toolbar.
For more information on using the Explorer page, see "Viewing
Saved Reports on the Explorer Page (page 97)".
Troubleshooting
Errors for Report Expert are logged in the following locations,
depending on the task you are performing at the time of the error:
• Microsoft Event Viewer.
Errors that occur while you are running the software (with the
exception of generating reports).
To display the Event Viewer, do either of the following:
• On Microsoft Windows Server 2008 R2:
34 Rockwell Automation Publication RPTEXP-UM001H-EN-P-June 2014
Page 35

Getting Started Chapter 4
Go to Start > Control Panel, and then click View event
logs in the System and Security group, or select Start >
Administrative Tools > Event Viewer. The Event Viewer
window appears.
• The SSRS log.
Errors that occur when you are generating reports.
The log file is located in the following folder:
Program Files\Microsoft SQL Server\<the name of the folder of
the Reporting Services instances, for example the default name or
MSRS10_50.MSSQLSERVER for Microsoft SQL Server 2008
R2>\Reporting Services\LogFiles.
• The Report Expert service log.
Errors that occur when you are using the Editor.
The log file is located in the \Website\Logs folder of your
Report Expert installation directory, for example: c:\Program
Files (x86)\Rockwell Software\Report Expert\Website\Logs.
Rockwell Automation Publication RPTEXP-UM001H-EN-P-June 2014 35
Page 36

Chapter 4 Getting Started
36 Rockwell Automation Publication RPTEXP-UM001H-EN-P-June 2014
Page 37

Chapter 5
Understanding Report Templates
Report Expert includes a fixed number of report templates. These
are partial reports where the data fields to be displayed are already
defined. The data fields and behavior of these templates are fixed, so
you cannot easily change them. However, you can apply parameter
sets to report templates to change both the content and the
appearance of the resulting report.
Drillthrough
In this chapter you will learn about standard report templates that
are available with Report Expert.
You will use this information to create your own reports. See
"Viewing and Generating Reports (page 97)" for details.
For information regarding the source of all raw data used by Report
Expert, see "Raw Data (page 76)".
For a list of the report templates, the queries the report templates
use, and the fields in each of those queries, see "Query Fields (page
72)".
When you use the Report Expert drillthrough capability by clicking
a data value in a report template, the resulting report displays data
based on the new row grouping. There is a set hierarchy of data
groupings as you drill through a report. For example, if you drill
through a report that contains a week’s data for a single work cell,
the resulting report will be grouped by day.
Following is the drillthrough hierarchy for the report templates
supporting Report Expert drillthrough capability:
Rockwell Automation Publication RPTEXP-UM001H-EN-P-June 2014 37
Page 38

Chapter 5 Understanding Report Templates
• Site
• Area
• Line
• Work Cell
• Month
• Week
• Day
• Shift
• Hour
Report templates that do not support drillthrough are identified in
the report template descriptions.
Report Templates
This section presents descriptions of the Report Expert report
templates. Depending on the type of a report template, the
descriptions may include the following information:
• The definition of the report template.
• The query on which the report template is based.
• The fields of the report template grid.
• The maximum number of rows allowed in the report template.
• The information on the drillthrough hierarchy.
• The description of the bar charts included in the report
template.
• The calculations used by Report Expert to prepare the
resulting report.
The definitions of report template fields are also available in
"Glossary of Fields (page 165)".
38 Rockwell Automation Publication RPTEXP-UM001H-EN-P-June 2014
Page 39

Understanding Report Templates Chapter 5
All report templates are available on the Parameters page, under
Select Report. See "Viewing and Generating Reports (page 97)" for
details.
Dashboard
The Dashboard report template is combined with the Dashboard
Current Shift parameter set. The Dashboard Current Shift
parameter set contains the following settings:
Item Description
Date/Time/Shift All Time Current Shift
Grouping Event Category (Col), Event Name (Col), Shift (Row)
Sorting None
Plant Model None
Filtering None
TOP N None
NOTE
For information on how the dashboard widgets (and this report
template) respond to changes in parameter settings, see "Parameter
Settings and Widgets (page 44)".
The Dashboard report template is comprised of the following
dashboard widgets:
• OEE % (page 40)
• 3 OEE Components (page 40)
• Last State (page 40)
• Production Summary (page 41)
• Uptime Summary (page 41)
• Fault Summary (page 42)
• Good Parts vs. Scrap Parts (page 42)
• Uptime vs. Downtime (page 43)
• Machine States (page 43)
• Event Count and Duration (page 43)
Rockwell Automation Publication RPTEXP-UM001H-EN-P-June 2014 39
Page 40

Chapter 5 Understanding Report Templates
OEE % Widget
The OEE % widget displays the OEE % value as a horizontal bar
chart for the work cells selected over the time period selected.
The color of the bar changes depending on the OEE value. The
color values are taken from the respective Color fields in the
RptSetting table. The values which cause a change from one color to
another are also set in the RptSetting table in the Threshold fields
(see "Configuring Report Expert Settings (page 138)").
3 OEE Components Widget
Last State Widget
The 3 OEE Components widget displays the OEE % and the three
OEE components (availability, throughput, and quality) as four bars
in a horizontal bar chart.
The color of the OEE bar changes depending on the OEE value. The
color values are taken from the respective Color fields in the
RptSetting table. The values which cause a change from one color to
another are also set in the RptSetting table in the Threshold fields
(see "Configuring Report Expert Settings (page 138)").
The Last State widget displays the current machine state and the
time the machine has been in that state. The data is shown as text.
This widget is not useful if you select more than one work cell.
However, if you select more than one work cell, this widget displays
the machine state with the latest starting time.
40 Rockwell Automation Publication RPTEXP-UM001H-EN-P-June 2014
Page 41

Understanding Report Templates Chapter 5
Machine states are not configured so you must configure them
manually. If you do not configure machine states, this widget will
not contain data. For information on configuring machine states,
refer to the FactoryTalk Metrics User Guide.
Production Summary Widget
Uptime Summary Widget
The Production Summary widget displays the number of good parts,
scrap parts, total parts, and scrap % for all the selected work cells for
the time period.
The Uptime Summary widget displays total available time, running
time, and down time for all selected work cells for the time period.
Each is shown in the format HH:MM:SS.
Rockwell Automation Publication RPTEXP-UM001H-EN-P-June 2014 41
Page 42

Chapter 5 Understanding Report Templates
Fault Summary Widget
Good Parts vs. Scrap Parts Widget
The Fault Summary widget displays the aggregated fault-related
data: fault count, fault time, mean time between failure and mean
time to repair.
The Good Parts vs. Scrap Parts widget displays the total good parts
and scrap parts by percentage in a pie chart.
42 Rockwell Automation Publication RPTEXP-UM001H-EN-P-June 2014
Page 43

Understanding Report Templates Chapter 5
Uptime vs. Downtime Widget
Machine States Widget
The Uptime vs. Downtime widget displays the total uptime and
total downtime (in minutes) as a vertical bar chart. If shift is
configured for the selected work cell(s), and more than one shift is
included in the time selection, the data is grouped by shift.
The Machine States widget displays total time (in minutes) in each
of the defined machine states in pie chart format.
Machine states are not configured so you must configure them
manually. If you do not configure machine states, this widget will
not contain data. For information on configuring machine states,
refer to the FactoryTalk Metrics User Guide.
Event Count and Duration Widget
The Event Count and Duration widget displays information for
user-defined events, including the event name, total event duration
(in minutes), and total event count. Duration is shown as a vertical
bar chart, and event count as a line. The chart is grouped by event
category and event name within each category.
Rockwell Automation Publication RPTEXP-UM001H-EN-P-June 2014 43
Page 44

Chapter 5 Understanding Report Templates
With the exception of the Event Count and Duration widget, data in
Parameter Settings and Widgets
The widgets will respond to most changes you make to the Report
Expert parameters. However, not all parameter settings affect all the
widgets. In general, the widgets will respond to the following
parameters:
Item Description
Date/Time/Shift All widgets in a report template use the selected setting for time
and shift.
Plant Model All widgets in a report template use the selected setting for the
Plant Model filter.
Terminology All widgets in a report template use the selected setting for
terminology. You can use the Terminologies feature to change the
titles that appear in each widget. See "Using the Terminology
Parameter (page 94)".
If the selected widget uses the data fields in the parameter settings,
the widget will respond to the following parameters:
Event All Detail
Item Description
Sorting
the widgets is not sorted. If you select a data field in the Event
Count and Duration widget (Event Count or Event Duration), you
can sort the data in the Event Count and Duration widget. See
"Using the Sorting Parameter (page 88)".
Filtering The widgets respond to filtering, depending on the data being
filtered. If you filter on Part Id or one of the flex fields, filtering will
affect all widgets. If you filter on event category or event
description, filtering only affects the Event Count and Duration
widget. See "Using the Filtering Parameter (page 91)". Filtering
that is not appropriate for a particular widget is ignored.
NOTE
If you change grouping parameters, the widgets will not respond and an
error message will appear. Do not change the grouping parameters
(Event Category (Col), Event Name (Col), Shift (Row)) in the default
parameter set (Dashboard – Current Shift).
The Event All Detail report template displays information on every
occurrence of events. It contains more details than the Event Detail
and Event Detail Paged report templates.
44 Rockwell Automation Publication RPTEXP-UM001H-EN-P-June 2014
Page 45

Understanding Report Templates Chapter 5
The report does not support any grouping.
NOTE
Due to a large amount of data that can be displayed with this report we
recommend that you filter your data thoroughly to shorten the report
generation time, and/or limit the number of records to be returned with
the EventDetailExtRowLimit setting (page 138) available in the
RptSetting table.
Query: EventDetailExt.
The fields of the report template grid:
Item Description
Line
Workcell
Event Category The category of the event.
Event Name The name of the event.
Event Severity The numeric severity level assigned to the event.
Start Time The date and time that the event or state started.
End Time The date and time that the event or state ended.
Duration The length of the event, calculated as the difference between start
Start Value The value collected at the start of the event.
End Value The value collected at the end of the event.
Shift Start Time The start time of the shift during which the data was collected.
A level of the plant model (which is constructed by enterprise, site,
area, line, and then work cell).
time and end time and displayed using the format
HH:MM:SS.mmm. The calculation for this field is:
Duration = End Time - Start Time.
Shift Number The number of the shift.
Shift Name The name of the shift.
Record State The numeric state of the database record.
Event During
Information whether the event occurred during the scheduled time.
Scheduled Time
Event Start Num The numeric value collected at the start of the event.
Event End Num The numeric value collected at the end of the event.
Event During Num A numeric information on the event calculated as the difference
between Event End Num and Event Start Num. The calculation for
this field is:
Event During Num = Event End Num – Event Start Num.
Rockwell Automation Publication RPTEXP-UM001H-EN-P-June 2014 45
Page 46

Chapter 5 Understanding Report Templates
Item Description
Event Is Fault Information on whether the event is used for Faults metrics.
Event Reason Code The numeric code representing the event reason.
Event Reason The string value representing the event reason.
Event Occurrence The identifier of a single event occurrence.
PartId The ID of the part that was being produced when the event
occurred.
Event Comment The wording of a comment that you have typed for an event in the
Editor (page 115).
The drillthrough hierarchy: none.
Calculations used by Report Expert to obtain values in the resulting
report:
Event Chart
• Duration = End Time - Start Time
• Event During Num = Event End Num – Event Start Num
The Event Chart report template aggregates all event-related data. It
contains a chart which displays data of the number and duration of
all events together, and links to Event Detail reports concerning
specific events.
Query: Event.
The fields of the report template grid:
Item Description
Event Count The number of events that occurred during the reporting period.
Total Duration The total time (HH:MM:SS.mmm) in the reporting period during
which an event or state was occurring.
Min. Duration The shortest event or state occurrence.
Max. Duration The longest event or state occurrence.
Avg. Duration The average length of event or state occurrences.
Detail Link to an Event Detail report referring to a specific fault, filtered to
display only faults and grouped by event name.
46 Rockwell Automation Publication RPTEXP-UM001H-EN-P-June 2014
Page 47

Understanding Report Templates Chapter 5
The values of the report template and other report templates to
which the values link using the drillthrough hierarchy:
Click a value in this column: To display this report template:
Event Count Event Chart
Total Duration Event Chart
Min. Duration Event Chart
Max. Duration Event Chart
Avg. Duration Event Chart
Detail Event Detail
The report template bar charts: Event Count and Event Duration
on separate charts, and a chart that displays both these values
together.
The bar chart fields:
Event Count and Event Duration chart fields (sorted according to
the type of sorting criteria selected):
Item Description
Values Event Count and Total Duration
X axis grouping First non-page grouping parameter
Series Second non-page grouping
Event Count chart fields (sorted by Event Count):
Item Description
Value Event Count
X axis grouping First non-page grouping parameter
Series Second non-page grouping
Event Duration fields (sorted by Total Duration):
Item Description
Value Total Duration
Rockwell Automation Publication RPTEXP-UM001H-EN-P-June 2014 47
Page 48

Chapter 5 Understanding Report Templates
Item Description
X axis grouping First non-page grouping parameter
Series Second non-page grouping
Event Configuration
The Event Configuration report template displays FactoryTalk
Metrics configuration data related to events.
Query: EventConfiguration.
The fields of the report template grid:
Item Description
Enterprise
Site
Area
Line
Work Cell
Event Category The category of the event.
Event Name The name of the event.
Machine State Name The name of the machine state associated with the event.
Severity Level The numeric severity level assigned to the event.
Fault Metric Use Defines how the event affects the calculation of Fault Metrics.
Event Trigger A textual description of the data point used as a trigger for the
Event Trigger
Expression
Event Value A text description of the data point used for the event value.
Event Value
Expression
Event Value Lookup
List Name
A level of the plant model (which is constructed by enterprise, site,
area, line, and then work cell).
event.
A FactoryTalk Transaction Manager expression used to determine
the event trigger value.
A FactoryTalk Transaction Manager expression used to determine
the event value.
A name of the value lookup list that provides descriptive names for
each event value, if there is any list associated with the event.
48 Rockwell Automation Publication RPTEXP-UM001H-EN-P-June 2014
Page 49

Understanding Report Templates Chapter 5
•
The report template supports the following:
Item Description
Event Detail
Sorting by
Site
• Area
• Line
• Work Cell
• Event Name
• Event Category
• Work Cell Ordered
The standard plant model filtering
Filtering by
• Event Name
• Event Category
• Terminology
The drillthrough hierarchy: none.
The Event Detail report template displays raw event data.
Query: EventDetail.
The fields of the report template grid:
Item Description
Start Time The date and time that the event or state started.
End Time The date and time that the event or state ended.
Duration The length of the event, calculated as the difference between start
time and end time and displayed using the format
HH:MM:SS.mmm. The calculation for this field is:
Duration = End Time - Start Time.
Start Value The value collected at the start of the event.
End Value The value collected at the end of the event.
Event Comment The wording of a comment that you have typed for an event in the
Editor (page 115).
The maximum number of rows in the resulting report: 5000.
Rockwell Automation Publication RPTEXP-UM001H-EN-P-June 2014 49
Page 50

Chapter 5 Understanding Report Templates
NOTE
If the data returned exceeds the maximum number of rows allowed in
the resulting report, the Max row limit reached message appears in
red above the grid. The maximum row number can be changed in the
RptSettings table. For details, see "Modifying the RptSetting Table (page
143)".
The drillthrough hierarchy: none.
Calculations used by Report Expert to obtain values in the resulting
report:
• Duration = End Time - Start Time
Event Detail Paged
The Event Detail Paged report template displays raw event data,
divided into pages.
Query: EventDetail.
The fields of the report template grid:
Item Description
Start Time The date and time that the event or state started.
End Time The date and time that the event or state ended.
Duration The length of the event, calculated as the difference between start
time and end time and displayed using the format
HH:MM:SS.mmm. The calculation for this field is:
Duration = End Time - Start Time.
Start Value The value collected at the start of the event.
End Value The value collected at the end of the event.
Event Comment The wording of a comment that you have typed for an event in the
Editor (page 115).
The maximum number of rows in the resulting report: 5000.
50 Rockwell Automation Publication RPTEXP-UM001H-EN-P-June 2014
Page 51

Understanding Report Templates Chapter 5
NOTE
If the data returned exceeds the maximum number of rows allowed in
the resulting report, the Max row limit reached message appears in
red above the grid. The maximum row number can be changed in the
RptSettings table. For details, see "Modifying the RptSetting Table (page
143)".
The drillthrough hierarchy: none.
Calculations used by Report Expert to obtain values in the resulting
report:
• Duration = End Time - Start Time
Event History String/Value
The Event History String and Value report templates display
row-level data from the OEEEvent table. The difference between
the reports is that the Start Value, End Value and Reporting Value
columns are displayed as either strings or values in the Event History
String and Event History Value report templates respectively.
Query: EventDetailExt.
The fields of the report template grid:
Item Description
Line
Workcell
Shift Start Time The start time of the shift during which the data was collected.
Event Occurrence The identifier of a single event occurrence.
Event Category The category of the event.
Event Name The name of the event.
Event Reason The string value representing the event reason.
Start Time The date and time that the event or state started.
End Time The date and time that the event or state ended.
Duration The length of the event, calculated as the difference between start
A level of the plant model (which is constructed by enterprise, site,
area, line, and then work cell).
time and end time and displayed using the format
HH:MM:SS.mmm. The calculation for this field is:
Duration = End Time - Start Time.
Rockwell Automation Publication RPTEXP-UM001H-EN-P-June 2014 51
Page 52

Chapter 5 Understanding Report Templates
Event Overview
Item Description
Start Value The value collected at the start of the event.
End Value The value collected at the end of the event.
Reporting Value The string value representing the event reason.
Event Severity The numeric severity level assigned to the event.
The drillthrough hierarchy: none.
Calculations used by Report Expert to obtain values in the resulting
report:
• Duration = End Time - Start Time
The Event Overview report template displays row-level data from
the OEEEvent table.
Query: EventDetailExt.
The fields of the report template grid:
Item Description
Line
Work Cell
Event Category The category of the event.
Event Name The name of the event.
Event Reason The string value representing the event reason.
Shift Start The start time of the shift during which the data was collected.
Event Occurrence
Count/Id
Start Time The date and time that the event or state started.
End Time The date and time that the event or state ended.
Total Duration The total time (HH:MM:SS.mmm) in the reporting period during
Min. Duration/Event
Severity
Max. Duration/Event
Start Num
A level of the plant model (which is constructed by enterprise, site,
area, line, and then work cell).
The number of the event occurrences (for grouping rows). / The
identifier of the single event occurrence (for detail rows).
which an event or state was occurring.
The shortest event or state occurrence (for grouping rows). / The
numeric severity level assigned to the event (for detail rows).
The longest event or state occurrence (for grouping rows). / The
numeric value collected at the start of the event (for detail rows).
52 Rockwell Automation Publication RPTEXP-UM001H-EN-P-June 2014
Page 53

Item Description
Understanding Report Templates Chapter 5
Event Summary
Avg. Duration/Event
End Num
The average length of event or state occurrences (for grouping
rows) / The numeric value collected at the end of the event (for
detail rows).
The drillthrough hierarchy: none.
The Event Summary report template displays aggregated event data.
This report template allows you to determine how often and for
how long events occurred during the manufacturing process.
Query: Event.
The fields of the report template grid:
Item Description
Event Count The number of events that occurred during the reporting period.
Total Duration The total time (HH:MM:SS.mmm) in the reporting period during
which an event or state was occurring.
Min. Duration The shortest event or state occurrence.
Max. Duration The longest event or state occurrence.
Avg. Duration The average length of event or state occurrences.
Detail Link to an Event Detail report for the selected event.
The values of the report template and other report templates to
which the values link using the drillthrough hierarchy:
Click a value in this column: To display this report template:
Event Count Event Summary
Total Duration Event Summary
Min. Duration Event Summary
Max. Duration Event Summary
Avg. Duration Event Summary
Detail Event Detail
The report template bar charts: Event Count and Total Duration.
Rockwell Automation Publication RPTEXP-UM001H-EN-P-June 2014 53
Page 54

Chapter 5 Understanding Report Templates
The bar chart fields:
Event Count chart fields:
Item Description
Value Event Count
X axis grouping First non-page grouping parameter
Series Second non-page grouping
Total Duration chart fields:
Item Description
Value Total Duration
X axis grouping First non-page grouping parameter
Series Second non-page grouping
Fault
The Fault report template displays aggregated data related to faults
of the machinery. It allows you to assess how often and for how long
the faults occurred during the manufacturing process, and provides
links to Event Summary reports concerning faults for a specific work
cell.
Query: Performance.
The fields of the report template grid:
Item Description
Running Time The number of seconds the machine was in a running state.
Fault Time The time when the fault occurred.
Fault Count The number of faults that occurred in the reporting period.
54 Rockwell Automation Publication RPTEXP-UM001H-EN-P-June 2014
Page 55

Faults per Hour = Faults Count ⁄ Uptime
Fault % = FaultTime / Uptime
Item Description
Understanding Report Templates Chapter 5
MTBF
(Mean Time Between
Failures)
MTBF = Uptime ⁄ FaultCount
Mean Time Between Failure (MTBF) is the ratio of running time to
the total number of failures. It measures the average amount of
time when a piece of equipment was in a running state between
failures. MTBF is a derived field that contains aggregate functions
and, as such, can only be used in summary report objects and
cannot have aggregate functions applied.
MTTR
(Mean Time To
Repair)
MTTR = FaultTime ⁄ FaultCount
Mean Time to Repair (MTTR) is the ratio of the time spent in a
failure state to the total number of failures. It measures the average
amount of time when a piece of equipment was in a failure state.
MTTR is a derived field that contains aggregate functions and, as
such, can only be used in summary report objects and cannot have
aggregate functions applied.
Faults per Hour
The average amount of faults per hour during the reporting period.
Fault %
The percentage of time the machine spent in a fault state.
Detail Link to an Event Summary report referring to a specific fault,
filtered to display only faults and grouped by event name.
Rockwell Automation Publication RPTEXP-UM001H-EN-P-June 2014 55
The values of the report template and other report templates to
which the values link using the drillthrough hierarchy:
Click a value in this column: To display this report template:
Running Time Fault (grouped by the next value in the
drillthrough hierarchy)
Fault Time
Fault Count
MTBF
MTTR
Faults per Hour
Fault %
Detail Event Summary
The report template bar charts: MTBF and MTTR.
Page 56

Chapter 5 Understanding Report Templates
The bar chart fields:
MTBF chart fields:
Item Description
Value MTBF (in hours)
X axis grouping First non-page grouping parameter
Series Second non-page grouping
MTTR chart fields:
Item Description
Value MTTR (in minutes)
X axis grouping First non-page grouping parameter
Series Second non-page grouping
Performance
Calculations used by Report Expert to obtain values in the resulting
report:
• MTBF = Uptime ⁄ FaultCount
• MTTR = FaultTime ⁄ FaultCount
• Faults per Hour = Faults Count ⁄ Uptime
• Fault % = FaultTime / Uptime
The Performance report template provides the OEE (Overall
Equipment Effectiveness) rating that can be used to assess a single
machine’s performance over time or to compare the performance of
machines to each other.
Query: Performance.
56 Rockwell Automation Publication RPTEXP-UM001H-EN-P-June 2014
Page 57

Understanding Report Templates Chapter 5
The fields of the report template grid:
Item Description
Uptime % The percentage of available time that the machine was actually
running. The calculation for this field is:
Uptime % = RunningTime/AvailableTime.
Throughput % The performance of a machine when it is running compared to its
ideal cycle time. The ideal cycle time depends upon the product
being produced and is measured in units of seconds per part. The
calculation for this field is:
Throughput = (TotalParts x IdealCycleTime) / Running Time.
Quality % The percentage of total parts produced that were of good quality.
The calculation for this field is:
Quality % = GoodParts / Total Parts.
OEE % The product of Uptime, Throughput, and Quality. The calculation for
this field is:
OEE % = Uptime x Throughput x Quality.
The values of the report template and other report templates to
which the values link using the drillthrough hierarchy:
Click a value in this column: To display this report template:
Uptime % Uptime
Throughput % Throughput
Quality % Quality
OEE % Performance
The report template bar charts: OEE %.
The bar chart fields:
Item Description
Value OEE %
X axis grouping First non-page grouping parameter
Series Second non-page grouping
Rockwell Automation Publication RPTEXP-UM001H-EN-P-June 2014 57
Page 58

Chapter 5 Understanding Report Templates
Calculations used by Report Expert to obtain values in the resulting
report:
• Uptime % = RunningTime/AvailableTime
• Throughput % = (TotalParts x IdealCycleTime) /
RunningTime
• Quality % = GoodParts / Total Parts
• OEE % = Uptime x Throughput x Quality
Or:
This reduces to:
NOTE
Typically, the OEE calculation will be performed over a time range with
numerous IdealCycleTime values. In this case, the calculation is done for
each unique IdealCycleTime using the GoodParts and AvailableTime
during that IdealCycleTime. Each individual calculation is then
multiplied by its fraction of the TotalAvailableTime
(AvailableTime/TotalAvailableTime) and then summed together.
The following formula illustrates the calculation with multiple
IdealCycleTimes:
where:
• ICT = IdealCycleTime
• GP = GoodParts
58 Rockwell Automation Publication RPTEXP-UM001H-EN-P-June 2014
Page 59

• A = AvailableTime
Understanding Report Templates Chapter 5
Production
If you group a report by work cell, using the Production report
template allows you to determine the production success of a single
work cell or to compare the production successes of multiple work
cells.
Query: Performance.
The fields of the report template grid:
Item Description
Good Parts The number of good parts produced.
Scrap Parts The number of parts rejected due to poor quality.
Total Parts The total number of parts produced.
Ideal Parts The total number of parts that could have been produced in the
available time. The calculation for this field is:
IdealParts = AvailableTime / IdealCycleTime.
Ideal % A measurement of how close the activity area was to ideal
performance. The calculation for this field is:
Ideal % = GoodParts / IdealParts. It calculates the percentage of the
ideal part count that was actually produced.
Scrap % The percentage of total parts produced that were rejected due to
poor quality. The calculation for this field is:
Scrap % = ScrapParts / TotalParts.
Running Time The number of seconds the machine was in a running state.
Uptime % The percentage of available time that the machine was actually
running. The calculation for this field is:
Uptime % = RunningTime/AvailableTime.
The values of the report template and other report templates to
which the values link using the drillthrough hierarchy:
Click a value in this column: To display this report template:
Good Parts Production
Scrap Parts Quality
Total Parts Production
Rockwell Automation Publication RPTEXP-UM001H-EN-P-June 2014 59
Page 60

Chapter 5 Understanding Report Templates
Click a value in this column: To display this report template:
Ideal Parts Production
Ideal % Production
Scrap % Production
Running Time Production
Uptime % Uptime
The report template bar charts: Good Parts vs. Ideal Parts.
The bar chart fields:
Item Description
Value Good Parts, Ideal Parts
X axis grouping First non-page grouping parameter
Series Second non-page grouping
Production Overview
Calculations used by Report Expert to obtain values in the resulting
report:
• IdealParts = AvailableTime / IdealCycleTime
• Ideal % = GoodParts / IdealParts
• Scrap % = ScrapParts / TotalParts
• Uptime % = RunningTime / AvailableTime
The Production Overview report template displays overall
performance of machines, aggregating data related to quality, time
and performance.
Query: Performance
60 Rockwell Automation Publication RPTEXP-UM001H-EN-P-June 2014
Page 61

Understanding Report Templates Chapter 5
The fields of the report template grid:
Item Description
Uptime % The percentage of available time that the machine was actually
running. The calculation for this field is:
Uptime % = RunningTime/AvailableTime.
Throughput % The performance of a machine when it is running compared to its
ideal cycle time. The ideal cycle time depends upon the product
being produced and is measured in units of seconds per part. The
calculation for this field is:
Throughput = (TotalParts x IdealCycleTime) / Running Time.
Quality % The percentage of total parts produced that were of good quality.
The calculation for this field is:
Quality % = GoodParts / Total Parts.
OEE % The product of Uptime, Throughput, and Quality. The calculation for
this field is:
OEE % = Uptime x Throughput x Quality.
Available Time It may be defined by a schedule or by information from the control
system. Available time may be impacted by scheduled unavailable
time and by the use of Monitored Availability in the work cell's
configuration.
Downtime The amount of time the machine was available, but was not
running. The calculation for this field is:
DownTime = AvailableTime - RunningTime.
Running Time The number of seconds the machine was in a running state.
Good Parts The number of good parts produced.
Scrap Parts The number of parts rejected due to poor quality.
Total Parts The total number of parts produced.
Ideal Parts The total number of parts that could have been produced in the
available time. The calculation for this field is:
IdealParts = AvailableTime / IdealCycleTime.
Scheduled
Unavailable Time
Faults The number of fault states.
TEEP (Total Effective Equipment Productivity (or Total Capacity).) A Key
The scheduled unavailable time as defined by the work cell
schedule.
Performance Indicator (KPI) that is similar to the OEE calculation,
but it uses Total Time instead of Available Time in the calculation:
TEEP = (Good Parts * Ideal Cycle Time)/Total Time
TEEP = OEE*(Available Time/Total Time).
Rockwell Automation Publication RPTEXP-UM001H-EN-P-June 2014 61
Page 62

Chapter 5 Understanding Report Templates
The values of the report template and other report templates to
which the values link using the drillthrough hierarchy:
Click a value in this column: To display this report template:
Uptime % Uptime
Throughput % Throughput
Quality % Quality
OEE % Performance
Available Time Production Overview
Downtime Production Overview
Running Time Production Overview
Good Parts Production Overview
Scrap Parts Production Overview
Total Parts Production
Ideal Parts Production
Scheduled Unavailable Time Production Overview
Faults Fault
TEEP Performance
The report template bar charts: Production Overview Chart.
The bar chart fields:
Item Description
Value Uptime %, Throughput %, Quality %, OEE %
X axis grouping First non-page grouping parameter
Series Second non-page grouping
Calculations used by Report Expert to obtain values in the resulting
report:
• Uptime % = RunningTime/AvailableTime
• Throughput = (TotalParts x IdealCycleTime) / Running Time
• Quality % = GoodParts / Total Parts
62 Rockwell Automation Publication RPTEXP-UM001H-EN-P-June 2014
Page 63

Understanding Report Templates Chapter 5
• OEE % = Uptime x Throughput x Quality
• DownTime = AvailableTime - RunningTime
• IdealParts = AvailableTime / IdealCycleTime
• TEEP = (Good Parts * Ideal Cycle Time)/Total Time
• TEEP = OEE*(Available Time/Total Time)
Quality
The Quality report template allows you to assess the quality of the
parts that have been produced.
Query: Performance
The fields of the report template grid:
Item Description
Good Parts The number of good parts produced.
Scrap Parts The number of parts rejected due to poor quality.
Quality % The percentage of total parts produced that were of good quality.
The calculation for this field is:
Quality % = GoodParts / Total Parts.
The values of the report template and other report templates to
which the values link using the drillthrough hierarchy:
Click a value in this column: To display this report template:
Good Parts Quality (grouped by the next value in the
Scrap Parts
drillthrough hierarchy)
Quality %
The report template bar charts: Quality %.
Rockwell Automation Publication RPTEXP-UM001H-EN-P-June 2014 63
Page 64

Chapter 5 Understanding Report Templates
The bar chart fields:
Item Description
Value Quality %
X axis grouping First non-page grouping parameter
Series Second non-page grouping
Calculations used by Report Expert to obtain values in the resulting
report:
• Quality = GoodParts / TotalParts
Root Cause Analysis
The Root Cause Analysis report template consists of a Gantt chart
displaying work cell state occurrences over time. The chart will
display the work cells in the order specified in the Line Order (page
164) tab. Below the Gantt chart for each line is a table of data
showing the same data used in the chart.
Query: State Detail.
The fields of the report template grid:
Item Description
Work Cell A level of the plant model (which is constructed by enterprise, site,
area, line, and then work cell).
Shift The shift during which the data was collected.
Shift Start The start time of the shift during which the data was collected.
State Name The machine state. This field is color coded.
Start Time The date and time that the event or state started.
End Time The date and time that the event or state ended.
Duration The length of the event, calculated as the difference between start
time and end time and displayed using the format
HH:MM:SS.mmm. The calculation for this field is:
Duration = End Time - Start Time.
The maximum number of rows in the resulting report: 1000.
64 Rockwell Automation Publication RPTEXP-UM001H-EN-P-June 2014
Page 65

Understanding Report Templates Chapter 5
NOTE
If the data returned exceeds the maximum number of rows allowed in
the resulting report, the Max row limit reached message appears in
red above the grid. The maximum row number can be changed in the
RptSettings table. For details, see "Modifying the RptSetting Table (page
143)".
The report template has one hard-coded grouping with one page
group (line) and four row groups (Work cell, Shift Start, State, and
PartId).
The report template has six control buttons. Each adjusts the
parameter set time window of the state data displayed:
Item Description
<< Scroll left 1 Decreases the parameter set time start and end by the difference
between end and start.
< Scroll left 1/4 Decreases the parameter set time start and end by 1/4 the
difference between end and start.
>> Scroll right 1 Increases the parameter set time start and end by the difference
between end and start.
> Scroll right 1/4 Increases the parameter set time start and end by 1/4 the
difference between end and start.
Zoom In Zooms in 50%. Increases the parameter set time start and
decreases the parameter set time end by 1/4 the difference
between end and start.
Zoom Out Zooms out 2X. Decreases the parameter set time start and increases
the parameter set time end by 1/2 the difference between end and
start.
The drillthrough hierarchy: none.
Calculations used by Report Expert to obtain values in the resulting
report:
• Duration = End Time - Start Time
State Detail
Rockwell Automation Publication RPTEXP-UM001H-EN-P-June 2014 65
Page 66

Chapter 5 Understanding Report Templates
The State Detail report template displays detailed state information
including work cell, shift start, state name, start time, end time, and
duration.
Query: State Detail.
The fields of the report template grid:
Item Description
Work Cell A level of the plant model (which is constructed by enterprise, site,
area, line, and then work cell).
Shift The shift during which the data was collected.
Shift Start The start time of the shift during which the data was collected.
State Name The machine state. This field is color coded.
Start Time The date and time that the event or state started.
End Time The date and time that the event or state ended.
Duration The length of the event, calculated as the difference between start
time and end time and displayed using the format
HH:MM:SS.mmm. The calculation for this field is:
Duration = End Time - Start Time.
The maximum number of rows in the resulting report: 1000.
NOTE
If the data returned exceeds the maximum number of rows allowed in
the resulting report, the Max row limit reached message appears in
red above the grid. The maximum row number can be changed in the
RptSettings table. For details, see "Modifying the RptSetting Table (page
143)".
The report template has one hard-coded grouping with one page
group (line) and four row groups (Work cell, Shift Start, State, and
PartId).
66 Rockwell Automation Publication RPTEXP-UM001H-EN-P-June 2014
Page 67

Understanding Report Templates Chapter 5
The drillthrough hierarchy: none.
Calculations used by Report Expert to obtain values in the resulting
report:
• Duration = End Time - Start Time
State Summary
The State Summary report template displays aggregated state data.
This report template allows you to determine how often and for
how long states occurred during the manufacturing process.
Query: State Summary
The fields of the report template grid:
Item Description
State Count The number of states that occurred during the reporting period.
Total Duration The total time (HH:MM:SS.mmm) in the reporting period during
which an event or state was occurring.
Min Duration The shortest event or state occurrence.
Max Duration The longest event or state occurrence.
Avg. Duration The average length of event or state occurrences.
Detail Link to a State Detail report for the selected state.
The values of the report template and other report templates to
which the values link using the drillthrough hierarchy:
Click a value in this column: To display this report template:
State Count State Summary (grouped by the next value
Total Duration
in the drillthrough hierarchy)
Min Duration
Max Duration
Avg. Duration
Detail State Detail
The report template bar charts: State Count and Total Duration.
Rockwell Automation Publication RPTEXP-UM001H-EN-P-June 2014 67
Page 68

Chapter 5 Understanding Report Templates
The bar chart fields:
State Count chart fields:
Item Description
Value State Count
X axis grouping First non-page grouping parameter
Series Second non-page grouping
Total Duration chart fields:
Item Description
Value Total Duration
X axis grouping First non-page grouping parameter
Series Second non-page grouping
Throughput
The Throughput report template allows you to assess the
performance of a machine as compared to its ideal cycle time. The
ideal cycle time will depend upon the product being produced and is
measured in units of seconds per part.
Query: Performance.
The fields of the report template grid:
Item Description
Total Parts The total number of parts produced.
Running Time The number of seconds the machine was in a running state.
Realized Cycle Time The actual amount of time it took to produce a part. This value is a
ratio of running time to the total number of parts produced. The
calculation for this field is:
RealizedCycleTime = RunningTime / TotalParts.
68 Rockwell Automation Publication RPTEXP-UM001H-EN-P-June 2014
Page 69

Understanding Report Templates Chapter 5
ideal amount of time it should take to produce a part and the actual
Item Description
Cycle Time Diff. The difference, represented by a negative number, between the
amount of time it took to produce parts. Better cycle time
differences are indicated by a lower negative number. The
calculation for this field is:
CycleTimeDifference = IdealCycleTime - RealizedCycleTime.
Cycle Time Diff. % The Cycle Time Difference as a percentage of the Ideal Cycle Time.
The calculation for this field is:
CycleTimeDiff% = -CycleTimeDifference / IdealCycleTime.
Throughput % The performance of a machine when it is running compared to its
ideal cycle time. The ideal cycle time depends upon the product
being produced and is measured in units of seconds per part. The
calculation for this field is:
Throughput = (TotalParts x IdealCycleTime) / Running Time.
The values of the report template and other report templates to
which the values link using the drillthrough hierarchy:
Click a value in this column: To display this report template:
Total Parts Production
Running Time Uptime
Realized Cycle Time Throughput (grouped by the next value in
Cycle Time Diff.
the drillthrough hierarchy)
Cycle Time Diff. %
Throughput %
The report template bar charts: a horizontal bar chart showing
Throughput % and a line chart showing Realized vs. Ideal Cycle
Time.
The bar chart fields:
Rockwell Automation Publication RPTEXP-UM001H-EN-P-June 2014 69
Page 70

Chapter 5 Understanding Report Templates
Throughput % chart fields:
Item Description
Value Throughput %
X axis grouping First non-page grouping parameter
Series Second non-page grouping
Realized vs. Ideal Cycle Time chart fields:
Item Description
Value Realized Cycle Time, Ideal Cycle Time
X axis grouping First non-page grouping parameter
Series Second non-page grouping
Calculations used by Report Expert to obtain values in the resulting
report:
Uptime
• RealizedCycleTime = RunningTime / TotalParts
• CycleTimeDiff = IdealCycleTime - RealizedCycleTime
• CycleTimeDiff% = -CycleTimeDifference / IdealCycleTime
• Throughput% = (TotalParts x IdealCycleTime) / Running
Time
The Uptime report template allows you to assess the production
availability of one or more activity areas. Uptime is a ratio of
running time to available time. Available time may be defined by a
schedule or modified by planned downtime events such as
preventive maintenance. Available time may also be modified by
events such as being starved for parts or being blocked by a
downstream process.
Query: Performance
70 Rockwell Automation Publication RPTEXP-UM001H-EN-P-June 2014
Page 71

Understanding Report Templates Chapter 5
The fields of the report template grid:
Item Description
Running Time The number of seconds the machine was in a running state.
Available Time It may be defined by a schedule or by information from the control
system. Available time may be impacted by scheduled unavailable
time and by the use of Monitored Availability in the work cell's
configuration.
Downtime The amount of time the machine was available, but was not
running. The calculation for this field is:
DownTime = AvailableTime - RunningTime.
Uptime % The percentage of available time that the machine was actually
running. The calculation for this field is:
Uptime % = RunningTime/AvailableTime.
The values of the report template and other report templates to
which the values link using the drillthrough hierarchy:
Click a value in this column: To display this report template:
Running Time Uptime (grouped by the next value in the
Available Time
drillthrough hierarchy)
Downtime
Uptime %
The report template bar charts: Uptime %.
The bar chart fields:
Item Description
Value Uptime %
X axis grouping First non-page grouping parameter
Series Second non-page grouping
Calculations used by Report Expert to obtain values in the resulting
report:
• DownTime = AvailableTime - RunningTime
Rockwell Automation Publication RPTEXP-UM001H-EN-P-June 2014 71
Page 72

Chapter 5 Understanding Report Templates
• Uptime % = RunningTime/AvailableTime
Query Fields
The following table lists the report templates, the queries those
report templates use, and the fields contained in each of the queries.
This report
template:
Event All Detail EventDetailExt
Uses this query:
That contains these query
fields:
• Event Category
• Event Comment
• Event Duration
• Event During Num
• Event During Scheduled Time
• Event End Num
• Event End Time
• Event End Value
• Event Is Fault
• Event Name
• Event Reason
• Event Reason Code
• Event Severity
• Event Start Num
• Event Start Time
• Event Start Value
• Flex 1 -5
• Line
• IOccurrenceEventId
• IOEEConfigEventId
• Record Start
• Shift
• Shift Number
• Shift Start
• Work Cell Ordered
• Work Cell
Event Detail
EventDetail
• Event Start Time
Event Detail Paged
72 Rockwell Automation Publication RPTEXP-UM001H-EN-P-June 2014
Page 73

This report
template:
Uses this query:
Understanding Report Templates Chapter 5
That contains these query
fields:
• Event End Time
• Event Duration
• Event Start Value
• Event End Value
• Event Occurrence
• Event During Num
• Event Start Num
• Event End Num
• Event Comment
• Sequence
• Row Group 1 - 5
• Page Group 1 - 5
Event Chart
Event
Event Summary
Event Configuration EventConfiguration
• Column Group 1 - 5
• Event Count
• Duration
• Minimum Duration
• Maximum Duration
• Average Duration
• Work Cell Ordered
• Column Group 1 - 5
• Row Group 1 - 5
• Page Group 1 - 5
• Enterprise
• Site
• Area
• Line
• Workcell
• ConfigWorkcellId
• ConfigEventId
• EventName
• EventCategory
• SeverityLevel
Rockwell Automation Publication RPTEXP-UM001H-EN-P-June 2014 73
Page 74

Chapter 5 Understanding Report Templates
This report
template:
Uses this query:
That contains these query
fields:
• UnschedDatapoint4EventTrigger
• FTTMExpr4EventTriggerValue
• FaultMetricUse
• Datapoint4EventValue
• FTTMExpr4EventValue
• EventValueLookupListName
• MachineStateId
• MachineStateName
Fault
Performance
Production
Production Overview
Quality
Throughput
Uptime
Performance
• Available Time
• Column Group 1 - 5
• Cycle Time Difference
• Cycle Time Difference %
• Down Time
• Failure Frequency Rate
• Failure Rate
• Fault Time
• Faults
• Good Parts
• Ideal Cycle Time
• Ideal Parts
• Monitored Unavailable Time
• MTBF (Mean Time Between
Failure)
• MTTR (Mean Time To Repair)
• OEE%
• Page Group 1 - 5
• Percent Ideal Parts
• Percent Scrap Parts
• Quality %
• Realized Cycle Time
• Row Group 1 - 5
• Running Time
• Schedule Capacity
74 Rockwell Automation Publication RPTEXP-UM001H-EN-P-June 2014
Page 75

This report
template:
Uses this query:
Understanding Report Templates Chapter 5
That contains these query
fields:
• Schedule Unavailable Time
• Scheduled Available Time
• Scrap Parts
• Throughput%
• Total Capacity
• Total Parts
• Total Time
• Uptime %
• Work Cell Ordered
Root Cause Analysis
State Detail
State Detail
State Summary State Summary
• Date
• Good Parts
• Hour
• Line
• Month
• Scrap Parts
• Shift
• Shift Number
• Shift Start
• State Name
• State Id
• Total Parts
• Week
• Work Cell
• Work Cell Ordered
• Average Duration
• Column Group 1 - 5
• Duration
• Maximum Duration
• Minimum Duration
• Page Group 1 - 5
• Row Group 1 - 5
• State Count
Rockwell Automation Publication RPTEXP-UM001H-EN-P-June 2014 75
Page 76

Chapter 5 Understanding Report Templates
This report
template:
Uses this query:
That contains these query
fields:
• Work Cell Ordered
Raw Data
The following table displays the source of all raw data used by
Report Expert. The data is contained in the RSBizWare database to
which Report Expert connects.
Data Table.Field
Available Time OEEWorkcell.dAvailSec
Fault Occurrences OEEFaultMetricData.lFaultCount
Fault Time OEEFaultMetricData.dFaultSeconds
Good Parts OEEWorkcell.dPartCount
Ideal Cycle Time OEEWorkcell.dIdealCycleTime
Running Time OEEWorkcell.dRunSec
Scrap Parts OEEWorkcell.dScrapParts
Total Parts OEEWorkcell.dTotalParts
76 Rockwell Automation Publication RPTEXP-UM001H-EN-P-June 2014
Page 77

Chapter 6
Understanding Parameter Sets
A parameter set consists of a collection of parameters that, when
applied to a report template, can change the appearance and filter
the content of the resulting report. With different parameter sets, a
single report template can produce a wide range of reports. Report
Expert includes a number of default parameter sets that you can
modify or create others.
Using the Date / Time / Shift Parameter
In this chapter you will learn about parameter sets that are available
with Report Expert.
You will use this information to generate reports and create your
own parameter sets. See "Viewing and Generating Reports (page
97)" for details.
To properly define a parameter set, you must understand how each
of the parameter set controls is used. The following subsections
describe each of the controls.
The parameter sets are displayed on the Parameters and Editor pages
of Report Expert.
NOTE
Administrators can configure which parameters sets are displayed. See
"Configuring Parameter Sets (page 154)" for details.
The Date/Time/Shift parameter allows you to specify or change the
date/time and shift properties associated with a parameter set.
When you apply these settings to a report, they are used to select
only the data with the specified dates/times and shifts.
Rockwell Automation Publication RPTEXP-UM001H-EN-P-June 2014 77
Page 78

Chapter 6 Understanding Parameter Sets
Start and End Times
All records in the FactoryTalk Metrics database contain a start time
and an end time. The Date/Time selections you make in Report
Expert use the start time from those database records.
Some data from the database (for example, the OEEWorkcell table
data that is used in the Performance, Production, Quality,
Throughput, and Uptime reports) is returned in 10 minute
increments. In this case, the start and end times (without dates to
simplify this example) of the resulting database records would be:
Database record: Start time: End time:
1 8:00 AM 8:10 AM
2 8:10 AM 8:20 AM
3 8:20 AM 8:30 AM
4 8:30 AM 8:40 AM
5 8:40 AM 8:50 AM
6 8:50 AM 9:00 AM
7 9:00 AM 9:10 AM
When you apply the Date/Time filter in Report Expert, only
complete database records are returned. Therefore, the data returned
may not match the parameter set’s Date/Time.
78 Rockwell Automation Publication RPTEXP-UM001H-EN-P-June 2014
Page 79

Understanding Parameter Sets Chapter 6
The Start and End date fields must specify a date with the following
he Start and End time fields must specify a time with the following
For example, for the start and end times above, the following records
would be returned:
Selecting Date/Time
Date/Time selection: Returns records:
Containing data from this
time:
8:00 AM to 9:00 AM 1 - 6 above 8:00 AM to 9:00 AM
8:05 AM. to 9:00 AM 2 - 6 above 8:10 AM. to 9:00 AM
8:00 AM to 9:05 AM 1 - 6 above 8:00 AM to 9:00 AM
8:01 AM to 8:09 AM none none
There are six different ways to specify the values of the date/time
properties; to select one, click the appropriate button and then type
any additional information.
Click this button: To:
All Time
Specify Time
Range with Start and
End Dates
Include all data in the database. We generally recommend that you
do not select All Time unless you also select Current Shift.
For performance reasons, Report Expert limits the number of
database rows returned by a query in the Event Detail, Root Cause
Analysis, and State Detail reports. Due to this limit, in most cases,
All Time will not return all data in these reports.
Specify that you want to view all information that was recorded
between a specified start and end date and time.
To specify the required time interval, you must complete the Start
and End date fields and the Start and End time fields.
Rockwell Automation Publication RPTEXP-UM001H-EN-P-June 2014 79
format: MM/DD/YYYY, where leading 0's in the month and day are
optional (for example 4/1/2007). The following shortcut keys are
available to quickly type a date: [t] to type today's date, [up arrow]
for the next date, [down arrow] for the previous date, [page up] for
the next month, [page down] for the previous month, and [c] to
access the calendar date picker. You can also access the calendar
date picker by clicking the calendar icon.
T
format: hh:mm:ss [AM or PM], where leading 0's in the hour are
optional (for example 1:23:00 AM). The following shortcut keys are
available to quickly type a date: Ctrl + [n] to type the current time,
Page 80

Chapter 6 Understanding Parameter Sets
Click this button: To:
[up arrow] for the next minute, [down arrow] for the previous
minute, [page up] for the next hour, [page down] for the previous
hour.
If you do not specify a start time, 0:00:00 a.m. (midnight) is used. If
you do not specify an end time, 0:00:00 a.m. (midnight) of the next
day is used. For example, if you select 1/12/2008, Report Expert
uses 2/12/2008 0:00:00 a.m.
You can type an end date/time that is in the future.
Specify Time
Span Ending Now
Specify Time
Span Ending on End
Date
Specify that you want to view all information that was recorded
during a specified time interval (in the past) through the current
date and time.
You must specify a time interval:
In the first Past field you must specify a number and in the second
Past field you must type a time value (in seconds, minutes, and so
on). Together, these two fields specify the length of the time
interval.
Specifying the time span can be useful for saved parameter sets
because the time span always applies. For example, the past 24
hours is always a valid time filter.
Specify that you want to view all information that was recorded
during a specified time interval (in the past) through a specified
end date and time.
To specify the required time interval, in the first Past field, type a
number; then click the drop-down arrow to select a time value
(seconds, minutes, and so on). Together, these two fields specify
the length of the time interval. You must also complete the End
date field and the End time field.
The Past field must specify a number and the Past list must contain
a time value (seconds, minutes, and so on). Together, these two
fields specify the length of the time interval.
The End date field must specify a date with the following format:
MM/DD/YYYY, where leading 0s in the month and day are optional
80 Rockwell Automation Publication RPTEXP-UM001H-EN-P-June 2014
Page 81

The Next field must specify a number and the Next list must contain
Click this button: To:
(for example 4/1/2007). The following shortcut keys are available
to quickly type a date: [t] to type today's date, [up arrow] for the
next date, [down arrow] for the previous date, [page up] for the
next month, [page down] for the previous month, and [c] to access
the calendar date picker. You can also access the calendar date
picker by clicking the calendar icon.
The End time field must specify a time with the following format:
hh:mm:ss [AM or PM], where leading 0s in the hour are optional
(for example 1:23:00 AM). The following shortcut keys are available
to quickly type time: Ctrl + [n] to type the current time, [up arrow]
for the next minute, [down arrow] for the previous minute, [page
up] for the next hour, [page down] for the previous hour.
Specifying the time span can be useful for saved parameter sets
because the time span always applies. For example, the past 24
hours is always a valid time filter.
Specify Time
Span Starting on
Start Date
Specify that you want to view all information that was recorded
during a specified time interval (in the past) from a specified start
date and time.
To specify the required time interval, in the Next field, type a
number; then click the drop-down arrow to select a time value
(seconds, minutes, and so on). Together, these two fields specify
the length of the time interval. You must also complete the Start
date field and the Start time field.
Understanding Parameter Sets Chapter 6
Rockwell Automation Publication RPTEXP-UM001H-EN-P-June 2014 81
a time value (seconds, minutes, and so on). Together, these two
fields specify the length of the time interval.
The Start date field must specify a date with the following format:
MM/DD/YYYY, where leading 0s in the month and day are optional
(for example 4/1/2007). The following shortcut keys are available
to quickly type a date: [t] to type today's date, [up arrow] for the
next date, [down arrow] for the previous date, [page up] for the
next month, [page down] for the previous month, and [c] to access
the calendar date picker. You can also access the calendar date
picker by clicking the calendar icon.
The Start time field must specify a time with the following format:
hh:mm:ss [AM or PM], where leading 0s in the hour are optional
(for example 1:23:00 AM). The following shortcut keys are available
to quickly type time: Ctrl + [n] to type the current time, [up arrow]
for the next minute, [down arrow] for the previous minute, [page
up] for the next hour, [page down] for the previous hour.
Page 82

Chapter 6 Understanding Parameter Sets
For example, let’s assume that Shift 1 runs from 7:00 a.m. until 3:00
Click this button: To:
Selecting Shift
Specify
Named Date Range
Specify that you want to view all information that was recorded
during a specified named date range.
Named Date Ranges are useful for saved parameter sets because
they are always current. For example, a date filter of "Yesterday"
always returns yesterday's data, no matter when you run the
report.
For each of the Date/Time options above (see "Selecting Date/Time
(page 79)"), you can filter the resulting data on Shift.
Item Description
A specific shift The Shift drop-down list in each of the Date/Time/Shift options
contains a list of shift names from the FactoryTalk Metrics database.
Select one or more specific shifts to filter the report data.
Note: The Shift list contains all shifts from the database, and it is
possible to select a shift that will not return any data. For example,
you could select one or more work cells in the Plant Model
parameter that do not use the selected shift, or you could select a
time period that does not contain data from the selected shift.
Current Shift Current Shift returns data from the currently running shift. It will
not return data from any time period in the past when a shift has
already completed.
All Data is returned for all shifts.
82 Rockwell Automation Publication RPTEXP-UM001H-EN-P-June 2014
p.m., Shift 2 runs from 3:00 p.m. until 11:00 p.m., and Current Shift
is selected in a parameter set. A report you run at 9:00 a.m. will
return data collected that day between 7:00 a.m. and 9:00 a.m. If
you run a report at 2:00 p.m., the report will return data collected
that day between 7:00 a.m. and 2:00 p.m. If you run a report at
4:00 p.m., it will return data collected that day between 3:00 p.m.
and 4:00 p.m. Each work cell may have a different shift schedule, so
the current shift time frame may differ as well.
Note: If you select Current Shift along with Last Shift selected as
the date range, you will get data records from both the last
completed shift, and the current one.
Page 83

Item Description
Understanding Parameter Sets Chapter 6
TIP
You can filter your data based on multiple shifts. For example, if you
select Shift 1 and 2 as field values for filtering, your report will return
data on Shift 1 and 2.
Select the Use Shift Start check box if you wish to filter data by shift
start, instead of the start and end time of each record. If you specify a
period of time for a report (see Selecting Date/Time (page 79)),
Report Expert will return data records of shifts started in the given
period, instead of records containing start and end time which
belong to this period).
For example, let's assume that Shift 1 runs from 6:00 a.m. until 2:00
p.m., Shift 2 runs from 2:00 p.m. until 10:00 p.m., and Shift3 runs
from 10.00 p.m. until 6:00 a.m. the next day. If you set Data Range
to Yesterday and select the Use Shift Start check box, Report Expert
will return data collected between 6 a.m. the day before and 6.a.m.
that day. Data records collected during Shift3 have the date of the
current day, but their start of shift has the date of the day before, and
therefore they also appear in the results.
Using the Grouping Parameter
The Grouping parameter allows you to create one or more grouping
filters that specify how the information in a report will be combined
and physically arranged.
Each row in the Grouping parameter consists of:
• A grouping field list (page 85).
Rockwell Automation Publication RPTEXP-UM001H-EN-P-June 2014 83
Page 84

Chapter 6 Understanding Parameter Sets
• A grouping type list (page 85).
• A grouping expansion type icon (page 87).
• A removal icon (page 88).
When you create a grouping filter, you must specify the field that
will be used to group the information and the grouping type.
The maximum number of fields/groups available is:
• 5 group fields
• 3 row groups
• 2 column groups
• 1 page group.
NOTE
The Event Detail, Event Detail Paged, Root Cause Analysis, and
State Detail reports do not respond to user groupings. However,
the Root Cause Analysis and State Detail reports have one
hard-coded grouping with one page group (line) and four row
groups (Work Cell, Shift Start, State, and PartId).
Data aggregation for each grouping is done sequentially (1 through
5). When groupings are in the parameter set, aggregations are done
for:
1. 0 groupings (grand totals)
2. Grouping 1
3. Grouping 1, 2
4. Grouping 1, 2, 3...
5. Etc.
An aggregation is not done for grouping 1, 3, or just grouping 3.
This is not a concern until you mix row and column groupings.
when there is a mix, you can expand group 3 before you expand
group 2.
84 Rockwell Automation Publication RPTEXP-UM001H-EN-P-June 2014
Page 85

Understanding Parameter Sets Chapter 6
For example, you might group the Performance report by Work
Cell, Shift, and Part. This allows you to see OEE for everything,
OEE for each work cell, OEE for each shift for each work cell, and
OEE for each part within each shift for each work cell. This would
not allow you to see OEE for each part for each work cell. To do
that, you would have to order the grouping by Work Cell, Part, and
then Shift.
Selecting the Grouping Field
Selecting the Grouping Type
Use the grouping field to organize and label the information in a
report. For example, if you select Work Cell as a grouping field and
you have Bend, Cut, Finish, Machine, and Weld work cells, your
report will contain rows, columns, or pages (subsections) labeled
with those work cell names and containing data associated with
those work cells. There is a maximum of five grouping fields.
NOTE
Do not select the same grouping field twice. If you select two identical
grouping fields and then attempt to view the report, the message
Duplicate grouping field found. Please set correct grouping
parameters. will appear.
Use the grouping type to specify the general layout of the
information in a report.
You can group fields by row, column, and page.
• Grouping by rows
When you specify the row grouping type, the grouping field is
added to the report as a column and the grouped information
is organized in rows. For example, if you group a Performance
report by work cell and select a group type of row, the
information in your report will look something like this:
Rockwell Automation Publication RPTEXP-UM001H-EN-P-June 2014 85
Page 86

Chapter 6 Understanding Parameter Sets
There is a maximum of 3 row groups.
• Grouping by columns
When you specify the column grouping type, the grouped
information is organized in columns. For example, if you
group a Performance report by work cell and select a group
type of column, the information in your report will look
something like this:
There is a maximum of 2 column groups.
• Grouping by pages
When you specify the page grouping type, the grouped
information is organized in subsections. For example, if you
group a Performance report by work cell and select a group
type of column, the information in your report will look
something like this:
86 Rockwell Automation Publication RPTEXP-UM001H-EN-P-June 2014
Page 87

Understanding Parameter Sets Chapter 6
Selecting the Grouping Expansion Type
There is a maximum of 1 page group.
Use the grouping expansion type to specify whether the grouped
data will be initially displayed fully expanded or collapsed.
• To specify expanded, click
so that it changes to
.
• To specify collapsed, leave
next to the grouping type list
.
When the report is initially rendered, data is shown for each of the
values of the grouping field. In the following example, data for each
of the work cells is displayed on a separate line:
Rockwell Automation Publication RPTEXP-UM001H-EN-P-June 2014 87
Page 88

Chapter 6 Understanding Parameter Sets
Using the Sorting Parameter
To specify collapsed, accept the default plus icon button. For
example, if you group a Performance report by work cell, select a
group type of row, and the information in your report will initially
look something like the one below. When the report is initially
rendered, data will be shown as a total for all the grouping field
values. To see expanded data, click the plus sign next to the grouped
field name:
Deleting a Grouping
To remove a grouping field and type from the parameter set, click
.
The Sorting parameter allows you create one or more sort orders
that specify how the information in a report will be sorted.
88 Rockwell Automation Publication RPTEXP-UM001H-EN-P-June 2014
Page 89

Understanding Parameter Sets Chapter 6
Each row in the Sorting parameter consists of:
• A sorting field list (page 89).
• Sorting method options (page 90).
• A removal icon (page 90).
When you create a sorting order, you must specify the field that will
be used to sort the information, and a sorting method.
Selecting the Sorting Field
With the exception of the Event Detail (page 49), Event Detail
Paged (page 50), Root Cause Analysis (page 64), and State Detail
(page 65) reports, Report Expert report templates are sorted
alphabetically by Work Cell as a default.
Use the sorting field to sort the information differently in the
remaining reports.
TIP
If you sort by a field that is not displayed in the report, you will not
notice changes selected in the sorting fields unless you group by the
sorting field.
For example, in the case of the Performance report, the following fields
are displayed in the report: Uptime %, Throughput %, Quality %, and
OEE %. If you sort the report by Line, you will not notice any
sorting-related changes in the displayed data.
The solution in this case would be to group the report by Line. The report
would then be sorted by the line automatically. Therefore, you would
not have to sort the report unless you did not want it sorted by line.
To sort a report by the line order set, in the sorting field, select
Work Cell Ordered. The Root Cause Analysis and State Detail
reports are always sorted by Work Cell Ordered, which is why they
do not respond to sorting changes in the parameter set. The default
line order set for all reports lists the line's work cells in the order in
which they were entered in the plant model. To change the line
order for any report, see "Configuring the Line Order (page 164)".
Rockwell Automation Publication RPTEXP-UM001H-EN-P-June 2014 89
Page 90

Chapter 6 Understanding Parameter Sets
Selecting the Sorting Method
Use the sorting method to specify the order of the information
within each grouping in a report.
There are two sorting methods:
Item Description
Ascending sorting The information is sorted within each grouping alphabetically, from
A to Z or numerically, from lowest to highest.
Descending sorting The information is sorted within each grouping alphabetically, from
Z to A or numerically, from highest to lowest.
Deleting a Sorting
Using the Plant Model Parameter
To remove a sorting field and method from the parameter set, click
.
The Plant Model parameter allows you to specify the activity areas of
a plant for which a report will display data. The parameter displays a
plant model defined in the Plant Model dialog box, which you can
access from the Configuration Console in RSBizWare.
By default, none of the check boxes in the plant model is selected.
To associate one or more activity areas with a parameter set, select
the check boxes for those activity areas. For example, if you wanted
to associate the Bend and Cut work cells with a parameter set, you
would select their check boxes as shown below:
90 Rockwell Automation Publication RPTEXP-UM001H-EN-P-June 2014
Page 91

Understanding Parameter Sets Chapter 6
TIP
If you have configured both a plant model unit and its children for data
collection in the Configuration Console in RSBizWare, then a filter on
that plant model unit will collect data from both the plant model unit
and its children, grouped according to the level of plant model.
Using the Filtering Parameter
The Filtering parameter allows you create one or more filters that
will limit the information displayed in the report. When applied to a
report, the field and value pairs that you create are used to filter out
data.
Each row in the Filtering parameter consists of:
• A filtering definition area (page 92).
• A removal icon (page 93).
When you configure a filtering parameter, you must specify the field
that will be used to filter the information, and a value for that field.
For example, if you select Parts as the filtering field and you specify
P3463ZX as the field value, your report will contain information for
that part only.
You can also filter your data using multiple fields’ values. For
example, if you select EventName as the filtering field and you
specify Fault and Pass as the field values, you report will contain
information on those two events.
Filtering on multiple values within a single field is equivalent to an
OR operation. Filtering on multiple fields is equivalent to an AND
Rockwell Automation Publication RPTEXP-UM001H-EN-P-June 2014 91
Page 92

Chapter 6 Understanding Parameter Sets
operation — data must match all defined filters to be included in the
report.
Selecting the Filtering Field and Value
TIP
The fields in the filtering parameter allow you to select multiple field
values for filtering.
Use the filtering field and value to limit the information returned to
a report. The field you select will dictate how the value is to be
entered—some fields allow you to type any value in the parameter,
while other fields require selection from a list of possible values. The
condition for all field and value pairs is "equals." If more than one
filter is specified, the filter items are joined by a logical AND.
You can filter report data using the following filters:
This filter: Filters by:
Part Id The ID of the part that was being produced when the event
occurred.
Part Description The description of the part that was being produced when
the event occurred.
Ideal Cycle Time The time required for one part to pass through a work cell
under ideal conditions.
Event Name The name of the event.
Event Category The category of the event.
Event Severity The numeric severity level assigned to the event.
Event Reason Code The numeric code representing the event reason.
Event Reason The string value representing the event reason.
Event During Scheduled
Time
Record State The numeric state of the database record.
Event Start Num The numeric value collected at the start of the event.
Event End Num The numeric value collected at the end of the event.
Event Is Fault Information on whether the event is used for Faults metrics.
Event Has Comment The event that includes or does not include comments.
State Name The machine state. This field is color coded.
Information whether the event occurred during the
scheduled time.
92 Rockwell Automation Publication RPTEXP-UM001H-EN-P-June 2014
Page 93

This filter: Filters by:
Understanding Parameter Sets Chapter 6
Deleting a Filter
Using the TOP N Parameter
[User Defined
Summarization Fields 1-5]
Names of the flex fields. The names can be changed by the
administrator in the Configuration Console.
To remove a filtering field and value from the parameter set, click
.
Use the Top N parameter to enable a parameter set to limit the data
of a report to the top (or bottom) N (number) of occurrences of a
field you specify.
When enabled, you must specify the field that you want to limit and
its desired maximum number of occurrences. The sorting will
determine what the top or bottom N occurrences are of the limiting
field.
When Top N is enabled, the top N rows of a dataset grouped only
by the top N field and sorted by the top N field called using, will
determine the top N occurrences of the top N field. Top will give
the largest values of the top N field while bottom will give the
smallest values. N can be a number between 1 and 20.
The following example illustrates that the Top N are determined for
the entire dataset (without regard to the grouping fields):
Let’s say you wanted an Event Summary report. The parameter set
selected was by Work Cell, and the grouping was set to Event
Rockwell Automation Publication RPTEXP-UM001H-EN-P-June 2014 93
Page 94

Chapter 6 Understanding Parameter Sets
Reason Code. The top N parameter was set to Top, 3, of field
Event Reason Code, using Event Count.
When querying for the dataset, each work cell could have a large
number of reason codes. They could also have some reason codes in
their own top 3, but not part of the overall top 3 for all work cells in
the query.
The Top N feature will first determine the top 3 reason codes for all
work cells in this example. Once those top 3 reason codes are
determined, the query or queries used to generate the report will
include a filter to limit the data to these 3 reason codes across the
entire report.
Using the Terminology Parameter
The Terminology parameter on the Parameters page allows you to
apply a domain terminology set to your report's parameter set.
To view a report with an applied terminology set:
1. In the Report Expert toolbar, click Parameters to display the
Parameters page, if it is not already displayed.
2. In the Select Report field, select a report template for the
report.
3. In the Parameter Set field, select a parameter set.
4. Expand the Terminology parameter and then select a
terminology set.
94 Rockwell Automation Publication RPTEXP-UM001H-EN-P-June 2014
Page 95

Understanding Parameter Sets Chapter 6
For information on administering the Terminology feature, see
"Configuring Terminologies (page 157)".
Rockwell Automation Publication RPTEXP-UM001H-EN-P-June 2014 95
Page 96

Chapter 6 Understanding Parameter Sets
96 Rockwell Automation Publication RPTEXP-UM001H-EN-P-June 2014
Page 97

Chapter 7
Viewing and Generating Reports
In this chapter you will learn how to generate and view reports using
the Report Viewer.
Viewing Saved Reports on the Explorer Page
The reports available on the Explorer page are combinations of
report templates and parameter sets. They are arranged first by the
time period (current shift, yesterday, etc.) on which they report, and
then by the report template they use. The reports installed by default
are examples only.
Use the Explorer page to browse and view saved reports:
• Expand a folder in the tree to view its contents.
• Collapse a folder in the tree to hide its contents.
• Click a report in the tree to view it in the display area.
• Click a web address in the tree to view its content in the
display area.
NOTE
Administrators can modify the content available on the Explorer
page. See "Configuring the Report Tree of the Explorer Page
(page 146)" for details.
Generating Reports Using the
Use the Parameters page to:
Parameters Page
• Generate reports with existing parameter sets (page 98).
• Generate reports with existing parameter sets that you
customize temporarily (page 98).
• Create new parameter set for your reports (page 99).
Rockwell Automation Publication RPTEXP-UM001H-EN-P-June 2014 97
Page 98

Chapter 7 Viewing and Generating Reports
NOTE
Administrators can modify the content available on the
Parameters page. See "Configuring Parameter Sets (page 154)"
for details.
Generating Reports with Existing Parameter Sets
Generating Reports with
Temporarily Customized
To generate a report with an existing parameter set:
1. Under Select Report, select the report template for the type of
report you want to view.
TIP
See "Understanding Report Templates (page 37)" for details.
2. Under Select Parameter Set, select the parameter set for the
report.
TIP
See "Understanding Parameter Sets (page 77)" for details.
3. Click the View Report link. The resulting report appears in
the display area.
If there is no data for the given parameters in the parameter
set, a message No data found for selected parameter set
appears.
To generate a report with a temporarily customized parameter
set:
Parameter Sets
1. Under Select Report, select the report template for the type of
report you want to view.
TIP
2. Under Select Parameter Set, select a parameter set that is the
closest to the temporary parameter set you want to use.
TIP
3. Modify the parameters as desired.
NOTE
98 Rockwell Automation Publication RPTEXP-UM001H-EN-P-June 2014
See "Understanding Report Templates (page 37)" for details.
See "Understanding Parameter Sets (page 77)" for details.
If you modify an existing parameter set, your changes may affect
existing saved reports.
Page 99

Viewing and Generating Reports Chapter 7
4. Click the View Report link. The resulting report appears in
the display area.
When you generate a report using customized parameter set
settings, the parameter set used in the report is defined as
Cache from URL.
5. If you are an administrator, you can make the changes to the
parameter set permanent. To do this, click Save.
Creating New Parameter Sets for Reports
Viewing and Using Reports
To create a new parameter set:
1. Click New.
2. Under Edit Parameter Set Name, type a name for the new
parameter set.
3. Select the desired parameters.
TIP
See "Understanding Parameter Sets (page 77)" for details.
4. Click Save.
NOTE
Administrators can create new parameter sets on the Administration
page. See "Configuring Parameter Sets (page 154)" for details.
The display area, in which reports are presented, contains a set of
tools that you can use to:
• Navigate a report (page 100).
• Export a report (page 100).
• Print a report (page 101).
Rockwell Automation Publication RPTEXP-UM001H-EN-P-June 2014 99
Page 100

Chapter 7 Viewing and Generating Reports
The appearance of the tool buttons available on the toolbar may
differ depending on the version of Microsoft SQL Server that you
use.
Navigating Reports
Exporting Reports
The following table presents the tools for viewing and navigating
reports.
Click: To:
Use arrows to navigate to the first page, previous page, next
page, and the last page of the report.
Type the page number to go to that page.
Specify the zoom percentage at which you want to view the
report.
Search for a specific text. Use the Find and Next buttons to
locate one or more instances of the text.
View or hide detailed information associated with summary
report lines. Click the plus and minus signs to expand and
collapse a section of the report.
Refresh the content of the report.
You may export reports to the formats listed below. The set of the
formats may differ depending on the version of Microsoft SQL
Server that you use.
• CSV (comma delimited)
• DOC (MS Word) - Microsoft SQL Server 2008 R2 only
• MHTML (web archive)
• PDF
• TIFF
• XLS (MS Excel)
• XML
100 Rockwell Automation Publication RPTEXP-UM001H-EN-P-June 2014
 Loading...