

Page 1

USER GUIDE
Rockwell Automation Publication PLTMT-UM001M-EN-P-June 2014
Supersedes Publication PLTMT-UM001L-EN-P-June 2013
Page 2

Contacting Rockwell
Copyright Notice
Trademark Notices
Other Trademarks
Warranty
Customer Support Telephone — 1.440.646.3434
Online Support — http://www.rockwellautomation.com/support/overview.page
© 2014 Rockwell Automation Technologies, Inc. All Rights Reserved.
This document and any accompanying Rockwell Software products are copyrighted by Rockwell Automation,
Inc. Any reproduction and/or distribution without prior written consent from Rockwell Automation, Inc. is
strictly prohibited. Please refer to the license agreement for details.
FactoryTalk, FactoryTalk Activation, FactoryTalk Diagnostics, FactoryTalk Directory, FactoryTalk Live Data,
FactoryTalk Metrics, FactoryTalk Services Platform, FactoryTalk Transaction Manager, FactoryTalk
VantagePoint, FactoryTalk ProductionCentre, Report Expert, Rockwell, Rockwell Automation, Rockwell
Software, and RSBizWare are trademarks of Rockwell Automation, Inc.
Any Rockwell Automation logo, software or hardware not mentioned herein is also a trademark, registered or
otherwise, of Rockwell Automation, Inc.
For a complete list of products and their respective trademarks, go to
http://www.rockwellautomation.com/rockwellautomation/legal-notices/overview.page?%23tab4#/tab4.
ActiveX, Microsoft, Microsoft Access, SQL Server, Visual Basic, Visual C++, Visual SourceSafe, Windows,
Windows ME, Windows NT, Windows 2000, Windows Server, Windows XP, Windows 7, Windows Vista, and
Windows 8 are either registered trademarks or trademarks of Microsoft Corporation in the United States
and/or other countries.
Adobe, Acrobat, and Reader are either registered trademarks or trademarks of Adobe Systems Incorporated in
the United States and/or other countries.
ControlNet is a registered trademark of ControlNet International.
DeviceNet is a trademark of the Open DeviceNet Vendor Association, Inc. (ODVA)
OLE for Process Control (OPC) is a registered trademark of the OPC Foundation.
Oracle, SQL*Net, and SQL*Plus are registered trademarks of Oracle Corporation.
All other trademarks are the property of their respective holders and are hereby acknowledged.
This product is warranted in accordance with the product license. The product’s performance may be affected
by system configuration, the application being performed, operator control, maintenance, and other related
factors. Rockwell Automation is not responsible for these intervening factors. The instructions in this
document do not cover all the details or variations in the equipment, procedure, or process described, nor do
they provide directions for meeting every possible contingency during installation, operation, or
maintenance. This product’s implementation may vary among users.
This document is current as of the time of release of the product; however, the accompanying software may
have changed since the release. Rockwell Automation, Inc. reserves the right to change any information
contained in this document or the software at any time without prior notice. It is your responsibility to obtain
the most current information available from Rockwell when installing or using this product.
Page 3

Welcome to FactoryTalk Metrics
Getting Started
Collecting Performance Data
Table of Contents
Chapter 1
What Is FactoryTalk Metrics? ................................................................... 9
Features and Benefits .................................................................................. 10
Intended Audience ...................................................................................... 10
Where Can I Go for Help? ....................................................................... 12
Get Web Support ................................................................................... 12
Get Phone Support ................................................................................ 13
Get Consulting Services ....................................................................... 13
Contact Us .............................................................................................. 13
Chapter 2
The RSBizWare Architecture .................................................................. 15
Importing Sample Data to the RSBizWare Database......................... 16
Connecting to the Information Services Manager .............................. 17
Using the Information Services Manager in Internet Explorer .. 17
Using the Information Services Manager in the Configuration
Console ..................................................................................................... 18
Getting Started with the Configuration Console .......................... 19
The Plant Model .......................................................................................... 20
Configuring the Plant Model .............................................................. 21
Loading Sample Activity Areas ........................................................... 23
Chapter 3
Collecting Part Count Data When the Metrics Server Manager Is
Stopped .......................................................................................................... 25
OEE Rating ................................................................................................... 27
Fault Metrics Ratings ................................................................................. 28
Mean Time Between Failure ............................................................... 28
Mean Time To Repair .......................................................................... 29
Configuring Activity Area Schedules ..................................................... 29
Time Patterns ......................................................................................... 29
Configuring Time Patterns ............................................................ 30
Configuring Work Day Time Patterns ....................................... 34
Configuring Work Week Time Patterns .................................... 36
Composites and Schedule Exceptions ............................................... 38
Configuring Composites and Schedule Exceptions ................. 39
Rockwell Automation Publication PLTMT-UM001M-EN-P-June 2014 3
Page 4

Table of Contents
Configuring OEE Performance Parameters For Activity Areas ...... 41
Configuring Data Collection .............................................................. 44
Configuring Cycle Time ...................................................................... 44
Configuring a Part ID/Cycle Time Lookup List ...................... 47
Configuring Part Id ............................................................................... 50
Configuring Summarization Criteria ............................................... 52
Configuring Part Count ....................................................................... 55
Configuring Part Count Using an Unscheduled Data Point 58
Configuring Part Count Using an Unscheduled Data Point
and a FTTM Expression ................................................................. 58
Configuring Part Count Using a FTTM Expression On a
Scheduled Basis ................................................................................. 59
Configuring a Formula .................................................................... 60
Availability ............................................................................................... 63
Configuring Scheduled Availability ............................................. 65
Configuring Monitored Availability ............................................ 73
Configuring Running State ............................................................ 78
Generating Performance Parameter Events ..................................... 81
Viewing Performance Parameter Events for an Activity Area .......... 81
System-generated Events ...................................................................... 83
User-defined Events .............................................................................. 85
Manual Events ........................................................................................ 88
The Recycle Bin ...................................................................................... 89
Configuring User-defined Performance Parameter Events .............. 90
Configuring the Event Data Summary ............................................. 90
Event Data Summarization Types ................................................ 92
Configuring the Event Trigger ........................................................... 93
Event Trigger Types ......................................................................... 96
Configuring the Event Value .............................................................. 99
Event Value Types ......................................................................... 101
Using the Expression Editor ....................................................... 104
Creating Event Value Reason Code Lookup Lists ................ 109
Configuring the Machine State / Faults ........................................ 111
Configuring the Reporting ............................................................... 113
Advanced Properties ................................................................................ 115
Scheduled Part Count Collection Parameters ............................. 115
4 Rockwell Automation Publication PLTMT-UM001M-EN-P-June 2014
Page 5

Table of Contents
Automated Configuration
System-generated Event Data Summarization ............................. 116
Availability Interpretation Options ............................................... 117
Performance Data Trending Rate ................................................... 118
Machine States .......................................................................................... 118
Machine States at the Sample Enterprise ...................................... 120
Prioritizing Machine States .............................................................. 122
Configuring Machine States ............................................................. 123
Mapping Machine States to User-defined Events ....................... 125
Determining Availability and Running State From Machine State
.................................................................................................... 126
Configuring FactoryTalk Metrics to Perform Downtime Tracking ...
126
Running Versus Downtime .............................................................. 128
User-defined Downtime Events ...................................................... 129
Machine State ...................................................................................... 130
Reviewing the Status of Performance Parameters Events ............... 131
Start Data Collection .............................................................................. 133
Stop Data Collection ............................................................................... 134
Manual Data Collection ......................................................................... 134
Chapter 4
Rockwell Automation Publication PLTMT-UM001M-EN-P-June 2014 5
FactoryTalk Metrics UDT ..................................................................... 139
UDT Tags and FactoryTalk Metrics Performance Parameters 140
Setting up Communication Between a ControlLogix Controller and
FactoryTalk Metrics ................................................................................ 143
Configuring RSLinx Enterprise ....................................................... 144
Importing the FactoryTalk Metrics UDT to the ControlLogix
Controller ............................................................................................. 148
Creating Tags Based on the FactoryTalk Metrics UDT ........... 150
Creating FactoryTalk Transaction Manager and FactoryTalk
Metrics Configurations ..................................................................... 154
Configuration Types ..................................................................... 154
Configuration Flow ...................................................................... 154
Guidelines for Modifying Imported Performance Parameters 168
Page 6

Table of Contents
Analyzing FactoryTalk Metrics
Data
Chapter 5
Create a New RSBizWare Report ........................................................ 171
Insert Text, Pictures, and Hyperlinks .................................................. 172
Save the Report ......................................................................................... 174
Move the Report and Set Report Permissions ................................... 175
Add a Saved Report Object to the Report .......................................... 177
Adjust the Time Range For a Time-based Report Object ........ 180
Configure the Report Object To Use Global Credentials ............. 182
Create a New Chart ................................................................................. 185
Step 1: Plan the Chart ........................................................................ 186
Step 2: Select the Data On Which To Report ............................. 187
Step 3: Choose a Chart Type ........................................................... 187
Step 4: Describe the Data .................................................................. 187
Step 5: Select Summary or Detail .................................................... 188
Step 6: Select the Fields To Be Charted ........................................ 189
Step 7: Enter the Chart Title ........................................................... 190
Step 8: Filter the Data ........................................................................ 190
Step 9: Insert Your New Chart Into the Report ......................... 193
Create a New Text Report Object ....................................................... 194
Step 1: Start the Text Report Object Wizard .............................. 194
Step 2: Select the Data On Which To Report ............................. 194
Step 3: Group the Records ................................................................ 195
Step 4: Sort the Records .................................................................... 196
Step 5: Format the Table ................................................................... 197
Step 6: Name the Report Object ..................................................... 199
Step 7: Filter the Data ........................................................................ 199
Step 8: Insert Your New Table Into the Report .......................... 199
Create an OEE Box Chart...................................................................... 200
Step 1: Add a Chart to the Report .................................................. 200
Step 2: Select an Activity Area ......................................................... 201
Step 3: Specify the Layout of the Chart ......................................... 202
Step 4: Create a Filter ......................................................................... 203
Step 5: Customize the OEE Bar Colors ........................................ 205
Step 6: Preview Your OEE Box Chart ........................................... 207
Create a FactoryTalk Metrics Detail Chart ....................................... 207
Export the Report to HTML ................................................................ 210
6 Rockwell Automation Publication PLTMT-UM001M-EN-P-June 2014
Page 7

Table of Contents
Customizing RSBizWare Charts
and Tables
Advanced Reporting Topics
Load the Report From File ..................................................................... 211
Chapter 6
Customizing Charts ................................................................................ 213
Working With the Component Parts of a Chart ....................... 214
Resizing a Component ................................................................. 215
Moving a Component .................................................................. 215
Deleting a Component ................................................................. 215
Editing the Chart Title or Text Field ....................................... 215
Changing Chart Component Properties ................................. 216
Working With Chart “Pens” ........................................................... 216
Customizing Text Report Objects ....................................................... 217
Show and Hide Columns .................................................................. 217
Resize Table Columns ....................................................................... 218
Aggregate, Group, Format, Sort, Chart, and Rename Columns .....
.................................................................................................... 218
Aggregate ......................................................................................... 220
Group ............................................................................................ 220
Format ............................................................................................ 220
Sort ............................................................................................ 221
Chart ............................................................................................ 221
Rename ............................................................................................ 221
Quick Filter .......................................................................................... 221
Rockwell Automation Publication PLTMT-UM001M-EN-P-June 2014 7
Chapter 7
The Excel Add-in ..................................................................................... 223
Scheduling Report Objects and Reports ............................................. 227
Schedule a Report Object .................................................................. 228
Schedule a Report ............................................................................... 231
View the History of the Scheduled Task ....................................... 235
Analyzing Non-RSBizWare Data ........................................................ 236
Create an External Data Source....................................................... 236
Report Data Sources ........................................................................... 237
Step 1: Start the Report Data Source Wizard ......................... 237
User-derived Fields .................................................................................. 241
Create Detailed Derived Fields ........................................................ 243
Create Summary Derived Fields ...................................................... 247
Page 8

Table of Contents
FactoryTalk Metrics Icon
Definitions
Object Permissions
Report Data Sources
Configuring Reports ................................................................................ 250
Chapter 8
Plant Model Element State Icons ......................................................... 253
Performance Parameter Event State Icons ......................................... 254
Chapter 9
Filter permissions ..................................................................................... 258
Report permissions ................................................................................... 258
Report data source permissions ............................................................. 259
Report object permissions ...................................................................... 259
Appendix A
Workcell History ...................................................................................... 261
Event History ............................................................................................ 263
Machine State Data.................................................................................. 264
8 Rockwell Automation Publication PLTMT-UM001M-EN-P-June 2014
Page 9

What Is FactoryTalk Metrics?
Welcome to FactoryTalk Metrics
In this chapter you will learn about the following:
• What Is FactoryTalk Metrics? (page 9)
• Features and Benefits (page 10)
Chapter 1
• Intended Audience (page 10)
• Where Can I Go for Help? (page 12)
Companies in the discrete and repetitive manufacturing industries
are being challenged by management to maximize production from
existing lines, to meet required cycle times and delivery dates for
each product, and to reduce costs. To meet this challenge,
production management is striving to operate the equipment at its
highest efficiency.
Real-time identification of production assets that fail to reach the
required standard is critical to maintaining world-class efficiency. A
thorough understanding of the details behind production
performance will allow you to identify sources of production
inefficiencies, and to maximize asset utilization.
Rockwell Automation Publication PLTMT-UM001M-EN-P-June 2014 9
The RSBizWare software is a suite of tools and services aimed at
increasing your manufacturing floor effectiveness and profitability
with solutions that target performance analysis and improvement,
and with data acquisition and integration. FactoryTalk Metrics is
just one of the applications that are available within the RSBizWare
software. FactoryTalk Metrics builds on the report, analysis, and
management capabilities of the RSBizWare software by providing a
Page 10

Chapter 1 Welcome to FactoryTalk Metrics
Features and Benefits
Intended Audience
powerful, yet simple set of tools to analyze the performance of
production assets.
FactoryTalk Metrics provides ratings - Overall Equipment
Effectiveness (OEE), Mean Time Between Failure (MTBF), and
Mean Time to Repair (MTTR) - that allow you to evaluate the
performance of your production assets. A production asset (or
activity area) can be anything from a single piece of equipment to a
complete manufacturing plant. These ratings provide a simple way
to determine quickly whether a production asset is performing
adequately, based on data collected from the control system.
FactoryTalk Metrics offers the following features and benefits:
• Rich reporting, graphing, analyzing, and querying
functionality providing a complete and easy-to-use solution for
performance analysis.
• High-level analysis tools to easily identify poorly performing
assets, including the ability to drill into the underlying detail to
identify the causes of production inefficiencies.
• The ability to evaluate every production asset based on OEE,
MTBF, and MTTR ratings.
• The ability to isolate each asset so that its rating is not affected
by upstream or downstream performance.
• The ability to connect most of the OEE parameters to either a
data point or a formula, providing flexibility in the
configuration of the OEE rating.
• The ability to embed a report object in any Microsoft ActiveX
container, such as Visual Basic or Internet Explorer.
10 Rockwell Automation Publication PLTMT-UM001M-EN-P-June 2014
The FactoryTalk Metrics User Guide is designed to help you
understand how to access and use the FactoryTalk Metrics product.
This document focuses on the end-user functions of FactoryTalk
Page 11

Welcome to FactoryTalk Metrics Chapter 1
Metrics and does not cover the installation and operation of
underlying system services.
This document is intended for the following types of users of the
RSBizWare software:
• RSBizWare administrators
RSBizWare administrators configure the RSBizWare system
so that it can capture performance data for use by report
designers and report users.
They should be familiar with:
• Control systems, process information (line and plant), and
databases.
• Microsoft Windows operating system.
• The location and structure of databases.
• Report designers
Report designers create the reports that will be used by report
users.
They should be familiar with:
• Process information (the physical representation of the
production line and plant).
• Microsoft Windows operating systems.
• Query logic (how to write a database query).
• Web publishing tools.
• The location and structure of databases.
• Report users
Report users make use of the reports created by the report
designer to perform their jobs.
Rockwell Automation Publication PLTMT-UM001M-EN-P-June 2014 11
Page 12

Chapter 1 Welcome to FactoryTalk Metrics
technical support resources, please visit the support site.
Where Can I Go for Help?
Get Web Support
They should be familiar with:
• Microsoft Windows operating systems.
Consult the following resources for additional information about
the product:
• Release Notes
The release notes contain current information about the
product, including hardware and software requirements, new
features, known and fixed anomalies.
• RSBizWare Administration Guide
The administration guide helps the RSBizWare administrator
install and configure the software as well as understand the
architecture of the RSBizWare suite and its components.
• Online help
The online help provides general information and step-by-step
procedures for working with the product.
• Rockwell Automation Support Center
The support center provides a variety of services, such as
trainings, webinars, and online support that will improve your
experience using the RSBizWare suite.
TIP
For web-based product support, and for detailed information on
Access the Rockwell Automation Knowledge base for 24/7 technical
information and assistance. You can also download software patches
and new software versions, ask questions via email, participate in
user forums, and access other useful problem-solving tools.
The support resources available vary, depending on the product
purchased. The latest information can be obtained from the
Rockwell Automation Technical Support website.
12 Rockwell Automation Publication PLTMT-UM001M-EN-P-June 2014
Page 13

Welcome to FactoryTalk Metrics Chapter 1
Get Phone Support
Get Consulting Services
Contact Us
A current TechConnect Support contract may be required to use
some online features.
To speak with a Technical Support representative in North
America, call 1-440-646-3434.
For information on how to contact Technical Support in other
locations worldwide, please visit the support site.
A current TechConnect Support contract may be required to obtain
phone support.
Rockwell Automation provides expert consulting and turnkey
implementation of this product. Please contact your local
representative for more information.
We strive to help all of our customers become successful in their
manufacturing improvement efforts. Toward this objective, we
invite you to contact your local representative or Rockwell
Automation at any time that we may be of service to you.
Rockwell Automation Publication PLTMT-UM001M-EN-P-June 2014 13
Page 14

Chapter 1 Welcome to FactoryTalk Metrics
14 Rockwell Automation Publication PLTMT-UM001M-EN-P-June 2014
Page 15
The RSBizWare Architecture
Chapter 2
Getting Started
Before you walk through the examples and tutorials that are
discussed in this book, it is assumed that the RSBizWare
administrator has installed, configured, and started the RSBizWare
server on the server computer.
Rockwell Automation Publication PLTMT-UM001M-EN-P-June 2014 15
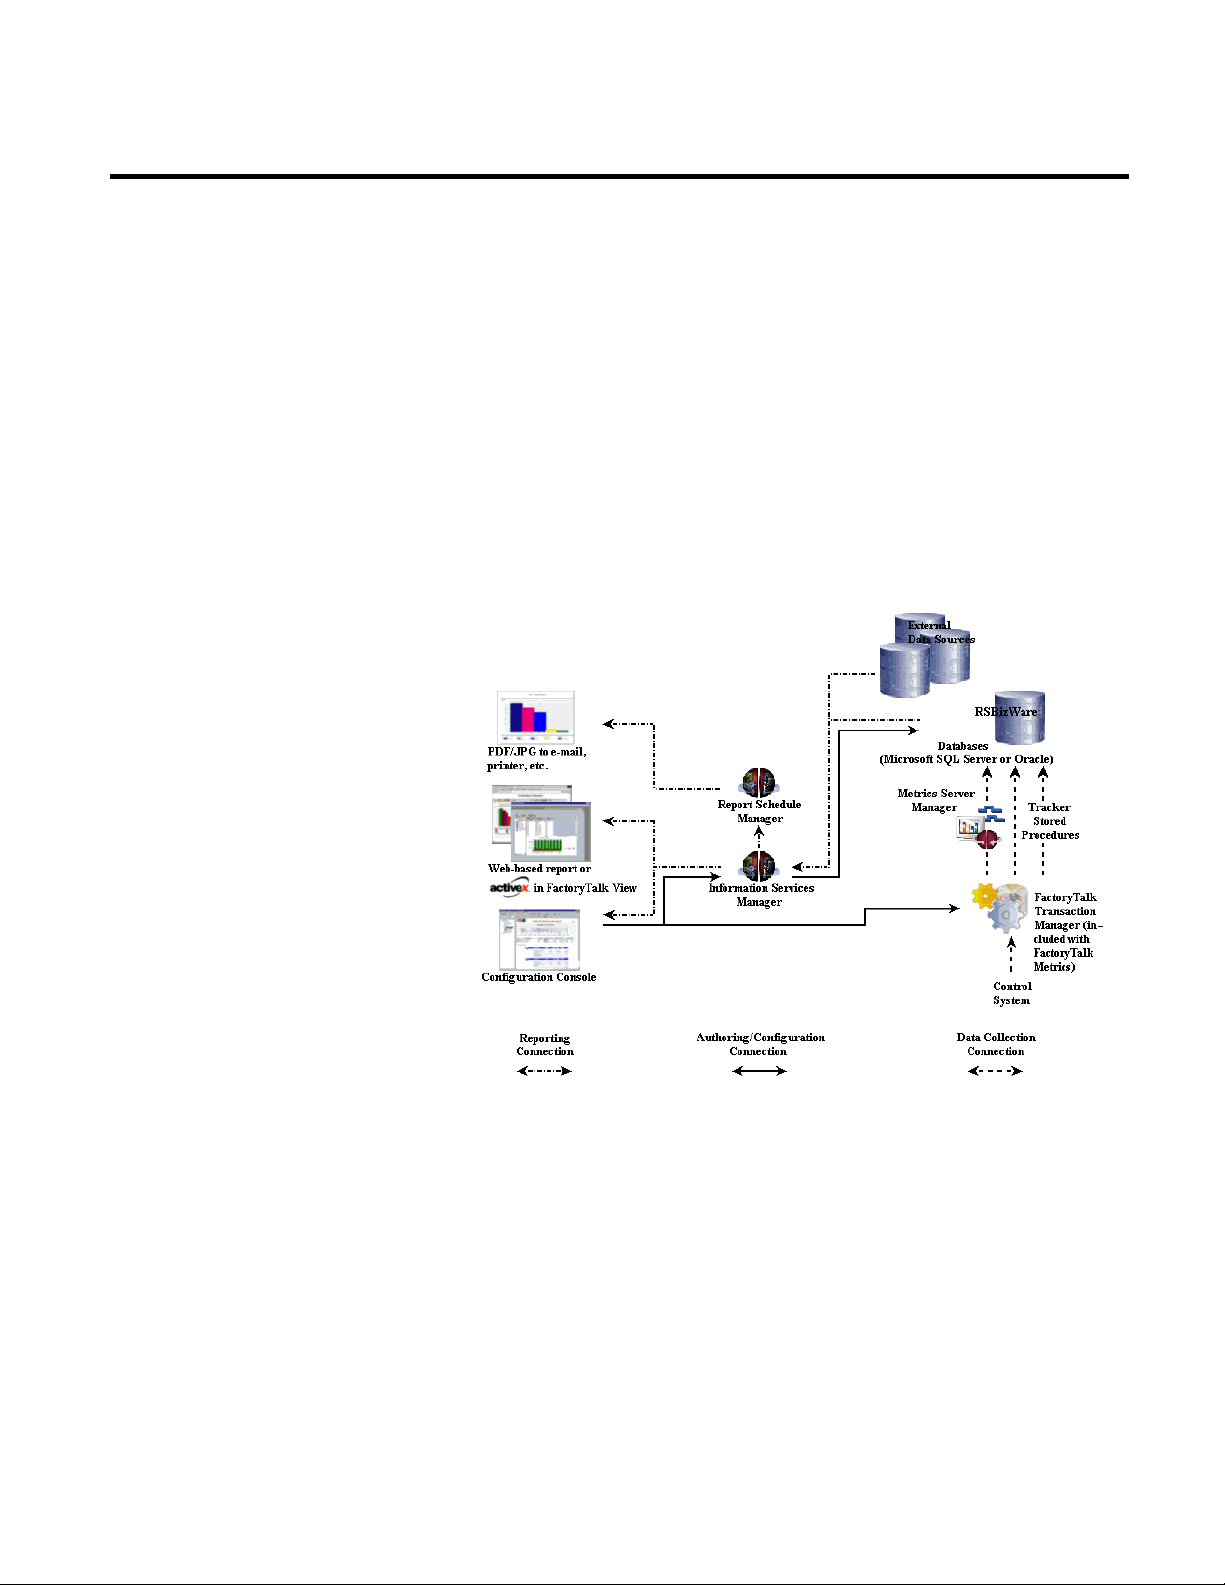
The RSBizWare architecture is a scalable, multi-tiered, distributed
architecture consisting of a data collection subsystem, an Oracle or
SQL Server database repository, the Information Services Manager,
and clients. Rockwell Automation’s FactoryTalk Transaction
Manager is the embedded engine that collects data from the control
system(s), and the Metrics Server Manager logs it to the predefined
RSBizWare database repository. There are several types of clients,
including the Configuration Console and the Internet Explorer
Web client.
Page 16

Chapter 2 Getting Started
Importing Sample Data to the RSBizWare Database
The RSBizWare architecture can be configured to run on a single
computer, or it can be distributed across multiple computers. In the
simplest case, the Configuration Console, the Information Services
Manager, the RSBizWare administrative tools used by the
RSBizWare administrator, the database, the Metrics Server
Manager, and the FactoryTalk Transaction Manager data collection
engine run on a single computer. In a distributed setting, these
components may reside on separate computers. Clients connect to
the Information Services Manager using TCP/IP, so they can be
deployed over a LAN, WAN, intranet, or the Internet. The
scalability of the RSBizWare architecture allows many clients to
connect to a single server.
You may import the FactoryTalk Metrics sample data so that you
can use it as a reference and/or for demonstration purposes.
To import the sample data into the RSBizWare database:
1. Go to Start > All Programs > Rockwell Software >
FactoryTalk Tools > Database Wizard.
The Database Load and Update Wizard appears.
2. Click Next.
The Product and Database Connection page appears.
3. In the ODBC DSN list, select your ODBC data source.
4. In the User text box, type the user name of your RSBizWare
database owner.
5. In the Password box, type the password of your RSBizWare
database owner.
6. Click Connect.
Under Available Product Modules, a list of sample data
appears.
16 Rockwell Automation Publication PLTMT-UM001M-EN-P-June 2014
Page 17

Getting Started Chapter 2
Connecting to the Information Services Manager
Using the Information Services Manager in Internet Explorer
7. Select the data that you want to import.
8. Click Finish.
The Processing page with the import status appears.
After the import is complete, the Completing the Database
Load and Update Wizard page appears.
9. Click Close.
RSBizWare reports created by the report designer are saved to the
Information Services Manager, and are available online over a
TCP/IP network. If you wish to create and edit RSBizWare reports
using Microsoft Internet Explorer, you need to run the
Configuration Console.
Using Microsoft Internet Explorer to view RSBizWare reports, you
can connect to the Information Services Manager without having
the RSBizWare software installed on your computer. Instead, the
server hosts a special Web page, the Quick Web, to give you access to
the RSBizWare reports stored on the server. This option only allows
you to view RSBizWare reports.
To access the Quick Web, open Internet Explorer, type the Web
address for the Information Services Manager computer, and press
Enter on your keyboard.
The Web address is made up of the name of the server computer and
the HTTP port number used by the server computer, separated by a
colon.
Rockwell Automation Publication PLTMT-UM001M-EN-P-June 2014 17
Page 18

Chapter 2 Getting Started
Using the Information Services Manager in the Configuration Console
For example, if you were attempting to connect to a server computer
named
would use the following address:
rsi-rockwell that uses the default HTTP port 8080, you
http://rsi-rockwell:8080.
Please contact your RSBizWare administrator for the specific
Information Services Manager Web address to which you should
connect.
The first time you try to use the Quick Web, you need to download
several ActiveX controls from the server computer. The download
will begin automatically.
After you have downloaded the ActiveX controls from the
Information Services Manager, you may be prompted to log on. If
prompted, type the user name and password for the account that
your RSBizWare administrator has authorized for you, and then
click OK. A connection to the RSBizWare server is established.
If you wish to configure your plant model, manage the collection of
control system data, and/or edit RSBizWare reports, you should
connect to the Information Services Manager via the Configuration
Console. Your RSBizWare administrator needs to assign a
FactoryTalk Metrics Author license and the appropriate privileges
to you, to enable you to perform these functions.
You need to have the client software installed on your computer to
run the Configuration Console. To install the Configuration
Console from the RSBizWare DVD, select the Minimal installation
option.
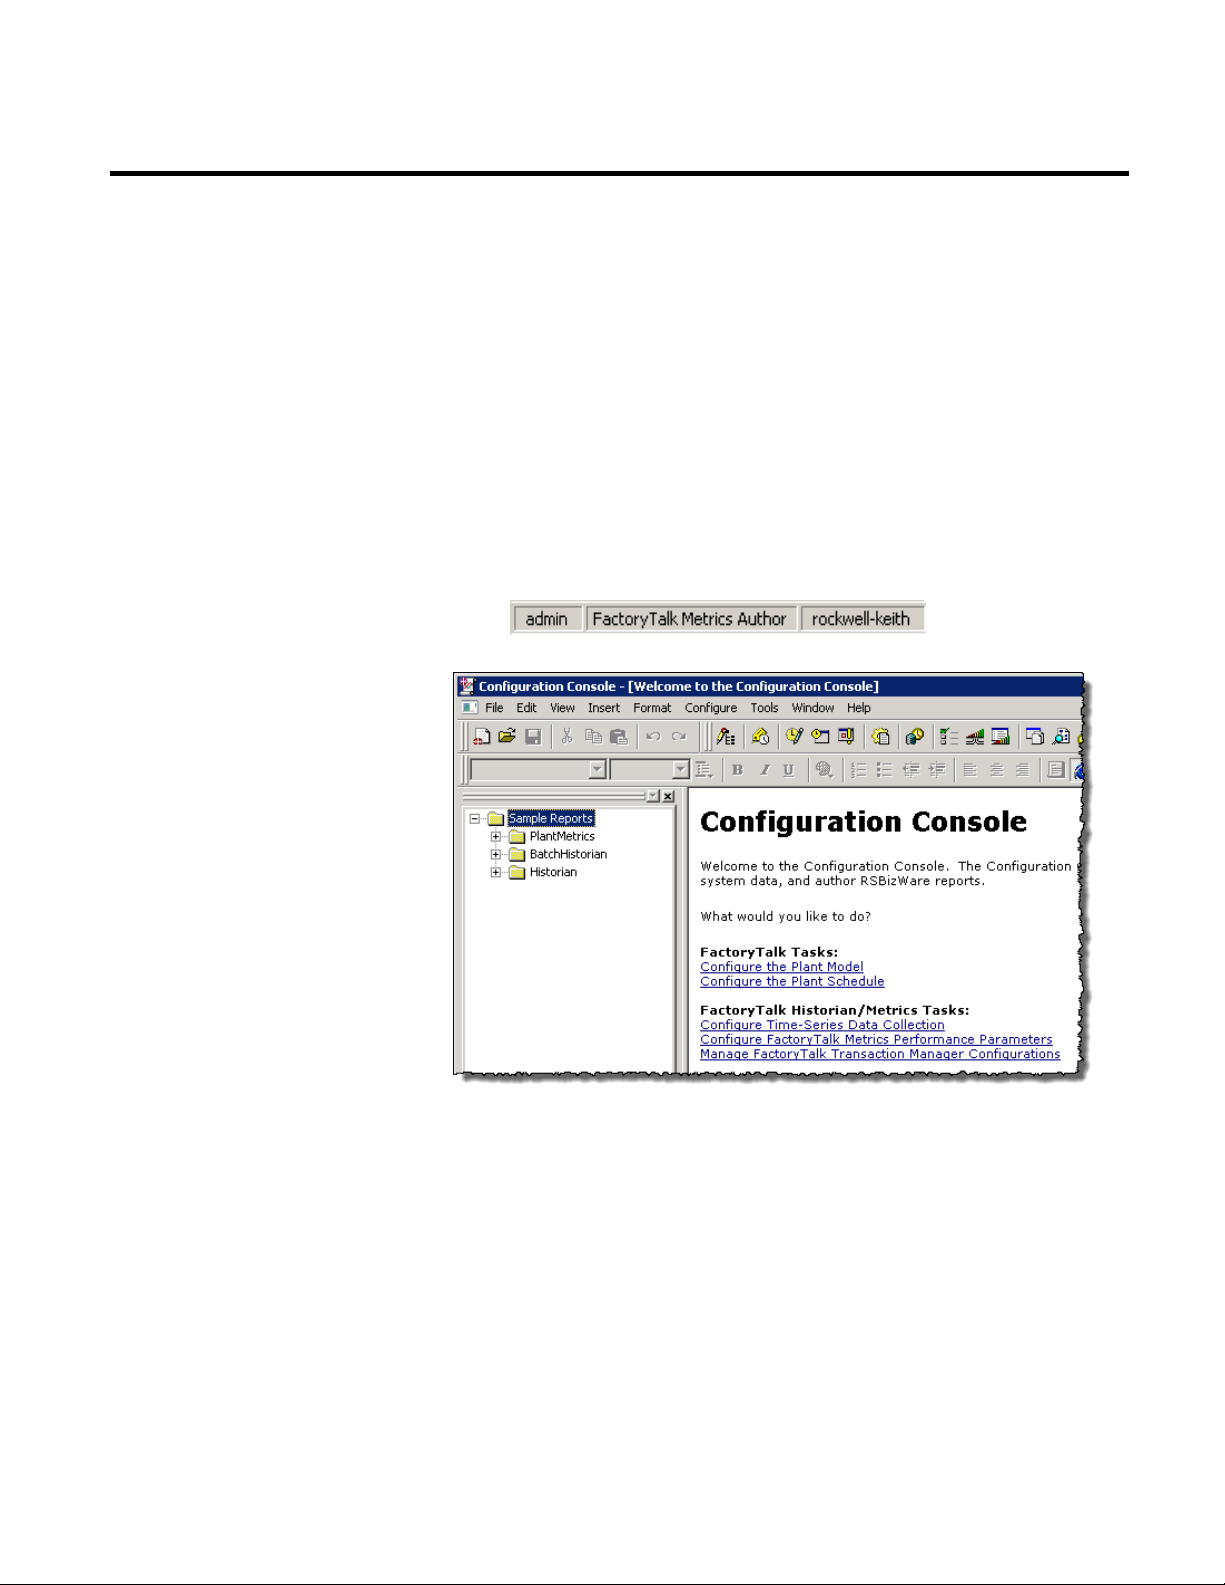
To start the Configuration Console:
1. Go to Start > All Programs > Rockwell Software >
RSBizWare > Configuration Console.
18 Rockwell Automation Publication PLTMT-UM001M-EN-P-June 2014
The RSBizWare Login dialog box appears.
Page 19
Getting Started Chapter 2
Getting Started with the Configuration Console
2. If prompted, type the user name and password for the account
that your RSBizWare administrator has authorized for you,
type the name of the server computer where the Information
Services Manager is running in the Server box, and then click
Login.
A client session with the RSBizWare server is established.
The status bar at the bottom of the client application shows
your user name, the activations that have been assigned to you,
and the Information Services Manager to which you are
connected.
The Configuration Console user interface is made up of two main
components:
Rockwell Automation Publication PLTMT-UM001M-EN-P-June 2014 19
• The Report Explorer pane on the left.
The Report Explorer is a hierarchical navigation tool used for
organizing the RSBizWare reports that have been saved for
future use. The Report Explorer contains the reports saved in
the Information Services Manager to which you are connected
and for which you have been granted view permissions. Your
Page 20

Chapter 2 Getting Started
selection is made.
workcell in the line).
location.
location at which products are manufactured.
Enterprise
The highest-level activity area, typically representing the business.
The Plant Model
ability to modify and delete the reports listed in the Report
Explorer depends on the licenses and features that you have
been assigned by your RSBizWare administrator, and the
permissions that you have been granted by the creator of each
individual report.
• The report design and display work area on the right.
When you click an item in the Report Explorer, the specified
RSBizWare report appears in this area. The work area is a
region where report designers can create and modify reports.
The plant model is made up of activity areas - enterprises, sites, areas,
lines, and workcells - as well as of equipment and labor resources.
The activity areas are based on the terms defined by the Instrument
Society of America (ISA) S95 standard in order to provide common
terminology for improved communication and integration between
control systems and enterprise systems.
Item Description
Workcell A location and/or group of equipment used to perform work in a
manufacturing process. The operations in a manufacturing process
are performed at workcells. A workcell is typically a physical
location and a primary resource (e.g., a machine); however, it may
also represent a logical grouping of primary resources from which a
Line A collection of one or more workcells that are combined to perform
work. The workcells in a line are either physically located close to
one another, or are related to one another in the production process
(the production result of the first workcell in a line feeds the second
Area A physical, geographical, or logical grouping of lines and/or
workcells within a site, typically representing a main production
capability (e.g., electronic assembly) within a manufacturing
Site A group of areas, lines, and workcells representing a geographical
20 Rockwell Automation Publication PLTMT-UM001M-EN-P-June 2014
Page 21
Getting Started Chapter 2
To create and edit the plant model, you must be granted the
Activity Areas (page 23)".
Configuring the Plant Model
The plant model may be used by all RSBizWare applications in your
organization (FactoryTalk Metrics, FactoryTalk Historian Classic,
and FactoryTalk Scheduler). The enterprises, sites, areas, lines, and
workcells in your plant model are the subjects of your performance
parameter evaluation. For implementations of RSBizWare that
incorporate the FactoryTalk Scheduler application, the plant model
also includes capacity, which is the property of an activity area
describing its availability over time. The performance parameters
can also be configured for resources.
NOTE:
Organize Plant Model privilege by your RSBizWare administrator.
If you want to have access to sample data, see "Loading Sample
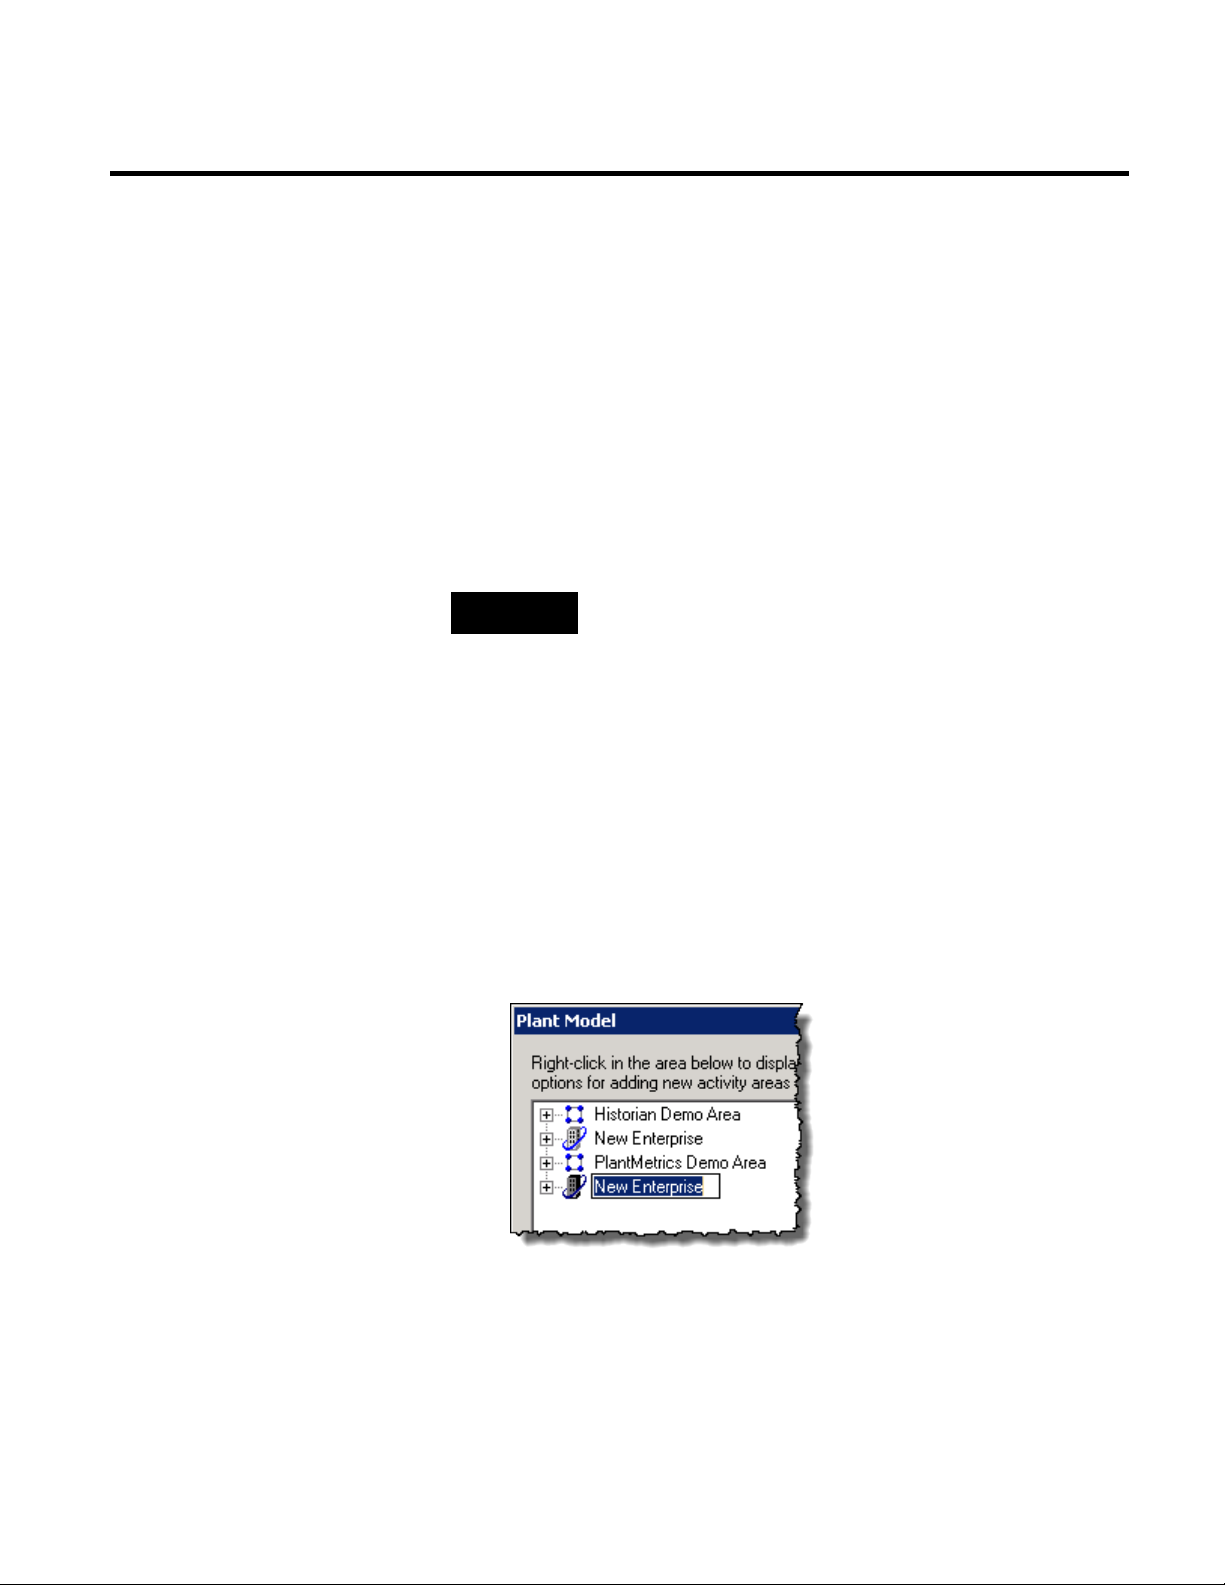
To configure the plant model in the Configuration Console:
1. On the Configure menu, click Plant Model.
The Plant Model dialog box appears.
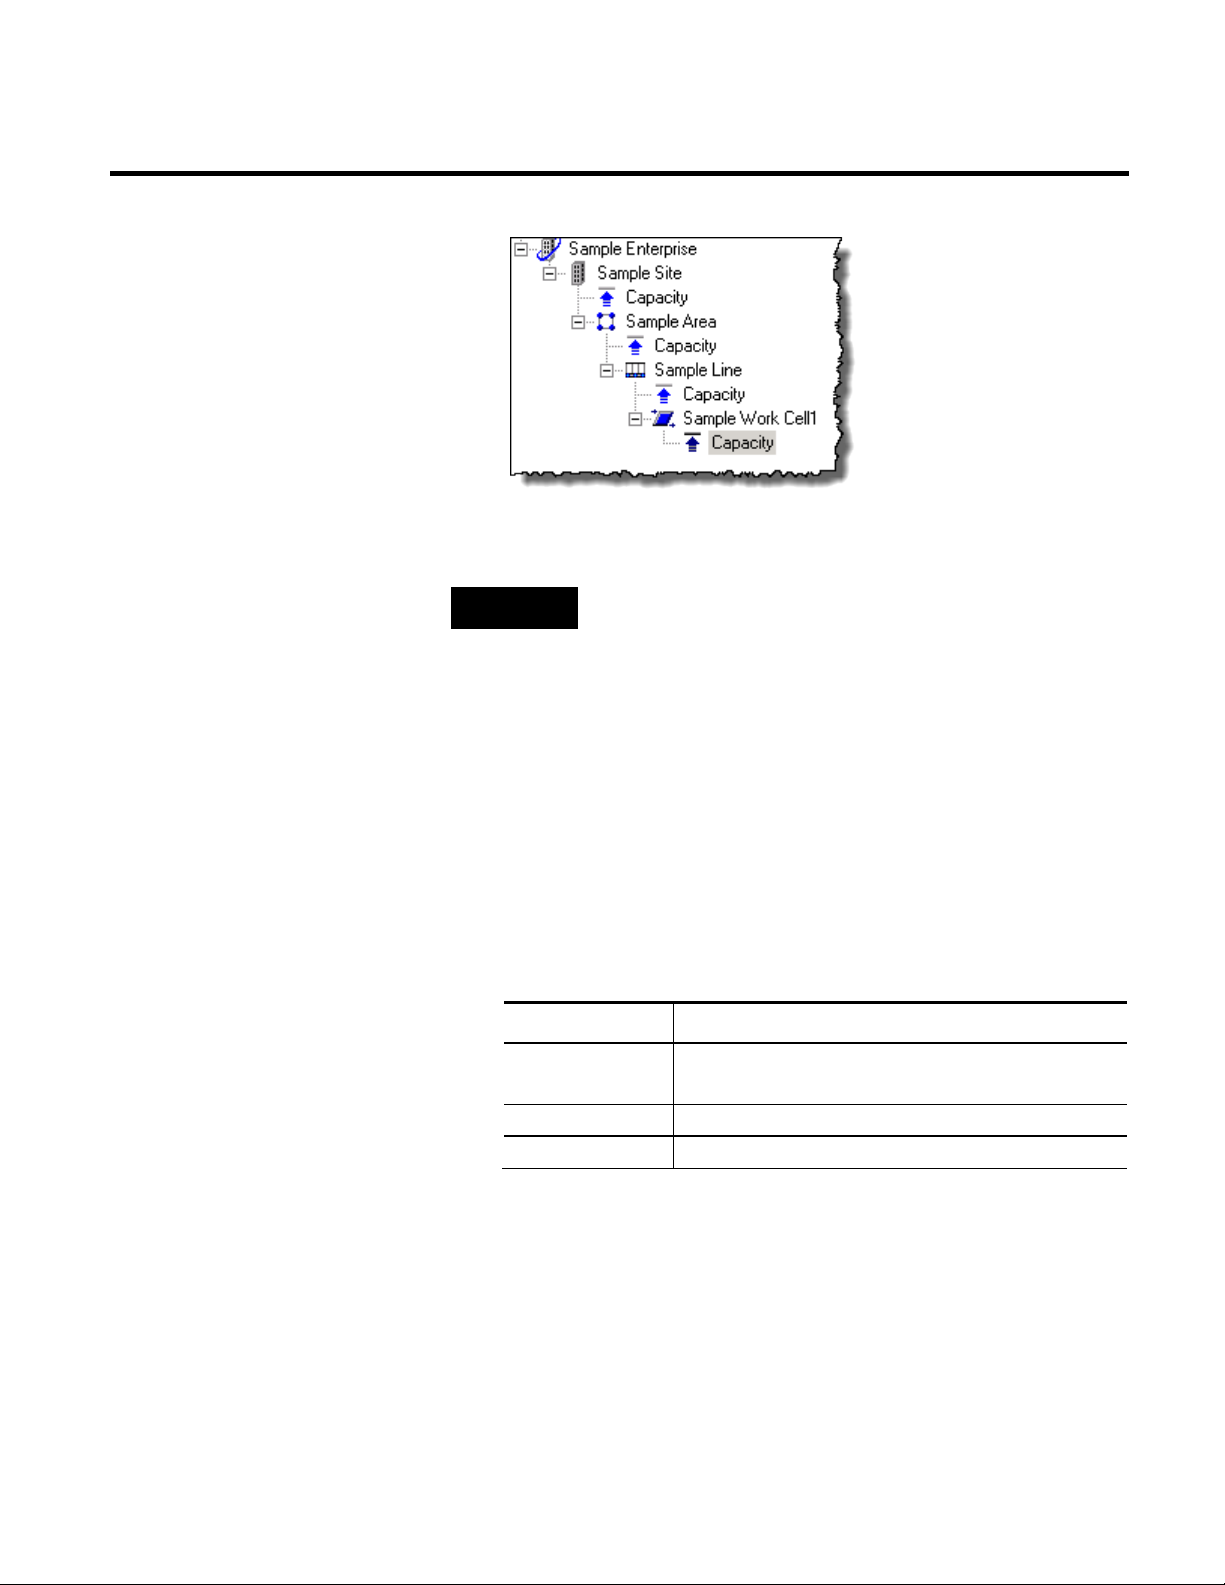
2. Right-click in the area under the plant model tree, and then
click New Root Enterprise.
A new enterprise is added to the tree.
Rockwell Automation Publication PLTMT-UM001M-EN-P-June 2014 21
3. Change the default name to
Sample Enterprise, and then press
Enter.
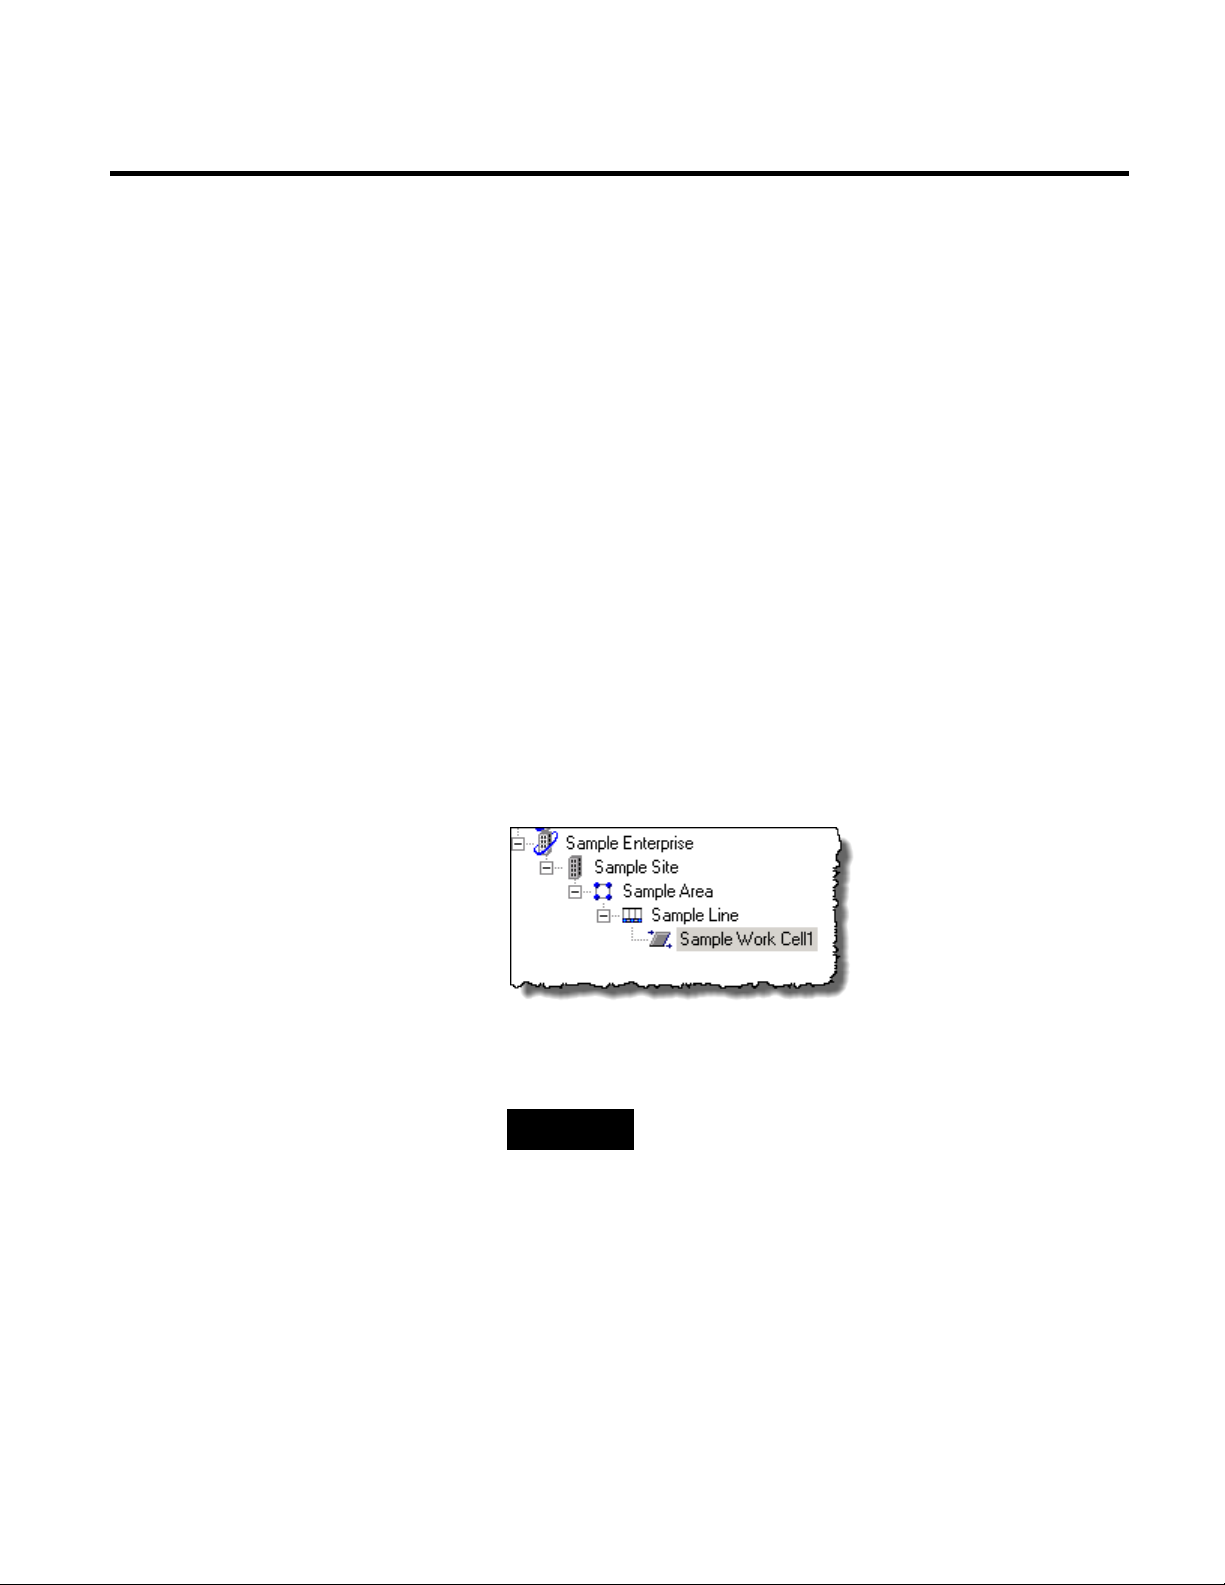
4. Right-click Sample Enterprise, and then click New Activity
Area > Site.
Page 22
Chapter 2 Getting Started
them with time patterns.
A new site is added to the tree.
5. Change the default name to
Sample Site.
6. Right-click Sample Site, and then click New Activity Area >
Area.
A new area is added to the tree.
7. Change the default name to
Sample Area.
8. Right-click Sample Area, and then click New Activity Area >
Line.
A new line is added to the tree.
9. Change the default name to
Sample Line.
10. Right-click Sample Line, and then click New Activity Area >
Work Cell.
A new workcell is added to the tree.
11. Change the default name to
Sample Work Cell 1.
22 Rockwell Automation Publication PLTMT-UM001M-EN-P-June 2014
12. Right-click each activity area that you have created, and then
click Add Capacity.
TIP
The capacity of an activity area describes its availability over
time.
Add capacity for your activity areas so that you can associate
Page 23
section "Clean installation: supported installation scenarios".
Item
Description
configured for your RSBizWare SQL Server database.
User
Type the user name of your RSBizWare database.
Password
Type the password for the RSBizWare database user.
Loading Sample Activity Areas
13. Click OK.
Getting Started Chapter 2
NOTE
Follow these steps on the database server computer, on which Report
Expert is installed. For more information, see the Administration Guide,
To load FactoryTalk Metrics sample data:
1. Go to Start > All Programs > Rockwell Software >
FactoryTalk Tools > Database Wizard.
The Database Load and Update wizard appears.
2. On the Welcome page, click Next.
3. On the Product and Database Connection page, provide the
following information:
ODBC DSN Select the name of the ODBC data source that you have
Rockwell Automation Publication PLTMT-UM001M-EN-P-June 2014 23
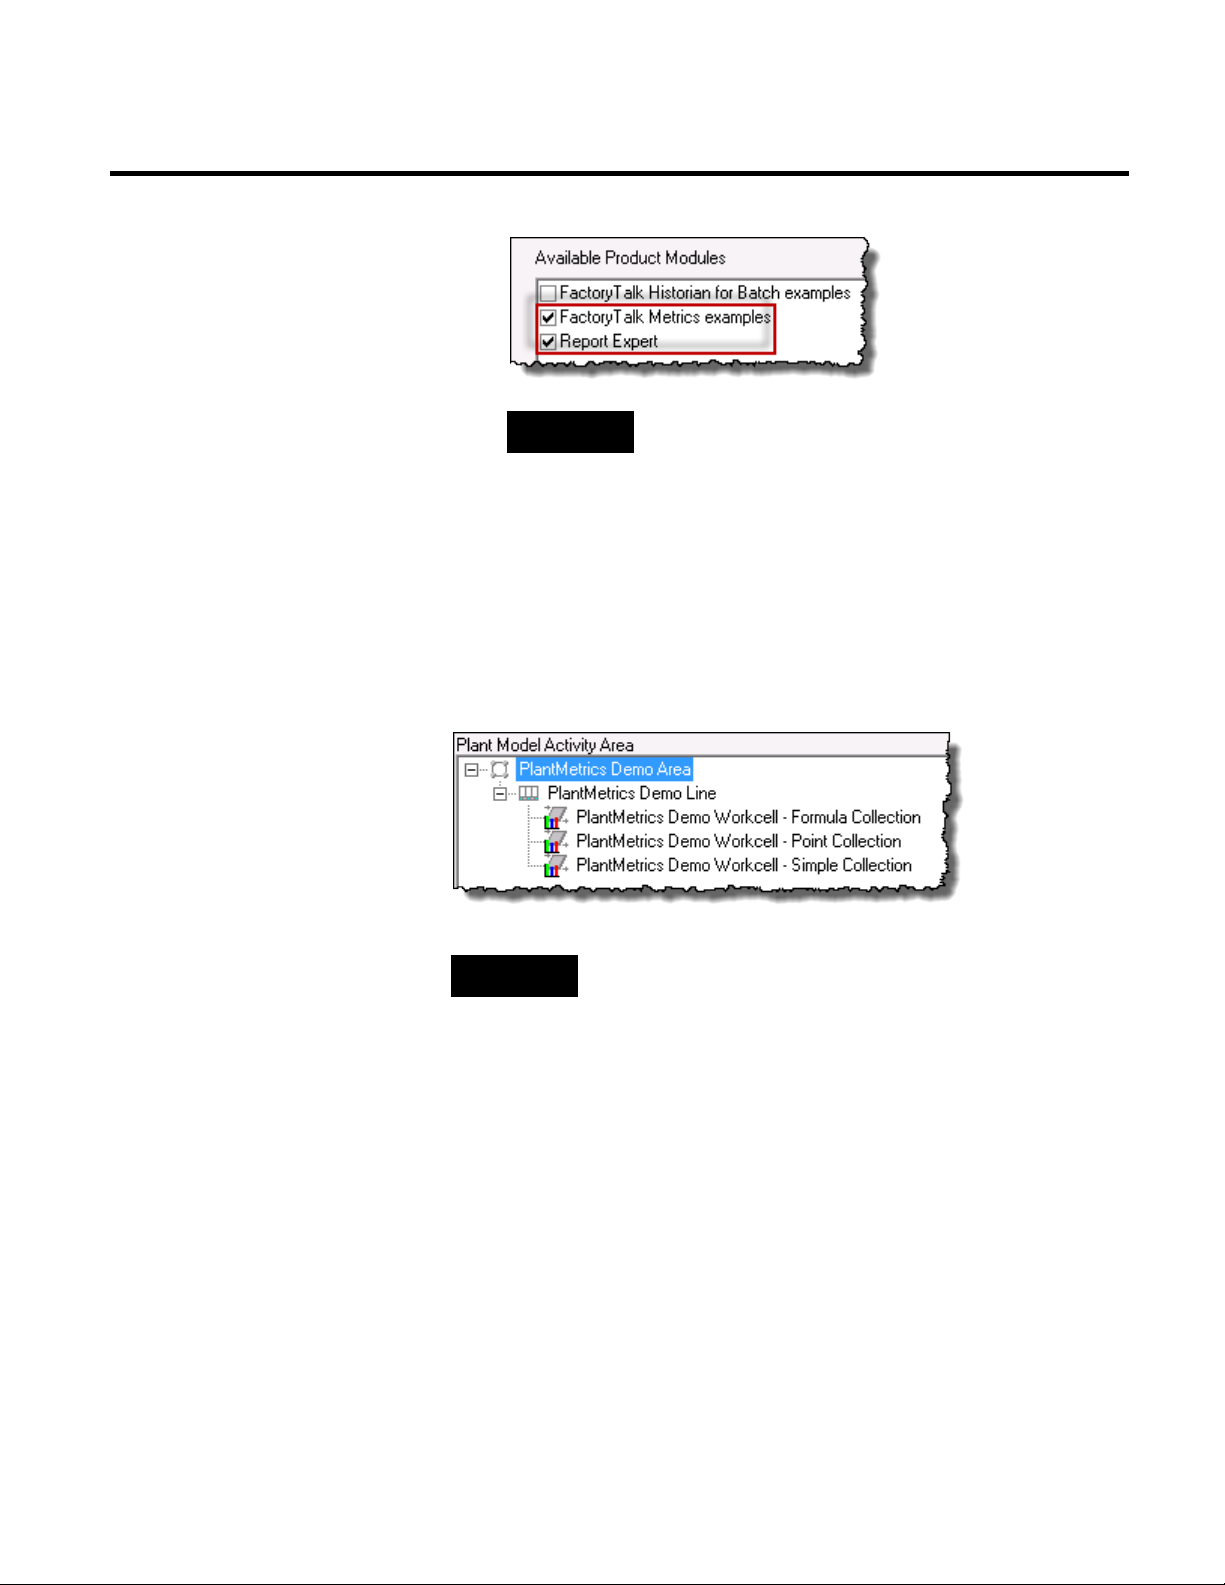
4. Click Connect. The Available Product Modules list is
populated with FactoryTalk components.
5. Under Available Product Modules, select these options:
Page 24
Chapter 2 Getting Started
Metrics and Report Expert sample data.
Parameters.
TIP
Select both options so that you have access to FactoryTalk
6. Click Finish to load data.
7. Click Close to exit the wizard.
Now you can examine the OEE performance parameters that are
configured for sample activity areas. The activity areas are listed in
the Manage Performance Parameters dialog box, under
PlantMetrics Demo Area.
TIP
To open the Manage Performance Parameters dialog box, on the
Configure menu, click FactoryTalk Metrics > Performance
24 Rockwell Automation Publication PLTMT-UM001M-EN-P-June 2014
Page 25

Collecting Part Count Data When the Metrics Server Manager Is Stopped
Chapter 3
Collecting Performance Data
The primary functions of FactoryTalk Metrics are collecting and
analyzing production data to provide performance ratings for every
activity area. Before the report designer can create performance
rating reports for the report user, the RSBizWare administrator
must set up the application to collect data from the control system.
This chapter will help you understand the two key categories of
ratings used to evaluate the performance of a production asset, and
understand how to identify and configure the data points that will
be used to collect the production data necessary to calculate
performance ratings.
We will:
• Define the OEE and Fault Metrics ratings.
• Configure the FactoryTalk Metrics application, including
plant model configuration, time pattern configuration, time
pattern exception configuration, composite time pattern
configuration, and performance parameter configuration.
• Start and stop data collection.
• Perform manual data collection.
The examples in "Analyzing FactoryTalk Metrics Data (page 171)"
will help you understand how to analyze the data that is collected in
FactoryTalk Metrics.
Rockwell Automation Publication PLTMT-UM001M-EN-P-June 2014 25
In version 7.0 of FactoryTalk Metrics a change was made to the way
the data collection is initialized. Prior to this it was possible to have
partial FactoryTalk Transaction Manager .rsl files (still stored on
Page 26

Chapter 3 Collecting Performance Data
disk when data collection started) processed as current data values.
This approach could lead to inaccurate count information being
recorded in the event of a part count reset in the control system. The
most serious effect of this issue was observed when the counter used
in a FactoryTalk Metrics part count formula was reset, and the
resulting formula evaluated to a negative number. The change
required that the initial data used as a baseline for calculations all
come from the same time period. In certain environments with
continuous counters that do not get reset, this change could result in
the loss of count data that was collected erroneously in previous
versions. The data collected this way can account for part counts
that were produced since the last time the Metrics server was
running.
In order to accommodate customers that found this data useful, the
Metrics Server Manager settings file
(PlantMetricsServerSettings.xml) can be configured so that it
forces the Metrics Server Manager to initialize its data in the pre-7.0
manner.
The file is located in the <ProgramFiles>\Rockwell
Software\RSBizWare folder. It contains the
InitializeFromSingleTimestamp tag. The tag is set by default to 1.
The default value causes the Metrics Server Manager to process data
in the standard way to prevent the inclusion of older data. If you
change the value to
0, the Metrics Server Manager will process data
regardless of its timestamp. This change may be appropriate for
some production environments, but in others may lead to incorrect
values being logged for count information.
For more information on the Metrics Server Manager settings file,
refer to "The Metrics Server Manager settings file" in the RSBizWare
Administration Guide.
26 Rockwell Automation Publication PLTMT-UM001M-EN-P-June 2014
Page 27

Collecting Performance Data Chapter 3
OEE Rating
FactoryTalk Metrics uses the OEE (Overall Equipment
Effectiveness) model to measure the performance of manufacturing
equipment. The OEE model yields a single performance rating for
every activity area (workcell, line, area, or plant) being monitored,
thereby providing a simple way to determine quickly if an activity
area is performing adequately. The OEE value can be used to assess a
single machine’s performance over time, or to compare the
performance of machines.
Three components contribute to the OEE value:
• Availability
The ratio of running time to available time.
Available time may be defined by a schedule, or modified by
planned downtime events such as preventive maintenance.
Available time may also be modified by events such as being
starved for parts or being blocked by a downstream process.
Availability = RunningTime / AvailableTime
• Throughput
The performance of a machine when it is running compared to
its ideal cycle time.
The ideal cycle time depends upon the product being
produced, and is measured in units of seconds per part.
Throughput = (TotalParts x IdealCycleTime) / RunningTime
• Quality
The percentage of good parts that are produced.
GoodParts = TotalParts – Scrap
Quality = GoodParts ⁄ TotalParts
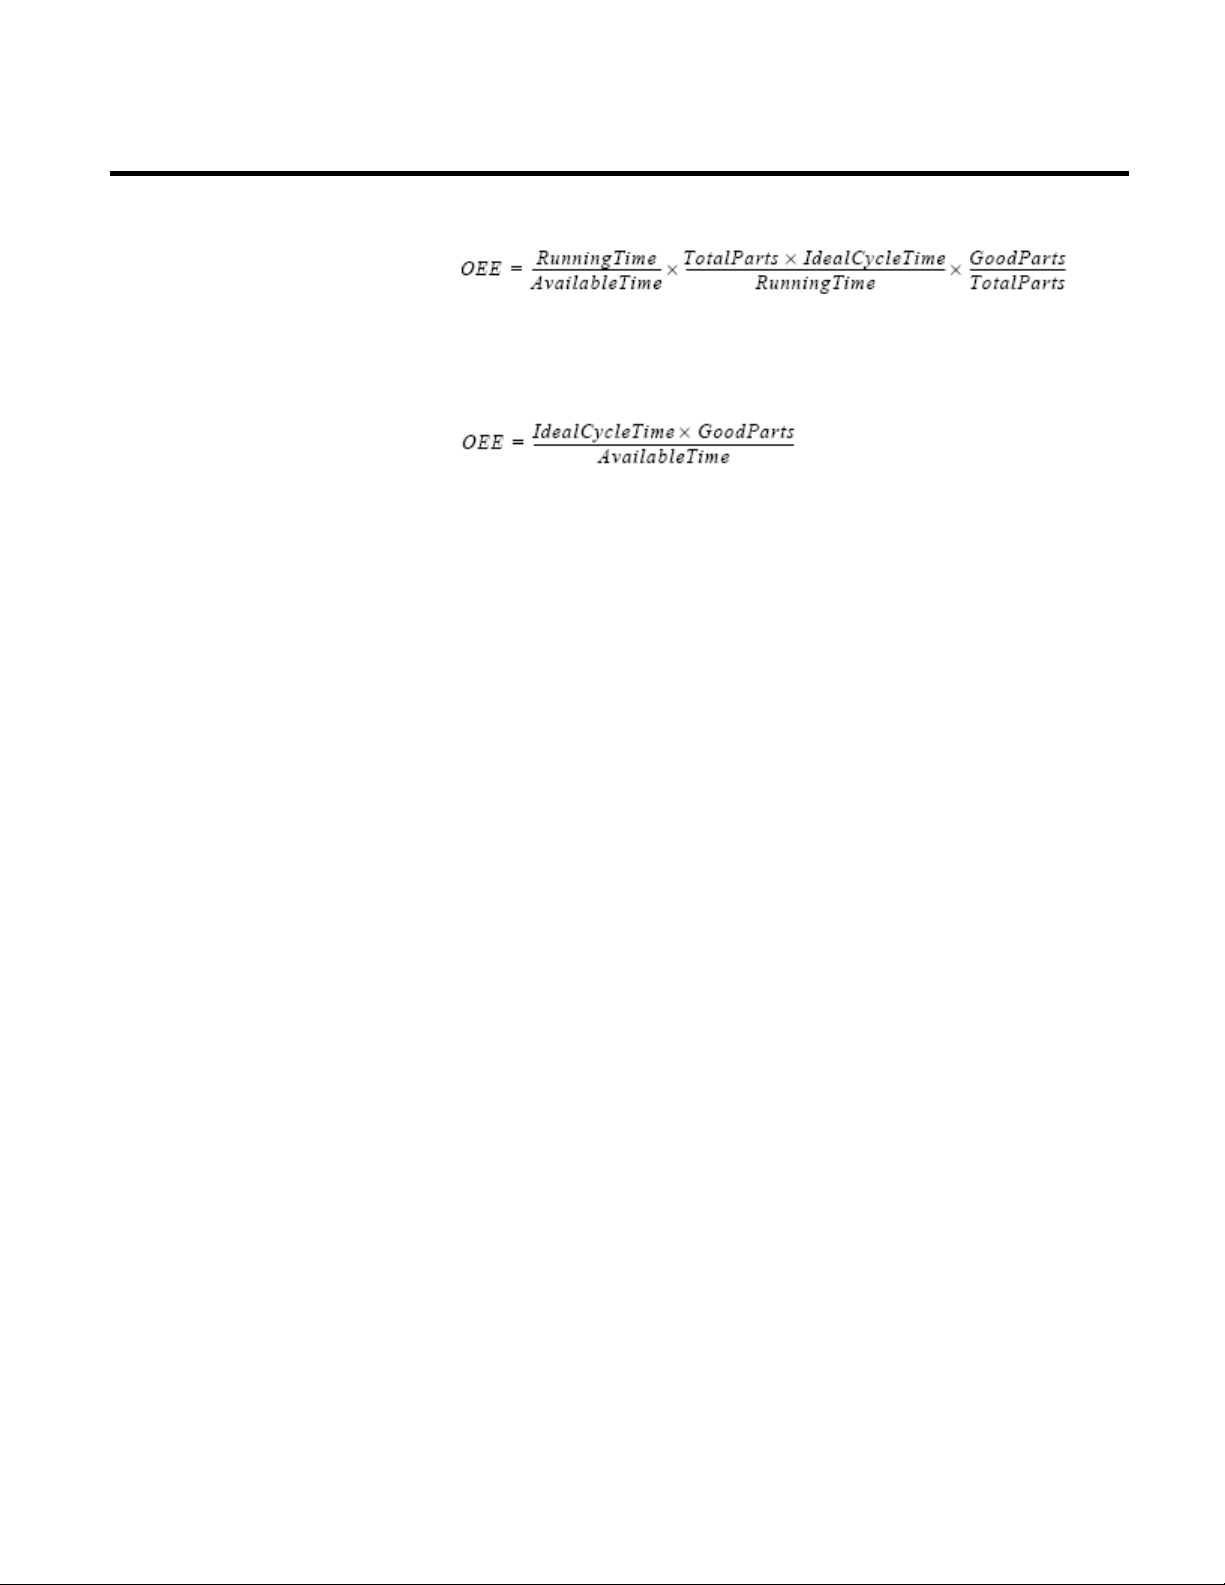
The OEE calculation that is used by FactoryTalk Metrics is the
product of these three components:
OEE = Availability × Throughput × Quality
Rockwell Automation Publication PLTMT-UM001M-EN-P-June 2014 27
Page 28
Chapter 3 Collecting Performance Data
Fault Metrics Ratings
Mean Time Between Failure
This reduces to:
FactoryTalk Metrics gathers and stores all of the raw data necessary
to make this calculation for specific time periods, as well as by
activity area, by part number, and by shift. All of the individual
components of the calculation are stored and available for analysis.
OEE is a valuable method of analyzing performance, because it is
widely recognized and can be applied to any type of industry, factory,
or machine. However, it is merely the default efficiency calculation
performed by FactoryTalk Metrics, and additional or alternate
calculations can be implemented. Furthermore, FactoryTalk Metrics
supports the collection of detailed event data, which can be used to
analyze the specific causes of inefficiencies.
FactoryTalk Metrics uses the Fault Metrics ratings to measure the
reliability of manufacturing equipment. These metrics provide a
simple way to determine quickly if an activity area is performing
reliably. The Fault Metrics values can be used to assess a single
machine’s reliability over time, or to compare the reliability of
machines to each other.
MTBF = Uptime ⁄ FaultCount
Mean Time Between Failure (MTBF) is the ratio of running time to
the total number of failures. It measures the average amount of time
when a piece of equipment was in a running state between failures.
MTBF is a derived field that contains aggregate functions and, as
28 Rockwell Automation Publication PLTMT-UM001M-EN-P-June 2014
Page 29

Collecting Performance Data Chapter 3
Area (page 81)”.
To define time patterns, configure composites, and schedule exceptions,
RSBizWare administrator.
Mean Time To Repair
Configuring Activity Area Schedules
Time Patterns
such, can only be used in summary report objects and cannot have
aggregate functions applied.
MTTR = FaultTime ⁄ FaultCount
Mean Time to Repair (MTTR) is the ratio of the time spent in a
failure state to the total number of failures. It measures the average
amount of time when a piece of equipment was in a failure state.
MTTR is a derived field that contains aggregate functions and, as
such, can only be used in summary report objects and cannot have
aggregate functions applied.
NOTE
To collect fault metrics for an activity area, you will need to create
custom events for the workcell. For information on creating custom
events, see “Viewing the Performance Parameter Events for an Activity
FactoryTalk Metrics allows you to create time patterns that will be
used to calculate the amount of available time for an activity area.
The OEE calculation is based on available time, so the calculation
will not be accurate unless the available time is defined accurately.
It is not necessary for you to use a time pattern to define available
time for an activity area; however, if you do, the OEE calculation for
the activity area will not be negatively impacted by the periods of
time when the activity area is scheduled to be unavailable (e.g.,
weekends or evenings).
NOTE
you must be granted the Manage Time Pattern privilege by your
A time pattern defines the availability of an activity area over time,
which repeats as necessary during the activity area schedule. We can
define the following durations of repeating periods:
Rockwell Automation Publication PLTMT-UM001M-EN-P-June 2014 29
Page 30

Chapter 3 Collecting Performance Data
Configuring Time Patterns
• Day
A time pattern for a 24-hour day.
• Week
A time pattern for a standard 7-day week.
• Custom
A time pattern for arbitrary duration, e.g., a 14-day cycle or an
8-hour shift.
A time pattern is composed of a default value and a series of time
spans. The default value defines the value of the time pattern during
intervals where no time span is specified. Each time span specifies
the start time, end time, value (e.g., Available, Unavailable), and the
optional report name for the span. The default value for the time
pattern and the value for the time span can be a named state, a
numeric value, or another time pattern. Named states are simply a
set of values (e.g., 1, 0) to which you have applied descriptions (e.g.,
Available, Unavailable).
The sample time patterns available with FactoryTalk Metrics consist
of three 8-hour shift periods, each with a 30-minute break
(Unavailable), that make up the work day. The time pattern applies
Monday through Friday, and the facility is closed (Unavailable)
during the weekends.
The ability to reference other time patterns allows you to build time
patterns from other time patterns.
In the following tutorials you will create sample shift time patterns
in the Configuration Console: a Work Day time pattern that is
made up of shifts, and a Work Week time pattern made up of five
Work Days.
30 Rockwell Automation Publication PLTMT-UM001M-EN-P-June 2014
Page 31

Collecting Performance Data Chapter 3
To configure time patterns:
1. On the Configure menu, click Time Pattern.
The Time Patterns dialog box appears.
2. On the File menu, click New Folder.
A new folder is added to the Time Patterns tree.
3. Change the default name to
My Time Patterns, and then press
Enter.
4. Right-click My Time Patterns, and then click New Time
Pattern.
A new time pattern is added to the My Time Patterns folder.
Rockwell Automation Publication PLTMT-UM001M-EN-P-June 2014 31
Page 32

Chapter 3 Collecting Performance Data
5. Change the default name to Shift A, and then press Enter.
In the right pane of the dialog box, the default settings of your
new time pattern are displayed.
TIP
The State value type set to Unavailable indicates that any
periods of time that are not listed as Available in the Time
Spans list will be considered Unavailable.
6. Clear the Lock Times check box.
The shift times will be relative to the start and end times
specified in the Work Day time pattern.
7. Under Duration, click
.
The Time Pattern Duration dialog box appears.
8. Under Duration Type, select Custom, and set the duration to
8 Hours.
9. Click OK.
10. Under Report Name, type
32 Rockwell Automation Publication PLTMT-UM001M-EN-P-June 2014
Shift A.
Page 33

Collecting Performance Data Chapter 3
shift time”.
11. Under Time Spans, right-click the area and then click New
Time Span.
The Time Span dialog box appears.
12. Make sure that the value type is set to State and the value is set
to Available.
13. Set the start time of the shift to
NOTE
Since the shift times are relative, the start time in this example means
0:00, and the end time to 4:00.
“the start time of the shift”, and the end time means “4 hours into the
14. Click OK.
The new time span appears under Time Spans.
15. Repeat steps 11-14, and create another time span with the start
time set to
Rockwell Automation Publication PLTMT-UM001M-EN-P-June 2014 33
4:30, and the end time set to 8:00.
Page 34

Chapter 3 Collecting Performance Data
unavailable shows 0 capacity in the time pattern chart.
Configuring Work Day Time Patterns
NOTE
Since the default value of the time pattern is Unavailable, the
half hour between the time spans is considered unavailable,
because it has not been defined as available. A time span that is
16. Under Time Patterns, right-click Shift A, and then click
Duplicate.
A copy of the shift is added to the tree.
17. Change the name of the shift to
18. Under Report Name, type
Shift B.
Shift B.
19. Under Time Patterns, right-click Shift B, and then click
Duplicate.
A copy of the shift is added to the tree.
20. Change the name of the shift to
21. Under Report Name, type
Shift C.
Shift C.
34 Rockwell Automation Publication PLTMT-UM001M-EN-P-June 2014
To configure a Work Day time pattern:
1. In the Time Patterns dialog box, right-click My Time
Patterns, and then click New Time Pattern.
A new time pattern is added to the tree.
2. Change the default name to
Work Day.
Page 35

Collecting Performance Data Chapter 3
3. Under Time Spans, right-click the area and then click New
Time Span.
The Time Span dialog box appears.
4. Under Value Type, select Time Pattern.
With the Time Pattern option, you will create a time pattern
for a particular shift.
5. Under Value, select Shift A.
6. Set the start time to
0:00 (midnight), and the end time to 8:00
(AM).
7. Click OK.
8. Under Time Spans, right-click the area and then click New
Time Span.
The Time Span dialog box appears.
9. Under Value Type, select Time Pattern.
10. Under Value, select Shift B.
Rockwell Automation Publication PLTMT-UM001M-EN-P-June 2014 35
Page 36

Chapter 3 Collecting Performance Data
Configuring Work Week Time Patterns
11. Set the start time to 8:00 (AM), and the end time to 16:00 (4
PM).
NOTE
Type the time in the 24-hour format.
12. Click OK.
13. Under Time Spans, right-click the area and then click New
Time Span.
The Time Span dialog box appears.
14. Under Value Type, select Time Pattern.
15. Under Value, select Shift C.
16. Set the start time to
16:00 (4 PM), and the end time to 24:00
(midnight).
36 Rockwell Automation Publication PLTMT-UM001M-EN-P-June 2014
To configure a Work Week time pattern:
1. In the Time Patterns dialog box, right-click My Time
Patterns, and then click New Time Pattern.
A new time pattern is added to the tree.
2. Change the default name to
3. Under Duration, click
Work Week.
.
The Time Pattern Duration dialog box appears.
4. Under Duration Type, select 1 Week.
Page 37

Collecting Performance Data Chapter 3
Value Type
Time Pattern
Value
Work Day
Start
Tuesday 0:00
End
Wednesday 0:00
For this item:
Select:
Value Type
Time Pattern
Value
Work Day
Start
Wednesday 0:00
End
Thursday 0:00
5. Click OK.
6. Under Time Spans, right-click the area and select New Time
Span.
The Time Span dialog box appears.
7. Under Value Type, select Time Pattern.
8. Under Value, select Work Day.
9. Under Start, select
10. Under End, select
Monday 0:00 (Monday at midnight).
Tuesday 0:00 (Tuesday at midnight).
11. Click OK.
12. Repeat steps 6-11, and create the following time spans:
Time span for Tuesday
For this item: Select:
Time span for Wednesday
Rockwell Automation Publication PLTMT-UM001M-EN-P-June 2014 37
Page 38

Chapter 3 Collecting Performance Data
Value Type
Time Pattern
Value Type
Time Pattern
Value
Work Day
Start
Friday 0:00
End
Saturday 0:00
Composites and Schedule Exceptions
Time span for Thursday
For this item: Select:
Value Work Day
Start Thursday 0:00
End Friday 0:00
Time span for Friday
For this item: Select:
38 Rockwell Automation Publication PLTMT-UM001M-EN-P-June 2014
Your My Time Patterns folder should contain now the
following time patterns:
A composite is a base time pattern that is associated with an activity
area. A time pattern defines the normal schedule for the activity area,
and a composite may have exceptions that define any changes to the
normal schedule. These exceptions may be outages (unavailable
times) such as holidays or planned maintenance periods, or
Page 39

Collecting Performance Data Chapter 3
Configuring Composites and Schedule Exceptions
additional available times such as overtime hours or extended
seasonal hours.
In this tutorial you will use your Work Week time pattern created
in "Configuring Work Week Time Patterns (page 36)", as the base
time pattern for your Sample Line and Sample Work Cell 1
created in "Configuring the Plant Model (page 21)". You will also
schedule an exception for the New Year's Day.
To configure a composite and schedule exceptions:
1. On the Configure menu, click Composite Time Pattern.
The Composite Time Patterns dialog box appears.
2. Under Elements, expand the Sample Enterprise item until
you get to the Sample Line item.
3. Expand Sample Line, and then click Capacity.
4. In the right pane of the dialog box, under Exceptions,
right-click the area and select New.
The Exception dialog box appears.
Rockwell Automation Publication PLTMT-UM001M-EN-P-June 2014 39
Page 40

Chapter 3 Collecting Performance Data
the arrows to move them under Application.
The activity area for which you are scheduling an exception (in
this tutorial it is Sample Line), is listed in the right pane of the
dialog box, under Application.
TIP
Exceptions are created for the activity areas that are listed under
Application.
If you want to add several activity areas to the exception that
you are configuring, select them under Elements, and then use
40 Rockwell Automation Publication PLTMT-UM001M-EN-P-June 2014
5. Under Description, type
New Year’s Day.
6. Leave the default values under Value Type (State) and Value
(Unavailable).
7. Under Start Date, select
8. Under End Date, select
Friday, January 02, 2015 at 0:0.
Saturday, January 03, 2015 at 0:0.
Page 41

Collecting Performance Data Chapter 3
Configuring OEE Performance Parameters For Activity Areas
9. Click OK.
The new exception appears under Exceptions in the
Composite Time Patterns dialog box.
After you have created a plant model and a time pattern, and
associated the time pattern with activity areas in the plant, you can
set additional parameters that will be used to measure the OEE
rating and gather custom events for these activity areas.
FactoryTalk Metrics provides a great deal of flexibility in
configuring the parameters that will be used to measure the OEE
rating of an activity area. At a minimum, you must provide the
following information:
• The FactoryTalk Transaction Manager configuration that will
be the link to the control system.
• The amount of time it should take the activity area to produce
one good part (ideal cycle time).
• The control system counter keeping track of production
counts.
Rockwell Automation Publication PLTMT-UM001M-EN-P-June 2014 41
Page 42

Chapter 3 Collecting Performance Data
RSBizWare administrator.
For more sophisticated configurations, you can define other key
parameters and custom events. You can connect many of the
parameters either to a data point in the control system or to a
formula. Depending on the sophistication of your control system,
you can use a combination of data points and formulas. This tutorial
illustrates the different methods that you can use to configure
performance parameters.
NOTE
To configure OEE performance parameters for an activity area, you must
be granted the Manage Performance Parameters privilege by your
Use the Configuration Console to configure the performance
parameters.
To select an activity area for configuration:
1. On the Configure menu, click FactoryTalk Metrics >
Performance Parameters.
The Manage Performance Parameters dialog box appears.
2. In the tree, select the activity area for which you want to
configure performance parameters.
For this tutorial, select your Sample Work Cell 1.
42 Rockwell Automation Publication PLTMT-UM001M-EN-P-June 2014
3. Click Configure.
The Configure Performance Parameters dialog box appears.
Page 43

Collecting Performance Data Chapter 3
In this dialog box you can configure the parameters that will be
used to collect performance data and measure the OEE rating
for the activity area.
The upper section of the dialog box provides basic information
on the activity area that you have selected, and the following
options that you can use with your activity area:
• Enable Manual Activity Area
Select this option if you want to create a manual workcell.
This indicates that the activity area can be configured
without data points assigned.
For more information, refer to "Configure FactoryTalk
Metrics Data Collection Parameters" in the Configuration
Console Online Help.
If the FactoryTalk Transaction Manager configuration
associated with this activity area is running and enabled for
online edits, you can edit the performance parameters of the
selected activity area without stopping the configuration. If
the configuration is running and not enabled for online
edits, you cannot make changes to the configuration until
the configuration is stopped.
The FactoryTalk Transaction Manager Live Data
Migration Tool allows you to enable configurations that are
not currently enabled for online edits. For additional
information about editing a running configuration and
using the FactoryTalk Transaction Manager Live Data
Migration Tool, refer to the Online Edits Tutorial in the
FactoryTalk Transaction Manager online help.
• Enable Data Collection for this Plant Model Activity
Area
Rockwell Automation Publication PLTMT-UM001M-EN-P-June 2014 43
Page 44

Chapter 3 Collecting Performance Data
which the Configuration Console is connected.
Configuring Data Collection
Configuring Cycle Time
Select this option if you want to start the data collection for
the activity area that you have selected.
NOTE
Enabling the data collection for the activity area also consumes
one workcell license for the Information Services Manager to
To configure the Data Collection:
• In the list, select a FactoryTalk Transaction Manager
configuration for data collection.
Make sure you have a FactoryTalk Transaction Manager
configuration defined in the Service Console. For more
information, see the RSBizWare Administration Guide,
"Configuring data collection".
How do I access the dialog box?
1. On the Configure menu, click FactoryTalk Metrics >
Performance Parameters.
The Manage Performance Parameters dialog box appears.
2. Select the activity area for which you want to associate
machine states, and then click Configure.
The Configure Performance Parameters dialog box appears.
3. If necessary, select the FactoryTalk Transaction Manager
configuration for the activity area.
4. In the left pane of the dialog box, click Cycle Time Part Id.
44 Rockwell Automation Publication PLTMT-UM001M-EN-P-June 2014
Page 45

Collecting Performance Data Chapter 3
The Ideal Cycle Time parameter is part of the Throughput value in
the OEE equation. It indicates the time, in seconds, which the
activity area should take to produce a single good part. It can have a
decimal value. If the activity area produces parts faster than the ideal
cycle time, the OEE rating will improve. If the activity area produces
parts slower than the ideal cycle time, the OEE rating will
deteriorate.
To configure the Ideal Cycle Time:
Under Ideal Cycle Time, in the Cycle Time Type list, select one of
the following options:
• Use a single Ideal Cycle Time
Select this option if the activity area always takes the same
amount of time to produce each part, regardless of what type
of part is being produced. Parts that take longer than the
specified cycle time will negatively impact the OEE rating.
In the Cycle Time box, specify the part production time in
seconds.
• Use a PartId/Cycle Time List
Select this option if you want to improve the accuracy of the
OEE rating. With this option, the application uses the
specified lookup list to find the Ideal Cycle Time for the type
of part that is being produced. This assumes that the activity
area always takes the same amount of time to produce a certain
type of part.
Rockwell Automation Publication PLTMT-UM001M-EN-P-June 2014 45
Page 46

Chapter 3 Collecting Performance Data
Lookup List (page 47)".
In the Lookup list, select the lookup list that you want to use:
• Click Create List to create a new list.
• Click Edit List to modify the list that you have selected.
TIP
For more information on creating and editing Part
Id/Cycle Time lists, see "Configuring a Part ID/Cycle Time
• Monitor an Unscheduled data point for Ideal Cycle Time
Select this option to obtain the most accurate ideal cycle time.
With this option, the control system specifies the amount of
time it should take to produce a good part.
You can either only select a data point or first select a data
point as the ideal cycle time event trigger, and then set the
actual ideal cycle time using a FactoryTalk Transaction
Manager expression:
46 Rockwell Automation Publication PLTMT-UM001M-EN-P-June 2014
1. Click Select.
The Select Data Point dialog box appears.
2. Under Filtering Tools, in the FT Transaction Manager
Topic/Device list, select the device from which you want
to load data points.
3. At the top of the dialog box, click Refresh Points.
The Data Points area at the bottom of the dialog box is
populated with data points for the selected device.
4. Double-click the data point that you want to use.
The data point appears in the Data Point box in the
Configure Performance Parameters dialog box.
Page 47

Collecting Performance Data Chapter 3
Clear.
Configuring a Part ID/Cycle Time Lookup List
TIP
To delete the data point that you have selected, click
5. (Optional) Set the actual ideal cycle time using a
FactoryTalk Transaction Manager expression:
1. Select the Use a FactoryTalk Transaction Manager
Expression to determine the Ideal Cycle Time value
check box.
2. Click Edit.
The Expression Editor - Ideal Cycle Time Expression
dialog box appears.
3. Create or modify the expression that you want to use.
If you use a FactoryTalk Transaction Manager
expression, the only data point it can reference is the one
that you have provided in the Data Point box.
How do I access the dialog box?
1. On the Configure menu, click FactoryTalk Metrics >
Lookup Lists > Part Id/Cycle Times.
The Part Id/Cycle Time Lookup List dialog box appears.
2. Do either of the following:
• Click Add.
• Select a lookup list, and then click Edit.
The Part Id/Cycle Time List Configuration dialog box
appears.
Use the Part Id/Cycle Time List Configuration dialog box to
configure a Part Id/Cycle Time Lookup List and its parameters:
• Default cycle time for Total Parts.
Rockwell Automation Publication PLTMT-UM001M-EN-P-June 2014 47
Page 48

Chapter 3 Collecting Performance Data
Configuring the Default Cycle Time for Total Parts
Configuring Ideal Cycle Time Values for Individual Part Ids
• Cycle times for individual Part Ids.
Click the links below to learn how to:
• Configure the default cycle time for Total Parts. (page 48)
• Configure the ideal cycle time values for individual Part Ids.
(page 48)
• Manage Part Id configurations. (page 49)
• Import the cycle time values for individual Part Ids. (page 49)
To configure the default Cycle Time for Total Parts:
1. In the List Description box, type a name for the new Part
Id/Cycle Time lookup list.
The name will be displayed in the Part Id/Cycle Time Lookup
list in the Part Id/Cycle Time section of the Configure
Performance Parameters dialog box.
2. In the Default Cycle Time box, type a value for the default
cycle time for Total Parts in seconds.
To configure the Ideal Cycle Time values for individual Part Ids:
1. Under Part Ids and Cycle Times, click Add.
2. The Part Id/Cycle Time Values dialog box appears.
48 Rockwell Automation Publication PLTMT-UM001M-EN-P-June 2014
3. In the Part Id box, type the name of the Part Id for which you
want to set the cycle time.
Page 49

Collecting Performance Data Chapter 3
Managing Part Id Configurations
Importing Cycle Time Values for Individual Part Ids
4. In the Cycle Time box, type an ideal cycle time value in
seconds.
5. Click OK.
The Part Id and its cycle time value appear under Part Ids and
Cycle Times in the Part Id/Cycle Time List Configuration
dialog box.
6. Repeat the steps for other Part Ids for which you want to set
individual ideal cycle time values.
To manage Part Id configurations:
• To edit a Part Id configuration, click the Part Id item under
Part Ids and Cycle Times, and then click Edit.
The Part Id/Cycle Time Values dialog box appears.
• To delete a Part Id configuration, click Delete.
To import Part Id configurations:
1. Create a text file with Part Id configurations.
2. In the file, type the data in the order in which it will be
displayed in the dialog box, that is:
<Part Id>,<Ideal cycle time>
3. Separate each chunk of data with a comma, for example:
AAA,2
4. Save the file in the .csv format.
5. Under Previous Import File Path, click Import.
If there are Part Id configurations defined in the dialog box,
the following message appears:
Rockwell Automation Publication PLTMT-UM001M-EN-P-June 2014 49
Page 50

Chapter 3 Collecting Performance Data
Configuring Part Id
6. Click Yes.
The Open dialog box appears.
7. Navigate to the file that you want to import, and then click
Open.
The table under Part Ids and Cycle Times is populated with
the data imported from the file.
How do I access the dialog box?
1. On the Configure menu, click FactoryTalk Metrics >
Performance Parameters.
The Manage Performance Parameters dialog box appears.
2. Select the activity area for which you want to associate
machine states, and then click Configure.
The Configure Performance Parameters dialog box appears.
3. If necessary, select the FactoryTalk Transaction Manager
configuration for the activity area.
4. In the left pane of the dialog box, click Cycle Time Part Id.
50 Rockwell Automation Publication PLTMT-UM001M-EN-P-June 2014
Page 51

Collecting Performance Data Chapter 3
The Part Id parameter tells FactoryTalk Metrics what type of part is
being produced by the activity area. Changes in the Part Id value
allow FactoryTalk Metrics to track what type of part is being
produced. If you always know what kind of part the activity area is
producing, you can obtain the OEE ratings for the activity area
sorted by part.
To configure the Part Id:
Under Part Id, in the Part Id Type list, select one of the following
options:
• Do not monitor Part Id
Select this option if the application does not have information
about the types of parts the activity area is producing. The
OEE rating for the activity area will always be based on all
parts produced by the activity area.
• Use a single Part Id
Select this option if the activity area produces only one type of
part, and the OEE rating for the activity area will always be
associated with that particular type of part.
In the Part Id box, type the part ID.
• Monitor an Unscheduled data point for Part Id
Rockwell Automation Publication PLTMT-UM001M-EN-P-June 2014 51
Page 52

Chapter 3 Collecting Performance Data
Clear.
Configuring Summarization Criteria
Select this option if you want to monitor a data point in the
control system to determine the type of part being produced.
Changes in the Part Id value allow FactoryTalk Metrics to
track operation conditions to the type of part being produced.
If FactoryTalk Metrics knows what kind of part the activity
area is producing, you can obtain the OEE rating for the
activity area when it is producing a specific type of part:
1. Click Select.
The Select Data Point dialog box appears.
2. Under Filtering Tools, in the FT Transaction Manager
Topic/Device list, select the device from which you want
to load data points.
3. At the top of the dialog box, click Refresh Points.
The Data Points area at the bottom of the dialog box is
populated with data points for the selected device.
4. Double-click the data point that you want to use.
The data point appears in the Data Point box in the
Configure Performance Parameters dialog box.
TIP
To delete the data point that you have selected, click
How do I access the dialog box?
1. On the Configure menu, click FactoryTalk Metrics >
Performance Parameters.
The Manage Performance Parameters dialog box appears.
2. Select the activity area for which you want to associate
machine states, and then click Configure.
52 Rockwell Automation Publication PLTMT-UM001M-EN-P-June 2014
The Configure Performance Parameters dialog box appears.
Page 53

Collecting Performance Data Chapter 3
administrator in the Service Console.
3. If necessary, select the FactoryTalk Transaction Manager
configuration for the activity area.
4. In the left pane of the dialog box, click Summarization
Criteria.
Summarization criteria take the form of a user-defined parameter,
similar to the Shift, Part Id, and Ideal Cycle Time parameters, for
which data can be collected. When the value of the parameter
changes, it triggers the summarization of historical performance data
for the activity area. The collected values can then be used to filter
OEE performance data for the activity area. For example, if your
system is configured to collect a user-defined summarization
criterion called Operator ID, you will be able to calculate the OEE
performance for the selected activity area when a particular operator
is running this equipment.
NOTE
User-defined summarization criteria are defined by the RSBizWare
To configure summarization criteria:
1. In the Select Summarization Criteria list, select the
parameter for which you want to collect data.
2. Select one of the following options:
• Do Not Monitor the selected Summarization Criteria
for the Plant Model Activity Area.
Rockwell Automation Publication PLTMT-UM001M-EN-P-June 2014 53
Page 54

Chapter 3 Collecting Performance Data
Select this option if you do not want the application to
collect values for this parameter. The OEE rating for the
activity area will always be based on all user-defined
summarization criterion values of this type.
• Specify a default Summarization Criteria Value for this
Plant Model Activity Area.
Select this option if you want to set a single value for the
summarization criterion. The OEE rating for the activity
area will always be based on this value. For example, if a
particular operator always runs this piece of equipment, you
may set the Operator ID parameter as the default value.
In the Value box, type the name of the parameter that you
want to use.
• Specify an Unscheduled Data Point to provide
Summarization Criteria information for this Plant
Model Activity Area.
Select this option if you want to monitor a data point in the
control system to determine the value for the
summarization criterion. Changes in the value allow
FactoryTalk Metrics to track operation conditions to a
specific value. For example, for the Operator ID, this would
allow FactoryTalk Metrics to track which operator is
running the machinery, and allow you to obtain the OEE
rating for the activity area if a specific operator is running
the machinery:
1. Click Select.
The Select Data Point dialog box appears.
54 Rockwell Automation Publication PLTMT-UM001M-EN-P-June 2014
Page 55

Collecting Performance Data Chapter 3
Clear.
Configuring Part Count
2. Under Filtering Tools, in the FT Transaction
Manager Topic/Device list, select the device from
which you want to load data points.
3. At the top of the dialog box, click Refresh Points.
The Data Points area at the bottom of the dialog box is
populated with data points for the selected device.
4. Double-click the data point that you want to use.
The data point appears in the Data Point box in the
Configure Performance Parameters dialog box.
TIP
To delete the data point that you have selected, click
How do I access the dialog box?
1. On the Configure menu, click FactoryTalk Metrics >
Performance Parameters.
The Manage Performance Parameters dialog box appears.
2. Select the activity area for which you want to associate
machine states, and then click Configure.
The Configure Performance Parameters dialog box appears.
3. If necessary, select the FactoryTalk Transaction Manager
configuration for the activity area.
4. In the left pane of the dialog box, click Part Count.
Rockwell Automation Publication PLTMT-UM001M-EN-P-June 2014 55
The Part Count parameter is part of the Throughput value in the
OEE equation. It indicates how many parts have been produced by
the activity area. FactoryTalk Metrics compares the rate of items
produced to the value given for the ideal cycle time, so the unit of
measure is not important (however, it must be the same unit of
measure as the ideal cycle time).
Page 56

Chapter 3 Collecting Performance Data
Good, Scrap/Bad).
part count types.
It is important to make sure that the total part counter and the
good/bad part counter fire at the same time (e.g., when the part
leaves the activity area). If the total part counter fires when a part
arrives, but the good/bad part counter does not fire until the part
leaves, the two part counters may be incremented in different
summarization periods, resulting in misleading part counts in
reports.
To configure the Part Count parameter:
1. Click the tab for the type of part count you want to collect:
• Total Part Count
• Good Part Count, or
• Scrap/Bad Part Count
NOTE
It is not necessary to collect all three count values;
however, at the minimum, you must collect either of the
following:
• The good part count.
• The total part count and scrap/bad count (from
which the good part count can be calculated).
For activity areas configured as manual activity areas,
you do not have to collect any part counts (i.e., Total,
TIP
The options listed in all three tabs are identical for all
2. Select one of the following options to indicate how
FactoryTalk Metrics should determine the number of parts of
the selected type (total, good, or scrap/bad) that the activity
area has produced:
• This Part Count Type is not in use.
56 Rockwell Automation Publication PLTMT-UM001M-EN-P-June 2014
Page 57

Collecting Performance Data Chapter 3
Select this option if you do not want to collect this type of
part count.
For manual activity areas, you can select this option for all
three tabs.
• The Plant Model Activity Area monitors a Scheduled or
Unscheduled Data Point to determine Part Count.
Select this option if you want a data point in the control
system to report the number of parts produced by the
activity area.
You can configure the way the activity determines part
counts by monitoring data points in the following ways:
• By selecting an unscheduled data point. (page 58)
• By selecting first an unscheduled data point as the part
count event trigger, and then setting the actual part
count using a FactoryTalk Transaction Manager
expression. (page 58)
• By setting the activity area to determine the value of a
FactoryTalk Transaction Manager expression on a
scheduled basis. (page 59)
• The Plant Model Activity Area evaluates a Formula to
determine Part Count.
Select this option if the number of parts produced is not
contained in a single register in the control system. For
Rockwell Automation Publication PLTMT-UM001M-EN-P-June 2014 57
Page 58

Chapter 3 Collecting Performance Data
Configuring Part Count Using an Unscheduled Data Point
Configuring Part Count Using an Unscheduled Data Point and a FTTM Expression
example, if the activity area for which you configure
performance parameters is actually two separate physical
machines, you can create a formula to add the part counts
from the two machines, in order to create a single good part
count.
Click Edit to define the formula (page 60).
To use an unscheduled Data Point:
1. Click Select.
The Select Data Point dialog box appears.
2. Under Filtering Tools, in the FT Transaction Manager
Topic/Device list, select the device from which you want to
load data points.
3. At the top of the dialog box, click Refresh Points.
The Data Points area at the bottom of the dialog box is
populated with data points for the selected device.
4. Double-click the data point that you want to use.
The data point appears in the Data Point box in the
Configure Performance Parameters dialog box.
TIP
To delete the data point that you have selected, click Clear.
To set the actual Part Count using an unscheduled Data Point
and a FactoryTalk Transaction Manager expression:
1. Choose an unscheduled data point. (page 58)
2. Check the Use a FTTM Expression to determine Part
Count value option.
58 Rockwell Automation Publication PLTMT-UM001M-EN-P-June 2014
Page 59

Collecting Performance Data Chapter 3
you are performing the actions.
Configuring Part Count Usin
a FTTM Expression On a
Scheduled Basis
3. Click Edit.
The Expression Editor - Total Part Count Expression
dialog box appears.
TIP
The title of the dialog box reflects the part count type for which
4. Create or modify the expression that you want to use.
If you use a FactoryTalk Transaction Manager expression with
this option, the only data point it can reference is the one
selected in the Data Point box.
To use a FTTM expression on a scheduled basis:
g
1. Check the Use a FTTM Expression to determine Part
Count value option.
2. Check the Evaluate this Expression on a scheduled basis
option.
Rockwell Automation Publication PLTMT-UM001M-EN-P-June 2014 59
3. Click Edit.
The Formula Parts wizard appears.
4. Use the wizard to define the formula. (page 60)
Page 60

Chapter 3 Collecting Performance Data
Configuring a Formula
How do I access the dialog box?
1. In the left pane of the Configure Performance Parameters
dialog, click Part Count.
2. Click the Total Part Count, Good Part Count, or
Scrap/Bad Part Count tab.
3. Click The Plant Model Activity Area evaluates a Formula
to determine Part Count.
4. Click Edit.
The performance parameter formulas are used to perform an
advanced calculation for an OEE Performance Parameter. They
consist of Boolean or arithmetic operations that are applied to data
point values. A formula can be based on operations against multiple
data points, so the collection of data from a formula allows you to
collect more specific information about your activity area.
To configure a formula:
1. In the Formula Parts wizard, click Add >.
60 Rockwell Automation Publication PLTMT-UM001M-EN-P-June 2014
Page 61

Collecting Performance Data Chapter 3
Under Formula Part Operator, the Starting Value operator
is preselected, since it is the first value in the arithmetic
formula.
2. Under Formula Part Data Point, click Select.
The Select Data Point dialog box appears.
3. Under Data Points, double-click the data point that you want
to evaluate in the formula.
4. Click Close, and then click Next.
The formula part that you have just created is displayed under
Formula Text and Formula Parts.
5. Repeat steps 1-4 to create another formula part.
You can add values to or subtracts values from the starting
values.
Rockwell Automation Publication PLTMT-UM001M-EN-P-June 2014 61
Page 62

Chapter 3 Collecting Performance Data
To add another value:
1. Under Formula Parts, click Add >.
2. Under Formula Part Operator, select (+) Add Value.
3. Under Formula Part Data Point, click Select.
4. Under Data Points, double-click the data point that you
want to evaluate in the formula.
5. Click Close, and then click Next.
The formula part that you have just created is displayed
under Formula Text and Formula Parts.
To subtract another value:
1. Under Formula Parts, click Add >.
2. Under Formula Part Operator, select (-) Subtract Value.
3. Under Formula Part Data Point, click Select.
4. Under Data Points, double-click the data point that you
want to evaluate in the formula.
5. Click Close, and then click Next.
The formula part that you have just created is displayed
under Formula Text and Formula Parts.
62 Rockwell Automation Publication PLTMT-UM001M-EN-P-June 2014
Page 63

Collecting Performance Data Chapter 3
Availability
6. Click Finish.
The formula is added to the Configure Performance
Parameters dialog box.
Availability is the ratio of running time to available time, and is a key
component of the OEE formula.
Availability = Running Time / Available Time
Available Time is also one of the three variables in the OEE
calculation itself:
OEE = (Good Part Count x Ideal Cycle Time) / Available Time
The calculation of Available Time is very important to get accurate
OEE data. The fundamental issue is to determine when a machine
(activity area) should be producing and when it should not. Some
companies count all shift time as available time, so any
non-productive time, no matter what the cause, is considered lost
capacity and reduces OEE. Others exclude some types of
non-productive time from the total available time, which results in
higher overall OEE values. This is not done to inflate OEE scores,
but to more accurately determine how efficiently the machine is
performing. Such exclusions can include:
Rockwell Automation Publication PLTMT-UM001M-EN-P-June 2014 63
Page 64

Chapter 3 Collecting Performance Data
• Scheduled breaks, meetings, etc.
• Planned maintenance.
• External conditions that prevent the machine from working,
such as being starved or blocked.
In FactoryTalk Metrics, Available Time is the result of two other
measures: Scheduled Availability and Monitored Availability.
Scheduled Availability is the expected availability that results from a
predictable shift schedule (including exceptions such as meetings or
planned maintenance).
Monitored Availability is the determination of machine availability
based on the real-time events that are occurring on the plant floor
(such as blocked/starved). Monitored Availability may override
Scheduled Availability to make a machine unavailable when it would
be available otherwise.
Because collecting accurate Available Time is so important, there are
several options within FactoryTalk Metrics for configuring both
Scheduled Availability and Monitored Availability. In addition,
overall Available Time can be configured to accumulate when both
the Scheduled Availability and Monitored Availability conditions
are true, or when only one of them is true. The methods used for
determining Available Time are configured separately for each
activity area.
The following approaches can be used to determine if a machine is
available:
• Defining a schedule (time pattern), which defines specific
periods of available and unavailable time that repeat into the
future, and which is subject to exceptions like holidays or
scheduled maintenance activities.
64 Rockwell Automation Publication PLTMT-UM001M-EN-P-June 2014
Page 65

Collecting Performance Data Chapter 3
Configuring Scheduled Availability
• Combining a time pattern optionally with Monitored
Availability, so that a control system condition can override
the predetermined schedule. This is how dynamic conditions
such as blocked and starved are commonly handled.
The Monitored Availability may be determined by:
• A control system condition.
This may be the state of a single data point or the resolution
of a complex expression or formula involving one or more
data points.
• The current state of the machine.
When machine states are configured, there is an option to
specify whether that state indicates that the activity area is
available or not available.
• Collecting shift information, scheduled availability
information, or both from the control system. If shift
schedules change frequently, this option is more flexible than
using a time pattern. Using this method, both shift
information and an optional Scheduled Availability value are
collected from the control system and used to define
availability.
How do I access the dialog box?
1. On the Configure menu, click FactoryTalk Metrics >
Performance Parameters.
The Manage Performance Parameters dialog box appears.
2. Select the activity area for which you want to associate
machine states, and then click Configure.
The Configure Performance Parameters dialog box appears.
3. If necessary, select the FactoryTalk Transaction Manager
configuration for the activity area.
Rockwell Automation Publication PLTMT-UM001M-EN-P-June 2014 65
Page 66

Chapter 3 Collecting Performance Data
4. In the left pane of the dialog box, click Scheduled
Availability.
The Scheduled Availability parameter is part of the Availability
value in the OEE equation. It indicates when the activity area is
supposed to be available to produce parts.
Scheduled Availability and Monitored Availability are used together
to determine the availability (page 63) component of the OEE
equation and to accumulate available time. Together, these values
indicate when the activity area is supposed to be available to produce
parts and define shift information. Scheduled Availability provides
the basic availability information for the activity area, and provides
the shift information. This is most commonly done by means of a
fixed and repeating time pattern.
To configure Scheduled Availability:
Select one of the following options to indicate how FactoryTalk
Metrics should determine when the activity area is available to
produce parts:
• The Plant Model Activity Area is scheduled to be available
at all times.
Select this option if the activity area runs 24 hours a day, seven
days a week, or you intend to rely on the Monitored
Availability to determine the availability.
With this option selected, it is difficult to determine when the
activity area is actually available. As a result, non-production
time (e.g., weekends) may cause the OEE rating of the activity
area to be artificially low.
66 Rockwell Automation Publication PLTMT-UM001M-EN-P-June 2014
Page 67

Collecting Performance Data Chapter 3
Since no shift information is collected, the reporting by shift is
not allowed.
• Collect Scheduled Availability information from the
control system.
Select this option if shift schedule changes on the site are
frequent and variable.
With this option selected, both shift information and an
optional Scheduled Availability value are collected from the
control system and used to define availability.
You can configure the option in the following ways:
• Select a data point to monitor for Shift information.
The data point should be an unscheduled numeric data
point that will contain the current shift number:
1. Click Select.
The Select Data Point dialog box appears.
2. Under Filtering Tools, in the FT Transaction
Manager Topic/Device list, select the device from
which you want to load data points.
3. At the top of the dialog box, click Refresh Points.
The Data Points area at the bottom of the dialog box is
populated with data points for the selected device.
Rockwell Automation Publication PLTMT-UM001M-EN-P-June 2014 67
Page 68

Chapter 3 Collecting Performance Data
click Clear.
For more information on creating and editing the
4. Double-click the data point that you want to use.
The data point appears in the Data Point box in the
Configure Performance Parameters dialog box.
TIP
To delete the data point that you have selected,
• Select a lookup list to provide a description for the
numeric shift value collected from the control system.
Select the lookup list that you want to use:
• Click New to create a new list.
• Click Edit to modify the list that you have selected.
TIP
Shift Description Lookup lists, see "Create Shift
Description Lookup Lists (page 71)".
• (Optional.) Select a data point to monitor for Scheduled
Availability.
68 Rockwell Automation Publication PLTMT-UM001M-EN-P-June 2014
1. Click Select.
The Select Data Point dialog box appears.
2. Under Filtering Tools, in the FT Transaction
Manager Topic/Device list, select the device from
which you want to load data points.
3. At the top of the dialog box, click Refresh Points.
The Data Points area at the bottom of the dialog box is
populated with data points for the selected device.
4. Double-click the data point that you want to use.
Page 69

Collecting Performance Data Chapter 3
click Clear.
The data point appears in the Data Point box in the
Configure Performance Parameters dialog box.
TIP
To delete the data point that you have selected,
If no data point is selected, the scheduled availability will be
determined from the current shift.
If the optional data point for the scheduled availability is
selected, that is the only value used to determine the state of
the scheduled availability.
If only the Shift Id data point is selected, the plant model
activity area will be considered to be scheduled available
when the Shift Id value indicates that a shift is currently
active.
The value collected for Shift Id is interpreted as an integer
value.
A positive value indicates that the plant model activity area
is in an active shift.
A zero or negative value indicates that the plant model
activity area is out of shift.
Any time that it is in an active shift is considered to be
scheduled available, and any out-of-shift time is scheduled
unavailable.
• A configured Capacity Time Pattern specifies the Plant
Model Activity Area’s Scheduled Availability and Capacity
state.
Select this option to define when the activity area is scheduled
to be available. If the availability of the activity area is based on
a time pattern, the OEE rating of the activity area will not be
Rockwell Automation Publication PLTMT-UM001M-EN-P-June 2014 69
Page 70

Chapter 3 Collecting Performance Data
Value > 0
Not Selected
Yes
> 0 value with description.
description.
Value < 0
Not Selected
No
< 0 value for shift number with no shift description.
description
Otherwise, -1 for shift number with no shift
negatively affected by time periods that are scheduled as
unavailable (e.g., weekends, evenings).
Click one the available buttons to access the respective editors
that you can use to create or modify composites, exceptions, or
time patterns:
• Click Composite to assign time patterns and exceptions to
activity areas.
• Click Exception to define availability exceptions and apply
them to appropriate activity areas.
• Click Pattern to define repeating time patterns of available
time, unavailable time, and shifts.
If a site changes shift schedules frequently, the Collect
Scheduled Availability information from the control
system option is more flexible than using a time pattern.
The following table illustrates how data collection will behave for
different configurations of Shift Id and Scheduled Availability.
Shift Data Point
Value
Value is 0 Not Selected No
Value > 0 Value is not 0 Yes > 0 value with description.
Value > 0 Value is 0 No > 0 value with description.
Value is 0 Value is not 0 Yes
Value is 0 Value is 0 No
Scheduled Available
Data Point Value
Scheduled Availability
Accumulating
Shift information that is written to the
database
If previous shift value > 0 then -1 * previous Shift
value.
Otherwise, -1 for shift number with no shift
If previous shift value > 0 then -1 * previous Shift
value.
Otherwise, -1 for shift number with no shift
If previous shift value > 0 then -1 * previous Shift
value.
70 Rockwell Automation Publication PLTMT-UM001M-EN-P-June 2014
Page 71

Collecting Performance Data Chapter 3
description.
Value < 0
Value is 0
No
< 0 value for shift number with no shift description.
Creating Shift Description Lookup Lists
Shift Data Point
Value
Scheduled Available
Data Point Value
Scheduled Availability
Accumulating
Shift information that is written to the
database
Value < 0 Value is not 0 Yes < 0 value for shift number with no shift description.
How do I access the dialog box?
1. In the left pane of the Configure Performance Parameters
dialog box, click Scheduled Availability.
2. Click Collect Scheduled Availability information from the
control system.
3. Under Select a lookup list to provide a description for the
numeric shift value collected from the control system, click
Create.
When a value is collected for Shift Id from the control system, that
value is numeric and can be associated with a text value to be used as
the Shift Description. For example, the collected Shift Id value of 1
may be associated with a Shift Description of “Shift 1 Crew A”. The
associated shift description values are stored in lookup lists.
To configure a Shift Description lookup list:
1. In the Lookup Code Description box, type a name for the
Shift Description lookup list.
2. Under Lookup Code Values, click Add.
The Shift Description Lookup Code Value dialog box
appears.
3. In the Value box, type a value.
4. In the Description box, type a description of the value.
Rockwell Automation Publication PLTMT-UM001M-EN-P-June 2014 71
Page 72

Chapter 3 Collecting Performance Data
with the new ones.
This item:
Is data of type:
Lookup Value
Numeric
Description
String
Event Lookup Value CSV Format
5. Click OK.
The value appears under Lookup Code Values.
Instead of manually configuring a lookup code list, you can import
an existing list from a comma-separated values file (.csv).
NOTE
If a shift description lookup list already contains values, and you intend
to import other values to this list, the original values will be replaced
To import Shift Description lookup list values:
1. Under Previous Import File Path, click Import.
The Open dialog box appears.
2. Select a file that contains the lookup list, and then click Open.
See "Event Lookup Value CSV Format (page 72)" for the
required file format of the Comma Separated Values (.csv) file.
3. Click OK.
Structure the content of the .csv file in the following way:
Lookup Value, Description, Fault State, Severity, Normal State
Where:
72 Rockwell Automation Publication PLTMT-UM001M-EN-P-June 2014
Fault State Boolean:
• 1, 0, or
• true, false (case-insensitive).
Severity Numeric:
• -1 (to indicate no severity), or
• Between 0 (high severity) and 100 (low severity).
Page 73

Collecting Performance Data Chapter 3
Configuring Monitored Availability
This item: Is data of type:
Normal State Boolean:
• 1, 0, or
• true, false (case-insensitive).
How do I access the dialog box?
1. On the Configure menu, click FactoryTalk Metrics >
Performance Parameters.
The Manage Performance Parameters dialog box appears.
2. Select the activity area for which you want to associate
machine states, and then click Configure.
The Configure Performance Parameters dialog box appears.
3. If necessary, select the FactoryTalk Transaction Manager
configuration for the activity area.
4. In the left pane of the dialog box, click Monitored
Availability.
The Monitored Availability parameter is part of the Availability
value in the OEE equation. The parameter indicates when the
activity area is actually available to produce parts. While the activity
area may be scheduled to be available at a specified time, it may not
actually be available at that time. An example of this is when the
activity area is scheduled to be available, but is not able to work,
because it is waiting for parts from an upstream process. Using the
Monitored Availability parameter helps understand which machine
in the facility really causes the problems. For the Monitored
Availability parameters you can create Boolean formulas.
Rockwell Automation Publication PLTMT-UM001M-EN-P-June 2014 73
The benefit of using Monitored Availability to determine the
available time for an activity area is more accurate efficiency
measurements. For example, even though an activity area can be
Page 74

Chapter 3 Collecting Performance Data
scheduled to be available for an 8-hour shift, there can be times
during that shift when the machine is not capable of producing
output through no fault of its own. It might be starved by an
upstream process, blocked by a downstream process, or it may have
no work orders. If these times are excluded from the available time,
the result is a more accurate picture of the machine’s actual
efficiency. To get this information, you must use one of the
Monitored Availability options. Of course, you will also want to
track these non-productive times as custom events or machine states
in order to get an accurate picture of how much production time is
being lost and where the fault lies.
By default, an activity area must be both Scheduled Available and
Monitored Available to be overall available and to accumulate
Available Time.
To configure Monitored Availability:
Select one of the following options to indicate how the application
should determine the actual availability of the activity area:
• The Plant Model Activity Area is always available.
Select this option if you want to disable Monitored
Availability. The overall availability will be determined based
on the state of Scheduled Availability only. As a result, the
non-production time that is not the fault of the activity area
(e.g., when the machine is waiting for parts) will cause the
OEE rating of the activity area to be artificially low.
• The Plant Model Activity Area determines Monitored
Availability based on the current Machine State.
74 Rockwell Automation Publication PLTMT-UM001M-EN-P-June 2014
Page 75

Collecting Performance Data Chapter 3
Select this option if you want to use machine state to
determine Monitored Availability.
When machine states are defined, the (Monitored)
Availability of each machine state is set. If machine states are
configured for the current activity area, then at any point in
time the activity area will be in one and only one machine
state, and the Monitored Availability of that machine state
(either available or unavailable) will be used.
For more information, see "Configure and Use Machine States
(page 118)".
• The Plant Model Activity Area monitors an Unscheduled
Data Point to determine availability.
Select this option if you want to improve the accuracy of the
OEE rating.
For example, if you base the monitored availability on the data
point that contains the running bit of an upstream unit, the
OEE of the current unit will not be negatively affected when it
is waiting for parts (the upstream unit is not running).
You can either only select a data point or first select a data
point as the availability event trigger, and then set the actual
availability value using a FactoryTalk Transaction Manager
expression.
Proceed as follows:
1. Click Select.
Rockwell Automation Publication PLTMT-UM001M-EN-P-June 2014 75
Page 76

Chapter 3 Collecting Performance Data
Clear.
The Select Data Point dialog box appears.
2. Under Filtering Tools, in the FT Transaction Manager
Topic/Device list, select the device from which you want
to load data points.
3. At the top of the dialog box, click Refresh Points.
The Data Points area at the bottom of the dialog box is
populated with data points for the selected device.
4. Double-click the data point that you want to use.
The data point appears in the Data Point box in the
Configure Performance Parameters dialog box.
TIP
To delete the data point that you have selected, click
5. (Optional) Set the actual availability value using a
FactoryTalk Transaction Manager expression:
1. Check the Use a FactoryTalk Transaction Manager
Expression to determine the Monitored Availability
value box.
2. Click Edit.
The Expression Editor - Monitored Availability
Expression dialog box appears.
3. Create or modify the expression that you want to use.
If you use a FactoryTalk Transaction Manager
expression, the only data point it can reference is the one
that you have provided in the Data Point box.
• The Plant Model Activity Area evaluates a Formula to
determine availability.
76 Rockwell Automation Publication PLTMT-UM001M-EN-P-June 2014
Page 77

Collecting Performance Data Chapter 3
Select this option if you want to determine the availability of
the activity area based on the results of a formula.
This option specifies a formula that is constructed from one or
more unscheduled numeric or binary data points, and when
the result of that formula has a non-zero or true value, it
indicates that the activity area is Monitored Available.
For example, if you base the monitored availability on the
running state of the upstream and downstream units, you can
determine that the activity area is actually available because it
is not waiting for parts and is not blocked.
Proceed as follows:
1. Click Edit.
The Formula Parts wizard appears.
2. Use the wizard to define the formula. (page 60)
Click Apply.
The Monitored Availability configuration results in creating several
system events contained in an event category called Available (in
addition to those created by the Scheduled Availability
configuration).
To view the events, in the left pane of the Configure Performance
Parameters dialog box, under Custom, click Events.
For more information, see "Viewing the Performance Parameter
Events for an Activity Area (page 81)".
The data from the events is logged to the database and used to
calculate OEE and other metrics. The events include (depending on
selected options):
• Activity Area Available – Formula
• Activity Area Available – Point
Rockwell Automation Publication PLTMT-UM001M-EN-P-June 2014 77
Page 78

Chapter 3 Collecting Performance Data
Configuring Running State
• Available Formula Point
How do I access the dialog box?
1. On the Configure menu, click FactoryTalk Metrics >
Performance Parameters.
The Manage Performance Parameters dialog box appears.
2. Select the activity area for which you want to associate
machine states, and then click Configure.
The Configure Performance Parameters dialog box appears.
3. If necessary, select the FactoryTalk Transaction Manager
configuration for the activity area.
4. In the left pane of the dialog box, click Running State.
The Running State parameter is part of the Availability (page 63)
value in the OEE equation. The parameter allows the control system
to indicate when the activity area is actually producing products.
For the Running State parameters you can create Boolean formulas.
To configure the Running State:
Select one of the following options to indicate how FactoryTalk
Metrics should determine when the activity area is actually running
and producing parts:
• The Plant Model Activity Area is always in a running state.
78 Rockwell Automation Publication PLTMT-UM001M-EN-P-June 2014
Select this option if you want the running time to be set equal
to the available time.
Page 79

Collecting Performance Data Chapter 3
With this option selected, you will not be able to isolate the
contribution that Availability makes to the OEE value.
• The Plant Model Activity Area is always running when it is
available and not in a faulted state.
Select this option if you want the running state of the activity
area to be based on the availability and the fault state of the
activity area. This enables you to eliminate unavailable time
and downtime from the OEE rating.
• The Plant Model Activity Area determines Running State
based on the current Machine State.
Select this option if you want the activity area to be considered
in the running state, when the current machine state indicates
the running state. For more information, see "Configure and
Use Machine States (page 118)".
• The Plant Model Activity Area monitors an Unscheduled
Data Point to determine running state.
Select this option if you have a data point in the control system
that contains a running bit. If you base the Running State
parameter on the data point that contains the running bit of
the selected activity area, the activity area’s running time will
be stored in the database for later reporting.
You can either only select a data point, or first select a data
point as the running state event trigger, and then set the actual
Rockwell Automation Publication PLTMT-UM001M-EN-P-June 2014 79
Page 80

Chapter 3 Collecting Performance Data
Clear.
running state value using a FactoryTalk Transaction Manager
expression:
1. Click Select.
The Select Data Point dialog box appears.
2. Under Filtering Tools, in the FT Transaction Manager
Topic/Device list, select the device from which you want
to load data points.
3. At the top of the dialog box, click Refresh Points.
The Data Points area at the bottom of the dialog box is
populated with data points for the selected device.
4. Double-click the data point that you want to use.
The data point appears in the Data Point box in the
Configure Performance Parameters dialog box.
TIP
To delete the data point that you have selected, click
5. (Optional) Set the actual running state value using a
FactoryTalk Transaction Manager expression:
1. Check the Use a FactoryTalk Transaction Manager
Expression to determine the Running State value box.
2. Click Edit.
The Expression Editor - Running State Expression
dialog box appears.
3. Create or modify the expression that you want to use.
If you use a FactoryTalk Transaction Manager
expression, the only data point it can reference is the one
that you have provided in the Data Point box.
80 Rockwell Automation Publication PLTMT-UM001M-EN-P-June 2014
Page 81

Collecting Performance Data Chapter 3
Generating Performance Parameter Events
Viewing Performance Parameter Events for an Activity Area
• The Plant Model Activity Area evaluates a Formula to
determine running state.
Select this option if the running state for the activity area is
determined by several data points in the control system. For
example, if you base the Running State parameter on the
running state of the activity area and the part jam bit or fault
indicator bit, you can determine that the activity area is
actually running because it is not jammed nor in a fault
condition.
Proceed as follows:
1. Click Edit.
The Formula Parts wizard appears.
2. Use the wizard to define the formula. (page 60)
When you have finished configuring your performance parameters,
click Apply. The application will create system-generated
Performance Parameter events.
How do I access the dialog box?
1. On the Configure menu, click FactoryTalk Metrics >
Performance Parameters.
The Manage Performance Parameters dialog box appears.
2. Select the activity area for which you want to associate
machine states, and then click Configure.
Rockwell Automation Publication PLTMT-UM001M-EN-P-June 2014 81
The Configure Performance Parameters dialog box appears.
Page 82

Chapter 3 Collecting Performance Data
parameter configuration is enabled.
the events on the FactoryTalk Metrics Detail report.
3. If necessary, select the FactoryTalk Transaction Manager
configuration for the activity area.
4. In the left pane of the dialog box, under Custom, click Events.
The Performance Parameter events are used by FactoryTalk Metrics
to collect data for performance monitoring.
There are two types of the Performance Parameter events:
system-generated (page 83) and user-defined (page 85).
Both types of the events can be manual events (page
88).
To manage events:
• To add a new custom event for the activity area, click New.
For more information, see "Configuring User-defined
Performance Parameter Events (page 90)".
• To edit an event, select it, and then click Edit.
• To remove an event, select it, and then click Delete.
TIP
You cannot delete user-defined events while the performance
• To change the order of the events within the categories, click
Move Up or Move Down.
82 Rockwell Automation Publication PLTMT-UM001M-EN-P-June 2014
TIP
The position of the events in the tree will also be the position of
Page 83

Collecting Performance Data Chapter 3
System-generated Events
• To copy a user-defined event from another performance
parameter configuration to the current performance
parameter configuration, click Copy.
• To import new performance parameter events that you have
created or overwrite existing performance parameter events
that you have modified in Excel (.csv) or XML (.xml) files,
click Import.
• To export existing performance parameter event information
to an Excel (.csv) or XML (.xml) file, click Export.
System-generated (default) events are created and maintained by the
FactoryTalk Metrics software and reflect the selections that you
have made for the Performance Parameters configuration. You are
only able to edit the description of a system-generated event. All
other properties of the events are locked.
System-generated events cannot be deleted.
System-generated events that may be created include:
• Schedule Available
If a schedule is assigned to a workcell, a Schedule Available
event record will be created when the schedule indicates the
workcell should be available. That record will close when the
schedule indicates the workcell is no longer available. So there
will be a Schedule Available event record in the database for
every continuous period of schedule availability for every
workcell.
• Schedule Exception Unavailable
A Schedule Exception Unavailable event record is created for
every continuous time period where Schedule Exception
Unavailable Time occurs. This Unavailable time is associated
with the schedule, and thereby an event record will be created
for every workcell that uses the schedule.
Rockwell Automation Publication PLTMT-UM001M-EN-P-June 2014 83
Page 84

Chapter 3 Collecting Performance Data
• Overall Available
An Overall Available event record is created for each workcell
for each continuous period of Overall Availability. Overall
Availability takes into account all of the applicable availability
factors that may determine if a workcell is available: schedule,
schedule unavailable time, availability data point, and activity
area exception unavailable time. The time spent in an Overall
Available status is also captured in the Available Seconds field
of the FactoryTalk Metrics Workcell History report data
source.
• Activity Area Exception Unavailable
An event record will be created for every continuous period of
time that a workcell experiences Exception Unavailable Time.
• Activity Area Available - Point
An event record will be created for every continuous period of
time that a workcell is available as defined by an activity area
Availability data point, which is specified in the Availability
section of the Performance Parameter screen. A record will be
created every time the Availability point in the control system
goes high, and closed when it goes low. If an Availability
formula is used, there will be an event created for each
component of the formula.
• Running - Point
An event record will be created for every continuous period of
time that a workcell is Running as defined by a Running data
point, which is specified in the Running section of the
Performance Parameter screen. A record will be created every
time the Running point in the control system goes high, and
closed when it goes low. If a Running formula is used, there
will be an event created for each component of the formula.
• Activity Area Part Count - Formula
This system-level event is created when a part count formula is
used in a workcell. An event record is created when data
84 Rockwell Automation Publication PLTMT-UM001M-EN-P-June 2014
Page 85

Collecting Performance Data Chapter 3
User-defined Events
collection begins, remains open for as long as the data for the
Part Count Formula is collected, and is subject to the event
data summarization rules. Each record contains a zero for the
start value and the cumulative result of the part count formula
over the time duration of the event record for the end value.
• Part Count Formula Point
One of these system-level events is created for every
component of a part count formula, when used in a workcell.
An event record is created when data collection begins,
remains open for as long as the data for the Part Count
Formula is collected, and is subject to the event data
summarization rules. Each record contains a zero for the start
value and the cumulative change of the formula data point
value over the time duration of the event record for the end
value.
• Activity Area Part Count - Point
This system-level event is created when a data point is used for
a part count in a workcell (not a part count formula). An event
record is created when data collection begins, remains open for
as long as the data for the Part Count Point is collected, and is
subject to the event data summarization rules. Each record
contains the a zero for the start value and the cumulative
change of the part count data point value over the time
duration of the event record in the end value.
For more information on the event data summarization rules, see
"Set the Event Data Summarization Parameters" in the
Configuration Console online help.
User-defined events are custom events that are used to collect extra
data that you would like to associate with the existing performance
data. By defining custom events, you can direct FactoryTalk Metrics
to monitor specific bits or registers in the plant control system, and
maintain historical records on the behavior of those data points. For
Rockwell Automation Publication PLTMT-UM001M-EN-P-June 2014 85
Page 86

Chapter 3 Collecting Performance Data
example, you can create user-defined events to trap and record
downtime occurrences, e-stops, the upstream/ downstream status,
machine state information, and operator input.
The ability to direct FactoryTalk Metrics to monitor custom events
in the control system is extremely powerful, because it allows you to
customize FactoryTalk Metrics for your unique situation and
objectives.
It is up to you what is captured and how it is interpreted. There is no
enforced limit to the number of custom events that can be associated
with a plant model activity area in FactoryTalk Metrics. However,
the addition of each new event consumes more resources from all the
system's components.
The performance parameters for a user-defined event include:
• Identifying information
The plant model activity area (referred to as “workcell
description” in the FactoryTalk Metrics event history report
data source), event category (a user-defined grouping or folder
of related events), and event description (user-defined).
For more information, see "FactoryTalk Metrics Event
History Report Data Source" in the Configuration Console
online help.
• Summarization rules
Define how FactoryTalk Metrics will handle the creation of
multiple summary records in the database for a single event
occurrence.
For more information, see "Set the Event Data Summarization
Parameters" in the Configuration Console online help.
86 Rockwell Automation Publication PLTMT-UM001M-EN-P-June 2014
Page 87

Collecting Performance Data Chapter 3
• Trigger
Defines how the event starts and ends (e.g., a bit in the control
system goes high to signal the start of the event and it goes low
at the end of the event).
For more information, see "Set the Event Trigger Parameters"
in the Configuration Console online help.
• Additional data
Optionally, an additional data point can be collected at the
start or end of the event, or a counter can be monitored
through the duration of an event. The additional data
collected may be the event reason code entered by the
operator, explaining why the event occurred.
For more information, see "Collect Additional Event
Information" in the Configuration Console online help.
• Event fault metrics
Not all events are relevant in the calculation of fault metrics.
Specify how the event should be used when calculating fault
metrics (Mean Time Between Failure, Mean Time To Repair).
Mean Time Between Failure and Mean Time to Repair are
derived fields that contain aggregate functions and, as such,
they can only be used in summary report objects, and you
cannot apply additional aggregate functions to them.
For more information, see "Set the Event Fault Metric And
Machine State Options" in the Configuration Console online
help.
• Event reporting properties
The reporting value property determines the type of value that
is reported for the event. The severity level property
determines the severity that is associated with the event. This
is useful for reporting and sorting events.
For more information, see "Set the Event Reporting
Properties" in the Configuration Console online help.
Rockwell Automation Publication PLTMT-UM001M-EN-P-June 2014 87
Page 88

Chapter 3 Collecting Performance Data
Manual Events
Manual events are events without a physical data point attached to
them. They can be both system-generated events and user-defined
events.
There is only one type of system-generated manual events, Activity
Area Good Part Count - Manual, and only one event of this type
may exist in a workcell.
Manual events can be created only in an activity area configured as a
manual activity area. For more information on configuring manual
activity areas, refer to "Configure FactoryTalk Metrics Data
Collection Parameters" in the Configuration Console online help.
To configure an event as a manual event, select the Manual Event
check box in the Configure Performance Parameters Events
dialog box.
Configuring an event as a manual event influences the following
settings:
• The Part Count performance parameter in the Configure
Performance Parameters dialog box.
• The following performance parameters in the Configure
Performance Parameters Event dialog box:
• Event Trigger types.
• Event Value.
The system-generated manual event is automatically described as
manual in the Categories & Events list.
88 Rockwell Automation Publication PLTMT-UM001M-EN-P-June 2014
Page 89

Collecting Performance Data Chapter 3
The Recycle Bin
For user-defined manual events you can enter additional
information about manual configuration in the event name.
The properties of manual events are the same like for the
user-defined events (page 85).
For more information on manual events, refer to "Manual Events
(page 88)" in the Configuration Console online help.
The Recycle Bin is a system-generated category similar to the
categories for available or running events. It is used to hold events
that are no longer used to collect performance parameter data, but
still have historical data in the database that may be used in reports.
The Recycle Bin is only displayed in the Performance Parameters
Events tree if historical data exists.
When you modify a set of performance parameters, FactoryTalk
Metrics disables the existing events for the modified set, and creates
new events for the category. Then it checks if any data has been
logged for the disabled events. If no data has been logged, the events
are deleted. If there is some historical data for the event, the event is
moved to the Recycle Bin.
Rockwell Automation Publication PLTMT-UM001M-EN-P-June 2014 89
Page 90

Chapter 3 Collecting Performance Data
Configuring User-defined Performance Parameter Events
Configuring the Event Data Summary
For example, if you changed the activity area availability from Data
Point to Formula, the system would disable the existing events in
the Available category, delete the events that do not have historical
data, move the events that have historical data to the Recycle Bin,
and then create new available events.
NOTE
If you delete an event from the Recycle Bin, the event and any
historical data associated with it will be deleted.
The process of creating performance parameter events consists of
the following stages:
1. Configuring the event data summary. (page 90)
2. Configuring the event trigger. (page 93)
3. Configuring the event value. (page 99)
4. Configuring the machine state / faults. (page 111)
5. Configuring the reporting. (page 113)
How do I access the dialog box?
1. On the Configure menu, click FactoryTalk Metrics >
Performance Parameters.
90 Rockwell Automation Publication PLTMT-UM001M-EN-P-June 2014
The Manage Performance Parameters dialog box appears.
2. Select the activity area for which you want to associate
machine states, and then click Configure.
The Configure Performance Parameters dialog box appears.
3. If necessary, select the FactoryTalk Transaction Manager
configuration for the activity area.
4. In the left pane of the dialog box, under Custom, click Events.
In the right pane of the dialog box, a list of available categories
and events appears.
5. Click New.
Page 91

Collecting Performance Data Chapter 3
The Configure Performance Parameter Event dialog box
appears.
To configure the event data summary:
1. In the Description box, type a name for the event.
2. In the Category list, either select a category from the list, or
create a new one.
To create a new category:
1. Next to the Category list, click New.
The New Event Category dialog box appears.
2. Under Enter Event Category Name, type a name for the
new category.
3. Click OK.
3. In the Data Summarization Type list, select one of the
following summarization types:
• Scheduled Shift Start
• Scheduled Shift Start and End
• Any Scheduled Shift Change
• Summarization Criteria Change
• Scheduled Shift Start or Summarization Criteria Change
• Scheduled Shift Start and End or Summarization Criteria
Change
• Any Scheduled Shift Change or Summarization Criteria
Change
• Performance Trending Summarization
• No Summarization
Rockwell Automation Publication PLTMT-UM001M-EN-P-June 2014 91
Page 92

Chapter 3 Collecting Performance Data
"Event Data Summarization Types (page 92)".
end of any shift that is followed by Out of Shift time.
time within a shift happen. The event data will be summarized when these
that is followed by Out of Shift time.
Data Summarization will occur for the event.
and Summarization Criteria Change types.
Event Data Summarization Types
TIP
For information on individual data summarization types, see
4. Continue with "Configuring the Event Trigger (page 93)".
Event data summarization defines how FactoryTalk Metrics will
handle the creation of multiple summary records in the database for
a single occurrence of an event.
There are the following event data summarization types:
Use this data summarization type: To:
Scheduled Shift Start Summarize the event data at the beginning of each shift defined in the
schedule that was selected as a part of the Performance Parameters
configuration.
If no schedule was selected, a new shift is created at midnight of each day.
Scheduled Shift Start and End Summarize the event data at the beginning of each shift.
Shifts may not be configured continuously and there may be gaps of time
between the end of a shift and the start of the next shift. This time is
known as Out of Shift time. The event data will also be summarized at the
Any Scheduled Shift Change Summarize the event data when transitions from available to unavailable
Summarization Criteria Change Summarize the event data when there is a change in any Summarization
Scheduled Shift Start or Summarization Criteria Change Summarize the event data at the beginning of each shift as well as when
92 Rockwell Automation Publication PLTMT-UM001M-EN-P-June 2014
transitions happen as well as at the start of a shift and at the end of a shift
Criteria, Part Id, or Cycle Time that is being monitored for a Performance
Parameters configuration.
If there are no Summarization Criteria, Part Id or Cycle Time being
monitored as a part of the Performance Parameters configuration then no
there is a change in any Summarization Criteria, Part Id, or Cycle Time that
is being monitored for the Performance Parameters configuration.
This data summarization type is a combination of the Scheduled Shift Start
Page 93

Summarize the event data at the beginning of each shift, at the end of each
and End and Summarization Criteria Change types.
Summarize the event data at the beginning of each shift, at the end of each
Change and Summarization Criteria Change types.
Performance Trending Summarization
Summarize the historical data for Performance Parameters at regular
Parameters data is summarized.
accurate.
Configuring the Event Trigger
Use this data summarization type: To:
Scheduled Shift Start and End or Summarization Criteria
Change
Any Scheduled Shift Change or Summarization Criteria
Change
shift that is followed by Out of Shift time, and when there is a change in
any Summarization Criteria, Part Id, or Cycle Time that is being monitored
for the Performance Parameters configuration.
This data summarization type is a combination of the Scheduled Shift Start
shift that is followed by Out of Shift time, when there is a change of
Available states within a shift, and when there is a change in any
Summarization Criteria, Part Id, or Cycle Time that is being monitored for
the Performance Parameters configuration.
This data summarization type is a combination of the Any Scheduled Shift
intervals specified by the Performance Data Trending Rate, on any change
of Shift or Available states within a shift, as well as when a change in any
Summarization Criteria, Part Id, or Cycle Time data occurs.
The event data will be summarized at the same time that Performance
Collecting Performance Data Chapter 3
No Summarization Choose not to summarize the event data at any time. The event will have
How do I access the dialog box?
1. On the Configure menu, click FactoryTalk Metrics >
Performance Parameters.
The Manage Performance Parameters dialog box appears.
2. Select the activity area for which you want to associate
machine states, and then click Configure.
The Configure Performance Parameters dialog box appears.
3. If necessary, select the FactoryTalk Transaction Manager
configuration for the activity area.
one record for its entire duration.
Note: Use this data summarization type with caution because using it
could result in creating event records that would make reporting less
Rockwell Automation Publication PLTMT-UM001M-EN-P-June 2014 93
Page 94

Chapter 3 Collecting Performance Data
4. In the left pane of the dialog box, under Custom, click Events.
In the right pane of the dialog box, a list of available categories
and events appears.
5. Click New.
The Configure Performance Parameter Event dialog box
appears.
To configure the event trigger:
1. In the left pane of the dialog box, click Event Trigger.
2. In the Event Trigger Type list, select one of the following:
• Monitored Bit Low to High Transition
• Monitored Bit High to Low Transition
• Monitored Value
• Monitored Formula Low to High Transition
• Monitored Formula High to Low Transition
• Monitored Periodic Value
• None
TIP
For information on the event trigger types, see "Event
Trigger Types for System-generated and User-defined
Events (page 97)".
The following steps will differ depending on the event trigger
type that you have selected.
If you have selected any of these event trigger types:
• Monitored Bit Low to High Transition
• Monitored Bit High to Low Transition
• Monitored Value
94 Rockwell Automation Publication PLTMT-UM001M-EN-P-June 2014
Page 95

Collecting Performance Data Chapter 3
Select a data point:
1. Under Data Point, click Select.
The Select Data Point dialog box appears.
2. Under Data Points, select a data point, and then click
Select.
The data point that you have selected appears in the Data
Point box.
3. Continue with "Configuring the Event Value (page 99)".
If you have selected any of these event trigger types:
• Monitored Formula Low to High Transition
• Monitored Formula High to Low Transition
Create a formula:
1. Under Configure a Formula for the Event Trigger, click
Edit.
The Formula Parts dialog box appears.
2. Follow the steps described in "Configuring a Formula (page
60)", and define your formula.
3. Continue with "Configuring the Event Value (page 99)".
If you have selected any of these event trigger types:
• Monitored Periodic Value
Rockwell Automation Publication PLTMT-UM001M-EN-P-June 2014 95
Page 96

Chapter 3 Collecting Performance Data
•
•
Unavailable
• Schedule Exception Unavailable Event
•
•
•
Event Trigger Types
Event Trigger Types for System-generated Events
• None
Continue with "Configuring the Event Value (page 99)".
There are the following types of event triggers:
• Event trigger types for system-generated events only (page 96).
• Event trigger types for system-generated and user-defined
events (page 97).
• Event trigger types for manual events (page 99).
The following event trigger types are available for system-generated
events only:
This event trigger: Is used by:
Activity Area Overall Available
Activity Area Schedule
Activity Area Schedule Exception
Activity Area Exception Unavailable
Activity Area Available
Activity Area Running
Overall Available Event
Schedule Available Event
Activity Area Exception Unavailable
Event
Activity Area Available - Point Event
• Activity Area Available - Formula Event
Activity Area Running - Point Event
• Activity Area Running - Formula Event
The system-generated events cannot be edited by users.
96 Rockwell Automation Publication PLTMT-UM001M-EN-P-June 2014
Page 97

Monitored Bit Low to High Transition
Monitor a bit value in the control system.
This event trigger type will accumulate the amount of time that the control system value is
in a High state.
their data in an unscheduled manner may be selected as the trigger data point. The values
Event Trigger Types for
System
User-defined Events
The following event trigger types are available for system-generated
events and user-defined events that are not manual:
-generated and
Use this event trigger type: To:
For this event trigger type, you need to specify a control system value as the trigger data
point.
The trigger data point does not have to be a bit but it must be numeric. Because this event
is triggered by a change in the value reported by the control system, only values that
report their data in an unscheduled manner may be selected as the trigger data point. The
values that are collected and interpreted in a binary fashion with a value of zero being Low
or Off and a non-zero value being High or On.
Use the trigger to track a value whose natural state is Low and you want to activate the
event when the value goes High and deactivate the event when the value returns to Low.
Collecting Performance Data Chapter 3
Monitored Bit High to Low Transition Monitor a bit value in the control system.
For this event trigger type, you need to specify a control system value as the trigger data
point.
The trigger data point does not have to be a bit but it must be numeric. Because this event
is triggered by a change in the value reported by the control system only values that report
that are collected are interpreted in a binary fashion with a value of zero being Low or Off
and a non-zero value being High or On.
Use the trigger to track a value whose natural state is High and you want to activate the
event when the value goes Low and deactivate the event when the value returns to High.
This event trigger type will accumulate the amount of time that the control system value is
in a Low state.
Rockwell Automation Publication PLTMT-UM001M-EN-P-June 2014 97
Page 98

Chapter 3 Collecting Performance Data
system only values that report their data in an unscheduled manner may be selected as the
have a specific On/Off value.
See also: Monitored Bit Low to High Transition
See also: Monitored Bit High to Low Transition
Summarization type selected for the event.
compared to other event trigger types.
Use this event trigger type: To:
Monitored Value Monitor any change of a value in the control system.
For this event trigger type, you need to specify a control system value as the trigger data
point for this event trigger type. The trigger data point can be either a numeric or string
data type. Because this event is triggered by a change in the value reported by the control
trigger data point.
Use the trigger to track any change in the monitored value and accumulate the amount of
time that a specific value is reported from the control system.
This event trigger type is very useful for tracking things such as machine states that do not
Monitored Formula Bit Low to High
Transition
Monitor a result of a formula in the control system.
Formulas let you perform advanced calculations that can be based on operations against
multiple data points.
Monitored Formula Bit High to Low
Transition
Monitor a result of a formula in the control system.
Formulas let you perform advanced calculations that can be based on operations against
multiple data points.
Monitored Periodic Value Periodically collect a control system value.
For this event trigger type, you do not select any control system value as a Trigger data
point.
This event trigger type is especially useful for collecting counter values to be associated
with Performance Parameter data. It is used by the Activity Area Part Count - Point and
Part Count Formula Point <Data Point Name> Events. It causes the control system value
selected for the event value data point to be collected from the control system every five
seconds.
The event trigger type does not cause new event data records to be written to the
database. The event data will only be written to the database according to the Data
None Periodically collect a control system value.
For this event trigger type, you do not select any control system value as a Trigger data
point.
This event trigger type is especially useful for collecting physical parameter data over the
duration of a period of data collection. It causes the control system value selected for the
event value data point to be collected and written to the database every 5 seconds for the
duration of data collection.
Important: This event trigger type will generate an extremely large amount of data when
98 Rockwell Automation Publication PLTMT-UM001M-EN-P-June 2014
Page 99

Collecting Performance Data Chapter 3
Event trigger type
Description
Manual active/inactive event trigger type is that the
latter does not require a data point attached to it.
type does not require a data point attached to it.
Event Trigger Types for Manual Events
Configuring the Event Value
There are the following event trigger types available for manual
events:
Manual active/inactive event The behavior of this trigger type is similar to the
following trigger types available for user-defined
events:
• Monitored Bit Low to High Transition
• Monitored Bit High to Low Transition
• Monitored Formula Low to High Transition
• Monitored Formula High to Low Transition
The difference between those trigger types and the
Manual monitored continuous event The behavior of this trigger type is similar to the
Monitored Value trigger type available for
user-defined events.
The difference between those trigger types is that
the Manual monitored continuous event trigger
How do I access the dialog box?
1. On the Configure menu, click FactoryTalk Metrics >
Performance Parameters.
The Manage Performance Parameters dialog box appears.
2. Select the activity area for which you want to associate
machine states, and then click Configure.
The Configure Performance Parameters dialog box appears.
3. If necessary, select the FactoryTalk Transaction Manager
configuration for the activity area.
4. In the left pane of the dialog box, under Custom, click Events.
In the right pane of the dialog box, a list of available categories
and events appears.
Rockwell Automation Publication PLTMT-UM001M-EN-P-June 2014 99
Page 100

Chapter 3 Collecting Performance Data
"Event Value Types (page 101)".
5. Click New.
The Configure Performance Parameter Event dialog box
appears.
To configure the event value:
1. In the left pane of the dialog box, click Event Value.
2. In the Event Value Type list, select one of the following:
• Collect Value at the Start of the Event
• Collect Value at the End of the Event
• Collect Value at the Start and the End of the Event
• Accumulate Value for the Duration of the Event
• None
TIP
For information on individual event value types, see
The following steps will differ depending on the event value
type that you have selected.
If you have selected any of these event value types:
• Collect Value at the Start of the Event
• Collect Value at the End of the Event
• Collect Value at the Start and the End of the Event
• Accumulate Value for the Duration of the Event
Choose either of the following:
• Select a data point for the Event Value
100 Rockwell Automation Publication PLTMT-UM001M-EN-P-June 2014
1. Under Data Point, click Select.
The Select Data Point dialog box appears.
 Loading...