

Page 1

Quick Start
Energy Management Accelerator Toolkit
Energy Assessment and Monitoring Methods System Configuration and
Wiring Energy Data Collector Configuration FactoryTalk EnergyMetrix
Configuration and Maintenance Local HMI Integration
Page 2
Important User Information
IMPORTANT
Read this document and the documents listed in the additional resources section about installation, configuration, and
operation of this equipment before you install, configure, operate, or maintain this product. Users are required to
familiarize themselves with installation and wiring instructions in addition to requirements of all applicable codes, laws,
and standards.
Activities including installation, adjustments, putting into service, use, assembly, disassembly, and maintenance are required
to be carried out by suitably trained personnel in accordance with applicable code of practice.
If this equipment is used in a manner not specified by the manufacturer, the protection provided by the equipment may be
impaired.
In no event will Rockwell Automation, Inc. be responsible or liable for indirect or consequential damages resulting from the
use or application of this equipment.
The examples and diagrams in this manual are included solely for illustrative purposes. Because of the many variables and
requirements associated with any particular installation, Rockwell Automation, Inc. cannot assume responsibility or
liability for actual use based on the examples and diagrams.
No patent liability is assumed by Rockwell Automation, Inc. with respect to use of information, circuits, equipment, or
software described in this manual.
Reproduction of the contents of this manual, in whole or in part, without written permission of Rockwell Automation,
Inc., is prohibited.
Throughout this manual, when necessary, we use notes to make you aware of safety considerations.
WARNING: Identifies information about practices or circumstances that can cause an explosion in a hazardous environment,
which may lead to personal injury or death, property damage, or economic loss.
ATTENTION: Identifies information about practices or circumstances that can lead to personal injury or death, property
damage, or economic loss. Attentions help you identify a hazard, avoid a hazard, and recognize the consequence.
Identifies information that is critical for successful application and understanding of the product.
Labels may also be on or inside the equipment to provide specific precautions.
SHOCK HAZARD: Labels may be on or inside the equipment, for example, a drive or motor, to alert people that dangerous
voltage may be present.
BURN HAZARD: Labels may be on or inside the equipment, for example, a drive or motor, to alert people that surfaces may
reach dangerous temperatures.
ARC FLASH HAZARD: Labels may be on or inside the equipment, for example, a motor control center, to alert people to
potential Arc Flash. Arc Flash will cause severe injury or death. Wear proper Personal Protective Equipment (PPE). Follow ALL
Regulatory requirements for safe work practices and for Personal Protective Equipment (PPE).
Allen-Bradley, CompactLogix, ControlLogix, FactoryTalk, FactoryTalk EnergyMetrix, PanelView Plus, Kinetix, PowerFlex, PowerMonitor, Studio 5000 Logix Designer, RSEnergyMetrix, RSLogix 5000, Rockwell Software,
Rockwell Automation, and TechConnect are trademarks of Rockwell Automation, Inc.
Trademarks not belonging to Rockwel l Automation are property of th eir respective compani es.
Page 3
Chapter 1
Energy Assessment and Monitoring Methods
Chapter 11
FactoryTalk View ME Energy Faceplates
FactoryTalk® EnergyMetrix™ Configuration and
Maintenance
Chapter 5 - Groups and Security Setup
Chapter 6 - Device Setup
Chapter 7 - Meter and Tag Setup
Chapter 8 - Alarm Setup
Chapter 9 - Reports and Charts
Chapter 10 - Maintenance
Chapter 4
FactoryTalk EnergyMetrix Software Installation
Chapter 3
Energy Data Collector Configuration
Chapter 2
System Configuration and Wiring
Chapter 12
Demand Control
Chapter 13
Time of Day Control
Where to Start
Follow this path to complete your energy management application.
Rockwell Automation Publication IASIMP-QS016C-EN-P - October 2014 3
Page 4

Where to Start
Notes:
4 Rockwell Automation Publication IASIMP-QS016C-EN-P - October 2014
Page 5

Energy Assessment and
Monitoring Methods
System Configuration and Wiring
Table of Contents
Preface
About This Publication. . . . . . . . . . . . . . . . . . . . . . . . . . . . . . . . . . . . . . . . . . . 13
Conventions. . . . . . . . . . . . . . . . . . . . . . . . . . . . . . . . . . . . . . . . . . . . . . . . . . . . . 14
Software Requirements . . . . . . . . . . . . . . . . . . . . . . . . . . . . . . . . . . . . . . . . . . . 14
Studio 5000 Environment. . . . . . . . . . . . . . . . . . . . . . . . . . . . . . . . . . . . . 15
Additional Resources . . . . . . . . . . . . . . . . . . . . . . . . . . . . . . . . . . . . . . . . . . . . . 16
Chapter 1
Introduction. . . . . . . . . . . . . . . . . . . . . . . . . . . . . . . . . . . . . . . . . . . . . . . . . . . . . 17
Review These Steps. . . . . . . . . . . . . . . . . . . . . . . . . . . . . . . . . . . . . . . . . . . . . . . 17
Determine Business Goals . . . . . . . . . . . . . . . . . . . . . . . . . . . . . . . . . . . . . . . . 18
Plant Walk-Through . . . . . . . . . . . . . . . . . . . . . . . . . . . . . . . . . . . . . . . . . . . . . 18
Energy Assessment . . . . . . . . . . . . . . . . . . . . . . . . . . . . . . . . . . . . . . . . . . . . . . . 19
Business Case for Energy Monitoring . . . . . . . . . . . . . . . . . . . . . . . . . . . . . . 23
Monitoring Methods . . . . . . . . . . . . . . . . . . . . . . . . . . . . . . . . . . . . . . . . . . . . . 24
Chapter 2
Introduction. . . . . . . . . . . . . . . . . . . . . . . . . . . . . . . . . . . . . . . . . . . . . . . . . . . . . 29
Before You Begin. . . . . . . . . . . . . . . . . . . . . . . . . . . . . . . . . . . . . . . . . . . . . . . . . 29
What You Need . . . . . . . . . . . . . . . . . . . . . . . . . . . . . . . . . . . . . . . . . . . . . . . . . 29
Follow These Steps . . . . . . . . . . . . . . . . . . . . . . . . . . . . . . . . . . . . . . . . . . . . . . . 30
List Energy Data Points. . . . . . . . . . . . . . . . . . . . . . . . . . . . . . . . . . . . . . . . . . . 31
Identify Existing Energy Distribution Layouts and Metering . . . . . . . . . 33
Create Metering Layout and Name Data Collection Hardware . . . . . . 36
Create Energy Panel Layout and Wiring Drawings . . . . . . . . . . . . . . . . . . 48
Select Monitoring Software . . . . . . . . . . . . . . . . . . . . . . . . . . . . . . . . . . . . . . . 52
License Options . . . . . . . . . . . . . . . . . . . . . . . . . . . . . . . . . . . . . . . . . . . . . . 52
Server Requirements. . . . . . . . . . . . . . . . . . . . . . . . . . . . . . . . . . . . . . . . . . 53
Client Requirements. . . . . . . . . . . . . . . . . . . . . . . . . . . . . . . . . . . . . . . . . . 54
Energy Data Collector
Configuration
Chapter 3
Introduction. . . . . . . . . . . . . . . . . . . . . . . . . . . . . . . . . . . . . . . . . . . . . . . . . . . . . 55
Before You Begin. . . . . . . . . . . . . . . . . . . . . . . . . . . . . . . . . . . . . . . . . . . . . . . . . 55
What You Need . . . . . . . . . . . . . . . . . . . . . . . . . . . . . . . . . . . . . . . . . . . . . . . . . 55
Follow These Steps . . . . . . . . . . . . . . . . . . . . . . . . . . . . . . . . . . . . . . . . . . . . . . . 56
Configure a PowerMonitor 3000 Device . . . . . . . . . . . . . . . . . . . . . . . . . . . 57
Configure a PowerMonitor 1000 Device . . . . . . . . . . . . . . . . . . . . . . . . . . . 62
Configure a PowerMonitor Wireless 250 Device. . . . . . . . . . . . . . . . . . . . 67
PC Receiver Connection . . . . . . . . . . . . . . . . . . . . . . . . . . . . . . . . . . . . . . 67
Configure a PowerMonitor 500 Device . . . . . . . . . . . . . . . . . . . . . . . . . . . . 68
Configure with the Display. . . . . . . . . . . . . . . . . . . . . . . . . . . . . . . . . . . . 68
Access the Programming Menu . . . . . . . . . . . . . . . . . . . . . . . . . . . . . . . . 69
Configure Communication Parameters . . . . . . . . . . . . . . . . . . . . . . . . 69
Configure Basic Device Parameters . . . . . . . . . . . . . . . . . . . . . . . . . . . . 70
Configure Advanced Parameters. . . . . . . . . . . . . . . . . . . . . . . . . . . . . . . 70
Configure the Date and Time . . . . . . . . . . . . . . . . . . . . . . . . . . . . . . . . . 71
Rockwell Automation Publication IASIMP-QS016C-EN-P - October 2014 5
Page 6

Table of Contents
FactoryTalk EnergyMetrix
Software Installation
Configure a PowerMonitor 5000 Device . . . . . . . . . . . . . . . . . . . . . . . . . . . 72
Setup Using the Web Interface. . . . . . . . . . . . . . . . . . . . . . . . . . . . . . . . . 72
Obtaining Access to the Configuration Pages . . . . . . . . . . . . . . . . . . . 72
How to Set Up the PowerMonitor 5000 Unit. . . . . . . . . . . . . . . . . . . 73
Configure a CompactLogix Controller . . . . . . . . . . . . . . . . . . . . . . . . . . . . . 78
Chapter 4
Introduction . . . . . . . . . . . . . . . . . . . . . . . . . . . . . . . . . . . . . . . . . . . . . . . . . . . . . 91
Before You Begin . . . . . . . . . . . . . . . . . . . . . . . . . . . . . . . . . . . . . . . . . . . . . . . . . 91
What You Need. . . . . . . . . . . . . . . . . . . . . . . . . . . . . . . . . . . . . . . . . . . . . . . . . . 91
Follow These Steps . . . . . . . . . . . . . . . . . . . . . . . . . . . . . . . . . . . . . . . . . . . . . . . 92
Contents of Installation DVD . . . . . . . . . . . . . . . . . . . . . . . . . . . . . . . . . . . . . 93
Server Requirements . . . . . . . . . . . . . . . . . . . . . . . . . . . . . . . . . . . . . . . . . . . . . . 93
Server Software Requirements for Installing FactoryTalk
EnergyMetrix. . . . . . . . . . . . . . . . . . . . . . . . . . . . . . . . . . . . . . . . . . . . . . . . . 93
Hardware Requirements . . . . . . . . . . . . . . . . . . . . . . . . . . . . . . . . . . . . . . 93
Client Requirements. . . . . . . . . . . . . . . . . . . . . . . . . . . . . . . . . . . . . . . . . . . . . . 94
Installation (64-bit). . . . . . . . . . . . . . . . . . . . . . . . . . . . . . . . . . . . . . . . . . . . . . . 95
Configure Windows 2008 Server. . . . . . . . . . . . . . . . . . . . . . . . . . . . . . . 95
Install SQL Server 2008 R2 . . . . . . . . . . . . . . . . . . . . . . . . . . . . . . . . . . . . 96
Enable 32-bit Applications . . . . . . . . . . . . . . . . . . . . . . . . . . . . . . . . . . . . 98
Install FactoryTalk EnergyMetrix Software Version 2.0 . . . . . . . . . . 98
Installation (32-bit). . . . . . . . . . . . . . . . . . . . . . . . . . . . . . . . . . . . . . . . . . . . . . . 99
Pre-installation Checks. . . . . . . . . . . . . . . . . . . . . . . . . . . . . . . . . . . . . . . . 99
Installation. . . . . . . . . . . . . . . . . . . . . . . . . . . . . . . . . . . . . . . . . . . . . . . . . . 100
Activate FactoryTalk EnergyMetrix Software . . . . . . . . . . . . . . . . . . . . . . 102
How to Activate Your Software . . . . . . . . . . . . . . . . . . . . . . . . . . . . . . . 103
Chapter 5
FactoryTalk EnergyMetrix Groups
and Security Setup
Introduction . . . . . . . . . . . . . . . . . . . . . . . . . . . . . . . . . . . . . . . . . . . . . . . . . . . . 105
Before You Begin . . . . . . . . . . . . . . . . . . . . . . . . . . . . . . . . . . . . . . . . . . . . . . . . 105
What You Need. . . . . . . . . . . . . . . . . . . . . . . . . . . . . . . . . . . . . . . . . . . . . . . . . 105
Follow These Steps . . . . . . . . . . . . . . . . . . . . . . . . . . . . . . . . . . . . . . . . . . . . . . 106
Creating Domains and Groups . . . . . . . . . . . . . . . . . . . . . . . . . . . . . . . . . . . 107
Configuring Security. . . . . . . . . . . . . . . . . . . . . . . . . . . . . . . . . . . . . . . . . . . . . 113
Chapter 6
FactoryTalk EnergyMetrix
Software Device Setup
6 Rockwell Automation Publication IASIMP-QS016C-EN-P - October 2014
Introduction . . . . . . . . . . . . . . . . . . . . . . . . . . . . . . . . . . . . . . . . . . . . . . . . . . . . 119
Before You Begin . . . . . . . . . . . . . . . . . . . . . . . . . . . . . . . . . . . . . . . . . . . . . . . . 119
What You Need. . . . . . . . . . . . . . . . . . . . . . . . . . . . . . . . . . . . . . . . . . . . . . . . . 119
Follow These Steps . . . . . . . . . . . . . . . . . . . . . . . . . . . . . . . . . . . . . . . . . . . . . . 120
Overview of Devices . . . . . . . . . . . . . . . . . . . . . . . . . . . . . . . . . . . . . . . . . . . . . 121
Configure Communication Drivers . . . . . . . . . . . . . . . . . . . . . . . . . . . . . . . 122
Configure a PowerMonitor Device. . . . . . . . . . . . . . . . . . . . . . . . . . . . . . . . 126
Copy Devices . . . . . . . . . . . . . . . . . . . . . . . . . . . . . . . . . . . . . . . . . . . . . . . . . . . 128
Page 7

FactoryTalk EnergyMetrix
Software Meter and Tag Setup
FactoryTalk EnergyMetrix
Software Alarm Setup
Table of Contents
Configure a CompactLogix Device . . . . . . . . . . . . . . . . . . . . . . . . . . . . . . . 130
Configure OPC Server Device . . . . . . . . . . . . . . . . . . . . . . . . . . . . . . . . . . . 132
Chapter 7
Introduction. . . . . . . . . . . . . . . . . . . . . . . . . . . . . . . . . . . . . . . . . . . . . . . . . . . . 133
Before You Begin. . . . . . . . . . . . . . . . . . . . . . . . . . . . . . . . . . . . . . . . . . . . . . . . 133
What You Need . . . . . . . . . . . . . . . . . . . . . . . . . . . . . . . . . . . . . . . . . . . . . . . . 133
Follow These Steps . . . . . . . . . . . . . . . . . . . . . . . . . . . . . . . . . . . . . . . . . . . . . . 134
Creating Electric Meters for PowerMonitor Devices . . . . . . . . . . . . . . . 134
Creating Energy Meters for PowerMonitor Status Inputs. . . . . . . . . . . 140
Creating Energy Meters for CompactLogix Devices . . . . . . . . . . . . . . . . 145
Creating Energy Meters for OPC Server Device . . . . . . . . . . . . . . . . . . . 150
Sharing and Moving Meters . . . . . . . . . . . . . . . . . . . . . . . . . . . . . . . . . . . . . . 153
Chapter 8
Introduction. . . . . . . . . . . . . . . . . . . . . . . . . . . . . . . . . . . . . . . . . . . . . . . . . . . . 159
Before You Begin. . . . . . . . . . . . . . . . . . . . . . . . . . . . . . . . . . . . . . . . . . . . . . . . 159
What You Need . . . . . . . . . . . . . . . . . . . . . . . . . . . . . . . . . . . . . . . . . . . . . . . . 159
Follow These Steps . . . . . . . . . . . . . . . . . . . . . . . . . . . . . . . . . . . . . . . . . . . . . . 160
Overview of Alarms . . . . . . . . . . . . . . . . . . . . . . . . . . . . . . . . . . . . . . . . . . . . . 161
Configure an Analog Alarm. . . . . . . . . . . . . . . . . . . . . . . . . . . . . . . . . . . . . . 161
Configure a Digital Alarm . . . . . . . . . . . . . . . . . . . . . . . . . . . . . . . . . . . . . . . 164
View and Edit Alarm Setups . . . . . . . . . . . . . . . . . . . . . . . . . . . . . . . . . . . . . 169
Configure Communication Alarms. . . . . . . . . . . . . . . . . . . . . . . . . . . . . . . 169
Configure Email Alarm Subscriptions. . . . . . . . . . . . . . . . . . . . . . . . . . . . . 170
Configure SMTP Server . . . . . . . . . . . . . . . . . . . . . . . . . . . . . . . . . . . . . . . . . 171
View Active Alarms and Alarm Log. . . . . . . . . . . . . . . . . . . . . . . . . . . . . . . 172
FactoryTalk EnergyMetrix
Software Reports and Charts
FactoryTalk EnergyMetrix
Software and PowerMonitor
Device Maintenance
Chapter 9
Introduction. . . . . . . . . . . . . . . . . . . . . . . . . . . . . . . . . . . . . . . . . . . . . . . . . . . . 173
What You Need . . . . . . . . . . . . . . . . . . . . . . . . . . . . . . . . . . . . . . . . . . . . . . . . 173
Follow These Steps . . . . . . . . . . . . . . . . . . . . . . . . . . . . . . . . . . . . . . . . . . . . . . 174
Standard Reports. . . . . . . . . . . . . . . . . . . . . . . . . . . . . . . . . . . . . . . . . . . . . . . . 175
Consumption Report. . . . . . . . . . . . . . . . . . . . . . . . . . . . . . . . . . . . . . . . . . . . 176
Demand Analysis Report . . . . . . . . . . . . . . . . . . . . . . . . . . . . . . . . . . . . . . . . 180
Billing Report. . . . . . . . . . . . . . . . . . . . . . . . . . . . . . . . . . . . . . . . . . . . . . . . . . . 182
Cost Allocation Report . . . . . . . . . . . . . . . . . . . . . . . . . . . . . . . . . . . . . . . . . . 187
Power Quality Report . . . . . . . . . . . . . . . . . . . . . . . . . . . . . . . . . . . . . . . . . . . 192
Standard Charts. . . . . . . . . . . . . . . . . . . . . . . . . . . . . . . . . . . . . . . . . . . . . . . . . 194
Chapter 10
Introduction. . . . . . . . . . . . . . . . . . . . . . . . . . . . . . . . . . . . . . . . . . . . . . . . . . . . 199
Before You Begin. . . . . . . . . . . . . . . . . . . . . . . . . . . . . . . . . . . . . . . . . . . . . . . . 199
What You Need . . . . . . . . . . . . . . . . . . . . . . . . . . . . . . . . . . . . . . . . . . . . . . . . 199
Follow These Steps . . . . . . . . . . . . . . . . . . . . . . . . . . . . . . . . . . . . . . . . . . . . . . 200
Rockwell Automation Publication IASIMP-QS016C-EN-P - October 2014 7
Page 8

Table of Contents
FactoryTalk View ME Energy
Faceplates
Set Up Database Maintenance . . . . . . . . . . . . . . . . . . . . . . . . . . . . . . . . . . . . 201
Automatic Data Repopulation. . . . . . . . . . . . . . . . . . . . . . . . . . . . . . . . . . . . 204
Devices that Support ADR . . . . . . . . . . . . . . . . . . . . . . . . . . . . . . . . . . . 204
Monitor Health of Data Logging . . . . . . . . . . . . . . . . . . . . . . . . . . . . . . . . . 206
Using the Windows Event Viewer . . . . . . . . . . . . . . . . . . . . . . . . . . . . . . . . 207
Running System Configuration Reports . . . . . . . . . . . . . . . . . . . . . . . . . . . 208
System Updates and Upgrades . . . . . . . . . . . . . . . . . . . . . . . . . . . . . . . . . . . . 209
Chapter 11
Introduction . . . . . . . . . . . . . . . . . . . . . . . . . . . . . . . . . . . . . . . . . . . . . . . . . . . . 213
Before You Begin . . . . . . . . . . . . . . . . . . . . . . . . . . . . . . . . . . . . . . . . . . . . . . . . 214
What You Need. . . . . . . . . . . . . . . . . . . . . . . . . . . . . . . . . . . . . . . . . . . . . . . . . 214
Follow These Steps . . . . . . . . . . . . . . . . . . . . . . . . . . . . . . . . . . . . . . . . . . . . . . 215
Configure PowerMonitor 1000 Faceplates. . . . . . . . . . . . . . . . . . . . . . . . . 217
Configure ME PowerMonitor 500 Faceplates. . . . . . . . . . . . . . . . . . . . . . 229
Configure RSLogix5000 for the PowerMonitor 500 Unit
Faceplate. . . . . . . . . . . . . . . . . . . . . . . . . . . . . . . . . . . . . . . . . . . . . . . . . . . . 230
Configure FactoryTalk View ME for the PowerMonitor 500
Unit Faceplate. . . . . . . . . . . . . . . . . . . . . . . . . . . . . . . . . . . . . . . . . . . . . . . 233
Configure PowerMonitor 5000 Unit Faceplates. . . . . . . . . . . . . . . . . . . . 238
Configure RSLogix5000 for the PowerMonitor 5000 Unit
Faceplate. . . . . . . . . . . . . . . . . . . . . . . . . . . . . . . . . . . . . . . . . . . . . . . . . . . . 239
Configure FactoryTalk View ME for the PowerMonitor 5000
Unit Faceplate. . . . . . . . . . . . . . . . . . . . . . . . . . . . . . . . . . . . . . . . . . . . . . . 243
Configure ME PowerFlex Drives Faceplates . . . . . . . . . . . . . . . . . . . . . . . 248
Configure RSLogix5000 for the PowerFlex Drive Faceplate . . . . . 249
Configure FactoryTalk View ME for the PowerFlex Drive
Unit Faceplate. . . . . . . . . . . . . . . . . . . . . . . . . . . . . . . . . . . . . . . . . . . . . . . 261
Configure ME E3PLUS Faceplates. . . . . . . . . . . . . . . . . . . . . . . . . . . . . . . . 265
DeviceNet to EtherNet/IP Network Setup . . . . . . . . . . . . . . . . . . . . 265
Configure RSLogix5000 for the E3 Plus Faceplate . . . . . . . . . . . . . . 268
Configure FactoryTalk View ME for the E3 Plus
Module Faceplate . . . . . . . . . . . . . . . . . . . . . . . . . . . . . . . . . . . . . . . . . . . . 276
Configure ME E300 Faceplate. . . . . . . . . . . . . . . . . . . . . . . . . . . . . . . . . . . . 280
Configure RSLogix5000 for the E300 Module Faceplate . . . . . . . . 281
Configure FactoryTalk View ME for the E3 Plus
Module Faceplate . . . . . . . . . . . . . . . . . . . . . . . . . . . . . . . . . . . . . . . . . . . . 287
Configure ME SMC-50 Controller Faceplates . . . . . . . . . . . . . . . . . . . . . 292
Configure RSLogix5000 for the SMC-50 Controller Faceplate . . 292
Configure FactoryTalk View ME for the SMC-50 Controller
Faceplate. . . . . . . . . . . . . . . . . . . . . . . . . . . . . . . . . . . . . . . . . . . . . . . . . . . . 301
Configure ME CIP Motion Drive Faceplates . . . . . . . . . . . . . . . . . . . . . . 306
System Compatibility . . . . . . . . . . . . . . . . . . . . . . . . . . . . . . . . . . . . . . . . 306
General Setup . . . . . . . . . . . . . . . . . . . . . . . . . . . . . . . . . . . . . . . . . . . . . . . 306
Configure Studio 5000 Logix Designer Application for
the Kinetix Drive Faceplate . . . . . . . . . . . . . . . . . . . . . . . . . . . . . . . . . . . 307
8 Rockwell Automation Publication IASIMP-QS016C-EN-P - October 2014
Page 9

Demand Control
Table of Contents
CIP Motion Energy Faceplate Overview. . . . . . . . . . . . . . . . . . . . . . . 315
Configure Device Logic for Equipment Status and Alarm
History Faceplates. . . . . . . . . . . . . . . . . . . . . . . . . . . . . . . . . . . . . . . . . . . . . . . 317
Configure Equipment Status Faceplate. . . . . . . . . . . . . . . . . . . . . . . . . . . . 338
Configure Alarm History Faceplate. . . . . . . . . . . . . . . . . . . . . . . . . . . . . . . 347
Create a Runtime Application File. . . . . . . . . . . . . . . . . . . . . . . . . . . . . . . . 354
Transfer Runtime File to PanelView Plus Terminal . . . . . . . . . . . . . . . . 356
Run Application on PanelView Plus Terminal . . . . . . . . . . . . . . . . . . . . . 357
Chapter 12
Introduction. . . . . . . . . . . . . . . . . . . . . . . . . . . . . . . . . . . . . . . . . . . . . . . . . . . . 359
Before You Begin. . . . . . . . . . . . . . . . . . . . . . . . . . . . . . . . . . . . . . . . . . . . . . . . 359
What You Need . . . . . . . . . . . . . . . . . . . . . . . . . . . . . . . . . . . . . . . . . . . . . . . . 359
Follow These Steps . . . . . . . . . . . . . . . . . . . . . . . . . . . . . . . . . . . . . . . . . . . . . . 360
Control Hardware Selection and Wiring . . . . . . . . . . . . . . . . . . . . . . . . . . 360
List Load Outputs and Inputs . . . . . . . . . . . . . . . . . . . . . . . . . . . . . . . . 360
Create Control Panel Layout and Wiring. . . . . . . . . . . . . . . . . . . . . . 361
Logic Integration. . . . . . . . . . . . . . . . . . . . . . . . . . . . . . . . . . . . . . . . . . . . . . . . 362
Configure Controller, Network, and I/O. . . . . . . . . . . . . . . . . . . . . . 362
Import and Configure Demand Control Program. . . . . . . . . . . . . . 364
Configure Load Inputs and Outputs . . . . . . . . . . . . . . . . . . . . . . . . . . 366
Configure PowerMonitor Messages . . . . . . . . . . . . . . . . . . . . . . . . . . . 367
Configure Password . . . . . . . . . . . . . . . . . . . . . . . . . . . . . . . . . . . . . . . . . 368
Save the Project File . . . . . . . . . . . . . . . . . . . . . . . . . . . . . . . . . . . . . . . . . 368
HMI Integration. . . . . . . . . . . . . . . . . . . . . . . . . . . . . . . . . . . . . . . . . . . . . . . . 369
Add Demand Faceplate to FactoryTalk View ME Application . . 369
Create a Display Navigation Button. . . . . . . . . . . . . . . . . . . . . . . . . . . 369
Configure Alarms . . . . . . . . . . . . . . . . . . . . . . . . . . . . . . . . . . . . . . . . . . . 370
Configure Communication . . . . . . . . . . . . . . . . . . . . . . . . . . . . . . . . . . 372
System Commissioning . . . . . . . . . . . . . . . . . . . . . . . . . . . . . . . . . . . . . . . . . . 373
Install System Hardware . . . . . . . . . . . . . . . . . . . . . . . . . . . . . . . . . . . . . 373
Download RSLogix5000 Project. . . . . . . . . . . . . . . . . . . . . . . . . . . . . . 374
Configure and Download FactoryTalk Project to
PanelView Plus Terminal . . . . . . . . . . . . . . . . . . . . . . . . . . . . . . . . . . . . 375
Demand Control Configuration. . . . . . . . . . . . . . . . . . . . . . . . . . . . . . 377
System Application Guide . . . . . . . . . . . . . . . . . . . . . . . . . . . . . . . . . . . . . . . 380
Faceplate Operation Overview. . . . . . . . . . . . . . . . . . . . . . . . . . . . . . . . 380
Demand Controller Tags . . . . . . . . . . . . . . . . . . . . . . . . . . . . . . . . . . . . 389
Time of Day Control
Chapter 13
Introduction. . . . . . . . . . . . . . . . . . . . . . . . . . . . . . . . . . . . . . . . . . . . . . . . . . . . 393
Before You Begin. . . . . . . . . . . . . . . . . . . . . . . . . . . . . . . . . . . . . . . . . . . . . . . . 393
What You Need . . . . . . . . . . . . . . . . . . . . . . . . . . . . . . . . . . . . . . . . . . . . . . . . 393
Follow These Steps . . . . . . . . . . . . . . . . . . . . . . . . . . . . . . . . . . . . . . . . . . . . . . 394
Control Hardware Selection and Wiring . . . . . . . . . . . . . . . . . . . . . . . . . . 394
Rockwell Automation Publication IASIMP-QS016C-EN-P - October 2014 9
Page 10

Table of Contents
List Load Outputs and Inputs. . . . . . . . . . . . . . . . . . . . . . . . . . . . . . . . . 394
Create Control Panel Layout and Wiring . . . . . . . . . . . . . . . . . . . . . . 395
Logic Integration . . . . . . . . . . . . . . . . . . . . . . . . . . . . . . . . . . . . . . . . . . . . . . . . 396
Configure Controller, Network, and I/O . . . . . . . . . . . . . . . . . . . . . . 396
Import and Configure Time of Day Program. . . . . . . . . . . . . . . . . . . 398
Configure Load Inputs and Outputs . . . . . . . . . . . . . . . . . . . . . . . . . . 399
Configure Alarms. . . . . . . . . . . . . . . . . . . . . . . . . . . . . . . . . . . . . . . . . . . . 401
Save the Project File. . . . . . . . . . . . . . . . . . . . . . . . . . . . . . . . . . . . . . . . . . 401
HMI Integration . . . . . . . . . . . . . . . . . . . . . . . . . . . . . . . . . . . . . . . . . . . . . . . . 402
Add TOD Faceplate to FactoryTalk View ME Application . . . . . 402
Configure Alarms. . . . . . . . . . . . . . . . . . . . . . . . . . . . . . . . . . . . . . . . . . . . 402
Configure Communication. . . . . . . . . . . . . . . . . . . . . . . . . . . . . . . . . . . 404
System Commissioning . . . . . . . . . . . . . . . . . . . . . . . . . . . . . . . . . . . . . . . . . . 405
Install System Hardware. . . . . . . . . . . . . . . . . . . . . . . . . . . . . . . . . . . . . . 405
Download RSLogix5000 Project File . . . . . . . . . . . . . . . . . . . . . . . . . . 405
Configure and Download FactoryTalk Project to
PanelView Plus Terminal. . . . . . . . . . . . . . . . . . . . . . . . . . . . . . . . . . . . . 407
System Startup and Test . . . . . . . . . . . . . . . . . . . . . . . . . . . . . . . . . . . . . . . . . 409
System Application Guide. . . . . . . . . . . . . . . . . . . . . . . . . . . . . . . . . . . . . . . . 415
Faceplate Operation Overview . . . . . . . . . . . . . . . . . . . . . . . . . . . . . . . . 415
Custom Meter Types
Custom Units and Value Types
Energy Electric Add-On
Instructions
Digital and Analog Energy Add-On
Instructions
Appendix A
. . . . . . . . . . . . . . . . . . . . . . . . . . . . . . . . . . . . . . . . . . . . . . . . . . . . . . . . . . . . . . . . 423
Appendix B
Verify Base Units . . . . . . . . . . . . . . . . . . . . . . . . . . . . . . . . . . . . . . . . . . . . . . . . 425
Create Base Units . . . . . . . . . . . . . . . . . . . . . . . . . . . . . . . . . . . . . . . . . . . . . . . 426
Verify Units. . . . . . . . . . . . . . . . . . . . . . . . . . . . . . . . . . . . . . . . . . . . . . . . . . . . . 427
Create Units . . . . . . . . . . . . . . . . . . . . . . . . . . . . . . . . . . . . . . . . . . . . . . . . . . . . 427
Verify Value Types . . . . . . . . . . . . . . . . . . . . . . . . . . . . . . . . . . . . . . . . . . . . . . 429
Create Value Types . . . . . . . . . . . . . . . . . . . . . . . . . . . . . . . . . . . . . . . . . . . . . . 429
Appendix C
CompactLogix Digital Input Logic. . . . . . . . . . . . . . . . . . . . . . . . . . . . . . . . 431
PowerMonitor Digital Status Input Logic . . . . . . . . . . . . . . . . . . . . . . . . . 432
CompactLogix Analog Input Logic . . . . . . . . . . . . . . . . . . . . . . . . . . . . . . . 433
Demand Calculation Logic . . . . . . . . . . . . . . . . . . . . . . . . . . . . . . . . . . . . . . . 434
Equipment Status Faceplate Logic . . . . . . . . . . . . . . . . . . . . . . . . . . . . . . . . 436
Alarm History Faceplate Logic. . . . . . . . . . . . . . . . . . . . . . . . . . . . . . . . . . . . 437
Appendix D
CompactLogix Digital Input Logic. . . . . . . . . . . . . . . . . . . . . . . . . . . . . . . . 439
PowerMonitor Digital Status Input Logic . . . . . . . . . . . . . . . . . . . . . . . . . 440
CompactLogix Analog Input Logic . . . . . . . . . . . . . . . . . . . . . . . . . . . . . . . 441
Equipment Status Faceplate Logic . . . . . . . . . . . . . . . . . . . . . . . . . . . . . . . . 443
10 Rockwell Automation Publication IASIMP-QS016C-EN-P - October 2014
Page 11

Update Add-on Profiles
Table of Contents
Alarm History Faceplate Logic . . . . . . . . . . . . . . . . . . . . . . . . . . . . . . . . . . . 444
Appendix E
Update the E3PLUS Add-On Profiles . . . . . . . . . . . . . . . . . . . . . . . . . . . . 447
Update the SMC-50 Add-On Profiles . . . . . . . . . . . . . . . . . . . . . . . . . . . . 448
Update the PowerFlex Add-On Profiles. . . . . . . . . . . . . . . . . . . . . . . . . . . 449
Update the E300 Add-On Profiles. . . . . . . . . . . . . . . . . . . . . . . . . . . . . . . . 450
Rockwell Automation Publication IASIMP-QS016C-EN-P - October 2014 11
Page 12

Table of Contents
Notes:
12 Rockwell Automation Publication IASIMP-QS016C-EN-P - October 2014
Page 13

Preface
IMPORTANT
About This Publication
This quick start is designed to provide a framework for developing an energy management monitoring, analysis, and
control application for your facility. Each section guides you through the tasks you need to plan, configure, program, and
use your Rockwell Automation
named Efficient Industries Plant 1, is referenced throughout this quick start to guide you through these tasks.
To help in the design and installation of your system, application files and other information is provided on the Energy
Management Accelerator Toolkit CD, publication IASIMP-SP014. The CD provides an energy data worksheet, layout
and wiring drawings, data collection and control logic, and more. With these tools and the built-in best-practices design,
you can focus on the design of your system and not on design overhead tasks.
Before using this quick start and the CD, read the Terms and Conditions on the
CD.
The beginning of each chapter contains the following information. Read these sections carefully before you begin work in
each chapter.
• Before You Begin - This section lists the steps that must be completed and decisions that must be made before
starting that chapter. The chapters in this quick start do not have to be completed in the order in which they appear,
but this section defines the minimum amount of preparation that is required before completing the current chapter.
• What You Need - This section lists the tools that are required to complete the steps in the current chapter. This
includes, but is not limited to, hardware and software.
• Follow These Steps - This illustrates the steps in the current chapter and identifies which steps are required to
complete the examples.
energy data collection and control devices and analysis software. An example application,
Rockwell Automation Publication IASIMP-QS016C-EN-P - October 2014 13
Page 14

Preface
Conventions
The manual uses the following conventions.
Convention Meaning Example
Click
Double-click
Right-click
Drag and drop
Choose Choose an option from a list of options. From the Tools menu, choose Internet Options.
Select Click to highlight an item. Select the Devices folder.
Check or uncheck Click to activate or deactivate a checkbox. Check Enable device.
> Shows nested menu selections as menu name followed by menu selection. Choose File > New > Document.
Expand Click the + to the left of a given item /folder to show its contents. Expand the Main Task.
Click the left mouse button once to initiate an action. (Assumes cursor is positioned
on object or selection.)
To initiate an action, click the left mouse button twice in quick succession while the
cursor is positioned on object or selection.
To initiate an action, click the right mouse button once while the cursor is positioned
on object or selection.
Click and hold the left mouse button on an object, move the cursor to where you
want to move the object, and release the mouse button.
Click Browse.
Double-click the application icon.
Right-click the Ethernet port.
Drag and drop a task into the blank plan.
Software Requirements
You need the following software to use this toolkit.
Rockwell Automation Software Version Required For
Studio 5000 Logix Designer application 21.00 or later Power and energy management
RSLogix 5000
• ControlFlash
• BOOTP/DHCP utility
•RSLinx
FactoryTalk View Studio for Machine Edition
• FactoryTalk Services
• RSLinx Enterprise
• RSLinx Classic
Fac toryTa lk
cat. no. 9307-FTEMMENE
Energy Management Accelerator Toolkit CD IASIMP-SP014 CAD files, wiring diagrams, application
Classic
EnergyMetrix™ CD,
17.00 or later
5.0 or later PanelView Plus terminals
2.0 or later FactoryTalk EnergyMetrix software
applications
files, and other support information
14 Rockwell Automation Publication IASIMP-QS016C-EN-P - October 2014
Page 15

Preface
Studio 5000 Environment
The Studio 5000 Engineering and Design Environment combines engineering and design elements into a common
environment. The first element in the Studio 5000 environment is the Logix Designer application. The Logix Designer
application is the rebranding of RSLogix 5000 software and continues to be the product to program Logix5000™
controllers for discrete, process, batch, motion, safety, and drive-based solutions.
The Studio 5000 environment is the foundation for the future of Rockwell Automation engineering design tools and
capabilities. It is the one place for design engineers to develop all the elements of their control system.
Rockwell Automation Publication IASIMP-QS016C-EN-P - October 2014 15
Page 16

Preface
Additional Resources
These documents contain additional information concerning related products from Rockwell Automation.
Resource Description
PowerMonitor 1000 Unit Installation Instructions, publication 1408-IN001 Provides information on installing, wiring, connecting, applying power and configuring the
PowerMonitor 1000 Unit User Manual, publication
1408-UM001
PowerMonitor 3000 Master Module installation instructions, publication
1404-IN007
Bulletin 1404 PowerMonitor 3000 Display Module installation
instructions, 1404-IN005
Bulletin 1404 PowerMonitor 3000 Unit User Manual, publication
1404-UM001
Bulletin 1404 PowerMonitor 3000 Unit User Manual, publication
1404-UM001D-EN-P
Bulletin 1404 Series B Ethernet Communication Release Note, publication
1404-RN008
PowerMonitor Wireless 250 Monitor User Manual, publication
1425-UM001
PowerMonitor 500 Unit User Manual, publication 1420-UM001
PowerMonitor 5000 Unit User Manual, publication
1426-UM001A
FactoryTalk EnergyMetrix User Manual, publication
FTEM-UM002
Power and Energy Management Solutions Product Overview, publication
EMSE00-BR017
Power and Energy Management Solutions Selection Guide, publication
1400-SG001
Logix Common Procedures Programming Manual, publication
1756-PM001
Industrial Automation Wiring and Grounding Guidelines, publication
1770-4.1
Product Certifications website, http://www.ab.com Provides declarations of conformity, certificates, and other certification details.
http://www.rockwellautomation.com/solutions/integratedarchitecture/
Rockwell Automation Configuration and Selection Tools, available at
http://www.rockwellautomation.com/en/e-tools/
Power Monito r 1000 unit.
Provides information on setting up communication with the PowerMonitor 1000 unit by using other
applications and controllers.
Provides information on selecting an enclosure, installing, and wiring the PowerMonitor 3000 master
module.
Provides information on installing and wiring the PowerMonitor 3000 display module.
Provides information on setting up communication with the PowerMonitor 3000 master module,
firmware version 3.0 or later, by using other applications and controllers.
Provides information on setting up communication with the PowerMonitor 3000 master module, prior to
firmware version 3.0, by using other applications and controllers.
Provides information on using the PowerMonitor 3000 module with EtherNet/IP communication.
Provides information on installing, wiring and setting up communication with the PowerMonitor
Wireless 250 unit.
Provides information on installing, wiring and setting up communication with the PowerMonitor 500
unit.
Provides information on installing, wiring and setting up communication with the PowerMonitor 5000
unit.
Provides information on how to use FactoryTalk EnergyMetrix, a modular, scalable, web-enabled, client/
server energy information and management application.
Provides an overview of the Rockwell Automation suite of energy management services and solutions,
includ ing hardware and software, for
monitoring, analyzing, controlling, and optimizing energy systems.
Provides information on selecting energy management ser vices and solutions, including hardware and
power management software.
Provides information on programming Logix 5000 controllers, including managing project files,
organizing tags, programming and testing routines, and handling faults
Provides general guidelines for installing a Rockwell Automation industrial system.
Provides information on integrated architecture tools and resources including accelerator toolkits.
These online tools install on your personal computer so that you can quickly access information on our
products.
• CrossWorks
• Industrial Computer Selector
• Operator Inter face Selection Tool
• Programmable Controller Family Selector
You can view or download publications at
http:/www.rockwellautomation.com/literature/
. To order paper copies of technical documentation, contact your local
Allen-Bradley distributor or Rockwell Automation sales representative.
16 Rockwell Automation Publication IASIMP-QS016C-EN-P - October 2014
Page 17

Chapter
Plant Walk-Through
Energy Assessment
Determine Business Goals
page 18
page 18
page 19
Business Case for Energy Monitoring
page 23
Monitoring Methods
page 24
Energy Assessment and Monitoring Methods
Introduction
This chapter introduces the fundamentals of creating an energy management plan that will help you to:
• determine your business goals.
• perform a plant walk-through.
• perform an energy assessment.
• understand the business case for energy monitoring.
• review the monitoring methods available when applying Rockwell Automation energy management hardware and
software products.
1
Review These Steps
Review these concepts to create an energy management plan for your facility.
Rockwell Automation Publication IASIMP-QS016C-EN-P - October 2014 17
Page 18

Chapter 1 Energy Assessment and Monitoring Methods
Determine Business Goals
Business today has changed and it added a color - green. Not only do you need to meet your business and production goals,
but global dynamics are forcing you to pursue energy reductions. Many companies can help reduce energy consumption at
their manufacturing facilities when a plan is implemented.
Determining your business goals is the first step in understanding and developing the scope of your energy and power
management application. Your business goals may include:
• Energy cost reduction
• Operating equipment efficiency
• Usage based cost accounting
• Downtime reduction through power quality monitoring
• Sustainable production initiatives
• Driving energy cost accountability to the energy user
• Identifying and justifying energ y cost savings projects
Plant Walk-Through
After determining your business goals, conduct a walk-through of your plant or campus. This will help you to identify the
largest energy consumption uses and events.
To maximize the efficiency of the walk-through, gather pertinent facility documentation that is available.
• Facility one line diagrams for electricity, gas, water, steam, air, and other fuels
• Production equipment layout
• Electric power equipment list
• Other energy equipment documentation including boilers, air compressors, HVAC equipment, and process cooling
equipment
• Energy meters and monitoring equipment
Plant walk-through steps include:
1. Listing large energy consuming equipment and processes.
2. Listing typical time of use or duty cycle.
3. Listing operational or production dependencies.
4. Identifying applications using variable speed drives.
5. Reviewing operation of air compressors, boilers, and chillers
18 Rockwell Automation Publication IASIMP-QS016C-EN-P - October 2014
Page 19
Energy Assessment and Monitoring Methods Chapter 1
Energy Assessment
The assessment process is a detailed analysis of the data collected during the walk-through. Identifying opportunities for
energy savings and developing the return on investment for these projects is critical. Energy assessments should identify not
only opportunities, but savings, project costs, and payback calculations. Projects should also be categorized as awareness or
behavior changes, minor cost, and capital. This approach will help prioritize the steps in the energy savings plan.
Collect and Analyze Utility Bills and Rate Schedules
An important part of the energy assessment is to collect and analyze your current utility rate schedules and bills. This
typically includes electric, natural gas, water, and sewer. Other fuels consumed may include fuel oil, propane, or steam.
Understanding your bill is crucial in executing an appropriate energy management plan to maximize your energy savings
investment.
Energy rate schedules from your local utilities can include, but are not limited to, line item charges such as:
• Demand Charges - A variable monthly or yearly charge for the highest amount of energy consumed over a fixed
period, typically 15 minutes. This charge can contribute significantly to overall energy costs.
• Energy Charge - A variable monthly charge for the total energy that is consumed. This charge typically includes on-
peak and off-peak rates, contracted minimums, alternative charges, ratchet demand penalties, or other special terms.
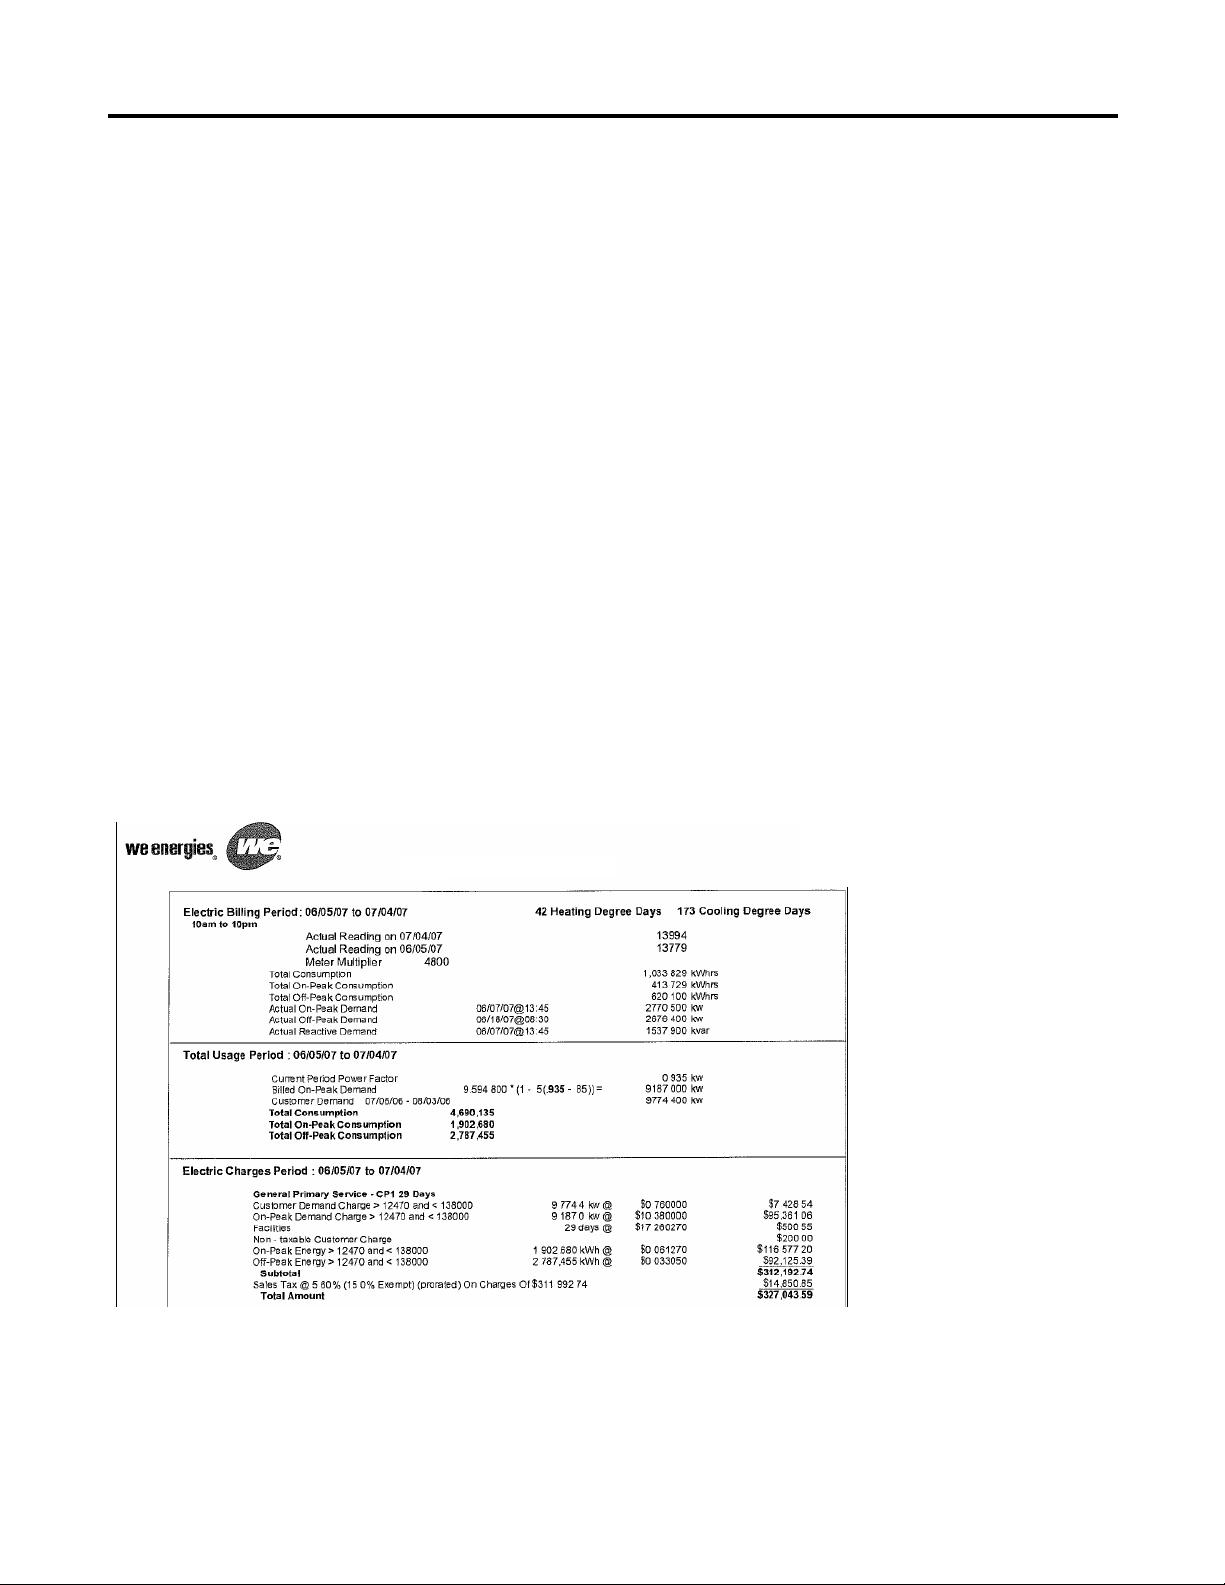
Here is an example of an electric bill and electric rate schedule. You can see that time-of-use and on-peak demand needs can
significantly increase your overall energy costs.
Sample Electric Bill
Rockwell Automation Publication IASIMP-QS016C-EN-P - October 2014 19
Page 20

Chapter 1 Energy Assessment and Monitoring Methods
Sample Rate Schedules
20 Rockwell Automation Publication IASIMP-QS016C-EN-P - October 2014
Page 21

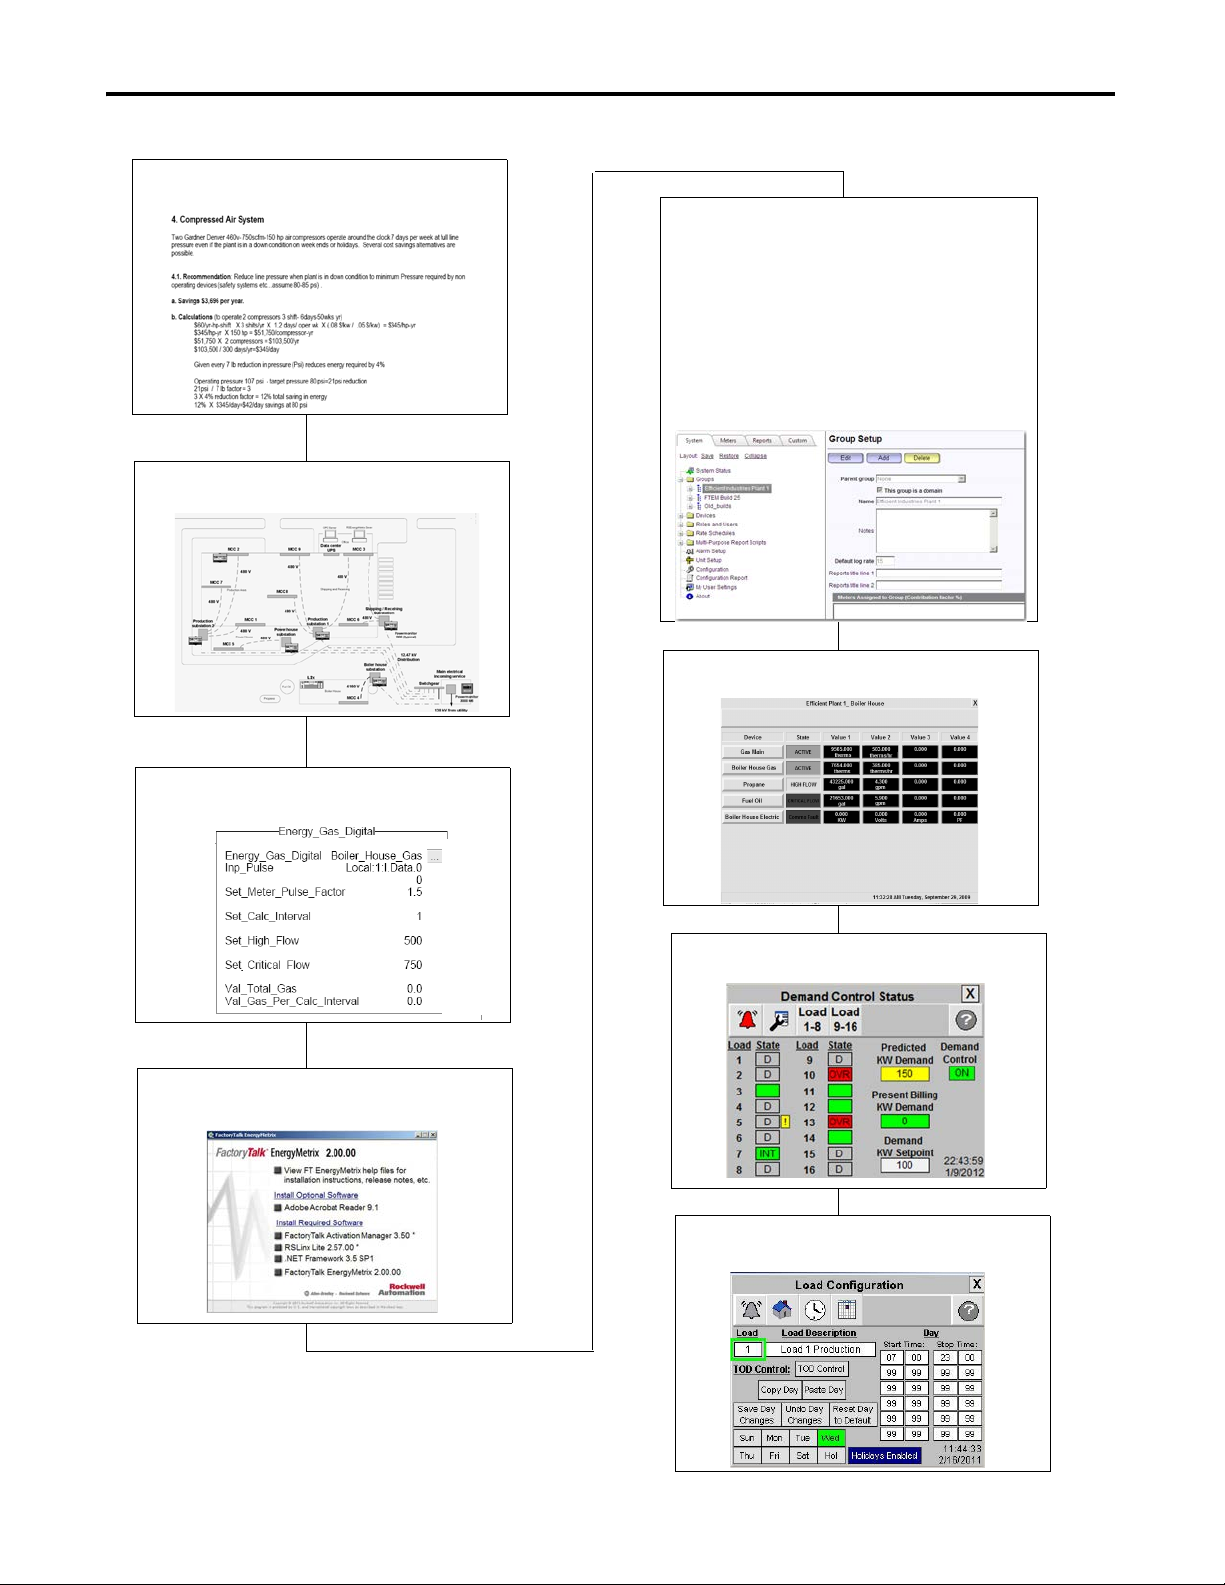
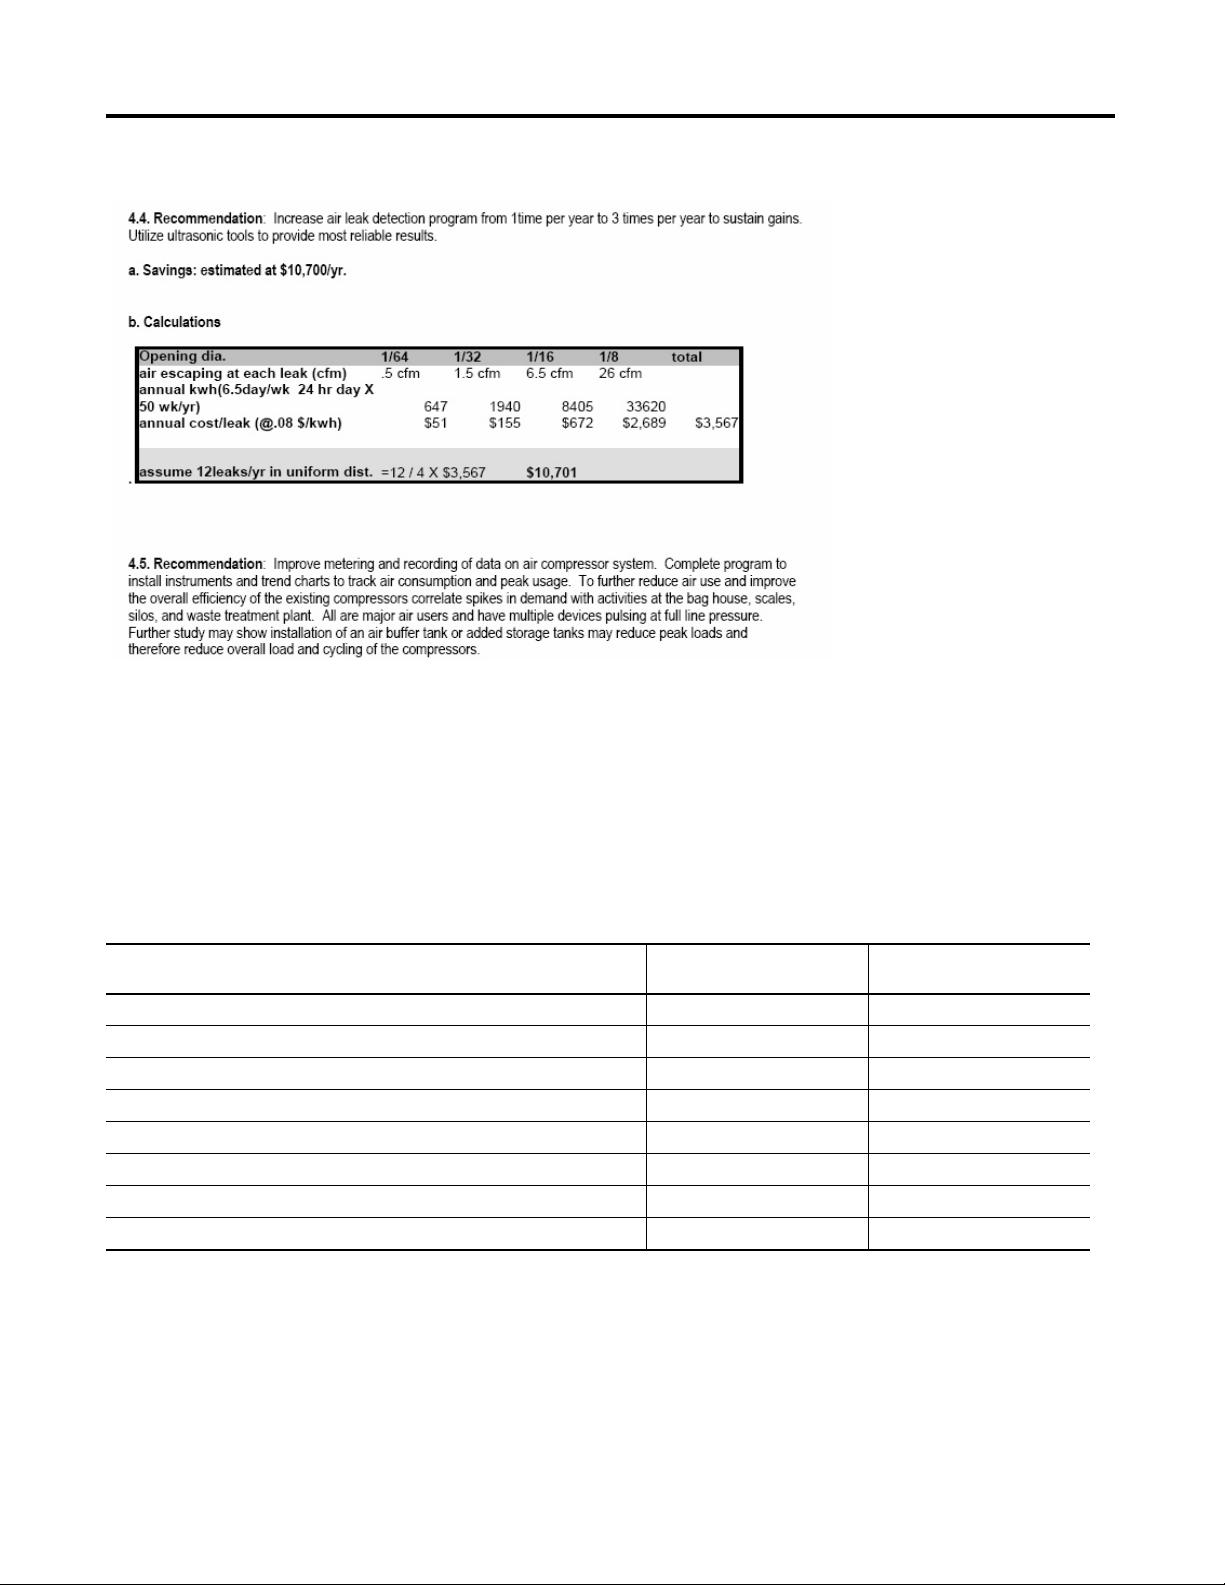
Sample Energy Assessment
Here is an example of a compressed air plant system assessment.
Sample Energy Assessment Document
Energy Assessment and Monitoring Methods Chapter 1
Rockwell Automation Publication IASIMP-QS016C-EN-P - October 2014 21
Page 22
Chapter 1 Energy Assessment and Monitoring Methods
How Rockwell Can Help
Rockwell Automation has a team of engineers that are experienced in conducting energy assessments for energy sources
including, but not limited to, electricity, gas, water, air, and steam.
To help you identify energy cost savings opportunities, Rockwell Automation can perform a general energy assessment that
will help you create a sustainable plan. If the scope of your needs is more extensive, a comprehensive assessment can be
performed to best fit your requirements.
Rockwell Automation Energy Assessment Options
Energy Assessment Option
Utility usage review • •
Energy saving project identification • •
Operations analysis of savings opportunities • •
Utility usage review •
Detailed energy usage analysis •
Rates and tariffs analysis •
Detailed quotations for sustainability projects •
Prioritization of projects •
(1) Request a 1400-AUD services quote from your local Rockwell Automation distributor or the Rockwell Automation custom support and maintenance team.
(2) Request 1400-ATT services quote from your local Rockwell Automation distributor or the Rockwell Automation custom support and maintenance team.
General
2 to 3 Days
(1)
Comprehensive
2 to 3 Weeks
(2)
To view a sample assessment, refer to the Energy and Utilities Site Assessment document in the Support Information
section on the Energy Management Accelerator Toolkit CD.
22 Rockwell Automation Publication IASIMP-QS016C-EN-P - October 2014
Page 23

Energy Assessment and Monitoring Methods Chapter 1
Business Case for Energy Monitoring
Energy monitoring makes energy usage data visible so that it is included in the planning and execution of a business strateg y
along with other management information. Because utility bills can be a significant portion of business expense, it is
important to understand how energy is used. Implementing a monitoring plan will help your business set goals for energy
reduction that will translate into cost savings.
Typical energy users evolve through a number of energy awareness phases.
Ignorance is Expensive
In the first phase, energy is not considered a significant expense or important management information. Operations uses
energy and accounts payable pays for it. Management begins to notice the higher costs and sets goals for energy reduction.
If operation managers are not aware of the energy cost of their operations, energy savings will not be captured.
Metering the Envelope
In the second phase, energy monitoring is installed on the plant main feeds. Electricity, natural gas, water, and other feeds
are recorded. The investment is relatively low. The monitoring system generates shadow bills to verify the utility billing.
Major users of energy are identified. The relationship between operating schedules and plant demand becomes clearer. A
few energy saving opportunities are identified and cost savings generated. However, monitoring only the entire plant has
limitations addressed in the next phase.
Submetering the Processes
In this phase, submeters are installed on process lines and utility equipment such as air, compressors, and boilers. This phase
requires a higher level of investment but provides a more detailed view of energy usage. Reports run daily or weekly provide
a direct line of sight to the impact of operations decisions. Energy use can be correlated with key production indicators to
identify peak producers and opportunities for improvement. Operations can be benchmarked within a plant or across an
enterprise. More cost-saving opportunities are identified. Historical data is used to accurately forecast energy use, providing
the basis for negotiating more favorable rates from energy providers. The same data is used in justifying capital projects to
improve efficiency and further reduce energy usage, cost, and waste. Energy accountability grows.
Controlling Energy Use and Demand
The volume and accuracy of energy use information gathered in the preceding phases is useful in determining the next
steps. Perhaps an automated demand control system would be effective in increasing energy efficiency and sustainability.
Opportunities for heat recovery and onsite generation may be identified. Potential trouble spots might be avoided that
would minimize unnecessary downtime.
Rockwell Automation Publication IASIMP-QS016C-EN-P - October 2014 23
Page 24
Chapter 1 Energy Assessment and Monitoring Methods
Monitoring Methods
Rockwell Automation power monitors and controllers collect data from your plant floor that can be used by
FactoryTalk EnergyMetrix software for monitoring and analysis.
FactoryTalk EnergyMetrix software provides monitoring and reporting tools to help you understand usage patterns,
optimize processes, and reduce utility costs in your organization. You can use these tools to monitor electrical loads,
consumption, power quality, analyze demand, and generate billing and cost allocation reports.
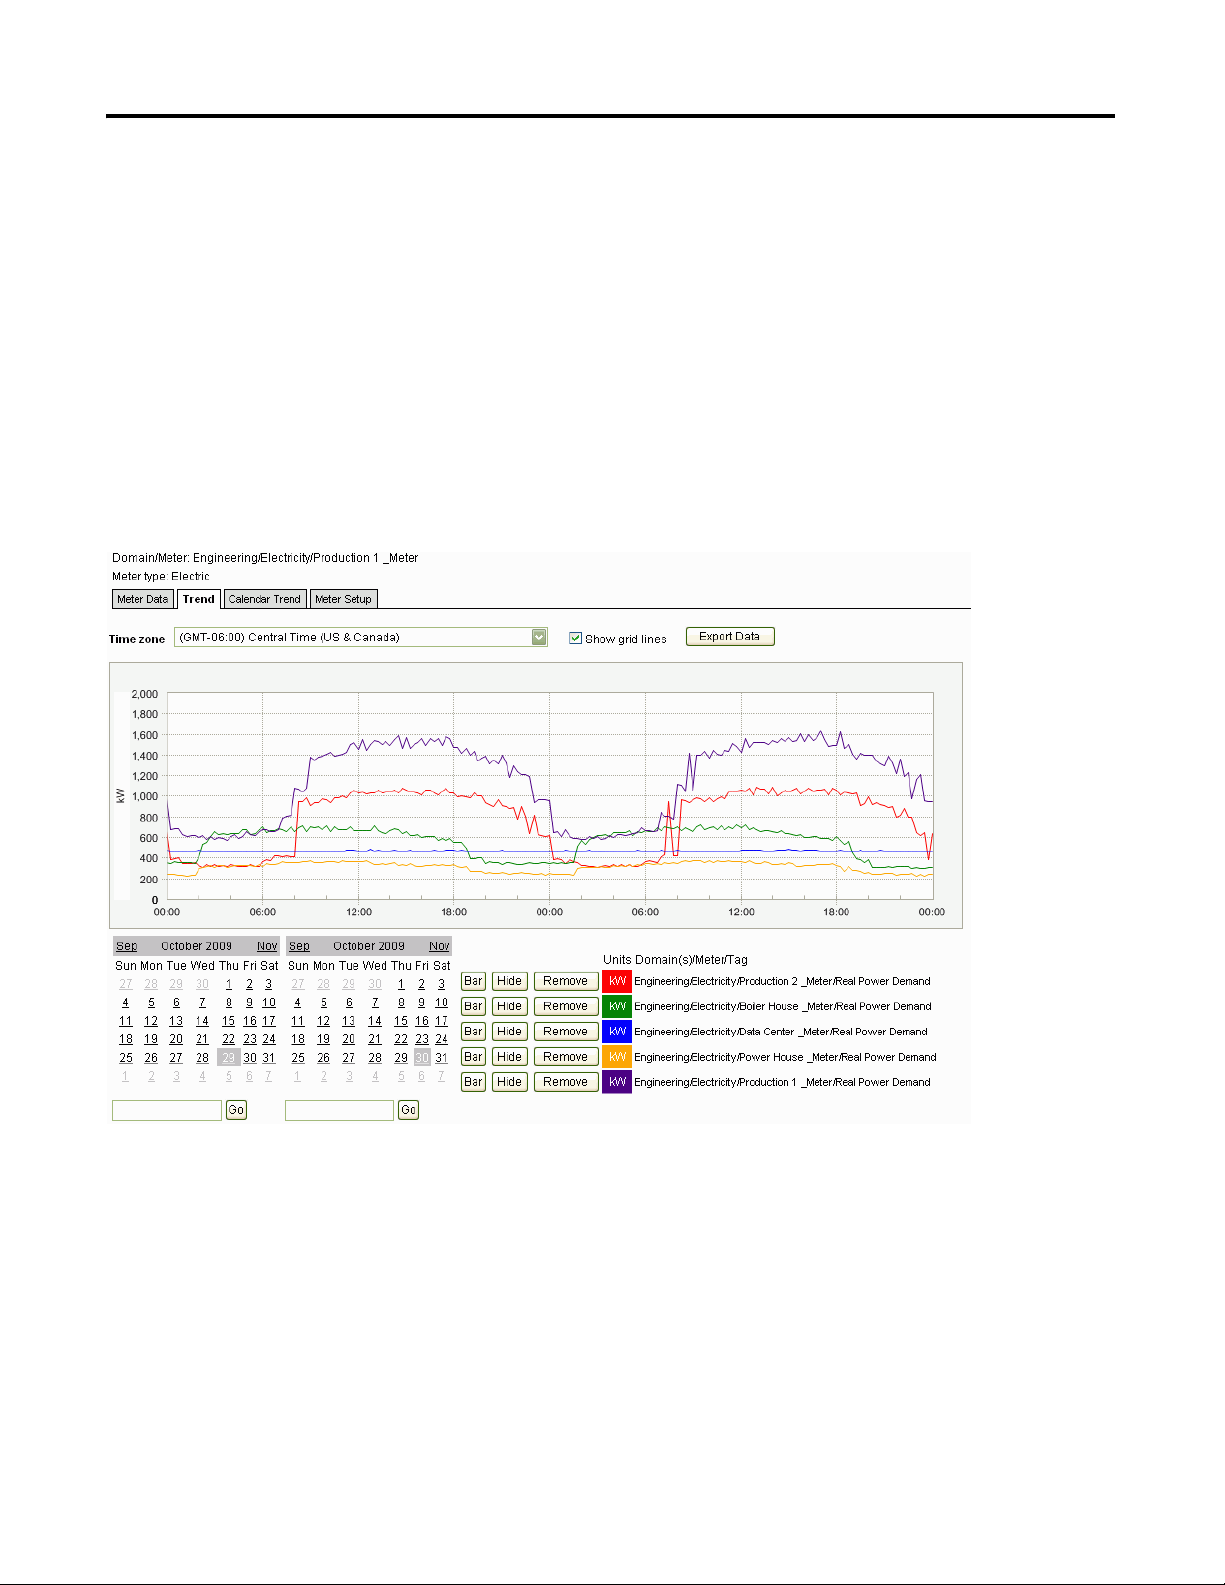
Load Profiling
Load profiling is a method where electrical loads are monitored or profiled. Load profiling helps to identify peak demands
so that you can reschedule loads accordingly to reduce energy costs.
24 Rockwell Automation Publication IASIMP-QS016C-EN-P - October 2014
Page 25
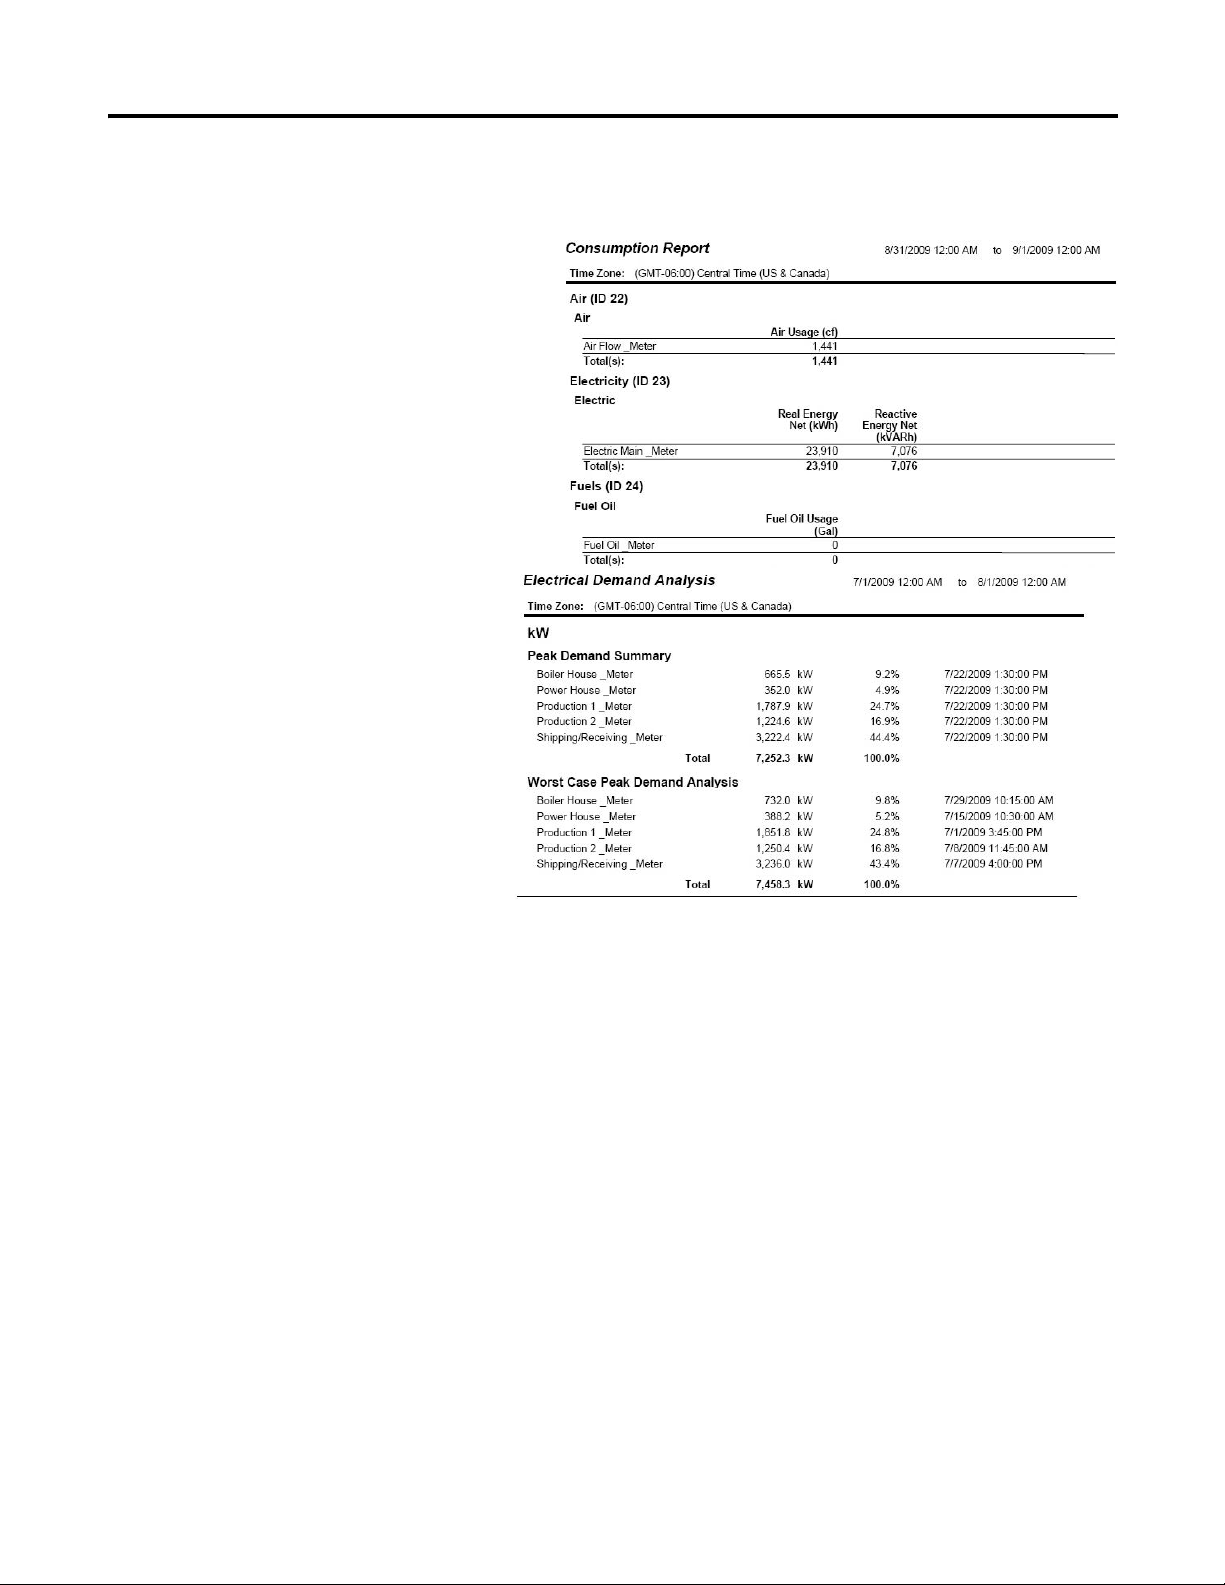
Consumption Reporting
Consumption reporting typically monitors periodic
utility usage, production, or other key performance
indicators, and assists with the early detection of
production/equipment problems such as leaks,
inefficiencies, and production problems.
Demand Analysis
Demand analysis monitors the electrical
demand of plant areas so that you can make
energy saving production scheduling or demand
control decisions.
Energy Assessment and Monitoring Methods Chapter 1
Rockwell Automation Publication IASIMP-QS016C-EN-P - October 2014 25
Page 26
Chapter 1 Energy Assessment and Monitoring Methods
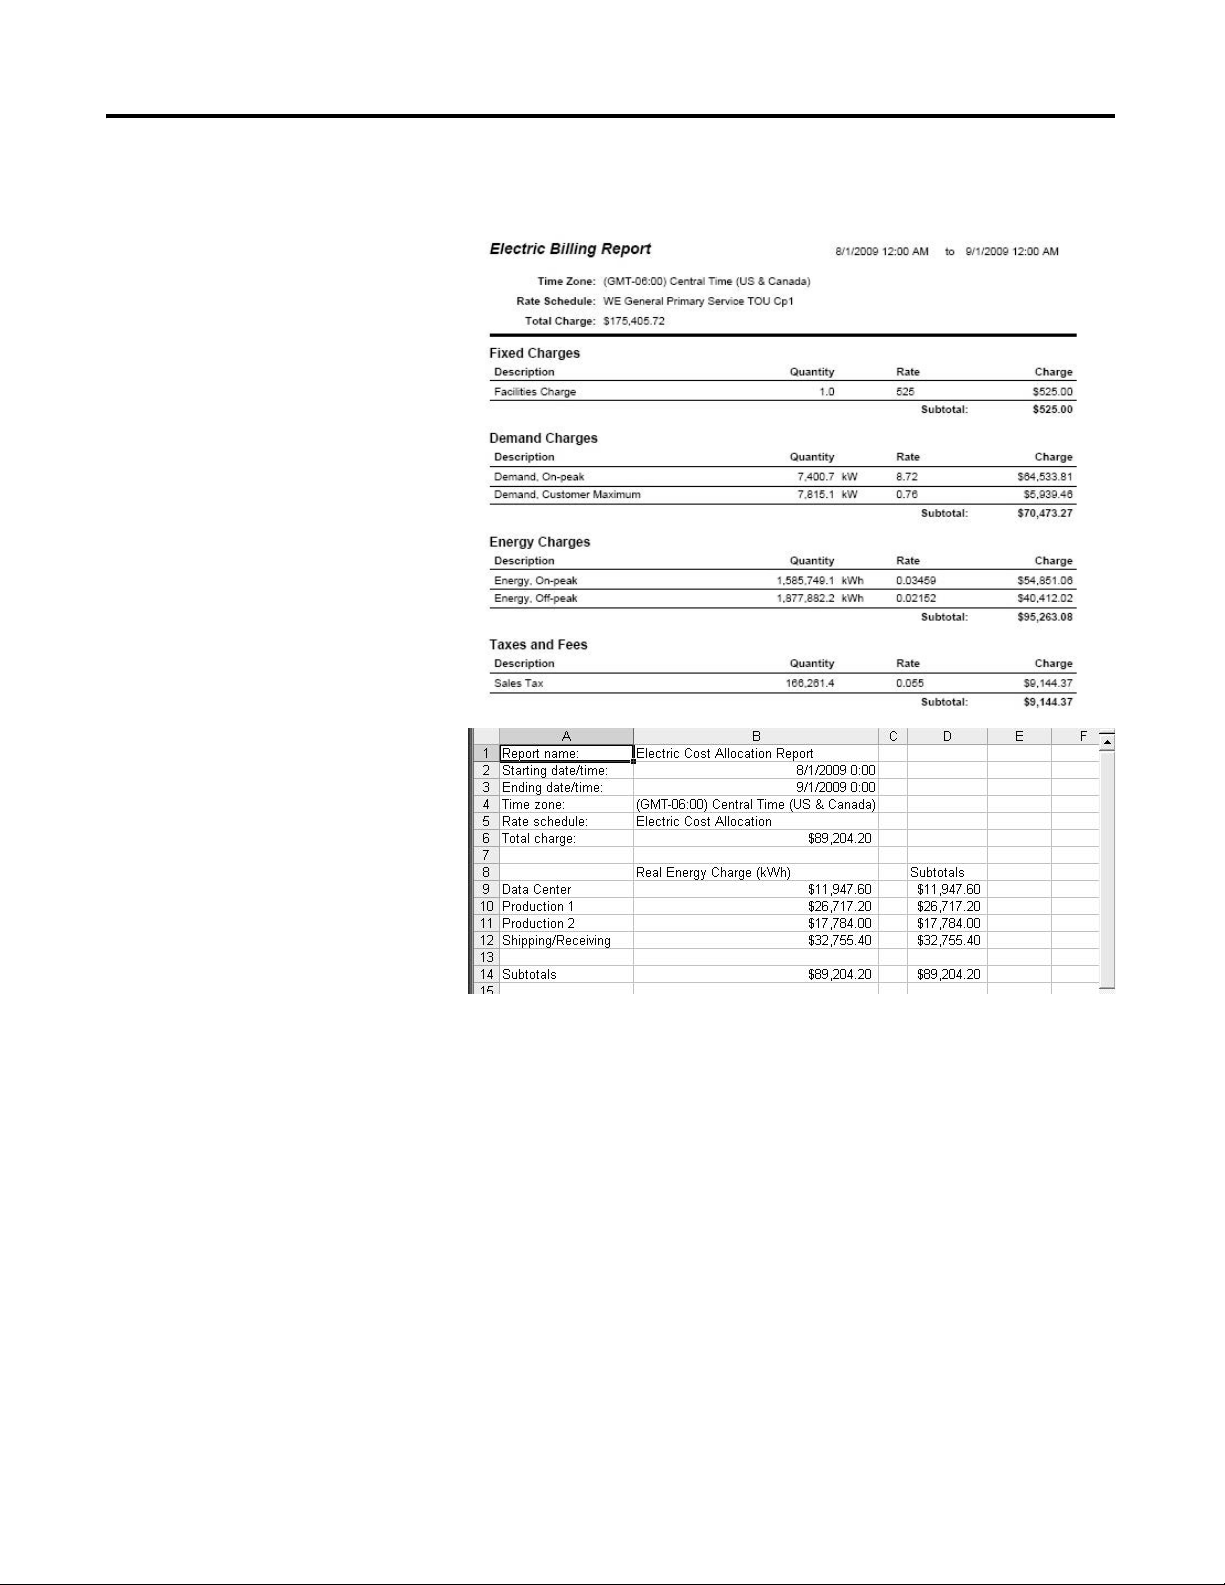
Shadow Billing
Shadow billing generates a replication of a
monthly bill from your energy provider
for comparative billing analysis and
potential energy cost recovery.
Cost Allocation
Cost allocation monitoring lets you
allocate energy costs based on actual usage
that is based on production area
submetering rather than other
measurements such as square footage
allocation. Effective cost allocation helps
drive energy accountabilities to the user.
26 Rockwell Automation Publication IASIMP-QS016C-EN-P - October 2014
Page 27
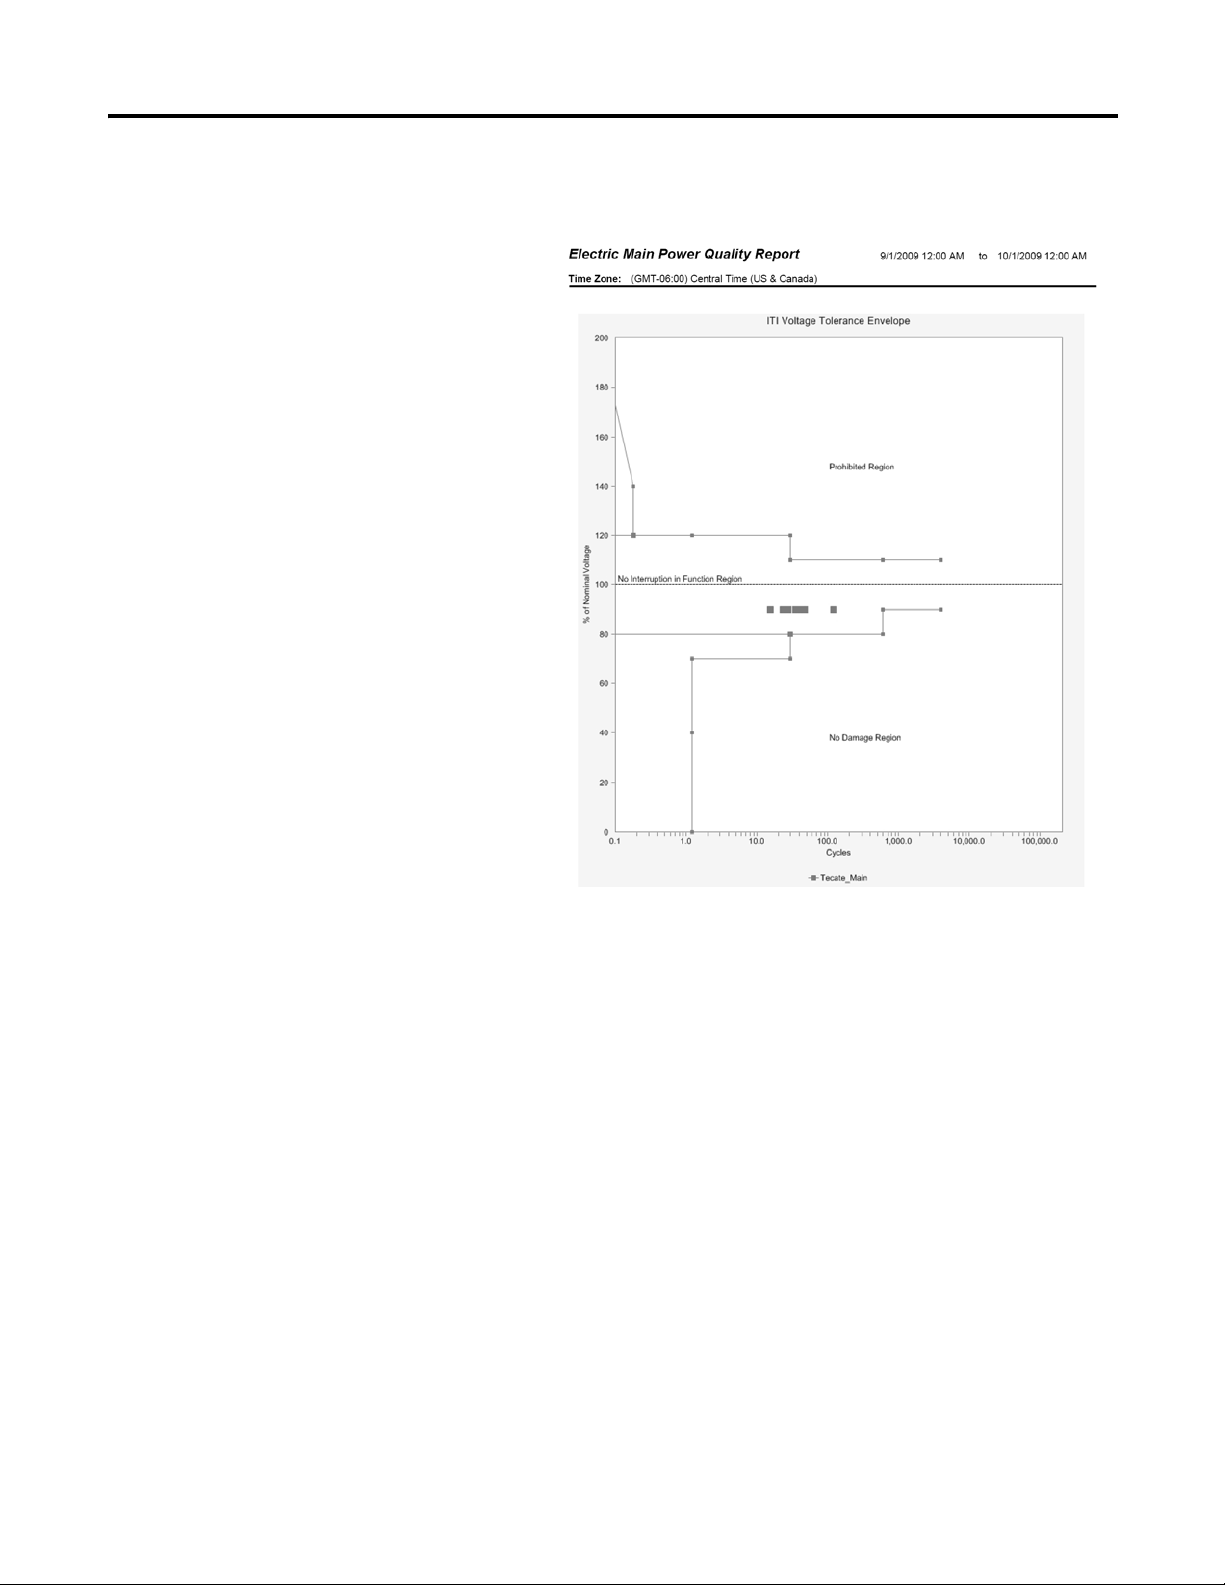
Power Quality
Power quality monitoring lets you capture power
quality events or conditions that could cause a
production shutdown like voltage sags, swells, and
brownouts.
Energy Assessment and Monitoring Methods Chapter 1
Rockwell Automation Publication IASIMP-QS016C-EN-P - October 2014 27
Page 28

Chapter 1 Energy Assessment and Monitoring Methods
Notes:
28 Rockwell Automation Publication IASIMP-QS016C-EN-P - October 2014
Page 29

Chapter
TIP
2
System Configuration and Wiring
Introduction
In this chapter, you will do the following:
• List energy data points based on your business goals and energy monitoring plan.
• Identify your existing energ y meters and distribution systems.
• Select data collection hardware and create a meter layout.
• Create panel layouts and wiring for your data collection hardware.
• Select required software.
To help you with system configuration, an industrial plant example, named Efficient Industries Plant 1, is referenced in this
and subsequent chapters.
Before You Begin
Complete an energy assessment and review monitoring methods in Chapter 1.
What You Need
• Personal computer with internet access for downloading software and files
• AutoCAD program to open the .dwg files or Adobe Acrobat Reader software to open.pdf files
Use AutoCAD Electrical to take advantage of advanced features.
• Energy Management Accelerator Toolkit CD, publication IASIMP-SP014, or visit the Integrated Architecture
Tools and Resources website at http://www.ab.com/go/iatools
• Power and Energ y Management section of the Industrial Controls catalog, available at http://www.ab.com/catalogs/
• Microsoft Excel software
to download toolkit files
Rockwell Automation Publication IASIMP-QS016C-EN-P - October 2014 29
Page 30

Chapter 2 System Configuration and Wiring
page 31
page 33
List Energy Data Points
Identify Existing Energy Distribution
Layouts and Metering
page 36
page 48
Create Metering Layout and Name Data
Collection Hardware
Create Energy Panel Layout and Wiring
Drawings
page 52
Select Monitoring Software
Follow These Steps
Follow this path to layout your energy panel and wiring, and select monitoring software.
30 Rockwell Automation Publication IASIMP-QS016C-EN-P - October 2014
Page 31

System Configuration and Wiring Chapter 2
List Energy Data Points
You will now review your business goals and energy monitoring plan, then enter your data points in the Energy Data
Wo r k s h e e t .
Review Business Goals and Energy Monitoring Plan
1. Review the business goals that you created in Chapter 1.
The Efficient Industries Plant 1 example, referenced throughout this quick start, is a midsized plant with two
production areas. These are the business goals of the example plant:
• Reduce electrical energy demand charges
• Improve electrical energy efficiency through power quality monitoring
• Reduce fuels and steam energy usage by running boilers in accordance with production demand schedules
• Reduce air compressor energy use
• Provide energy cost allocation to production areas, shipping and receiving, and the data center
2. Review your monitoring plan based on the initial energy assessment findings.
These are the monitoring goals of the Efficient Industries Plant 1 example:
• Monitor electrical main power quality
• Track electrical consumption of production 1, production 2, shipping/receiving, boiler house, and data center
• Monitor gas main, boiler house gas, fuel oil, and propane fuel usage
• Monitor steam, air, and water flow
Enter Energy Data Points in Energy Data Worksheet
Enter your energy data points in the Energy Data Worksheet. The procedure demonstrates how to enter data points using
the Efficient Industries Plant 1 example.
1. Browse to the System Layout and
Wiring folder on the Energy
Management Accelerator Toolkit
CD image.
Rockwell Automation Publication IASIMP-QS016C-EN-P - October 2014 31
Page 32

Chapter 2 System Configuration and Wiring
2. Right-click Energy Data Worksheet and open the file.
When opening the spreadsheet, select Enable Macros.
3. Click the Energ y Point tab in the worksheet and enter
an energy type and name for the first energy data
point in your system.
a. Select a cell in the Energy Type column and click
the pull-down list icon.
b. Choose an Energy Type.
For the Efficient Energy Plant 1 example, choose
Electricity.
c. Select a cell in the Name column and enter a name
for the energy data point.
For the Efficient Energy Plant 1 example, Electric
Main is entered as the first Electricity data point.
4. Repeat step 3 for each data point with the same energy
type selected in step 2.
For the Efficient Energy Plant 1 example, the
Electricity energy point listing should look like this.
5. Repeat steps 3 and 4 for the remaining energy types in
your system.
For the Efficient Energy Plant 1 example, the
completed energy point listing should look like this.
32 Rockwell Automation Publication IASIMP-QS016C-EN-P - October 2014
Page 33

System Configuration and Wiring Chapter 2
Identify Existing Energy Distribution Layouts and Metering
Follow these steps to help identify your existing energy distribution and metering systems.
1. Gather existing electrical distribution single line drawings and label electricity data point substations and
distribution points.
Efficient Industries Plant 1 Example - Electrical Single Line Drawing Example
Rockwell Automation Publication IASIMP-QS016C-EN-P - October 2014 33
Page 34

Chapter 2 System Configuration and Wiring
2. Gather or create the electrical distribution plant layout.
Efficient Industries Plant 1 Example- Electrical Distribution Layout
34 Rockwell Automation Publication IASIMP-QS016C-EN-P - October 2014
Page 35

3. Gather or create other energy distribution plant layouts.
Efficient Industries Plant 1 Example - Other Energy Distribution Plant Layouts
System Configuration and Wiring Chapter 2
Rockwell Automation Publication IASIMP-QS016C-EN-P - October 2014 35
Page 36

Chapter 2 System Configuration and Wiring
Create Metering Layout and Name Data Collection Hardware
In this section, you will create a metering layout, then select and name your data collection hardware using the Energy Data
Worksheet. The information entered in the worksheet will be used later in the FactoryTalk EnergyMetrix software
configuration chapters.
Create a Metering Layout and Select Data Collection Device Classes
Follow these steps to create a metering layout of your energy data collection devices.
1. Add PowerMonitors to your Electrical Distribution Layout drawing based on the electricity energy data points listed
in the Energ y Data Worksheet.
For the Efficient Industries Plant 1 example, these devices are added to the drawing:
• One PowerMonitor 3000 for the Electric Main to monitor power quality
• Five PowerMonitor 1000 devices to monitor electric consumption and demand for various plant departments, as
listed in the Energy Data Worksheet
36 Rockwell Automation Publication IASIMP-QS016C-EN-P - October 2014
Page 37

System Configuration and Wiring Chapter 2
2. Browse to the System Layout and Wiring folder on your Energy
Management Accelerator Toolkit CD image and open the Energy Data
Wo r k s h e e t .
3. Click the FactoryTalk EnergyMetrix tab and select a Device Class for each PowerMonitor added to the layout.
The device classes will be used in later chapters when configuring devices in FactoryTalk EnergyMetrix software and
also determine the energy meter tag names.
a. Select a cell in the Device Class column
and click the pull-down list icon.
b. Choose the appropriate PowerMonitor
device class for each data point based on
the Device Class Selection table.
Device Class Selection
Device Class Energy Data Point Metering Requirements
PowerMonitor 1000 on EtherNet/IP Select this device class for:
PowerMonitor 3000 on EtherNet/IP Select this device class for:
PowerMonitor W250 Select this device class for:
PowerMonitor 500 on Serial Select this device class for:
PowerMonitor 500 on EtherNet/IP Select this device class for:
PowerMonitor 5000 on Ethernet/IP Select this device class for:
• electricity data points requiring only consumption and demand monitoring.
• other energy data points in close proximity to a PowerMonitor 1000 device that can
provide a digital contact output, for example, an existing utility meter with a pulse
contact output.
A maximum of two energy status inputs are provided on the PowerMonitor 1000 device.
• electricity data points requiring consumption, demand, and power quality monitoring.
• other energy data points in close proximity to a PowerMonitor 3000 device that can
provide a digital contact output, for example, an existing utility meter with a pulse
contact output.
A maximum of two energy status inputs are provided on the PowerMonitor 3000 device.
electricity data points requiring consumption monitoring in a wireless communication
network
electricity data points requiring consumption monitoring
• electricity data points requiring consumption monitoring
• can also be used for demand monitoring
• electricity data points requiring consumption, demand, and power quality monitoring.
• other energy data points in close proximity to a PowerMonitor 5000 device that can
provide a digital contact output, for example, an existing utility meter with a pulse
contact output.
A maximum of four energy status inputs are provided on the PowerMonitor 5000 device.
Rockwell Automation Publication IASIMP-QS016C-EN-P - October 2014 37
Page 38

Chapter 2 System Configuration and Wiring
For the Efficient Industries Plant 1 example, the electricity energy data point listing would look like this.
4. Identify other digital energy data points in close proximity that you can connect to the status inputs of the
PowerMonitors.
For the Efficient Industries Plant 1 example, the air flow digital pulse meter is near the Production 2 electrical
substation so it can connect to the PowerMonitor 1000 named Production 2.
5. Select a Device Class and Meter Type on the FactoryTalk EnergyMetrix tab of the Energy Data Worksheet for the
PowerMonitor status inputs identified in step 4.
a. Select the appropriate PowerMonitor Device Class.
b. Select PM Status Input for the Meter Type.
For the Efficient Industries Plant 1 example, the entries for the air flow data point would look like this.
38 Rockwell Automation Publication IASIMP-QS016C-EN-P - October 2014
Page 39

System Configuration and Wiring Chapter 2
6. Identify other small groups (<3) of digital energy points in close proximity that can be collected by the digital status
inputs of the PowerMonitor 1000 device.
This is a lower cost alternative to a CompactLogix™ controller with a few digital inputs.
For the Efficient Industries Plant 1 example, the gas main and water main digital meters are somewhat isolated in the
corner of the production area near MCC 2. A PowerMonitor 1000 named MCC 2 is added to capture these two
digital meter inputs.
7. Select a Device Class and Meter Type on the FactoryTalk EnergyMetrix tab of the Energy Data Worksheet for the
PowerMonitor status inputs identified in step 6.
a. Select a PowerMonitor 1000 Device Class.
b. Select PM Status Input for the Meter Type.
For the Efficient Industries Plant 1 example, the entries for the gas main and water main data points would look like
this.
8. Identify other larger groups of digital and analog energy data points in close proximity that can connect to an L23
CompactLogix controller data collection device.
Rockwell Automation Publication IASIMP-QS016C-EN-P - October 2014 39
Page 40

Chapter 2 System Configuration and Wiring
The L23 CompactLogix controller can collect up to 16 digital inputs and 4 analog inputs.
For the Efficient Industries Plant 1 example, the remaining digital and analog energy data points are in the Boiler
House so a CompactLogix controller is added to the metering layout.
9. Select a Device Class and Meter Type on the FactoryTalk EnergyMetrix tab of the Energy Data Worksheet for the
digital and analog energ y inputs identified in step 8.
a. Select ControlLogix
on Ethernet for the Device Class.
b. Select L2x Input for the Meter Type.
For the Efficient Industries Plant 1 example, the entries for the CompactLogix digital and analog energy data points
would look like this.
10. Identify and list any energy data points to be collected from an OPC server.
For the Efficient Industries Plant 1 example, Data Center energy consumption will be collected by an OPC server in
the office area. The personal computer for the FactoryTalk EnergyMetrix server is also in this location. All energy
data collection devices and the FactoryTalk EnergyMetrix server are connected to an EtherNet/IP network.
40 Rockwell Automation Publication IASIMP-QS016C-EN-P - October 2014
Page 41

System Configuration and Wiring Chapter 2
11. Select a Device Class and Meter Type on the FactoryTalk EnergyMetrix tab of the Energy Data Worksheet for the
OPC server data point identified in step 10.
a. Select OPC Server on Ethernet for the Device Class.
b. Select OPC for the Meter Type.
For the Efficient Industries Plant 1 example, the entry for the OPC server data point would look like this.
Rockwell Automation Publication IASIMP-QS016C-EN-P - October 2014 41
Page 42

Chapter 2 System Configuration and Wiring
Select Data Collection Hardware
Follow these steps to select your data collection hardware.
1. Browse to the System Layout and Wiring folder on the Energy
Management Accelerator Toolkit CD image and open the Energy Data
Wo r k s h e e t .
2. Click the FactoryTalk EnergyMetrix tab then choose or enter energy device
catalog numbers.
a. Select a cell in the Cat. No. column and click the pull-down list icon.
b. Choose the appropriate Cat. No. for each data point based on the PowerMonitor and CompactLogix Device
Selection table.
To use a nonstandard energy device, select the blank at the bottom of the list and enter the catalog number.
Device Cat. No. Description Communication
1408-EM1A-ENT Provides kWh data, energy log, and status log only.
PowerMonitor 1000 on Ethernet
PowerMonitor 3000 on Ethernet
PowerMonitor W250 1425-D1002-MOD PowerMonitor Wireless,100A,300V Delta Serial or Ethernet (using
1408-EM2A-ENT Provides kWh, kVARh, kVAHh data, demand and
1408-EM3A-ENT
1404-M505x-ENT
1404-M605x-ENT
1404-M805x-ENT
1425-D1002-MOD-480 PowerMonitor Wireless,100A,480V Delta
1425-W1003-MOD PowerMonitor Wireless,100A,300V Wye
1425-D2002-MOD PowerMonitor Wireless,200A,300V Delta
1425-W2003-MOD PowerMonitor Wireless, 200A,300V Wye
1425-D5002-MOD PowerMonitor Wireless, 500A, 300V Delta
1425-D5002-MOD-480 PowerMonitor Wireless, 500A, 480V Delta
1425-W5003-MOD PowerMonitor Wireless, 500A, 300V Wye
1425-D10002-MOD PowerMonitor Wireless, 1000A, 300V Delta
1425-W10003-MOD PowerMonitor Wireless, 1000A, 300V Wye
1425-D20002-MOD PowerMonitor Wireless, 2000A, 300V Delta
1425-D20002-MOD-480 PowerMonitor Wireless, 2000A, 480V Delta
1425-W20003-MOD PowerMonitor Wireless, 2000A, 300V Wye
(2)
projected demand values plus energy min/max, load
factor, and status log.
Provides same parameters as catalog number 1408EM2A-ENT plus separate voltage, current, frequency,
and power factor parameters.
(3)
Provides full consumption and demand value
parameters, ten configurable setpoints, %THD, and
K-factor harmonic analysis.
(2)(3)
Provides same parameters as catalog number 1404M505x-ENT plus waveform capture capability, and
41st order harmonic analysis.
(3)
Provides same parameters as catalog number 1404M605x-ENT plus transient detection and capture,
and 63rd order harmonic analysis.
Ethernet
Ethernet
a serial to Ethernet
gateway).
42 Rockwell Automation Publication IASIMP-QS016C-EN-P - October 2014
Page 43

System Configuration and Wiring Chapter 2
Device Cat. No. Description Communication
PowerMonitor 500
(1)
1420-Vy Power Meter Indicator No Comm
1420-VyP Power Meter - Pulse (digital) Output
1420-VyA Power Meter - Analog Output
1420-Vy-ENT EtherNet/IP Power Meter Ethernet
1420-VyP-ENT EtherNet/IP Power Meter - Pulse (digital) Output
1420-VyA-ENT EtherNet/IP Power Meter - Analog Output
1420-Vy-485 Serial Power Meter Serial
1420-VyP-485 Serial Power Meter - Pulse (digital) Output
1420-VyA-485 Serial Power Meter - Analog Output
PowerMonitor 5000 1426-M5E Power Quality Meter Ethernet
1426-M5E-ENT Power Quality Meter with 2nd Ethernet Port
1426-M5E-CNT Power Quality Meter with ControlNet Port
1426-M5E-DNET Power Quality Meter with DeviceNet Port
1769-L23E-QB1B Provides 16 DC inputs/16 DC outputs
CompactLogix L23 Controllers
1769-L23E-QBFC1B Provides 16 DC inputs/16 DC outputs plus:
4 analog inputs
Ethernet
2 analog outputs
4 high speed counters
(1) The y in the catalog number designates device voltage, where 1 = 240V ACV-LL120V ACV-LN/208V ACV-LL and 2 = 400V ACV-LN and 690V ACV-LL.
(2) Preferred devices for use with this toolkit.
(3) The x in the catalog number designates device power, where A=120/240 VAC and B= 24 VDC.
For the Efficient Industries Plant 1 example, the catalog numbers for the data collection devices would look like this.
Rockwell Automation Publication IASIMP-QS016C-EN-P - October 2014 43
Page 44

Chapter 2 System Configuration and Wiring
TIP
Name Data Collection Hardware
Follow these steps to create or select device names, meter types, and meter tag names for each energy data point. These
names will be used later in the FactoryTalk EnergyMetrix software configuration chapters.
1. Click the FactoryTalk EnergyMetrix tab on the Energy Data Worksheet.
2. Enter a device name for each energy data point.
It is recommended that you name the device with the same name as the energy data point when possible. If a device
collects multiple energy data points, use a name related to the most significant data point or unique location.
For the Efficient Industries Plant 1 example, the device names for the first six PowerMonitor devices and the data
center are the same as the energy data point names.
For the Efficient Industries Plant 1 example, the PowerMonitor 1000 device named MCC 2 collects two energy data
points, the Gas Main and the Water Main. The CompactLogix device collecting one digital and three analog inputs
is named L2x.
44 Rockwell Automation Publication IASIMP-QS016C-EN-P - October 2014
Page 45

System Configuration and Wiring Chapter 2
3. Review meter names.
The meter names are autopopulated in the worksheet based on energy data point names.
4. Choose Electric as the Meter Type for all the PowerMonitor devices.
5. Select or enter meter tag names for each data point based on the Energy Type and Meter Type shown in the table.
Energy Type Meter Type Meter Tag Names
Electric
Electricity
PM Status Input
L2x Input
OPC
Natural Gas PM Status Input
L2x Input
OPC
Fuel Oil PM Status Input
L2x Input
OPC
Propane PM Status Input
L2x Input
OPC
Steam PM Status Input
L2x Input
OPC
Air PM Status Input
L2x Input
OPC
Water PM Status Input
L2x Input
OPC
Real Energy Net
Reactive Energy Net
Reactive Power Demand
Real Energy Net
Natural Gas Usage
Fuel Oil Usage
Propane Usage
Propane Usage
Air Usage
Water Usage
(1)
(1)
(1)
(1)
(1)
(1)
(1)
(1) If there is only one energy data point of a particular energy type then select the meter tag name listed in the
table. If there is more than one energy data point with the same energy type then select a blank meter name
and type [EnergyDataPointName] [EnergyType] Usage, for example, Boiler House Natural Gas Usage.
Rockwell Automation Publication IASIMP-QS016C-EN-P - October 2014 45
Page 46

Chapter 2 System Configuration and Wiring
For the Efficient Industries Plant 1 example, the meter type and meter tag name listing would look like this.
Assign CompactLogix Input Addresses
Follow these steps to assign CompactLogix hardware input addresses and corresponding PLC-5 mapped tags to the
energy data points.
1. Click the CompactLogix tab on the Energy Data Worksheet.
2. Enter an L2x address for each energy data point that is connected to a CompactLogix controller.
a. Select a cell in the L2x column and click the pull-down list icon.
b. Choose the L2x digital hardware address to which the energy data point is wired.
Digital Input addresses are Local:1:I.Data.0 through Local:1:I.Data.15.
Analog Input addresses are Local:3:I.CH0 through Local:3:I.CH3.
46 Rockwell Automation Publication IASIMP-QS016C-EN-P - October 2014
Page 47

System Configuration and Wiring Chapter 2
TIP
3. Select the corresponding PLC-5 mapped address for the energy data point.
a. Select a cell in the PLC-5 Address column and click the pull-down list icon.
b. Choose a PLC-5 File 10 address to which the energy data point will be mapped for communicating with
FactoryTalk Energ yMetrix software.
It is recommended that you assign consecutive PLC-5 addresses in a single file to simplify mapping.
Refer to page 86
for details on mapped PLC-5 addresses.
For the Efficient Industries Plant 1 example, the Compactlogix and PLC-5 address assignments would look similar
to this.
Rockwell Automation Publication IASIMP-QS016C-EN-P - October 2014 47
Page 48

Chapter 2 System Configuration and Wiring
Create Energy Panel Layout and Wiring Drawings
The toolkit provides energy data collector panel layout and wiring drawings in DWG, DXF, and PDF file formats to help
you plan the layout of your energy system. The files are organized by device (CompactLogix, PM1000, PM3000,
PMW250, PM500, and PM5000). The drawings include power and control wiring.
If you do not have CAD software, use the pdf files to build your system drawings.
Use CAD Drawings from Toolkit
Follow these steps to access the AutoCAD drawings for each device in your Energy Data Worksheet.
1. Browse to and open the System
Layout and Wiring folder on the
Energy Management Accelerator
To ol ki t C D i ma g e.
2. Navigate to the desired files based
on your device and file format
(DXF, DWG, or PDF).
3. Add the required files to your project or copy them to your project folder.
The drawings were created using AutoCAD Electrical. The project files are included in the DWG folder. The path
references in the project file are the default AutoCAD Electrical installation path.
48 Rockwell Automation Publication IASIMP-QS016C-EN-P - October 2014
Page 49

System Configuration and Wiring Chapter 2
Panel Layout Drawings
The AutoCAD Electrical project includes several panel-layout drawings for the PowerMonitor 1000, PowerMonitor 3000,
and CompactLogix data collector devices. Choose an appropriate drawing as a starting point. Add or remove components
as needed.
This example shows an energy panel layout with a PowerMonitor 3000 device.
Sample PowerMonitor 3000 Layout
Sample Bill of Material
Rockwell Automation Publication IASIMP-QS016C-EN-P - October 2014 49
Page 50

Chapter 2 System Configuration and Wiring
Wiring Drawings
The AutoCAD electrical project includes a variety of electrical power wiring configurations for PowerMonitor 1000 and
PowerMonitor 3000 devices plus power and control wiring drawings for the CompactLogix L23E controller.
This drawing shows PowerMonitor 3000 device wiring for a 480V, 4-wire WYE direct system.
PowerMonitor 3000 Device Wiring
50 Rockwell Automation Publication IASIMP-QS016C-EN-P - October 2014
Page 51

Access Other Allen-Bradley CAD Drawings
TIP
Follow these steps to download other Allen-Bradley® product CAD drawings.
System Configuration and Wiring Chapter 2
1. Open your browser and go to http://ab.com/e-tools
The Configuration and Selection Tools webpage opens.
If you know the complete catalog number of your Allen-Bradley product, you can enter it here and click Submit.
However, you need a complete catalog number string to get the configuration results.
.
2. If you don’t know the complete catalog number,
click product directory to browse the configured
Rockwell Automation products.
3. Click Rockwell Automation and follow the
prompts.
Rockwell Automation Publication IASIMP-QS016C-EN-P - October 2014 51
Page 52

Chapter 2 System Configuration and Wiring
IMPORTANT
Select Monitoring Software
Use these tables to select the FactoryTalk EnergyMetrix software appropriate for your application requirements. Every
FactoryTalk EnergyMetrix system must include a Manager license of 8, 64, or 1000 meters.
License Options
FactoryTalk EnergyMetrix software is a scalable, modular software application. Its components and capabilities are
determined by the licenses purchased and installed by the user. Licenses are installed by means of FactoryTalk Activation.
The table below shows the component type and, if applicable, the number of meters supported. There is no limit on the
number of users. It is the customer's responsibility to observe the requirements of software licenses.
The Manager license is required for use of the software, and includes 10 meters which can be any combination of RSLinx
software and 3rd-party OPC meters. Additional meter licenses can be purchased in 10-, 50, 100- and 500- meter sets. The
FTEMOPC 3rd-party OPC option enables 3rd-party OPC connectivity to all licensed meters.
If you are upgrading from an existing installation of FactoryTalk EnergyMetrix software, your existing licenses are
supported, including existing meter counts.
FactoryTalk EnergyMetrix software only supports FactoryTalk Activation. If you plan to upgrade from an installation of
FactoryTalk EnergyMetrix that uses EVRSI Master Disk activation, please contact Rockwell Automation customer service
to convert to FT Activation.
Component Type Maximum Meter Count
FTEM Manager, includes 10 RSLinx or OPC meters 10
FTEM10 10-meter option, RSLinx 10
FTEM50 50-meter option, RSLinx 50
FTEM100 100-meter option, RSLinx 100
FTEM500 500-meter option, RSLinx 500
FTEMOPC 3rd-party OPC client for all licensed meters N/A
FTEMRT Real Time option N/A
FTEMRPT ReportsPlus option N/A
FTEMCHT ChartsPlus option N/A
Microsoft SQL Server bundle - 1 client license option N/A
Microsoft SQL Server bundle - processor license option N/A
Contact your Rockwell Automation representative for information on the meter and option packages listed above.
52 Rockwell Automation Publication IASIMP-QS016C-EN-P - October 2014
Page 53

System Configuration and Wiring Chapter 2
Server Requirements
We recommend, but do not require, that you install FactoryTalk EnergyMetrix software on a dedicated server with a local
installation of Microsoft SQL Server.
Server Software Requirements for Installing FactoryTalk EnergyMetrix Software
• Windows 2003 Server or Windows 2008 Server, Application Server role. For 64-bit operating systems, RSLinx
Classic software version 2.57 CPR9 SR3 or later must be installed. Windows 2000 Server is not supported.
• Microsoft SQL Server 2005 or 2008, installed with mixed-mode authentication (Windows and SQL). TCP/IP
access must be enabled. A system administrator SQL login must be used for the FactoryTalk EnergyMetrix
installation.
• You must have machine administrator privileges to install FactoryTalk EnergyMetrix software.
Hardware Requirements
These are the hardware requirements that you need to use FactoryTalk EnergyMetrix software.
Definitions
The following rules of thumb are offered as a starting point for determining server sizing for FactoryTalk EnergyMetrix.
Other factors will affect the required size of a ser ver. A higher number of tags being logged, a faster log rate, a larger number
of users, and a larger number of reports being run will require a more powerful server than the guidelines specify. These are
the server guidelines:
• A low-end server has up to 8 meters and logs up to 40 meter tags at a minimum 15 minute log rate.
• A mid-range server has up to 64 meters and logs up to 320 meter tags at a minimum 15 minute log rate.
• A high-end server has more than 64 meters and logs more than 500 meter tags at a minimum 15 minute log rate.
Database Size Guidelines
FactoryTalk EnergyMetrix writes 16 bytes of data to the database for each meter tag logged. Over time, the database can
grow to become quite large. Some examples include the following:
• A low-end server, logging 40 meter tags at 15 minute intervals, will grow the database at a rate of 2.56 KB per hour or
22 MB per year.
• A mid-level server, logging 320 meter tags at 15 minute intervals, will grow the database at a rate of 20.5 KB per hour,
or 180 MB per year.
• A high-end server, logging 1000 meter tags at 15 minute intervals, will grow the database at a rate of 240 KB per
hour, or 2.1 GB per year.
Consider these guidelines when determining hard disk requirements for a server as well as database maintenance schedules.
Rockwell Automation Publication IASIMP-QS016C-EN-P - October 2014 53
Page 54

Chapter 2 System Configuration and Wiring
TIP
Recommendations
These are general guidelines. FactoryTalk EnergyMetrix software is capable of running on a variety of hardware platforms.
The main scalability issue is related to processing of logged data (for example, report generation, trending). CPU speed,
number of CPUs, RAM, and RAID 5 for the database files are the main scalability factors (in that order). All hardware
platforms require the following:
• Processor, RAM and hard drive as noted below
• DVD drive
• One or more Ethernet network ports
• Internet access
• Monitor, keyboard, pointing device (mouse)
• Low-end Server
– Single 2 GHz Pentium 4
– 1…2 GB RAM
– 80 GB hard disk
• Mid-range Server
– 2 or 4 CPU 2 GHz Pentium 4 or better
– 2…4 GB RAM
– 160 GB hard disk (with separate disks for operating system and log files and RAID 5 for main database files
preferred)
• High-end Server
– High-end server requirements are very dependent upon the user's application requirements. Please contact
Rockwell Automation for assistance in specifying hardware for a high-end server.
Client Requirements
The following are the client requirements for compatibility with FactoryTalk EnergyMetrix software:
• Microsoft Windows XP Professional, Vista Professional, Windows 7 (Windows 2000 is not supported) operating
system.
• Internet Explorer 7, 8, or 9 web browser.
• Adobe Acrobat Reader 7.0 software or later is required to view reports.
• Microsoft .NET Framework 3.5 SP1 is required to use RT and Charts Plus options. .NET Framework 3.5 SP1 is
included on the installation DVD or can be downloaded at no charge from Microsoft.
Your client workstation must also be permitted Intranet, Internet or dial-in access to the FactoryTalk EnergyMetrix server.
Contact your IT support personnel for assistance.
Your browser should be set to check for newer versions of stored pages
automatically, not every visit to the page.
54 Rockwell Automation Publication IASIMP-QS016C-EN-P - October 2014
Page 55

Chapter
3
Energy Data Collector Configuration
Introduction
In this chapter, you configure data collector devices for your energy management application. This can include
PowerMonitor W250, 500, 1000, 3000, or 5000 devices and CompactLogix controllers.
PowerMonitor devices typically gather electrical energy data through connections to electrical distribution systems. In
addition, PowerMonitor devices can connect to digital pulse outputs from gas, water, and other types of energy meters.
The CompactLogix controller collects energy data from digital or analog outputs of meters and transmitters for a variety of
energy sources such as water, air, gas, steam, electric, and fuel. The controller also provides an interface to HMI devices
providing energy data and device status to the plant floor.
Before You Begin
• Determine business goals, complete energy assessment, and determine monitoring methods (Chapter 1).
• Select hardware and wire devices (Chapter
2).
What You Need
• Supporting hardware identified in the Energy Data Worksheet for your system, which includes:
– PowerMonitor 1000 device
– PowerMonitor 3000 master module and display module
– PowerMonitor W250 device
– PowerMonitor 500 device
– PowerMonitor 5000 device
– CompactLogix controller
• RSLogix 5000 software, version 17 or later or Studio 5000 Logix Designer application, version 21.00 or later
• Energy Management Accelerator Toolkit, publication IASIMP-SP014
or visit the Integrated Architecture Tools and Resources website at http://www.ab.com/go/iatools
• Product manuals:
– Bulletin 1404 PowerMonitor 3000 Unit User Manual, publication 1404-UM001
– PowerMonitor 3000 Installation Instructions, publication 1404-IN007
– PowerMonitor 1000 Unit User Manual, publication 1408-UM001
– PowerMonitor 1000 Unit Installation Instructions, publication 1408-IN001
– PowerMonitor W250 Unit User Manual, publication 1425-UM001
– PowerMonitor 500 Unit User Manual, publication 1420-UM001
– PowerMonitor 5000 Unit User Manual, publication 1426-UM001
– Logix Common Procedures Programming Manual, publication 1756-PM001
Rockwell Automation Publication IASIMP-QS016C-EN-P - October 2014 55
Page 56

Chapter 3 Energy Data Collector Configuration
Create a Project and Set Up
Controller Properties
Configure a CompactLogix
Controller
Configure CompactLogix
Energy Inputs
Map Energy Add-On Instruction
Tags to PLC-5 Addresses
page 86
Import Energy Add-On
Instructions
page 78
page 79
page 80
Configure the Ethernet IP
Address
Configure a PowerMonitor 3000
Device
Configure Advanced Device
Parameters
Configure Basic Device
Parameters
page 58
page 59
page 60
Configure the Ethernet IP
Address
Configure a PowerMonitor 1000
Device
Configure Advanced Device
Parameters
Configure the Date and Time
page 66
Configure Analog Inputs
page 62
page 63
page 65
Configure with the Display
Configure a PowerMonitor 500
Device
Configure Communication
Parameters
Configure Basic Device
Parameters
page 70
Access the Programming
Menu
page
68
page 69
page 69
RS-232 Data Port Use and
Configuration
Configure a PowerMonitor
Wireless 250 Device
PC Receiver RS-485 Data Port
Use and Configuration
page
67
page 67
Setup Using the Web Interface
Configure a PowerMonitor 5000
Device
Basic Metering Setup
Native Ethernet Communication
Setup
page 74
Obtaining Access to the
Configuration Pages
page
72
page 72
page 74
Configure Advanced Parameters
Configure the Date and Time
page 70
page 71
Set Up Date and Time
Test Security
Setting Up Remaining Functions
of the PowerMonitor 5000 Unit
page 77
Set-up Initial Security
page
76
page 76
page 77
Follow These Steps
Follow these paths to configure the PowerMonitor devices and Compactlogix controllers in your energy system.
56 Rockwell Automation Publication IASIMP-QS016C-EN-P - October 2014
Page 57
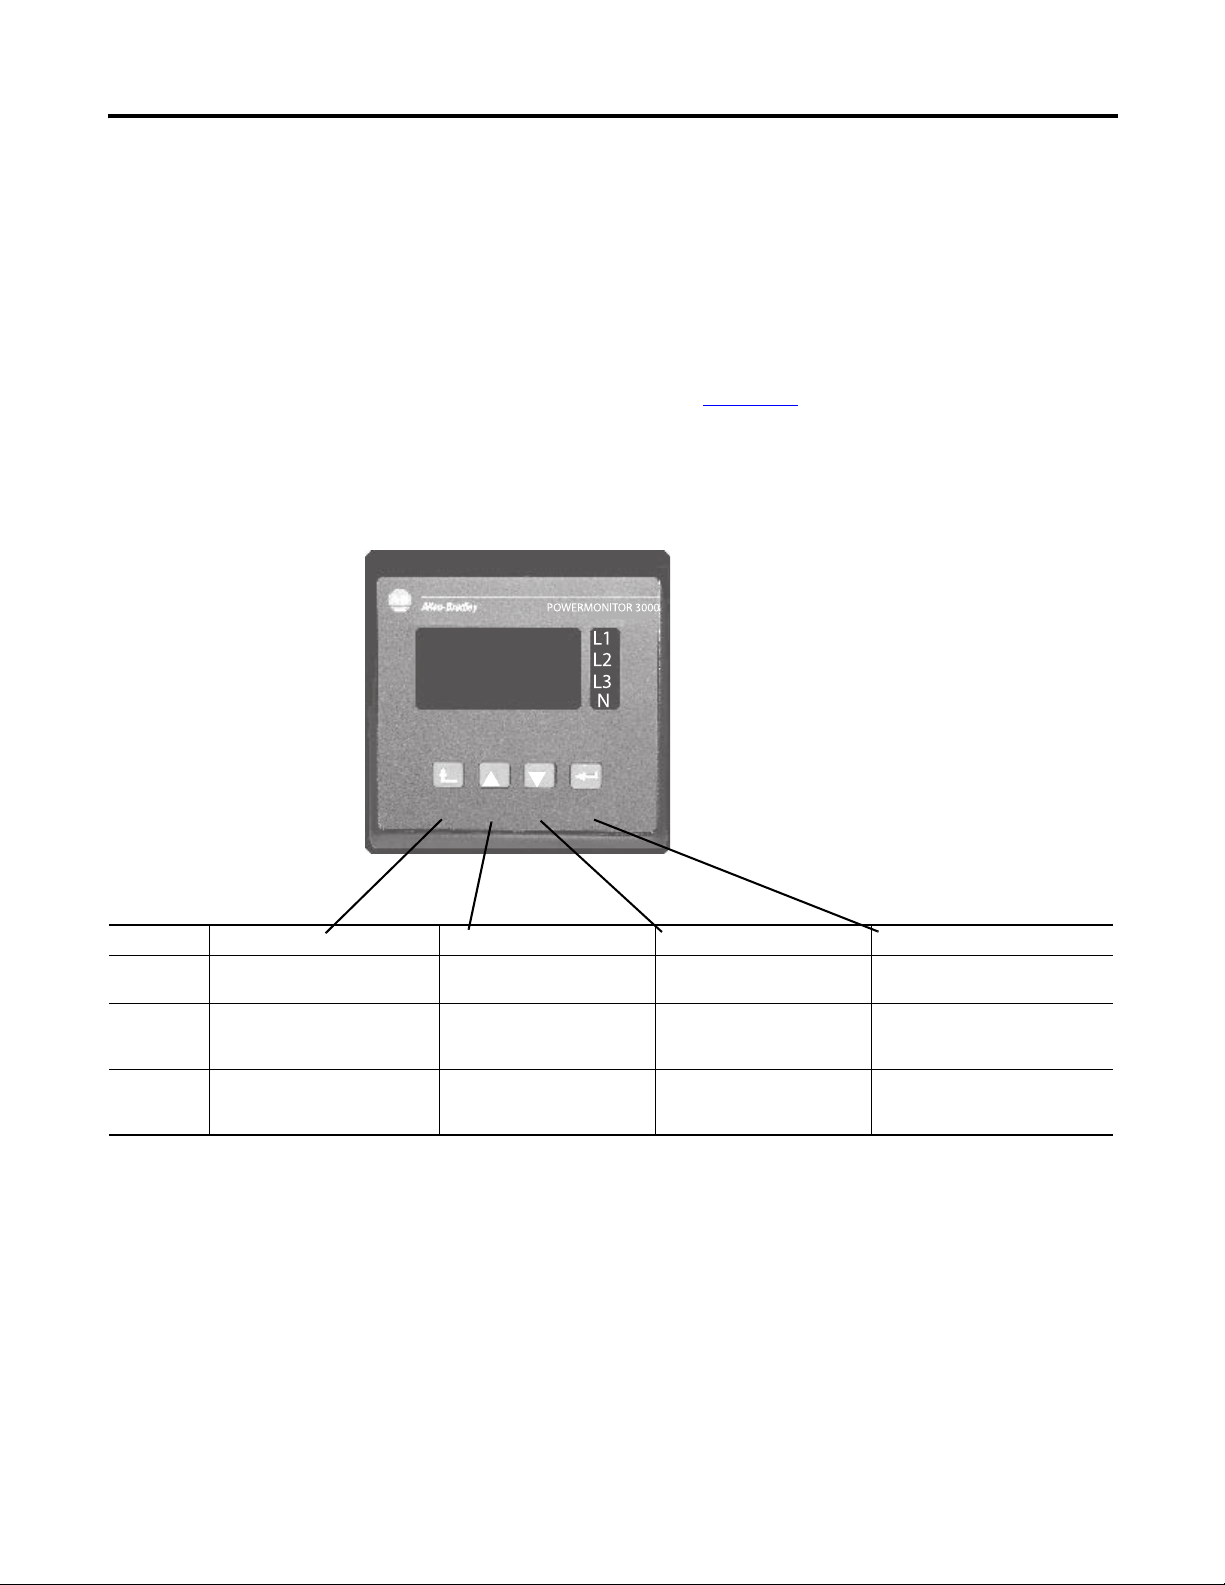
Energy Data Collector Configuration Chapter 3
TIP
Configure a PowerMonitor 3000 Device
This section shows you how to configure PowerMonitor 3000 device settings by using the PowerMonitor 3000 display
module. Certain settings are needed for the power monitor to meter accurately, communicate correctly, and work with
FactoryTalk EnergyMetrix software properly. These settings include network configuration, wiring, PT and CT ratios,
nominal system voltage, demand settings, and the date/time. Your application may require additional configuration.
Network configuration is provided for the PowerMonitor 3000 on Ethernet device. For other communication options,
refer to the PowerMonitor 3000 Unit User Manual, publication 1408-UM001
The PowerMonitor 3000 display module has four keys on its front bezel that are used to navigate menus and select
parameters within the module. The phase indicators, L1, L2, L3, N, show which phase, or phases, are being displayed. The
phase indicators also indicate Program mode by flashing.
Navigation to Menu Items
Mode Escape Key Up Arrow Key Down Arrow Key Enter Key
Display Returns to parent menu. Steps back to the previous
Program Returns to parent menu. Steps back to the previous
Edit Cancels changes to a parameter,
restores the existing value, and
returns to Program mode.
parameter/menu in the list.
parameter/menu in the list.
Increments the parameter/
menu value.
Steps forward to the next
parameter/menu in the list.
Steps forward to the next
parameter/menu in the list.
Decrements the parameter
value.
Steps into a submenu or sets as
default screen.
Steps into a submenu, selects the
parameter to be modified, or
changes to Edit mode.
Saves the parameter change to
the master module and returns to
Program mode.
Rockwell Automation Publication IASIMP-QS016C-EN-P - October 2014 57
Page 58

Chapter 3 Energy Data Collector Configuration
TIP
TIP
TIP
Configure the Ethernet IP Address
Follow these steps to configure the Ethernet IP address of the PowerMonitor 3000 module.
The default IP address is 192.168.254.xxx, where xxx is the unit’s id.
Before starting the procedure, make sure the PowerMonitor 3000 display module is connected to the PowerMonitor
3000 device and control power is on.
1. Press the Down Arrow key to select PROG mode.
2. Press the Enter key to access Edit mode.
You should see PASS.? and four flashing zeroes, 0000, on the display.
3. Press the Up and Down arrow keys to select the four-digit password and press the Enter key.
The default password is 0000.
You can press and hold the Up Arrow or Down Arrow key for a few seconds to increase the rate the value increments or
decrements.
4. Press the Down arrow key to select CONFIGURATION, then press the Enter key.
5. Press the Down Arrow key until you see OPTIONAL COMM, then press the Enter key.
You should see IP ADDR. BYTE 1 on the display.
The syntax of the IP address is four bytes connected by decimal points: aaa.bbb.ccc.ddd. Each byte has a value in the
range 0…255.
6. Press the Enter key to access the parameter value for editing.
When editing a parameter, the phase indicators at the right of the display module are solid and the
parameter flashes. After pressing the Enter key to store the new value, the phase indicators flash and the
parameter turns solid.
7. Press the Up Arrow or Down Arrow key to select the desired value.
8. Press the Enter key to write the new value to the PowerMonitor 3000 master module.
9. Press the Down Arrow key to select the next IP address byte.
10. Repeat steps 6…9 to edit the remaining IP address byte values.
11. Repeat steps 6…10 to configure the Subnet Mask and Gateway IP addresses as required.
12. Press the Escape key twice to return to the Configuration menu.
58 Rockwell Automation Publication IASIMP-QS016C-EN-P - October 2014
Page 59

Energy Data Collector Configuration Chapter 3
Configure Basic Device Parameters
Follow these steps to configure wiring, PT and CT ratios, and nominal system voltage for the PowerMonitor 3000 device.
The Basic Device Configuration Parameters
example settings.
1. Press the Enter key from the PROG.>CONFIGURATION menu.
The BASIC configuration menu is displayed.
2. Press the Enter key to select the WIRING CONFIG. menu.
3. Press the Enter key to access Edit mode.
4. Press the Down Arrow key to select the desired wiring mode parameter.
5. Press the Enter key to write the new value to the PowerMonitor 3000 master module and return to the WIRING
CONFIG menu.
6. Repeat steps 4 and 5 to set the PT Secondary, CT Primary, CT Secondary, and Nominal System Voltage (M6 and
M8 models only) parameters.
The I4 Primary and I4 Secondary parameters are used for neutral metering only.
table on page 59 provides a list of basic device configuration parameters and
7. Press the Escape key to return to the Configuration menu.
Basic Device Configuration Parameters
Parameter Range Default Example Settings
Wiring 0 = Delta 3 CT
PT Primary 1
PT Secondary 1
CT Primary 1
CT Secondary 1
I4 Primary 1
I4 Secondary 1
Nominal System Voltage
(M6 and M8 only)
(1) This value is typically line-to-neutral voltage for Wye systems and line-to-line voltage for Delta systems.
1 = Delta 2 CT
2 = Direct Delta 3 CT
3 = Direct Delta 2 CT
4 = Open Delta 3 CT
…
10,000,000 480 480 (Volts)
…
600 480 480 (Volts)
…
10,000,000 5 600 (Amps)
…
5 5 5 (Amps)
…
10,000,000 5
…
55
…
10,000,000 480 277 (Volts)
1
5 = Open Delta 2 CT
6 = Wye
7 = Single Phase
8 = Demo
6 = Wye Wye
(1)
Rockwell Automation Publication IASIMP-QS016C-EN-P - October 2014 59
Page 60

Chapter 3 Energy Data Collector Configuration
Configure Advanced Device Parameters
The Advanced Device Configuration Parameters table on page 61 provides a list of advanced parameters and values you can
set for the PowerMonitor 3000 device. Most applications use the default values for demand period length, number of
demand periods, and forced demand delay.
Follow these basic steps to configure demand parameters and the date/time.
1. Press the Enter key from the PROG.>CONFIGURATION menu.
The BASIC configuration menu is displayed.
2. Press the Down Arrow key to select the ADVANCED menu, then press the Enter key.
3. Press the Down Arrow key to select the desired advanced parameter.
4. Press the Enter key to access Edit mode.
5. Press the Up and Down Arrow keys to change the value.
6. Press the Enter key to write the new value to the PowerMonitor 3000 master module and set the display module back
to Program mode.
7. Repeat steps 3…6 to set other advanced parameters.
8. Press the Escape key to return to desired menus.
60 Rockwell Automation Publication IASIMP-QS016C-EN-P - October 2014
Page 61

Energy Data Collector Configuration Chapter 3
Advanced Device Configuration Parameters
Parameter Range Default Example Settings
…
New Password -1
Demand Period Length -99
Number of Demand Periods 1
Forced Demand Delay 0
Predicted Demand Type Instantaneous
KYZ Control Source 0 = None
KYZ Pulse Output Scale 1
KYZ Pulse Output Width 0, 40
Relay Control Source Same as KYZ 7 = Setpoint
Relay Pulse Output Scale 1
Relay Pulse Output Width 0, 40
RMS Resolution Nominal / High High
RMS Averaging On / Off On
Frequency Averaging On / Off On
Date Format MM/DD/YYYY DD/MM/YYYY MM/DD/YYYY
Date: Year 1998
Date: Month 1
Date: Day 1
Time: Ho ur 0
Time: Minutes 0
Time: Seconds 0
Default relay state on comms loss 0 = Last state/resume
Default KYZ state on comms loss 0
Wdog action 0 = Halt
Display Module Scroll Speed Fast / Slow Fast
Energy counter rollover point 4
(1)
Metering Result Set (M8 only
)
9999 0000 0000
…
99 min 15 15
…
15 1 1
…
900 s 10 10
1st Order
2nd Order
1 = Wh Forward
2 = Wh Reverse
3 = VARh Forward
4 = VARh Reverse
…
30000 10
…
2000 0
…
30000 10
…
2000 100
…
2097 1998
…
12 1
…
31 1
…
23 0
…
59 0
…
59 0
1 = Last state/freeze
1 = Continue
…
15 digits 15
0 = All results
1 = Transducer mode
2 = Energy meter mode
5 = Vah
6 = Ah
7 = Setpoint
8 = Comms
2 = De-energize/resume
3 = De-energize/freeze
Instantaneous
7 = Setpoint
(2)
0
0 = Halt
0 = All results
(1) Metering result set parameter may only be configured by using communication.
(2) Factory default for RMS Resolution is Nominal for the M4 and High for the M5, M6, and M8.
Rockwell Automation Publication IASIMP-QS016C-EN-P - October 2014 61
Page 62

Chapter 3 Energy Data Collector Configuration
TIP
TIP
http://192.168.254.23
Configure a PowerMonitor 1000 Device
This section shows you how to configure parameters of a PowerMonitor 1000 device by using its internal Display and
Configuration web page. Certain settings are needed for the PowerMonitor to meter accurately, communicate correctly,
and work with FactoryTalk EnergyMetrix software properly. You will set the network configuration, voltage mode, PT and
CT ratios, demand values, and the date and time. Your application may require additional configuration.
Network configuration is provided for the PowerMonitor 1000 on Ethernet device. For other communication options,
refer to the PowerMonitor 1000 Unit Installation Instructions, publication 1408-IN001
Follow these steps to configure PowerMonitor 1000 device parameters.
1. Launch the Internet browser on your computer.
2. In the Address field, type the IP address of your PowerMonitor 1000 device.
The default IP address is 192.168.254.xxx, where xxx is the unit’s id. The default address simplifies the task of
making the initial connection to the unit from a personal computer.
You can check the IP address of the PowerMonitor 1000 device from its display or by using RSLinx
Classic software and configuring an EtherNet/IP driver.
Configure the Ethernet IP Address
Follow these steps to configure the Ethernet IP address of a PowerMonitor 1000 device.
1. Choose Configure Options>
Communication>Ethernet
Communications to access the
Ethernet Configuration page.
62 Rockwell Automation Publication IASIMP-QS016C-EN-P - October 2014
Page 63

2. Enter the default password of 0 or another valid
TIP
TIP
1
600
password to access Edit mode.
The password appears as asterisks
(*). If you don’t know the password,
call Rockwell Automation technical
support for assistance.
3. Enter appropriate values in the IP Address Byte fields.
Energy Data Collector Configuration Chapter 3
For the Efficient Industries Plant 1
example, the IP
address is 10.10.10.1 for the first PowerMonitor 1000
device.
4. Enter the Subnet Mask and Gateway IP addresses as
required.
5. Click Submit to send the parameter changes to the
PowerMonitor 1000 device.
You will lose communication to the PowerMonitor device. You must enter the new IP address in the
Address field of your web browser to re-establish communication with the device.
6. Browse to the new IP address from your web browser.
The IP address is shown on the default LCD display screen.
Configure Analog Inputs
Follow these steps to configure the voltage mode, PT ratios, and CT ratios for the PowerMonitor 1000 device. The Analog
Input Setup Parameters table on page 64 shows the analog input parameters and example settings.
1. Choose Configure Options>Analog Input to
display the Analog Input Configuration page.
Rockwell Automation Publication IASIMP-QS016C-EN-P - October 2014 63
Page 64

Chapter 3 Energy Data Collector Configuration
TIP
2. Enter the default password of 0 or another valid
password to access Edit mode.
The password appears as asterisks
(*)
.
If you don’t know the password,
call Rockwell Automation technical
support for assistance.
3. Enter the value of the Voltage Mode you are using.
4. Set elements 2, 3, and 4 to configure the PT and
CT parameters.
5. Click Submit to send the parameter changes to the
PowerMonitor 1000 device.
Analog Input Setup Parameters
Parameter Range Default Example Settings
Password 0…9999 0 0
Voltage Mode 0…6
0 = Direct Delta
1 = Open Delta
2 = Wye
3 = Single Phase
4 = Demo, simulated results
5 = 1PT1CT-LL
6 = 1PT1CT-LN
PT Primary 1.0… 50,000 480 480
PT Secondary 5.00… 50,000 480 480
CT Primary 5.00… 50,000 5 600
System PF Setting 0 = Lead (-97…89)
1 = High (-85…98)
2 = Low (-52…-95)
22
2 = Low 2
64 Rockwell Automation Publication IASIMP-QS016C-EN-P - October 2014
Page 65

Energy Data Collector Configuration Chapter 3
TIP
Configure Advanced Device Parameters
Follow these steps to configure advanced demand parameters for the PowerMonitor 1000 device. These settings include
demand source, demand period length, and the number of demand periods to average for the demand calculation. The
Advanced Device Configuration Parameters
1. Choose Configure
Options>Advanced to
access the Advanced
Configuration page.
2. Enter the default password
of 0 or another valid password to access Edit mode.
The password appears as asterisks (*).
If you don’t know the password, call
Rockwell Automation technical
support for assistance.
table on page 65 shows the demand parameters and example settings.
3. Set appropriate values for the demand parameters
(elements 14, 15, and 16).
For this example, accept the default parameters as shown.
4. Click Submit to send the parameter changes to the PowerMonitor 1000 device.
Advanced Device Configuration Parameters
Parameter Range Default Example Settings
Password 0…9999 0 0
Demand Source 0…3
Demand Period Length 0…99 min 15 min 15
Number of Demand Periods 1…15 1 1
Forced Demand Sync Delay 0… 90 s 10
Demand Broadcast Master Select 0…1 0
Broadcast Port Number
(Ethernet Setup)
0 = Internal Timer
1 = Status Input 2
2 = Controller Command
3 = Ethernet Demand Broadcast
300… 400 300
00
Rockwell Automation Publication IASIMP-QS016C-EN-P - October 2014 65
Page 66

Chapter 3 Energy Data Collector Configuration
TIP
Configure the Date and Time
Follow these steps to configure the date and time for the PowerMonitor 1000 device. The Date and Time Setup Parameters
table on page 66
1. Choose Configure Options>Date and
Time to access the Date and Time
Configuration page.
2. Enter the default password of 0 or another valid
password to access Edit mode.
shows the date and time parameters, and example settings
The password appears as asterisks (*).
If you don’t know the password, call
Rockwell Automation technical
support for assistance.
3. Configure the date and time parameters accordingly.
4. Click Submit to send the parameter changes to the
PowerMonitor 1000 device.
Date and Time Setup Parameters
Parameter Range Default Example Settings
Password 0…9999 0 0
Date: Year 2001…2100 2005
Date:Month 1…12 1
Date:Day 1…31 0
Tim e:Hour 0… 23 0
Time:Minute 0…59 0
Time:Seconds 0…59 0
Time:Hundreths 0…59 0
66 Rockwell Automation Publication IASIMP-QS016C-EN-P - October 2014
Page 67

Energy Data Collector Configuration Chapter 3
1
5
9
6
1
2
3
4
5
6
7
8
9
Inverting Signal -
NC
GND
Non-inverting Signal +
NC
Configure a PowerMonitor Wireless 250 Device
The PowerMonitor Wireless 250 monitors are factory configured. Each PowerMonitor Wireless 250 device is assigned a
Group ID and Device ID in the factory. These should not be modified except under exceptional circumstances. One such
circumstance would be operating two or more independent PowerMonitor W250 networks in such close proximity that
RF interference with each other occurs. Please contact Rockwell Automation support services for more information or if
assistance is required.
The PC Receiver can be configured for RS-232 or RS-485 data port use.
PC Receiver Connection
This section describes the RS-232 and RS-485 connections.
RS-232 Data Port Use and Configuration
DB-9 style connector: RS-232 Data Port connector with standard DCE connections for transmit data, receive data, RTS
input, and CTS output.
The PC Receiver is factory configured with the following parameters:
• Communication Rate - 115,200
• Data Bits - 8
• Parity - None
• Stop Bits - 1
PC Receiver RS-485 Data Port Use and Configuration
The RS-485 mode of the PC Receiver requires special wiring for the DB9 connection. In order to activate the RS-485
mode, please connect the data port as follows.
PC Receiver RS-485 Wiring Diagram
Rockwell Automation Publication IASIMP-QS016C-EN-P - October 2014 67
Page 68

Chapter 3 Energy Data Collector Configuration
6
7
8
3
4
5
2
1
As soon as power is applied to the PC Receiver unit, the PC Receiver unit chooses the serial mode, RS-232 or RS-485,
according to the DB9 wiring. This mode remains until the PC Receiver is power cycled (just removing the DB9 connector
does not change the serial mode).
RS-485 mode is available on the PC Receiver unit with the date code 10267 or later with firmware revision (or later) 1.5.15
(100 and 200 node) or 1.7.5.15 (10 node). Upgrade of an older PC Receiver (before date code 10267) is not possible, as it
is a different hardware revision.
RS-485 mode sets the device Modbus address to 247. The address cannot be changed. Only point-to-point communication
is supported.
Refer to the PowerMonitor Wireless 250 Monitor User Manual, publication 1425-UM001
, for more information on
installing and commissioning your wireless network.
Configure a PowerMonitor 500 Device
This section shows you how to configure parameters of a PowerMonitor 500 device by using its front panel display. Certain
settings are needed for the power monitor to meter accurately, communicate correctly, and work with FactoryTalk
EnergyMetrix software properly. You set the communication parameters, system type, PT and CT ratios, demand values,
and the date and time. Your application may require additional configuration.
Configure with the Display
The PowerMonitor 500 unit provides menu-based configuration (programming) using its front panel display. The
programming menus let you select parameters to edit, select digits within parameters, and increase or decrease the value of
each digit.
During the Programming mode, the instrument provides
this information.
1. Indicates Programming mode.
2. Identifies the programming menu number.
Refer to the programming flow chart.
3. Indicates parameter currently being edited.
4. Cursor identifies the digit currently being edited.
5. Allowable range of selected parameter.
Use the Up and Down arrow (7) to increase and decrease the
digit indicated by the cursor (4). To set another digit, move
the cursor to the desired digit by using Escape (6). Each
button press shifts the cursor (4) one digit to the left.
68 Rockwell Automation Publication IASIMP-QS016C-EN-P - October 2014
Page 69

When the cursor is beneath the last digit on the left, a
10
9
further press of Escape (6) lets you change the decimal point
and the multiplier (9) (k or M). The blinking ‘dP’ (decimal
point) text (10) indicates this capability.
To modify the decimal point position and the multiplier, use
the Up and Down arrow button (7) to select the desired
value.
To store the new programmed value, press Enter (7). To
cancel the change in programming and restore the previous
values of the parameter, press Escape (6) for at least 2
seconds.
Follow these steps to configure PowerMonitor 500 device parameters.
Access the Programming Menu
Energy Data Collector Configuration Chapter 3
1. Press and hold Enter for at least 2 seconds to access the programming menu.
2. Enter the default password of 0 (or another valid password).
3. Press Enter to access programming mode.
Configure Communication Parameters
1. Press the Up Arrow until you reach the RS232-485 or Ethernet menu.
2. Press Enter to select the menu item.
3. Press the Up and Down arrows to scroll through the communication parameters.
The Serial communication parameters are listed in this table.
Parameter Range Default
Address 1…247 1
Communication Rate 9600, 19200, 38400, 115200 9600
Parity None/odd/even none
Rockwell Automation Publication IASIMP-QS016C-EN-P - October 2014 69
Page 70

Chapter 3 Energy Data Collector Configuration
The Ethernet communication parameters are listed in this table.
Parameter Range Default
IP Address www.xxx.yyy.zzz N/A
Subnet www.xxx.yyy.zzz N/A
Gateway www.xxx.yyy.zzz N/A
TCP IP Port 1…9999 502
ACD Yes or No No
4. To change a parameter:
a. Press Enter to select a menu item.
b. Press the Up and Down arrows to change the value.
c. When the desired value is displayed, press Enter to confirm your selection.
5. Press Esc to return to the main menu.
Configure Basic Device Parameters
1. From the main programming menu, use the Up and Down Arrows to scroll through the programming menu and
view the configuration for the basic device parameters.
Parameter Range Default
System 1P, 2P, 3P, 3P.n,3P.1, 3P.2 3P.n
CT Ratio 1.0…9999 1.0
PT Ratio 1.0…9999 1.0
2. To change a parameter:
a. Press Enter to select a menu item.
b. Press the Up and Down arrows to change the value.
c. When the desired value is displayed, press Enter to confirm your selection.
3. Press Esc to return to the main menu.
Configure Advanced Parameters
Follow these steps to configure the advanced parameters for the PowerMonitor 500 device. These settings include the
demand calculation mode, interval time, and synchronization mode.
1. From the main programming menu, use the Up and Down Arrows to scroll through the programming menu.
2. Select a menu item by pressing Enter.
70 Rockwell Automation Publication IASIMP-QS016C-EN-P - October 2014
Page 71

These are the Demand configuration parameters.
Parameter
Typ e FIXE D
Time 01, 05, 10, 15, 20, 30 15
Sync OFF/CLOCK OFF
(1) Additional advanced parameters, such as alarms, outputs, and digital
(1)
filtering are also available for configuration. Refer to the PowerMonitor 500
Unit User Manual, publication 1420-UM001
Range Default
FIXED
AVG/DMD
SLIDE
, for detailed information.
3. To change a parameter:
a. Press Enter to select a menu item.
b. Press the Up and Down arrows to change the value.
c. When the desired value is displayed, press Enter to confirm your selection.
4. Press Esc to return to the main menu.
Energy Data Collector Configuration Chapter 3
Configure the Date and Time
Follow these steps to configure the date and time for the PowerMonitor 500 device.
1. From the main programming menu, use the Up and Down Arrows to scroll through the programming menu.
2. Select the Clock menu item by pressing Enter.
These are the Clock configuration parameters.
Parameter Range Default
FORMAT EU/USA EU
YEAR 2009…2099 2009
MONTH 1…12 1
DAY 1…31 1
HOUR 0…23 0
MINUTE 0…59 0
SECOND 0…59 0
3. To change a parameter:
a. Press Enter to select a menu item.
b. Press the Up and Down arrows to change the value.
c. When the desired value is displayed, press Enter to confirm your selection.
d. Press Esc to return to the main menu.
Rockwell Automation Publication IASIMP-QS016C-EN-P - October 2014 71
Page 72

Chapter 3 Energy Data Collector Configuration
Configure a PowerMonitor 5000 Device
This section shows you how to configure parameters of a PowerMonitor 5000 device by using the Web interface. Certain
settings are needed for the power monitor to meter accurately, communicate correctly, and work with FactoryTalk
EnergyMetrix software properly. You will set the basic metering, native Ethernet communication, date and time, and initial
security configuration. Your application may require additional configuration.
Setup Using the Web Interface
For initial setup, connect a personal computer to the PowerMonitor 5000 unit by using a USB cable. Initial setup is usually
performed by using the USB Web interface, and initial security setup can only be performed by using the USB Web
interface.
Refer to the PowerMonitor 5000 USB Driver Installation and Configuration instructions, publication 1426-IN001
more information on installing the USB communication drivers.
Open Internet Explorer and browse to http://192.168.169.3.
The PowerMonitor 5000 home page will display in your
browser as shown below. The home page displays general
information about the PowerMonitor 5000 unit. You can
navigate by clicking folders and pages from the tree on the left.
Initial setup by using the USB Web interface should include at least the following configuration steps:
• Basic Metering - this aligns the power monitor metering functionality with the properties of the circuit to which it
connects
• Native Ethernet Network Communication - this permits access to the unit for data monitoring and setup through an
Ethernet network
• Date and Time - this sets the unit's internal clock so that time stamps in logged data are correct
• Security (if desired) - enabling and configuring security will guard against unauthorized changes to the power
monitor configuration
for
Once initial setup has been completed, including configuration of the Ethernet IP address, you can also access the Web
interface from a computer connected through a network to the PowerMonitor 5000 unit’s native Ethernet port. Open
Internet Explorer and browse to the IP address of the unit.
Obtaining Access to the Configuration Pages
The PowerMonitor 5000 unit initially has security disabled by default. If your power monitor's security is disabled, you can
continue setting up the unit without logging in.
72 Rockwell Automation Publication IASIMP-QS016C-EN-P - October 2014
Page 73

Energy Data Collector Configuration Chapter 3
If Security is Enabled
If security is enabled, the web page header displays ‘Logged in as:’ and a Log in link.
If security is enabled, you will need to log in as an administrator to configure setup parameters. If not logged in as an
administrator, you will be able to view, but not change, configuration parameters. If you need to log in, click the Log in link.
The USB connection has a special administrator account. Follow these steps to log in with this account.
1. Type in the user name usbadmin.
2. Type in the password usbadmin.
3. Click Log In.
A dialog box reports the result.
To log in from the network Web
interface, select a previously configured
administrator account user name and
password. The PowerMonitor 5000 unit
does not permit logging in with the
USB administrator login from the
network.
You will remain logged in until you log
out or until 30 minutes have passed
since configuration changes have been
applied.
How to Set Up the PowerMonitor 5000 Unit
From any power monitor web page, click the Configuration folder. A list of available configuration pages is displayed in the
tree. The steps for entering, editing and applying configuration parameters are similar for each configuration page.
The configuration pages contain text boxes for entering parameter
values, pull-down menus for selecting enumerated parameter
values, and an Apply Changes button for committing changes to
the power monitor. The power monitor checks that parameter
values are within their valid range before applying them. A dialog
box appears to report the success or reason for failure of an
attempt to apply new parameters.
Rockwell Automation Publication IASIMP-QS016C-EN-P - October 2014 73
Page 74

Chapter 3 Energy Data Collector Configuration
EXAMPLE
Basic Metering Setup
We will begin with configuring the basic metering parameters. Click the Metering_Basic page under the open
Configuration folder. The page opens. You can select other configuration pages by clicking the desired page in the tree, or
by clicking the corresponding tab in the page.
This page displays the existing basic metering configuration of the power monitor, including the metering mode, PT (VT)
and CT ratios, nominal voltage and frequency, and demand. To change the basic metering setup, enter the desired values
into the text boxes, scroll down, and click Apply Changes. A dialog box appears to report the result of the setup change.
This Metering_Basic page illustrates the setup for a 480V, 3-phase system with 1000:5 current transformer
(CT) ratios on all phases and the neutral.
Native Ethernet Communication Setup
Click the Configuration folder and select the CommunicationsNative page. The PowerMonitor 5000 unit is set up by
default to obtain an IP address automatically from a DHCP (Dynamic Host Configuration Protocol) server. If your power
monitor is on a network served by a DHCP server, and the power monitor is connected to the network, it has probably
already been assigned an IP address.
We recommend that each power monitor be assigned a static, or fixed, IP address, since DHCP addresses can change from
time to time, resulting in loss of communication with client applications. Obtain a fixed IP address, subnet mask, default
gateway, and other network setup parameters from your network administrator. Another option can be to set up the power
monitor as a reserved client in the DHCP server.
74 Rockwell Automation Publication IASIMP-QS016C-EN-P - October 2014
Page 75

Energy Data Collector Configuration Chapter 3
EXAMPLE
IMPORTANT
This example explains how to change from a DHCP-assigned to a static IP address.
The initial network configuration is shown below. The IP address assigned is 192.168.200.8. The network administrator has provided a range of static IP addresses in the same subnet, beginning with 192.168.200.100. In this case, the default gateway and
DNS servers remain the same for static or DHCP-obtained addresses (verify if this is true in your case with your network administrator).
To change to the new address, from the IP_Address_Obtain pull-down menu choose Static, type in the new IP address, and click
Apply Changes.
You can change the network configuration from the USB or network web pages. If you change the IP address from the network
Web interface, you will then need to browse to the new IP address to re-establish communication.
Rockwell Automation Publication IASIMP-QS016C-EN-P - October 2014 75
Page 76

Chapter 3 Energy Data Collector Configuration
Set Up Date and Time
Click the Configuration folder and select the DateTime page. Enter the year, month, day, hour, and minute into the
corresponding input fields and click Apply Changes. If your power monitor has been set up for time synchronization with
either a SNTP or IEEE 1588 PTP server, the time may already be set.
Set-up Initial Security
If you choose to enable security on the power monitor, you must perform the initial security setup by using the USB Web
interface.
1. In the USB web page, select the
Security folder and then the
Security page.
2. From the Security Defaults pulldown menu, choose Enable
Security.
3. Accept the prompt regarding
enabling security and accept the
prompt to reload the web pages.
4. Log in with user name usbadmin
and password usbadmin.
5. Accept the prompt that the login
was successful.
6. To add a network administrator,
click AddNew.
7. Enter a username and password
for a network administrator.
The username and password can
be any string up to 32 characters
in length. This example sets a
username of admin with a
password of admin. Make a note
of the new network
administrator login for future use
and keep it in a secure location.
8. While still connected to the USB
port, log out from the usbadmin account.
76 Rockwell Automation Publication IASIMP-QS016C-EN-P - October 2014
Page 77

Energy Data Collector Configuration Chapter 3
Only one admin type account is permitted to be active at a time.
Now that the network administrator user has been created, you can continue setting up the PowerMonitor 5000 unit by
connecting through the native EtherNet/IP port and using the network Web interface. This includes the ability to
configure additional users, administrators, and application security accounts.
Test Security
To test the network administrator login, follow these steps.
1. Browse to the network address of
the PowerMonitor 5000 unit.
2. Click Log in from the page
header and enter the user name
and password just created and
click Log In.
Note that only the USB Web interface
can be used to enable, disable, or reset
security. If security accounts are lost or
forgotten, you will need to connect to
the USB Web interface and log in with
the usbadmin account to create new
network security accounts.
Setting Up Remaining Functions of the PowerMonitor 5000 Unit
The remaining functions are set up in the same way as the examples discussed in this section. For additional details on
configuring the PowerMonitor 5000 unit refer to the PowerMonitor 5000 Unit user manual, publication 1426-UM 001
Optionally, the PowerMonitor 5000 device can be configured using the FactoryTalk EnergyMetrix software. Refer to the
FactoryTalk EnergyMetrix software user manual, publication FTEM-UM002
, for details.
.
Rockwell Automation Publication IASIMP-QS016C-EN-P - October 2014 77
Page 78
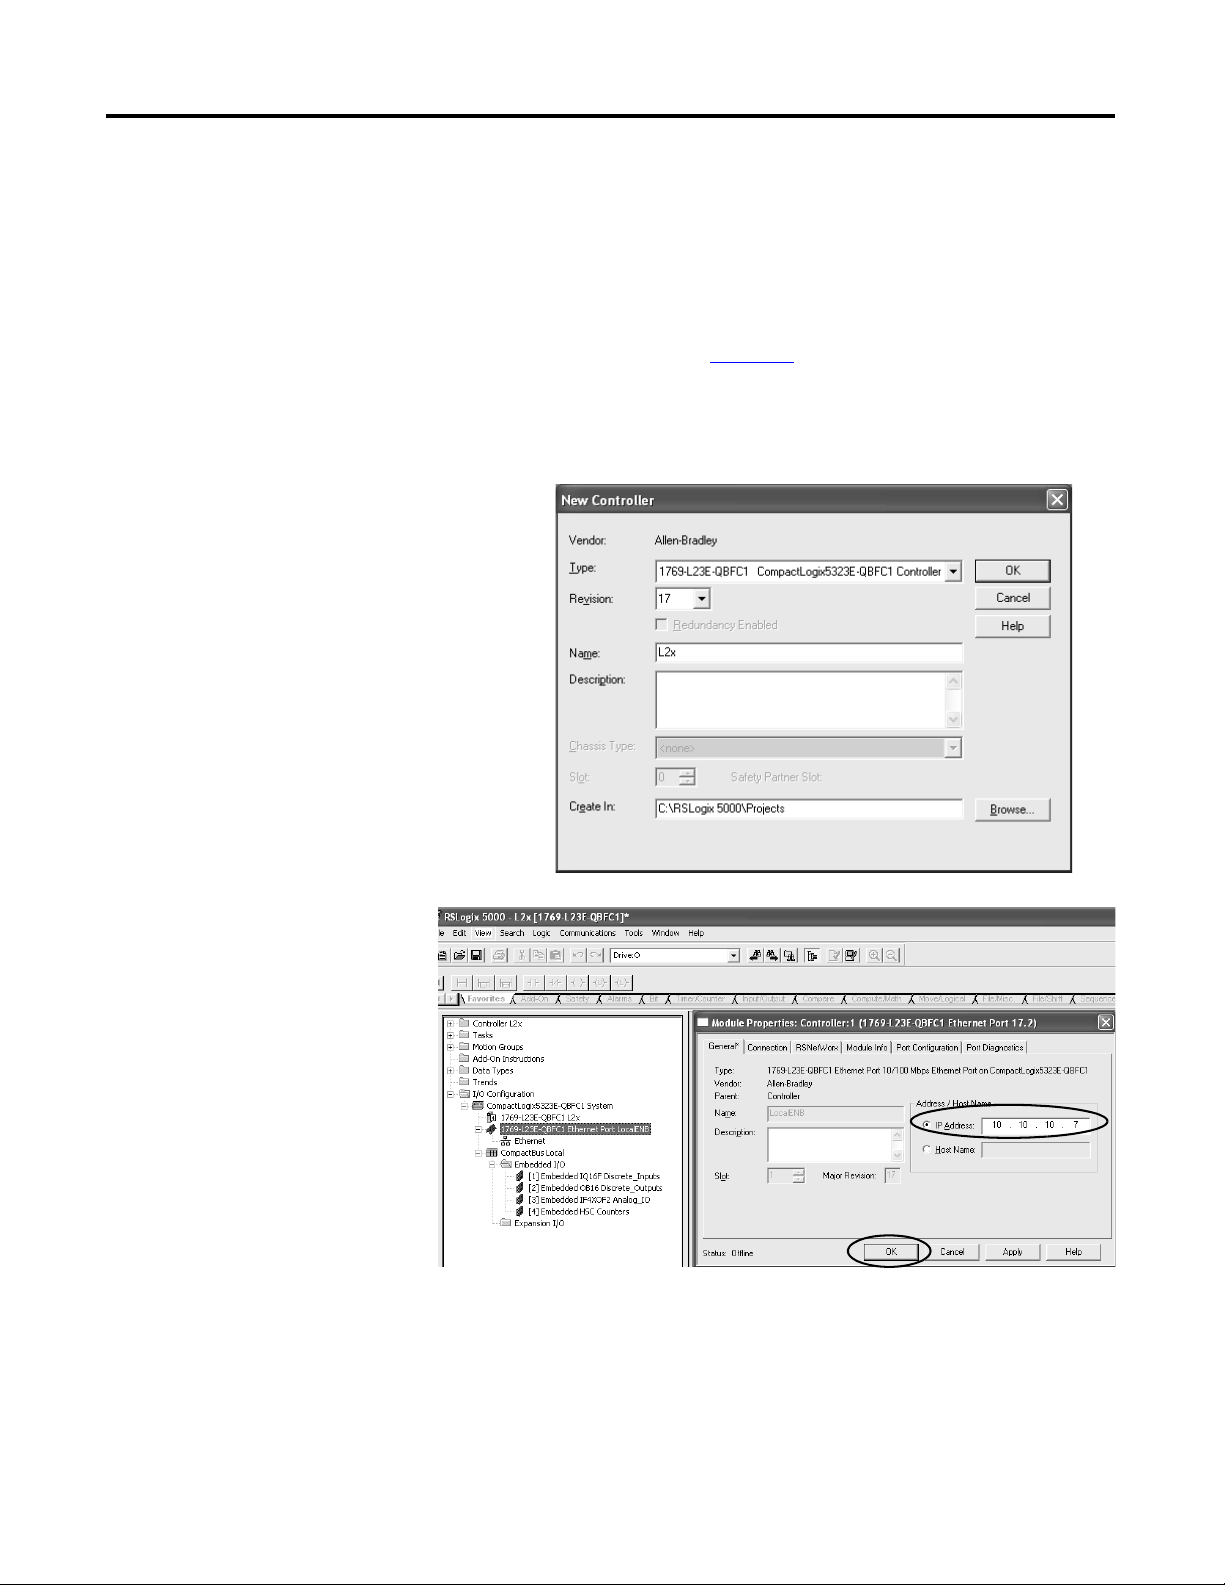
Chapter 3 Energy Data Collector Configuration
Configure a CompactLogix Controller
In this section, you set up a CompactLogix controller as a FactoryTalk EnergyMetrix data collector, and interface to local
HMI faceplates. You configure controller properties, digital and analog energy inputs, and energy Add-On Instructions for
each controller in your system.
Refer to the CompactLogix tab in the Energy Data Worksheet created in Chapter
address assignments.
Create a Project and Set Up Controller Properties
1. Open RSLogix 5000 software to create a new
project.
2. Choose your first controller and choose
revision 17, or later.
For this example, a CompactLogix 1769L23E-QBFC1 is selected as a cost-effective
solution supporting digital and analog energy
inputs, and Ethernet communication.
3. Enter the name of the controller from your
Energy Data Worksheet.
For this example, L2x is entered.
4. Click OK.
5. Right-click the Ethernet Port
and choose Properties.
2 for CompactLogix and PLC-5
For this example, choose the
LocalENB port.
6. Enter a unique IP address for
your controller and click OK.
For this example, 10.10.10.7 is
entered.
78 Rockwell Automation Publication IASIMP-QS016C-EN-P - October 2014
Page 79

Energy Data Collector Configuration Chapter 3
Import Energy Add-On Instructions
You will now import preconfigured Energy Add-On Instructions to support the digital and analog energy inputs listed on
the CompactLogix tab of your Energy Data Worksheet. These Add-On Instructions provide energy data calculations and
HMI interface logic for the energy inputs. Refer to Appendix
1. Navigate to and right-click the AddOn Instructions folder.
2. Choose Import Add-On Instruction.
C and Appendix D for detailed logic information.
3. Browse to the Energy Input Logic folder
on your Energy Management
Accelerator Toolkit CD image.
4. Select the Analog or Digital folder and browse to the desired energy input file.
Choose a digital input file for meters with a
pulse output representing consumption.
Select an analog input file for meters with
an analog output representing flow rate.
The example shows a gas meter digital
input selected.
5. Click Import.
Rockwell Automation Publication IASIMP-QS016C-EN-P - October 2014 79
Page 80

Chapter 3 Energy Data Collector Configuration
6. Click OK from the Import Configuration
dialog box to continue the Add-On
Instruction import.
7. Verify the imported file appears under Add-On
Instructions.
8. Repeat steps 1…7 to import other required Add-On
Instruction files for your project.
For the Efficient Industries Plant 1
example, the Add-
On Instructions list would look similar to this.
Configure CompactLogix Energy Inputs
You are now ready to program each digital and analog energy input listed on the CompactLogix tab of your Energy Data
Worksheet and assign energy tags and factors.
1. Open your program
routine and create a
new rung.
80 Rockwell Automation Publication IASIMP-QS016C-EN-P - October 2014
Page 81

2. Click the Add-On tab in the instruction toolbar.
3. Click an Energy Add-On Instruction icon to add
the instruction to your rung.
For this example, the Energy_Gas_Digital Add-On
Instruction is selected.
4. Click in the energ y tag name field and enter a
tag name.
For this example, Boiler_House_Gas is
entered.
Energy Data Collector Configuration Chapter 3
5. Right-click the energy tag name just entered
and choose the New “Ta g _ N a m e ” from the list.
6. Click OK to accept the default setup for the new
Add-On Instruction tag.
Rockwell Automation Publication IASIMP-QS016C-EN-P - October 2014 81
Page 82

Chapter 3 Energy Data Collector Configuration
7. Double-click the input parameter field, then
click the pull-down menu icon
to display the input controller tags.
Refer to the CompactLogix tab of the Energy
Data Worksheet for the local I/O digital or
analog input address.
8. Navigate to the desired digital or analog input
tag.
This example shows Local:1:I.Data.
9. For digital input tags:
a. Click the tag pull-down menu icon to display
a table of data bits.
b. Click the bit associated with the hardware
terminal wired to your digital input.
For analog input tags:
a. Click the tag pull-down menu icon to display
the channel tags.
b. Double-click the channel data tag associated
with the hardware terminal wired to your
analog energy input.
The analog input channels must also be
enabled.
c. Double-click Analog I/O under IO Configuration to launch the module properties and enable the channels that
will be used.
82 Rockwell Automation Publication IASIMP-QS016C-EN-P - October 2014
Page 83

10. Assign energy input calculation and scaling factor
TIP
tag values based on the Energy Add-On Instruction
Factor table definitions on page 84
.
One table provides factor definitions for electric
inputs and one for all other energy inputs.
This example shows values that need to be set for
the Energy_Gas_Digital Add-On Instruction.
For additional information on how these energy factors affect calculations, refer to Appendix C, Energy Electric Add-
On Instructions and Appendix D, Digital and Analog Energy Add-On Instructions.
Energy Data Collector Configuration Chapter 3
Rockwell Automation Publication IASIMP-QS016C-EN-P - October 2014 83
Page 84

Chapter 3 Energy Data Collector Configuration
Energy Add-On Instruction Default Consumption Unit
Air cf (cubic feet)
Fuel Oil, Propane, Water gallons
Gas therms
Steam lbs (pounds)
Energy Add-On Instruction Default Flow Rate Unit
Air cfm (cubic feet per min)
Fuel Oil, Propane, Water gpm (gallons per min)
Gas therms/hr
Steam lbs/hr
Energy Add-On Instruction Default Flow Rate Unit
Air cfm (cubic feet per min)
Fuel Oil, Propane, Water gpm (gallons per min)
Gas therms/hr
Steam lbs/hr
Energy Add-On Instruction Factors for Electric Inputs
Energy Factor Tag Description
Set_Meter_Pulse_Factor The kWh value used to scale the input pulses. The value 1.5 represents 1.5 kWh per pulse.
Set_Demand_Interval The value, in minutes, used to calculate the End of Demand Interval (EOI). This value is used only if the Val_End_of
Demand_Type is 2.
Set_Demand_Delay The time value used to reset the end of interval after the Set_Demand_Interval value has been exceeded without a
utility contact or master end of demand contact closure. The value must be in the range of 0…90 seconds.
Set_End_of_Demand_Interval_
Typ e
The value that defines how the End of Demand Interval (EOI) is triggered.
1 = A local digital input connected to an electric utility meter EOI contact (Inp_End_of_Demand_Utility_Contact).
2 = An internal PLC timer (Demand_Interval _PLC Timer) that is typically used when an electric utility meter EOI
contact is not available.
3 = A master command input (CMD_Master_End_Of_Demand_Interval) typically from a central controller that is used
to synchronize multiple electric meter EOIs.
Set_High_Demand When the demand (kW) value exceeds the Set_High_Demand, the High Demand Fault is set.
Set_Critical_Demand When the demand (kW) value exceeds the Set_Critical_Demand, the High Critical Fault is set.
Energy Add-On Instruction Factors for Gas, Propane, Fuel Oil, Steam, Air and Water Inputs
Energy Factor Tag Definitions
Set_Meter_Pulse_Factor
(1)
The consumption value of each input pulse.
For example, a value of 1.5 for the Energy_Gas_Digital Add-On Instruction, represents 1.5 therms per pulse.
Set_Calc_Interval The time interval, in minutes, used to calculate the average energy flow.
For example, an interval value of 5 will calculate the average energy flow every 5 minutes.
Set_High_Flow When the flow rate value exceeds the Set_High_Flow value, the High Flow Fault is set.
Example 1
: A value of 500 will set the High Flow Fault in the Energy_Gas_Digital Add-On Instruction when the gas flow
rate exceeds 500 therms/hr.
Example 2: A value of 500 will set the High Flow Fault in the Energy_Air_Analog Add-On Instruction when the air flow
rate exceeds 500 cfm.
Set_Critical_Flow When the flow rate value exceeds the Set_Critical_Flow value, the Critical Flow Fault is set.
Example 1
: A value of 750 will set the Critical Flow Fault in the Energy_Gas_Digital Add-On Instruction when the gas
flow rate exceeds 750 therms/hr.
Example 2: A value of 750 will set the Critical Flow Fault in the Energy_Air_Analog Add-On Instruction when the air flow
rate exceeds 750 cfm.
(1) The Set_Meter_Pulse_Factor applies only to Energy_xxx_Digital Add-On Instructions. Analog inputs must be scaled to represent flow by using the
engineering units in the table.
84 Rockwell Automation Publication IASIMP-QS016C-EN-P - October 2014
Page 85

Energy Data Collector Configuration Chapter 3
11. Repeat steps 1…10 to program other digital and analog energy inputs in your project.
For the Efficient Industries Plant 1
example, the completed energy input logic would look similar to this.
Rockwell Automation Publication IASIMP-QS016C-EN-P - October 2014 85
Page 86

Chapter 3 Energy Data Collector Configuration
TIP
Map Energy Add-On Instruction Tags to PLC-5 Addresses
After programming the CompactLogix energy Add-On Instructions, you must map the total energy tags
(AOIName.Val_Total_xxx) to PLC-5 type addresses (Fxx:x) that FactoryTalk EnergyMetrix software can read. You will
create a MOV instruction for each Compactlogix energy Add-On Instruction to move its total to a tag within an array
named ControllerName_EnergyTotals. You will then map that array to the PLC-5 file F10.
Tag mapping must be done in Offline mode.
Refer to the CompactLogix tab of the Energy Data Worksheet for the CompactLogix EnergyTotal and PLC-5 tags that
must be mapped.
The worksheet below shows the tags to be mapped for the Efficient Industries Plant 1 example.
Follow these steps to map the total energy Add-On Instruction tags to PLC-5 type addresses.
1. Open your program routine and
create a new rung.
For this example, a new rung is
added after
the Energy Add-On Instruction
rung.
86 Rockwell Automation Publication IASIMP-QS016C-EN-P - October 2014
Page 87

2. Add the MOV instruction to
your rung by clicking the Move/
Logical tab in the Instruction
toolbar, then clicking the MOV
instruction icon.
3. Choose the source tag, Val_Total_xxx, from your energy
Add-On Instruction.
For this example, Boiler_House_Gas.Val_Total_Gas is
selected.
Energy Data Collector Configuration Chapter 3
4. Enter a name for the new controller-scoped destination
tag in the format: ControllerName_EnergyTotals.
For this example, enter L2x_EnergyTotals.
5. Right-click the destination tag just entered and choose
New ‘TagName’ to create the controller tag.
6. Configure the new tag.
a. Choose Real for the Data Type with
an array size at least equal to the
number of controller total energy tags
to be mapped.
b. Choose Float for the Style.
c. Click OK to save the configuration.
Rockwell Automation Publication IASIMP-QS016C-EN-P - October 2014 87
Page 88

Chapter 3 Energy Data Collector Configuration
TIP
7. Double-click the Dest tag assignment in the
MOV instruction and reassign the Dest tag to a
unique ControllerName_EnergyTotals array
element in the CompactLogix tab of the
Energy Data worksheet.
This example shows the instruction used to
move Boiler_House_Gas.Val_Total_Gas to the
L2x_EnergyTotals file element [0].
8. Repeat steps 2, 3, and 7 to program MOV instructions for the remaining Add-On Instruction total energy tags
(AOIName.Val_Total_xxx.)
9. Choose Map PLC/SLC Messages from the Logic
menu.
10. In the PLC/SLC Mapping
dialog box:
a. Enter a PLC/SLC file number.
For this example, the PLC-5 file
number 10 is entered.
b. Choose the
ControllerName_EnergyTotals tag
from the Name list.
For this example, L2x_EnergyTotals is
selected.
c. Click OK.
This example shows the
L2x_EnergyTotals 4-element, tag array
mapped to the F10 PLC/SLC file.
FactoryTalk EnergyMetrix software meter tags reference these mapped tags by their PLC-5
equivalent addresses F10:0 through F10:3
88 Rockwell Automation Publication IASIMP-QS016C-EN-P - October 2014
Page 89

Energy Data Collector Configuration Chapter 3
For the Efficient Industries Plant 1 example, the completed energy Add-On Instruction tag-mapping logic would look
similar to this.
Rockwell Automation Publication IASIMP-QS016C-EN-P - October 2014 89
Page 90

Chapter 3 Energy Data Collector Configuration
Notes:
90 Rockwell Automation Publication IASIMP-QS016C-EN-P - October 2014
Page 91

Chapter
FactoryTalk EnergyMetrix Software Installation
Introduction
In this chapter, you will install server software and FactoryTalk EnergyMetrix software on your computer, and launch
FactoryTalk EnergyMetrix software from your web browser.
Before You Begin
• Determine business goals, complete energy assessment, and determine monitoring methods (Chapter 1).
• Select hardware and wire devices (Chapter
• Configure data collection devices (Chapter
2).
3).
4
What You Need
• Personal computer with internet access for launching and using FactoryTalk EnergyMetrix software.
• FactoryTalk EnergyMetrix CD, catalog number 9307-FTEMMENE.
• FactoryTalk EnergyMetrix online help and user manual, publication FTEM-UM002
• Energy Management Accelerator Toolkit CD, publication IASIMP-SP014, or visit the Integrated Architecture
Tools and Resources website at http://www.ab.com/go/iatools
to download toolkit files.
.
Rockwell Automation Publication IASIMP-QS016C-EN-P - October 2014 91
Page 92

Chapter 4 FactoryTalk EnergyMetrix Software Installation
page 93
page 94
Server Requirements
Client Requirements
page 95
page 95
Installation (64-bit)
Configure Windows 2008 Server
page 96
page 98
Install SQL Server 2008 R2
Enable 32-bit Applications
page 98
Install FactoryTalk EnergyMetrix
Software Version 2.0
page
99
Installation (32-bit)
page 102
Activate FactoryTalk EnergyMetrix
Software
Follow These Steps
Follow these steps to install server software, prerequisite software, and FactoryTalk EnergyMetrix software on your
computer. You will also modify settings to use FactoryTalk EnergyMetrix RT and Chart options and launch FactoryTalk
EnergyMetrix software.
92 Rockwell Automation Publication IASIMP-QS016C-EN-P - October 2014
Page 93

FactoryTalk EnergyMetrix Software Installation Chapter 4
Contents of Installation DVD
The installation DVD contains the following required components:
• FactoryTalk EnergyMetrix software version 2.00.00
• FactoryTalk Activation Manager version 3.50
• RSLinx Classic Lite 2.57 CPR 9 SR 3
• Microsoft .NET Framework 3.5 SP1
And the following optional components:
• Adobe Acrobat Reader 9.1
The CD also includes the following applications, which are not accessible from the auto-run menu but can be browsed:
• FactoryTalk EnergyMetrix Software User Manual
• Internet Explorer WebControls 1.0
Server Requirements
We recommend, but do not require, that you install FactoryTalk EnergyMetrix software on a dedicated server with a local
installation of Microsoft SQL Server.
Server Software Requirements for Installing FactoryTalk EnergyMetrix
• Windows 2003 Server or Windows 2008 Server, Application Server role. For 64-bit operating systems, RSLinx
Classic version 2.57 CPR9 SR3 or later must be installed. Windows 2000 Server is not supported.
• Microsoft SQL Server 2005 or 2008, installed with mixed-mode authentication (Windows and SQL). TCP/IP
access must be enabled. A system administrator SQL login must be used for the FactoryTalk EnergyMetrix
installation.
• You must have machine administrator privileges to install FactoryTalk EnergyMetrix.
Hardware Requirements
These are the hardware requirements that you need to use FactoryTalk EnergyMetrix software.
Definitions
The following rules of thumb are offered as a starting point for determining server sizing for FactoryTalk EnergyMetrix.
Other factors will affect the required size of a ser ver. A higher number of tags being logged, a faster log rate, a larger number
of users and a larger number of reports being run will require a more powerful server than the guidelines specify.
• A low-end server has up to 8 meters and logs up to 40 meter tags at a minimum 15 minute log rate
• A mid-range server has up to 64 meters and logs up to 320 meter tags at a minimum 15 minute log rate
• A high-end server has more than 64 meters and logs more than 500 meter tags at a minimum 15 minute log rate
Rockwell Automation Publication IASIMP-QS016C-EN-P - October 2014 93
Page 94

Chapter 4 FactoryTalk EnergyMetrix Software Installation
Database Size Guidelines
FactoryTalk EnergyMetrix writes 16 bytes of data to the database for each meter tag logged. Over time, the database can
grow to become quite large. Some examples include the following:
• A low-end server, logging 40 meter tags at 15 minute intervals, will grow the database at a rate of 2.56 KB per hour or
22 MB per year.
• A mid-level server, logging 320 meter tags at 15 minute intervals, will grow the database at a rate of 20.5 KB per hour,
or 180 MB per year.
• A high-end server, logging 1000 meter tags at 15 minute intervals, will grow the database at a rate of 240 KB per
hour, or 2.1 GB per year.
Consider these guidelines when determining hard disk requirements for a server as well as database maintenance schedules.
Recommendations
These are general guidelines. FactoryTalk EnergyMetrix software is capable of running on a variety of hardware platforms.
The main scalability issue is related to processing of logged data (for example, report generation, trending). CPU speed,
number of CPUs, RAM, and RAID 5 for the database files are the main scalability factors (in that order). All hardware
platforms require the following:
• Processor, RAM and hard drive as noted below
• DVD drive
• One or more Ethernet network ports
• Internet access
• Monitor, keyboard, pointing device (mouse)
• Low-end Server
– Single 2 GHz Pentium 4
– 1…2 GB RAM
– 80 GB hard disk
• Mid-range Server
– 2 or 4 CPU 2 GHz Pentium 4 or better
– 2…4 GB RAM
– 160 GB hard disk (with separate disks for operating system and log files and RAID 5 for main database files
preferred)
• High-end Server
– High-end server requirements are very dependent upon the user's application requirements. Please contact
Rockwell Automation for assistance in specifying hardware for a high-end server.
Client Requirements
The following are the client requirements for compatibility with FactoryTalk EnergyMetrix software:
• Microsoft Windows XP Professional, Vista Professional, Windows 7 (Windows 2000 is not supported) operating
system.
• Internet Explorer 7, 8, or 9 web browser.
94 Rockwell Automation Publication IASIMP-QS016C-EN-P - October 2014
Page 95

FactoryTalk EnergyMetrix Software Installation Chapter 4
TIP
IMPORTANT
• Adobe Acrobat Reader 7.0 software or later is required to view reports.
• Microsoft .NET Framework 3.5 SP1 is required to use RT and Charts Plus options. .NET Framework 3.5 SP1 is
included on the installation DVD or can be downloaded at no charge from Microsoft.
Your client workstation must also be permitted Intranet, Internet or dial-in access to the FactoryTalk EnergyMetrix server.
Contact your IT support personnel for assistance.
Your browser should be set to check for newer versions of stored pages
automatically, not every visit to the page.
Installation (64-bit)
Perform the following steps while logged in as a Machine Administrator.
Configure Windows 2008 Server
Start with a clean Windows Server 2008 R2 SP1.
1. If it hasn’t launched automatically, launch Server Manager.
Wait until Server Manager has finished collecting data.
2. Right-click Roles and select Add Roles.
3. Click Next on Before You Begin page.
4. Select Application Server.
5. Click Add Required Features.
6. Click Next.
7. Click Next.
8. Click Web Services (IIS) Support.
9. Click Add Required Role Services.
Rockwell Automation Publication IASIMP-QS016C-EN-P - October 2014 95
Page 96

Chapter 4 FactoryTalk EnergyMetrix Software Installation
TIP
10. Click Next.
11. Click Next.
12. Scroll down in the Role Services window
and then select IIS 6 Management
Compatibility.
13. Click Next.
14. Click Install.
15. Wait while installation proceeds.
16. Click Close when done.
We recommend that you disable Internet Explorer Enhanced Security
Configuration.
17. To do this, locate the Configure IE ESC link in the Security section In the Server Manager.
18. Click the link, turn off IE ESC for Administrators, and then click OK.
Install SQL Server 2008 R2
Microsoft SQL Server 2008 R2 must be installed on the local server even if the FactoryTalk EnergyMetrix database is to be
hosted on another machine.
1. Insert disk into CD/DVD drive.
2. If necessary, run SETUP.EXE and click Yes to allow SQL Server 2008 R2 to install on the computer.
3. Review the documentation in the SQL Server Installation Center window.
4. Install the upgrade advisor if desired.
5. Click the Installation link in the menu.
6. Click the New installation or add features to an existing installation link.
7. Enter the product key and then click Next.
8. Accept the license terms and click Next
9. On the Setup Support Files page, click Install.
10. Wait while installation proceeds.
11. Make note of any issues or warnings listed in the Setup Support Rules page and take action as needed.
12. Click Next.
13. Select SQL Server Feature Installation.
96 Rockwell Automation Publication IASIMP-QS016C-EN-P - October 2014
Page 97

FactoryTalk EnergyMetrix Software Installation Chapter 4
IMPORTANT
14. Select the features shown as selected in the screen
capture.
15. Click Next.
16. Click Next.
17. Leave the Default instance selected, click Next.
18. On the Disk Space Requirements page, click Next.
19. On the Service Account dialog, Click Use the same
account for all SQL Server services.
20. Select NT AUTHORITY\SYSTEM in the dialog
and then click OK.
21. Click Next.
22. On the Database Engine Configuration page, select
Mixed Mode.
23. Enter a password.
Record the password in a safe location. You will need to enter it when you install FactoryTalk EnergyMetrix.
24. Click Add Current User.
Add additional users as administrators as desired.
25. Click Next.
26. Click Next.
27. Click Install.
28. Wait until installation completes.
29. Click Close.
30. Close the SQL Server Installation Center window.
31. Remove the SQL Server 2008 R2 installation DVD.
In SQL Server 2008 R2, TCP/IP network access is enabled by default.
Rockwell Automation Publication IASIMP-QS016C-EN-P - October 2014 97
Page 98

Chapter 4 FactoryTalk EnergyMetrix Software Installation
TIP
IMPORTANT
IMPORTANT
Enable 32-bit Applications
1. Using Internet Information Services (IIS)
Manager > Application Pools > DefautlAppPool
> Advanced Settings, set Enable 32-Bit
Applications to True.
2. Click OK.
Install FactoryTalk EnergyMetrix Software
Version 2.0
1. Insert the FactoryTalk EnergyMetrix installation DVD into the CD/DVD drive.
If needed, browse the DVD and launch Autorun.exe to access the installation menu. Perform the following steps from the
installation menu.
2. If needed, install Adobe Acrobat Reader (required for viewing reports on the server).
a. Click the Adobe Acrobat Reader link under Install Optional Software.
b. Select all defaults for a typical installation.
3. Install FactoryTalk Activation Manager.
a. Click the FactoryTalk Activation Manager link under Install Required Software.
b. Click Continue on the InstallShield Wizard screen.
c. When prompted, select No to installing the HASP USB dongle drivers.
d. Wait while prerequisite packages are installed.
e. On the FactoryTalk Activation Manager InstallShield Wizard, click Next.
f. Accept the terms of the license agreement, click Next.
g. Click Install.
h. When prompted, reboot the server.
4. Install RSLinx Classic Lite software version 2.57.
a. From the FactoryTalk EnergyMetrix installation menu, click RSLinx Lite 2.57.00.
b. Complete the steps to install RSLinx Classic Lite software.
c. After installation, RSLinx Classic starts as an application.
Refer to the RSLinx application notes section below for tips on using RSLinx Classic software on Windows 2008
Server R2.
Do not install Microsoft .NET Framework 3.5 SP1 on Windows Server 2008 R2 SP1. It is already installed with the
operating system.
FactoryTalk EnergyMetrix software does not require the installation of Internet Explorer WebControls 1.0.
98 Rockwell Automation Publication IASIMP-QS016C-EN-P - October 2014
Page 99

FactoryTalk EnergyMetrix Software Installation Chapter 4
TIP
TIP
IMPORTANT
5. Install FactoryTalk EnergyMetrix.
a. From the FactoryTalk EnergyMetrix installation menu, click FactoryTalk EnergyMetrix 2.00.00.
b. Locate the InstallShield Wizard.
It may be behind other windows on the desktop, click Next.
c. Click Yes to accept the EULA.
d. Enter the customer information, click Next.
e. Click Next.
f. Click Next.
g. Presuming a local installation of the SQL database, enter the server SQL login username and password that you
entered in step 2.v previously.
If the SQL server is hosted on a remote machine, enter the database server name and SQL authentication
credentials. Click Next.
h. Click Next.
i. Wait while FactoryTalk EnergyMetrix software is installed.
j. When complete, click Finish to reboot the server.
6. Install activations by using the FactoryTalk Activation Manager.
7. Add local machine user IIS_IUSRS with read and modify rights to the C:\Program Files (x86)\Rockwell
Software\FTEnergyMetrix\ChartFXNet folder.
8. Open Internet Explorer.
a. Browse to http://localhost/ftenergymetrix
.
b. Log in with username admin and password admin.
The RT and ChartsPlus options do not require specific security configuration in FactoryTalk EnergyMetrix software. They
run as Microsoft ClickOnce applications by default. You will need to grant permission for the options to run, but only one
time on each computer.
When you set up Devices such as power monitors and PLCs in FactoryTalk EnergyMetrix software, you will need to
access RSLinx Classic software running on the server to configure drivers and network addresses of devices. You access
the RSLinx Classic user interface to perform tasks such as configure drivers, monitor devices in RSWho, and set up OPC
topics.
Installation (32-bit)
See Installation (64-bit) on page 95 for instructions to install FactoryTalk
EnergyMetrix software on a 64-bit operating system.
Pre-installation Checks
1. Check out the server for required customer-provided software:
Rockwell Automation Publication IASIMP-QS016C-EN-P - October 2014 99
Page 100

Chapter 4 FactoryTalk EnergyMetrix Software Installation
IMPORTANT
IMPORTANT
• Windows 2003 R2 Server, set up in the Application Server role. ASPNET must be installed. Active Server Pages
must be enabled in Internet Information Services. Network COM+ Access must be enabled. The server can not
be set up as a Domain Server. FactoryTalk EnergyMetrix software installation on Windows 2000 Server is no
longer supported.
• SQL 2005 or 2008 Server, installed and set up for mixed mode authentication (SQL Server and Windows).
TCP/IP access must be enabled.
• If the SQL database server is hosted on a remote server, you must download from Microsoft (if necessary) and
install Microsoft SQL Server 2005 or 2008 Express Edition on the FactoryTalk EnergyMetrix server. This installs
the osql.exe application FactoryTalk EnergyMetrix software uses to connect to the remote database.
• IIS 6, 7, or 7.5 installed and enabled to run.
2. You must use a machine administrator login in Windows and have full administrator rights for SQL.
3. Ping all Ethernet devices (meters and/or controllers) the customer wishes to connect to.
• Correct communication to any meters that don't respond.
• Verify communication with Allen-Bradley Ethernet power monitors via their built-in web page.
Installation
1. Verify the Application Server role configuration in the host Windows Server operating system.
These are the minimum required components:
• ASPNET
• COM+ Services
• Internet Information Services (IIS), all options
Make any necessary changes before proceeding with the installation.
2. If not already installed, install Microsoft SQL Server 2005 or 2008 (NOT included in FactoryTalk EnergyMetrix
base software but 2008 is available as a bundled option).
SQL Server must be set up with mixed-mode authentication (Windows and SQL Server). You can make this selection
during initial installation or by using Enterprise Manager and editing the server properties, security tab after installation.
We recommend that you do not use the default system administrator login (username = ‘sa’, password = “”) due to known
security issues. Record the system administrator login credentials as you will be prompted to enter them when you install
FactoryTalk EnergyMetrix software. The same SQL database login will be required when the software is upgraded to a
new version eventually.
If the SQL Server is to be hosted on another computer, download (if needed) and install SQL Server 2005 or 2008 Express
Edition on the FactoryTalk EnergyMetrix server at this time.
3. Using Internet Information Services manager, verify that ASP.NET version 2.0 is selected in the default web page
properties.
If it is not, select ASP.NET version 2.0 and run IISRESET before installing the software.
4. Insert the FactoryTalk EnergyMetrix software installation DVD into the server’s DVD drive.
100 Rockwell Automation Publication IASIMP-QS016C-EN-P - October 2014
 Loading...