

Page 1

User's Guide User's Guide User's Guide User's Guide
Quantum Scalar
Quantum Scalari2000 Library
Scalar i2000
i2000 Library
6-00421-11
Page 2

Scalar i2000 User’s Guide, 6-00421-11, June 2007, Made in USA.
Quantum Corporation provides this publication “as is” without warranty of any kind, either express or implied,
including but not limited to the implied warranties of merchantability or fitness for a particular purpose. Quantum
Corporation may revise this publication from time to time without notice.
COPYRIGHT STATEMENT
Copyright 2007 by Quantum Corporation. All rights reserved.
Your right to copy this manual is limited by copyright law. Making copies or adaptations without prior written
authorization of Quantum Corporation is prohibited by law and constitutes a punishable violation of the law.
TRADEMARK STATEMENT
Quantum, ADIC, DLT, DLTtape, the Quantum logo, and the DLTtape logo are all registered trademarks of Quantum
Corporation.
SDLT and Super DLTtape are trademarks of Quantum Corporation.
Other trademarks may be mentioned herein which belong to other companies.
Page 3

Contents
Chapter 1 About This Guide and Your Product 1
Product Safety Statements................................................................................ 1
Mechanical Locks ....................................................................................... 2
Power Button on the Library’s Indicator Panel...................................... 2
Disposal of Electrical and Electronic Equipment.......................................... 3
Product Model Number.................................................................................... 3
Explanation of Symbols and Notes ................................................................. 4
Other Documents you Might Need................................................................. 4
Getting More Information or Help.................................................................. 5
Chapter 2 Troubleshooting Your Library 6
How Does the Library Report Issues? ............................................................ 7
Understanding Indicators on System Status Buttons............................ 9
Understanding E-mail Notifications...................................................... 10
Working With Tickets ..................................................................................... 12
Ticket Guidelines...................................................................................... 12
Displaying Ticket Lists ............................................................................ 16
Viewing Ticket Details .................................................................................... 21
Viewing History Ticket Details .............................................................. 25
Viewing Ticket Details Reports .............................................................. 26
Viewing Repair Pages .............................................................................. 30
Viewing Tape Alerts and Generating Media Integrity Analysis
Scalar i2000 User’s Guide iii
Page 4

Reports ................................................................................................ 31
Mailing, Saving, and Printing Ticket Information............................... 39
Running Verification Tests to Determine Issue Resolution................ 42
Closing Tickets .......................................................................................... 43
Generating the Tickets Report ................................................................45
Interpreting LEDs ............................................................................................ 51
Interpreting Blade Status LEDs .............................................................. 52
Interpreting Drive Status LEDs .............................................................. 56
Interpreting Fibre Port Link LEDs ........................................................ 59
I/O Blade Fibre Port Link LED............................................................... 62
Interpreting MCB Port LEDs................................................................... 64
Interpreting LBX Terminator LEDs........................................................ 66
Interpreting Power Supply LEDs ........................................................... 69
Working With Command History Logs ....................................................... 71
Viewing Command History Logs .......................................................... 72
Mailing and Saving Logs......................................................................... 75
Accessing Online Help.................................................................................... 76
Chapter 3 Description 77
Library Features ...............................................................................................79
Density........................................................................................................ 79
Centralized Management ........................................................................80
Proactive Availability............................................................................... 80
Serviceability and Reliability .................................................................. 80
Data Path Conditioning ........................................................................... 80
SAN Backup .............................................................................................. 81
Host Attachment....................................................................................... 81
Remote Management ...............................................................................82
Capacity on Demand................................................................................ 82
Control Module................................................................................................ 83
Expansion Modules ......................................................................................... 84
Library Management Module ........................................................................ 86
Management Control Blade .................................................................... 87
Robotics Control Unit............................................................................... 87
Library Motor Driver ............................................................................... 87
I/O Management Units................................................................................... 87
Control Management Blade .................................................................... 88
FC I/O Blades............................................................................................ 88
Cartridge Accessor........................................................................................... 89
Import/Export Stations................................................................................... 89
Cartridges.......................................................................................................... 91
Scalar i2000 User’s Guide iv
Page 5

Cartridge Magazines ....................................................................................... 92
Support for WORM ......................................................................................... 93
Tape Drives....................................................................................................... 94
LTO Drives................................................................................................. 96
DLT Drives.................................................................................................97
Mixed Media Support and Rules................................................................... 97
Operator Panel................................................................................................100
Power System .................................................................................................101
Chapter 4 Configuring Your Library 102
Running the Setup Wizard ........................................................................... 103
Enabling Licenses........................................................................................... 104
Working With Partitions............................................................................... 106
Understanding Partition Media Policy Settings................................. 107
Creating Partitions.................................................................................. 111
Modifying Partitions .............................................................................. 119
Deleting Partitions .................................................................................. 126
Setting Up the Network Configuration ...................................................... 127
Managing Connectivity................................................................................. 129
Port Configuration.................................................................................. 129
FC Host Port Failover............................................................................. 132
Setting Up Policies for the Physical Library...............................................136
Specifying the Date and Time ...................................................................... 138
Configuring E-mail ........................................................................................ 140
Setting Up E-mail Notifications ................................................................... 142
Configuring Devices...................................................................................... 147
Device IDs................................................................................................ 148
Channel Zoning ......................................................................................150
SCSI Host ................................................................................................. 152
FC Host..................................................................................................... 157
Generating the LUN Mapping Report................................................. 173
Generating the Library Configuration Report.................................... 177
Configuring Drive Cleaning......................................................................... 179
Registering SNMP Traps............................................................................... 184
Registering an Application.................................................................... 184
Removing an Application’s Trap Registration...................................185
Configuring Library Security ....................................................................... 186
Accessing the Security Configuration Dialog Box ............................. 186
Configuring Access for Network Services .......................................... 187
Configuring Access for Remote LMC Clients .................................... 189
Configuring Access for SNMP and SMI-S ..........................................191
Scalar i2000 User’s Guide v
Page 6

Using LDAP....................................................................................................192
Configuring LDAP .................................................................................194
Configuring Screen Saver Preferences........................................................195
Working With Data Path Conditioning...................................................... 198
Configuring Datapath Conditioning ...................................................198
Installing the Host Registration Service .............................................. 201
Chapter 5 Maintaining Your Library 203
Monitoring the Library .................................................................................204
Monitoring System Status ..................................................................... 205
Monitoring Drive Status ........................................................................ 208
Monitoring Connectivity Status ........................................................... 209
Monitoring I/E Station Status............................................................... 214
Monitoring Slot Status ........................................................................... 216
Monitoring Media Status.......................................................................219
Monitoring Sensor Status ...................................................................... 221
Monitoring Users Status ........................................................................ 227
Monitoring Partitions Status ................................................................. 228
Mailing, Saving, and Printing Status Information............................. 230
Maintenance Actions ..................................................................................... 232
Is the Access Door Closed?.................................................................... 233
Is a Cartridge Old?..................................................................................233
Using Library Explorer .......................................................................... 234
Configuring and Testing Drives........................................................... 238
Working With Connectivity.................................................................. 248
Capturing Snapshots.............................................................................. 250
Teaching the Library (Configuration and Calibration)..................... 253
Saving and Restoring Library Configuration ..................................... 256
Viewing the Drive Resource Utilization Reports...............................265
Setting Up Advanced Reporting Options ........................................... 269
Working With Verification Tests.......................................................... 275
Using the Partitions Defragmentation Tool........................................ 328
Removing Lodged Cartridges...............................................................332
Maintaining the Air Filters.................................................................... 333
Scalar i2000 User’s Guide vi
Page 7

Chapter 6 Running Your Library 337
Logging On and Off....................................................................................... 338
Logging On From the Touch Screen (Local Client) ...........................338
Logging Off From the Touch Screen (Local Client)........................... 340
Logging On From the LMC Applet (Web Browser).......................... 340
Logging Off From the LMC Applet (Web Browser).......................... 342
Logging On From a Remote Client ...................................................... 342
Logging Off From a Remote Client...................................................... 345
Connecting to Multiple Libraries................................................................. 345
Operator Panel................................................................................................347
Indicator Panel ........................................................................................ 348
Library Management Console (LMC)......................................................... 349
Menus ....................................................................................................... 352
Toolbar ..................................................................................................... 361
Reading the Library Information Panel............................................... 362
System Status Buttons ............................................................................ 364
Understanding Location Coordinates......................................................... 366
Cartridge Locations ................................................................................ 366
Tape Drive Locations .............................................................................373
I/O Blade Locations ............................................................................... 376
Viewing the Library (Physical or Partition) ............................................... 378
Displaying the Physical Library or a Partition ................................... 378
Managing Library Views....................................................................... 378
Changing the Library’s State........................................................................ 380
Working With Local User Accounts............................................................383
Creating Local User Accounts .............................................................. 383
Deleting Local User Accounts............................................................... 391
Viewing Local User Account Permissions .......................................... 391
Shutting Down/Rebooting the Library......................................................393
.Powering Off the Library............................................................................. 394
Powering On the Library .............................................................................. 395
Locking/Unlocking the I/E Station ............................................................395
When Robotics Are Not Ready.................................................................... 397
Chapter 7 Working With Cartridges and Barcodes 400
Handling Cartridges Properly .....................................................................401
Write-Protecting Cartridges ......................................................................... 402
Barcode Requirements ..................................................................................403
Installing Barcode Labels.............................................................................. 405
Using Cleaning Cartridges ........................................................................... 406
Scalar i2000 User’s Guide vii
Page 8

Managing Media ............................................................................................ 407
Importing Cartridges Into Partitions ...................................................408
Exporting Cartridges From Partitions ................................................. 410
Loading Drives........................................................................................411
Unloading Drives.................................................................................... 413
Moving Media......................................................................................... 415
Inventory.................................................................................................. 416
Installing a Remote Client............................................................................. 426
Installing the Client on a Windows System........................................ 426
Installing the Client on a UNIX System............................................... 427
Launching the Remote Client ............................................................... 429
Launching a Windows Client ............................................................... 429
Launching a UNIX Client ...................................................................... 430
Scalar i2000 User’s Guide viii
Page 9

Tables
Table 1 Severity Levels Assigned to Tickets ......................................... 8
Table 2 Report Criteria............................................................................ 36
Table 3 Tickets Report Criteria Options ............................................... 46
Table 4 Explanations of Blade Status LED States................................ 54
Table 5 Blade Status LED States - Normal Conditions...................... 55
Table 6 Drive Sled Status LED States (UDS-2 and UDS-3) ................ 58
Table 7 Drive Sled Status LED States - Normal Conditions.............. 59
Table 8 Fibre Drive Sled Link LED States (UDS-2)............................. 60
Table 9 Fibre Drive Sled Link LED States (UDS-3)............................. 61
Table 10 I/O Blade Link LED States ....................................................... 63
Table 11 Explanations of MCB Ethernet Port LED States .................... 65
Table 12 LBX LED Version 01 ................................................................. 67
Table 13 LBX LED Version 03 .................................................................. 69
Table 14 Explanation of Power Supply LED States .............................. 70
Table 15 Cartridge Capacities in Library Modules ............................... 93
Table 16 LTO Drive and Cartridge Compatibility................................ 96
Table 17 DLT Drive and Cartridge Compatibility ................................ 97
Scalar i2000 User’s Guide ix
Page 10

Table 18 Sampling of Media Type Identifiers...................................... 109
Table 19 Return Media Identifier Behavior Example ......................... 111
Table 20 FC I/O Blade Port Settings ..................................................... 131
Table 21 Severity Levels Assigned to Issues ........................................ 142
Table 22 Show Details.............................................................................. 163
Table 23 Descriptors ................................................................................ 164
Table 24 Test Results................................................................................ 283
Table 25 Robotics Enabled Indicator.................................................. 348
Table 26 Status Indicator ....................................................................... 349
Table 27 Power Indicator........................................................................ 349
Table 28 Menu Commands: Privileges and Environments................354
Table 29 Areas on the Library Information Panel ............................... 363
Table 30 Subsystems and Their Components ...................................... 364
Table 31 Drive Location Coordinates.................................................... 374
Table 32 Blade Location Coordinates.................................................... 378
Table 33 Library Functions Requiring Online or Offline State.......... 382
Table 34 Menu Commands When Robotics Are Disabled................ 397
Scalar i2000 User’s Guide x
Page 11

Figures
Figure 1 Status Indicator ........................................................................... 7
Figure 2 Locations and Colors of Blade Status LEDs ........................... 52
Figure 3 Rear View of Fibre Channel Drive Sled (UDS-2)................... 56
Figure 4 Rear View of Fibre Channel Drive Sled (UDS-3)................... 57
Figure 5 Locations - Colors of I/O Blade Fibre Port Link LEDs......... 62
Figure 6 Locations - Colors of MCB Ethernet Port LEDs..................... 64
Figure 7 Locations - Colors MCB FC / SCSI Port LEDs ...................... 66
Figure 8 Locations of LBX Terminator LEDs (Version 01) .................. 67
Figure 9 Locations of LBX Terminator LEDs (Version 03) .................. 68
Figure 10 Locations and Colors of Power Supply LEDs........................ 70
Figure 11 Front View of a Control Module and Expansion Module ... 78
Figure 12 Front and Back View of the Control Module......................... 84
Figure 13 Expansion Module ..................................................................... 85
Figure 14 Library Management Module Boards..................................... 86
Figure 15 I/O Management Unit .............................................................. 88
Figure 16 Example of LTO Cartridge Insertion into a Magazine ......... 91
Figure 17 Magazine and Drive Locations in the Control Module........ 92
Scalar i2000 User’s Guide xi
Page 12

Figure 18 Magazine Installation Order..................................................... 99
Figure 19 Operator Panel..........................................................................100
Figure 20 Verification Tests Dialog Box ................................................. 279
Figure 21 Report Window ........................................................................285
Figure 22 Joint Alignments Graphical Report ....................................... 287
Figure 23 Vertical Alignments Graphical Report.................................. 289
Figure 24 Horizontal Alignments Graphical Report ............................291
Figure 25 Calibration Offsets Graphical Report .................................... 293
Figure 26 Boundary/Accessibility Graphical Report........................... 295
Figure 27 Get/Put Graphical Report ...................................................... 297
Figure 28 Scan Fiducials Graphical Report ............................................ 299
Figure 29 Picker Pivot/Reach Graphical Report................................... 301
Figure 30 Example Test Log Output.......................................................303
Figure 31 Top and Bottom Air Filters ..................................................... 333
Figure 32 Library Op Panel ......................................................................347
Figure 33 LMC (Local Touch Screen - Physical Library View) ........... 351
Figure 34 LMC (Remote Client With Partition View Shown) ............. 352
Figure 35 LMC (Remote Client With Partition View Shown) ............. 362
Figure 36 System Status Buttons in Good Status .................................. 364
Figure 37 Status Buttons - Drives and Robotics Issues.......................365
Figure 38 Aisle, Module, and Rack Numbering Locations.................. 367
Figure 39 Section, Column, and Row Numbering for Rack 1 - LTO
Cartridges368
Figure 40 Section, Column, and Row Numbering for Rack 2 - LTO
Cartridges370
Figure 41 Example Location Coordinates .............................................. 372
Figure 42 Coordinates in Load Drives Dialog......................................373
Figure 43 Location Coordinates for Drives ............................................ 374
Figure 44 Drive-side Location Coordinates ........................................... 375
Figure 45 I/O Blade Location Coordinates............................................376
Scalar i2000 User’s Guide xii
Page 13

Figure 46 I/O Management Unit Blade Numbering............................ 377
Figure 47 Write-protect Switch on an LTO-1 Cartridge.......................403
Figure 48 Applying Barcode Labels to Cartridges................................406
Scalar i2000 User’s Guide xiii
Page 14
Chapter 1
CAUTION
1About This Guide and Your
Product
This guide contains information and instructions necessary for the
normal operation and management of the Scalar
guide is intended for system administrators, operators, or anyone
interested in learning about or using the Scalar i2000 library after its
initial installation and configuration. Be aware that you must have
administrator privileges to use many of the features that this guide
describes.
Product Safety Statements
This product is designed for data storage and retrieval using magnetic
tape. Any other application is not considered the intended use. ADIC will
not be held liable for damage arising from unauthorized use of the
product. The user assumes all risk in this aspect.
®
i2000 library. This
Be sure to read all operating instructions in this
manual and in the System, Safety, and Regulatory
Information Guide before operating this product.
This unit is engineered and manufactured to meet all safety and
regulatory requirements. Be aware that improper use may result in
Scalar i2000 User’s Guide 1
Page 15
Chapter 1 About This Guide and Your Product
CAUTION
WARNING
Note
WARNING
Product Safety Statements
bodily injury, damage to the equipment, or interference with other
equipment.
Be sure to read all operating instructions in this
manual and in the System, Safety, and Regulatory
Information Guide before operating this product.
BEFORE POWERING ON OR USING THIS
EQUIPMENT, READ THE SYSTEM, SAFETY,
AND REGULATORY INFORMATION GUIDE.
KEEP THE GUIDE FOR FUTURE REFERENCE.
WHEN DRIVE SLED POSITIONS ARE EMPTY,
DRIVE COVER PLATES MUST BE INSTALLED
AND IN PLACE AT ALL TIMES TO PREVENT
ACCESS INTO THE EMPTY DRIVE SLED
POSITIONS.
Mechanical Locks 1
The access and service doors can only be opened with a key. The key
should be kept by an authorized person at your company. Access to the
interior of the library is both a data-integrity and safety issue.
Power Button on the Library’s Indicator Panel1
Switching off the Power button on the indicator panel, located on the
front of the library, removes power from the electronics, which causes the
picker to stop immediately. This button also removes power from the
drives.
THIS POWER BUTTON FUNCTIONS AS A
POWER INTERRUPT ONLY. TO COMPLETELY
REMOVE ALL POWER BEFORE SERVICING
OR IN AN EMERGENCY, TURN OFF THE
CIRCUIT BREAKER ON THE POWER
DISTRIBUTION UNIT, AND THEN
DISCONNECT THE POWER CORD FROM THE
ELECTRICAL SOURCE.
Scalar i2000 User’s Guide 2
Page 16

Chapter 1 About This Guide and Your Product
Disposal of Electrical and Electronic Equipment
Disposal of Electrical and Electronic Equipment
THIS SYMBOL ON THE PRODUCT OR ON ITS PACKAGING INDICATES
THAT THIS PRODUCT SHOULD NOT BE DISPOSED OF WITH YOUR
OTHER WASTE. INSTEAD, IT SHOULD BE HANDED OVER TO A
DESIGNATED COLLECTION POINT FOR THE RECYCLING OF
ELECTRICAL AND ELECTRONIC EQUIPMENT. THE SEPARATE
COLLECTION AND RECYCLING OF YOUR WASTE EQUIPMENT AT THE
TIME OF DISPOSAL WILL HELP TO CONSERVE NATURAL RESOURCES
AND ENSURE THAT IT IS RECYCLED IN A MANNER THAT PROTECTS
HUMAN HEALTH AND THE ENVIRONMENT. FOR MORE INFORMATION
ABOUT WHERE YOU CAN DROP OFF YOUR WASTE EQUIPMENT FOR
RECYCLING, PLEASE VISIT OUR WEBSITE AT: HTTP://
QCARE.QUANTUM.COM OR CONTACT YOUR LOCAL GOVERNMENT
AUTHORITY, YOUR HOUSEHOLD WASTE DISPOSAL SERVICE OR THE
BUSINESS FROM WHICH YOU PURCHASED THE PRODUCT.
Product Model Number
The Scalar i2000 model number is as follows: SCi2000.
Scalar i2000 User’s Guide 3
Page 17

Explanation of Symbols and Notes
WARNING
CAUTION
Note
The following symbols appear throughout this document to highlight
important information.
INDICATES A POTENTIALLY HAZARDOUS
SITUATION WHICH, IF NOT AVOIDED,
COULD RESULT IN DEATH OR BODILY
INJURY.
Indicates a situation that may cause possible
damage to equipment, loss of data, or
interference with other equipment.
Chapter 1 About This Guide and Your Product
Explanation of Symbols and Notes
Indicates important information that helps you
make better use of your system.
Other Documents you Might Need
The following documents are also available for this product. These
documents can be found on the product CD or at www.quantum.com/
support.
• Scalar i2000 Planning Guide (6-00418-xx)
• Scalar i2000 User’s Guide (6-00421-xx)
• Scalar i2000 Maintenance Guide (6-00422-xx)
• ADIC Management Console User’s Guide (6-00064-xx)
Scalar i2000 User’s Guide 4
Page 18

• Scalar i2000 Unpacking Instructions (6-00771-xx)
Note
• System, Safety, and Regulatory Information Guide (6-00618-xx)
Release Notes are also available for this product.
The Release Notes describe changes to your system
or firmware since the last release, provide
compatibility information, and discuss any known
issues and workarounds. The Release Notes can be
found in the product box or at
www.quantum.com/support
Getting More Information or Help
More information about this product is available on the Service and
Support website at
Support Website contains a collection of information, including answers
to frequently asked questions (FAQs). You can also access software,
firmware, and drivers through this site.
www.quantum.com/support. The Service and
Chapter 1 About This Guide and Your Product
Getting More Information or Help
For further assistance, or if training is desired, contact Quantum:
For additional contact information: www.quantum.com/support
To open a Service Request: www.quantum.com/esupport
Scalar i2000 User’s Guide 5
Page 19

Chapter 2
2Troubleshooting Your Library
This chapter describes how the library informs you of issues that it
detects within its subsystems. It also provides information about working
with tickets to resolve issues, running verifications tests to check whether
they have been resolved, interpreting LEDs, viewing command history
logs, and accessing Online Help.
This chapter consists of the following sections:
• How Does the Library Report Issues? on page 7
• Working With Tickets on page 12
• Viewing Tape Alerts and Generating Media Integrity Analysis
Reports on page 31
• Generating Media Integrity Analysis Reports on page 34
• Saving a Report Template on page 39
• Generating the Tickets Report on page 45
• Interpreting LEDs on page 51
• Interpreting LBX Terminator LEDs on page 66
• Working With Command History Logs on page 71
• Accessing Online Help on page 76
Scalar i2000 User’s Guide 6
Page 20
How Does the Library Report Issues?
Status indicator
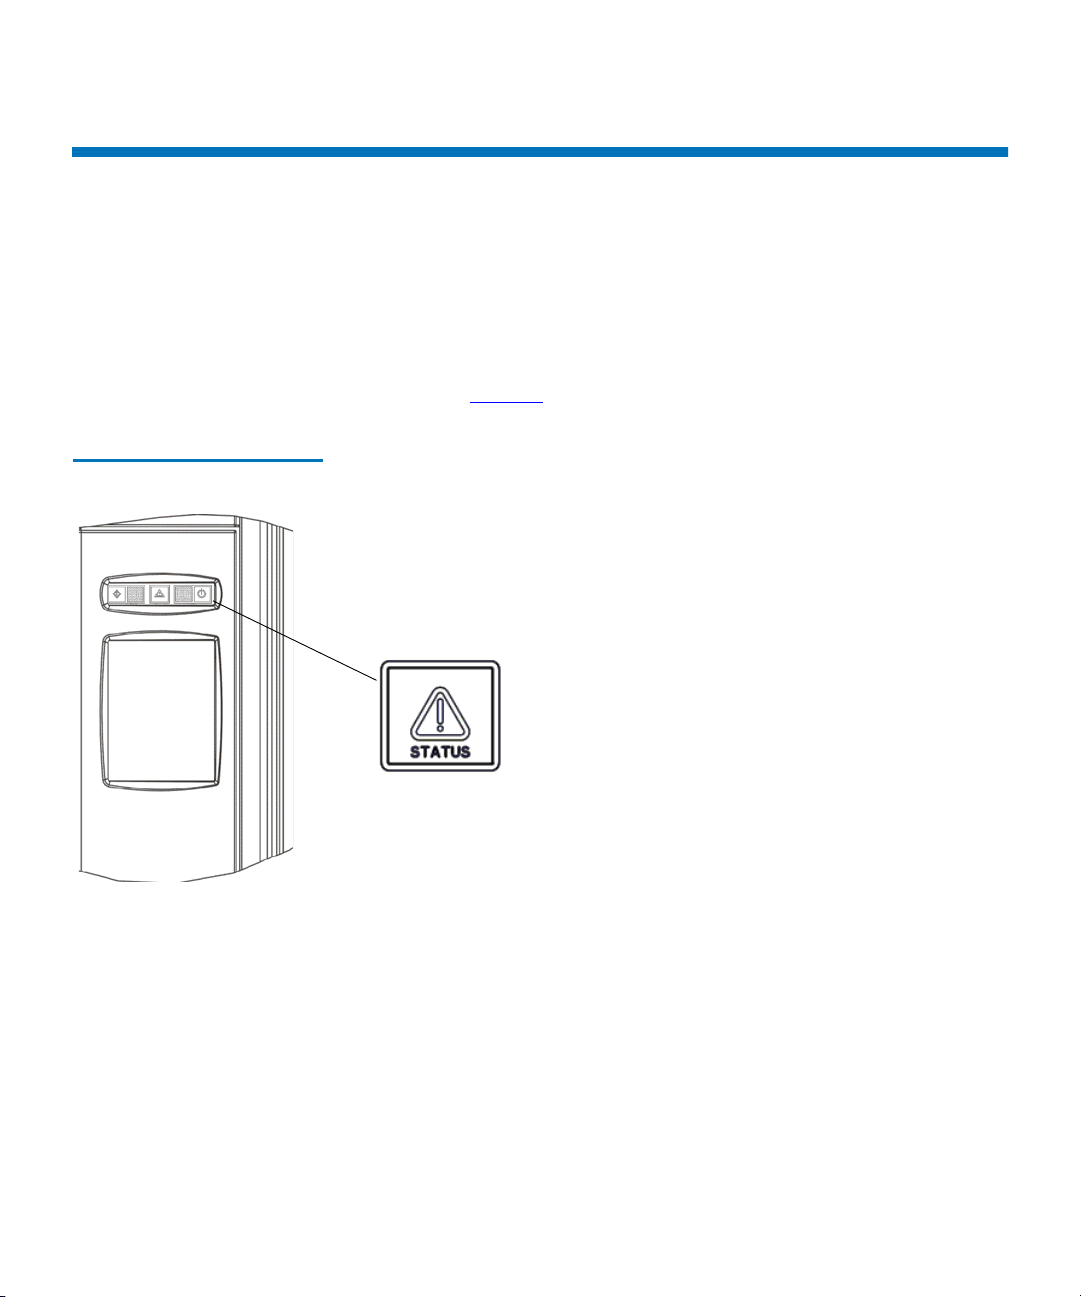
The library has advanced problem detection, reporting, and notification
functionality. The library has many processors and sensors that monitor
conditions and operations, such as temperatures, voltages, current,
calibrations, firmware versions, and so forth.
The first indication of issues is the status indicator on the indicator panel,
as shown in
Figure 1 Status Indicator
Figure 1.
Chapter 2 Troubleshooting Your Library
How Does the Library Report Issues?
•If the Status indicator light is solid green, the library currently has no
tickets in an Open state.
•If the Status indicator light is flashing amber, at least one of the six
subsystems has a ticket in an Open state.
When the library detects an issue, it creates a ticket for it. A ticket
includes the following types of information:
• Details about the issue
• Reports that are associated with the ticket
Scalar i2000 User’s Guide 7
Page 21

Chapter 2 Troubleshooting Your Library
Note
How Does the Library Report Issues?
• A repair page that provides corrective actions
In most cases, tickets isolate field replaceable units (FRUs) that you must
service or replace.
Tickets can indicate failures or other serious
problems, but they also can indicate warning
conditions that you should investigate or other
helpful information. For example, opening the
library’s access door or changing the library’s
configuration causes the library to create a ticket,
but these situations would not indicate serious
problems. However, you should investigate the
tickets.
The library assigns a severity level to each ticket that it creates, and it
notifies users of the ticket.
Table 1 describes possible severity levels for
tickets.
Table 1 Severity Levels
Assigned to Tickets
Severity Level Description
1 (Failed) Indicates that a failure has occurred or a different serious condition exists within a
library subsystem that requires immediate corrective action. In most cases, a
hardware component is no longer functioning at an acceptable level or has failed.
Typical library operations are either impossible or highly unreliable.
Examples of failure situations include a FRU that is not functioning, a temperature
threshold that has been reached that causes unreliable operations, or a partition that
the library has automatically taken offline.
2 (Degraded) Indicates that a degraded condition exists within a library subsystem that impacts
system performance or redundancy. Typical library operations can continue
without immediate corrective action, but an administrator should investigate the
condition and correct the problem soon.
Examples of degraded situations include a redundant power supply that has failed
or a connectivity problem that has caused host port failover to occur.
Scalar i2000 User’s Guide 8
Page 22
Chapter 2 Troubleshooting Your Library
How Does the Library Report Issues?
Table 1 Severity Levels
Assigned to Tickets
Severity Level Description
3 (Warning) Indicates that a condition exists within a library subsystem that has little effect on
system operations. Typical library operations can continue without immediate
corrective action, but you should investigate the condition and correct the problem
when possible. Warnings also can provide helpful information, such as indicating
that a door is open.
Examples of warning situations include a FRU that is functioning less reliably or a
temperature threshold that has been reached that does not affect reliable operations.
The library has two ways of notifying users that it has discovered issues
and has created tickets for them:
• Status indicators on Library Management Console (LMC) system
status buttons
• E-mail notifications
Understanding Indicators on System Status Buttons 2
System status buttons are located in the Overall System Status area at the
bottom of the LMC display. Each button displays a status indicator for
the library subsystem it represents. For more information about the
buttons, see
System Status Buttons on page 364. When the library creates
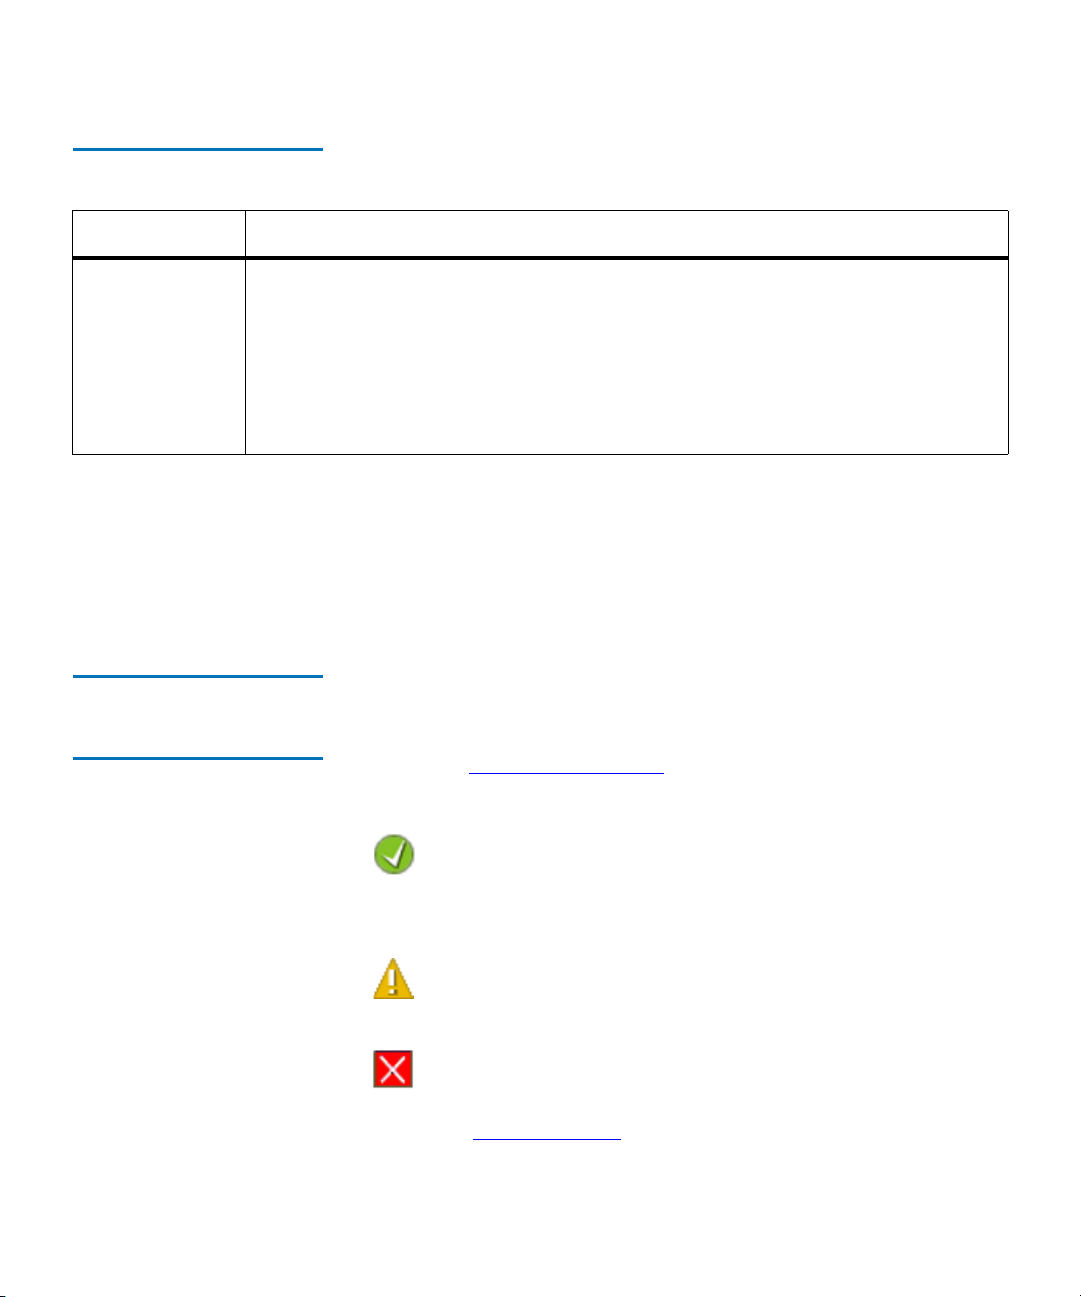
a ticket, the status indicator button for the affected subsystem
automatically changes from the following icon:
Good (green)
to one of the following icons:
Warning or Degraded
(yellow)
Failed (flashing red)
The meanings of these status indicators correspond to the severity levels
described in
table 1 on page 8. If a system status button indicates
anything other than a Good state, clicking it displays a list of open tickets
Scalar i2000 User’s Guide 9
Page 23

Chapter 2 Troubleshooting Your Library
Note
How Does the Library Report Issues?
for the subsystem. To access tickets by using the system status buttons,
see
Working With Tickets on page 12.
Understanding E-mail
Notifications 2
The library collects status information on its components and, if the
appropriate e-mail notifications have been set up in the LMC, the library
can send notifications whenever tickets with severity levels 1, 2, or 3 are
created. For information about severity levels, see
table 1 on page 8. The
library assigns a severity level to each ticket it creates. If the ticket’s
severity level matches one of an e-mail address’ severity codes (as set up
in e-mail notifications), the library sends a notification to that particular
e-mail address. The library also sends a notification if a ticket’s severity
level escalates to a more severe level. The library does not send one when
an ticket’s severity level becomes less severe.
By default, the only e-mail address to which the library sends e-mail
notifications (severity level 1 issues only) is techsup@quantum.com
(Quantum technical support). To set up other e-mail addresses to receive
notifications, see
Configuring E-mail on page 140 and Setting Up E-mail
Notifications on page 142.
Even though you can remove the Quantum
technical support e-mail address so that Quantum
does not receive severity level 1 notifications,
Quantum recommends that you do not remove it.
Also, do not include the Quantum technical
support e-mail address for severity level 2 or 3
notifications.
The subject line of the e-mail notification indicates “Scalar i2000,” the
library’s serial number, and the severity level of the ticket. The body of
the message states that the library sent the message automatically. The
message body also includes the following information, which provides
details about the ticket and library conditions at the time of the event:
• Ticket summary
• Ticket details, including status information
• Firmware versions, including MCB, RCU, CMB, and drive bricks
• Physical library configuration
Scalar i2000 User’s Guide 10
Page 24

Chapter 2 Troubleshooting Your Library
Note
How Does the Library Report Issues?
• Library states, such as physical library online or offline, partitions
online or offline, or robotics enabled or disabled
• Time stamps of recent activity
• Report summary
• Report details for the ticket
The notification also includes a repair page attachment. This page
provides a problem description and corrective actions you or a customer
service engineer (CSE) can perform. For more information about repair
pages, see
Viewing Repair Pages on page 30.
A notification e-mail contains helpful information
about a ticket and how to resolve it. However, the
notification represents a condition that existed at a
certain time in the past. The notification might not
reflect the current situation. The notification
indicates a specific ticket ID, so you should find
and examine that specific ticket in the LMC. The
ticket reflects the real-time status of the issue. For
more information about accessing tickets, see
Working With Tickets on page 12.
Scalar i2000 User’s Guide 11
Page 25

Working With Tickets
Tickets are your primary troubleshooting tool when you experience
problems with the library. A ticket provides details and reports about the
issue and library conditions at the time of the event. It also provides
guidance on how to resolve the issue. If you are an administrator or a
service representative, you can access the tickets through the LMC. This
section explains how to display ticket lists, view ticket and report details,
view repair pages, and resolve and close tickets.
To help you quickly troubleshoot an issue by using tickets, read the
Ticket Guidelines 2
following guidelines.
What is the issue and its cause? 2
You became aware of a library issue because either the library sent an
e-mail notification, an LMC system status button indicated a subsystem
status of Warning, Degraded, or Failed, or a backup/archive software
application indicated a problem. Tickets include details about the issue
and library conditions at the time of the event. They also include reports,
any history tickets that the library has created in the past for the same
FRU, and a repair page that provides a detailed description of the issue
and its possible causes. The repair page also provides corrective actions
that you or a CSE can perform. To use a ticket to determine an issue and
its cause, you can perform the following general steps:
Chapter 2 Troubleshooting Your Library
Working With Tickets
1 Display a list of tickets (see Displaying Ticket Lists on page 16).
2 View the details for the appropriate ticket (see Viewing Ticket Details
on page 21).
3 View the reports that are associated with this ticket (see Viewing
Ticket Details Reports on page 26.
4 View the ticket’s repair page (see Viewing Repair Pages on page 30).
Scalar i2000 User’s Guide 12
Page 26

Chapter 2 Troubleshooting Your Library
Working With Tickets
Where did the issue occur in the library? 2
The Status Group field on the Details tab of the Ticket Details dialog
box indicates the library subsystem that caused the ticket. For more
information about the Details tab, see
Viewing Ticket Details on page 21
The FRU ID field on the Report tab of the Ticket Details dialog box
indicates the type of FRU that is affected, and the FRU Instance field
indicates the specific FRU by its location in the library. For more
information about the Report tab, see
Viewing Ticket Details Reports on
page 26.
When did the issue first occur? 2
The Posted field on the Details tab of the Ticket Details dialog box
indicates the date and time on which the library first reported the issue
and created a ticket for it. For more information about the Details tab, see
Viewing Ticket Details on page 21.
Has the issue occurred repeatedly? 2
The Duplicates field on the Details tab of the Ticket Details dialog box
indicates how many times the library has reported the same issue while
the ticket has been open. In addition, you can determine whether the
same issue has occurred and been resolved in the past. The FRU History
List area on the Details tab lists tickets that have been opened for the
same FRU in the past, but have been resolved and are now in the Closed
or Verified state. By selecting a history ticket and then clicking Show, you
can investigate the ticket history of a particular FRU. For more
information about the Details tab and viewing history tickets, see
Viewing Ticket Details on page 21.
Has the FRU been replaced before? 2
You can determine whether a specific FRU has been replaced in the past
by examining the FRU SN field on the Details tab of the Ticket Details
dialog box for the open ticket and the history tickets. Because the history
tickets associated with an open ticket are for the same specific instance of
a FRU, and because a FRU instance is identified by its location in the
library, the FRU serial number, which is uniquely assigned to each FRU,
will change if the unit has been replaced in the past. For more
Scalar i2000 User’s Guide 13
Page 27

Chapter 2 Troubleshooting Your Library
Working With Tickets
information about the Details tab and viewing history tickets, see
Viewing Ticket Details on page 21.
How do I resolve the issue? 2
The repair page provides comprehensive, step-by-step procedures for
resolving the issue. Both user and CSE procedures are provided. When
the procedures require a CSE to perform them, contact technical support.
For more information, see
Viewing Repair Pages on page 30.
How can I know whether the issue is resolved? 2
Some issues require you to determine whether they are resolved and
others the library will detect automatically.
• In some cases, the library can automatically detect that an issue is
resolved (for example, an open door that is now shut). For these, the
library automatically transitions the ticket to the Verified state.
• In other cases, the library cannot automatically detect that an issue is
resolved (for example, a faulty tape cartridge). You must determine
whether the issue is resolved by running a verification test or, if an
applicable test does not exist, by following the repair page
instructions. If you run a test and the results are all good, the library
automatically transitions the ticket to the Verified state. If you cannot
run a test, you should physically examine the FRU, and then
manually transition the ticket to the Closed state after determining
that the issue is resolved. After you close the ticket, the library
transitions it to the Verified state if it is able to do so. For more
information, see
Running Verification Tests to Determine Issue
Resolution on page 42 and Closing Tickets on page 43.
The library reopens tickets that receive failed, degraded, or warning
reports within 30 minutes of transitioning to the Closed or Verified state.
If a Closed or Verified ticket remains free of failed, degraded, or warning
reports for 30 minutes, the library locks them from transitioning back to
the Open state. A failed, degraded, or warning report that is received
beyond 30 minutes causes the library to open a new ticket.
Scalar i2000 User’s Guide 14
Page 28

Chapter 2 Troubleshooting Your Library
Working With Tickets
What do I do if I cannot resolve the issue? 2
Contact Quantum technical support. See Getting More Information or
Help on page 5. Technical support personnel might ask you to send them
an electronic copy of the ticket. For instructions, see Mailing, Saving, and
Printing Ticket Information on page 39.
How do I view the number of tickets that occurred in a certain time
range?
The Tickets Report lets you see how many tickets occurred in a particular
time period. You can choose to group tickets by subsystem, module, or
FRU, and the results can be presented as a rollup summary or as a trend
so you can see if the number of issues is increasing or decreasing over
time. Also, the report results can be presented in different chart formats,
such as bar graphs or pie charts. For more information, see
Generating
the Tickets Report on page 45.
2
Scalar i2000 User’s Guide 15
Page 29

Chapter 2 Troubleshooting Your Library
Working With Tickets
Displaying Ticket Lists 2
The LMC provides three ways to display ticket lists:
• By clicking a system status button that indicates a Warning,
Degraded, or Failed state
This option displays a list of open tickets for the associated subsystem.
See
Using System Status Buttons to Display Ticket Lists on page 16.
• By clicking Tools→ Tickets
This option displays the Tickets dialog box from which you can obtain a
list of all tickets or a partial list of tickets according to selection criteria.
See
Using the Tickets Command or the Tickets Button to Display Ticket
Lists on page 19.
• By clicking the Tickets button on the toolbar
This option displays the same Tickets dialog box as the Tools→ Tickets
command does. See
Using the Tickets Command or the Tickets Button to
Display Ticket Lists on page 19.
From the ticket list, you can select a ticket to view ticket details,
associated reports, and a repair page.
Using System Status Buttons to Display Ticket Lists 2
To display a list of tickets by using a system status button, the button
must indicate a Warning, Degraded, or Failed state. Clicking a system
status button that indicates a Good state either displays a list of
subsystem tickets that are in Closed or Verified states or informs you that
no tickets exist for the subsystem.
1 Click the system status button that corresponds with the subsystem
for which you want to display a list of open tickets.
Scalar i2000 User’s Guide 16
Page 30
Chapter 2 Troubleshooting Your Library
Working With Tickets
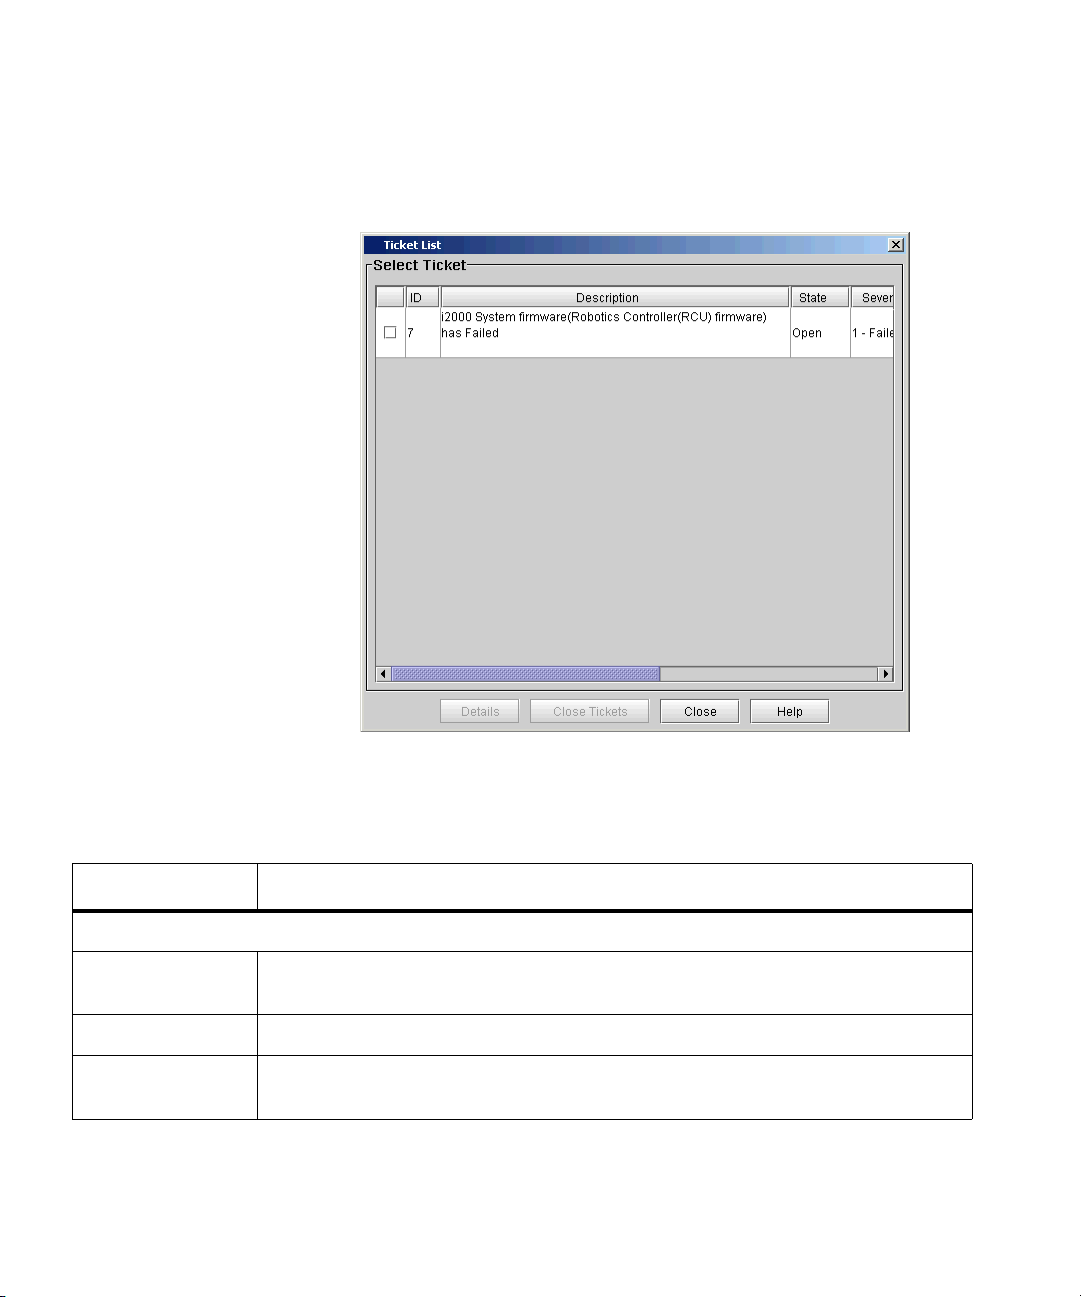
The Ticket List dialog box appears with a list of open tickets for the
subsystem.
The following table describes the elements on the Ticket List dialog box.
Element Description
In the Select Ticket area:
Check Box To close multiple tickets, select each ticket you want to close by clicking the
check box.
ID The library-assigned identifier for the ticket.
Description A summary description of the ticket. The description identifies the FRU that
caused the ticket and includes reason text that describes the cause of the ticket.
Scalar i2000 User’s Guide 17
Page 31

Chapter 2 Troubleshooting Your Library
Working With Tickets
Element Description
State The current state of the ticket. Possible states are:
Open — indicates that an issue, whether problem or warning condition, has
occurred in the library that requires attention
Closed — indicates that a user has closed the issue
Verified — indicates that the library has successful operational results or
positive data that verifies that the problem is resolved
Severity The severity level of the ticket. Possible levels are:
•1 (Failed)
•2 (Degraded)
• 3 (Warning)
• 5 (Good)
Serial # The serial number that the manufacturer assigns to the particular FRU.
Sub-system The subsystem that caused the ticket. Possible subsystems are:
• Connectivity
•Drives
• Control
•Power
• Cooling
• Robotics
Posted Date The date and time on which the library created the ticket.
The Details button displays the Ticket Details dialog box. For more
information, see
Viewing Ticket Details on page 21.
2 By default, the ticket list is sorted by ticket ID in ascending order with
the oldest ticket at the top and the newest one at the bottom. To
change the sorting (for example, by state or severity), click the
column heading by which you want the tickets sorted. Repeatedly
clicking a column heading toggles between ascending and
descending order.
Scalar i2000 User’s Guide 18
Page 32

Chapter 2 Troubleshooting Your Library
Working With Tickets
Using the Tickets Command or the Tickets Button to Display Ticket
Lists
1 Make sure that you are viewing the physical library. From the View
menu, click the name of the physical library.
2 Click Tools→ Tickets or click the Tickets button on the toolbar.
The Tickets dialog box appears.
2
This dialog box enables you to specify the kinds of tickets that will appear
in the ticket list. For example, you can do the following:
• To display all tickets in the library, select All for state, severity,
and subsystem.
• To display all open tickets with a severity level 2 status for the
drives and control subsystems, select Opened for state, 2 for
severity, and Drives and Control for subsystem.
• To display all tickets that users have manually closed for the
robotics subsystem, select Closed for state, All for severity, and
Robotics for subsystem.
• To display all tickets that the library has automatically
determined as having been resolved, select Verified for state, All
for severity, and All for subsystem.
If you select a combination that does not produce a ticket list, a No
Tickets Found error message appears.
Scalar i2000 User’s Guide 19
Page 33

Chapter 2 Troubleshooting Your Library
Note
Working With Tickets
By default, this dialog box is set to Opened for state, All for severity level,
and All for subsystem.
Tickets that the library has automatically verified
and closed are in the Verified state. Tickets that
users have manually closed are in the Closed state.
3 Select the appropriate check boxes in the Select State, Select
Severity, and Select Sub-system areas, and then click OK.
The Ticket List dialog box appears.
For descriptions of elements on the Ticket List dialog box, see Using
System Status Buttons to Display Ticket Lists on page 16.
4 By default, the ticket list is sorted by ticket ID in ascending order with
the oldest ticket at the top and the newest one at the bottom. To
change the sorting (for example, by state or severity), click the
column heading by which you want the tickets sorted. Repeatedly
clicking a column heading toggles between ascending and
descending order.
Scalar i2000 User’s Guide 20
Page 34

Viewing Ticket Details
Tickets provide detailed information about the ticket itself, the reports
that are associated with it, and a repair page that gives guidance for
resolving the issue. These tickets provide important information about
library conditions from which the issue emerged and helpful information
for resolving it.
To display the detailed information for a particular ticket, perform the
following steps:
1 On the Ticket List dialog box in the Select Ticket area, click the
appropriate ticket row to highlight it.
2 Click Details.
The Ticket Details dialog box appears with the Details tab displayed.
Chapter 2 Troubleshooting Your Library
Viewing Ticket Details
Scalar i2000 User’s Guide 21
Page 35

Chapter 2 Troubleshooting Your Library
The Ticket # area of the Ticket Details dialog box displays detailed
information about the ticket. The FRU History Ticket List area lists all
tickets that were ever opened in the past and that see the same specific
FRU (based on the FRU’s location in the library) as the one reported by
this ticket.
The following table describes the elements on the Details tab.
Element Description
In the Ticket # area:
State The current state of the ticket. Possible states are:
Open — indicates that an issue, whether problem or warning condition, has
occurred in the library that requires attention
Closed — indicates that a user has closed the issue
Verified — indicates that the library has successful operational results or
positive data that verifies that the problem is resolved
Viewing Ticket Details
Posted The date and time on which the library created the ticket.
Status Group The subsystem that caused the ticket. Possible subsystems are:
Connectivity
Drives
Control
Power
Cooling
Robotics
Closed If the ticket is closed, the date and time on which it was closed.
Severity The severity level that is associated with the status group (subsystem).
Possible levels are:
1 (Failed)
2 (Degraded)
3 (Warning)
5 (Good)
Scalar i2000 User’s Guide 22
Page 36

Chapter 2 Troubleshooting Your Library
Viewing Ticket Details
Element Description
Duplicates The number of times that the library has reopened the ticket. If a ticket is in the
Closed or Verified state and the identical problem occurs again within 30
minutes, the library reopens the ticket and increments the ticket’s duplicate
count. If the library has not reopened the ticket, the value is zero (0).
Tickets that are in the Closed or Verified state for more than 30 minutes cannot
be reopened. In this case, if the identical problem occurs again, the library
creates a new ticket.
FRU SN The serial number of the particular FRU.
Repair Link The name of the repair page that is associated with the ticket.
FRU Status The status of the FRU. Possible statuses are:
• Failed
•Degraded
• Warning
• Good
Error Code A number that is associated with a particular issue that caused the ticket
report. Because more than one issue can cause a report, an error code provides
another level of detail to what the report provides. The error code maps to a
portion of library firmware code, which a trained analyst can examine to
determine the root cause of an issue. If the ticket is in the Closed or Verified
state, this field is set to N/A. This information is for technical support use
only.
FRU Logical SN The logical serial number that the library assigns to a drive in a specific
location. This is not the serial number of the particular FRU (see FRU SN in
this table). If a drive is replaced by another drive in the same library location,
the logical serial number remains the same. From the host’s perspective, the
replacement drive is the same as the original one. This field appears for all
drive-related tickets only. If the logical serial number addressing feature is
disabled for the library, Disabled appears in this field.
Description area A summary description of report information that is associated with the ticket.
It includes reason text that describes the cause of the ticket.
Scalar i2000 User’s Guide 23
Page 37

Chapter 2 Troubleshooting Your Library
Viewing Ticket Details
Element Description
In the FRU History Ticket List area:
ID The library-assigned identifier for the history ticket.
Description A summary description of the history ticket. The description identifies the
FRU that caused the ticket and includes reason text that describes the cause of
the ticket.
All tickets that appear on the Details tab, including the ones in the FRU
History Ticket List area and the Ticket # area, see the same specific FRU.
State The current state of the history ticket. All history tickets are in the Closed or
Verified state.
Severity The historical ticket’s current severity level.
Serial # The serial number of the particular FRU.
Sub-system The subsystem that caused the ticket. Possible subsystems are:
• Connectivity
•Drives
• Control
•Power
• Cooling
• Robotics
Posted Date The date and time on which the library created the ticket.
From the Ticket Details dialog box, you can perform the following tasks:
• Display detailed information for a history ticket by using the
Show button, and then redisplay the original ticket details using
the Initial Ticket button (see
Viewing History Ticket Details on
page 25)
• Connect to online service and support resources by clicking
Online Support. Online service and support resources include
free, secure access to KnowledgeBase articles and the Online
Service Request tool. (If clicking Online Support does not
connect you to the online service and support web site, try
disabling your web browser’s pop-up blocker.)
Scalar i2000 User’s Guide 24
Page 38

Chapter 2 Troubleshooting Your Library
Note
Viewing Ticket Details
• Mail, save, or print ticket information by using the Send button
(see
Mailing, Saving, and Printing Ticket Information on
page 39)
• Determine whether the issue is resolved by using the FRU Test
button. FRU Test is available only if the ticket’s FRU has an
applicable verification test that you can run. (FRUs that belong to
the Accessor, Picker, Drive, IE Assembly, or Bar Code Label
categories have applicable verification tests.) When you click
FRU Test, the Verification Tests dialog box appears with the
appropriate verification test already selected and ready to start. If
you run a verification test and the results are all good, the library
automatically transitions the ticket to the Verified state. For more
information, see
Working With Verification Tests on page 275.
If the library does not have a verification test for
the FRU, after you resolve the issue, you must
manually transition the ticket to the Closed state by
using the Close Ticket button. After you close the
ticket, the library transitions it to the Verified state
if it is able to do so. For more information about
manually closing a ticket, see
Closing Tickets on
page 43.
• Display report information (see Viewing Ticket Details Reports
on page 26)
• Display the repair page (see Viewing Repair Pages on page 30)
Viewing History Ticket Details 2
To display the detailed information for a particular history ticket,
perform the following steps:
1 On the Ticket List dialog box in the FRU History Ticket List area of
the Details tab, click the appropriate ticket row to highlight it.
2 Click Show.
The history ticket details appear in the Ticket # area. However, the list of
tickets in the FRU History Ticket List remains the same as what the
initial ticket displayed. This list does not change. The Report and Repair
tabs show information that is specific to the history ticket, but the Close
Ticket and FRU Test buttons at the bottom of the Ticket Details dialog
Scalar i2000 User’s Guide 25
Page 39

Chapter 2 Troubleshooting Your Library
Viewing Ticket Details
box are grayed out because the history ticket is in the Closed or Verified
state already.
3 To return to the non-history ticket that appeared initially, click Initial
Ticket.
Viewing Ticket Details Reports 2
The library creates a key report for each issue that occurs. As updates to
the issue occur, the library creates subordinate reports that it associates
with the key report. Typically, you should examine the key report
because it represents the earliest time at which the ticket reached its
highest severity level. It often isolates the most significant problem.
Scalar i2000 User’s Guide 26
Page 40

Chapter 2 Troubleshooting Your Library
Viewing Ticket Details
To display all report information that is associated with a ticket, click the
Report tab on the Ticket Details dialog box.
By default, the Report # area displays report details for either the key
report or, if subordinate reports exist, the most recent subordinate report.
Scalar i2000 User’s Guide 27
Page 41

Chapter 2 Troubleshooting Your Library
Viewing Ticket Details
The following describes the elements on the Report tab:
Element Description
In the Reports Tree area:
Report tree area Provides a hierarchy of report information that is associated with the ticket.
Descriptions includes reason text that describes the cause of the report.
Initially, only the highest level of the report tree appears. Clicking this level
(Reports for Ticket #) reveals one or more second-level reports, and clicking a
second-level report reveals one or more third-level reports. Second-level reports
function essentially as containers of third-level reports. A ticket in the Open state
has one or more third-level reports, including one key report. The key report
represents the earliest time at which the ticket reached its highest severity level. It
often isolates the most significant problem. A ticket in the Closed or Verified state
does not have a key report.
In the Report # area:
Report ID The library-assigned identifier for the report.
Posted The date and time on which the library created the report.
Duplicates For open tickets only, the number of times that the library created the same
report. If the identical issue occurs while the ticket remains open, the library
creates an identical report and increments the report’s duplicate count. If the
library has not created duplicate reports, the value is zero (0).
Status Group The subsystem that caused the ticket. Possible subsystems are:
Connectivity
Drives
Control
Power
Cooling
Robotics
Scalar i2000 User’s Guide 28
Page 42

Chapter 2 Troubleshooting Your Library
Viewing Ticket Details
Element Description
Severity The severity level that is associated with the status group (subsystem). Possible
levels are:
• Failed
•Degraded
• Warning
• Good
FRU ID The identifier for the FRU.
FRU Instance In libraries with multiple FRUs of the same kind, the specific FRU that caused the
report. This field usually identifies a particular FRU by its location in the library
(for example, [1,1,1,8,1,1] for a drive sled). If the library has only one instance of
the FRU, this field is blank.
FRU Category The category to which the FRU belongs.
Reason A brief explanation of why the FRU caused the report. Reasons describe the
causes of issues.
Error Code A number that is associated with a particular issue that caused the ticket report.
Because more than one issue can cause a report, an error code provides another
level of detail to what the report provides. The error code maps to a portion of
library firmware code, which a trained analyst can examine to determine the root
cause of an issue. This information is for technical support use only.
Modifier A numerical qualifier, in hexadecimal format, that provides context for an error
condition. A modifier adds another level of detail to what the error code
provides. If a modifier does not exist for the error condition, this field is set to
“0x0”. This information is for technical support use only.
Repair Link The name of the repair page that is associated with the report.
Report Description A summary description of the report.
Scalar i2000 User’s Guide 29
Page 43

Chapter 2 Troubleshooting Your Library
Viewing Ticket Details
Viewing Repair Pages 2
Repair pages provide problem descriptions and corrective actions that
you or a CSE can perform. To display the repair page that is associated
with a ticket, click the Repair tab on the Ticket Details dialog box.
The repair page provides the following information:
• The title at the top of the repair page is a brief description of the
issue.
•The Problem section describes the issue in more detail.
•The User and Customer Service Engineer Actions section
provides corrective actions that the user or the CSE can perform.
Scalar i2000 User’s Guide 30
Page 44

Chapter 2 Troubleshooting Your Library
Note
Note
Viewing Ticket Details
•The Customer Service Engineer Actions section provides
additional corrective actions that the CSE can perform. If you are
a user, do not perform these steps. Contact technical support for
assistance.
If you are a CSE, see the Scalar i2000 Maintenance
Guide for detailed maintenance action plans, and
removal and replacement procedures.
•The Technical Support Information section provides a
comprehensive list of FRUs that could be involved.
• Text on the repair pages can include links to specific Online Help
pages, which appear in place of the repair page when you click
them. Navigation buttons near the top of the Repair tab enable
you to access Online Help pages as follows:
•The < Back button returns you to the previously viewed page
(either a previously viewed Online Help page or the repair page).
•The Next > button returns you to the page that you were viewing
before you clicked the < Back button.
•The Content button displays a table of contents for the Online
Help system.
Viewing Tape Alerts and Generating Media Integrity Analysis Reports 2
Tape alerts are issued by a drive whenever there is a problem in the drive
that relates to a tape cartridge.
The problem can be with the drive or with the tape cartridge. You can
view tape alerts on the Media Integrity Analysis tab of the Ticket
Details dialog box or generate tape alert reports from Reports on the
menu. See
Viewing Tape Alerts on page 32 or Generating Media
Integrity Analysis Reports on page 34.
The Media Integrity Analysis feature requires a
license key to use. For more information, see
Enabling Licenses on page 104.
You can use these reports to cross-reference tape alerts for drives and
tape cartridges over a specified period of time, in order to determine if
the problem belongs to the drive or to a specific tape cartridge. Typically,
Scalar i2000 User’s Guide 31
Page 45

Chapter 2 Troubleshooting Your Library
Note
Viewing Ticket Details
tape alerts point to a drive problem if a specific drive exhibits tape alerts
against multiple pieces of media. Conversely, tape alerts point to a media
problem if a specific piece of media exhibits tape alerts against multiple
drives. See
Generating Media Integrity Analysis Reports on page 34.
Viewing Tape Alerts 2
To view tape alerts:
1 Click the Media Integrity Analysis tab on the Ticket Details dialog
box.
The Media Integrity Analysis tab only appears on
the Ticket Details dialog box for drive subsystem
tickets.
The Media Integrity Analysis view appears, displaying one of the
following:
If the ticket contains a valid drive serial number and the drive is present
in the library, the view displays a list of drive SNs in the left pane and
media IDs in the right pane for which tape alerts exist for the specified
date range.
Scalar i2000 User’s Guide 32
Page 46

Chapter 2 Troubleshooting Your Library
Viewing Ticket Details
• If the drive serial number given in the ticket is invalid or if the
drive is not present in the library,
the view displays the message, “Invalid serial number or drive is
no longer present”.
2 To change the date range, click the down arrow next to the date box
and select the range you want.
Scalar i2000 User’s Guide 33
Page 47

Chapter 2 Troubleshooting Your Library
Viewing Ticket Details
The Media Integrity Analysis tab displays the tape alert information
available for the selected range.
3 To sort the lists, click the column heading you want to sort.
4 Go to Generating Media Integrity Analysis Reports on page 34.
Generating Media Integrity Analysis Reports 2
This function allows you to generate reports using the criteria described
in
table 3 on page 46.
To generate tape alert reports:
1 Do one of the following:
On the Media Integrity Analysis tab of the Ticket Details dialog box,
click Report.
Scalar i2000 User’s Guide 34
Page 48

Chapter 2 Troubleshooting Your Library
Viewing Ticket Details
• On the menu bar, click Tools→ Reports→ Media Integrity Analysis.
The Report Criteria dialog box appears.
2 To view a report, select the report criteria described in the following
and click View.
Scalar i2000 User’s Guide 35
Page 49

Chapter 2 Troubleshooting Your Library
Viewing Ticket Details
Table 2 Report Criteria
Element Description
Range Specifies the range of time to cover in the report. Choices include:
•Historical
• Current Month
• Last Month
• Last 3 Months
• Last 6 Months
• Last 12 Months
• Last 30 Days (default)
• Last 7 Days
Grouping Determines which drive or tape cartridge to base the report. Choices include:
• All (default)
• Selected Drive by Physical SN—displays the Choose Drive dialog box
• Selected Media by Media ID—displays the Specify Media dialog box
Media ID,
Drive Physical SN,
Selected in any combination to determine which values are included in the
report. (All=default)
Tape Alert
check boxes
Type Type of report. Choices include:
• Rollup—displays the values based on which of the above check boxes,
Media ID, Drive Physical SN, and/or Tape Alert, that you have selected
(default)
• Trend—shows the occurrence of tape alerts over time
Sort By How the report is sorted. Choices include:
• Alphabetically (default)
• Count
• Last Occurrence
Scalar i2000 User’s Guide 36
Page 50

Chapter 2 Troubleshooting Your Library
Element Description
Chart Determines the type of chart. Choices include:
•Area
•Bar
•Bar 3D
•Line
• Stacked Area
•Stacked Bar
•Stacked Bar 3D
•Pie
• Pie 3D (default)
The Report Viewer dialog box appears. The content and appearance of
the report varies depending on the selected criteria.
Viewing Ticket Details
Scalar i2000 User’s Guide 37
Page 51

Chapter 2 Troubleshooting Your Library
Viewing Ticket Details
3 Click Preview.
The report appears in the Media Integrity Analysis Print Preview
window.
4 To view the next page of the report, click the Next icon on the toolbar.
5 To increase or decrease the magnification of the report, click the
Zoom In or Zoom Out buttons.
Scalar i2000 User’s Guide 38
Page 52

Chapter 2 Troubleshooting Your Library
Viewing Ticket Details
6 In the report viewer, you can perform the following tasks:
1 To save the report as an Adobe
®
Portable Document Format
(PDF) file, click the Adobe PDF icon on the toolbar.
2 In the Saving Report to PDF dialog box, enter the appropriate
information, and then click Confirm to convert the report into a
PDF file.
3 To print the report, click the Print icon on the toolbar.
Saving a Report Template 2
If you frequently generate the Media Integrity Analysis Report with the
same set of report criteria, save the criteria as a template. Loading the
template recalls the saved report criteria and lets you quickly generate a
report based on the saved criteria.
1 On the menu bar, click Tools→ Reports→ Media Integrity Analysis.
The Report Criteria dialog box appears.
2 Under Specify Report Criteria, click criteria options in the lists to
customize the content and appearance of the Media Integrity
Analysis Report.
Table 2 on page 36 summarizes the available report criteria options.
3 Under Templates, click Save.
4 Type a name for the template, and then click OK.
The template appears in the list under Templates.
To load the saved report criteria at a later time, click the template in the
list, and then click View to generate the report.
5 To close the Report Criteria dialog box, click Cancel.
Mailing, Saving, and Printing Ticket Information 2
The Send button on the Ticket Details dialog box enables you to send
detailed ticket information, including all report details, to e-mail
addresses. If you are accessing the LMC from a remote client, Send also
enables you to save the information to a file or print it.
Scalar i2000 User’s Guide 39
Page 53

Chapter 2 Troubleshooting Your Library
Note
Note
Viewing Ticket Details
You can mail, save, or print ticket information from
a remote client. However, you cannot save or print
the information from the library’s touch screen.
Ticket information that a user sends by using the Send button is
essentially the same as the information that the library automatically
provides in e-mail notifications (see
Understanding E-mail Notifications
on page 10). The only differences are that the subject line states “Library
RAS Information” and the body of the message does not have a
“REASON FOR AUTOMATED E-MAIL” section, but it has a “REPAIR
AND TROUBLESHOOTING INSTRUCTIONS ATTACHED” section.
The message body also includes the following information, which
provides details about the ticket and library conditions at the time of the
event:
• Ticket summary
• Ticket details, including status information
• Firmware versions, including MCB, RCU, CMB, and drive bricks
• Physical library configuration
• Library states, such as physical library online or offline, partitions
online or offline, or robotics enabled or disabled
• Time stamps of recent activity
• Report summary
• Report details for the ticket
The RAS repair page attachment is in HTML format.
Before you perform the following procedure, you
must make sure that e-mail is appropriately
configured in the LMC so that the library can send
ticket details to the recipient. See
Configuring
E-mail on page 140.
To mail, save, or print information for a particular ticket, perform the
following steps:
1 Make sure that the Ticket Details dialog box displays information for
the ticket that you want to send. See
Displaying Ticket Lists on
page 16 and Viewing Ticket Details on page 21.
Scalar i2000 User’s Guide 40
Page 54

Chapter 2 Troubleshooting Your Library
Note
Note
Viewing Ticket Details
2 Click Send.
The Ticket Information dialog box appears.
3 Perform one of the following tasks:
• To indicate that you want to send the information as an e-mail
message to a recipient, select Email, and then either type an e-mail
address in the Email text box or select an existing address from the
drop-down list. You can type a comment in the Comment text box to
send with the information.
• To indicate that you want to save the information, select Save, and
then either type in the Save text box a path and a file name to which
you want the information saved or click Browse to specify a location
and a file name.
The Save option is available to remote client users
only. It appears grayed out on the touch screen.
• To indicate that you want to send the information to a printer, select
Print.
The Print option is available to remote client users
only. It appears grayed out on the touch screen.
4 To send, click OK.
Scalar i2000 User’s Guide 41
Page 55

Chapter 2 Troubleshooting Your Library
Note
Viewing Ticket Details
Running Verification Tests to Determine Issue Resolution 2
A ticket is always generated against a particular FRU when the library
detects an issue. Therefore, the library provides FRU tests that you can
run to determine whether the conditions that caused the ticket have been
resolved. Running the FRU tests is an important part of ensuring that the
system is working properly.
The library can detect issues under the following contexts:
• When the library polls at regular intervals, or
• When a host or user commands the library to perform an operation
(such as occurs with GUI commands, host inventory, and host move
media)
FRU tests are designed to help resolve issues under the second context.
During FRU testing, the library creates operational scenarios to evaluate
the functionality of a FRU. FRU tests attempt to evaluate as many aspects
of the FRU as possible, but they might not fully recreate the conditions
that caused the original ticket. The library cannot recreate all conditions
and, therefore, the library does not provide tests for some FRUs.
The instructions on the ticket’s repair page direct you to run a FRU test if
an applicable one exists. If you run the test and the results are all good,
the library automatically transitions the ticket to the Verified state.
If you cannot run a test, make sure that you
complete the repair page instructions and, if
needed, physically examine the FRU. After you
determine that the issue is resolved, manually
transition the ticket to the Closed state. See
Closing
Tickets on page 43. After you close the ticket, the
library transitions the ticket to the Verified state if
it is able to do so.
You can access the tests in two ways:
• On the main LMC display, click Tools→ Verification Tests.
The Verification Tests dialog box appears. From this dialog box, you can
choose from a variety of verification tests, including the FRU tests.
•On the Ticket Details dialog box, click FRU Test.
Scalar i2000 User’s Guide 42
Page 56

Chapter 2 Troubleshooting Your Library
Note
Note
Viewing Ticket Details
The FRU Test button is available only if the ticket’s
FRU has an applicable verification test that you can
run.
The Verification Tests dialog box appears with the appropriate test
already selected and ready to start.
For details about the verification tests and how to run them, seeWorking
With Verification Tests on page 275.
Closing Tickets 2
Manually close a ticket if all of the following conditions are true:
• You have completed the repair page instructions to resolve the issue
(for example, replaced a FRU).
•The FRU Test button on the Ticket Details dialog box is not
available. This means that an applicable verification test does not
exist for the ticket’s FRU.
If the FRU Test button is available for a ticket, you
should use it to access and run the verification test.
You should not manually close it. The verification
test determines whether the issue is resolved, and
the library automatically transitions the ticket to
the Verified state if the test passes without
problems. See
Running Verification Tests to
Determine Issue Resolution on page 42.
• The issue has been resolved, but the ticket remains in an Open state
(for example, when defective media has been replaced in the library).
You should manually transition a ticket to the Closed state after
physically examining the FRU to make sure that the issue is resolved.
Scalar i2000 User’s Guide 43
Page 57

Chapter 2 Troubleshooting Your Library
Note
Viewing Ticket Details
Closing Individual Tickets 2
To transition a ticket to the Closed state, perform the following steps:
1 Make sure that the Ticket Details dialog box displays information for
the open ticket that you want to close. See
Displaying Ticket Lists on
page 16 and Viewing Ticket Details on page 21.
2 Click Close Ticket.
The ticket’s state changes to Closed. If the library is able to do so, it
automatically transitions the closed ticket to the Verified state.
If the identical issue occurs again within 30
minutes after the ticket transitions to the Closed or
Verified state, the library reopens the ticket and
increments the ticket’s duplicate count.
Tickets that are in the Closed or Verified state for
more than 30 minutes cannot be reopened. In this
case, if the identical problem occurs again, the
library creates a new ticket.
Closing Multiple Tickets 2
You can use this method when you have many tickets relating to the
same issue, for example, when you have many drives in a library or many
tape alerts.
To transition multiple tickets to the Closed state, do the following:
1 On the Ticket List dialog box, select each ticket you want to close by
clicking the check box.
See Displaying Ticket Lists on page 16 and Viewing Ticket Details on
page 21.
2 Click Close Tickets.
3 In the Attention message box, click Yes to confirm that you want to
close multiple tickets.
The tickets’ state changes to Closed. If the library is able to do so, it
automatically transitions the closed tickets to the Verified state.
Scalar i2000 User’s Guide 44
Page 58

Chapter 2 Troubleshooting Your Library
Viewing Ticket Details
Generating the Tickets Report 2
The Tickets Report lets you see how many tickets occurred in a particular
time period. You can choose to group tickets by subsystem, module, or
FRU, and the results can be presented as a rollup summary or as a trend
so you can see if the number of issues is increasing or decreasing over
time. Also, the report results can be presented in different chart formats,
such as bar graphs or pie charts.
After generating a report, you can print it or save it as a PDF file. In
addition, you can save a set of report criteria as a template for reports you
frequently generate.
Specifying Tickets Report Criteria 2
To generate the Tickets Report, first specify the report criteria, and then
view the report.
1 Log on as an administrator.
2 On the menu bar, click Tools→ Reports→ Tickets.
The Report Criteria dialog box appears.
3 Under Specify Report Criteria, click criteria options in the lists to
customize the content and appearance of the Tickets Report.
Table 3 on page 46 summarizes the available report criteria options.
Scalar i2000 User’s Guide 45
Page 59

Chapter 2 Troubleshooting Your Library
Viewing Ticket Details
Table 3 Ticket s Report Criteria
Options
Criteria Description
Range Specifies the range of time to cover in the report. Choices include:
•Historical
• Current Month
• Last Month
• Last 3 Months
• Last 6 Months
• Last 12 Months
• Last 30 Days (default)
• Last 7 Days
Grouping Determines how tickets are grouped in the report. Choices include:
• Subsystem (default)—tickets are grouped according to subsystem
• FRU Category—tickets are grouped according to FRU category
• FRU Id—tickets are grouped according to FRU ID
• Serial Number—tickets are grouped according to module serial number
• Selected Drive by Physical SN—tickets are grouped according to drive serial
number (displays the Choose Drive dialog box)
Attribute Determines how tickets are identified in the report. Choices include:
• All (default)—tickets are separated according to attribute (Failed, Degraded,
Warning, or Other)
• Total—tickets are not separated according to attribute
Type Specifies the type of report. Choices include:
• Rollup (default)—displays the values based on the selected grouping
• Trend—shows the occurrence of tickets over time (grouping criteria is not
used)
Scalar i2000 User’s Guide 46
Page 60

Chapter 2 Troubleshooting Your Library
Criteria (Continued) Description
Chart Determines the type of chart. Choices include:
•Area
•Bar
•Bar 3D
•Line
• Stacked Area
• Stacked Bar (default)
•Stacked Bar 3D
•Pie
•Pie 3D
4 Click View.
Viewing Ticket Details
Scalar i2000 User’s Guide 47
Page 61
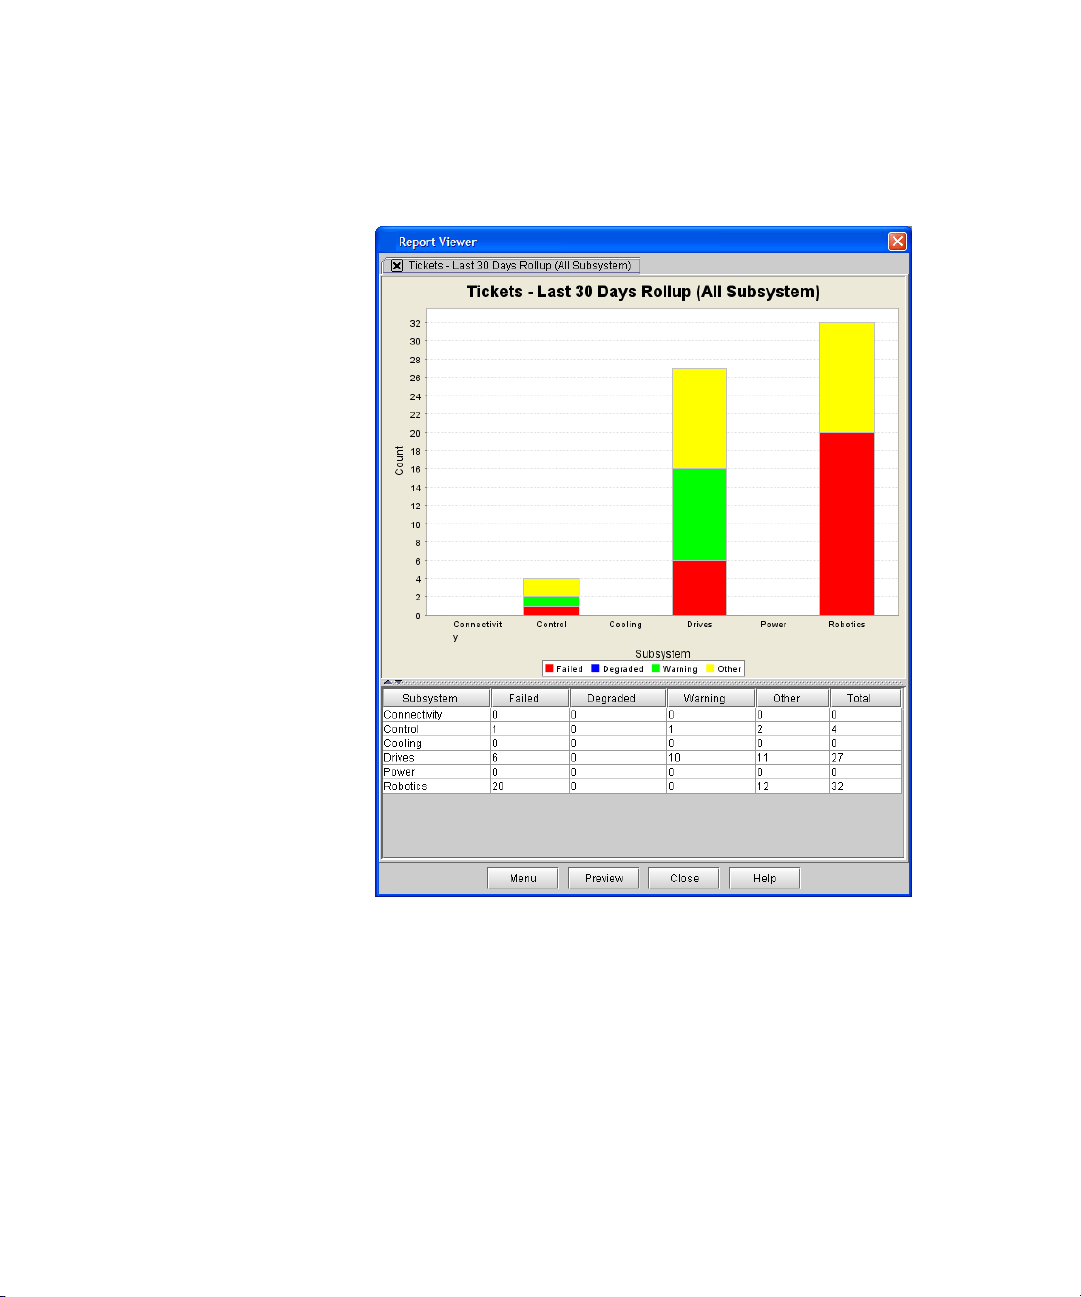
Chapter 2 Troubleshooting Your Library
Viewing Ticket Details
The Report Viewer dialog box appears. The content and appearance of
the report varies depending on the selected criteria.
5 When you are finished viewing the Tickets Report, click Close.
6 To close the Report Criteria dialog box, click Cancel.
Scalar i2000 User’s Guide 48
Page 62

Chapter 2 Troubleshooting Your Library
Viewing Ticket Details
Printing or Exporting a Report to PDF 2
After generating the Tickets Report, you can print it or export it to a PDF
file.
1 On the Report Viewer dialog box, click Preview.
The Print Preview dialog box appears.
2 Do one or more of the following:
• To navigate through the pages of the report, click Back or Next.
• To increase or decrease the magnification of the report, click
Zoom In or Zoom Out.
• To print the report, click Print. Specify print options, and then
click OK.
Scalar i2000 User’s Guide 49
Page 63

Chapter 2 Troubleshooting Your Library
Note
Viewing Ticket Details
• To save the report as a PDF file, click PDF. Specify a file path and
file name, and then click Confirm.
3 When you are finished working with the Print Preview dialog box,
click Close.
You cannot print reports or save them to a PDF file
using the touch screen.
Exporting a Report to an E-mail or a Text File 2
Instead of viewing the report as a chart, you can e-mail the report data to
an e-mail address. Or export the report data to a comma delimited text
file (*.csv) for use in other programs.
1 On the menu bar, click Tools→ Reports→ Tickets.
The Report Criteria dialog box appears.
2 Under Specify Report Criteria, click criteria options in the lists to
customize the content and appearance of the Tickets Report.
Table 3 on page 46 summarizes the available report criteria options.
3 Click Export.
The Export Raw Data dialog box appears.
4 Do one of the following:
• To send the report data to an e-mail address, click Email. Type or
select the e-mail address, type an optional comment in the Comment
box, and then click OK.
• To save the report data to a comma delimited text file, click Save.
Specify a file path and file name, and then click OK.
5 To close the Report Criteria dialog box, click Cancel.
Scalar i2000 User’s Guide 50
Page 64

Chapter 2 Troubleshooting Your Library
Interpreting LEDs
Saving a Report Template 2
If you frequently generate the Tickets Report with the same set of report
criteria, save the criteria as a template. Loading the template recalls the
saved report criteria and lets you quickly generate a report based on the
saved criteria.
1 On the menu bar, click Tools→ Reports→ Tickets.
The Report Criteria dialog box appears.
2 Under Specify Report Criteria, click criteria options in the lists to
customize the content and appearance of the Tickets Report.
Table 3 on page 46 summarizes the available report criteria options.
3 Under Templates, click Save.
4 Type a name for the template, and then click OK.
The template appears in the list under Templates.
To load the saved report criteria at a later time, click the template in the
list, and then click View to generate the report.
Interpreting LEDs
5 To close the Report Criteria dialog box, click Cancel.
LEDs can help you assess the state of a library component. The primary
library LEDs can be grouped as follows:
• Blade status LEDs
•Drive status LEDs
• Fibre port link LEDs (for Fibre drives and Fibre Channel I/O blades)
•MCB port LEDs
• LBX terminator LEDs
• Power supply status LEDs
Scalar i2000 User’s Guide 51
Page 65

Chapter 2 Troubleshooting Your Library
blade LEDs
- left = green
- middle = amber
- right = blue
blade LEDs
- left = blue
- middle = amber
- right = green
FC I/O blade
control management blade
management control blade
robotics control unit
library motor drive
Interpreting LEDs
Interpreting Blade Status LEDs 2
Figure 2 Locations and Colors
of Blade Status LEDs
Each of the following library blades has a set of green, amber, and blue
LEDs that indicate blade processor status, health status, and power
control status:
• Management control blade (MCB)
• Control management blade (CMB)
• I/O blade
• Robotics control unit (RCU)
• Library motor drive (LMD)
Figure 2 shows the locations and colors of the status LEDs on the five
blades that can be in the library.
Scalar i2000 User’s Guide 52
Page 66

Chapter 2 Troubleshooting Your Library
Interpreting LEDs
Blade status LEDs provide troubleshooting information that you can use
in conjunction with tickets that the library creates. However, the LEDs
might not directly correspond to tickets. The LEDs can indicate a
firmware or hardware problem so severe that the library cannot create or
display a ticket. For example, if the MCB firmware becomes inoperable,
the amber LED flashes at 1 Hz, but the library might not be able to
display any related tickets.
For a description of each LED color and what its state might mean, see
table 4 on page 54. For a description of how the blade status LEDs appear
under normal conditions, see table 5 on page 55.
Scalar i2000 User’s Guide 53
Page 67

Chapter 2 Troubleshooting Your Library
Interpreting LEDs
Table 4 Explanations of Blade
Status LED States
LED Color Represents Possible States and Explanations
Green Processor status • Solid off — blade’s main processor is not operating (or
blade is booting)
• Solid on — blade’s main processor is not operating
(however, this does not apply to the LMD; solid on
indicates that the LMD’s main processor is operating
normally)
• Blinks one time every second (1 Hz) — blade’s main
processor is operating normally
• Blinks 10 times every second (10 Hz) — identify mode
• Solid on for three seconds, then blinks twice at 1 Hz, and
then repeats — blade firmware is downloading
Amber Health status • Solid off — blade’s power and control subsystem is
operating normally
• Solid on — blade’s power and control subsystem has failed
Solid on also can mean that the blade’s power and control
subsystem firmware is autoleveling. In conjunction with
the blue amber LED blinking one time every 10 seconds,
this is a normal condition. Autoleveling takes about three
minutes for each blade, and blades within an I/O
management unit autolevel in series. It can take as long as
three minutes for the power and control subsystem to
download. Never remove a blade when the amber LED is
solid on unless it has been on continuously for at least 10
minutes.
Blue Power control status • Solid off — blade is not receiving power
• Solid on — blade is powered down; ready to be replaced
(swap mode)
• Blinks one time every 10 seconds (flash) — blade is
powered on; operating normally
Scalar i2000 User’s Guide 54
Page 68
Chapter 2 Troubleshooting Your Library
Interpreting LEDs
Table 5 Blade Status LED
States - Normal Conditions
LED Color State and Explanation
Green Blinks one time every second (1 Hz) — blade’s main processor is operating normally
(however, this does not apply to the LMD; solid on indicates that the LMD’s main
process is operating normally)
Amber Solid off — no errors are detected; blade’s PIP is operating normally
Blue Blinks one time every 10 seconds (flash) — blade is powered on; operating normally
Actions Based on LED States 2
When the RAS system is operating properly, service actions should be
based on tickets first and foremost. However, some situations occur when
the amber LED indicates problems that are not detected by the ticket
system. You should always act on any amber LED that is solidly on,
which indicates that the blade’s power and control subsystem has failed.
In this case, replace the blade.
When you replace a blade FRU or escalate a problem based on LED
states, perform the following steps:
1 Observe and report the timing pattern of the blue, amber, and green
LED group. Spend at least 30 seconds observing the LEDs and record
the results in the service request (SR) and on any equipment failure
report form that you return with the part. Proper reporting of all LED
states is critical for determining the root cause of the failure.
2 Capture a system snapshot and send it to technical support for
analysis.
Scalar i2000 User’s Guide 55
Page 69

Chapter 2 Troubleshooting Your Library
Note
Note
FC link LED
fibre port
- top = blue
- middle = amber
- bottom = green
status LEDs:
Interpreting LEDs
Interpreting Drive Status LEDs 2
Figure 3 Rear View of Fibre
Channel Drive Sled (UDS-2)
The library reports all drive issues that can affect customer operations. In
addition to examining library reports, you should observe drive sled link
LED and status LED activity.
The blinking codes described in table 6 on page 58
on page 133 are the same for Fibre Channel and
SCSI drives in the UDS-2 drive sleds.
Figure 3 shows the locations of the status LEDs and the Fibre Channel
link LED on the rear of a UDS-2 drive sled.
Scalar i2000 User’s Guide 56
SDLT-600 Fibre drives do not have a Fibre Channel
link LED.
Page 70

Figure 4 Rear View of Fibre
- top = blue
- middle = amber
- bottom = green
status LEDs:
LED for future use
fibre port
FC Link
LED
Channel Drive Sled (UDS-3)
Chapter 2 Troubleshooting Your Library
Interpreting LEDs
Figure 4 shows the locations of the status LEDs and the Fibre Channel
link LED on the rear of a UDS-3 drive sled.
Table 6 on page 58 describes how to interpret the drive sled status LED
activity that you might see on the rear of a UDS-2 or UDS-3 drive sled.
For a description of how the blade status LEDs appear under normal
conditions, see
table 7 on page 59. For information about interpreting the
drive link LED, see Drive Sled Fibre Channel Link LED on page 59.
Scalar i2000 User’s Guide 57
Page 71

Chapter 2 Troubleshooting Your Library
Interpreting LEDs
Table 6 Drive Sled St atus LED
States (UDS-2 and UDS-3)
LED Color Represents Possible States and Explanations
Green Processor status • Solid off — drive sled’s main processor is not operating (or
blade is booting)
• Solid on — drive sled’s main processor is not operating
• Blinks one time every second (1 Hz) — drive sled’s main
processor is operating normally
• Blinks 10 times every second (10 Hz) — identify mode
• Solid on for three seconds, then blinks twice at 1 Hz, and
then repeats — drive sled or drive brick firmware is
downloading
• Blinks three times in three seconds (1 Hz), then pauses
(solid off), and then repeats — drive brick is activating
(varying on)
Amber Health status • Solid off — drive sled’s controller (drive DC to DC
converter [DDC]) is operating normally
• Solid on — drive sled’s DDC has failed
Blue Power control status • Solid off — drive sled is not receiving power
• Solid on — drive brick is powered down; ready to be
replaced (swap mode) or varied on
• Blinks one time every 10 seconds (flash) — drive brick is
powered on; operating normally
Scalar i2000 User’s Guide 58
Page 72

Chapter 2 Troubleshooting Your Library
Note
Interpreting LEDs
Table 7 Drive Sled St atus LED
States - Normal Conditions
LED Color State and Explanation
Green Blinks one time every second (1 Hz) — drive sled’s main processor is operating
normally. The green LEDs for all drive sleds that are operating normally blink together.
Amber Solid off — no errors are detected; drive sled’s controller is operating normally.
Blue Blinks one time every 10 seconds (flash) — drive sled is powered on; operating
normally.
Interpreting Fibre Port Link LEDs 2
A fibre port link LED shows the state of the Fibre Channel link and
whether the link is ready to transmit commands.
Drive Sled Fibre Channel Link LED 2
The Fibre Channel link LED for a drive sled is located on the rear of the
drive sled.
Figure 3 on page 56 shows the location of the Fibre Channel
link LED on the rear of the UDS-2 drive sled, and Figure 4 on page 57
shows the location of the Fibre Channel link LED on the rear of the UDS-3
drive sled.
SDLT-600 Fibre drives do not have a Fibre Channel
link LED.
Scalar i2000 User’s Guide 59
Page 73

Table 8 describes how to interpret the Fibre Channel link LED activity
that you might see on the rear of the UDS-2 drive sled. Table 9 on page 61
on page 135 describes the Fibre Channel link LED activity on the rear of
the UDS-3 drive sled.
Table 8 Fibre Drive Sled Link
LED States (UDS-2)
LED Color Represents State and Explanation
Chapter 2 Troubleshooting Your Library
Interpreting LEDs
Green LIP and
activity
• Solid on — loop initialization protocol (LIP) has occurred.
• Blinks at irregular intervals — host command/data activity is
occurring.
Amber Online and
light
• Solid on — the library has enabled the drive data bus; it can detect
light through a fiber optic cable.
detected
No color • Solid off — the drive brick is varied off or the drive cannot detect light
through a fiber optic cable (equivalent to no fibre cable plugged in). If
the drive brick is varied off, the blue status LED will be solid on.
Scalar i2000 User’s Guide 60
Page 74

Table 9 Fibre Drive Sled Link
Note
LED States (UDS-3)
LED Color Represents State and Explanation
Chapter 2 Troubleshooting Your Library
Interpreting LEDs
Green LIP and
activity
• Solid on — loop initialization protocol (LIP) has occurred.
• Blinks at irregular intervals — host command/data activity is
occurring.
Amber Online and
light
detected
• Solid on — the library has enabled the drive data bus; it can detect
light through a fiber optic cable.
• Blinks at regular intervals — the library has enabled the drive data
bus, but light is not detected through the fiber optic cable.
No color • Solid off — the library has not enabled the drive data bus or the drive
brick is varied off. If the drive brick is varied off, the blue status LED
will be solid on.
A UDS-2 drive with no fiber optic cable plugged in
is healthy if the link LED is solid off. A UDS-3
drive with no fiber optic cable plugged in is
healthy if the LED is amber and blinking at regular
intervals, indicating that the library has enabled
the drive data bus, but no light is detected.
Scalar i2000 User’s Guide 61
Page 75
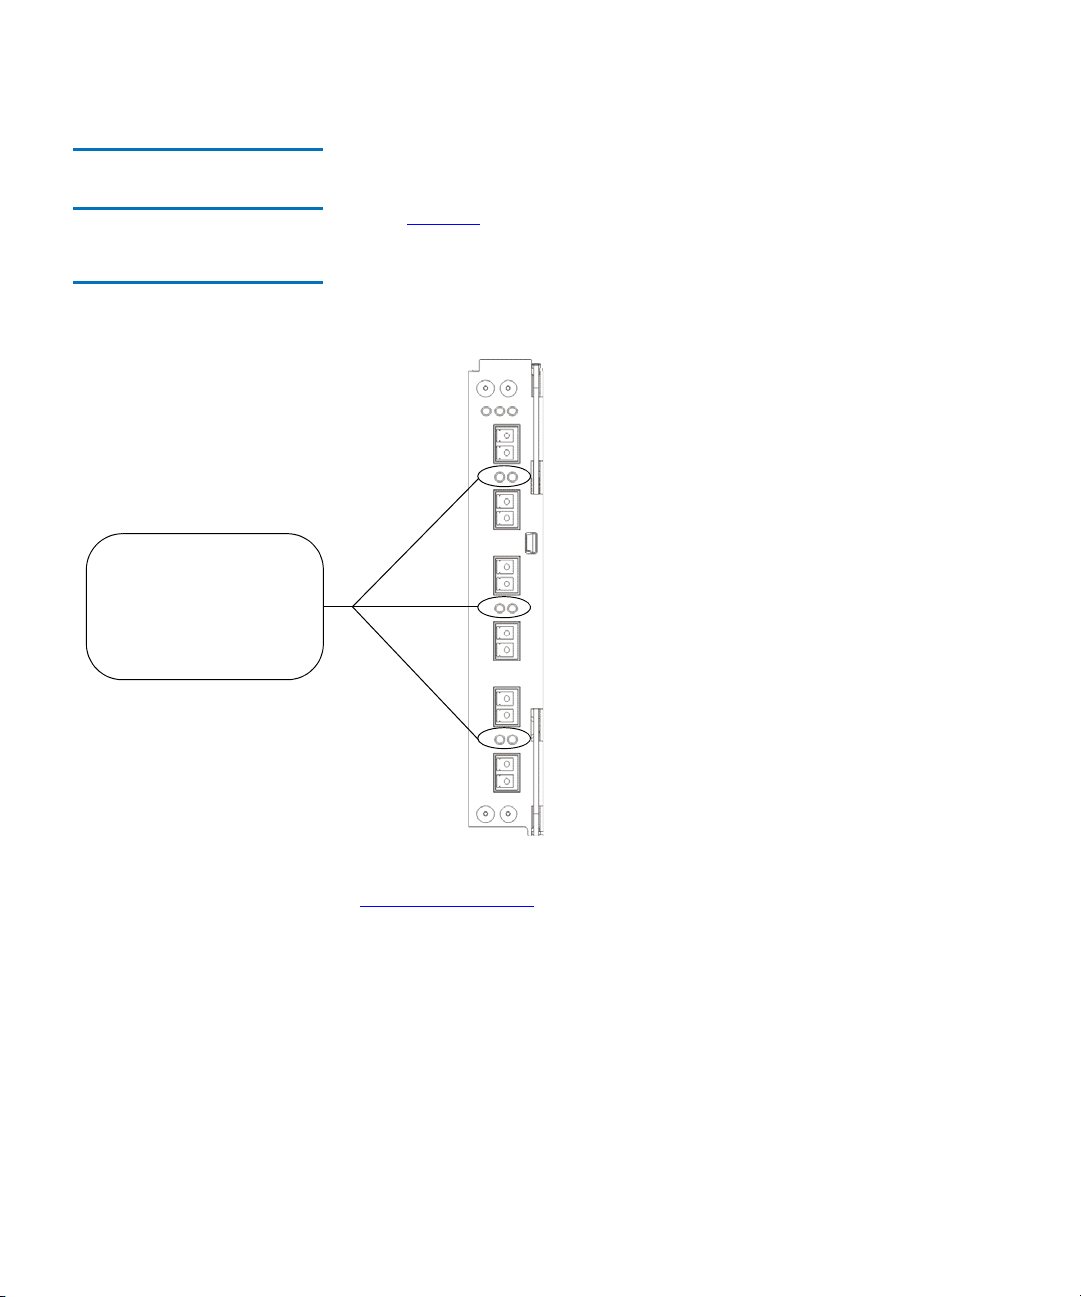
Chapter 2 Troubleshooting Your Library
I/O blade link LEDs
- left = green (belongs
to port below)
- right = green (belongs
to port above)
Interpreting LEDs
I/O Blade Fibre Port Link LED 2
Figure 5 Locations - Colors of
I/O Blade Fibre Port Link LEDs
The link LED for an I/O blade fibre port is located next to the port. On the
I/O blade faceplate, black lines indicate how each link LED belongs to a
port.
Figure 5 shows the locations of the I/O blade Fibre port link LEDs.
Table 10 on page 63 describes how to interpret the link LED activity that
you might see. There are two different models of I/O blade: 6404 and
7404. LED behavior varies based on which model is installed in the
library.
Scalar i2000 User’s Guide 62
Page 76

Chapter 2 Troubleshooting Your Library
Note
Interpreting LEDs
Table 10 I/O Blade Link LED
States
Blade Model Possible Green LED States and Explanations
6404 • Solid on — the I/O blade has established a proper link and is ready to use. The
drive detects light through the fiber optic cable.
• Blinks slowly — the link is up and currently transporting commands.
• Blinks rapidly — when the I/O blade is beginning to reboot or power up, all I/O
blade link LEDs, along with the I/O blade’s green status LED, blink rapidly to
indicate that the blade is starting the Power On Self Test (POST).
• Blinks with other link LEDs in a racetrack pattern — when all of the I/O blade
link LEDs blink consecutively in a clockwise order, the blade is booting up. This
pattern stops when the blade is powered and ready. If the pattern doesn’t stop,
the blade is unable to completely boot up. In this situation, follow the repair page
instructions.
• Solid off — the I/O blade does not detect light through the fiber optic cable.
7404 • Solid on — the I/O blade has established a link but is not currently transporting
data.
• Blinks — the link is active and is currently transporting data.
• Solid off — the I/O blade has not established a link OR the link is active and is
currently transporting a large amount of data.
For the 7404 I/O blade, fibre port LEDs are off
while the blade is booting up.
Scalar i2000 User’s Guide 63
Page 77

Chapter 2 Troubleshooting Your Library
MCB Ethernet
port LEDs
- top = green
- bottom = amber
Interpreting LEDs
Interpreting MCB Port LEDs 2
Figure 6 Locations - Colors of
MCB Ethernet Port LEDs
The MCB has LEDs for the Ethernet, Fibre Channel, and SCSI ports.
MCB Ethernet Port LEDs 2
The LEDs on the MCB Ethernet port indicate status and activity. Figure 6
shows the locations and colors of the MCB Ethernet port LEDs.
Scalar i2000 User’s Guide 64
Page 78

Chapter 2 Troubleshooting Your Library
Interpreting LEDs
Table 11 describes how to interpret the Ethernet port LED activity that
you might see.
Table 11 Explanations of MCB
Ethernet Port LED States
LED Color Possible States and Explanations
Green • Solid on — the link is up; data can be sent or received through the Ethernet port
• Solid off — the link is not up; data cannot be sent or received through the Ethernet
port
Amber • Flashes at irregular intervals — data activity is occurring through the Ethernet port
• Solid off — no data activity is occurring through the Ethernet port
MCB Fibre Channel and SCSI Port LEDs 2
The LEDs for the MCB Fibre Channel and SCSI ports are for future use.
Ignore LED behaviors that might appear.
Figure 7 on page 66 shows the
locations and colors of the LEDs.
Scalar i2000 User’s Guide 65
Page 79

Figure 7 Locations - Colors
MCB port LEDs
- left = green (belongs to
SCSI port below)
- right = green (belongs
to FC port above)
MCB FC / SCSI Port LEDs
Chapter 2 Troubleshooting Your Library
Interpreting LEDs
Interpreting LBX Terminator LEDs 2
The LBX terminator has two versions. Version 01 has four LEDs and
Version 03 has six LEDs. For more information, see the Scalar i2000
Maintenance Guide.
LBX Terminator Version 01 LEDs 2
The LBX terminator has four green LEDs that indicate the presence of
modules in the library.
Figure 8 on page 67 shows the locations of the
LEDs. Table 12 on page 67 describes how to interpret LED activity on the
LBX terminator.
Scalar i2000 User’s Guide 66
Page 80

Figure 8 Locations of LBX
1
2
3
4
Terminator LEDs (Version 01)
Table 12 LBX LED Version 01
LED On/Off Combinations
Chapter 2 Troubleshooting Your Library
Interpreting LEDs
Explanation1 2 3 4
Off Off Off Off Robotics are disabled, the access door is open, or the LBX terminator
is misaligned.
On Off Off Off The library has one control module and no expansion modules.
On On Off Off The library has one control module and one expansion module.
On On On Off The library has one control module and two expansion modules.
On On On On The library has one control module and three expansion modules.
On Off On On The library has one control module and four expansion modules.
On On Off On The library has one control module and five expansion modules.
On Off On Off The library has one control module and six expansion modules.
On Off Off On The library has one control module and seven expansion modules.
Scalar i2000 User’s Guide 67
Page 81

Figure 9 Locations of LBX
123456
Terminator LEDs (Version 03)
Chapter 2 Troubleshooting Your Library
Interpreting LEDs
LBX Terminator Version 03 LEDs 2
The LBX terminator has six green LEDs that indicate the presence of
modules in the library.
Figure 9 shows the locations of the LEDs. Table 13
on page 69 describes how to interpret LED activity on the LBX
terminator.
Scalar i2000 User’s Guide 68
Page 82

Chapter 2 Troubleshooting Your Library
Note
Interpreting LEDs
Table 13 LBX LED Version 03
LED On/Off Combinations
Explanation1 2 3 4 5 6
Off Off Off Off Off Off Robotics are disabled, the access door is open, or the LBX
terminator is misaligned.
On Off Off Off Off Off The library has one control module and no expansion modules.
On Off Off On Off Off The library has one control module and one expansion module.
On Off Off On On Off The library has one control module and two expansion modules.
On Off Off On On On The library has one control module and three expansion modules.
On Off Off Off On On The library has one control module and four expansion modules.
On Off Off On Off On The library has one control module and five expansion modules.
On Off Off Off On Off The library has one control module and six expansion modules.
On Off Off Off Off On The library has one control module and seven expansion modules.
Interpreting Power Supply LEDs 2
Power supply problems are reported in tickets. To physically identify a
power supply, note the power supply number and module number in the
ticket details. Modules can have up to two power supplies each. The top
supply is #1 and the bottom supply is #2.
The library can be physically configured to include
up to seven expansion modules. If any of the
expansion modules include drives, those modules
also will have power supplies.
Scalar i2000 User’s Guide 69
Page 83

Figure 10 Locations and
power supply LEDs
- top (AC OK) = green
- middle (DC OK) = green
- bottom (FAULT) = blue
Colors of Power Supply LEDs
Chapter 2 Troubleshooting Your Library
Interpreting LEDs
Figure 10 shows the locations and colors of the power supply LEDs.
Table 14 describes how to interpret LED activity that you might see.
T able 14 Explanation of Power
Supply LED States
LED Color Represents Possible States and Explanations
Green
(top LED)
AC OK • Solid on — power supply’s AC input is above minimum
requirements to operate
• Solid off — power supply’s AC input is below minimum
requirements to operate
Green
(middle
DC OK • Solid on — power supply’s output voltage is within specifications
• Solid off — power supply’s output voltage is outside of specifications
LED)
Scalar i2000 User’s Guide 70
Page 84

Note
T able 14 Explanation of Power
Supply LED States (Continued)
LED Color Represents Possible States and Explanations
Chapter 2 Troubleshooting Your Library
Working With Command History Logs
Blue (bottom
LED)
Fault • Solid on — indicates any of the following conditions:
• Power supply output is outside of specifications
• Current limit has been exceeded
• Temperature limit has been exceeded
• Fan failed while AC input is present and above minimum operating
voltage
• AC input is below minimum operating voltage
• PDU is on, but the Power button on the library’s indicator panel is off
• Solid off — no faults are detected
Working With Command History Logs
The Command History Log dialog box enables you to view command
and response activity that has occurred with externally addressable
library devices, including the LMC, controller LUNs, partitions, and
drives. This information can help you isolate the source of an issue, such
as a library device or host application.
The number of selected drives affects the
performance of the Command History Log.To
ensure proper operations, limit drive log requests
to twenty-five.
Scalar i2000 User’s Guide 71
Page 85

Viewing Command History Logs 2
Chapter 2 Troubleshooting Your Library
Working With Command History Logs
1 Log on as an administrator.
2 You can perform this procedure while viewing either the physical
library or a partition. From the View menu, click the name of the
physical library or the appropriate partition.
3 Click Tools→ Command History Log.
The Command History Log dialog box appears.
The first example dialog box that follows represents the physical view,
and the second one represents a partition view. These examples show
expanded levels for “Controller LUNs”, “Partitions”, and “Tape Drives”.
Initially, these areas are not expanded. Click the highest-level items to
show next-level items.
Scalar i2000 User’s Guide 72
Page 86

Chapter 2 Troubleshooting Your Library
Note
Working With Command History Logs
If logical serial number addressing is enabled on the Physical Library
dialog box (Setup→ Physical Library), tape drives are listed according to
their logical serial numbers. If logical serial number addressing is
disabled, the drives are listed according to their physical serial numbers.
Also notice that command history logs for the LMC and the controller
LUNs are available only from the physical view.
The library is a multi-LUN device. To meet SCSI
standards, a LUN 0 is allocated as a controller LUN
on each blade, including the MCB and the I/O
blades. The command history log for a controller
LUN includes commands intended for the blade,
not a specific logical unit connected to the blade.
4 To access the command history logs (for LMC, controller LUNs,
partitions, or tape drives), select one or more device check boxes, and
then click OK.
Scalar i2000 User’s Guide 73
Page 87

Chapter 2 Troubleshooting Your Library
Working With Command History Logs
A list of log files appears in the Command History Log dialog box.
From this log-list view of the Command History Log dialog box, you can
perform the following tasks:
• Display the contents of a log by clicking the Open button
(proceed to the next step)
• Mail or save a log by clicking the Send button (see Mailing and
Saving Logs on page 75)
5 Click a log file to highlight it, and then click Open.
The contents of the log file appear.
Scalar i2000 User’s Guide 74
Page 88

Mailing and Saving Logs2
Note
Chapter 2 Troubleshooting Your Library
Working With Command History Logs
The Send button on the log-list view of the Command History Log dialog
box enables you to send logs to e-mail addresses. If you are accessing the
LMC from a remote client, Send also enables you to save the information
to a file.
• You can mail or save logs from a remote client.
However, you cannot save logs from the
library’s touch screen.
• Before you perform the following procedure,
you must make sure that e-mail is appropriately
configured in the LMC so that the library can
send logs to the recipient. For more information
about configuring e-mail, see the Scalar i2000
User’s Guide.
1 From the log-list view of the Command History Log dialog box, click
a log file to highlight it, and then click Send.
The Email, Save or Print Table dialog box appears.
2 Perform one of the following tasks:
• To indicate that you want to send the log as an e-mail message to
a recipient, select Email, and then either type an e-mail address
in the Email text box or select an existing address from the dropdown list. You can type a comment in the Comment text box to
send with the log.
• To indicate that you want to save the log, select Save, and then
either type in the Save text box a path and a file name to which
you want the information saved or click Browse to specify a
location and a file name.
Scalar i2000 User’s Guide 75
Page 89

3 To send, click OK.
Note
Accessing Online Help
For further help, you can access the library’s Online Help system.
• To access the entire Online Help system, click Help→ Content.
• To access context-sensitive help, click the Help button on any dialog
box.GHCGHCGHC
Chapter 2 Troubleshooting Your Library
Accessing Online Help
The Save option is available to remote client users
only. It appears grayed out on the touch screen.
Scalar i2000 User’s Guide 76
Page 90

Chapter 3
3Description
The Scalar i2000 library automates the retrieval, storage, and control of
tape cartridges. Application software on the host can use the library’s
robotics to mount cartridges into tape drives and retrieve them without
operator intervention.
The library can be installed on a solid or raised floor. It has a standard 19inch rack footprint and can be placed in a standard server rack space.
Because the library provides access by way of the access and service
doors, the library can be placed with either side against a wall or between
racks.
Figure 11 on page 78 shows a front view of the library, consisting of a
control module and an expansion module.
Scalar i2000 User’s Guide 77
Page 91

Figure 11 Front View of a
control module
expansion module
touch screen
I/E station
access doors
operator panel
Control Module and Expansion
Module
Chapter 3 Description
Scalar i2000 User’s Guide 78
The library is designed for ease of installation, configuration, and field
upgrades. The minimum library configuration consists of one control
module. You can add up to seven expansion modules as storage and tape
drive requirements change. The maximum library configuration can
accommodate from 102 to 3,492 LTO cartridges or from 100 to 2,915 DLT
cartridges, from 1 to 96 tape drives, and from 1 to 8 Import/Export (I/E)
stations.
Page 92

This chapter includes the following sections:
• Library Features on page 79
• Control Module on page 83
• Expansion Modules on page 84
• Library Management Module on page 86
• I/O Management Units on page 87
• Cartridge Accessor on page 89
• Import/Export Stations on page 89
• Cartridges on page 91
• Cartridge Magazines on page 92
• Tape Drives on page 94
• Mixed Media Support and Rules on page 97
• Operator Panel on page 100
• Power System on page 101
Chapter 3 Description
Library Features
Library Features
This section describes several library features.
The library provides a storage density of 720 cartridges (LTO) per square
Density 3
Scalar i2000 User’s Guide 79
meter. Each module, also referred to as a frame, has two storage racks:
one on the drive side and another on the door side. A rack consists of up
to 10 horizontal sections and three or four columns of magazines,
depending on the rack configuration. Each magazine, located at the
intersection of a particular section and a particular column, consists of
five or six cartridge slots, depending on the type of media (DLT or LTO
respectively).
Page 93

Centralized Management3
Proactive Availability 3
Chapter 3 Description
Library Features
The Library Management Console (LMC) gives you a single point from
which to view all library components, including robotics, drives, storage,
I/E stations, and network connectivity. You can use this graphical user
interface both locally from the library’s touch screen and remotely from a
remote client. The LMC communicates with the LMC server that runs on
the library. The LMC uses a simple and intuitive graphical style that is
secure and provides library managers with native partitioning ability.
The library can alert you about problems before they occur. The library
checks the complete data path at user-defined intervals to make sure that
it is functioning properly before backups begin. The library also monitors
its six major subsystems (drives, power, robotics, cooling, connectivity,
and control). You can configure the library to send notifications of
problems to one or more e-mail accounts, including Quantum service
personnel. For more information about the library’s monitoring and
reporting capabilities, see
Maintaining Your Library on page 203.
Serviceability and Reliability 3
Data Path Conditioning 3
The library has extensive serviceability and reliability features. You can
hot swap drives, power supplies (in redundant power configurations
only), Input/Output (I/O) blades, and fans. Host port failover, an
advanced feature that moves a host’s communication stream from a
failed connection to a working connection without disrupting the backup
operation, maintains connectivity whether the failure occurs on the host,
the switch, or the library.
Your backup system and data path are idle most of the time. When
backups begin, the system is used intensively at maximum bandwidth.
The library provides you with notifications and a robust ticket system
that notifies you of any problems it identifies, enabling you to solve them
before backups begin. For more information about the library’s
notification system, ticket system, and other troubleshooting help, see
Troubleshooting Your Library on page 6.
Quantum provides an automatic means of verifying, monitoring, and
protecting data path integrity between hosts and library drives. This
feature is referred to as data path conditioning. Using this feature,
administrators can proactively detect and resolve data path problems
before they affect backups, restore operations, and other data transfer
operations. Data path conditioning makes sure that data transmissions
are optimized and reliable, resulting in improved system availability.
Scalar i2000 User’s Guide 80
Page 94

Chapter 3 Description
Library Features
Data path conditioning occurs in two separately managed areas:
• Between host and Fibre Channel (FC) I/O blades
• Between FC I/O blades and library drives
The Host Registration Service (HRS), an optional utility that runs on the
host, manages data path conditioning along the path between the host
and the FC I/O blade. HRS automatically sends pulses to the I/O blade at
regular, configurable intervals. The I/O blade monitors the data path for
the anticipated pulses and generates a reliability, availability, and
serviceability (RAS) ticket if two intervals pass without receiving a pulse
from the host. This indicates a host connection failure.
The FC I/O blade manages data path conditioning along the path
between itself and the library drives. Data path monitoring automatically
occurs at regular, configurable intervals. The I/O blade generates a RAS
ticket if monitoring tests fail for two intervals. This indicates either loss of
connectivity or drive failure. The FC I/O blades include the data path
conditioning feature. Administrators can use the LMC to configure data
path conditioning.
SAN Backup 3
Host Attachment 3
Storage area network (SAN) support is built into the library. Fibre
Channel throughput results in huge amounts of data being stored
quickly. For more information about running your library as part of a
SAN environment, see the ADIC Management Console User’s Guide.
Requests issued from the host application result in cartridge movement
in the library. The primary requests issued are for mounting and
dismounting cartridges in and out of the tape drives and for importing
and exporting cartridges in and out of the library. The library manages
the physical location. In addition to requesting cartridge movement in the
library, the host application can use the FC or SCSI command interface to
obtain status information, configuration information, and cartridge
storage information from the library.
Hosts can be attached to the library in the following ways:
• SDLT-320 SCSI-interfaced drives can be connected to the SAN when
they are directly connected to an external Storage Networking
Controller (SNC) 5100. There is no area provided to mount the SNC
inside the library modules, so you must plan for extra rack space near
the library.
Scalar i2000 User’s Guide 81
Page 95

Remote Management 3
Chapter 3 Description
Library Features
• FC and SCSI drives can be directly attached to host systems or to the
SAN. In these configurations, the management control blade (MCB)
has one library control port (FC or SCSI) connecting to the controlling
host computer.
• FC drives can be attached to FC I/O blades in the I/O management
unit. There are two ports on each FC I/O blade that can be connected
directly to the host or to the SAN.
The library can be managed locally or remotely using the LMC. Locally,
the LMC is displayed on the touch screen on the front of the library.
Remotely, the LMC is accessed through a client instance of the LMC
software on any computer on the network. For more information about
accessing
Logging On From the LMC Applet (Web Browser) on
page 340. For more information about the LMC, see Library
Management Console (LMC) on page 349.
The LMC provides additional monitoring of a SAN-attached library over
the network to a management server by using Simple Network
Management Protocol (SNMP). This includes library subsystem health
and status information and early fault notification. For more information,
see the Intelligent Libraries Basic SNMP Reference Guide.
The library also supports the Common Information Model (CIM) server
based on the Storage Management Initiative Specification (SMI-S) on the
MCB. A CIM client can use the CIM server to monitor the SAN-attached
library. For more information, see the Intelligent Libraries SMI-S Reference
Guide.
If you purchased capacity on demand, the library is initially licensed for a
Capacity on Demand 3
default configuration of 100 DLT or 102 LTO storage slots. The number of
storage slots differs between media types because the library only
supports full magazines for capacity on demand.
The library’s license key must be enabled during installation to configure
those parts of the library that are governed by additional licensing.
Customer license keys are available from Quantum technical service.
The capacity on demand library can be expanded from a single module to
up to eight modules. With capacity on demand, you can purchase enough
storage to accommodate your current needs. As your storage needs
change, you can add storage in blocks of 100 cartridges without being
required to purchase additional hardware. Capacity on demand begins at
Scalar i2000 User’s Guide 82
Page 96

Control Module
Chapter 3 Description
Control Module
100 cartridges and can be increased to as many as 3,492 LTO or 2,915 DLT
cartridges inside one library.
All library configurations include the control module, which contains the
following components at a minimum (see
• Library management module (LMM)
•I/E station
• Tape drives
• Cartridge storage
• Operator panel
• Power system
figure 12 on page 84):
The I/O management unit is optional for the control module. For more
information about the I/O management unit, see
on page 87.
Scalar i2000 User’s Guide 83
I/O Management Units
Page 97

Figure 12 Front and Back View
power
supplies
library
management
magazines
module
drive
picker
I/E
station
accessor
and
cartridge
slots
front view back view
clusters
I/O
management
unit
of the Control Module
Chapter 3 Description
Expansion Modules
Expansion Modules
Scalar i2000 User’s Guide 84
Expansion modules enable the library to expand by adding space for tape
drives, I/E stations, and cartridges. Each expansion module adds 300 to
456 LTO or 250 to 380 DLT cartridge slots, depending on the number of
tape drives installed and whether an I/E station is installed (see
on page 85). The library’s maximum configuration includes up to seven
figure 13
Page 98

Figure 13 Expansion Module
I/E station
(optional)
cartridge
magazines
drive cluster
(optional)
drive side door side
Chapter 3 Description
Expansion Modules
expansion modules for a total of eight modules. Expansion modules can
only be added to the right of the control module.
The expansion modules can accommodate the following components:
• I/O management unit (optional)
• Tape drives (optional)
• Cartridge storage
•I/E station
• AC power compartment (required only if drives are added)
If an expansion module contains only cartridges, all power is derived
from the control module.
Scalar i2000 User’s Guide 85
Page 99

Library Management Module
management control blade
robotics control unit
library motor drive
The library management module (LMM) controls and manages library
hardware and software components. It enables both SAN-connected
hosts and users who access the library using the operator panel to
configure the library, obtain system status information, and perform
various library functions. The LMM contains the management control
blade (MCB), the robotics control unit (RCU), and the library motor
driver (LMD), as shown in
Figure 14 Library Management
Module Boards
Chapter 3 Description
Library Management Module
figure 14.
Scalar i2000 User’s Guide 86
Page 100

Chapter 3 Description
I/O Management Units
Management Control Blade 3
Robotics Control Unit 3
Library Motor Driver 3
The MCB is the primary point of intelligent management in the library.
The MCB stores firmware and configuration data for itself as well as most
other intelligent components in the library. It also contains the LMC,
which enables local or remote users or hosts to operate, configure, and
monitor the library. The MCB collects status information on other
components in the library and issues notifications when problems occur.
The RCU provides robotics intelligence that controls accessor movements
and functions, including picker, pivot, and reach actions. It receives
commands from hosts or users by way of the MCB.
The LMD monitors wiring, fuses, and relays within the library. It
regulates power levels and performs other power-related functions, such
as disabling robotics when a library door opens.
I/O Management Units
The I/O management unit is an optional component that provides
connectivity and data path management to a SAN fabric and the hosts.
The I/O management unit houses up to six FC I/O blades, which provide
FC connections for the Fibre Channel drives in the module. (The control
module and each of the expansion modules can contain up to 12 FC
drives.) The I/O management unit performs all tape drive and library
host communication functions in a library that is attached to a SAN.
The I/O management unit supports two types of blades: the control
management blade (CMB) and the FC I/O blades, as shown in
on page 88.
Scalar i2000 User’s Guide 87
figure 15
 Loading...