

Page 1

4205/5205-TS-104S-PDPS
ProLinx Standalone
IEC-60870-5-104 to PDPS Communication Module with Time Stamp
July 12, 2007
User Manual
Page 2

Please Read This Notice
Successful application of this module requires a reasonable working knowledge of the ProLinx
Module, its connected devices, and the application in which the combination is to be used. For this
reason, it is important that those responsible for implementation satisfy themselves that the
combination will meet the needs of the application without exposing personnel or equipment to
unsafe or inappropriate working conditions.
This manual is provided to assist the user. Every attempt has been made to assure that the
information provided is accurate and a true reflection of the product's installation requirements. In
order to assure a complete understanding of the operation of the product, the user should read all
applicable documentation on the operation of the connected devices.
Under no conditions will ProSoft Technology be responsible or liable for indirect or consequential
damages resulting from the use or application of the product.
Reproduction of the contents of this manual, in whole or in part, without written permission from
ProSoft Technology is prohibited.
Information in this manual is subject to change without notice and does not represent a
commitment on the part of ProSoft Technology Improvements and/or changes in this manual or the
product may be made at any time. These changes will be made periodically to correct technical
inaccuracies or typographical errors.
Important Installation Instructions
Power, input and output wiring must be in accordance with Class I, Division 2
wiring methods – Article 501-4 (b) of the National Electrical Code, NFPA 70 and
in accordance with the authority having jurisdiction. The following warnings must
be heeded:
a WARNING – EXPLOSION HAZARD – SUBSTITUTION OF
COMPONENTS MAY IMPAIR SUITABILITY FOR CLASS I, DIV. 2;
b WARNING – EXPLOSION HAZARD – WHEN IN HAZARDOUS
LOCATIONS, TURN OFF POWER BEFORE REPLACING OR WIRING
MODULES, and
c WARNING – EXPLOSION HAZARD – DO NOT DISCONNECT
EQUIPMENT UNLESS POWER HAS BEEN SWITCHED OFF OR THE
AREA IS KNOWN TO BE NONHAZARDOUS.
d "THIS DEVICE SHALL BE POWERED BY CLASS 2 OUTPUTS ONLY."
Page 3

Your Feedback Please
We always want you to feel that you made the right decision to use our products. If you have
suggestions, comments, compliments or complaints about the product, documentation or support,
please write or call us.
ProSoft Technology
1675 Chester Avenue, Fourth Floor
Bakersfield, CA 93301
+1 (661) 716-5100
+1 (661) 716-5101 (Fax)
http://www.prosoft-technology.com
Copyright © ProSoft Technology, Inc. 2000 - 2007. All Rights Reserved.
4205/5205-TS-104S-PDPS User Manual
July 12, 2007
PSFT.104S.ProLinx.UM.07.07.12
ProSoft Technology ®, ProLinx ®, inRAx ®, ProTalk® and RadioLinx ® are Registered Trademarks
of ProSoft Technology, Inc.
Page 4

Page 5

Contents 4205/5205-TS-104S-PDPS ♦ ProLinx Standalone
IEC-60870-5-104 to PDPS Communication Module with Time Stamp
Contents
PLEASE READ THIS NOTICE...........................................................................................................2
Important Installation Instructions..............................................................................................2
Your Feedback Please ..................................................................................................................3
1 CUSTOMIZING THE SAMPLE CONFIGURATION FILE...........................................................7
1.1 Obtain the Sample Configuration Files.......................................................................7
1.1.1 PDPS Protocol Specific Configuration...........................................................................8
1.1.2 [PROFIBUS SLAVE] Section.........................................................................................8
1.1.3 IEC 60870-5-104 Server section .................................................................................12
1.1.4 [Window Parameters]...................................................................................................12
1.1.5 [SNTP CLIENT]............................................................................................................12
1.1.6 [IEC-870-5-104] ...........................................................................................................14
1.1.7 [IEC-870-5-104 IP Addresses].....................................................................................22
1.1.8 [IEC-870-5-104 Database]...........................................................................................22
1.1.9 [M_SP_NA_1 104] Section ..........................................................................................25
1.1.10 [M_DP_NA_1 104] Section..........................................................................................25
1.1.11 [M_ST_NA_1 104] Section ..........................................................................................26
1.1.12 [M_ME_NA_1 104] Section..........................................................................................26
1.1.13 [M_ME_NB_1 104] Section..........................................................................................26
1.1.14 [M_ME_NC_1 104] Section .........................................................................................27
1.1.15 [M_IT_NA_1 104] Section............................................................................................27
1.1.16 [C_SC_NA_1 104] Section ..........................................................................................27
1.1.17 [C_DC_NA_1 104] Section ..........................................................................................28
1.1.18 [C_RC_NA_1 104] Section ..........................................................................................28
1.1.19 [C_SE_NA_1 104] Section...........................................................................................29
1.1.20 [C_SE_NB_1 104] Section...........................................................................................29
1.1.21 [C_SE_NC_1 104] Section ..........................................................................................30
1.1.22 Group Definition ...........................................................................................................30
1.1.23 [Data Map] Section ......................................................................................................31
1.1.24 [E-MAIL] Section ..........................................................................................................33
1.1.25 Creating Custom E-Mail Reports .................................................................................34
1.1.26 Example E-mail Report File .........................................................................................34
2 PROTOCOL IMPLEMENTATION.............................................................................................35
2.1 IEC-60870-5-104 (104S) Protocol Implementation....................................................35
2.1.1 Module Address ...........................................................................................................36
2.1.2 Monitor Direction and Control Direction – Point Definition ..........................................37
2.1.3 Using Monitor Points....................................................................................................38
2.1.4 Using Control (Command) Points ................................................................................46
2.1.5 Data Communication ...................................................................................................49
2.1.6 Events ..........................................................................................................................53
2.2 Redundant Connections.............................................................................................60
2.3 PDPS Protocol Implementation..................................................................................62
2.3.1 Functional Overview ....................................................................................................62
3 DIAGNOSTICS AND TROUBLESHOOTING ...........................................................................71
3.1 Definition of Module's Extended Diagnostics Data .................................................71
ProSoft Technology, Inc. Page 5 of 128
July 12, 2007
Page 6

4205/5205-TS-104S-PDPS ♦ ProLinx Standalone Contents
IEC-60870-5-104 to PDPS Communication Module with Time Stamp
3.1.1 The Configuration/Debug Menu .................................................................................. 72
3.1.2 Required Hardware ..................................................................................................... 74
3.1.3 Main Menu................................................................................................................... 75
3.1.4 Database View Menu .................................................................................................. 79
3.1.5 IEC-870-5-104 Server Menu ....................................................................................... 81
3.1.6 Network Menu ............................................................................................................. 83
3.1.7 PROFIBUS Slave Menu .............................................................................................. 84
4 REFERENCE ............................................................................................................................ 91
4.1 Product Specifications...............................................................................................91
4.1.1 General Specifications ................................................................................................ 91
4.1.2 Internal Database ........................................................................................................ 91
4.1.3 Hardware Specifications.............................................................................................. 92
4.1.4 Port Physical and Protocol Specifications................................................................... 93
4.1.5 SNTP Support .............................................................................................................95
4.2 GSD File: prlx05a5.gsd............................................................................................... 96
4.3 Slave Error and Status Data....................................................................................... 99
4.3.1 General Communication Status and Client 0 Status................................................... 99
4.3.2 Client 1 Status ........................................................................................................... 101
4.4 LED Indicators...........................................................................................................101
4.5 Command Qualifiers................................................................................................. 102
4.6 Parameter Qualifiers................................................................................................. 102
4.7 Design Forms............................................................................................................103
4.8 IEC 60870-5-104 Server Interoperability Document...............................................107
4.8.1 System or device....................................................................................................... 107
4.8.2 Application Layer....................................................................................................... 107
4.8.3 Selection of standard ASDUs.................................................................................... 108
4.8.4 Type identifier and cause of transmission assignments............................................ 111
4.8.5 Basic Application Functions ...................................................................................... 112
5 SUPPORT, SERVICE & EXTENDED WARRANTY............................................................... 117
5.1 How to Contact Us: Sales and Support..................................................................118
5.2 Return Material Authorization (RMA) Policies and Conditions............................ 118
5.2.1 All Product Returns ................................................................................................... 119
5.3 Procedures for Return of Units Under Warranty:.................................................. 119
5.4 Procedures for Return of Units Out of Warranty:.................................................. 120
5.4.1 Un-repairable Units ................................................................................................... 120
5.5 LIMITED WARRANTY................................................................................................ 121
5.5.1 What Is Covered By This Warranty........................................................................... 121
5.5.2 What Is Not Covered By This Warranty ....................................................................122
5.5.3 DISCLAIMER REGARDING HIGH RISK ACTIVITIES ............................................. 122
5.5.4 DISCLAIMER OF ALL OTHER WARRANTIES ........................................................ 123
5.5.5 LIMITATION OF REMEDIES**.................................................................................. 123
5.5.6 Time Limit for Bringing Suit ....................................................................................... 123
5.5.7 No Other Warranties ................................................................................................. 123
5.5.8 Intellectual Property................................................................................................... 123
5.5.9 Additional Restrictions Relating To Software And Other Intellectual Property ......... 124
5.5.10 Allocation of risks....................................................................................................... 124
5.5.11 Controlling Law and Severability............................................................................... 124
INDEX.............................................................................................................................................125
Page 6 of 128 ProSoft Technology, Inc.
July 12, 2007
Page 7

Customizing the Sample Configuration File 4205/5205-TS-104S-PDPS ♦ ProLinx Standalone
IEC-60870-5-104 to PDPS Communication Module with Time Stamp
1 Customizing the Sample Configuration File
In This Chapter
Obtain the Sample Configuration Files..................................... 7
PDPS Protocol Specific Configuration .....................................8
[PROFIBUS SLAVE] Section ...................................................8
Set_Param (SAP61)............................................................... 10
IEC 60870-5-104 Server section............................................ 12
[Data Map] Section................................................................. 31
[E-MAIL] Section .................................................................... 33
Creating Custom E-Mail Reports............................................ 34
Example E-mail Report File ................................................... 34
1.1 Obtain the Sample Configuration Files
The ProSoft Solutions CD is organized in folders by module name. In the folder
for the module you are using, you will find sample configuration files and other
information.
1 Use Windows Explorer to locate the sample configuration files for your
ProLinx module on the ProLinx CD.
2 When you have located the correct configuration files, use the Copy and
Paste commands to move the files to a location on your PC's hard drive. We
recommend C:\temp.
3 Files copied from a CD-ROM are read-only. The next step is to make the files
writable. Navigate to the directory where you copied the files, then select the
files and click the right mouse button to open a shortcut menu. On the
shortcut menu, select Properties, and clear (uncheck) the Read Only check
box.
4 The next step is to open the configuration files in a text editor such as
Notepad, which comes with Windows. To start Notepad, click the Start button,
and then choose Programs → Accessories → Notepad.
5 When Notepad starts, open the File menu, and then choose Open. Navigate
to the folder where you copied the configuration file on your PC and select the
file. Click Open. The configuration file will open in Notepad, ready for editing.
Note: We do not recommend opening the configuration file in a word
processor such as Microsoft Word, because the file may be saved in a format
that cannot be read by the module.
ProSoft Technology, Inc. Page 7 of 128
July 12, 2007
Page 8

4205/5205-TS-104S-PDPS ♦ ProLinx Standalone Customizing the Sample Configuration File
IEC-60870-5-104 to PDPS Communication Module with Time Stamp
1.1.1 PDPS Protocol Specific Configuration
The following is excerpted from a configuration file showing typical examples of
the PROFIBUS Slave Port of a CFG file for a PDPS port. Shipped with each unit
is a default configuration file that can easily form the basis for a working solution.
This file can either be downloaded from the ProSoft web site at
http://www.prosoft-technology.com
# Example configuration file for the 4105-xxxx-PDPS communication module.
#
# COMPANY : ProLinx Communication Gateways, Inc.
# DATE :
#
# This information sets up the database.
[Module]
Module Name: 5105-xxxx-PDPS
# This is the data area for setting the PROFIBUS Slave parameters
[PROFIBUS Slave]
Slave Address : 6 #PROFIBUS node address for slave (0-125)
Swap Input Bytes : No #Swap bytes in input image (Yes or No)
Swap Output Bytes : No #Swap bytes in output image (Yes or No)
Comm Failure Mode : 1 #0=x-fer on comm fail, 1=no x-fer on fail
Comm Timeout Multiplier : 1 #(1 to 10) * 125 mSec communication timeout
, or transferred from the module.
1.1.2 [PROFIBUS SLAVE] Section
The PROFIBUS Slave section contains the data that applies to the PROFIBUS
Slave parameters.
[PROFIBUS Slave]
Slave Address : 6 #PROFIBUS node address for slave (0-125)
Swap Input Bytes : No #Swap bytes in input image (Yes or No)
Swap Output Bytes : No #Swap bytes in output image (Yes or No)
Comm Failure Mode : 1 #0=x-fer on comm fail, 1=no x-fer on fail
Comm Timeout Multiplier : 10 #(1 to 10) * 125 mSec communication timeout
Slave Address
0 to 125
The parameter specifies the node address on the PROFIBUS network for the
slave emulated in the module. Each node on the network must have a unique
address.
Note: Although valid PROFIBUS Node addresses range from 0 to 125, Node 0
is not a valid node number for a Slave module and that Nodes 0, 1, and 2 are
usually reserved for PROFIBUS Masters. Users are advised to use Node
numbers 3-125
Page 8 of 128 ProSoft Technology, Inc.
July 12, 2007
Page 9

Customizing the Sample Configuration File 4205/5205-TS-104S-PDPS ♦ ProLinx Standalone
IEC-60870-5-104 to PDPS Communication Module with Time Stamp
Swap Input Bytes
Yes or No
This parameter specifies if the data in the input data area of the module is to be
byte swapped. If the order of the bytes in the words stored in the database is not
correct, use this option. A value of Yes causes the module's program to swap the
bytes in each word. A value of No indicates no byte swapping will occur.
Swap Output Bytes
Yes or No
This parameter specifies if the data in the output data area of the module is to be
byte swapped. If the order of the bytes in the words stored in the database is not
correct, use this option. A value of Yes causes the module's program to swap the
bytes in each word. A value of No indicates no byte swapping will occur.
Comm Failure Mode
0 or 1
This parameter sets the data transfer mode of the module's PROFIBUS output
image to the internal database when a communication failure on the PROFIBUS
interface is detected. If the parameter is set to 0, the output image will continue to
be transferred. If the parameter is set to 1, the output image will not be
transferred and the last values will be retained.
Comm Timeout Multiplier
1 to 10
This parameter sets the communication timeout value for the module. The value
entered is multiplied by 125 milliseconds to determine the actual timeout value.
For example, a value of 1 specifies a communication timeout of 125 milliseconds.
ProSoft Technology, Inc. Page 9 of 128
July 12, 2007
Page 10
4205/5205-TS-104S-PDPS ♦ ProLinx Standalone Customizing the Sample Configuration File
IEC-60870-5-104 to PDPS Communication Module with Time Stamp
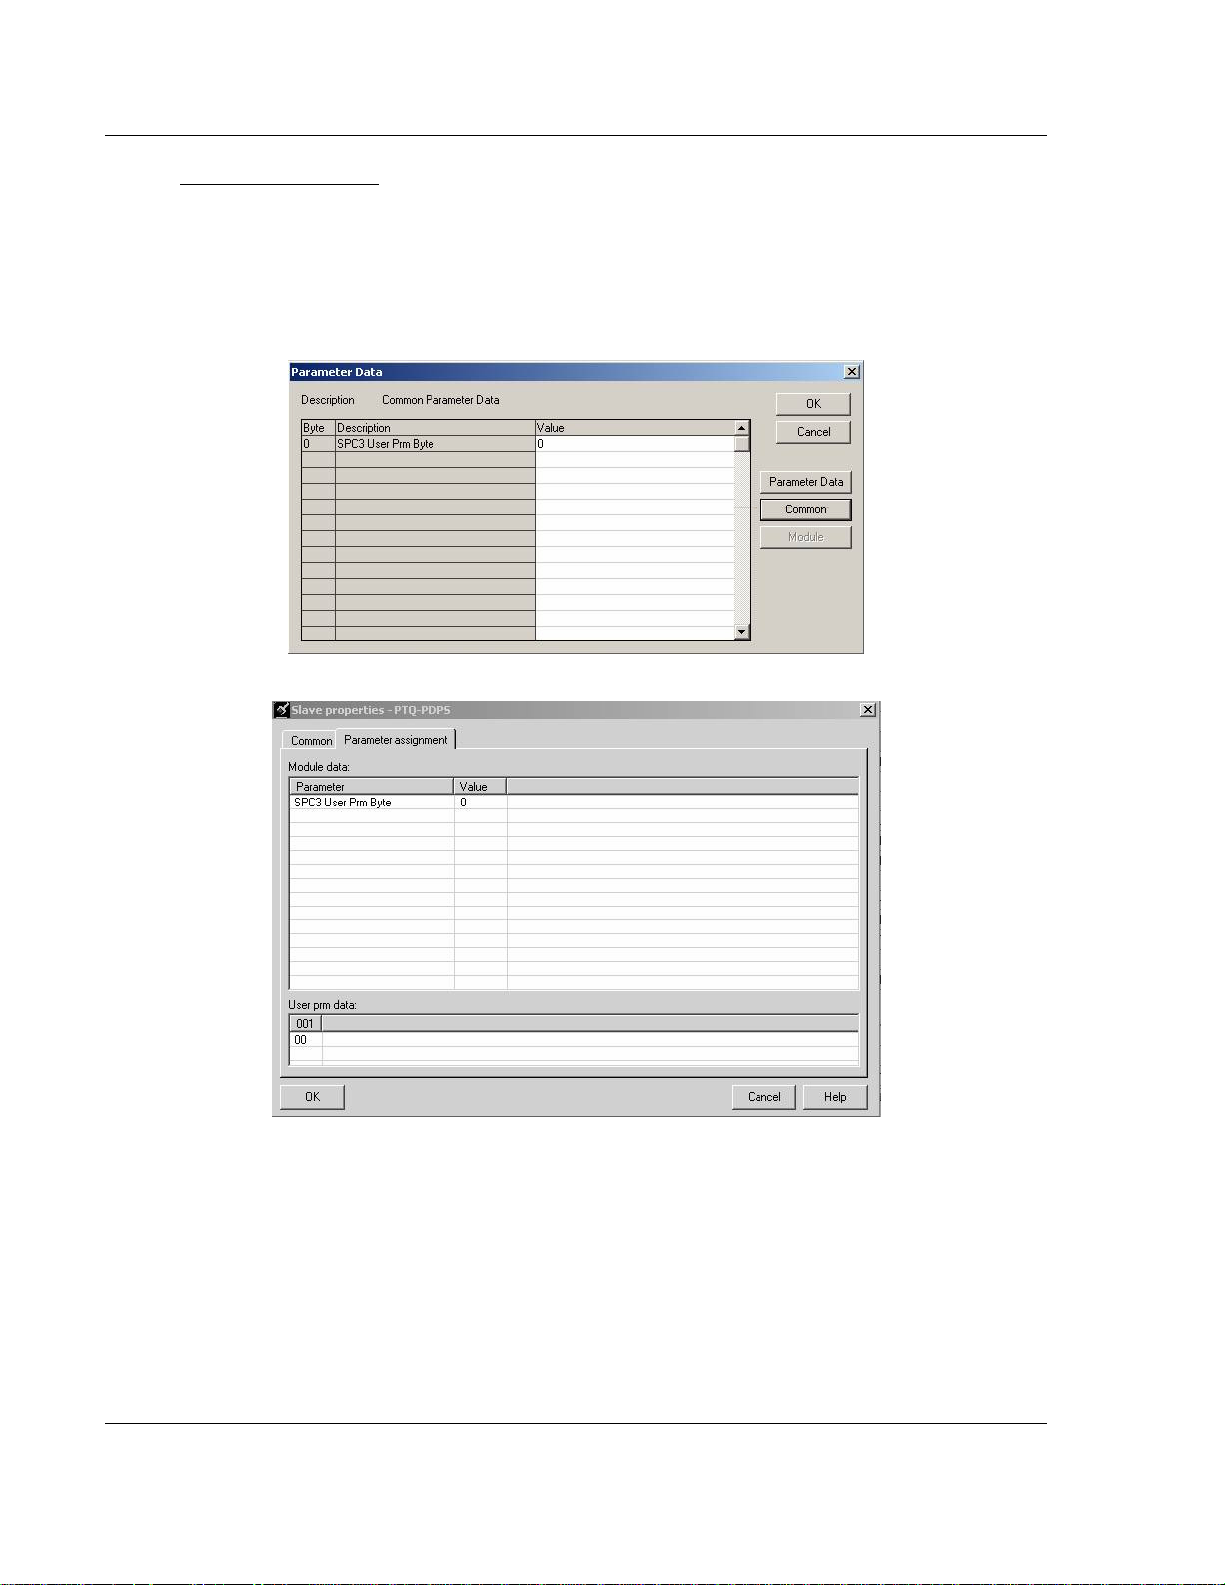
Set_Param (SAP61)
ProSoft PROFIBUS Slave (PDPS) devices have a configurable parameter for
SPC3 User Prm Byte. The following illustrations show the value of this parameter
in Sycon, the configuration tool for ProLinx PROFIBUS Master devices, and in
ProSoft Configuration Builder for PROFIBUS, the configuration tool for ProSoft
PROFIBUS Master devices.
Page 10 of 128 ProSoft Technology, Inc.
July 12, 2007
Page 11

Customizing the Sample Configuration File 4205/5205-TS-104S-PDPS ♦ ProLinx Standalone
IEC-60870-5-104 to PDPS Communication Module with Time Stamp
Parameter Data Structure
SPC3 evaluates the first seven data bytes (without user prm data), or the first
eight data bytes (with user prm data). The first seven bytes are specified
according to the standard. The eighth byte is used for SPC3-specific
communications. The additional bytes are available to the application.
Byte Bit Position Designation
0 Lock
1
2
3
4
5
6
7
8 to 243
7 6 5 4 3 2 1 0
Unio
Reg
Req
Sync
Req
Free
Req
WD
on
Res Res Res Station status
WD_Fact_1
WD_Fact_2
MinTSDR
Ident_Number_High
Ident_Number_Low
Group_Ident
Spec_User_Prm_Byte
User_Prm_Data
Byte 7 Spec_User_Prm_Byte
Bit Name Significance Default State
0 Dis_Startbit The start bit monitoring in the receiver
is switched off with this bit
1 Dis_Stopbit Stop bit monitoring in the receiver is
switched off with this bit
2 WD_Base This bit specifies the time base used
to clock the watchdog.
WD_Base = 0: time base 10 ms
WD_Base = 1: time base 1 ms
3 to 4 Res To be parameterized with 0 0
5 Publisher_Enable DXB-publisher-functionality of the
SPC3 is activated with this bit
6 to 7 Res To be parameterized with 0 0
Dis_Startbit = 1,
That is, start bit monitoring is switched off.
Dis_Stopbit = 0
That is, stop bit monitoring is not switched
off.
WD_Base = 0
That is, the time base is 10 ms.
Publisher_Enable = 0, DXB-requesttelegrams are ignored;
Publisher_Enable = 1, DXB-requesttelegramme are processed
ProSoft Technology, Inc. Page 11 of 128
July 12, 2007
Page 12

4205/5205-TS-104S-PDPS ♦ ProLinx Standalone Customizing the Sample Configuration File
IEC-60870-5-104 to PDPS Communication Module with Time Stamp
1.1.3 IEC 60870-5-104 Server section
The following is excerpted from a configuration file showing typical examples
used for configuration of the 104S driver. A default configuration file for each
module application that includes the 101S interface card is available for
download from the ProSoft web site. This default configuration can easily form
the basis for a working solution. This file can either be downloaded from the
ProSoft web site at http:/www.prosoft-technology.com, or transferred from the
module.
1.1.4 [Window Parameters]
This section is used to define the control window to send events and time data
from the MNET interface to and from the 104S interface. If either or both of
these parameters are invalid or -1, then this feature is disabled.
If the database registers for the two areas (non-overlapping -- not checked by
application) are valid, this feature is utilized. Each window requires 100 words of
the database. The input window is read by the module and the output window is
written by the module.
[Window Parameters]
DB Input Window Start : 3000 #Start register for input window (-1=not used)
DB Output Window Start : 3100 #Start register for output window (-1=not used)
DB Input Window Start
The DB Input Window Start parameter defines the Prolinx database starting
register where the command block request should be transferred to (from the
remote node to the Prolinx module). A value of –1 disables this functionality.
DB Output Window Start
The DB Output Window Start parameter defines the Prolinx database starting
register where the command block response should be transferred to (from the
Prolinx module to the remote node ). So some command blocks will require a
response from the module (for example the command block to retrieve the
current time from the module). A value of –1 disables this functionality.
1.1.5 [SNTP CLIENT]
The [SNTP CLIENT] section of the CFG file is used to specify the parameters for
the Simple Network Time Protocol (SNTP) client provided with the protocol
driver. This client is required in order to keep the driver's internal clock set
correctly. This version of the driver supports SNTP Revision 3 and stratum
between 1 and 14.
SNTP is used for time synchronization of produced and consumed commands.
When an exchange occurs the driver compares time stamps from the previous
exchange. When the new exchange time is less than the previous exchange, the
exchange is ignored. This can occur when the Ethernet packets are routed and
delayed. Time synchronization provides for data integrity.
Page 12 of 128 ProSoft Technology, Inc.
July 12, 2007
Page 13

Customizing the Sample Configuration File 4205/5205-TS-104S-PDPS ♦ ProLinx Standalone
IEC-60870-5-104 to PDPS Communication Module with Time Stamp
The SNTP driver will compute a new clock value every 5 minutes using the
average value of 10 samples each collected over an approximate 6-second
period. This new value will be used to adjust the clock maintained by the SNTP
driver and used by the application. If a valid database register is specified, the
driver will place the time value into the module's database. The first two registers
will contain the number of seconds and the next two registers will contain the
number of microseconds since January 1, 1970.
A list of some of the common NTP servers can be obtained at
http://www.ntp.org/
the appropriate IP address. Other server lists can be found on the Internet by
searching on "NTP Servers" with your browser.
, http://www.eecis.udel.edu/~mills/ntp/servers.html, along with
NTP Server IP Address
Enter in dotted notation
This parameter sets the IP address of the NTP server to utilize for time
acquisition. Select an NTP server with the greatest accuracy that can be
accessed all the time from your network. Setting this IP address to 0.0.0.0
disables SNTP server requests.
Time Zone
–11 to 11
This parameter sets the time zone offset from UTC. If UTC time is to be utilized
in the module, set this value to zero. Positive values are for time zones west of
UTC, and negative values are for time zones east of UTC.
Use Daylight Savings Time
Yes or No
This parameter specifies if daylight savings time will be used in the time
computation.
Database Register
–1 or 0 to 3992 as an even value
This parameter specifies if the NTP time computed by the driver is to be placed
into the module's database. If a value of –1 is specified, the time will not be
placed into the database. If the value is between 0 and 3992, the time will be
placed in the database. The first 4 bytes will represent the seconds since
1/1/1970, and the second 4 bytes will represent the number of microseconds. An
even value should be used for the register value in order for the data to be stored
correctly.
ProSoft Technology, Inc. Page 13 of 128
July 12, 2007
Page 14

4205/5205-TS-104S-PDPS ♦ ProLinx Standalone Customizing the Sample Configuration File
IEC-60870-5-104 to PDPS Communication Module with Time Stamp
1.1.6 [IEC-870-5-104]
This section provides information required to configure a server application with
the module. Most entries contained within this section are self explanatory An
item of concern is the maximum size of the total database, although it is possible
to configure a database of considerable size, this would not work, as the
maximum Class 0 request may not exceed 2048 bytes in size.
The following example shows a sample [IEC-870-5-104] section:
# Network configuration
Use IP List : N #Use IP list to validate connection (Y/N)
Override StartDT : Y #Used to ignore STARTDT/STOPDT state (Y/N)
Clear queue on close : Y #Clear the queue when connection closed (Y/N)
t1 timeout set value : 15 #timeout of send or test ASDU
t2 timeout set value : 10 #timeout of ack when no data (t2<t1)
t3 timeout set value : 30 #timeout for test frame on idle state
k (maximum queue) : 12 #maximum number of message to hold in queue
#(1-20)
w (latest ack threshold) : 8 #threshold value when to send ack (1-20)
Time DB Offset : 1020 #DB location of IEC time
Command Delay Timer : 6000 #mSec to add to cmd w\ time-tag to check for
#validity
# General protocol settings
Common Address of ASDU : 1 #Range 0 to 65535
Cyclic data transmission : 0 #Numb of milliseconds between cyclic updates
Select/Operate Timeout : 2000 #Milliseconds before select timeout
Use ACTTERM with setpoint : Y #ACTCON is last response to cmd (Yes or No)
Use ACTTERM with step : Y #ACTCON is last response to cmd (Yes or No)
Maximum ASDU Resp Len : 248 #maximum ASDU response message length (25-255)
# These two parameters are utilized if the Mode A operation is to be used for the
# counter freeze operation. If they are not used, the the module will operate in
# Mode D.
Freeze Start Type : N #D=Day, H=Hour, M=Minute, N=Not used
Interval For Freeze : 30 #Number of seconds after start type
#(0 to 65535)
# This section is used to define priority queues for the module. The data types
# that can return events can be assigned priorities so that events of data types
# will be returned before other data types. This may cause events to be lost as
# the event buffers for low priority queues may overflow. If this feature is
# utilized, each data type must be assigned a unique index from 0 to 6. The
# lower the index the higher the priority (0=highest priority).
Set Priority Queues : 1 #Set user defined priority queues 1=Yes, 0=No
M_SP_NA Priority : 1 #Unique index for this data type in queue
#(0-5)
M_DP_NA Priority : 0 #Unique index for this data type in queue
#(0-5)
M_ST_NA Priority : 5 #Unique index for this data type in queue
#(0-5)
M_ME_NA Priority : 4 #Unique index for this data type in queue
#(0-5)
M_ME_NB Priority : 3 #Unique index for this data type in queue
#(0-5)
Page 14 of 128 ProSoft Technology, Inc.
July 12, 2007
Page 15

Customizing the Sample Configuration File 4205/5205-TS-104S-PDPS ♦ ProLinx Standalone
IEC-60870-5-104 to PDPS Communication Module with Time Stamp
M_ME_NC Priority : 2 #Unique index for this data type in queue
#(0-5)
M_IT_NA Priority : 6 #Unique index for this data type in queue
#(0-5)
# This section is used to define the parameters utilized for the Invalid Bit
# Monitoring. If this feature is not used, set the parameters to zero. If used,
# the Cyclic Set IV Time must be at least 3 times larger than the IV Check Delay
# Time. If the IV Fail Count parameter is zero, the feature will be disabled.
Cyclic Set IV Time : 60 #Number of sec intervals between IV sets
IV Check Delay Time : 15 #Number of sec intervals between investigation
IV Fail Count : 3 #Number of IV failures recognized before
#reporting
# Event configuration
Event Scan delay : 1 #MSec between event scanning (0-65535) 0=Disable
M_SP_NA Scan Events : 1 #0=No scanning, 1=scan for events
M_SP_NA Time Type : 2 #0=None, 2=CP56 time
M_DP_NA Scan Events : 1 #0=No scanning, 1=scan for events
M_DP_NA Time Type : 2 #0=None, 2=CP56 time
M_ST_NA Scan Events : 1 #0=No scanning, 1=scan for events
M_ST_NA Time Type : 2 #0=None, 2=CP56 time
M_ME_NA Scan Events : 1 #0=No scanning, 1=scan for events
M_ME_NA Time Type : 2 #0=None, 2=CP56 time
M_ME_NB Scan Events : 1 #0=No scanning, 1=scan for events
M_ME_NB Time Type : 2 #0=None, 2=CP56 time
M_ME_NC Scan Events : 0 #0=No scanning, 1=scan for events
M_ME_NC Time Type : 2 #0=None, 2=CP56 time
M_IT_NA Time Type : 2 #0=None, 2=CP56 time
Modify each parameter based on the needs of your application.
Use IP List
Use IP List : 0 #Use IP list to validate connection
#(0=No, 1=Yes)
This parameter specifies if the IP address of the host connected to the system
will be validated. If the parameter is set to 0, any host may connect to the unit. If
the parameter is set to 1, only hosts in the IP list will be permitted to connect to
the unit.
Override StartDT
Override StartDT : 1 #Used to ignore STARTDT/STOPDT state
#(0=No, 1=Yes)
This parameter is used when testing the unit with a simulator or with a client unit
that does not meet the IEC 60870-5-104 specification. After the host connects to
the system, it will send a STARTDT.ACT U-format message to the unit to permit
the unit to start sending data. If the client does not support this requirement, set
the parameter to a value of 1. Set the parameter to 0 if the unit sends the
STARTDT.ACT message.
ProSoft Technology, Inc. Page 15 of 128
July 12, 2007
Page 16

4205/5205-TS-104S-PDPS ♦ ProLinx Standalone Customizing the Sample Configuration File
IEC-60870-5-104 to PDPS Communication Module with Time Stamp
Clear Queue on Close
Clear queue on close : 0 #Clear the queue when connection
#closed (0=No, 1=Yes)
Use this command to define if the module will store the unacknowledged buffers
in the unit after the connection is closed. If the specification is to be followed, set
this parameter to 0 and the packets will be resent after a connection is made. If
you want to flush the packets after the connection is closed, set this parameter to
1 (this is not according to the specification).
t1 Timeout Set Value
t1 timeout set value : 60 #timeout of send or test ASDU
This is the timeout of send or test ASDU's and is in units of seconds. After a
packet is sent from the unit, the client must acknowledge the packet within this
time interval or else the unit will close the connection.
t2 Timeout Set Value
t2 timeout set value : 10 #timeout of ack when no data (t2<t1)
This is a timeout of when to send an S-format message to the host to
acknowledge outstanding messages received. This parameter is in units of
seconds and must be less than the value set for t1.
t3 Timeout Set Value
t3 timeout set value : 30 #timeout for test frame on idle state
This is the timeout to wait on an idle line before the unit will send a TestFr.Act
message. This value is in units of seconds.
k (maximum queue)
k (maximum queue) : 12 #maximum number of message to hold in
#queue (1-20)
This parameter specifies the number of unacknowledged messages the unit will
buffer. This parameter must match that in the host. If the set number of buffers
are filled in the unit, no other messages will be sent until the host unit
acknowledges some or all the messages.
w (latest ack threshold)
w (latest ack threshold) : 8 #threshold value when to send ack (1-20)
This parameter must match that of the host unit and specifies the number of
messages the module will receive before sending an S-format sequence
acknowledge message when no I-format data is ready to send. It is
recommended to set this value to 2/3 the value of k.
Page 16 of 128 ProSoft Technology, Inc.
July 12, 2007
Page 17

Customizing the Sample Configuration File 4205/5205-TS-104S-PDPS ♦ ProLinx Standalone
IEC-60870-5-104 to PDPS Communication Module with Time Stamp
Common Address of ASDU
Common Address of ASDU : 1 #Range 0 to 65535
This parameter specifies the common address of the ASDU (section address) for
access to data in the module. There is only one value entered for access to all
data in the module.
Cyclic Data Transmission
Cyclic data transmission : 20000 #Numb of milliseconds between cyclic
#updates
This parameter defines the number of milliseconds between cyclic updates. The
range of values for this parameter permit update times of 1 millisecond to 5
minutes. If the parameter is set to 0, cyclic data reporting will be disabled.
Select/Operate Timeout
Select/Operate Timeout : 10000 #Milliseconds before select timeout
This parameter sets the number of milliseconds after a select command is
received in which to wait for a valid execute command. The range of values for
this parameter permit times of 1 millisecond to 30 seconds. If the parameter is
set to 0, the feature will be disabled.
Use ACTTERM with Setpoint
Use ACTTERM with setpoint : 0 #1=Yes, 0=No ACTCON is last response
#to cmd
This parameter determines if an ACTTERM will be sent. If the parameter is set to
Y, then setpoint commands will issue an ACTTERM when the command is
complete. If the parameter is set to N, ACTCON is the last response to a setpoint
command.
Use ACTTERM with Step
Use ACTTERM with step : 1 #1=Yes, 0=No ACTCON is last response
#to cmd
This parameter determines if an ACTTERM will be sent. If the parameter is set to
Y, then step commands will issue an ACTTERM when the command is complete.
If the parameter is set to N, ACTCON is the last response to a step command.
Time DB Offset
Time DB Offset : 3000 #DB location of IEC time
This parameter sets the location in the database where the module's current date
and time will be copied to.
ProSoft Technology, Inc. Page 17 of 128
July 12, 2007
Page 18

4205/5205-TS-104S-PDPS ♦ ProLinx Standalone Customizing the Sample Configuration File
IEC-60870-5-104 to PDPS Communication Module with Time Stamp
Note: The following tables lists the 12 byte, data area placed in the database if
the Time DB Offset parameter is set to a value other than –1:
Byte Length Range Description
0 to 1 2 0 to 59,999 Seconds and milliseconds
2 1 0 to 59 Minutes
3 1 0 to 23 Hour
4 1 Reserved
5 1 1 to 31 Day of the Month
6 1 1 to 12 Month
7 to 8 2 0 to 65,535 Year (four digit format, for example 2005)
9 1 Reserved
10 1 0 or 1 Invalid Flag (0 = Valid, 1 = Invalid
11 1 Reserved
Command Delay Timer
0 to 65535
This value is used for time-tag validity verification for the ASDUs listed
below. The received commands will only be accepted if [timestamp + Command
Delay Timer] is greater than the module own time.
Maximum ASDU Resp Len
Maximum ASDU Resp Len : 246 #Max ASDU response message length may
#have value from 25 to 246 (usually 246).
This parameter limits the maximum size of the ASDU portion of a response
message. Most applications will use
Freeze Start Type
a value of 246.
D=Day, H=Hour, M=Minute, N=Not used
The Freeze Start Type parameter defines when the module starts sending the
M_IT messages.
Interval for Freeze
These two parameters are utilized if the Mode A operation is to be used for the
counter freeze operation. If they are not used, the module will operate in Mode D.
Freeze Start Type : N #D=Day, H=Hour, M=Minute, N=Not used
Interval For Freeze : 30 #Number of seconds after start type (0 to
65535)
Set Priority Queues
Set Priority Queues : 1 #Set user defined priority queues
#1=Yes, 0=No
This section defines priority queues for the module. The data types that can
return events can be assigned priorities so that events of data types will be
Page 18 of 128 ProSoft Technology, Inc.
July 12, 2007
Page 19

Customizing the Sample Configuration File 4205/5205-TS-104S-PDPS ♦ ProLinx Standalone
IEC-60870-5-104 to PDPS Communication Module with Time Stamp
returned before other data types. This may cause events to be lost as the event
buffers for low priority queues may overflow. If this feature is utilized, each data
type must be assigned a unique index from 0 to 6. The lower the index, the
higher the priority (0=highest priority).
M_SP_NA Priority : 1 #Unique index for this data type in queue
#(0-5)
M_DP_NA Priority : 0 #Unique index for this data type in queue
#(0-5)
M_ST_NA Priority : 5 #Unique index for this data type in queue
#(0-5)
M_ME_NA Priority : 4 #Unique index for this data type in queue
#(0-5)
M_ME_NB Priority : 3 #Unique index for this data type in queue
#(0-5)
M_ME_NC Priority : 2 #Unique index for this data type in queue
#(0-5)
M_IT_NA Priority : 6 #Unique index for this data type in queue
#(0-5)
Each of the ASDUs affected by this feature must be assigned a unique priority
index from 0 to 6. Events of the ASDU with a priority of 0 will always be reported
before any others when they are present.
For more information, refer to Event Priority (page 58).
Cyclic Set IV Time
Cyclic Set IV Time : 0 #Number of sec intervals between IV sets
The Cyclic Set IV Time parameter must be set to determine how frequently the IV
Checks will be performed. If the IV bit is ON for a number of times given by the IV
Fail Count parameter the module will consider the point as invalid.
This section defines the parameters utilized for the Invalid Bit Monitoring. If this
feature is not used, set the parameters to zero. If used, the Cyclic Set IV Time
must be at least 3 times larger than the IV Check Delay Time. If the IV Fail Count
parameter is zero, the feature will be disabled.
For more information on using this feature, refer to Using Monitor Points (page
38).
IV Check Delay Time
IV Check Delay Time : 10 #Number of sec intervals between
#investigation
This feature allows the application to set the invalid (IV) quality bit of the protocol
for all the monitored ASDU types supported. The Cyclic Set IV Time parameter
must be at least 3 times larger than the IV Check Delay Time.
IV Fail Count
IV Fail Count : 2 #Number of IV failures recognized before
#reporting
This feature allows the application to set the invalid (IV) quality bit of the protocol
for all the monitored ASDU types supported. If you enable this feature, the
ProSoft Technology, Inc. Page 19 of 128
July 12, 2007
Page 20

4205/5205-TS-104S-PDPS ♦ ProLinx Standalone Customizing the Sample Configuration File
IEC-60870-5-104 to PDPS Communication Module with Time Stamp
processor can determine the individual IV quality bit status of each point you
configured.
To disable this feature, set the IV Fail Count parameter to 0. If used, the Cyclic
Set IV Time parameter must be at least 3 times larger than the IV Check Delay
Time.
Event Scan Delay
Event Scan delay : 1 #MSec between event scanning (0-65535)
#0=Disable
If set to 0, the feature will be disabled and the module will not generate any
events. If set from 1 to 65535, the parameter represents the number of
milliseconds between event scanning. This parameter defines how often the
program will scan for new events in the databases.
M_SP_NA Scan Events
M_SP_NA Scan Events : 1 #0=No scanning, 1=scan for events
Determines if events of this point type will be generated by the module. If 0, then
events will not be generated. If 1, events will be scanned and generated on
change.
M_SP_NA Time Type
M_SP_NA Time Type : 2 #0=None, 2=CP56 time
This parameters defines the time format used with data events. 0=None and
2=CP56 time formats.
M_DP_NA Scan Events
M_DP_NA Scan Events : 1 #0=No scanning, 1=scan for events
Determines if events of this point type will be generated by the module. If 0, then
events will not be generated. If 1, events will be scanned and generated on
change.
M_DP_NA Time Type
M_DP_NA Time Type : 2 #0=None, 2=CP56 time
This parameters defines the time format used with data events. 0=None and
2=CP56 time formats.
M_ST_NA Scan Events
M_ST_NA Scan Events : 1 #0=No scanning, 1=scan for events
Determines if events of this point type will be generated by the module. If 0, then
events will not be generated. If 1, events will be scanned and generated on
change.
Page 20 of 128 ProSoft Technology, Inc.
July 12, 2007
Page 21

Customizing the Sample Configuration File 4205/5205-TS-104S-PDPS ♦ ProLinx Standalone
IEC-60870-5-104 to PDPS Communication Module with Time Stamp
M_ST_NA Time Type
M_ST_NA Time Type : 2 #0=None, 2=CP56 time
This parameters defines the time format used with data events. 0=None and
2=CP56 time formats.
M_ME_NA Scan Events
M_ME_NA Scan Events : 1 #0=No scanning, 1=scan for events
Determines if events of this point type will be generated by the module. If 0, then
events will not be generated. If 1, events will be scanned and generated on
change.
M_ME_NA Time Type
M_ME_NA Time Type : 2 #0=None, 2=CP56 time
This parameter defines the time format used with data events. 0=None and
2=CP56 time formats.
M_ME_NB Scan Events
M_ME_NB Scan Events : 1 #0=No scanning, 1=scan for events
Determines if events of this point type will be generated by the module. If 0, then
events will not be generated. If 1, events will be scanned and generated on
change.
M_ME_NB Time Type
M_ME_NB Time Type : 2 #0=None, 2=CP56 time
This parameters defines the time format used with data events. 0=None and
2=CP56 time formats.
M_ME_NC Scan Events
M_ME_NC Scan Events : 1 #0=No scanning, 1=scan for events
Determines if events of this point type will be generated by the module. If 0, then
events will not be generated. If 1, events will be scanned and generated on
change.
M_ME_NC Time Type
M_ME_NC Time Type : 2 #0=None, 1=CP24, 2=CP56 time
This parameters defines the time format used with data events. 0=None and
2=CP56 time formats.
M_IT_NA Time Type
M_IT_NA Time Type : 2 #0=None, 2=CP56 time
This parameters defines the time format used with data events. 0=None and
2=CP56 time formats.
ProSoft Technology, Inc. Page 21 of 128
July 12, 2007
Page 22

4205/5205-TS-104S-PDPS ♦ ProLinx Standalone Customizing the Sample Configuration File
IEC-60870-5-104 to PDPS Communication Module with Time Stamp
1.1.7 [IEC-870-5-104 IP Addresses]
This section enters the IP addresses for the hosts to connect to this unit. The unit
will only accept connections from hosts listed here. This list may contain up to 10
entries between the START and END labels. The address must start in column 1,
and must be entered in standard dot notation.
The following is an example of the [IEC-870-5-104 IP Addresses] section:
[IEC-870-5-104 IP ADDRESSES]
START
192.168.0.207
192.168.0.203
192.168.0.61
END
1.1.8 [IEC-870-5-104 Database]
This section describes the [IEC-870-5-104 Database] section.
Each parameter is described below. Edit the configuration file according to the
needs of your application.
Short Pulse Time
Short Pulse Time : 2000 #MSec for short pulse command
This parameter defines the number of milliseconds to be associated with a short
pulse command. The valid range of numbers for this parameter are 0 to
2,147,483,647. Range is 0 to 2^31-1.
Long Pulse Time
Long Pulse Time : 10000 #MSec for long pulse command
This parameter defines the number of milliseconds to be associated with a long
pulse command. The valid range of numbers for this parameter are 0 to
2,147,483,647. Range is 0 to 2^31–1
M_SP_NA Point Count
M_SP_NA point count : 10 #Number of monitored single-points
This parameter specifies the number of point values assigned in monitored
single-point database. Range is 0 to 1000.
M_DP_NA Point Count
M_DP_NA point count : 10 #Number of monitored dual-points
This parameter specifies the number of point values assigned in monitored dualpoint database. Rang is 0 to 1000.
M_ST_NA Point Count
M_ST_NA point count : 10 #Number of monitored step-points
This parameter specifies the number of point values assigned in monitored steppoint database. Range is 0 to 1000.
Page 22 of 128 ProSoft Technology, Inc.
July 12, 2007
Page 23

Customizing the Sample Configuration File 4205/5205-TS-104S-PDPS ♦ ProLinx Standalone
IEC-60870-5-104 to PDPS Communication Module with Time Stamp
M_ME_NA Point Count
M_ME_NA point count : 10 #Number of monitored normalized-points
This parameter specifies the number of point values assigned in monitored
normalized-point database. Range is 0 to 1000.
M_ME_NB Point Count
M_ME_NB point count : 10 #Number of monitored scaled-points
This parameter specifies the number of point values assigned in monitored
scaled-point database. Range is 0 to 1000.
M_ME_NC Point Count
M_ME_NC point count : 10 #Number of monitored scaled-points
This parameter specifies the number of point values assigned in monitored
scaled short-float point database. Range is 0 to 50.
M_IT_NA Point Count
M_IT_NA point count : 10 #Number of monitored counter-points
This parameter specifies the number of point values assigned in monitored
counter-point database. Range is 0 to 1000.
C_SC_NA Point Count
C_SC_NA point count : 10 #Number of command single-points
This parameter specifies the number of point values assigned in command
single-point database. Range is 0 to 1000.
C_DC_NA Point Count
C_DC_NA point count : 10 #Number of command dual-points
This parameter specifies the number of point values assigned in command dualpoint database. Range is 0 to 1000.
C_RC_NA Point Count
C_RC_NA point count : 10 #Number of command step-points
This parameter specifies the number of point values assigned in command steppoint database. Range is 0 to 1000.
C_SE_NA Point Count
C_SE_NA point count : 10 #Number of command normalized-points
This parameter specifies the number of point values assigned in command
normalized-point database. Range is 0 to 1000.
C_SE_NB Point Count
C_SE_NB point count : 10 #Number of command scaled-points
This parameter specifies the number of point values assigned in command
scaled-point database. Range is 0 to 1000.
ProSoft Technology, Inc. Page 23 of 128
July 12, 2007
Page 24

4205/5205-TS-104S-PDPS ♦ ProLinx Standalone Customizing the Sample Configuration File
IEC-60870-5-104 to PDPS Communication Module with Time Stamp
C_SE_NC Point Count
C_SE_NC point count : 10 #Number of command float points
This parameter specifies the number of point values assigned in command float
point database. Range is 0 to 1000.
Sequence
M_SP_NA Sequence : N #Y=ASDU in sequence with SQ=1, N=report separate (SQ=0)
M_DP_NA Sequence : N #Y=ASDU in sequence with SQ=1, N=report separate (SQ=0)
M_ME_NA Sequence : N #Y=ASDU in sequence with SQ=1, N=report separate (SQ=0)
M_ME_NB Sequence : N #Y=ASDU in sequence with SQ=1, N=report separate (SQ=0)
M_ME_NC Sequence : N #Y=ASDU in sequence with SQ=1, N=report separate (SQ=0)
M_IT_NA Sequence : N #Y=ASDU in sequence with SQ=1, N=report separate (SQ=0)
M_ME_NA Parameter Offset
M_ME_NA Parameter Offset : 2000 #M_ME_NA IOA offset for parameter data
This parameter specifies the IOA offset to the parameter data for the normalized
parameter data. The value entered is added to the Information Object Address
for the associated point to compute the parameter IOA address. When the
M_ME_NA or M_ME_NB points are polled (e.g, with a group interrogation
request), the module will also include parameter points in the response.
For each monitored point, there will be three parameter points:
Point Value
Threshold
Low Last reported event value - threshold.
High Last reported event value + threshold.
Determined by the deadband set in the configuration file or
altered by the write command.
M_ME_NB Parameter Offset
M_ME_NB Parameter Offset : 2000 #M_ME_NB IOA offset for parameter data
This parameter specifies the IOA offset to the parameter data for the scaled
parameter data. The value entered is added to the Information Object Address
for the associated point to compute the parameter IOA address.
For each monitored point, there will be three parameter points:
Point Value
Threshold
Low Last reported event value - threshold.
High Last reported event value + threshold.
Determined by the deadband set in the configuration file or
altered by the write command.
For example, for a M_ME_NA point with an Information Object Address of 503,
the associated parameter point would have an IOA of 2503 (for a configured
parameter offset of 2000).
Page 24 of 128 ProSoft Technology, Inc.
July 12, 2007
Page 25

Customizing the Sample Configuration File 4205/5205-TS-104S-PDPS ♦ ProLinx Standalone
IEC-60870-5-104 to PDPS Communication Module with Time Stamp
M_ME_NC Parameter Offset
M_ME_NC Parameter Offset : 2000 #M_ME_NC IOA offset for parameter data
This parameter specifies the IOA offset to the parameter data for the scaled
parameter data. The value entered is added to the Information Object Address
for the associated point to compute the parameter IOA address.
For each monitored point, there will be three parameter points:
Point Value
Threshold
Low Last reported event value - threshold.
High Last reported event value + threshold.
Determined by the deadband set in the configuration file or
altered by the write command.
For example, for a M_ME_NC point with an Information Object Address of 503,
the associated parameter point would have an IOA of 2503 (for a configured
parameter offset of 2000).
1.1.9 [M_SP_NA_1 104] Section
This section defines the monitored single-point database for the server device
emulated. This information is sourced from the database and is transferred to the
remote client unit. Each point in the database occupies 1 bit. (1 = On, 0 = Off
state).
This section takes the following parameters:
Point #
DB Address
Group(s)
IV DB Bit
Each point is one bit and the DB address value corresponds to the bit offset in
the database.
1.1.10 [M_DP_NA_1 104] Section
This section defines the monitored dual-point database for the server device
emulated. This information is sourced from the database and is transferred to the
remote client unit. Each point in the database occupies two bits. (00 =
intermediate, 01 = off, 10 = on and 11 = intermediate).
This section takes the following parameters:
Point #:
DB Address:
Group(s):
IV DB Bit
Each point is two bits and the DB address value corresponds to the bit offset in
the database.
ProSoft Technology, Inc. Page 25 of 128
July 12, 2007
Page 26

4205/5205-TS-104S-PDPS ♦ ProLinx Standalone Customizing the Sample Configuration File
IEC-60870-5-104 to PDPS Communication Module with Time Stamp
1.1.11 [M_ST_NA_1 104] Section
This section defines the monitored step database for the server device emulated.
This information is sourced from the database and is transferred to the remote
client unit. Each point in the database occupies one byte.
This section takes the following parameters:
Point #:
DB Address:
Group(s):
IV DB Bit
Each point is one byte and the DB Address value corresponds to the byte offset
in the database.
1.1.12 [M_ME_NA_1 104] Section
This section defines the monitored measured value, normalized database for the
server device emulated. This information is sourced from the database and is
transferred to the remote client unit. Each point occupies a word position in the
database. The IOA for the parameters are for each object and are determined by
adding the Point # below to the value of the M_ME_NA parameter offset
parameter set in the previous section.
This section takes the following parameters:
Point #:
DB Address:
Group(s):
Default Deadband:
IV DB Bit
Each point is one word and the DB Address value corresponds to the word offset
in the database.
1.1.13 [M_ME_NB_1 104] Section
This section defines the monitored measured value, scaled database for the
server device emulated. This information is sourced from the database and is
transferred to the remote client unit. Each point occupies a word position in the
database. The IOA for the parameters for each object are determined by adding
the Point # below to the value of the M_ME_NB parameter offset parameter set
in the previous section.
This section takes the following parameters:
Point #:
DB Address:
Group(s):
Default Deadband:
IV DB Bit
Each point is one word and the DB Address value corresponds to the word offset
in the database.
Page 26 of 128 ProSoft Technology, Inc.
July 12, 2007
Page 27

Customizing the Sample Configuration File 4205/5205-TS-104S-PDPS ♦ ProLinx Standalone
IEC-60870-5-104 to PDPS Communication Module with Time Stamp
1.1.14 [M_ME_NC_1 104] Section
This section defines the monitored short-float point database for the slave device
emulated. This information is sourced from the database and is transferred to the
remote client unit. Each point occupies 4-byte positions in the database. The IOA
for the parameters for each object are determined by adding the Point # below to
the value of the M_ME_NC Parameter Offset parameter set above.
This section takes the following parameters:
Point #
DB Address
Groups
Default Deadband
IV DB Bit
Each point is one word and the DB Address value corresponds to the word offset
in the database.
The Database Address value should be located in a database area that is
constantly being moved from the processor to the 4205/5205-TS-104S-PDPS
module. Therefore, this value should be configured in an area that is used on a
Backplane Command Function 1.
Refer to the Group Codes section for a listing of Group Codes.
1.1.15 [M_IT_NA_1 104] Section
This section defines the monitored integrated totals (counter) database for the
server emulated. This information is sourced from the database and is
transferred to the remote client unit. Each point occupies two words in the
database (4 bytes).
This section takes the following parameters:
Point #:
DB Address:
Group(s):
IV DB Bit
Each point is two words and the DB Address value corresponds to the doubleword offset in the database.
1.1.16 [C_SC_NA_1 104] Section
This section defines the single point command database for the server emulated.
This information is sourced from the remote client and is transferred to the
database. Each point occupies a single bit position in the database. You can
associate a command with a monitored single-point database value to coordinate
the command/monitor operation. You must enter the correct Monitor Point # and
Monitor DB Address values in the table. If the Require Select parameter is not
set to zero, a select command must be received before an execute command will
be processed.
ProSoft Technology, Inc. Page 27 of 128
July 12, 2007
Page 28

4205/5205-TS-104S-PDPS ♦ ProLinx Standalone Customizing the Sample Configuration File
IEC-60870-5-104 to PDPS Communication Module with Time Stamp
This section takes the following parameters:
Point #:
DB Address:
Monitor Point #:
Monitor DB Addr:
Require Select:
Each point is one bit and the DB Address value corresponds to the bit offset in
the database.
1.1.17 [C_DC_NA_1 104] Section
This section defines the double point command database for the server
emulated. This information is sourced from the remote client and is transferred to
the database. Each point occupies two bits in the database. You can associate a
command with a monitored double point database value to coordinate the
command/monitor operation. You must enter the correct Monitor Point # and
Monitor DB Addr values in the table. If the Require Select parameter is not set to
zero, a select command must be received before an execute command will be
processed.
This section takes the following parameters:
Point #:
DB Address:
Monitor Point #:
Monitor DB Addr:
Require Select:
Each point is two bits and the DB Address value corresponds to the bit offset in
the database.
1.1.18 [C_RC_NA_1 104] Section
This section defines the step command database for the server emulated. This
information is sourced from the remote client and is transferred to the database.
Each point occupies a byte in the database. The control value can be associated
with a monitored point as described in the previous example.
This section takes the following parameters:
Point #:
DB Address:
Monitor Point #:
Monitor DB Addr:
Each point is one byte and the DB Address value corresponds to the byte offset
in the database.
Page 28 of 128 ProSoft Technology, Inc.
July 12, 2007
Page 29

Customizing the Sample Configuration File 4205/5205-TS-104S-PDPS ♦ ProLinx Standalone
IEC-60870-5-104 to PDPS Communication Module with Time Stamp
1.1.19 [C_SE_NA_1 104] Section
This section defines the normalized setpoint database for the server emulated.
This information is sourced from the remote client and is transferred to the
database. Each point occupies a word position in the database. You can
associate a command with a monitored normalized database value to coordinate
the command/monitor operation. You must enter the correct Monitor Point # and
Monitor DB Addr values in the table. If the Require Select parameter is not set to
zero, a select command must be received before an execute command will be
processed.
This section takes the following parameters:
Point #:
DB Address:
Monitor Point #:
Monitor DB Addr:
Require Select:
Each point is one word and the DB Address value corresponds to the word offset
in the database.
1.1.20 [C_SE_NB_1 104] Section
This section defines the scaled setpoint database for the server emulated. This
information is sourced from the remote client and is transferred to the database.
You can associate a command with a monitored scaled database value to
coordinate the command/monitor operation. You must enter the correct Monitor
Point # and Monitor DB Addr values in the table. If the Require Select parameter
is not set to zero, a select command must be received before an execute
command will be processed.
This section takes the following parameters:
Point #:
DB Address:
Monitor Point #:
Monitor DB Addr:
Require Select:
Each point is one word and the DB Address value corresponds to the word offset
in the database.
ProSoft Technology, Inc. Page 29 of 128
July 12, 2007
Page 30

4205/5205-TS-104S-PDPS ♦ ProLinx Standalone Customizing the Sample Configuration File
IEC-60870-5-104 to PDPS Communication Module with Time Stamp
1.1.21 [C_SE_NC_1 104] Section
This section defines the short-float setpoint database for the server emulated.
This information is sourced from the remote client and is transferred to the
database. Each point occupies a double-word position in the database. If the
Require Select parameter is not set to zero, a select command must be received
before an execute command will be processed.
This section takes the following parameters:
Point #:
DB Address:
Monitor Point #:
Monitor DB Addr:
Require Select:
Each point is two words and the DB Address value corresponds to the doubleword offset in the database.
The database address should be located in a database area that is being
constantly moved from the module to the processor. You should configure the
DB Address parameter in an area that is on a Backplane Command Function 2.
1.1.22 Group Definition
One aspect of the point configuration database that leads to confusion is the
group definition field. This assignment for each point assigns a point to one or
more interrogation groups. Use of interrogation groups permits the controlling
unit to interface with a specific set of data. Refer to the IEC 60870-5-104
standard for a full discussion of interrogation groups. A specific group, Periodic
data group, reports data points on a set frequency. The frequency is set in the
Cyclic Data Transmission parameter in the configuration file. Remember that a
point can be assigned to more than one group:
Group Code Description
0x00000001 Interrogated by general interrogation (station or global)
0x00000002 Interrogated by group 1 interrogation
0x00000004 Interrogated by group 2 interrogation
0x00000008 Interrogated by group 3 interrogation
0x00000010 Interrogated by group 4 interrogation
0x00000020 Interrogated by group 5 interrogation
0x00000040 Interrogated by group 6 interrogation
0x00000080 Interrogated by group 7 interrogation
0x00000100 Interrogated by group 8 interrogation
0x00000200 Interrogated by group 9 interrogation
0x00000400 Interrogated by group 10 interrogation
0x00000800 Interrogated by group 11 interrogation
0x00001000 Interrogated by group 12 interrogation
0x00002000 Interrogated by group 13 interrogation
Page 30 of 128 ProSoft Technology, Inc.
July 12, 2007
Page 31

Customizing the Sample Configuration File 4205/5205-TS-104S-PDPS ♦ ProLinx Standalone
IEC-60870-5-104 to PDPS Communication Module with Time Stamp
Group Code Description
0x00004000 Interrogated by group 14 interrogation
0x00008000 Interrogated by group 15 interrogation
0x00010000 Interrogated by group 16 interrogation
0x00020000 Interrogated by general counter request
0x00040000 Interrogated by group 1 counter request
0x00080000 Interrogated by group 2 counter request
0x00100000 Interrogated by group 3 counter request
0x00200000 Interrogated by group 4 counter request
0x40000000 Disable event scanning of this point
0x80000000 Periodic/cyclic data returned from unit
If the highest bit (bit 31) is set, data will be produced by the driver for the
specified point at the rate set for periodic data generation. Bit 30 (0x40000000)
enables scanning of this point for event generation. If the bit is clear and the data
type is set for scanning, events will be generated for the point. If the bit is set,
events will not be generated for the point. This feature can be used to select
which points will generate events for the controlling station and can get rid of
event data that is not important to the application.
1.1.23 [Data Map] Section
The [Data Map] section of the CFG file allows you to selectively copy data
registers, one register up to 100 registers at a time, from one internal database
area to another. Up to 200 entries can be made in the [Data Map] section,
providing a wide and powerful range of functionality.
You can use the Data Map section of the configuration file to copy data from the
device error or status table to the internal database register, or to copy data from
one area to another. The bytes and/or words copied can be altered to preset the
data (for example, floating-point data) in the correct format for a specific protocol.
You can also use the Data Map feature to build a specific block of data to be
used by any of the protocol drivers. For example, you can use the data map to
build the input and output data area for the PROFIBUS Slave driver.
Tip: Use the [V] command in the Configuration/Debug Menu (page 77) to
view the status of the Program Scan Counter. Repeat the command to see the
value change.
ProSoft Technology, Inc. Page 31 of 128
July 12, 2007
Page 32

4205/5205-TS-104S-PDPS ♦ ProLinx Standalone Customizing the Sample Configuration File
IEC-60870-5-104 to PDPS Communication Module with Time Stamp
From Address
0 to highest Status Data address
This field specifies the internal database register to be copied from. This address
can range from the Data area as well as the Status Data Area of the product
To Address
0 to 3999
The destination for the copy is always going to be the Register Data area.
Register Count
1 to 100
This parameter specifies the number of registers to be copied.
Swap Code
0,1,2,3
You may need to swap the order of the bytes in the registers during the copy
process in order to change from alignment of bytes between dissimilar protocols.
This parameter is helpful when dealing with floating-point or other multi-register
values, as there is no standard method of storage of these data types in slave
devices.
The following table defines the values and their associated operations:
Swap Code Description
0 None - No Change is made in the byte ordering (1234 = 1234)
1 Words - The words are swapped (1234=3412)
2
3 Bytes - The bytes in each word are swapped (1234=2143)
Words & Bytes - The words are swapped then the bytes in each word are
swapped (1234=4321)
Delay Preset
Copies one portion of the database or virtual database to a user specified
location in the database. The Delay Preset represents the scan count of the
program between each copy operation. The copy operations should not all
happen at the same time, otherwise the process could delay the scan. For
example, you should not set all values to a delay preset of 1001. Instead, use
values such as 1000, 1001 and 1002, or you can use the preset values in the
sample configuration file. This will keep the copies from happening concurrently.
Tip: Use the [V] command in the Configuration/Debug Menu (page 77) to
view the status of the Program Scan Counter. Repeat the command to see the
value change.
Page 32 of 128 ProSoft Technology, Inc.
July 12, 2007
Page 33

Customizing the Sample Configuration File 4205/5205-TS-104S-PDPS ♦ ProLinx Standalone
IEC-60870-5-104 to PDPS Communication Module with Time Stamp
1.1.24 [E-MAIL] Section
The [E-MAIL] section of the CFG file defines the network and file parameters to
be associated with each of the 20 potential e-mail messages that can be sent
from the module. The format of the section is different than the other sections of
the configuration file. Each e-mail definition is contained on a single line between
the labels START and END. These labels inform the program where the list
resides. The module's program will parse all data after the START label until it
reaches the END label or until 20 e-mail messages are defined.
The format of each definition in the list is the same with the content dependent on
the operation to perform. An example section from the CFG file is shown below:
[E-MAIL]
# DB Trigger Mail TO
# Reg Value Server IP Name E-Mail File Name
START
4000 1 192.168.0.5 user@aol.com stat
4000 2 192.168.0.5 user@aol.com commands
4000 3 192.168.0.5 user@aol.com errlist
4000 4 192.168.0.5 user@aol.com emailcfg
4000 5 192.168.0.5 user@aol.com example.rpt
END
Each parameter is discussed below:
DB Reg
0 to 9999
This parameter specifies the register in the virtual database in the module to be
associated with the Trigger Value parameter. The register value can be
controlled by Server devices based on data acquired using the command list or
from commands issued on the network from a remote Client unit.
Trigger Value
This parameter specifies the value in the database to trigger the e-mail message.
When the value entered for this parameter is first recognized in the virtual
database at the register specified in the DB Reg parameter, the e-mail message
will be generated. The value must change in order for the value to be re-used.
Most applications will use a single register with different trigger values generating
different messages. The example displayed above uses this technique.
Mail Server IP
This parameter specifies the IP address of the mail server to be reached with the
e-mail message. Refer to your network administrator for this information.
To Name
This parameter must contain a valid user or e-mail account information for your
network. Groups of people can be designated to receive an individual e-mail
message by setting the appropriate name in this field. Refer to your network
administrator for a list of accounts.
ProSoft Technology, Inc. Page 33 of 128
July 12, 2007
Page 34

4205/5205-TS-104S-PDPS ♦ ProLinx Standalone Customizing the Sample Configuration File
IEC-60870-5-104 to PDPS Communication Module with Time Stamp
E-Mail File Name
This parameter contains the fully qualified file and path name to the file to be
associated with the e-mail message. This file must reside on the module's Flash
ROM in order to be sent. Several e-mail files are built into the module and need
not be constructed by the user. The reserved file names and a description of their
content is given below:
Stat: This file contains the module's communication status data for each network
service and the Client port.
Emailcfg: This file contains a listing of the e-mail configuration data.
All other file names entered must exist on the module.
1.1.25 Creating Custom E-Mail Reports
The ProLinx module supports up to 20 user defined e-mail reports. The following
insertion tags can be used with e-mail messages:
Note: A space character must exist before the --> string or else the insertion
tag will be disregarded
<--DATE 0 --> insert the date in the format 02/07/2000.
<--DATE 1 --> insert the date in the format February 7, 2000.
<--TIME --> insert the time in the format 17:02:15.35
<--BTEXT 0,BIT_0_ON,BIT_0_OFF --> insert a text string based on the value of
a bit in the database.
<--DATA 0,1,1,%04d --> insert one or more data values from the database in the
specified format.
Refer to the Web Page Definition section of the documentation on formatting files
with encapsulated data and insertion tags.
1.1.26 Example E-mail Report File
The following serves as an example of an e-mail report file. This file is available
on the ProLinx unit, and can be accessed via the FTP port.
TO: Production Engineers
FROM: 4201-WEB-DFM, ProSoft Technology, Inc. Module
SUBJECT: Production Report for Shipping Pumps
This is an example of the type of e-mail that can be sent from the module
to a remote site using the e-mail feature. The data contained in the report
displays several methods of displaying data in a report from the module's
database.
Register 0 = <--DATA 0,1,1,%d --> (this is the report number flag value)
DATE 0 = <--DATE 0 -->
DATE 1 = <--DATE 1 -->
TIME = <--TIME -->
BTEXT = <--BTEXT 0,BIT_0_ON,BIT_0_OFF --> (state of bit 0)
DATA = <--DATA 0,1,1,%04d -->
PUMP DATA:
On Time Suction Discharge Temp
(Hours) (PSIG) (PSIG) (F)
<--DATA 0,12,4,%12d -->
End of report.
Page 34 of 128 ProSoft Technology, Inc.
July 12, 2007
Page 35

Protocol Implementation 4205/5205-TS-104S-PDPS ♦ ProLinx Standalone IEC-60870-5-104 to PDPS Communication Module with Time Stamp
2 Protocol Implementation
In This Chapter
IEC-60870-5-104 (104S) Protocol Implementation ................35
Redundant Connections......................................................... 60
PDPS Protocol Implementation.............................................. 62
2.1 IEC-60870-5-104 (104S) Protocol Implementation
The intent of this section is to provide a quick understanding of how the 104S
module implements the IEC-60870-5-104 protocol, without going into complex
details of the specification.
The IEC-60870-5-104 protocol applies to Telecontrol equipment and systems
with data transmission for monitoring and controlling geographically widespread
processes. This protocol consists essentially of the IEC-60870-5-101 protocol,
with the addition of TCP/IP as the transport mechanism.
Any application with the IEC-60870-5-104 protocol consists of a client
(Controlling Station) and one or more servers (Controlled Stations). The client
constantly monitors and controls the data from each server in the TCP/IP
network.
The 4205/5205-TS-104S-PDPS works as an IEC-60870-5-104 server; it can
send monitor data, receive commands, or generate events to the client unit.
ProSoft Technology, Inc. Page 35 of 128
July 12, 2007
Page 36

4205/5205-TS-104S-PDPS ♦ ProLinx Standalone Protocol Implementation
IEC-60870-5-104 to PDPS Communication Module with Time Stamp
2.1.1 Module Address
The 4205/5205-TS-104S-PDPS module is identified at transport level (using the
IP Address) and at application level (using the Common ASDU Address).
IP Address
The 4205/5205-TS-104S-PDPS module is identified by a unique IP address on
the TCP/IP network. You must edit the WATTCP.CFG configuration file (or use
the configuration tool) to enter a valid IP address. The following example lists the
default contents of the WATTCP.CFG file:
# ProSoft Technology
# Default private class 3 address
my_ip=192.168.0.100
# Default class 3 network mask
netmask=255.255.255.0
# The gateway I wish to use
gateway=192.168.0.1
# some networks (class 2) require all three parameters
# gateway,network,subnetmask
# gateway 192.168.0.1,192.168.0.0,255.255.255.0
In this example, the 4205/5205-TS-104S-PDPS module is identified by IP
address 192.168.0.100 in the IEC-60870-5-104 network, with a netmask (subnet
mask) of 255.255.255.0 and a default gateway address of 192.168.0.1.
Because there could be several devices in the same TCP/IP network, some
applications may require a connection control (from which IP addresses the
module may receive valid messages).
To restrict the units (IP addresses) from which the 4205/5205-TS-104S-PDPS
module will accept connections, use the following parameter:
Use IP List : 0 #Use IP list to validate connection
#(0=No, 1=Yes)
If this parameter is set as 1 (Yes), the module will only accept a connection from
a client unit that is listed in the IP address list, in the following format:
[IEC-870-5-104 IP ADDRESSES]
START
192.168.0.207
192.168.0.203
192.168.0.61
END
Page 36 of 128 ProSoft Technology, Inc.
July 12, 2007
Page 37

Protocol Implementation 4205/5205-TS-104S-PDPS ♦ ProLinx Standalone
IEC-60870-5-104 to PDPS Communication Module with Time Stamp
If the Use IP List parameter is set to 1 (Yes), the module will only accept a
connection from one of the three IP addresses listed in the example above. The
following illustration shows that the Server will accept a connection from Client A,
whose address is on the list, but will reject a connection from Client B, whose
address is not on the list.
Common ASDU Address
At the application level, the module is identified by the Common ASDU
(Application Service Data Unit) Address. This address must match the CASDU
sent by the client unit. An ASDU is a data unit that transfers information objects
between the client and the server.
If the client sends a message to a different Common ASDU, the module ignores
the command. To configure the Common ASDU Address for the 4205/5205-TS104S-PDPS module, use the following parameter in the configuration file:
Common Address of ASDU : 1 #Range 0 to 65535
2.1.2 Monitor Direction and Control Direction – Point
Definition
The protocol specification defines two directions of data: monitor direction and
control direction.
Monitor Direction: The direction of transmission from the server to the client
Control Direction: The direction of transmission from the client to the server
ProSoft Technology, Inc. Page 37 of 128
July 12, 2007
Page 38

4205/5205-TS-104S-PDPS ♦ ProLinx Standalone Protocol Implementation
IEC-60870-5-104 to PDPS Communication Module with Time Stamp
The points that are typically transferred from the server to the client are also
known as Monitor Points (or Monitor Information Objects). The points that are
typically transferred from the client to the server are also known as Control
Points (or Command Information Objects).
The 4205/5205-TS-104S-PDPS module contains an internal database of 4000
words. You must associate the monitor and control points to database addresses
in the 4205/5205-TS-104S-PDPS module. To configure the points for the
4205/5205-TS-104S-PDPS module, follow these steps:
1 Calculate the number of monitor and control points for the application.
2 Calculate the 4205/5205-TS-104S-PDPS module database regions that are
required for the application, based on the number of monitor and control
points. Define two separate regions. Remember that each data type stores a
different quantity of data (for example, M_SP_NA uses one bit, M_ST_NA
uses one byte, and so on).
3 Configure each point within its 4205/5205-TS-104S-PDPS module database
region.
2.1.3 Using Monitor Points
The following monitor points are supported by the 4205/5205-TS-104S-PDPS
module:
Symbol Description
M-SP-NA Monitored Single-Points 1 bit Bit
M-DP-NA Monitored Dual-Points 2 bits Bit
M-ST-NA Monitored Step-Points 1 byte Byte
M-ME-NA Monitored Measured Normalized-Points 1 word Word
M-ME-NB Monitored Measured Scaled-Points 1 word Word
M-ME-NC Monitored Measured Short Floating Points 2 words Double-Word
M-IT-NA Monitored Counter-Points 2 words Double-Word
Data Size in
Database
Addressing Type
Each monitor point is identified by its Information Object Address (it should be
unique for each Common ASDU Address in the network). For each monitor point,
configure the following parameters:
Point # – The information object address of the point. It identifies the point in the
network.
DB Address – The database location in the 4205/5205-TS-104S-PDPS module
associated with the point. You must associate each point to a database address
in the 4205/5205-TS-104S-PDPS module. The interpretation of this parameter
depends on the point type configured. For example, for an M_SP_NA point, this
value represents the bit address. For a M_ME_NA point, this value represents
the Word address.
Group(s) – This is the group definition for the point. It sets how the point will be
polled by the master (cyclic or group interrogation). It can also be used to enable
or disable the event generation for one specific point. The group parameter is
discussed in the Data Communication section.
Page 38 of 128 ProSoft Technology, Inc.
July 12, 2007
Page 39

Protocol Implementation 4205/5205-TS-104S-PDPS ♦ ProLinx Standalone
IEC-60870-5-104 to PDPS Communication Module with Time Stamp
Deadband – Sets the deadband for each Measured point. If the value changes
from more than the configured deadband , the module will generate an event for
this point.
IV DB Bit – This feature allows the application to set the invalid (IV) quality bit of
the protocol for all the monitored ASDU types supported. If you enable this
feature, the processor can determine the individual IV quality bit status of each
point you configured.
The following parameters must be configured in order to use this feature:
Cyclic Set IV Time : 10 #Number of sec intervals
IV Check Delay Time : 2 #Number of sec intervals between
#investigation
IV Fail Count : 2 #Number of IV failures recognized
#before reporting
To disable this feature, set the IV Fail Count parameter to 0. If used, the Cyclic
Set IV Time parameter must be at least 3 times larger than the IV Check Delay
Time.
The Cyclic Set IV Time parameter must be set to determine how frequently the IV
Checks will be performed. If the IV bit is ON for a number of times given by the IV
Fail Count parameter the module will consider the point as invalid. The following
illustration shows how these parameters are implemented:
ProSoft Technology, Inc. Page 39 of 128
July 12, 2007
Page 40

4205/5205-TS-104S-PDPS ♦ ProLinx Standalone Protocol Implementation
IEC-60870-5-104 to PDPS Communication Module with Time Stamp
If the IV bit field is absent or set to 0, the invalid quality state for the point will
always be reported as valid.
If a database bit address (1 to 64000) is present, the application may consider
the point with an invalid flag if the previous logic checks the iv bit as 1 during
consecutive IV Check Delay scans. The iv bits would have to be reset to 0 to set
the point to valid state.
The IV DB bit defined for each point can be unique or many points may share the
same bit. The last case could be used when the points on an I/O module are to
be considered as one set. In this case only a single bit is required. For a point
that is the result of a computation, the valid quality state could be set for each
point individually.
Monitor Data Transfer
Typically, you should properly configure the group code for each monitor point to
define how the master will poll for the point. The group codes are defined as
follows:
The Group parameter is defined as follows:
Group Code Description
0x00000001 Interrogated by general interrogation (station or global)
0x00000002 Interrogated by group 1 interrogation
0x00000004 Interrogated by group 2 interrogation
0x00000008 Interrogated by group 3 interrogation
0x00000010 Interrogated by group 4 interrogation
0x00000020 Interrogated by group 5 interrogation
0x00000040 Interrogated by group 6 interrogation
0x00000080 Interrogated by group 7 interrogation
0x00000100 Interrogated by group 8 interrogation
0x00000200 Interrogated by group 9 interrogation
0x00000400 Interrogated by group 10 interrogation
0x00000800 Interrogated by group 11 interrogation
0x00001000 Interrogated by group 12 interrogation
0x00002000 Interrogated by group 13 interrogation
0x00004000 Interrogated by group 14 interrogation
0x00008000 Interrogated by group 15 interrogation
0x00010000 Interrogated by group 16 interrogation
0x00020000 Interrogated by general counter request
0x00040000 Interrogated by group 1 counter request
0x00080000 Interrogated by group 2 counter request
0x00100000 Interrogated by group 3 counter request
0x00200000 Interrogated by group 4 counter request
0x40000000 Disable event scanning of this point
0x80000000 Periodic/cyclic data returned from unit
Page 40 of 128 ProSoft Technology, Inc.
July 12, 2007
Page 41

Protocol Implementation 4205/5205-TS-104S-PDPS ♦ ProLinx Standalone
IEC-60870-5-104 to PDPS Communication Module with Time Stamp
The module will periodically send all points configured for periodic/cyclic poll
(0x80000000) at every x milliseconds, where x is configured with the following
parameter:
Cyclic data transmission: 20000 #Numb of milliseconds between cyclic
#updates
Example – Periodic Monitor Polling:
If the following point is configured for monitor polling:
[M_ME_NB_1]
#
# Each point is one word and the DB Address value corresponds to the
# word offset into the database.
#
# Default
# Point # DB Address Group(s) Deadband IV DB Bit
# ------- ---------- -------- -------- --------START
100 0 80000000 0 0
END
If you configure the periodic polling for 10 seconds (10000 milliseconds) as
follows:
Cyclic data transmission : 10000 #Numb of milliseconds between
#cyclic updates
The following illustration shows the communication procedure:
Therefore, the point configured for a cyclic poll is periodically reported to the
master.
You may also create groups of points allowing the master to poll certain points
more frequently than other points. The master may send requests for different
groups as follows:
General Interrogation (station)
General Interrogation for Group 1
ProSoft Technology, Inc. Page 41 of 128
July 12, 2007
Page 42

4205/5205-TS-104S-PDPS ♦ ProLinx Standalone Protocol Implementation
IEC-60870-5-104 to PDPS Communication Module with Time Stamp
General Interrogation for Group 2
…
General Interrogation for Group 16
Example – General Interrogation
If the following points are configured for General Interrogation:
If you configure the following data points:
[M_SP_NA_1]
# Point # DB Address Group(s) IV DB Bit
# ------- ---------- -------- ---------
START
100 1600 00000002 0 # Group 1 Interrogation
101 1601 00000002 0 # Group 1 Interrogation
102 1602 00000004 0 # Group 2 Interrogation
END
This feature allows you to separate the points into different groups according to
the priority level that these should be reported to the master. In the example
above, points 100 and 101 would be returned with a General Interrogation for
Group 1 and point 102 would be returned with a General Interrogation for Group
2:
Counter Points
There are four modes of acquisition of integrated totals (M_IT_NA points) defined
by the protocol specification. The actual values may be memorized (copied)
periodically to frozen values by a freeze command received from the master or
initiated locally within the module.
The module supports the following modes:
Mode A – Local freeze with spontaneous transmission
Mode D – Counter interrogation commands from the master initiate the freeze
operation and the frozen values are reported spontaneously.
Example – Mode A
To use Mode A, configure the following parameters:
Freeze Start Type : D #D=Day, H=Hour, M=Minute, N=Not used
Interval For Freeze : 15 #Number of seconds after start type
#(0 to 65535)
Page 42 of 128 ProSoft Technology, Inc.
July 12, 2007
Page 43

Protocol Implementation 4205/5205-TS-104S-PDPS ♦ ProLinx Standalone
IEC-60870-5-104 to PDPS Communication Module with Time Stamp
Freeze Start Type
The Freeze Start Type parameter will define when the module starts sending the
M_IT messages.
Example I – Freeze Start Type
If the module powers up with the following date and time clock:
03/25/2004 18:07:42
If you configure the Interval For Freeze parameter as follows:
Interval For Freeze : 15 #Number of seconds after start
#type (0 to 65535)
The module would send the counter messages every 15 seconds. The module
would start sending the messages depending on the Freeze Start Type
parameter as follows:
Freeze Start Type Time to Start Sending Messages
D 03/26/2004 00:00:00
H 03/25/2004 19:00:00
M 03/25/2004 18:08:00
Example II – Freeze Start Type
If the module should send the counter points on the hourly turn around time and
also 45 minutes later, the Mode A parameters should be configured as follows:
Freeze Start Type : H #D=Day, H=Hour, M=Minute, N=Not
#used
Interval For Freeze : 2700 #Number of seconds after start
#type (0 to 65535)
So the module would send events as follows (Hours:Minutes:Seconds):
17:00:00
17:45:00
18:00:00
18:45:00
19:00:00
19:45:00
…
Mode D
To select the Mode D. configure the Freeze Start Type parameter as "N". For this
mode the master would periodically send Counter Interrogation Commands to
perform the freeze operation. After the values are frozen the module will return
the counter points as events. The counter points must be properly configured for
counter interrogation groups for Mode D operation.
ProSoft Technology, Inc. Page 43 of 128
July 12, 2007
Page 44

4205/5205-TS-104S-PDPS ♦ ProLinx Standalone Protocol Implementation
IEC-60870-5-104 to PDPS Communication Module with Time Stamp
Monitor Points Addressing
As discussed before, the monitor points must be configured in a database area in
the 4205/5205-TS-104S-PDPS module.
The monitor data types are described in the following table:
Data Type Data Size Addressing Type
M_SP_NA 1 bit Bit
M_DP_NA 2 bits Bit
M_ST_NA 1 byte Byte
M_ME_NA 1 word Word
M_ME_NB 1 word Word
M_ME_NC 2 word Double-Word
M_IT_NA 2 word Double-Word
M_SP_NA and M_DP_NA
The monitored single-point (1 bit) and monitored double-point (2 bits) types both
occupy bit-addressing. For example, if you configured the following points:
# Point # DB Address Group(s) IV DB Bit
# ------- ---------- -------- ------------START
100 1600 80000000 0
101 1601 00000200 0
102 1602 00000400 0
END
These points would be used as follows:
Inf. Object Address Module Database Address
100 Bit 0 of word 100
101 Bit 1 of word 100
102 Bit 2 of word 100
The monitored double-point uses two bits with bit-addressing. It typically
represents the ON/OFF states where:
01 = OFF
10 = ON
M_ST_NA
The monitored step-point uses one byte with byte-addressing.
For example, if you configured the following points:
# Point # DB Address Group(s) IV DB Bit
# ------- ---------- -------- ------------START
300 40 80000000 0
301 60 00000200 0
302 81 00000400 0
END
Page 44 of 128 ProSoft Technology, Inc.
July 12, 2007
Page 45

Protocol Implementation 4205/5205-TS-104S-PDPS ♦ ProLinx Standalone
IEC-60870-5-104 to PDPS Communication Module with Time Stamp
These points would be used as follows:
Inf. Object Address Module Database Address
300 Low Byte of word 20
301 Low Byte of word 30
302 High Byte of word 40
M_ME_NA and M_ME_NB
The monitored measured normalized and measured scaled points occupy one
word with word-addressing.
For example, if you configured the following points:
# Default
# Point # DB Address Group(s) Deadband IV DB Bit
# ------- ---------- -------- -------- --------START
400 10 80000000 0 0
401 12 00000200 0 0
402 18 00000400 0 0
END
These points would be used as follows:
Inf. Object Address 4205/5205-TS-104S-PDPS Module Database Address
400 Word 10
401 Word 12
402 Word 18
The monitored measured normalized points use a data representation defined by
the protocol specification, where each bit represents a value as follows:
Bit 16 15 14 13 12 11 10 9 8 7 6 5 4 3 2 1
Value S
–1
2
2-2 2-3 2-4 2-5 2-6 2-7 2-8 2-9 2
–10
2
–11
2
–12
2
–13
2
–14
2
–15
Example: a value of 4000hex is interpreted as 0.5
M_ME_NC and M_IT_NA
The monitored measured short floating point and monitored integrated total
points occupy two words with double-word addressing.
For example, if you configured the following points:
# Point # DB Address Group(s) Deadband IV DB Bit
# ------- ---------- -------- -------- --------START
500 20 80000000 0 0
501 32 00000200 0 0
502 52 00000400 0 0
END
These points would be used as follows:
Inf. Object Address Module Database Address
500 Words 40 and 41
ProSoft Technology, Inc. Page 45 of 128
July 12, 2007
Page 46

4205/5205-TS-104S-PDPS ♦ ProLinx Standalone Protocol Implementation
IEC-60870-5-104 to PDPS Communication Module with Time Stamp
Inf. Object Address Module Database Address
501 Words 64 and 65
502 Word 104 and 105
2.1.4 Using Control (Command) Points
The following control points are supported by the 4205/5205-TS-104S-PDPS
module:
Symbol Description
C_SC_NA Single-Point Command
C_DC_NA Dual-Point Command
C_RC_NA Step-Point Command
C_SE_NA Measured Normalized Point Command
C_SE_NB Measured Scaled-Point Command
C_SE_NC Measured Short Floating-Point Command
Each control point is identified by its Information Object Address. For each
control point, configure the following parameters:
Point # - This is the information object address of the point. It identifies the point
in the network. This address must be unique for each Common ASDU Address in
the network.
DB Address - This is the database location in the 4205/5205-TS-104S-PDPS
module associated with the point.
Monitor Point #-Monitor DB Address- The user might (optionally) configure a
monitor point to be sent by the 4205/5205-TS-104S-PDPS module when it
receives the command for that specific point.
Example (C_SC_NA)
# Monitor Monitor Require
# Point # DB Address Point # DB Addr Select
# ------- ---------- ------- ------- ------START
700 3200 100 1600 0
END
In the example above, each time the module receives a command for singlecommand point 700, it sends a response containing a monitored single-point
(information object address 100 with the value at database bit-address 1600).
Require Select - This parameter configures the point to require a Select request
before the Operate command.
Page 46 of 128 ProSoft Technology, Inc.
July 12, 2007
Page 47

Protocol Implementation 4205/5205-TS-104S-PDPS ♦ ProLinx Standalone
IEC-60870-5-104 to PDPS Communication Module with Time Stamp
Control Data Transfer
The control communication typically occurs when the client sends a command
request to update the module's command points.
The data types addressing are described in the following table:
Data Type Data Size Addressing Type
C_SC_NA 1 bit Bit
C_DC_NA 2 bits Bit
C_RC_NA 1 byte Byte
C_SE_NA 1 word Word
C_SE_NB 1 word Word
C_SE_NC 2 words Word
Some of the command points may be configured to be selected before executed.
Refer to the following parameter to configure the select/operate timeout period.
After the module receives the SELECT operation it will wait for this period of time
for the EXECUTE operation. If the module does not receive an EXECUTE
operation within this period of time it will require another SELECT operation
before the EXECUTE operation.
Select/Operate Timeout : 20000 #Milliseconds before select
#timeout
Command Points Addressing
As discussed before, the command points must be configured in a database area
that is updated at the module. You must associate each point to a database
address in the 4205/5205-TS-104S-PDPS module. The interpretation of this
parameter depends on the point type configured.
C_SC_NA and C_DC_NA
The single-point command and dual-point command points use one bit with bitaddressing. For example, if you configure the following points:
# Monitor Monitor Require
# Point # DB Address Point # DB Addr Select
# ------- ---------- ------- ------- ------START
100 1600 0 0 0
101 1601 0 0 0
102 1602 0 0 0
END
These points would be used as follows:
Inf. Object Address Module Database Address
100 Bit 0 of word 100
101 Bit 1 of word 100
102 Bit 2 of word 100
The protocol specification defines a qualifier value that is set by the master to
determine the duration of the pulse (short, long or persistent).
ProSoft Technology, Inc. Page 47 of 128
July 12, 2007
Page 48

4205/5205-TS-104S-PDPS ♦ ProLinx Standalone Protocol Implementation
IEC-60870-5-104 to PDPS Communication Module with Time Stamp
Configure the parameters below to set the duration of the short and long pulses:
Short Pulse Time : 2000 #MSec for short pulse command
Long Pulse Time : 10000 #MSec for long pulse command
C_RC_NA
The step-point command uses one byte with byte-addressing.
For example, if you configured the following points:
# Monitor Monitor
# Point # DB Address Point # DB Addr
# ------- ---------- ------- ------START
300 40 0 0
301 60 0 0
302 81 0 0
END
These points would be used as follows:
Inf. Object Address Module Database Address
300 Low Byte of word 20
301 Low Byte of word 30
302 High Byte of word 40
C_SE_NA and C_SE_NB
The measured normalized point command uses one word with word-addressing.
For example, if you configured the following points:
# Monitor Monitor Require
# Point # DB Address Point # DB Addr Select
# ------- ---------- ------- ------- ------START
400 10 0 0 0
401 12 0 0 0
402 18 0 0 0
END
These points would be used as follows:
Inf. Object Address 4205/5205-TS-104S-PDPS Module Database Address
400 Word 10
401 Word 12
402 Word 18
The measured normalized points use a data representation defined by the
protocol specification, where each bit represents a value as follows:
Bit 16 15 14 13 12 11 10 9 8 7 6 5 4 3 2 1
–10
–11
–12
–13
–14
Value S 2–1 2-2 2-3 2-4 2-5 2-6 2-7 2-8 2-9 2
2
2
2
2
–15
2
Ex: a value of 4000hex is interpreted as 0.5
Page 48 of 128 ProSoft Technology, Inc.
July 12, 2007
Page 49

Protocol Implementation 4205/5205-TS-104S-PDPS ♦ ProLinx Standalone
IEC-60870-5-104 to PDPS Communication Module with Time Stamp
C_SE_NC
The measured short floating point command uses two words with double word
addressing.
For example, if you configured the following points:
# DB Address Monitor Monitor Require
# Point # (word*2) Point # DB Addr Select
# ------- ---------- ------- ------- ------START
400 10 0 0 0
401 12 0 0 0
402 18 0 0 0
END
These points would be used as follows:
Inf. Object Address Module Database Address
400 Words 20 and 21
401 Words 22 and 23
402 Words 24 and 25
2.1.5 Data Communication
Group Communication
As previously discussed, the Group parameter in the module configuration file
controls how each monitored point is transferred between the 4205/5205-TS104S-PDPS module and the client unit. The Group parameter is described in
detail in Group Definition (page 30)
The following example configures this point to be repeated either during cyclic
polls, or when the module General Interrogation request for group 1 occurs.
# Point # DB Address Group(s)
# ------- ---------- -------START
100 1600 80000002 # P1-PSHH -- Discharge pressure SD
END
The module periodically sends all points configured for periodic/cyclic poll
(0x80000000) at the interval in milliseconds configured with the following
parameter:
Cyclic data transmission : 20000 #Numb of milliseconds between cyclic
#updates
You can also divide the monitored points into different groups, allowing the client
to periodically poll only certain points. This also allows some points to be polled
more frequently than others.
Note: You should configure the counter points (M_IT_NA) for general counter
interrogation or group counter interrogations.
ProSoft Technology, Inc. Page 49 of 128
July 12, 2007
Page 50

4205/5205-TS-104S-PDPS ♦ ProLinx Standalone Protocol Implementation
IEC-60870-5-104 to PDPS Communication Module with Time Stamp
Example:
In the following example, with the following data points for data type M_SP_NA
configured:
[M_SP_NA_1 104]
# Point # DB Address Group(s)
# ------- ---------- -------START
100 1600 80000000 # Periodic Poll
101 1601 00000002 # Group 1 Interrogation
102 1602 00000002 # Group 1 Interrogation
103 1603 00000004 # Group 2 Interrogation
END
And the Cyclic data transmission parameter configured as follows:
Cyclic data transmission : 20000 #Numb of milliseconds between cyclic updates
The client unit sends the following requests:
General Interrogation for Group 1 every 12 seconds
General Interrogation for Group 2 every 15 seconds
The following illustration shows how the communication would be performed
between the client and the 104S module.
Page 50 of 128 ProSoft Technology, Inc.
July 12, 2007
Page 51

Protocol Implementation 4205/5205-TS-104S-PDPS ♦ ProLinx Standalone
IEC-60870-5-104 to PDPS Communication Module with Time Stamp
STARTDT & STOPDT
STARTDT (Start Data Transfer) and STOPDT (Stop Data Transfer) are used by
the client to control the data transfer from the 4205/5205-TS-104S-PDPS
module. When the connection is established, user data is not automatically
enabled in the server until it receives a STARTDT act request from the client.
The server should respond with a STARTDT con response to acknowledge the
client request. Once this procedure is concluded, the server can send monitor
data to the client.
The client can interrupt the monitor data flow at any time sending a STOPDT act
command to the server.
In some circumstances the client unit may not support STARTDT and STOPDT
messages. The module may also be tested with simulator software that does not
support these features. During these situations, you may want to disable the
STARTDT and STOPDT features using the following parameter:
Override StartDT : 1 #Used to ignore STARTDT/STOPDT state (0=No, 1=Yes)
If this parameter is set to 1, the module will ignore the STARTDT and STOPDT
requests by the client unit.
TESTFR Requests
Connections that are unused (but opened) may be periodically tested in both
directions by sending test messages (TESTFR=act) which are confirmed by the
receiving station sending TESTFR=con messages. The 4205/5205-TS-104SPDPS module can be configured to periodically send this message using the
following parameter:
t3 timeout set value : 30 #timeout for test frame on idle state
ProSoft Technology, Inc. Page 51 of 128
July 12, 2007
Page 52
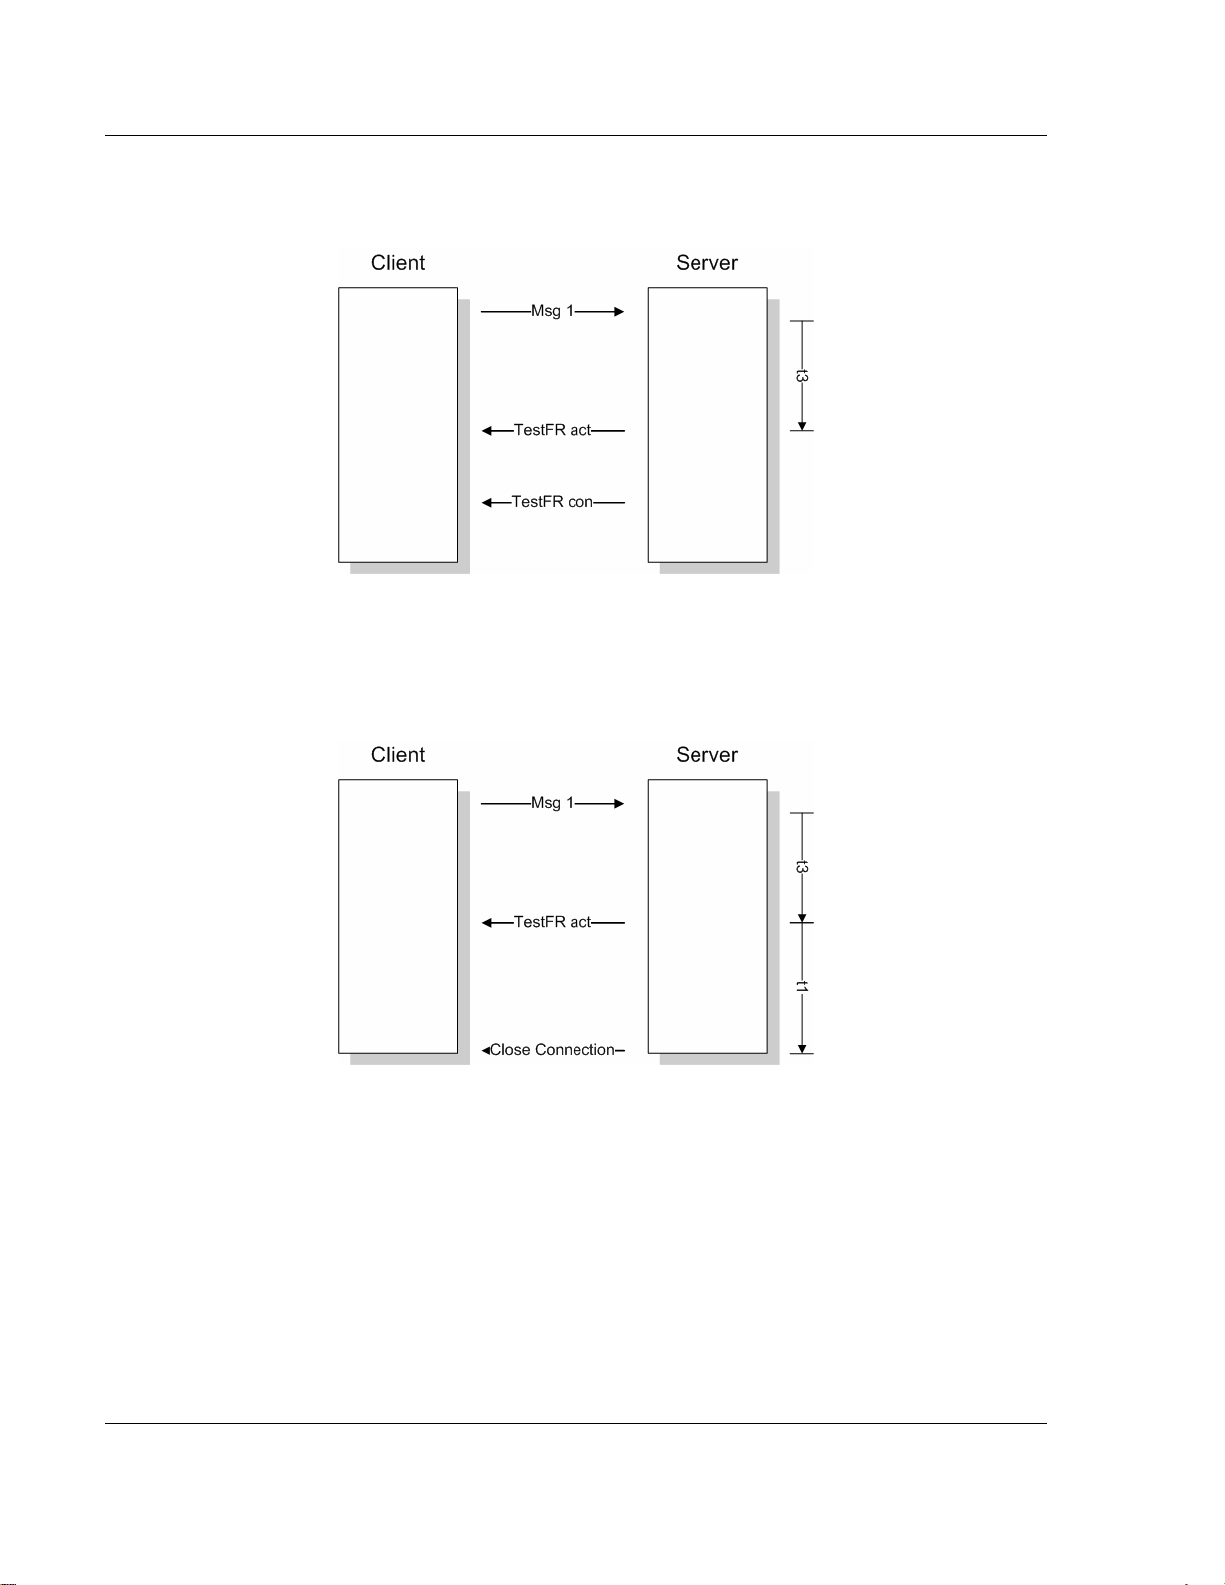
4205/5205-TS-104S-PDPS ♦ ProLinx Standalone Protocol Implementation
IEC-60870-5-104 to PDPS Communication Module with Time Stamp
In the example above, the module would send a TESTFR.ACT message 30
seconds after receiving the last message:
If the module does not receive the TESTFR.con message within a certain
amount of time, it will timeout and close the connection. You can configure the
timeout period using the following parameter:
t1 timeout set value : 15 #timeout of send or test ASDU
When closing the connection, the module can be configured to clear all the
messages in its queue. The following parameter is used to implement this task:
Clear queue on close: 1 #Clear the queue when connection closed
#(0=No, 1=Yes)
The configuration above would cause to module to delete all pending
messages/events while closing the connection to the client.
Page 52 of 128 ProSoft Technology, Inc.
July 12, 2007
Page 53

Protocol Implementation 4205/5205-TS-104S-PDPS ♦ ProLinx Standalone
IEC-60870-5-104 to PDPS Communication Module with Time Stamp
2.1.6 Events
In order to improve communication efficiency, most applications will require the
client to periodically poll for data changes with a higher priority than polling for
monitor data. Every time a data changes, the server sends this information,
typically with the date and time information on when it has occurred.
Deadbands
The monitored measured points (M_ME_NA and M_ME_NB) will only generate
events if the data changes from a value greater than the configured deadband
value.
For example, with the following point configured:
[M_ME_NB_1 104]
# Default
# Point # DB Address Group(s) Deadband
# ------- ---------- -------- -------START
500 105 80000000 100
END
So, if the current value for this point is 130, it would only generate events if:
NEW VALUE is less or equal than 30
OR
NEW VALUE is greater or equal than 230.
You can set the deadband for each monitored measured point through the
configuration file.
The client may also dynamically change the deadband for each monitored point.
The client may send one of the following commands:
Type Command
110 Parameter of Measured Normalized Data (M_ME_NA)
111 Parameter of Measured Scaled Data (M_ME_NB)
112 Parameter of Measured Short Floating Point (M_ME_NC)
ProSoft Technology, Inc. Page 53 of 128
July 12, 2007
Page 54

4205/5205-TS-104S-PDPS ♦ ProLinx Standalone Protocol Implementation
IEC-60870-5-104 to PDPS Communication Module with Time Stamp
The protocol specification explains that the qualifier value for these commands
should be configured as:
Bits Value Description
1 to 6
0 Not Used
1 Threshold Value (Deadband)
2 Smoothing Factor (filter time constant) – Not Supported
3 Low Limit Transmission of Measured Value
4 High Limit Transmission of Measured Value
5..31 Reserved
0 No Change 7
1 Change
0 Operation 8
1 Not in Operation
For the 4205/5205-TS-104S-PDPS module, the Low Limit and High Limit
parameters cannot be changed by command, because these values are
calculated as follows:
Low Limit = (LAST REPORTED VALUE) – Deadband
High Limit = (LAST REPORTED VALUE) + Deadband
These commands must be sent to a specific Information Object Address. The
4205/5205-TS-104S-PDPS module associates each monitor measured point with
a parameter point through the following configuration parameters:
M_ME_NA Parameter Offset : 2000 #M_ME_NA IOA offset for parameter data
M_ME_NB Parameter Offset : 2000 #M_ME_NB IOA offset for parameter data
M_ME_NC Parameter Offset : 2000 #M_ME_NC IOA offset for parameter data
Example:
If the following monitored measured points are configured:
[M_ME_NA_1 104]
#
# Default
# Point # DB Address Group(s) Deadband IV DB Bit
# ------- ---------- -------- -------- --------START
400 10 00000002 100 # P1 suction pressure
401 11 00000002 100 # P1 discharge pressure
402 12 00000002 100 # P2 suction pressure
403 13 00000002 100 # P2 discharge pressure
404 14 00000002 100 # Station discharge pressure
405 15 00000002 100 # VSD speed
406 16 00000002 100 #
407 17 00000002 100 #
408 18 00000002 100 #
409 19 00000002 100 #
END
Page 54 of 128 ProSoft Technology, Inc.
July 12, 2007
Page 55

Protocol Implementation 4205/5205-TS-104S-PDPS ♦ ProLinx Standalone
IEC-60870-5-104 to PDPS Communication Module with Time Stamp
[M_ME_NB_1 104]
#
# Default
# Point # DB Address Group(s) Deadband IV DB Bit
# ------- ---------- -------- -------- --------START
500 20 00000002 100 # P1 inboard bearing temp
501 21 00000002 100 # P1 outboard bearing temp
502 22 00000002 100 # P1 winding Temp
503 23 00000002 100 # P1 current
504 24 00000002 100 # P2 inboard bearing temp
505 25 00000002 100 # P2 outboard bearing temp
506 26 00000002 100 # P2 winding Temp
507 27 00000002 100 # P2 current
508 28 00000002 100 #
509 29 00000002 100 #
END
[M_ME_NC_1 104]
#
# Default
# Point # DB Address Group(s) Deadband IV DB Bit
# ------- ---------- -------- -------- --------START
600 30 00000002 100 #
601 32 00000002 100 #
602 34 00000002 100 #
603 36 00000002 100 #
604 38 00000002 100 #
605 40 00000002 100 #
606 42 00000002 100 #
607 44 00000002 100 #
608 46 00000002 100 #
609 48 00000002 100 #
END
And the parameter points are configured as follows:
M_ME_NA Parameter Offset : 2000 #M_ME_NA IOA offset for parameter data
M_ME_NB Parameter Offset : 2000 #M_ME_NB IOA offset for parameter data
M_ME_NC Parameter Offset : 2000 #M_ME_NC IOA offset for parameter data
It would imply that the parameter points would be configured as follows:
M_ME_NA
Monitored Measured Normalized Point Associated Parameter Point
400 2400
401 2401
402 2402
403 2403
404 2404
ProSoft Technology, Inc. Page 55 of 128
July 12, 2007
Page 56

4205/5205-TS-104S-PDPS ♦ ProLinx Standalone Protocol Implementation
IEC-60870-5-104 to PDPS Communication Module with Time Stamp
M_ME_NB
Monitored Measured Normalized Point Associated Parameter Point
500 2500
501 2501
502 2502
503 2503
504 2504
In order to send change the deadband for the M_ME_NA point 400, the client
would send a command type 110 to point 2400:
M_ME_NC
Monitored Measured Normalized Point Associated Parameter Point
600 2600
601 2601
602 2602
603 2603
604 2604
Page 56 of 128 ProSoft Technology, Inc.
July 12, 2007
Page 57

Protocol Implementation 4205/5205-TS-104S-PDPS ♦ ProLinx Standalone
IEC-60870-5-104 to PDPS Communication Module with Time Stamp
Controlling the Generation of Events
Some applications may require that only some points should generate events.
The application would only poll the current value for these points, although there
would be no special interest on when these points change the values. Other
applications may require that all configured points should generate events.
The 4205/5205-TS-104S-PDPS module offers a lot of flexibility for event control.
The user may control if events will be generated at 3 different levels:
1 General (All Points)
2 Data Type Level
3 Point Level
General (All Points)
The user may control how frequently the module will scan the database for
events using the following configuration parameter:
Event Scan delay : 1 #MSec between event scanning (0-65535)
#0=Disable
If this parameter is set to 0, the module will not generate events for any points. A
non-zero value will configure how frequently the module will scan for events in
the database.
Data Type Lev e l
The user may configure if a data type should generate events or not. Each data
type has a configuration parameter to control the generation of events:
M_SP_NA Scan Events : 1 #0=No scanning, 1=scan for events
M_DP_NA Scan Events : 0 #0=No scanning, 1=scan for events
M_ST_NA Scan Events : 0 #0=No scanning, 1=scan for events
M_ME_NA Scan Events : 0 #0=No scanning, 1=scan for events
M_ME_NB Scan Events : 0 #0=No scanning, 1=scan for events
M_ME_NC Scan Events : 0 #0=No scanning, 1=scan for events
In the example above, only the M_SP_NA points would generate events.
Point Level
You can configure if each point should generate events or not using the Group
field for each point configuration. The user should set the value as 40000000 in
order to disable the generation of events for that specific point.
[M_SP_NA_1 104]
#
# Point # DB Address Group(s)
# ------- ---------- -------START
100 1600 40000000 # P1-PSHH -- Discharge pressure SD
END
ProSoft Technology, Inc. Page 57 of 128
July 12, 2007
Page 58

4205/5205-TS-104S-PDPS ♦ ProLinx Standalone Protocol Implementation
IEC-60870-5-104 to PDPS Communication Module with Time Stamp
Time Information
Each event may also send the date and time when it has occurred. The
4205/5205-TS-104S-PDPS module supports the CP56 time format (as defined in
the protocol specification). This format contains the milliseconds, seconds,
minute, hour, day, month and year when the event has occurred.
The 4205/5205-TS-104S-PDPS module may also be configured not to send any
time information with each event for certain data types.
The following parameters may be used to control the time information for each
data type:
M_SP_NA Time Type : 2 #0=None, 2=CP56 time
M_DP_NA Time Type : 2 #0=None, 2=CP56 time
M_ST_NA Time Type : 2 #0=None, 2=CP56 time
M_ME_NA Time Type : 2 #0=None, 2=CP56 time
M_ME_NB Time Type : 2 #0=None, 2=CP56 time
M_IT_NA Time Type : 2 #0=None, 2=CP56 time
M_IT_NC Time Type : 2 #0=None, 2=CP56 time
Note: The client should send a Time Synchronization command to the module
in order to synchronize its date and time information, according to the protocol
specifications. Depending on certain parameters, as well as hardware
limitations, the module may present some time delay over time. The client
should periodically send time synchronization requests to the 104S module.
Event Priority
Event Priority permits ASDUs that generate events to be placed in priority
queues that are set by the user. The configuration file contains the following
parameters to support this feature:
[IEC-870-5-PDPS Port 0]
Set Priority Queues : 1 #Set user defined priority queues 1=Yes,
#0=No
M_SP_NA Priority : 1 #Unique index for this data type in queue
#(0-5)
M_DP_NA Priority : 0 #Unique index for this data type in queue
#(0-5)
M_ST_NA Priority : 5 #Unique index for this data type in queue
#(0-5)
M_ME_NA Priority : 4 #Unique index for this data type in queue
#(0-5)
M_ME_NB Priority : 3 #Unique index for this data type in queue
#(0-5)
M_ME_NC Priority : 2 #Unique index for this data type in queue
#(0-5)
M_IT_NA Priority : 6 #Unique index for this data type in queue
#(0-5)
The Set Priority Queues parameter must be enabled for this feature to be used.
Each of the ASDU's affected by this feature must be assigned a unique priority
index from 0 to 6. Events of the ASDU with a priority of 0 will always be reported
before any others when they are present.
Page 58 of 128 ProSoft Technology, Inc.
July 12, 2007
Page 59

Protocol Implementation 4205/5205-TS-104S-PDPS ♦ ProLinx Standalone
IEC-60870-5-104 to PDPS Communication Module with Time Stamp
Example – Event Priority
If the module is configured with the example values above, and the event queue
contains the events generated in the following order:
Event Order ASDU
1 M_SP_NA
2 M_SP_NA
3 M_DP_NA
4 M_ST_NA
5 M_DP_NA
6 M_SP_NA
The module will respond to a class one data request from the controlling station
by returning the data in the event queue in the order shown in the following table:
Packet Order Con t ent
1 M_DP_NA events 3 and 5
2 M_SP_NA events 1, 2 and 6
3 M_ST_NA event 4
Note that the events are packed into messages in order to maximize the
bandwidth on the network. The following warning must be considered when
deciding to use this feature: Because events from the highest priority queues are
always reported when present before lower priority queues, events in the lower
queues may be lost due to buffer overflow.
If this feature is not utilized, each ASDU's events are stored in their own queue.
The module will report each queue containing events in a round-robin fashion
with all the data for each ASDU being packed. This methodology limits the
possibility of a buffer overflowing and still maximizes the use of bandwidth on the
communication channel.
ProSoft Technology, Inc. Page 59 of 128
July 12, 2007
Page 60

4205/5205-TS-104S-PDPS ♦ ProLinx Standalone Protocol Implementation
IEC-60870-5-104 to PDPS Communication Module with Time Stamp
2.2 Redundant Connections
The module supports redundancy by accepting two simultaneous client
connections. Only one connection can send/receive user data at a time, so the
module uses the STARTDT function to select to which client it will be exchanging
data. The module will send events and accept commands only to the client
connection that has sent the last STARTDT function.
The following diagram shows an example where the module sends five events to
two different clients. The module initially receives a STARTDT request from
Client 1 and therefore sends the following events to this client. After the third
event the Client 1 sends a STOPDT request and then Client 2 sends a
STARTDT request to the module. From that point on the module will send the
next events to Client 2 only.
Please note the following:
1 The STARTDT triggers the switch of the connection. Therefore, the STOPDT
request is not actually required from the current client to perform the switch
(although the previous diagram indicates the recommended communication
procedure)
2 The module will respond to any TESTFR requests received by both clients at
any time.
By selecting the E key (Display Program Status) the user can monitor the status
of both connections can be monitored. For the example below, the client
connected through Socket 1 is actively exchanging data to the module. This can
be confirmed since the START DT Active register has a value of YES (which
means that the last START DT received was through Socket 1).
Page 60 of 128 ProSoft Technology, Inc.
July 12, 2007
Page 61

Protocol Implementation 4205/5205-TS-104S-PDPS ♦ ProLinx Standalone
IEC-60870-5-104 to PDPS Communication Module with Time Stamp
You can also monitor the number of connections opened and closed per each
socket:
ProSoft Technology, Inc. Page 61 of 128
July 12, 2007
Page 62

4205/5205-TS-104S-PDPS ♦ ProLinx Standalone Protocol Implementation
IEC-60870-5-104 to PDPS Communication Module with Time Stamp
2.3 PDPS Protocol Implementation
2.3.1 Functional Overview
The PROFIBUS slave protocol driver may exist in a single port implementation.
The driver can be configured as a slave interface with other PROFIBUS devices.
The PROFIBUS slave port can be used to continuously interface with other
PROFIBUS devices over a serial communication interface (RS-485).
Module Internal Database
Central to the functionality of the module is the internal database. This database
is shared between all the ports on the module and is used as a conduit to pass
information from one device on one network to one or more devices on another
network. This permits data from devices on one communication port/network to
be viewed and controlled by devices on another port/network. In addition to data
from the slave port, status and error information generated by the module can
also be mapped into the internal database.
PROFIBUS Slave Port Access to Database
The Slave driver uses the database in two ways:
1 A read command issued to a slave device by the slave driver will return the
slave data into the internal database.
2 A write command issued to a slave device by the slave driver uses the data in
the internal database to write to the slave device
Page 62 of 128 ProSoft Technology, Inc.
July 12, 2007
Page 63

Protocol Implementation 4205/5205-TS-104S-PDPS ♦ ProLinx Standalone
IEC-60870-5-104 to PDPS Communication Module with Time Stamp
Mailbox Commands
Start Stop Direction Description
100 101 PLC to GW Event Data
150 151 PLC to GW Database write transfer
160 161 GW to PLC Database read transfer
200 200 Both Set Time
201 201 Both Get Time
202 202 Both Get Event Buffer Counts
PLC = PROFIBUS master interface in PLC
GW = ProLinx Gateway
NOTES:
The block number for each device must be changed to trigger an operation.
The I/O data area is owned exclusively by only the PLC or GW.
A timeout must be implemented in the PLC in case the GW is not present.
Mailbox Structure
Mailbox From PLC to GW
Start Byte End Byte Description
0 0 Block number of data in block
1 1 Block number of data requested
2 198 Data for block
199 199 Block number of data in block
Mailbox From GW to PLC
Start Byte End Byte Description
0 0 Block number of data in block
1 1 Block number last requested by PLC
2 198 Data for block
199 199 Block number of data in block
Example Raw Database Exchange
Start Byte End Byte Description
0 0 150 (Raw data write)
1 1 160 (Raw data read)
2 3 Start register in database for write
4 5 Number of registers to write (1 to 94)
6 7 Start register in database for read
8 9 Number of registers to read (1 to 96)
10 197 Words to write to the database
198 198 Reserved
199 199 150 (Raw data write)
ProSoft Technology, Inc. Page 63 of 128
July 12, 2007
Page 64

4205/5205-TS-104S-PDPS ♦ ProLinx Standalone Protocol Implementation
IEC-60870-5-104 to PDPS Communication Module with Time Stamp
Example Response Block From GW
Start Byte End Byte Description
0 0 160 (Raw data read)
1 1 150 (Raw data write)
2 3 Start register in database for read
4 5 Number of registers to read (1 to 96)
6 197 Words read from the database
198 198 Reserved
199 199 160 (Raw data read)
Example Event Data Block From PLC
Start Byte End Byte Description
0 0 100 (Event data)
1 1 201 (Get Time)
2 3 Event Count
4 195 Event Data
196 198 Reserved for future use
199 199 100 (Event data)
Example Response Block From GW
Start Byte End Byte Description
0 0 201 (Get Time)
1 1 100 (Event data)
2 3 Year
4 5 Month
6 7 Day
8 9 Hour
10 11 Minutes
12 13 Seconds & milliseconds
14 198 Reserved for future use
199 199 201 (Get Time)
Example Set Time Data Block From PLC
Start Byte End Byte Description
0 0 200 (Set Time)
1 1 201 (Get Time)
2 3 Year
4 5 Month
6 7 Day
8 9 Hour
10 11 Minutes
12 13 Seconds & milliseconds
14 198 Reserved for future use
199 199 200 (Set Time)
Page 64 of 128 ProSoft Technology, Inc.
July 12, 2007
Page 65

Protocol Implementation 4205/5205-TS-104S-PDPS ♦ ProLinx Standalone
IEC-60870-5-104 to PDPS Communication Module with Time Stamp
Example Response Block From GW
Start Byte End Byte Description
0 0 201 (Get Time)
1 1 200 (Set Time)
2 3 Year
4 5 Month
6 7 Day
8 9 Hour
10 11 Minutes
12 13 Seconds & milliseconds
14 198 Reserved for future use
199 199 201 (Get Time)
Example Get Event Buffer Count Block From PLC
Start Byte End Byte Description
0 0 100 (Event data)
1 1 202 (Get Event Buffer Count)
2 3 Event Count
4 195 Event Data
196 198 Reserved for future use
199 199 100 (Event data)
Example Response Block From GW
Start Byte End Byte Description
0 0 202 (Get Event Buffer Count)
1 1 100 (Event data)
2 3 Single point event buffer space
4 5 Double point event buffer space
6 7 Step point event buffer space
8 9 Normalized event buffer space
10 11 Scaled event buffer space
12 13 Short-float event buffer space
14 15 Integrated totals event buffer space
16 198 Reserved
199 199 202 (Get Event Buffer Count)
Block 100 to 101 identification codes send event messages from the PROFIBUS
interface to the IEC-60870-5-104S driver.
Event Data Block Format
Start
Byte
End Byte
Data
Field(s)
0 0 Block ID
1 1
Data block
being
requested
2 3 Event Count
4 19 Event #1 Event data to add to event message queue.
Description
This field contains the value of 100 to 101 identifying the
block type to the module.
This field contains the block ID being requested for the
response block.
Number of events present in the block. This field can
have a value from 1 to 12.
ProSoft Technology, Inc. Page 65 of 128
July 12, 2007
Page 66

4205/5205-TS-104S-PDPS ♦ ProLinx Standalone Protocol Implementation
IEC-60870-5-104 to PDPS Communication Module with Time Stamp
Start
Byte
End Byte
Data
Field(s)
20 35 Event #2 Event data to add to event message queue.
36 51 Event #3 Event data to add to event message queue.
52 67 Event #4 Event data to add to event message queue.
68 83 Event #5 Event data to add to event message queue.
84 99 Event #6 Event data to add to event message queue.
100 115 Event #7 Event data to add to event message queue.
116 131 Event #8 Event data to add to event message queue.
132 147 Event #9 Event data to add to event message queue.
148 163 Event #10 Event data to add to event message queue.
164 179 Event #11 Event data to add to event message queue.
180 195 Event #12 Event data to add to event message queue.
196 198 Reserved Reserved for future use
199 199 Block ID Copy of byte 0 in the block.
Description
The structure of each event record in the block is shown below:
Start
Byte
End Byte
Data
Field(s)
0 1 DB Index
Description
This is the index for the point in the module's database.
This corresponds to the order of point definition for the
module data types. This is not the point address for the
event.
2 2 ASDU
This is the ASDU data type for the event message. Valid
entries for this field are as follows: 1=single point,
3=double-point, 5=step, 9=normalized, 11=scaled,
13=short-float and 15=integrated total.
3 3 Qualifier
This is the qualifier code to be used with the event
message. Refer to the IEC protocol specification for a full
listing of valid qualifier codes for each ASDU type.
4 5 Year
This field contains the four-digit year to be used with the
event.
6 6 Month
This field contains the month value for the event. Valid
entry for this field is in the range of 1 to 12.
7 7 Day
This field contains the day value for the event. Valid entry
for this field is in the range of 1 to 31.
8 8 Hour
This field contains the hour value for the event. Valid
entry for this field is in the range of 0 to 23.
9 9 Minute
This field contains the minute value for the event. Valid
entry for this field is in the range of 0 to 59.
10 11
Seconds &
Milliseconds
This field contains the seconds and milliseconds value
for the event. Valid entry for this field is in the range of 0
to 59,999.
12 15 Data
These bytes contain the data to be used with the event.
For single- and double-point, step events, the first byte is
used. For measured value events, the first two bytes are
used. For integrated total and short-float events, all four
bytes are used.
Page 66 of 128 ProSoft Technology, Inc.
July 12, 2007
Page 67

Protocol Implementation 4205/5205-TS-104S-PDPS ♦ ProLinx Standalone
IEC-60870-5-104 to PDPS Communication Module with Time Stamp
PROFIBUS Slave Error and Status Data
The PROFIBUS Slave Error and Status Data area is discussed in this section.
The data area is initialized with zeros whenever the module is initialized. This
occurs during a cold-start (power-on), reset (reset push-button pressed) or a
warm-boot operation (commanded or loading of new configuration). Counter
values are also initialized to 0 at power up.
Example Internal
Database Address
10300 0
10301 1 Reserved
10302 2 Reserved
10303 3 Reserved
10304 4 Product Codes Bytes 0 and 1
10305 5 Product Codes Bytes 2 and 3
10306 6 Product Codes Bytes 4 and 5
10307 7 Product Codes Bytes 6 and 7
10308 8 Product Codes Bytes 8 and 9
10309 9 PROFIBUS Status Register
10310 10
10311 11
10312 12
10313 13 No valid data
…
…
…
10399
Word Offset Description
Diagnostic reporting state
0=normal
1=extended
2=static diagnostics
3=extended/static diagnostics
Module state and last global command received by slave from
a master
Input counter (number of times the input region of the
database is transferred to the input image)
Output counter (number of times the output image is
transferred to the database)
Refer to the following topics to interpret the status/error codes present in the data
area.
Diagnostic state – Word 10300
0 = Normal Operation or not in data exchange with Status Register [0] Bit
0x20 set.
1 = Not in data exchange state with the Status Register [0] bit 0x20 not set or
normal operation with the Status Register [0] bit 0x20 not set.
3 = Not in a defined state or in module state 1, 2 or 3.
4 = Normal operation with Status Register [0] bit 0x20 set
ProSoft Technology, Inc. Page 67 of 128
July 12, 2007
Page 68

4205/5205-TS-104S-PDPS ♦ ProLinx Standalone Protocol Implementation
IEC-60870-5-104 to PDPS Communication Module with Time Stamp
PROFIBUS Reserved Words - Word 10301 to Word 10303
Reserved for future use.
Words 10304 - 10308
Example Internal
Database Address
10304 4 Product Codes Bytes 0 and 1
10305 5 Product Codes Bytes 2 and 3
10306 6 Product Codes Bytes 4 and 5
10307 7 Product Codes Bytes 6 and 7
10308 8 Product Codes Bytes 8 and 9
Word Offset Description
PROFIBUS Status Register – Word 10309
SPC3 ASIC slave status information provided to the master
Bit 0
Bit 1
Bit 2
Bit 3
Bits
4,5
Bits
6,7
Offline/Passive-Idle
Offline-/Passive-Idle state
0 = SPC3 is in offline
1 = SPC3 in passive idle
FDL_IND_ST (Fieldbus Data link Layer)
FDL indication is temporarily buffered.
0 = No FDL indication is temporarily buffered.
1 = FDL indication is temporarily buffered.
Diag_Flag
Status diagnostics buffer
0 = The DP master fetches the diagnostics buffer.
1 = The DP master has not yet fetched the diagnostics buffer.
RAM Access Violation
Memory access > 1.5kByte
0 = No address violation
1 = For addresses > 1536 bytes, 1024 is subtracted from the current address,
and there is access to this new address.
DP-State
DP-State Machine state
00 = 'Wait_Prm' state
01 = 'Wait_Cfg' state
10 = 'DATA_EX' state
11 = Not possible
WD-State
Watchdog-State-Machine state
00 = 'Baud_Search' state
01 = 'Baud_Control' state
10 = 'DP_Control' state
11 = Not possible
Page 68 of 128 ProSoft Technology, Inc.
July 12, 2007
Page 69

Protocol Implementation 4205/5205-TS-104S-PDPS ♦ ProLinx Standalone
IEC-60870-5-104 to PDPS Communication Module with Time Stamp
Bits
8 - 11
Bits
12 - 15
Baud rate:
The baud rates SPC3 found
0000 = 12 Mbaud
0001 = 6 Mbaud
0010 = 3 Mbaud
0011 = 1.5 Mbaud
0100 = 500 kBaud
0101 = 187.5 kBaud
0110 = 93.75 kBaud
0111 = 45.45 kBaud
1000 = 19.2 kBaud
1001 = 9.6 kBaud
Rest = Not possible
SPC3-Release:
Release no. for SPC3
0000 = Release 0
Rest = Not possible
Further explanation of Status Register [0] – Word 10309 Bit states
Bit 0
Offline/Passive-idle
0 = SPC3 exits offline and goes to passive-idle. The idle timer and Wd timer
go offline.
1= SPC3 exits offline and goes to passive-idle. The idle timer and Wd timer
are started.
Bit 4, 5
10 = Data Exchange State is Normal. The SPC3 has a correct configuration.
Module State – Word 10310 Byte 0
Indicates the current state of the module.
0 = Normal Operation
1 = Shutdown
2 = File Transfer
3 = SPC3 ASIC problem
4 = Not in data exchange
Last Global Command – Word 10310 Byte 1
The value of the last global command code received from the master.
Bit Designation Significance
0 Reserved
1 Clear_Data
2 Unfreeze With 'Unfreeze' - freezing input data is cancelled.
3 Freeze
With this command the ASCI output data is deleted in data
transfer buffer and is changed to next transfer data buffer
contents.
The ASCI input data is fetched from next transfer buffer to data
transfer buffer and frozen. New input data is not fetched again
until the master sends the next 'Freeze' command.
ProSoft Technology, Inc. Page 69 of 128
July 12, 2007
Page 70

4205/5205-TS-104S-PDPS ♦ ProLinx Standalone Protocol Implementation
IEC-60870-5-104 to PDPS Communication Module with Time Stamp
Bit Designation Significance
4 Unsync The 'Unsync' command cancels the 'Sync' command.
5 Sync
6,7 Reserved
The ASCI output data transferred with a WRITE_READ_DATA
telegram is changed from data transfer buffer next state buffer.
The following transferred output data is kept in data transfer buffer
until the next 'Sync' command is given.
The Reserved designation specifies that these bits are reserved
for future function expansions.
PROFIBUS Input Counter – 10311
Input counter is incremented each time the input data is updated.
PROFIBUS Output Counter – Word 10312
Output counter is incremented each time the output data is updated.
Words 10313 - 10399
No valid data
Page 70 of 128 ProSoft Technology, Inc.
July 12, 2007
Page 71

Diagnostics and Troubleshooting 4205/5205-TS-104S-PDPS ♦ ProLinx Standalone IEC-60870-5-104 to PDPS Communication Module with Time Stamp
3 Diagnostics and Troubleshooting
In This Chapter
Definition of Module's Extended Diagnostics Data ................. 71
The module provides information on diagnostics and troubleshooting in the
following forms:
Status data values are transferred from the module to the processor.
Data contained in the module can be viewed through the
Configuration/Debug port attached to a terminal emulator.
LED status indicators on the front of the module provide information on the
module's status.
3.1 Definition of Module's Extended Diagnostics Data
The Extended Diagnostic Data is reported during startup and initialization
sequence when the master requests diagnostic data from the module. The
Extended Diagnostics is "Device Related" type providing status data (the
extended diagnostic bit 3 in standard diagnostic byte 1 is set = 0). The data
length is normally 14 (0E) bytes displayed in the following format:
Byte(s) Description (HEX)
0 Extended Diagnostics length (normally 14 bytes (0E))
1 to 6 ASCII data for Product Version
7 to 10 ASCII data for Product Name
11 Value of Status Register [0] (see Section 2)
12 Value of Status Register [1] (see Section 2)
13 Module State (see Section 2)
Bytes 7 through 10 Data – Specific Product Code Value
Each ProLinx application has its own, unique product code. You can determine
the product code from the Version screen in the Configuration/Debug menu.
The following table lists the product codes for some ProLinx modules that
support the PDPS protocol.
Example Product Example Product Code
5105-ASCII-PDPS ASPS
5105-DFCM-PDPS DFPS
5105-DH485-PDPS D4PS
5105-DNPM-PDPS DMPS
5105-DNPS-PDPS D3PS
5105-I101S-PDPS ISPS
5105-I103M-PDPS PSI3
5105-MCM-PDPS PDSM
ProSoft Technology, Inc. Page 71 of 128
July 12, 2007
Page 72

4205/5205-TS-104S-PDPS ♦ ProLinx Standalone Diagnostics and Troubleshooting
IEC-60870-5-104 to PDPS Communication Module with Time Stamp
Sample Diagnostics reported to master.
Translated as follows:
Extended diagnostics length 0E= 14 bytes, Product Version 56 = "V", 30 =
"0", 31 = "1", 2E = ".", 30 = "0", 35 = "5", Product Name 50 = ""P", 44 = ""D", 53
= "S", 34 = "4" (MVI46),
Status Register [0] 41 = SPC3 in passive idle and WD-State is in DP_Control
State, Status Register [1] 03 = 1.5 Baud rate, Module State 04 = not in data
exchange
3.1.1 The Configuration/Debug Menu
The Configuration and Debug menu for this module is arranged as a tree
structure, with the Main Menu at the top of the tree, and one or more sub-menus
for each menu command. The first menu you see when you connect to the
module is the Main menu.
Because this is a text-based menu system, you enter commands by typing the
command letter from your computer keyboard in the diagnostic window in
ProSoft Configuration Builder (PCB). The module does not respond to mouse
movements or clicks. The command executes as soon as you press the
command letter — you do not need to press [Enter]. When you type a command
letter, a new screen will be displayed in your terminal application.
Using the Diagnostic Window in ProSoft Configuration Builder
To connect to the module's Configuration/Debug serial port:
1 Start PCB program with the application file to be tested. Right click over the
module icon.
Page 72 of 128 ProSoft Technology, Inc.
July 12, 2007
Page 73

Diagnostics and Troubleshooting 4205/5205-TS-104S-PDPS ♦ ProLinx Standalone
IEC-60870-5-104 to PDPS Communication Module with Time Stamp
2 On the shortcut menu, choose Diagnostics.
3 This action opens the following dialog box. Press "?" to display the Main
Menu.
If there is no response from the module, follow these steps:
1 Verify that the cable is connected properly between your computer's serial or
Ethernet port and the module. A regular serial cable will not work.
2 On computers with more than one serial port, verify that your communication
program is connected to the same port that is connected to the module.
If you are still not able to establish a connection, you can contact ProSoft
Technical Services for assistance.
ProSoft Technology, Inc. Page 73 of 128
July 12, 2007
Page 74

4205/5205-TS-104S-PDPS ♦ ProLinx Standalone Diagnostics and Troubleshooting
IEC-60870-5-104 to PDPS Communication Module with Time Stamp
Navigation
All of the sub-menus for this module contain commands to redisplay the menu or
return to the previous menu. You can always return from a sub-menu to the next
higher menu by pressing [M] on your keyboard.
The organization of the menu structure is represented in simplified form in the
following illustration:
The remainder of this section shows you the menus available for this module,
and briefly discusses the commands available to you.
Keystrokes
The keyboard commands on these menus are almost always non-case sensitive.
You can enter most commands in lower case or capital letters.
The menus use a few special characters ([?], [-], [+], [@]) that must be entered
exactly as shown. Some of these characters will require you to use the [Shift],
[Ctrl] or [Alt] keys to enter them correctly. For example, on US English
keyboards, enter the [?] command as [Shift][/].
Also, take care to distinguish capital letter [I] from lower case letter [l] (L) and
number [1]; likewise for capital letter [O] and number [0]. Although these
characters look nearly the same on the screen, they perform different actions on
the module.
3.1.2 Required Hardware
You can connect directly from your computer's serial port to the serial port on the
module to view configuration information, perform maintenance, and send
(upload) or receive (download) configuration files.
ProSoft Technology recommends the following minimum hardware to connect
your computer to the module:
80486 based processor (Pentium preferred)
1 megabyte of memory
At least one UART hardware-based serial communications port available.
USB-based virtual UART systems (USB to serial port adapters) often do not
function reliably, especially during binary file transfers, such as when
uploading/downloading configuration files or module firmware upgrades.
A null modem serial cable.
Page 74 of 128 ProSoft Technology, Inc.
July 12, 2007
Page 75

Diagnostics and Troubleshooting 4205/5205-TS-104S-PDPS ♦ ProLinx Standalone
IEC-60870-5-104 to PDPS Communication Module with Time Stamp
3.1.3 Main Menu
When you first connect to the module from your computer, your terminal screen
will be blank. To activate the main menu, press the [?] key on your computer's
keyboard. If the module is connected properly, the following menu will appear on
your terminal screen:
Caution: Some of the commands available to you from this menu are
designed for advanced debugging and system testing only, and can cause the
module to stop communicating with the processor or with other devices,
resulting in potential data loss or other failures. Only use these commands if
you are specifically directed to do so by ProSoft Technology Technical Support
staff. Some of these command keys are not listed on the menu, but are active
nevertheless. Please be careful when pressing keys so that you do not
accidentally execute an unwanted command.
Redisplaying the Menu
Press [?] to display the current menu. Use this command when you are looking
at a screen of data, and want to view the menu choices available to you.
ProSoft Technology, Inc. Page 75 of 128
July 12, 2007
Page 76

4205/5205-TS-104S-PDPS ♦ ProLinx Standalone Diagnostics and Troubleshooting
IEC-60870-5-104 to PDPS Communication Module with Time Stamp
Viewing Block Transfer Statistics
Press [B] from the Main Menu to view the Block Transfer Statistics screen.
Use this command to display the configuration and statistics of the backplane
data transfer operations between the module and the processor. The information
on this screen can help determine if there are communication problems between
the processor and the module.
Tip: To determine the number of blocks transferred each second, mark the
numbers displayed at a specific time. Then some seconds later activate the
command again. Subtract the previous numbers from the current numbers and
divide by the quantity of seconds passed between the two readings.
Viewing Module Configuration
Press [C] to view the Module Configuration screen.
Use this command to display the current configuration and statistics for the
module.
Opening the Database Menu
Press [D] to open the Database View menu. Use this menu command to view the
current contents of the module's database.
Opening the IEC-870-5-104 Server Menu
Press [I] to open the IEC-870-5-104 Server Menu. Use this command to view all
data associated with the IEC 60870-5-104 server driver.
Viewing SNTP Status
Press [N] to view configuration information about the SNTP client.
Refer to SNTP Support for more information on configuring and using this
function.
Page 76 of 128 ProSoft Technology, Inc.
July 12, 2007
Page 77

Diagnostics and Troubleshooting 4205/5205-TS-104S-PDPS ♦ ProLinx Standalone
IEC-60870-5-104 to PDPS Communication Module with Time Stamp
Viewing the Backplane Command List
Press [P] from the Main Menu to view the Backplane Data Exchange List. Use
this command to display the configuration and statistics of the backplane data
transfer operations.
Tip: Repeat this command at one-second intervals to determine the number of
blocks transferred each second.
Opening the Session Configuration Menu
Press [P] from the Main Menu Menu to open the PROFIBUS Slave menu. Use
this command to view PROFIBUS Slave configuration information.
The PROFIBUS Slave Menu section has more information about the commands
on this menu.
Receiving the Configuration File
Press [R] to download (receive) the current configuration file from the module.
For more information on receiving and sending configuration files, please see
Uploading and Downloading the Configuration File.
Sending the Configuration File
Press [S] to upload (send) an updated configuration file to the module. For more
information on receiving and sending configuration files, please see Uploading
and Downloading the Configuration File.
Viewing Version Information
Press [V] to view Version information for the module.
Use this command to view the current version of the software for the module, as
well as other important values. You may be asked to provide this information
when calling for technical support on the product.
Values at the bottom of the display are important in determining module
operation. The Program Scan Counter value is incremented each time a
module's program cycle is complete.
ProSoft Technology, Inc. Page 77 of 128
July 12, 2007
Page 78

4205/5205-TS-104S-PDPS ♦ ProLinx Standalone Diagnostics and Troubleshooting
IEC-60870-5-104 to PDPS Communication Module with Time Stamp
Tip: Repeat this command at one-second intervals to determine the frequency
of program execution.
Resetting diagnostic data
Press [U] to reset the status counters for the client and/or servers in the module.
Warm Booting the Module
Caution: Some of the commands available to you from this menu are
designed for advanced debugging and system testing only, and can cause the
module to stop communicating with the processor or with other devices,
resulting in potential data loss or other failures. Only use these commands if
you are specifically directed to do so by ProSoft Technology Technical Support
staff. Some of these command keys are not listed on the menu, but are active
nevertheless. Please be careful when pressing keys so that you do not
accidentally execute an unwanted command.
Press [W] from the Main Menu to warm boot (restart) the module. This command
will cause the program to exit and reload, refreshing configuration parameters
that must be set on program initialization. Only use this command if you must
force the module to re-boot.
Exiting the Program
Caution: Some of the commands available to you from this menu are
designed for advanced debugging and system testing only, and can cause the
module to stop communicating with the processor or with other devices,
resulting in potential data loss or other failures. Only use these commands if
you are specifically directed to do so by ProSoft Technology Technical Support
staff. Some of these command keys are not listed on the menu, but are active
nevertheless. Please be careful when pressing keys so that you do not
accidentally execute an unwanted command.
Press [Esc] to restart the module and force all drivers to be loaded. The module
will use the configuration stored in the module's Flash ROM to configure the
module.
Page 78 of 128 ProSoft Technology, Inc.
July 12, 2007
Page 79

Diagnostics and Troubleshooting 4205/5205-TS-104S-PDPS ♦ ProLinx Standalone
IEC-60870-5-104 to PDPS Communication Module with Time Stamp
3.1.4 Database View Menu
Press [D] from the Main Menu to open the Database View menu. Use this menu
command to view the current contents of the module's database. Press [?] to
view a list of commands available on this menu.
Viewing Register Pages
To view sets of register pages, use the keys described below:
Command Description
[0]
[1]
[2]
Display registers 0 to 99
Display registers 1000 to 1099
Display registers 2000 to 2099
And so on. The total number of register pages available to view depends on your
module's configuration.
Displaying the Current Page of Registers Again
This screen displays the current page of 100 registers in the database.
ProSoft Technology, Inc. Page 79 of 128
July 12, 2007
Page 80

4205/5205-TS-104S-PDPS ♦ ProLinx Standalone Diagnostics and Troubleshooting
IEC-60870-5-104 to PDPS Communication Module with Time Stamp
Moving Back Through 5 Pages of Registers
Press [-] from the Database View menu to skip back to the previous 500
registers of data.
Viewing the Previous 100 Registers of Data
Press [P] from the Database View menu to display the previous 100 registers of
data.
Skipping 500 Registers of Data
Hold down [Shift] and press [=] to skip forward to the next 500 registers of data.
Viewing the Next 100 Registers of Data
Press [N] from the Database View menu to select and display the next 100
registers of data.
Viewing Data in Decimal Format
Press [D] to display the data on the current page in decimal format.
Viewing Data in Hexadecimal Format
Press [H] to display the data on the current page in hexadecimal format.
Viewing Data in Floating Point Format
Press [F] from the Database View menu. Use this command to display the data
on the current page in floating point format. The program assumes that the
values are aligned on even register boundaries. If floating-point values are not
aligned as such, they are not displayed properly.
Viewing Data in ASCII (Text) Format
Press [A] to display the data on the current page in ASCII format. This is useful
for regions of the database that contain ASCII data.
Returning to the Main Menu
Press [M] to return to the Main Menu.
Page 80 of 128 ProSoft Technology, Inc.
July 12, 2007
Page 81
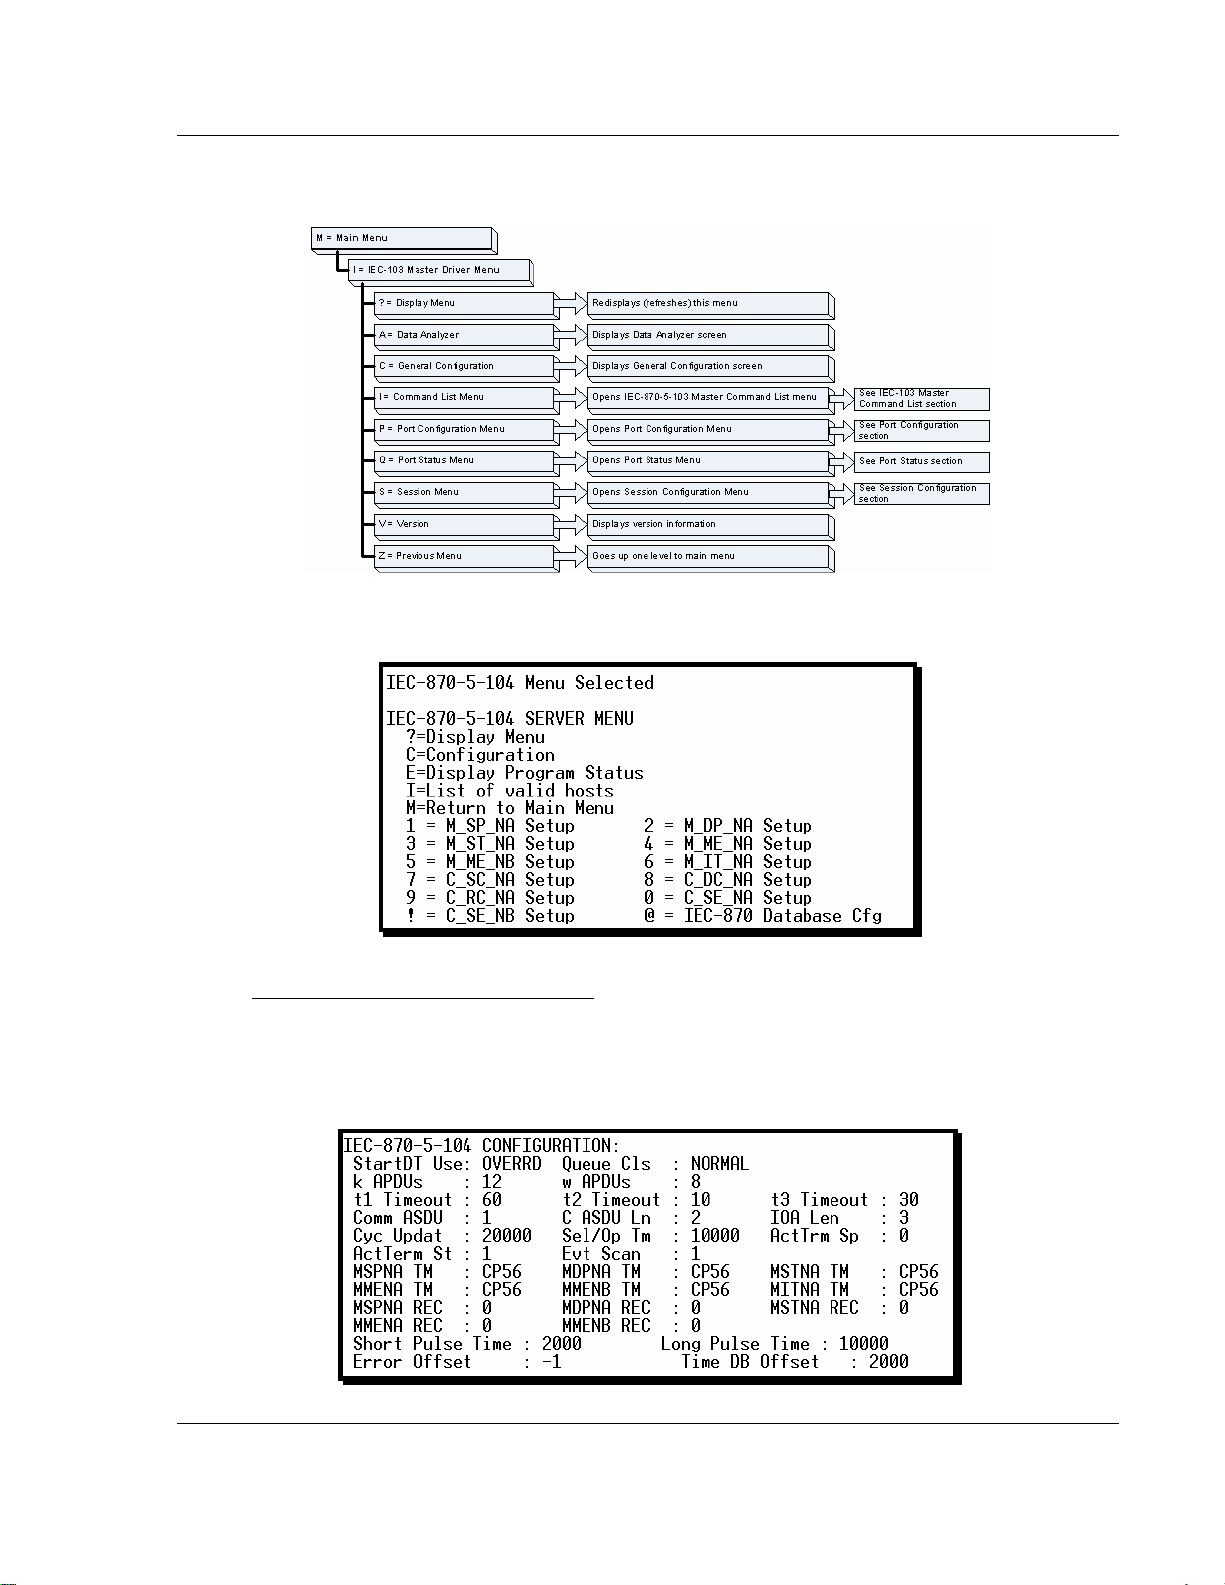
Diagnostics and Troubleshooting 4205/5205-TS-104S-PDPS ♦ ProLinx Standalone
IEC-60870-5-104 to PDPS Communication Module with Time Stamp
3.1.5 IEC-870-5-104 Server Menu
Press [I] from the main menu to display the IEC-870-5-104 Server Menu.
IEC-870-5-104 Configuration Menu
From the IEC-870-5-104 Server Menu, press [C] to display the IEC-870-5-104
Configuration Menu. This menu shows the module parameters configured by the
user through the configuration file:
ProSoft Technology, Inc. Page 81 of 128
July 12, 2007
Page 82

4205/5205-TS-104S-PDPS ♦ ProLinx Standalone Diagnostics and Troubleshooting
IEC-60870-5-104 to PDPS Communication Module with Time Stamp
IEC-870-5-104 Status Data
From the IEC-870-5-104 Server Menu press [E] to display the IEC-870-5-104
Status Data screen. Refer to the Status section for more information about these
values.
Lists of Valid Hosts
From the IEC-870-5-104 Server Menu press [I] to display the List of Valid Hosts
screen. These values are configured by the user and the IP addresses will be
displayed only if the "Use IP List" parameter is set to YES.
Point Setup
From the IEC-870-5-104 Server Menu press keys 1 to 9, 0 or ! to display the
point configuration for each data type. The information includes point address,
group and its current value.
Page 82 of 128 ProSoft Technology, Inc.
July 12, 2007
Page 83

Diagnostics and Troubleshooting 4205/5205-TS-104S-PDPS ♦ ProLinx Standalone
IEC-60870-5-104 to PDPS Communication Module with Time Stamp
Database Configuration
From the IEC-870-5-104 Server Menu press [@] to display the Database
Configuration screen. It displays the number of configured points and the event
configuration for each data type:
3.1.6 Network Menu
The network menu allows you to send, receive and view the WATTCP.CFG file
that contains the IP and gateway addresses, and other network specification
information.
Transferring WATTCP.CFG to the module
Press [R] to transfer a new WATTCP.CFG file from the PC to the module. Use
this command to change the network configuration for the module (for example,
the module's IP address).
Press [Y] to confirm the file transfer, and then follow the instructions on the
terminal screen to complete the file transfer process.
Transferring WATTCP.CFG to the PC
Press [S] to transfer the WATTCP.CFG file from the module to your PC.
Press [Y] to confirm the file transfer, and then follow the instructions on the
terminal screen to complete the file transfer process.
ProSoft Technology, Inc. Page 83 of 128
July 12, 2007
Page 84

4205/5205-TS-104S-PDPS ♦ ProLinx Standalone Diagnostics and Troubleshooting
IEC-60870-5-104 to PDPS Communication Module with Time Stamp
After the file has been successfully transferred, you can open and edit the file to
change the module's network configuration.
Viewing the WATTCP.CFG file on the module
Press [V] to view the module's WATTCP.CFG file. Use this command to confirm
the module's current network settings.
Returning to the Main Menu
Press [M] to return to the Main Menu.
3.1.7 PROFIBUS Slave Menu
The PROFIBUS Slave menu provides slave (module) status information and
error data.
Press [P] to open the PROFIBUS Slave menu.
Page 84 of 128 ProSoft Technology, Inc.
July 12, 2007
Page 85

Diagnostics and Troubleshooting 4205/5205-TS-104S-PDPS ♦ ProLinx Standalone
IEC-60870-5-104 to PDPS Communication Module with Time Stamp
Viewing PROFIBUS Slave Configuration
The Configuration Screen displays many specific SPC3 ASIC diagnostic data
useful to ProSoft Technology Technical Support and advanced PROFIBUS
users. Additional information can be found in the SPC3 specification.
Station Address = The configured station address set by the user
DOut Len is the total number of output bytes with the S1, S2 and S3 values
being pointers to the 3 output buffers in the SPC3 chip.
DIn Len is the total number of input bytes with the S1, S2 and S3 values being
pointers to the 3 input buffers in the SPC3 chip.
Diag1Len should always be 6 to represent the minimal number of diagnostic
bytes and S= pointer in SPC3 chip to this data.
Diag2Len is the extended diagnostic buffer length and S is a pointer to this data
in the SPC3 chip.
Aux1 Len: (see SPC3 specification) and S is a pointer to this data in the SPC3
chip.
Aux2 Len: (see SPC3 specification) and S is a pointer to this data in the SPC3
chip.
SSA Len is not used and should be 0 and its pointer S is N/A.
Param Len = is the length of the parameter data for the slave with S as the
pointer in the SPC3 chip to the data.
Cfg Len is the configuration length for the slave with S as the pointer.
RCfg len is that received from the master with S as the pointer.
Ident is the PROFIBUS identification number for the module.
FDL SAP last PTR is the end of all the PDPS data in the SPC3 chip. This value
must be less than 0xFF or there is a memory overflow problem!
Comm Failure mode is that from the configuration file as is the swapping of
input and output data.
ProSoft Technology, Inc. Page 85 of 128
July 12, 2007
Page 86

4205/5205-TS-104S-PDPS ♦ ProLinx Standalone Diagnostics and Troubleshooting
IEC-60870-5-104 to PDPS Communication Module with Time Stamp
Viewing PROFIBUS Status
Enable State
Indicates the initialized state of the 4205/5205-TS-104S-PDPS module.
0 = Module is not initialized
1 = Module is initialized
Module State
Indicates the current state of the 4205/5205-TS-104S-PDPS module.
0 = Normal Operation
1 = Shutdown
2 = File Transfer
3 = SPC3 ASIC problem
4 = Not in data exchange
Status Register [0]
SPC3 ASIC slave status information provided to the master.
Bit 0
Bit 1
Bit 2
Bit 3
Offline/Passive-Idle
Offline-/Passive-Idle state
0 = SPC3 is in offline
1 = SPC3 in passive idle
FDL_IND_ST (Fieldbus Data link Layer)
FDL indication is temporarily buffered.
0 = No FDL indication is temporarily buffered.
1 = FDL indication is temporarily buffered.
Diag_Flag
Status diagnostics buffer
0 = The DP master fetches the diagnostics buffer.
1 = The DP master has not yet fetched the diagnostics buffer.
RAM Access Violation
Memory access > 1.5kByte
0 = No address violation
1 = For addresses > 1536 bytes, 1024 is subtracted from the current address, and
there is access to this new address.
Page 86 of 128 ProSoft Technology, Inc.
July 12, 2007
Page 87

Diagnostics and Troubleshooting 4205/5205-TS-104S-PDPS ♦ ProLinx Standalone
IEC-60870-5-104 to PDPS Communication Module with Time Stamp
Bits
4,5
Bits
6,7
DP-State
DP-State Machine state
00 = 'Wait_Prm' state
01 = 'Wait_Cfg' state
10 = 'DATA_EX' state
11 = Not possible
WD-State
Watchdog-State-Machine state
00 = 'Baud_Search' state
01 = 'Baud_Control' state
10 = 'DP_Control' state
11 = Not possible
Bit 0
Offline/Passive-idle
0 = SPC3 exits offline and goes to passive-idle. The idle timer and Wd timer
go offline.
1= SPC3 exits offline and goes to passive-idle. The idle timer and Wd timer
are started.
Bit 4, 5
10 = Data Exchange State is Normal. The SPC3 has a correct configuration.
Bits 6, 7
Watchdog Timer
Automatic Baud Rate Identification
The SPC3 is able to identify the baud rate automatically. The "baud search" state
is located after each RESET and also after the watchdog (WD) timer has run out
in the "Baud_Control_state." As a rule, SPC3 begins the search for the set rate
with the highest baud rate. If no SD1 telegram, SD2 telegram, or SD3 telegram
was received completely and without errors during the monitoring time, the
search continues with the next lowest baud rate.
After identifying the correct baud rate, SPC3 switches to the "Baud_Control"
state and monitors the baud rate. The monitoring time can be parameterized
(WD_Baud_Control_Val). The watchdog works with a clock of 100 Hz (10
milliseconds). The watchdog resets each telegram received with no errors to its
own station address. If the timer runs out, SPC3 again switches to the baud
search state.
Further explanation of Status Register [0] – Word 9 Bit states
Bit 0
Offline/Passive-idle
0 = SPC3 exits offline and goes to passive-idle. The idle timer and Wd timer
go offline.
1= SPC3 exits offline and goes to passive-idle. The idle timer and Wd timer
are started.
ProSoft Technology, Inc. Page 87 of 128
July 12, 2007
Page 88

4205/5205-TS-104S-PDPS ♦ ProLinx Standalone Diagnostics and Troubleshooting
IEC-60870-5-104 to PDPS Communication Module with Time Stamp
Bit 4, 5
10 = Data Exchange State is Normal. The SPC3 has a correct configuration.
Bits 6, 7
Watchdog Timer
Automatic Baud Rate Identification
The SPC3 is able to identify the baud rate automatically. The "baud search" state
is located after each RESET and also after the watchdog (WD) timer has run out
in the "Baud_Control_state." As a rule, SPC3 begins the search for the set rate
with the highest baud rate. If no SD1 telegram, SD2 telegram, or SD3 telegram
was received completely and without errors during the monitoring time, the
search continues with the next lowest baud rate.
After identifying the correct baud rate, SPC3 switches to the "Baud_Control"
state and monitors the baud rate. The monitoring time can be parameterized
(WD_Baud_Control_Val). The watchdog works with a clock of 100 Hz (10
milliseconds). The watchdog resets each telegram received with no errors to its
own station address. If the timer runs out, SPC3 again switches to the baud
search state.
Baud Rate Monitoring
The located baud rate is constantly monitored in 'Baud_Control.' The watchdog is
reset for each error-free telegram to its own station address. The monitoring time
results from multiplying both 'WD_Baud_Control_Val' (user sets the parameters)
by the time base (10 ms). If the monitoring time runs out, WD_SM again goes to
'Baud_Search'. If the user carries out the DP protocol (DP_Mode = 1, see Mode
register 0) with SPC3, the watchdog is used for the "DP_Control' state, after a
'Set_Param telegram' was received with an enabled response time monitoring
'WD_On = 1.' The watchdog timer remains in the baud rate monitoring state
when there is a switched off 'WD_On = 0' master monitoring. The PROFIBUS DP
state machine is also not reset when the timer runs out. That is, the slave
remains in the DATA_Exchange state, for example.
Response Time Monitoring
The 'DP_Control' state serves response time monitoring of the DP master
(Master_Add). The set monitoring times results from multiplying both watchdog
factors and multiplying the result with the momentarily valid time base (1 ms or
10 ms):
TWD = (1 ms or 10 ms) * WD_Fact_1 * WD_Fact_2 (See byte 7 of the
parameter setting telegram.)
The user can load the two watchdog factors (WD_Fact_1, and WD_Fact_2) and
the time base that represents a measurement for the monitoring time via the
'Set_Param telegram' with any value between 1 and 255.
EXCEPTION: The WD_Fact_1=WD_Fact_2=1 setting is not permissible. The
circuit does not check this setting.
Monitoring times between 2 ms and 650 s - independent of the baud rate - can
be implemented with the permissible watchdog factors. If the monitoring time
runs out, the SPC3 goes again to 'Baud_Control,' and the SPC3 generates the
Page 88 of 128 ProSoft Technology, Inc.
July 12, 2007
Page 89

Diagnostics and Troubleshooting 4205/5205-TS-104S-PDPS ♦ ProLinx Standalone
IEC-60870-5-104 to PDPS Communication Module with Time Stamp
'WD_DP_Control_Timeout-Interrupt'. In addition, the DP_State machine is reset,
that is, generates the reset states of the buffer management.
If another master accepts SPC3, then there is either a switch to 'Baud_Control"
(WD_On = 0), or there is a delay in 'DP_Control' (WD_On = 1), depending on the
enabled response time monitoring (WD_On = 0).
Status Register [1]
SPC3 ASIC slave status information provided to the master.
Bits
0 - 3
Bits
4 - 7
Baud rate:
The baud rates SPC3 found
0000 = 12 MBaud
0001 = 6 MBaud
0010 = 3 MBaud
0011 = 1.5 MBaud
0100 = 500 kBaud
0101 = 187.5 kBaud
0110 = 93.75 kBaud
0111 = 45.45 kBaud
1000 = 19.2 kBaud
1001 = 9.6 kBaud
Rest = Not possible
SPC3-Release:
Release no. for SPC3
0000 = Release 0
Rest = Not possible
Diagnostic State
0 = Normal Operation or not in data exchange with Status Register [0] Bit
0x20 set.
1 = Not in data exchange state with the Status Register [0] bit 0x20 not set or
normal operation with the Status Register [0] bit 0x20 not set.
3 = Not in a defined state or in module state 1, 2 or 3.
4 = Normal operation with Status Register [0] bit 0x20 set
PROFIBUS Input Counter
Input counter is incremented each time the input data is updated.
PROFIBUS Output Counter
Output counter is incremented each time the output data is updated.
ProSoft Technology, Inc. Page 89 of 128
July 12, 2007
Page 90

4205/5205-TS-104S-PDPS ♦ ProLinx Standalone Diagnostics and Troubleshooting
IEC-60870-5-104 to PDPS Communication Module with Time Stamp
Last Global Command
The value of the last global command code received from the master.
Bit Designation Significance
0 Reserved
1 Clear_Data
2 Unfreeze With 'Unfreeze' - freezing input data is cancelled.
3 Freeze
4 Unsync The 'Unsync' command cancels the 'Sync' command.
5 Sync
6,7 Reserved
With this command the ASCI output data is deleted in data
transfer buffer and is changed to next transfer data buffer
contents.
The ASCI input data is fetched from next transfer buffer to data
transfer buffer and frozen. New input data is not fetched again
until the master sends the next 'Freeze' command.
The ASCI output data transferred with a WRITE_READ_DATA
telegram is changed from data transfer buffer next state buffer.
The following transferred output data is kept in data transfer buffer
until the next 'Sync' command is given.
The Reserved designation specifies that these bits are reserved
for future function expansions.
Page 90 of 128 ProSoft Technology, Inc.
July 12, 2007
Page 91

Reference 4205/5205-TS-104S-PDPS ♦ ProLinx Standalone
IEC-60870-5-104 to PDPS Communication Module with Time Stamp
4 Reference
In This Chapter
Product Specifications............................................................ 91
GSD File: prlx05a5.gsd .......................................................... 96
Slave Error and Status Data .................................................. 99
LED Indicators...................................................................... 101
Command Qualifiers ............................................................102
Parameter Qualifiers ............................................................ 102
Design Forms....................................................................... 103
IEC 60870-5-104 Server Interoperability Document............. 107
4.1 Product Specifications
4.1.1 General Specifications
The ProLinx Communication Modules provide connectivity for two or more
dissimilar network types. The modules, encased in sturdy extruded aluminum,
are stand-alone DIN-rail mounted protocol gateways, providing communication
between many of the most widely used protocols in industrial automation today.
4.1.2 Internal Database
The ProLinx module contains an internal database that consists of areas for
application data, status information, and configuration information.
The internal database is shared between all ports on the module and is used as
a conduit to pass information from a device on one network to one or more
devices on another network.
Application Data Area
The data area stores and retrieve data by the protocol drivers and for data
exchange between protocols. The database is used as a source for write
commands to remote devices and holds data collected from the remote devices.
Commands defined in the configuration file (stored in the configuration data area)
control how the data is to be handled in the database.
ProSoft Technology, Inc. Page 91 of 128
July 12, 2007
Page 92

4205/5205-TS-104S-PDPS ♦ ProLinx Standalone Reference
IEC-60870-5-104 to PDPS Communication Module with Time Stamp
Status Data Area
This area stores error codes, counters, and port status information for each port.
Configuration File
This file contains module configuration information such as port configuration,
network information, and command configuration. This configuration file is
transferred to or from the module.
Optional Web Server for Ethernet Solutions
An HTML server is available for Ethernet ProLinx modules. With this option,
HTML text pages can be enabled to:
Display module internal register and status values
Accept user data input values via POST commands for setpoint, on/off
control, etc.
Provide limited graphic file support
Type Specifications
HTML Server (See note below) Key features of the HTML server include:
Max HTML page size: 1MB
Max File Storage: 32MB
Supported context types: jpeg, bmp, css
Supported data types: bit, ASCII, integer, float
Sockets: Up to five connections. Note that this limits the number of simultaneous
graphic file and frame references per HTML page
FTP Server Permits remote HTML file transfer between the module and remote host.
Capabilities of the FTP Server include:
Single socket connection
Non-passive transfers only
WS_FTP or Command Line FTP recommended
CuteFTP, Internet Explorer, Netscape, or NCFTP all support multiple socket
connections and therefore are not supported by the ProLinx module
Email Client E-mail message generation based on database trigger values. Messages can
contain dynamic data from the module
Important Note: The Web Server is not designed to act like, or replace, the
powerful web servers available in the marketplace today. Please check
application specifics with Technical Support if you are unsure if your
application will work with the ProLinx Web Server.
4.1.3 Hardware Specifications
Specification Description
Power Supply 24 VDC nominal
18 to 32 VDC allowed
Positive, Negative, GND Terminals
2.5 mm screwdriver blade
Current Load 500 mA max@ 32 VDC max
Operating Temperature –20 to 50°C (–4 to 122°F)
Storage Temperature –40 to 85°C (–40 to 185°F)
Relative Humidity 5% to 95% (non-condensing)
Page 92 of 128 ProSoft Technology, Inc.
July 12, 2007
Page 93

Reference 4205/5205-TS-104S-PDPS ♦ ProLinx Standalone
IEC-60870-5-104 to PDPS Communication Module with Time Stamp
Specification Description
Dimensions Standard: 5.20H x 2.07W x 4.52D in. (13.2cmH x 5.25cmW x 11.48cmD)
Extended: 5.20H x 2.73W x 4.52D in. (13.2cmH x 6.934cmW x 11.48cmD)
LED Indicators Power and Module Status
Application Status
Serial Port Activity LED
Serial Activity and Error LED Status
Configuration Serial Port DB-9M RS-232 only
No hardware handshaking
Ethernet Port (Ethernet modules
only)
Application Serial Ports RS-232/422/485
Serial Port Isolation 2500V RMS port signal isolation per UL 1577
Shipped with Each Unit Mini-DIN to DB-9M serial cables
RJ45 Connector
Link and Activity LED indicators
RS-232 handshaking configurable
RS-422/485 screw termination included
3000V DC min. port to ground and port to logic power isolation
4 ft RS-232 configuration cable
2.5mm screwdriver
CD (docs and Configuration utility)
RS-422/485 DB-9 to Screw Terminal Adaptor (1 or 4, depending on ports)
4.1.4 Port Physical and Protocol Specifications
104 Slave Port Specifications
The 104S module acts as a gateway between the IEC-870-5-104, other protocols
and networks, as well as several proprietary interfaces. A 4000-word register
space in the module exchanges data between the two protocols.
General specifications include:
Support for the storage and transfer of up to 4000 registers between
protocols
User-definable module memory usage
Storage of IEC time used in module is available in the database
Configuration via a user-generated text file (downloadable to the module)
Protocol implementation conforms to the IEC-870-5-104 specification with
fully configurable parameters
Priority Queues
Invalid Bit Monitoring
Supports Redundant Connection
Driver Protocol Specifications
General Parameters
Internal Database 4000 registers (words) available
Communication parameters Port 0: Baud Rate = 110 to 38.4K baud
Port 1,2,3: Baud Rate = 110 to 115K baud
Stop Bits: 1 or 2
Data Size: 5 or 8 bits
Parity: None, Even, Odd
RTS Timing Delays: 0 to 65535 milliseconds
ProSoft Technology, Inc. Page 93 of 128
July 12, 2007
Page 94

4205/5205-TS-104S-PDPS ♦ ProLinx Standalone Reference
IEC-60870-5-104 to PDPS Communication Module with Time Stamp
IEC 60870-5-104 Slave
Configurable Parameters
Status Data Status data is returned in a block of counter values allowing communications to
be effectively debugged.
Conformance Specifications
See IEC 60870-5-104 Server Interoperability Document (page 107)
Slave Functional Specifications
The 104S module accepts commands from an attached master unit on the
network and generates unsolicited messages. These last sets of messages are
either spontaneous or cyclic. Data transferred to the host is derived from the
module's internal database. The remote master device can control data in the
database and hence the devices connected using the other protocol in the
module using standard control messages supported in the protocol. The remote
master device uses the fully-configured databases in the module to control
outputs and monitor inputs.
PROFIBUS Slave Port Specifications
Type Specifications
General Parameters
Internal Database Up to 4000 registers (words) available.
GSD File Downloadable from ProSoft-Technology.com web site
PROFIBUS Slave
Communication parameters Baud Rate: 9.6 kbps to 12 Mbps
Supported I/O length 122 words Input data
122 words Output data
200 words max
Supported PROFIBUS DP
features
Configurable Parameters a) PROFIBUS Node Address: 0 to 125
Status Data Error codes available on an individual command basis. In addition, a slave status
Physical Connection
PROFIBUS Connector Standard PROFIBUS DB-9F communication connector. Cable connection
Freeze Mode
Sync Mode
Auto Baud Setting
b) Data byte swapping
c) Action on loss of PROFIBUS connection
d) Comm Fail Timeout Multiplier
e) Status Data location in Internal Database
list is maintained per active PROFIBUS Slave port.
matches PROFIBUS pin out specification.
Important Note: The slave node address is set to 126 by default in the module
configuration file (See Section 3 of this manual). The default node address
must be changed to a valid address between 0 to 125 by the user for the slave
to function on the PROFIBUS network.
Page 94 of 128 ProSoft Technology, Inc.
July 12, 2007
Page 95

Reference 4205/5205-TS-104S-PDPS ♦ ProLinx Standalone
IEC-60870-5-104 to PDPS Communication Module with Time Stamp
Serial Port Specifications
Type Specifications
Serial Ports
Serial Port Cables
(DB-9M Connector)
Config Port DB-9M connector
Serial Port Isolation 2500V RMS port-to-port isolation per
Serial Port Protection RS-485/422 port interface lines TVS diode protected at +/- 27V standoff voltage.
One DIN to DB-9M cable included per configurable serial port
UL 1577.
3000V DC min. port to ground and port to logic power isolation.
RS-232 port interface lines fault protected to +/- 36V power on, +/- 40V power off.
Note: On single serial port ProLinx modules, the serial port data is not
buffered. Packets go directly to and from the serial chip set to the processor.
This has the potential to cause the serial communications to start becoming
erratic above baud rates of 38,400 baud.
ProLinx modules with 4 serial ports have a separate serial interface board for
the additional 3 serial ports. These serial ports are buffered, and can handle
communications up to 115,200 baud.
4.1.5 SNTP Support
SNTP is used for time synchronization of produced and consumed commands.
When an exchange occurs the driver compares time stamps from the previous
exchange. When the new exchange time is less than the previous exchange, the
exchange is ignored. This can occur when the Ethernet packets are routed and
delayed. Time synchronization provides for data integrity. The following table lists
the parameters defined in this section:
The SNTP driver will compute a new clock value every 5 minutes using the
average value of 10 samples each collected over an approximate 6-second
period. This new value will be used to adjust the clock maintained by the SNTP
driver and used by the application. If a valid database register is specified, the
driver will place the time value into the module's database. The first two registers
will contain the number of seconds and the next two registers will contain the
number of microseconds since January 1, 1970.
A list of some of the common NTP servers can be obtained at
http://www.ntp.org/
the appropriate IP address. Other server lists can be found on the Internet by
searching on "NTP Servers" with your browser.
SNTP Status Data
The status data for the SNTP driver is located at the virtual database addresses
shown in the following table, The data area is initialized with zeros whenever the
module is initialized. This occurs during a cold-start (power-on), reset (reset
push-button pressed) or warm-boot operation (commanded or loading of new
configuration).
, http://www.eecis.udel.edu/~mills/ntp/servers.html, along with
ProSoft Technology, Inc. Page 95 of 128
July 12, 2007
Page 96

4205/5205-TS-104S-PDPS ♦ ProLinx Standalone Reference
IEC-60870-5-104 to PDPS Communication Module with Time Stamp
SNTP Client Status
4030 Time is valid
4031 Request count
4032 Response count
4033 Computation count
4034 Clock set count
4035 Timeout error count
The module's data mapping feature can be utilized to move this data into the
module's database area. This way the data can be made available to all drivers
on the module for use on any of the connected networks. If it is not mapped into
the module's database, the data will only be available through the
Configuration/Debug Port.
The Time is valid status register will be set to 1 if the SNTP time is valid. If the
time is not valid, the register will be set to 0. All the other registers are counters
used to determine the functionality of the driver. This version of the driver
supports SNTP Revision 3 and stratum between 1 and 14.
4.2 GSD File: prlx05a5.gsd
;============================================================
; Profibus Device Database of:
; ProLinx Communication Gateways, Inc.
; Model: ProLinx Profibus Slave
; Description: Profibus DP Slave
; Language: English
; Date: 01.16.2006
; Author: ProLinx Communication Gateways, Inc.
; Rev Date Description
; A 01/16/06 Max_Output_Len and Max_Input_Len increased to 244
;============================================================
#Profibus_DP
GSD_Revision = 2
;These are text strings associated with each parameter
;This application only uses one parameter byte required
;by the SPC3 ASIC.
ExtUserPrmData=0 "SPC3 User Prm Byte" ;
Unsigned8 0 0-7
EndExtUserPrmData
; Device identification
Vendor_Name="ProLinx Comm Gateways Inc."
Model_Name = "ProLinx Profibus Slave"
Revision = "Version 1.00"
Ident_Number = 0x05A5
Protocol_Ident = 0 ; DP protocol
Station_Type = 0 ; Slave device
FMS_supp = 0 ; FMS not supported
Hardware_Release = "Rev. 1.00"
Software_Release = "Rev. 1.00"
; Supported baudrates
Page 96 of 128 ProSoft Technology, Inc.
July 12, 2007
Page 97

Reference 4205/5205-TS-104S-PDPS ♦ ProLinx Standalone
IEC-60870-5-104 to PDPS Communication Module with Time Stamp
9.6_supp = 1
19.2_supp = 1
45.45_supp = 1
93.75_supp = 1
187.5_supp = 1
500_supp = 1
1.5M_supp = 1
3M_supp=1
6M_supp=1
12M_supp=1
; Maximum responder time for supported baudrates
MaxTsdr_9.6 = 60
MaxTsdr_19.2 = 60
MaxTsdr_45.45 = 250
MaxTsdr_93.75 = 60
MaxTsdr_187.5 = 60
MaxTsdr_500 = 100
MaxTsdr_1.5M = 150
MaxTsdr_3M = 250
MaxTsdr_6M = 450
MaxTsdr_12M = 800
; Supported hardware features
Redundancy = 0 ; not supported
Repeater_Ctrl_Sig = 2 ; TTL
24V_Pins = 0 ; not connected
Implementation_Type = "SPC3"
; Supported DP features
Freeze_Mode_supp = 1 ; supported
Sync_Mode_supp = 1 ; supported
Auto_Baud_supp = 1 ; supported
Set_Slave_Add_supp = 0 ; not supported
;
;--Slave specific data----Bitmap_Device = "ProLnx_R"
Bitmap_Diag = "ProLnx_D"
Bitmap_SF = "ProLnx_S"
; Default Length of User Parameter
User_Prm_Data_Len = 1
; Default User Parameter string:
User_Prm_Data = 0x00
Ext_User_Prm_Data_Const(0)= 0x00
Ext_User_Prm_Data_Ref(0)=0
; Maximum polling frequency
Min_Slave_Intervall = 1 ;100 µs
; Maximum supported sizes
Modular_Station = 1 ; modular
Max_Module = 14 ; logical modules emulated on the card
Max_Input_Len = 244
Max_Output_Len = 244
Max_Data_Len = 400
ProSoft Technology, Inc. Page 97 of 128
July 12, 2007
Page 98

4205/5205-TS-104S-PDPS ♦ ProLinx Standalone Reference
IEC-60870-5-104 to PDPS Communication Module with Time Stamp
Modul_Offset=0
Slave_Family=9
Max_Diag_Data_Len = 20
;Refer to the ProSoft Profibus Slave documentation for a complete discussion of
;the extended diagnostic data.
;
; Module byte-organised send data
;
Module = "Empty Slot" 0x00
EndModule
;
; Module word size send data
;
Module = "1 Word Input" 0x50
EndModule
Module = "2 Words Input" 0x51
EndModule
Module = "3 Words Input" 0x52
EndModule
Module = "4 Words Input" 0x53
EndModule
Module = "5 Words Input" 0x54
EndModule
Module = "6 Words Input" 0x55
EndModule
Module = "7 Words Input" 0x56
EndModule
Module = "8 Words Input" 0x57
EndModule
Module = "9 Words Input" 0x58
EndModule
Module = "10 Words Input" 0x59
EndModule
Module = "11 Words Input" 0x5A
EndModule
Module = "12 Words Input" 0x5B
EndModule
Module = "13 Words Input" 0x5C
EndModule
Module = "14 Words Input" 0x5D
EndModule
Module = "15 Words Input" 0x5E
EndModule
Module = "16 Words Input" 0x5F
EndModule
;
; Module word size receive data
;
Module = "1 Word Output" 0x60
EndModule
Module = "2 Words Output" 0x61
EndModule
Module = "3 Words Output" 0x62
Page 98 of 128 ProSoft Technology, Inc.
July 12, 2007
Page 99

Reference 4205/5205-TS-104S-PDPS ♦ ProLinx Standalone
IEC-60870-5-104 to PDPS Communication Module with Time Stamp
EndModule
Module = "4 Words Output" 0x63
EndModule
Module = "5 Words Output" 0x64
EndModule
Module = "6 Words Output" 0x65
EndModule
Module = "7 Words Output" 0x66
EndModule
Module = "8 Words Output" 0x67
EndModule
Module = "9 Words Output" 0x68
EndModule
Module = "10 Words Output" 0x69
EndModule
Module = "11 Words Output" 0x6A
EndModule
Module = "12 Words Output" 0x6B
EndModule
Module = "13 Words Output" 0x6C
EndModule
Module = "14 Words Output" 0x6D
EndModule
Module = "15 Words Output" 0x6E
EndModule
Module = "16 Words Output" 0x6F
EndModule
4.3 Slave Error and Status Data
The 104S Driver Error and Status Data areas are discussed in this section. This
data represents a collection of status, diagnostic and troubleshooting registers
which may prove helpful in troubleshooting the 104S network and port operation.
The data map functionality of the module must be utilized in order to map this
data into the normal module database region (0 to 3999). All or any portion of the
data can be moved using this facility.
The data area is initialized with zeros whenever the module is initialized. This
occurs during a cold-start (power-on), reset (reset push-button pressed) or a
warm-boot operation (commanded or loading of new configuration).
4.3.1 General Communication Status and Client 0 Status
Status Register Name Description
10200 t0 Timeout Count
10201 t1 Timeout Count
10202 t2 Timeout Count
10203 t3 Timeout Count
This word contains the number of t0 errors
recognized by the module.
This word contains the number of t1 errors
recognized by the module.
This word contains the number of t2 errors
recognized by the module.
This word contains the number of t3 errors
recognized by the module.
ProSoft Technology, Inc. Page 99 of 128
July 12, 2007
Page 100

4205/5205-TS-104S-PDPS ♦ ProLinx Standalone Reference
IEC-60870-5-104 to PDPS Communication Module with Time Stamp
Status Register Name Description
10204 Sequence Error Count
10205 Bad Address Error Count
10206 Length Error Count
10207 Receive Frame Count
10208 Transmit Frame Count
10209
Socket State Value
(socket 0)
10210
Socket Open Count
(socket 0)
10211
Socket Close Count
(socket 0)
10212
Socket Connect Count
(socket 0)
10213
…
10222
Host IP Address
(socket 0)
This word contains the number of sequence errors
recognized by the module. When the send
sequence number received by the module does not
match the expected sequence number, the
connection is closed and this counter is
incremented.
This word contains the number of messages
received from the remote host that do not contain a
valid common ASDU address in the packet.
This word contains the number of messages
received from the remote host that do not have a
valid length field.
This word contains the number of message frames
(not packets) received from the host. A packet may
contain more than one message.
This word contains the number of message frames
sent to the host from the unit.
This word contains the current socket state as
follows:
-1 = Open Socket
0 = Wait for connection
1 = Transmit message if ready
2 = Receive packet and process message
3 = Process multiple messages in packet
50 = Send TestFr Act
51 = Wait for TestFr Con
60 = Send sequence (S-Format) message
1000 = Close Socket
1001 = Wait for socket to close
This word contains the number of times the socket
listen function executed.
This word contains the number of times an active
close function executed.
This word contains the number of times a
connection was established with the remote host
unit.
IP address of the client connected to the server.
Page 100 of 128 ProSoft Technology, Inc.
July 12, 2007
 Loading...