

Page 1

MapInfo™ Stratus
Version 42
MapInfo Stratus User's Guide
Page 2

Page 3

Contents
Chapter 1: Getting Started..................................................................................5
Overview................................................................................................................6
Browser Requirement...........................................................................................6
Version Number and Build Number.....................................................................7
Signing In and Out ................................................................................................7
Chapter 2: Learn the Basics...............................................................................9
Views....................................................................................................................10
Maps.....................................................................................................................10
Toolbar Features..................................................................................................11
Tooltips.................................................................................................................12
Navigating in the Map.........................................................................................13
Switching Base Maps..........................................................................................15
Map Legend ........................................................................................................15
Status Bar............................................................................................................16
Getting Help.........................................................................................................16
Annotation Toolbar......................................................................................11
Measuring Toolbar......................................................................................12
Zooming In and Out....................................................................................13
Copy X-Y and Longitude and Latitude Values............................................13
Changing Map Center................................................................................14
Moving around the Map..............................................................................14
Using the Keyboard Keys ..........................................................................14
Chapter 3: Search and Query Builder.............................................................19
Search for an Address........................................................................................20
Searching ZIP Code, Placename or Address.............................................20
Using Wildcards when Searching ..............................................................20
More Search Options .................................................................................21
Recently Selected Addresses.....................................................................21
Find my Nearest .................................................................................................22
Finding more Information about Nearby Services .....................................23
Search Results ...................................................................................................23
Query Builder.......................................................................................................23
Page 4

Building a Query.........................................................................................24
Query Results View....................................................................................25
Chapter 4: Thematic Mapping..........................................................................27
What is a Thematic Map?...................................................................................28
What is a Thematic Layer?.........................................................................28
What is a Range Thematic Map?...............................................................28
Creating a Thematic Map....................................................................................28
Chapter 5: Working with Annotations............................................................31
Annotations.........................................................................................................32
Draw a Shape Annotations.........................................................................32
Draw Line...................................................................................................34
Draw Point..................................................................................................34
Text Annotation ..........................................................................................34
Pick from Map ............................................................................................35
Annotation Manager ..................................................................................36
Measuring Distance and Area ...........................................................................39
Navigate in the Map ...................................................................................39
Measuring Distance ...................................................................................39
Measuring an Area.....................................................................................40
Clearing the Feature...................................................................................40
Chapter 6: Printing Maps..................................................................................41
Print Preview........................................................................................................42
Print to Scale.......................................................................................................43
Print Map to PDF.................................................................................................43
Chapter 7: Linking Maps...................................................................................45
Copying Map Link...............................................................................................46
Chapter 8: Support............................................................................................47
Frequently Asked Questions..............................................................................48
MapInfo™Stratus 424
Page 5

Getting Started
Welcome to MapInfo Stratus Help. To get started, refer to the following help topics:
In this section:
• Overview . . . . . . . . . . . . . . . . . . . . . . . . . . . . . . . . . . . . . . . .6
• Browser Requirement . . . . . . . . . . . . . . . . . . . . . . . . . . . . . .6
• Version Number and Build Number . . . . . . . . . . . . . . . . . .7
• Signing In and Out . . . . . . . . . . . . . . . . . . . . . . . . . . . . . . . .7
1
Page 6
Overview
Overview
The MapInfo Stratus is an interactive mapping service provided by Pitney Bowes Software. It provides
access to mapping and geographic-based information, addresses and postcode searches.
Figure 1: MapInfo Stratus Overview
It also allows you to:
• Browse current maps and data
• Switch between different background maps such as aerial maps and road maps
• Zoom in and zoom out of maps
• Search and find addresses and postcodes
• Add more information to your map (overlays)
• Get information about what's on the map by clicking the map
• Search for what services and facilities are nearby to an address
• Search for data within the current map or in a shape you draw
• Search for data using various criteria
• Measure areas and distances
• Draw annotations on the map
• Print maps to a PDF file
• Create a link to launch the map later at the same location
• Retain X, Y, View and Zoom on switching Map Config, if the projections are same.
The system presents map detail appropriate to the level of zoom.
Browser Requirement
The MapInfo Stratus supports following browsers:
MapInfo™Stratus 426
Page 7

• Microsoft Internet Explorer 8.0, 9.0 10 and 11.
• Mozilla Firefox 33.0
• Safari 7.0.5 on Mac
• Google Chrome 38.
• iPad (Admin Console is not supported in iPad)
Chapter 1: Getting Started
Note:
Internet Explorer 6 and 7 are not supported. Older versions of Firefox, Safari and Chrome are
supported.
Version Number and Build Number
The MapInfo Stratus displays version number along with build number at the bottom of the page. However,
it is not available all the time. You need to append "?getVersion=true" at the end of the MapInfo
Stratus URL.
Signing In and Out
Signing In to MapInfo Stratus
MapInfo Stratus allows you to login with your user name and password. To Sign-in to your account:
1. In the Map toolbar, click on Sign-in icon. The Sign-in page appears.
2. Fill in your account information.
User name and password are case sensitive.Note:
3. Click Submit button. The MapInfo Stratus application appears with your credentials.
Signing Out from MapInfo Stratus
To Sign-out from your account:
1. In the Map toolbar, click on Sign-out icon.
2. You have successfully signed out. Click on MapInfo Stratus Home Page to retun to the map view.
Note:
In case you don't have login information then please contact your Administrator to get login
credentials.
7MapInfo Stratus User's Guide
Page 8

Page 9

Learn the Basics
The following topics provide help on individuaMapInfo Stratus features:
In this section:
• Views . . . . . . . . . . . . . . . . . . . . . . . . . . . . . . . . . . . . . . . . . .10
• Maps . . . . . . . . . . . . . . . . . . . . . . . . . . . . . . . . . . . . . . . . . . .10
• Toolbar Features . . . . . . . . . . . . . . . . . . . . . . . . . . . . . . . . .11
• Tooltips . . . . . . . . . . . . . . . . . . . . . . . . . . . . . . . . . . . . . . . .12
• Navigating in the Map . . . . . . . . . . . . . . . . . . . . . . . . . . . . .13
• Switching Base Maps . . . . . . . . . . . . . . . . . . . . . . . . . . . . .15
• Map Legend . . . . . . . . . . . . . . . . . . . . . . . . . . . . . . . . . . . .15
• Status Bar . . . . . . . . . . . . . . . . . . . . . . . . . . . . . . . . . . . . . .16
• Getting Help . . . . . . . . . . . . . . . . . . . . . . . . . . . . . . . . . . . . .16
2
Page 10
Views
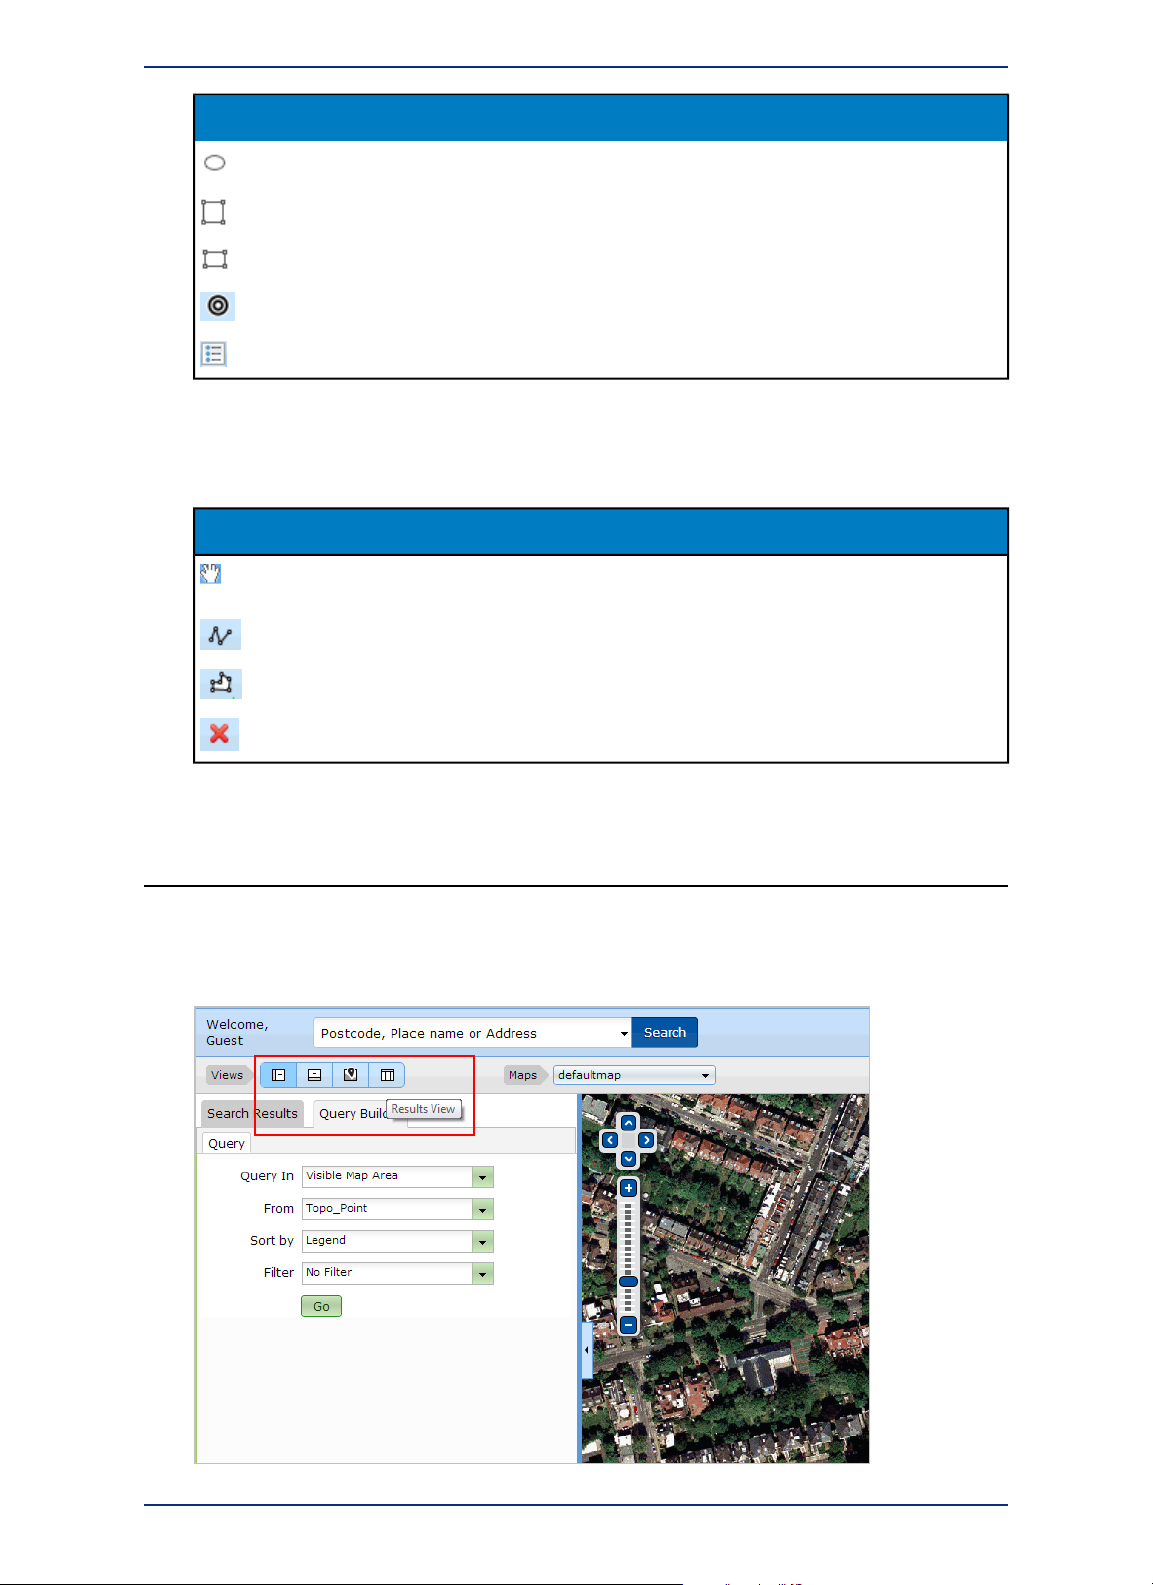
Views
MapInfo Stratus allows you to select various views located at the top left corner of the viewport. You can
select:
DescriptionViewIcon
Vertical View
Horizontal View
Map View
Result View
You can drag the splitter between the results/query panel and map to resize its position.Note:
It shows map and results
vertically. This is the default view.
It shows map and results
horizontally.
It is map only view. The search
and query panel is hidden.
You can click on the
Search\Query view icon on the
left side of the map to display
Search and Query panel.
It is results only view. The map is
hidden.
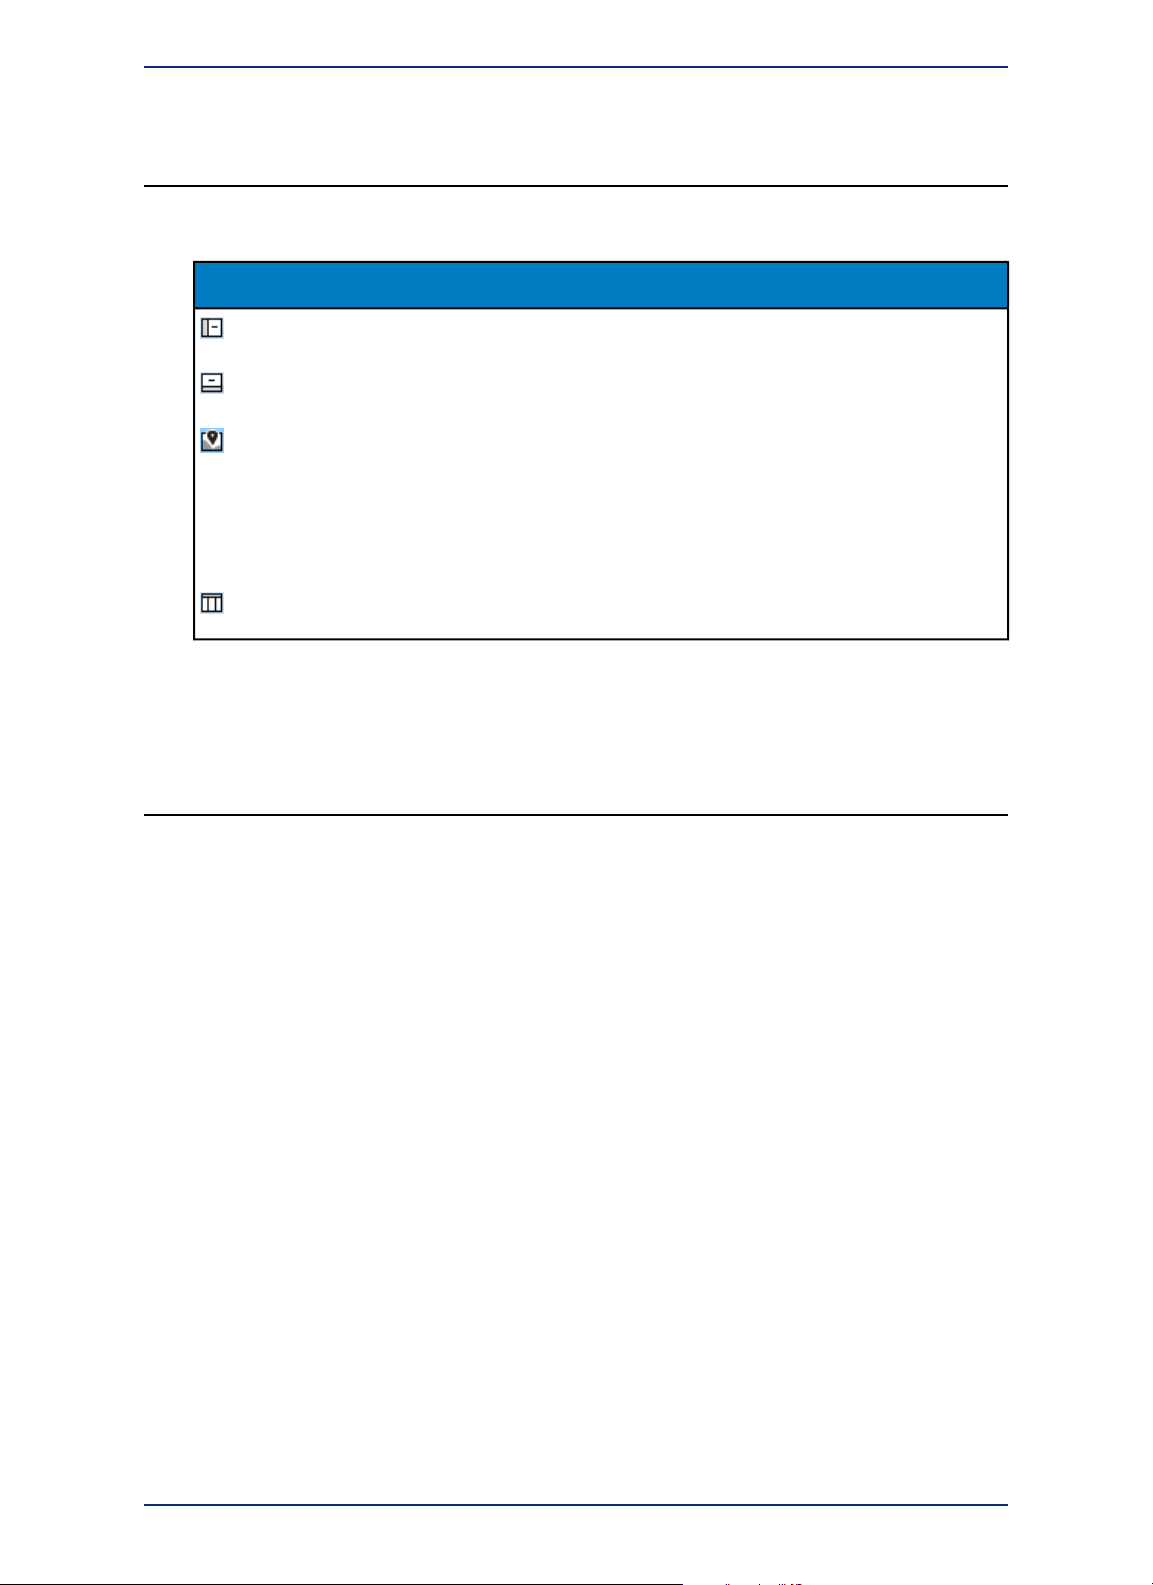
Maps
MapInfo Stratus provides list of available maps at the center of the toolbar. You can select maps from
the Maps drop-down list.
Figure 2: Maps
MapInfo™Stratus 4210
Page 11
Chapter 2: Learn the Basics
Toolbar Features
MapInfo Stratus toolbar is located at the top right corner of the viewport. Based on annotation preferences
selected in the Administration Console, you can use one of the following toolbar at a time:
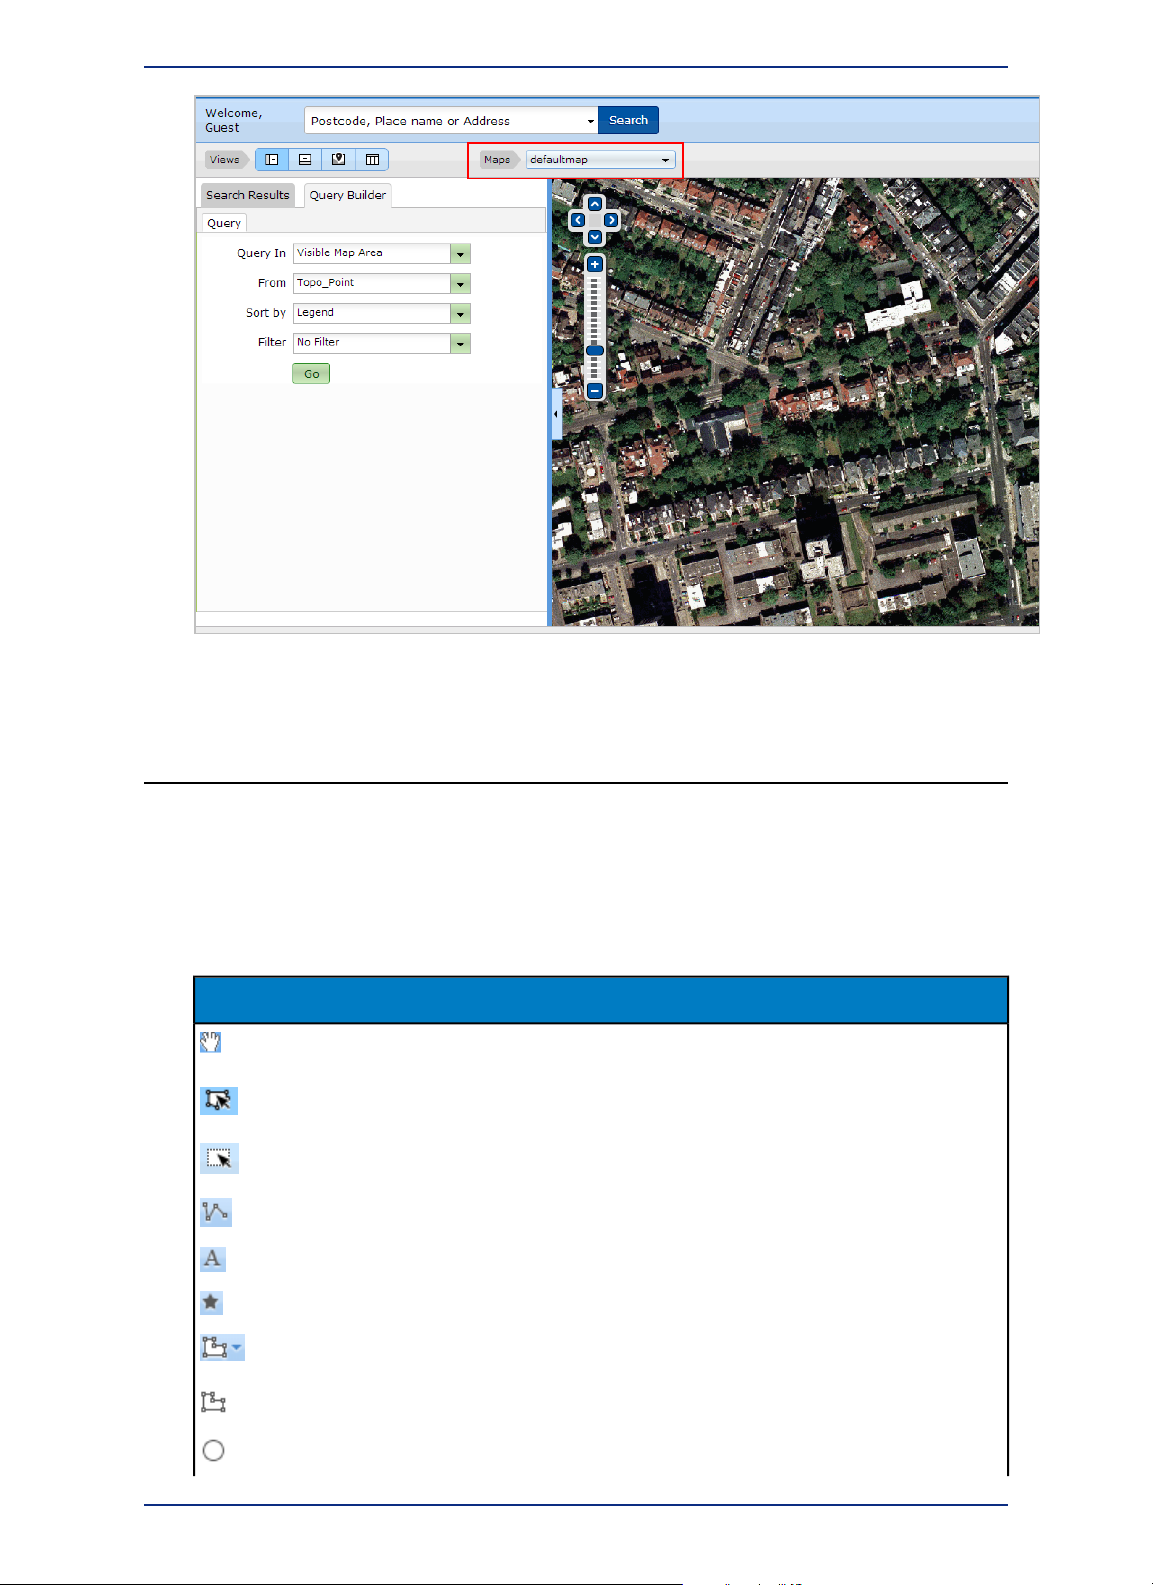
Annotation Toolbar
It displays all annotation tools. The table below lists the feature available in Annotation Toolbar:
DescriptionNameIcons
Navigate Map
Select Annotation Tool
Pick from map
Draw a shape annotation
Navigate Map (pan to move and
click to see info)
Select an annotation to see its
properties
Pick a map feature to add it to
your annotations
Draw a line annotationDraw Line
Enter a text annotationText Annotation
Draw a point annotationDraw Point
Draw a shape annotation (one of
the following)
Draw a PolygonDraw Polygon
Draw a CircleDraw a Circle
11MapInfo Stratus User's Guide
Page 12
Tooltips
DescriptionNameIcons
Draw an EllipseDraw an Ellipse
Draw SquareDraw Square
Draw RectangleDraw Rectangle
Draw Concentric RingDraw Concentric Ring
Manage AnnotationsManage Annotations
Measuring Toolbar
It displays measuring tools. The table below lists the features available in Measuring Toolbar:
DescriptionNameIcons
Navigate Map
Navigate Map (pan to move and
click to see info)
Measure a lineMeasure Line
Measure an areaMeasure Area
Clear annotation featuresClear Feature
Tooltips
MapInfo Stratus tool tips provide additional information about each field. To see a tool tip for an attribute
in the left panel, hover-over the attribute.
Figure 3: Tooltips
MapInfo™Stratus 4212
Page 13
Navigating in the Map
MapInfo Stratus navigation tools help you to explore the map visually.
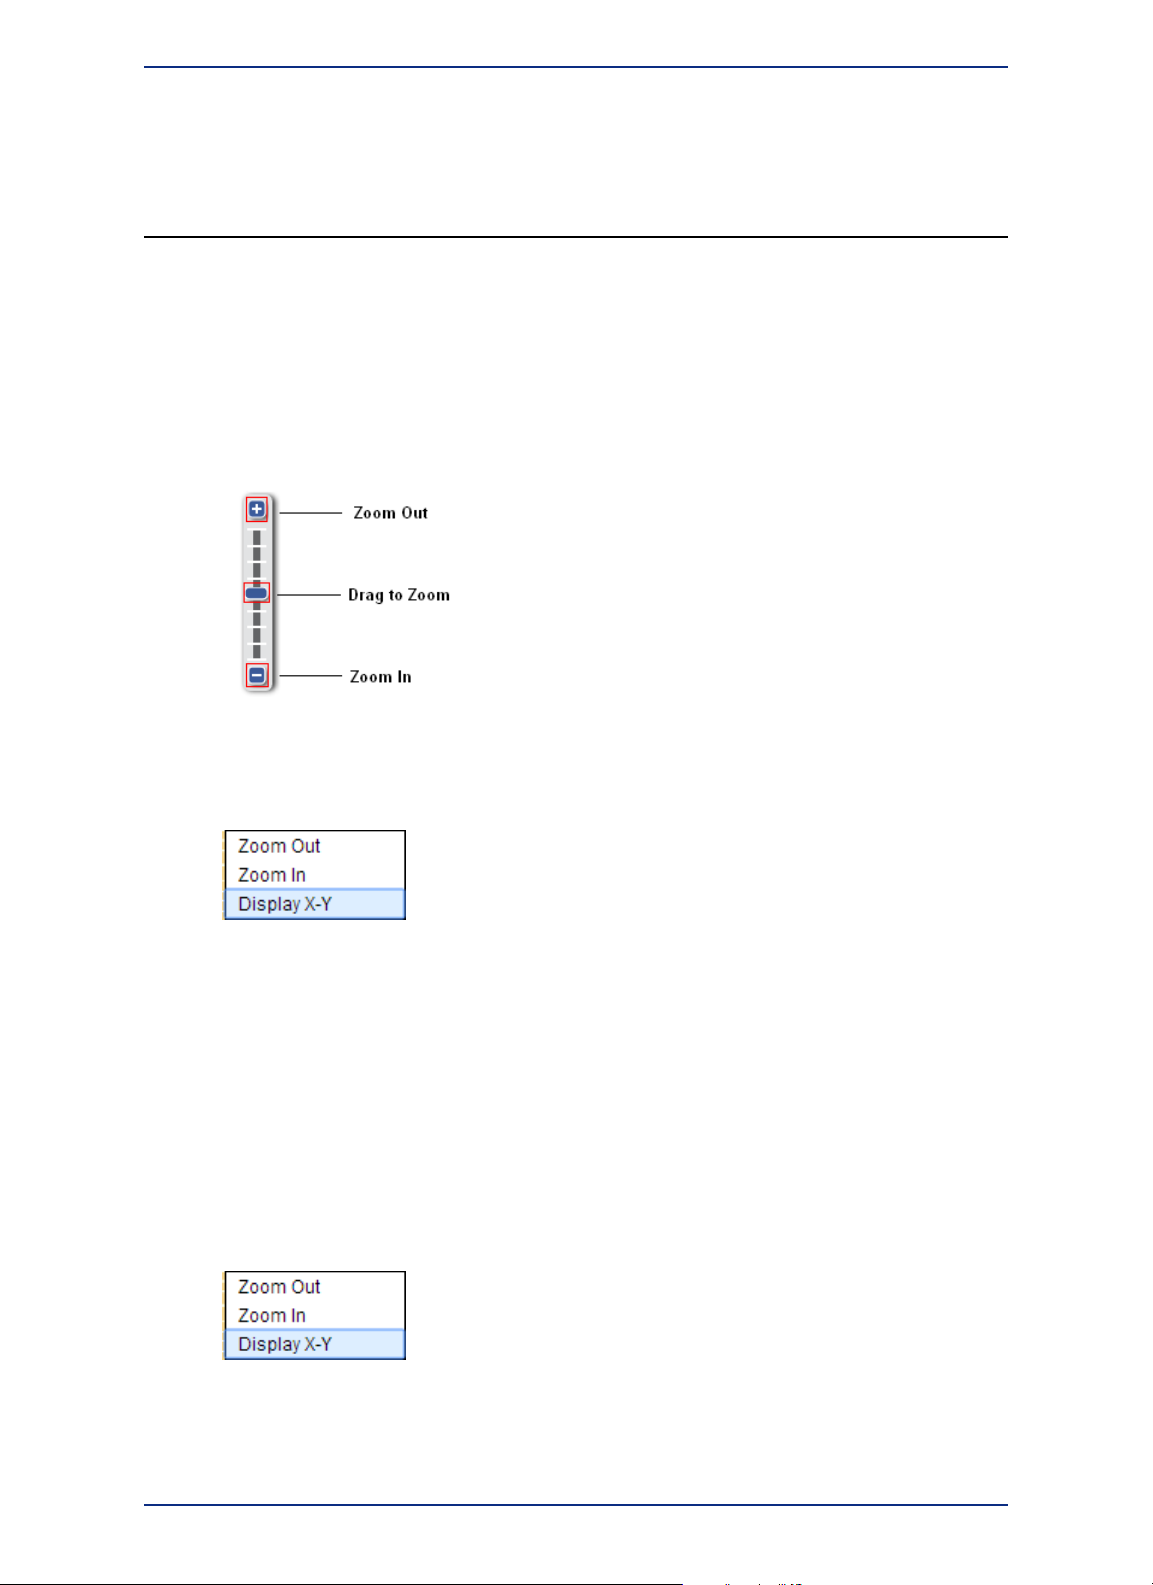
Zooming In and Out
There are numerous ways to zoom in and out of the maps.
1. Click the + or - buttons on the zoom bar.
2. Move the zoom slider up or down the zoom bar.
Chapter 2: Learn the Basics
3. Hold the SHIFT key down your keyboard, then click and drag the cursor to form a rectangle on the
map. The map will then zoom into the specified area.
4. Right click on the map and select Zoom Out or Zoom In from the right click menu.
5. Simply position the cursor on the map and zoom in or out by scrolling the mouse wheel forward or
backwards.
6. When the Navigate Map tool is selected double click the map to zoom in one level.
For more information, refer to Frequently Asked Questions.Note:
Copy X-Y and Longitude and Latitude Values
You can copy X and Y value of the current position to the clipboard in the map.
1. Right click on the map and click on the Display X-Y from the right click menu to copy x-y value to
the clipboard.
The Info dialog box appears with x-y and longitude and latitude values of the current position.
2. Select the values to copy either by right-click menu or ctrl+c keyboard option.
3. Click Ok to close the Info dialog box.
13MapInfo Stratus User's Guide
Page 14
Navigating in the Map
The x-y and Longitude and Latitude values are displayed in all the callouts.Note:
Changing Map Center
It allows you to locate the map to X and Y value that you have provided. You can enter values in longitude
and latitude in addition to the current projection of the map. It also allows you to view your current position
on the map.
To change the Map center x-y value:
1. Click on the Map Center link to open the Map Center dialog box. It displays following options:
DescriptionOption
Current Map Projection
It displays the current map project. For example,
EPSG:3857
XY
Longitude-Latitude
2. Click on the Apply button to change the map center.
3. Click on the Cancel button to discard the changes and close the Map center dialog box.
This option is available on the basis of settings done in Admin Console.Note:
Select XY radio button to modify the value of x and y.
The X and Y text boxes displays current values of X and Y initially.
Select Longitude/Latitude radio button if your input values are longitude
and latitudes in decimal degree.
Click on the Locate Me icon to see your current position on map.
This features is not supported by IE8.Note:
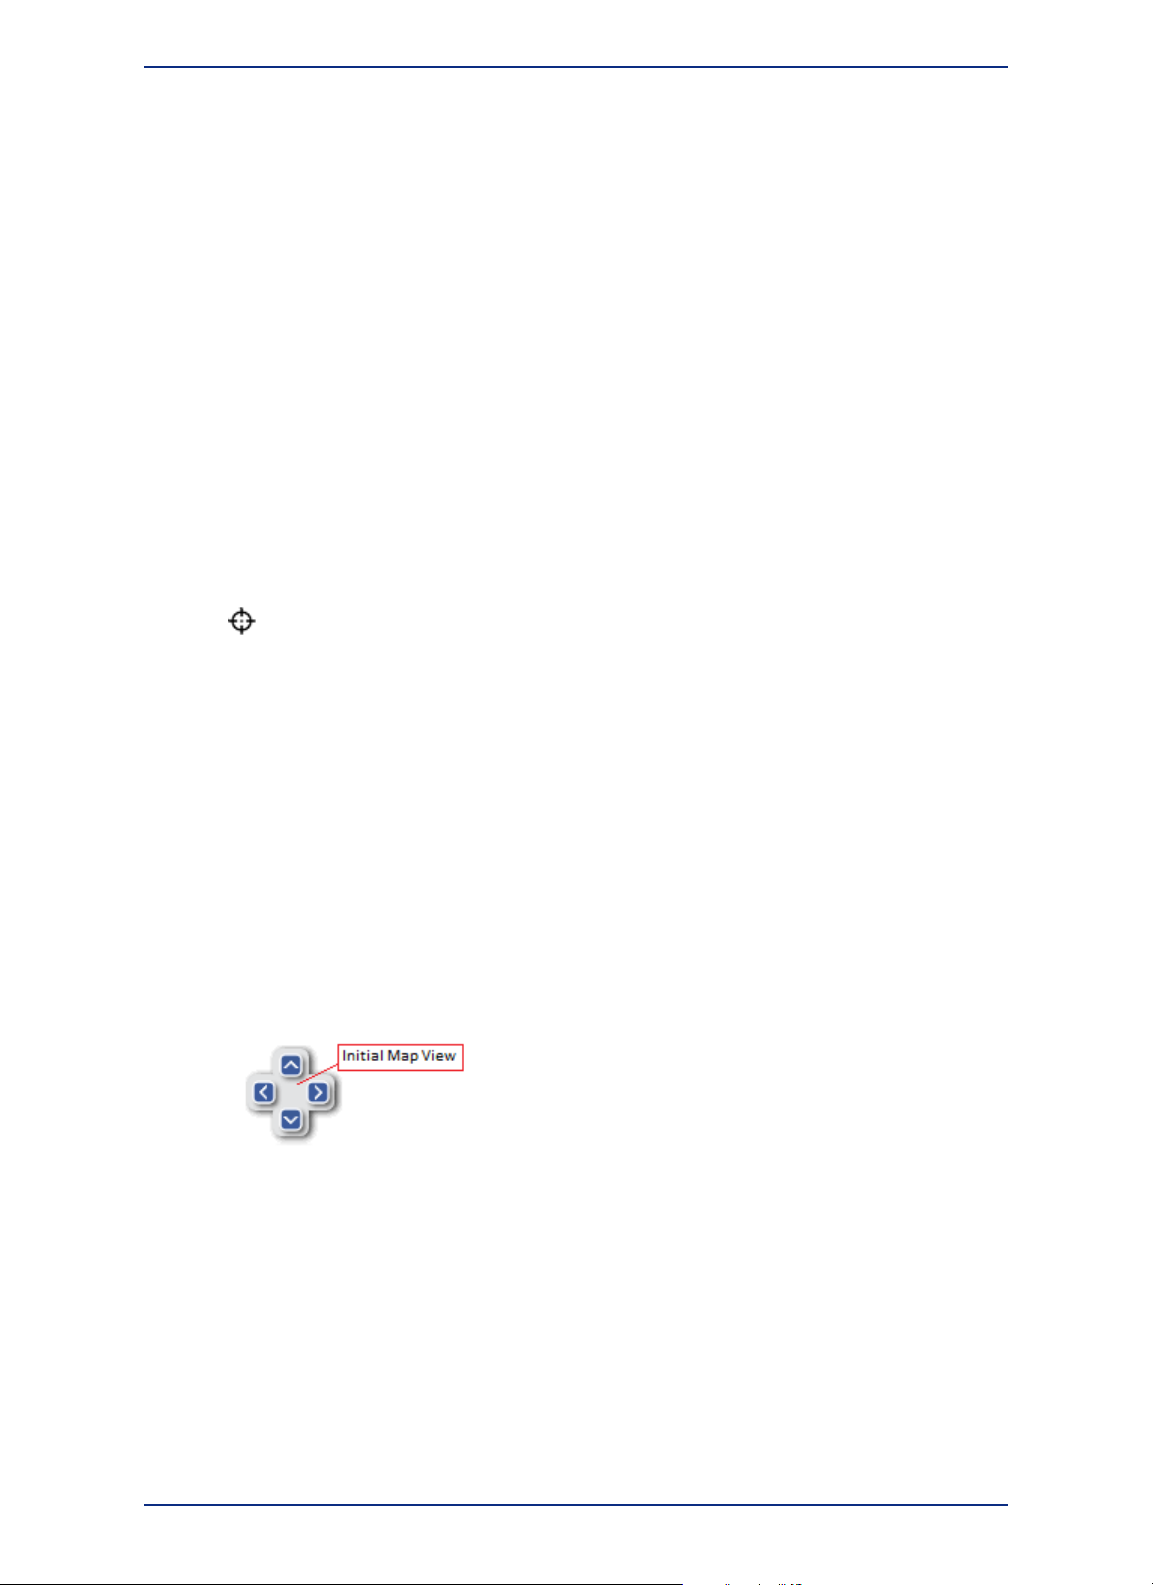
Moving around the Map
To move around the map, perform the following steps:
1. Click on any of the four points on the panning star. It allows you to pan north, pan south, pan west
and pan east.
2. When the Navigate Map tool is selected, click on the map screen, hold the mouse, click down and
drag the cursor across the screen to move around the map.
3. Click on the Initial Map View button in the center of the pan to take the map to the initial view.
Using the Keyboard Keys
You can use keyboard keys to navigate around the map. Use Access Key (Alt + 1) to focus the map
element, and then use following keys to pan and zoom:
MapInfo™Stratus 4214
Page 15
Chapter 2: Learn the Basics
ActionKeyboard Keys
Zoom In+
Zoom Out-
Pan NorthUp Arrow
Pan SouthDown Arrow
Pan EastLeft Arrow
Pan WestRight Arrow
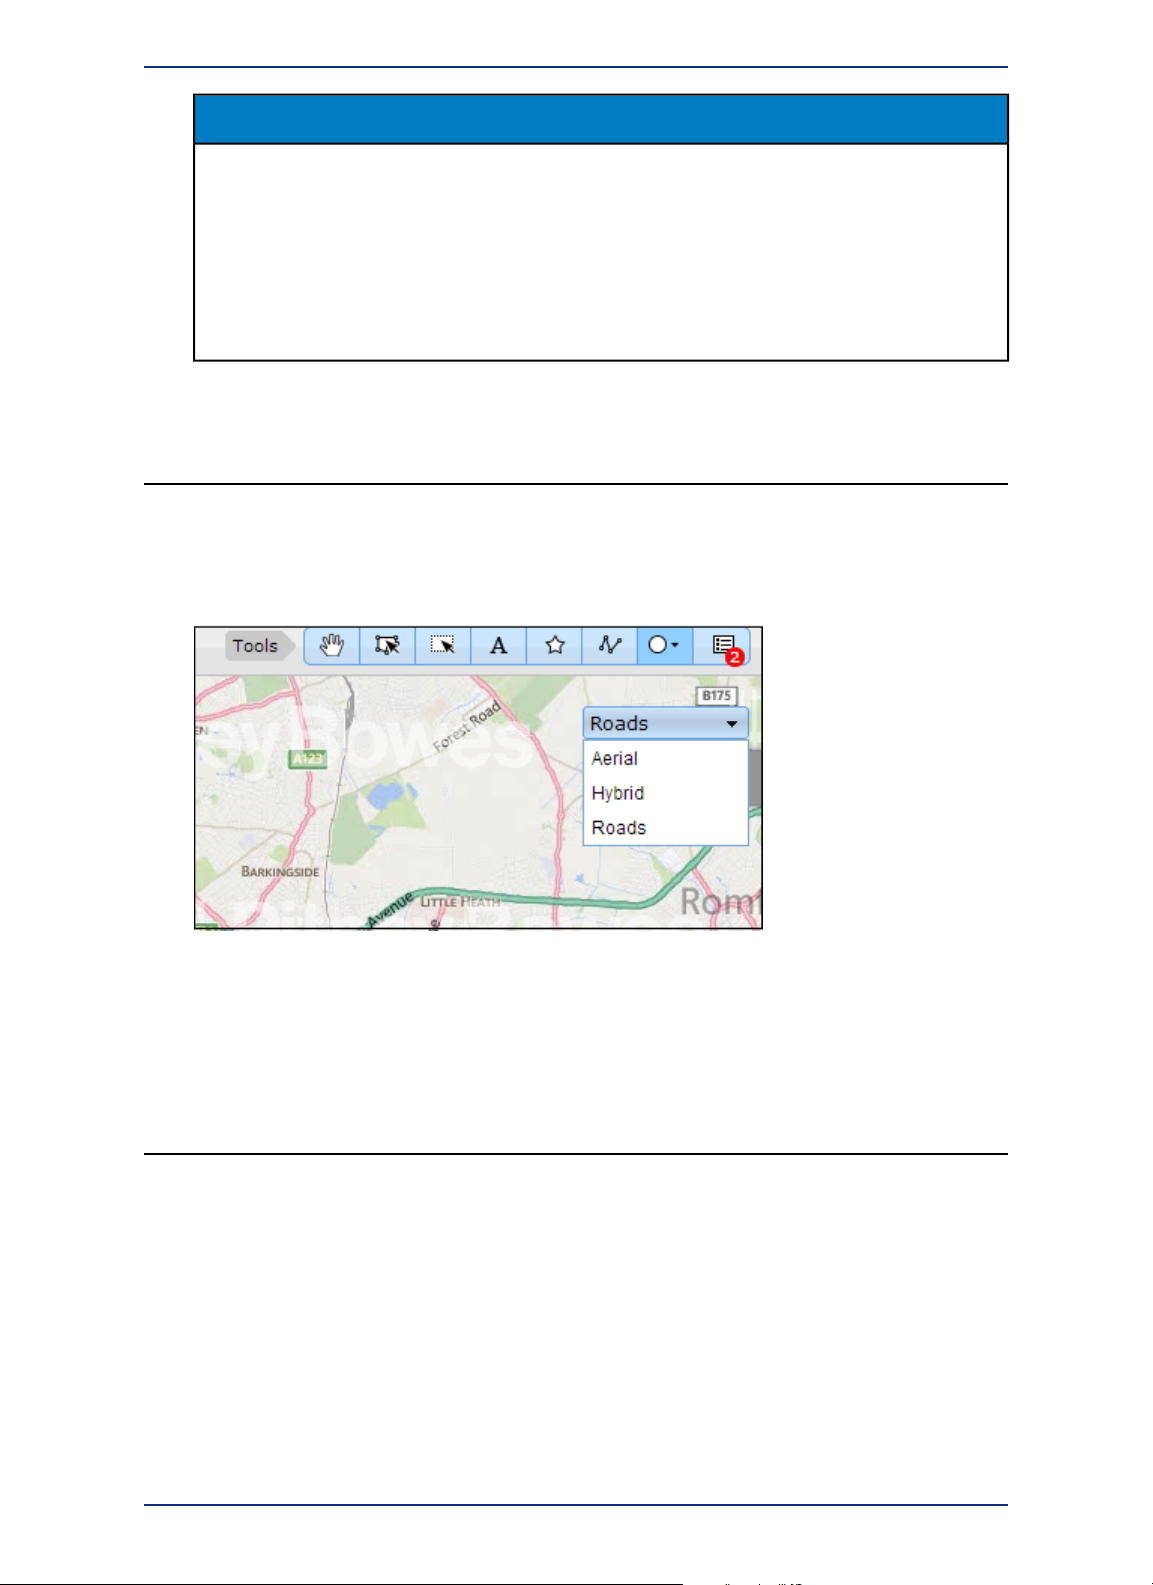
Switching Base Maps
You can switch to a different type of background map. For example, Aerial, Hybrid and Roads map. The
switch background map option is located at the top right corner of the map. In the example below, click
on the Aerial or Hybrid or Roads options to switch between them.
Figure 4: Switching Base Maps
Note:
Based on the settings done in Admin Console, you can retain X, Y, View and Zoom while switching
the Map Configurations with same projections.
Map Legend
Map legends show a key to the map overlays available on your map. It also allows you to turn on or off
individual overlay’s and individual layers in a map to show only the maps more appropriate to your
requirements. It also allows you to adjust translucency of a layer.
Figure 5: Map Legend
15MapInfo Stratus User's Guide
Page 16

Status Bar
You can perform following actions by using Map Legend:
1. Click on the Show\Hide Overlay on the Map check box next to the required map overlay in the
legend to turn on a map overlay. Overlay check boxes can show following three states:
a) Checked- when all children layers are checked.
b) Unchecked - when all children layers are unchecked.
c) Indeterminate (solid color filled)- when some and not all layers are checked.
2. Click on the Show\Hide Layer on the Map check box next to the required layer under the overlay
to turn on a layer.
3. Click the overlay name or the arrow next to the overlay name to expand or collapse the legend display
for an overlay.
4. Click on the Opacity control icon and adjust translucency by using Layer Opacity slider to adjust
translucency of a layer.
5. Click on the Label icon to show or hide the label layers on the map.
The Opacity Control icon appears only when Show\Hide Overlay on the Map check box is
Note:
clicked. The individual Layer Show\Hide option is available based on settings done in Admin
Console.
Note:
Click on the Delete icon next to the thematic map legend to delete it. The delete option
is only available for thematic map.
Status Bar
Status bar at the bottom of the viewport displays the scale and the current X and Y as you hover the
mouse over the map.
Getting Help
MapInfo Stratus provides online help for all the features.
MapInfo™Stratus 4216
Page 17

To access online help:
1. In the Map toolbar, click on help icon to view online help.
Chapter 2: Learn the Basics
17MapInfo Stratus User's Guide
Page 18

Page 19

Search and Query Builder
The following topics provide help on search and query builder:
In this section:
• Search for an Address . . . . . . . . . . . . . . . . . . . . . . . . . . . .20
• Find my Nearest . . . . . . . . . . . . . . . . . . . . . . . . . . . . . . . . .22
• Search Results . . . . . . . . . . . . . . . . . . . . . . . . . . . . . . . . . .23
• Query Builder . . . . . . . . . . . . . . . . . . . . . . . . . . . . . . . . . . .23
3
Page 20

Search for an Address
Search for an Address
MapInfo Stratus provides search bar on the top left corner of the viewport. It searches for place or location
that you'd like to view. Search results are displayed on the Search Results panel.
Searching ZIP Code, Placename or Address
MapInfo Stratus provides search for an address, place name and ZIP code. Your search may include a
single phrase or number or any combination of multiple phrases or numbers separated by a space. This
can include:
• The road name
• Property number and name
• Property number and ZIP code
• Full Postcode
• Part of a postcode
• Mix of postcode and road name (full or part)
• Place name (for example, school)
Figure 6: Search for an Address
To search for an address, place name or ZIP code, follow the steps given below:
1. Enter part of an address (for example, ZIP code, street name etc.) in the search bar on the top left
corner of the viewport.
2. Click Search.
List of matching addresses are displayed in the Search Results panel.
3. In the Search Results panel, click on the address of your interest.
4. The address is marked on the map with a map-marker.
Using Wildcards when Searching
MapInfo Stratus supports following two wildcard characters:
1. A “*” can be used in place of multiple characters.
MapInfo™Stratus 4220
Page 21

Chapter 3: Search and Query Builder
2. A “?” can be used in place of any single character.
The most common form of wildcard search is where you place a * at the end of the phrase you are
searching.
For example, searching for “cam” may return results such as “Cam Road” but it will not return “Camden
Road”. Searching for “cam*” will return results that start with “cam”. For example “Camden Road” and
“Cambridge Road” would be returned if they were present in the dataset being searched.
A single character wildcard can be used where you are unsure of the spelling. For example searching
for “jo?ner” would return both “joiner” and “joyner”.
A wildcard is only supported if it is in the middle or end of a phrase. For example you cannot search
“*way”. Searching in this way will return no results.
More Search Options
MapInfo Stratus supports following search options:
Special characters: Any characters other than * and ? will be searched literally. This includes characters
such as “\” “/” and brackets. If for example the address data has text enclosed in brackets, for example
if all underground stations are indicated with brackets like this “Kentish Town Road Station (Underground)”
and you wish to search all underground stations then you must include the brackets and search for
“(underground)”.
Number Ranges: For number searches, you can search for either a single number or a number range
using two numbers. If searching for two numbers you can separate them using a dash or space. Given
below are the four sample searches:
1. “8-12 High Street”
2. “8 12 High Street”
3. “8 High Street”
4. “12 High Street”
In cases 1 and 2 the results will include addresses where both 8 and 12 are present in the address.
Results that contain only an 8 or a 12 are not returned. In case 3 if you searched for a single number
such as “8 High Street” you would see results returned that include 8 as a single number or as a number
range. Hence 1, 2 and 3 returned.
Similarly, in case 4 a search for “12 High Street” would return results 1, 2 and 4. However, a search for
"10 High Street" would not return results for "8-12 High Street". We make no assumption that the range
8-12 includes number 10. Only results that are for 10 High Street or which include 10 in a number range
such as 10-12 High Street would be returned.
Apostrophes: If you have an address that has “’s” in the string like king’s, then you can use either kings
or king’s to search and any results that have “kings” or “king’s” will be returned. You do not need include
the apostrophe, but if you do, then the results will still be the same.
Quotes: If you are using quotes “” in your search, you might get unexpected results as MapInfo Stratus
will explicitly search for terms that include the quotes in the address. We recommend not to use quotes.
UK Postcodes: For UK Postcodes you can search the inner or outer code or specify the full postcode.
If specifying the full postcode you can enter it either using a space between the inner and outer code or
enter the whole postcode without spaces. MapInfo Stratus will correctly search and find the matching
postcodes.
Recently Selected Addresses
In the Search Text box, before typing any text, if you click the down arrow it displays recently selected
addresses.
21MapInfo Stratus User's Guide
Page 22

Find my Nearest
As you type within the search box, it displays searches that might be similar to the one you are typing.
It displays top five results for what you have typed in so far.
Find my Nearest
Whenever an address search is carried out, the address is marked on the map with a map marker offering
links to show nearby services. Each link displays up to ten closest features/events of the selected type.
Figure 7: Find My Nearest
By clicking on one of the link, nearest locations in that category are added to the map.
MapInfo™Stratus 4222
Page 23

Chapter 3: Search and Query Builder
Finding more Information about Nearby Services
There are two ways of getting more information about nearby services.
1. Place the cursor over a map marker without clicking it. This will cause the map marker to grow in
size, and the corresponding details listed in the Search Results panel will be highlighted.
2. Click once on a map marker. A call out with more information about the selected feature appears. It
also displays x-y and longitude and latitude values of the selected feature.
Search Results
Search results are displayed in the Search Results panel.
Figure 8: Search Results
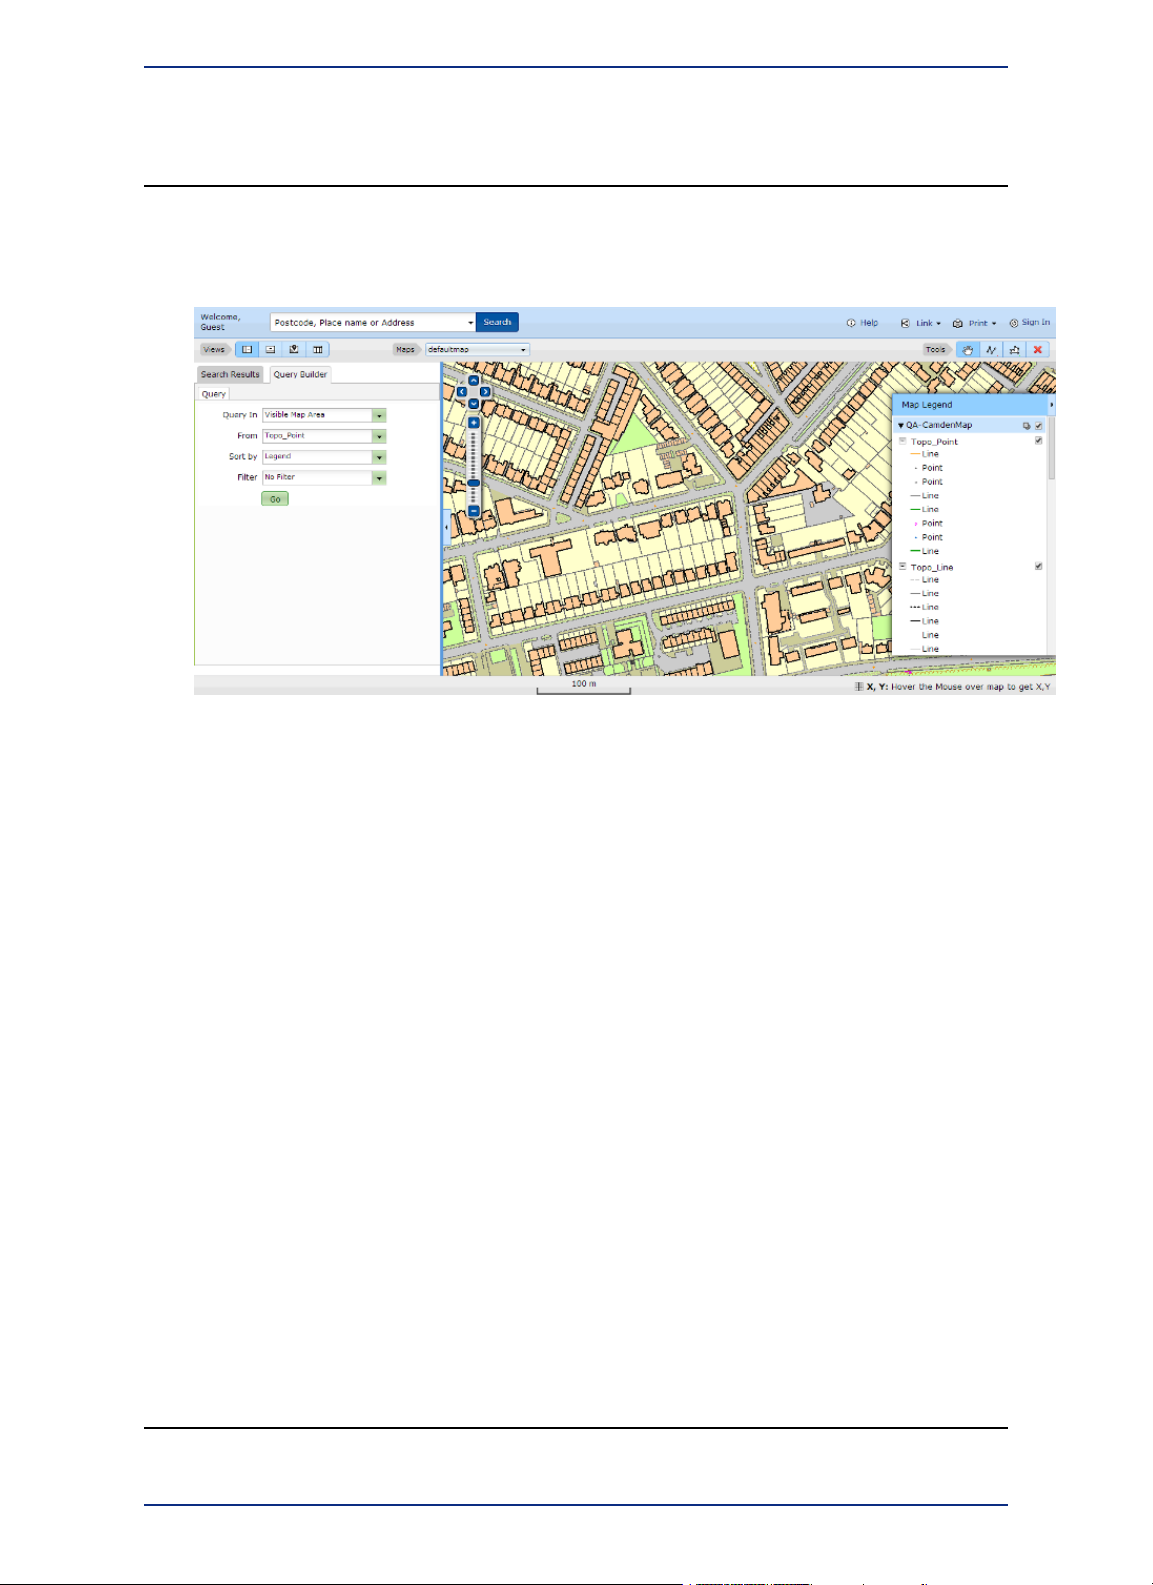
Query Builder
The query builder allows you to search for information on individual map layers shown on the map.
Results are displayed as an interactive table. Clicking a result on the table will zoom to and highlight that
feature on the map. You can search and display all of the data for a layer, constrain your search to within
the current map view, or search for information which is inside the shapes that you draw on the map as
annotations. For some layers the MapInfo Stratus Administrators will have set up additional criteria that
you can choose to further limit the results you get (for example, to return results within a date range or
results which meet some other value).
Figure 9: Query Builder
23MapInfo Stratus User's Guide
Page 24

Query Builder
A query can be set up to perform a more detailed search on a map. Query now also supports Date, Time
and Date_Time data types. You can set your query based on following parameters:
DescriptionQuery Options
Query In
Sort by
Filter
Allows you to specify the geographic area to search in. You can choose to see all
the data, data within the current map view or choose one of the annotations you
have drawn to search for data that is inside or touches it. If there are more than one
annotation present on the map then two more options will be available to choose
from- Selected Annotations and All Annotations.
The name of the map layer you wish to search.From
You can choose which column of data to sort the results by. You can also re-sort
the data once the results are shown.
Some layers will have a list of criteria you can choose. If criteria exist you will be
presented with additional text boxes or pick lists to further refine the results you
return.
• No Filter- No criteria is selected.
• Custom Filter- Displays Filter Criteria dialog box and allows you to customize
your search. For more information, refer to Building a Query.
• Others- In addition to above two filter options, the query filter created from Admin
Console are also listed.
Note:
Now, you can select multiple options from query pick list and query on
multiple options at once.
Building a Query
The Query Builder tab allows tabular queries on the attribute data from any of the currently displayed
layers.
MapInfo™Stratus 4224
Page 25

Chapter 3: Search and Query Builder
To build a query, follow the steps given below:
1. Select the Query Builder tab.
2. From the Query In drop-down list, select the geographic area to be queried. You can choose to see
all the data, data within the current map view or choose one of the annotations you have drawn to
search for data that is inside or touches it.
3. From the From drop-down list, select the name of the map layer you wish to search.
4. From the Sort By drop-down list select which column of data to sort the results by. You can also
re-sort the data once the results are shown.
5. Select Custom Filter from Filter drop-down list to customize search. The Filter Criteria section is
displayed.
6. From the Where drop-down list select the column that is to be queried.
If there are less than 50 records associated with selected column then criteria is shown as
Note:
drop down list with multiselect option and if records are more than 50 then criteria is shown
as text box.
7. Select the search operator from the drop-down list. It provides following search operators.
DescriptionNameOperator
equal to=
not equal to<>
less than<
greater than>
>=
<=
Multiselect pick list is supported for {equal, not-equal and like} operators. For others, simple
Note:
pick list is displayed.
8. Enter a value in the Criteria text box and click Go.
9. Click sign to add AND conditions to the query filter. If you want to delete a query condition click
the button to delete the current row.
You can add up-to 5 search criteria.Note:
greater than or
equal to
less than or equal
to
LikeLike
This function only retrieves records that exactly match the
text or value entered in the criteria text box.
This function looks for all values that are different from the
value entered in the criteria text box.
This function looks for all values lower than the value entered
in the criteria text box.
This function look for all values higher than the value entered
in the criteria text box.
This function looks for all values higher than or at the same
level as the value entered in the criteria text box.
This function looks for all values lower than or at the same
level as the value entered in the criteria text box.
It looks for records in the chosen field that contain the criteria
entered in any way.
Query Results View
On the results table you can:
• Re-order the results by clicking the column headings.
• Navigate from page to page.
• Export all of the results as a CSV file (or choose to export one page at a time). A maximum of 1000
results can be exported at any one time.
• Click each result to zoom to and highlight the record on the map.
• The highlighted feature can be used to make a second query inside its area.
25MapInfo Stratus User's Guide
Page 26

Query Builder
• Resize the column widths by dragging the edges between the columns.
• Switch between horizontal, vertical or full results views to see more of the data.
• You can open as many queries as you like and each will be shown in its own tab.
• You can also close them.
MapInfo™Stratus 4226
Page 27

Thematic Mapping
MapInfo Stratus allows you to apply themes on maps. Thematic mapping allows
you to analyze your data and display it in a variety of ways on a map.
Note:
In this section:
The Thematic Map feature is available on the basis of settings done in
Admin Console.
• What is a Thematic Map? . . . . . . . . . . . . . . . . . . . . . . . . . .28
• Creating a Thematic Map . . . . . . . . . . . . . . . . . . . . . . . . . .28
4
Page 28

What is a Thematic Map?
What is a Thematic Map?
A map that contains one or more Thematic Layers is termed as thematic map.
What is a Thematic Layer?
A Layer on the map that has had its visual style altered to represent data associated with that map layer.
For example, a Layer might contain suburb boundaries and have associated information about the total
population of each suburb. A Thematic can be applied to this Layer so that each suburb is displayed in
a different color depending on how large the population of the suburb is.
What is a Range Thematic Map?
A Range thematic map groups all records into ranges and assigns different colors, symbols, patterns or
line style. For example, if you want to visualize the population of the world by growth rate, you would
shade countries according to their reported growth rate amounts.
Creating a Thematic Map
The Thematic Map tab allows you to apply themes on a map. To create a thematic map, follow the steps
given below:
1. Open the Thematics Map tab.
2. Click on Create New Thematics from drop-down list.
3. From the Table drop-down list select a table on which you would want to apply thematic.
4. From the Column drop-down list, select a column on which you would like to create thematic.
5. From the Visualization type drop-down list, select the type of thematic map you want to create.
Currently, only Ranged thematic map is supported. The Visualization type drop-down will
Note:
be enabled only if the data type for column is numeric.
6. Select Map Geometries to style. You can choose from Polygon, Line or Point map geometries. By
default, the predominant map geometry is selected.
Table 1: Map Geometries Options
DescriptionOption
Select interval. It ranges from 2 to 16.Interval
Method
Select to create ranges automatically using any one of the following methods. You
can select from:
• Equal Count- It has the same number of records in each range.
Border >
Style
• Equal Ranges- It divides records across ranges of equal size.
• Standard Deviation- In this method the middle range breaks at the mean of your
values, and the ranges above and below the middle range are one standard deviation
above or below the mean.
Select the pattern from the list. This option is available with polygon geometry only.Pattern
Select the border style from the list. This option is available with polygon and line
geometry only.
MapInfo™Stratus 4228
Page 29

Chapter 4: Thematic Mapping
DescriptionOption
Border >
Color
Width
Color
Color
Image >
Icon
Size
Legend
Create
Note:
Caution: The Thematic Map is not retained once you refresh your current page or change Map
Configuration.
Select the border color from color palette. This option is available with polygon geometry
only.
Select the size for border. This option is available with polygon and line geometry only.Border >
Select the start color of the range. The start color is same for all the map geometries.Fill > Start
Select the end color of the range. The end color is same for all the map geometries.Fill > End
Select the image icon from the drop-down list. This option is available with point
geometry only.
Select the size of image icon. This option is available with point geometry only.Image >
Click to preview legend range.Preview
Click to create and view thematic map. Each thematic map is added as a top level
map item. The thematic map is also listed in the Map Legend. For more information,
refer Map Legend on page 15.
Click to apply changes to thematic maps.Apply
Once a thematic map is created, you can further edit or delete it. You can delete thematic
map from Map Legend. For more information, refer Map Legend on page 15.
29MapInfo Stratus User's Guide
Page 30

Page 31

Working with Annotations
5
Note:
The following topics provide help on working with annotations:
In this section:
The functions available in MapInfo Stratus are controlled by the
administrator for each organization and some users may not have these
tools enabled, whilst others may only have measuring tools enabled
instead of the full annotation tools.
• Annotations . . . . . . . . . . . . . . . . . . . . . . . . . . . . . . . . . . . . .32
• Measuring Distance and Area . . . . . . . . . . . . . . . . . . . . . .39
Page 32

Annotations
Annotations
MapInfo Stratus provides various types of annotation features that you can draw on the map. You can
use these annotation features to highlight or label certain areas. The annotations can be exported as a
Google KML file that you can share with others and are included in the PDF printouts you can create
from MapInfo Stratus. You can also import KML annotations that you have drawn in other applications.
If you have the query capability enabled you can also search and display information from map layers
where they overlap with the annotations. You can also pick features from the map and add them to your
annotations. Whilst adding you are given the option to buffer the feature by a certain value.
For example if you want to see all the map information within 100 meters of an existing area, you can
pick the area on the map, buffer it by 100 meters and then use the resulting annotation in a query. The
annotation features are managed by Annotation Manager.
Draw a Shape Annotations
The Draw a Shape annotation button allows you to choose from five different shapes:
Draw Polygon
To draw a polygon, follow the steps given below:
1. From Shape Annotation drop-down list, select Draw Polygon .
2. Click on the map once to start the first point.
3. Move the mouse and click again to enter the second point.
4. Repeat the above step for as many points that you wish to add.
5. When you are adding the last point, add it using a double click of the mouse. This will end the drawing
mode and complete your polygon.
If you click the map and drag the mouse whilst drawing you can pan the map. This is useful
Note:
if you want to carry on drawing past the edge of the current map view. A polygon must have
at least 3 points to be added to the map.
Note:
Click on Navigate Map icon on the toolbar to release the selected annotation feature.
Draw Circle
To draw a circle, follow the steps given below:
1. From Shape Annotation drop-down list, select Draw Circle .
2. Click on the map where the center of the circle will be and drag mouse outwards to draw the circle.
3. Release the mouse to complete the drawing and add the circle to the map.
Note:
Click on Navigate Map icon on the toolbar to release the selected annotation feature.
Draw Ellipse
To draw a ellipse, follow the steps given below:
1. From Shape Annotation drop-down list, select Draw Ellipse .
2. Click on the map where one corner of the ellipse will be and drag mouse outwards to draw the ellipse.
3. Release the mouse to complete the drawing and add the ellipse to the map.
MapInfo™Stratus 4232
Page 33

Chapter 5: Working with Annotations
Note:
Click on Navigate Map icon on the toolbar to release the selected annotation feature.
Draw Square
To draw a square, follow the steps given below:
1. From Shape Annotation drop-down list, select Draw Square .
2. Click on the map where the centre of the square will be and drag mouse outwards to draw the square.
3. Move the mouse around to rotate the square whilst drawing it.
4. Release the mouse to complete the drawing and add the square to the map.
Note:
Click on Navigate Map icon on the toolbar to release the selected annotation feature.
Draw Rectangle
To draw a rectangle, follow the steps given below:
1. From Shape Annotation drop-down list, select Draw Rectangle .
2. Click on the map where one corner of the rectangle will be and drag mouse to draw the rectangle.
3. Release the mouse to complete the drawing and add the rectangle to the map.
Unlike the square, the rectangle cannot be rotated.Note:
Note:
Click on Navigate Map icon on the toolbar to release the selected annotation feature.
Draw Concentric Ring
To draw a concentric ring on a map, follow the steps given below:
1. From Shape Annotation drop-down list, select Draw Concentric Ring .
2. Click on the map where you want to add concentric ring and drag mouse outwards to draw a circle.
The radius of the drawn circle becomes the initial outer radius of the rings. The Add Concentric
Ring dialog box appears with following options:
DescriptionOptions
Enter x coordinateX- Coordinate
Enter y coordinateY-Coordinate
Outer Most Radius
Number of Rings
Enter\change outer radius value for the outermost ring. You
can edit the outer radius to a different value.
Enter the total number rings. You can enter 2 to 5 rings only.
For example, if the number of rings is 2 then 2 rings will be
drawn with the first ring having inner radius as 0 and second
ring having outer radius as specified in the "Outermost Radius"
field.
Each individual ring will be a separate annotation that will be
listed in Annotation Manager. You can query in each ring
individually or with other annotations (multiple select) in Query
Builder.
Select to create rings at equal distances.Equidistant
33MapInfo Stratus User's Guide
Page 34

Annotations
DescriptionOptions
Custom
Cancel
3. Click on the Select Annotation Tool icon on the toolbar to view and edit ring annotation
properties.
4. Click on the ring to see and edit its annotation properties. For more information, refer Editing
Annotation Properties on page 36.
Note:
Click on Navigate Map icon on the toolbar to release the selected annotation feature.
Select to create rings at customized distances.
The radius text box appears on the basis of total number of
rings. The last radius text box cannot be edited. It displays
the value entered in Outermost Radius text box.
Click Save. The Concentric Ring appears on the map.Save
Click Cancel to exit Add Concentric Ring dialog box without
creating concentric ring on the map.
Draw Line
To draw a line, follow the steps given below:
1. From the toolbar, select Draw Line
2. Click on the map once to start the first point.
3. Move the mouse and click again to enter the second point.
4. Repeat the above step for as many points that you wish to add.
5. When you are adding the last point, add it using a double click of the mouse. This will end the drawing
mode and complete your line.
If you click the map and drag the mouse whilst drawing you can pan the map. This is useful
Note:
if you want to carry on drawing past the edge of the current map view. A line must have at
least two points to be added to the map.
Note:
Click on Navigate Map icon on the toolbar to release the selected annotation feature.
Draw Point
To add a point annotation to the map follow the steps given below:
1. From the toolbar, select Draw Point .
2. Click on the map once where you wish to add the point. The point will be added to the map.
Note:
Click on Navigate Map icon on the toolbar to release the selected annotation feature.
Text Annotation
To add a text annotation to the map follow the steps given below:
1. From the toolbar, select Text Annotation .
2. Click on the map once to register the centre point for the text.
The text annotation dialog box appears.
MapInfo™Stratus 4234
Page 35

3. Type the text you wish to add and click OK.
The text will be added to the map.
Chapter 5: Working with Annotations
You cannot query on a Text Annotation. Summarize data is not supported for Text Annotation.Note:
Note:
Click on Navigate Map icon on the toolbar to release the selected annotation feature.
Pick from Map
To pick a map feature and add it to the map as an annotation follow the steps given below:
1. From the toolbar, select the Pick from Map button .
2. Click on the map where the map feature is located.
You will be shown a dialog listing of all the map features found at that location.
3. Tick the features you wish to add as annotations. Each would be added as a separate annotation.
4. Optionally, enter a value for the buffer. Each map feature will be increased in size from its edge by
the buffer amount before being added.
5. Click Save.
All the selected annotations will be added to the map as shown below:
35MapInfo Stratus User's Guide
Page 36

Annotations
Annotation Manager
To manage all the annotations from one place you can use the annotation manager from the toolbar.
The Annotation Manager highlights total number of annotations drawn on the map. The following options
are available in annotation manager:
DescriptionOptions
Toggles the visibility of all of the annotations.Show/Hide All Annotations
on Map
Toggles the visibility of individual annotation.
View and edit properties of individual annotation. For more information,
refer Editing Annotation Properties on page 36.
Delete individual annotations.
Export the annotations to a Google KML file to your computer.Export
Import
Summarize Data
Import a new set of annotations from a Google KML file you have on your
computer.
Summarize data within single or multiple annotations. It displays the sum,
average, min and max of numeric data that falls within the selected
annotations. For more information, refer Summarize Data in Multiple
Annotation on page 39 and Summarize Data in a Single Annotation
on page 38.
Query on multiple annotations.Query
Query on a Text Annotation is not allowed.Note:
Delete all annotationsDelete All
Editing Annotation Properties
There are two ways to view and edit annotation properties.
MapInfo™Stratus 4236
Page 37

Chapter 5: Working with Annotations
Edit Annotation
The Edit Annotation icon allows you to view and edit properties of individual annotation. To edit
annotation properties, follow the steps given below:
1. Click on the Annotation Manger icon on the toolbar. The Annotation Manger dialog box appears.
2. Select the Annotation that you want to view or edit.
3. Click on the Edit Annotation icon. The Properties dialog box for selected annotation appears
under the Annotation tab.
DescriptionProperties
Annotation
Measurement Units
Displays name of the selected annotation. For example, circle, point, line,
ring etc.
Displays the measurements of selected annotations like area, length and
perimeter. You can select various measurement units from the drop-down
list. The supported measurement units are Meters, Feet, Yards, Kilometers,
Miles, Acres, and Hectares. The default measurement unit will be the
configured map unit for all annotations.
Displays the inner radius of a circle or ring annotation.Inner Radius
This option is available with a circle or ring annotation only.Note:
Displays the outer radius of a circle or ring annotation.Outer Radius
This option is available with a circle or ring annotation only.Note:
Enter a buffer value to apply to the selected annotation.Apply Buffer
Enter the value of x to relocate an existing annotation to a new location.X
Enter the value of y to relocate an existing annotation to a new location.Y
Select to input values for longitude and latitudes in decimal degree.Longitude-Latitude
4. Click on the Delete icon to delete the selected annotation.
5. Click on the Apply button to apply changes to annotation properties.
Select Annotation Tool
The Select Annotation Tool on the toolbar allows you to select an existing annotation and view
or modify its properties. Follow the steps given below to edit annotation properties:
1. From the toolbar, select the Select Annotation Tool .
2. Move the mouse over the map. As you move, annotations that can be selected is highlighted in bold
outline.
3. Click on the annotation to select it. The selected annotation will turn orange and the edit properties
dialog box appears for selected annotation under the Annotation tab.
DescriptionProperties
Annotation
Measurement Units
Displays name of the selected annotation. For example, circle, point, line,
ring etc.
Displays the measurements of selected annotations like area, length and
perimeter. You can select various measurement units from the drop-down
list. The supported measurement units are Meters, Feet, Yards, Kilometers,
Miles, Acres, and Hectares. The default measurement unit will be the
configured map unit for all annotations.
37MapInfo Stratus User's Guide
Page 38

Annotations
DescriptionProperties
Displays the inner radius of a circle or ring annotation.Inner Radius
This option is available with a circle or ring annotation only.Note:
Displays the outer radius of a circle or ring annotation.Outer Radius
This option is available with a circle or ring annotation only.Note:
Enter a buffer value to apply to the selected annotation.Apply Buffer
Enter the value of x to relocate an existing annotation to a new location.X
Enter the value of y to relocate an existing annotation to a new location.Y
Select to input values for longitude and latitudes in decimal degree.Longitude-Latitude
4. Click on the Delete icon to delete the selected annotation.
5. Click on the Apply button to apply changes to annotation properties.
Summarize Data in a Single Annotation
You can summarize data in\within a single annotation. It displays the sum, average, min and max of
numeric data that falls within the selected annotation. To get summarized data for the selected annotation:
1. Click on the Annotation Manger icon on the toolbar. The Annotation Manger dialog box appears.
2. Select the Annotation for which you want to summarize data.
3. Click on the edit icon. The properties dialog box appear for selected annotation.
4. Click on the Summarize Data tab. The Summarize Data for the selected annotation appears under
Summarize Data tab
DescriptionOptions
Select the table for which you want to summarize data.For Table
Where
Sum
Average
Min
Max
Select whether the data should be within or intersecting the
annotation. You may select Features intersect these annotations
or Features are within this annotation option. Intersecting is the only
option for lines and points while polygons can have either option.
Displays the total number of features found in selected area.Count
Displays the sum of corresponding values for numeric data for each
table column.
Displays the average of corresponding values for numeric data for
each table column.
Displays the minimum value of corresponding values for numeric data
for each table column.
Displays the maximum value of corresponding values for numeric data
for each table column.
Exports the summarize data to a csv file.Export
Close the Summarize Data dialog box.Close
Exports only selected data to a csv file.Export Selected
Summarize data is not supported for Text Annotations.Note:
MapInfo™Stratus 4238
Page 39

Chapter 5: Working with Annotations
Summarize Data in Multiple Annotation
You can summarize data in\within multiple annotations. It displays the sum, average, min and max of
numeric data that falls within the selected annotations. To get summarized data for multiple annotations:
1. Click on the Annotation Manger icon on the toolbar. The Annotation Manger dialog box appears.
2. Select single or multiple Annotations for which you want to summarize data.
3. Click on the Summarize Data link at the bottom of Annotation Manager dialog box. The Summarize
Data for selected annotations dialog box appears with following options:
DescriptionOptions
Select the table for which you want to summarize data.For Table
Where
Select whether the data should be within or intersecting the
annotation. You may select Features intersect these annotations
or Features are within this annotation option. Intersecting is the only
option for lines and points while polygons can have either option.
Count
Sum
Average
Min
Max
Summarize data is not supported for Text Annotations.Note:
Displays the total number of features found in the selected area.
For tables with no numeric columns, only the record count is displayed.
Displays the sum of corresponding values for numeric data for each
table column.
Displays the average of corresponding values for numeric data for
each table column.
Displays the minimum value of corresponding values for numeric data
for each table column.
Displays the maximum value of corresponding values for numeric data
for each table column.
Exports the summarize data to a csv file.Export
Closes the Summarize Data dialog box.Close
Exports only selected data to a csv file.Export Selected
Measuring Distance and Area
In this topic:
Navigate in the Map
To navigate in the map:
1. Select the Navigate Map tool and click on the map screen.
2. Hold the mouse, click down and drag the cursor across the screen to navigate.
3. Click on the map to see the information of selected point.
Measuring Distance
To measure distances on the map:
39MapInfo Stratus User's Guide
Page 40

Measuring Distance and Area
1. From the measuring toolbar, select Measure Line .
2. Click on the map once to start the first point.
3. Move the mouse and click again to enter the second point.
4. Repeat the above step for as many points that you wish to add.
5. When you are adding the last point, add it using a double click of the mouse. The distance measured
is shown in measurement dialog box.
You can measure distance in meters, feet, yards, kilometers and miles.Note:
Measuring an Area
To measure an area on the map:
1. From the measuring toolbar, select Measure Area .
2. Click on the map once to start the first point.
3. Move the mouse and click again to enter the second point.
4. Repeat the above step for as many points that you wish to add.
5. When you are adding the last point, add it using a double click of the mouse. The area measured is
shown in measurement dialog box.
You can measure area in meters, feet, yards, kilometers, miles, acres and hectares.Note:
Clearing the Feature
To clear the drawn area or distance on the map:
1. From the measuring toolbar, click on the Clear Feature button.
2. The drawn area or line is removed from map.
MapInfo™Stratus 4240
Page 41

Printing Maps
MapInfo Stratus allows you to print maps with annotations including measured
distances and areas. It also allows you to preview your map before printing.
The following topics provide help on printing maps:
In this section:
• Print Preview . . . . . . . . . . . . . . . . . . . . . . . . . . . . . . . . . . . .42
• Print to Scale . . . . . . . . . . . . . . . . . . . . . . . . . . . . . . . . . . . .43
• Print Map to PDF . . . . . . . . . . . . . . . . . . . . . . . . . . . . . . . . .43
6
Page 42

Print Preview
Print Preview
To preview the map before printing:
1. In the Map Toolbar, click Print .
The Print Settings dialog box appears.
You may or may not see the scale print option in the Print Settings dialog box. It is available
Note:
on the basis of settings applied by the MapInfo StratusAdministrator.
2. Enter the title for the map in the Title text box.
3. Select the template from the Template drop down list. You can select from following templates:
• Portrait
• Landscape
• Portrait Map Only
• Landscape Map Only
4. Select the scale to print from Scale drop-down list. The drop down lists the current scale (as it would
appear if the current visible map is fitted into the print template) and also a number of other scales.
You can also type in a specific scale of your choice. The range of available scales is chosen based
on the current zoom level to ensure that the print appears at a good resolution. If the scale you want
is not in range then try zooming in or out and then printing.
5. Click on the Preview button to see the PDF print preview of Map.
6. Click Print and select the printing options that you want in the print preferences dialog. The print
preferences dialog will differ based on your specific printer and PDF viewer.
When After previewing the print PDF and before printing please ensure that you uncheck
Note:
any Fit to Page options in the print preferences dialog. Sometimes these options are show
when clicking the properties button on the dialog. For more information, refer Print to scale.
7. Click on the Preview button to see the print preview of Map.
8. Select the printing options that you want, and then click Print.
MapInfo™Stratus 4242
Page 43

Chapter 6: Printing Maps
Print to Scale
The print templates in MapInfo Stratus are designed to specify a page size that is slightly less than full
A4 at 200mm by 287mm. This has been done to ensure that on most printers and printer drivers the
output does not need to be shrunk to fit into the printable area of the paper. They should therefore print
at the exact scale intended. However there can be exceptions to this:
1. On some older printers and print drivers we have seen that output can still become scaled down
(shrunk) if the printer cannot print to a printable area as large as 200mm x 287mm.
2. In some cases the printer driver offers the ability to Fit (or Scale to Fit) into the printable area. In
these cases it is possible that the print may become scaled up (grown).
When printing scaled PDF’s we strongly recommend disabling any options like "shrink to Printable Area”
or "Fit to Printable Area" on your print menu to ensure that there is no page scaling, otherwise the output
will not be at the exact scale that was chosen.
In order to assist with validating the output the actual dimensions of the printed map should be as follows
for each of the standard print templates.
• Landscape Map Only 27.7 cm x 15.0 cm
• Landscape 21.7 cm x 15.5 cm
• Portrait Map Only 19.0 cm x 24.5 cm
• Portrait 19.0 cm x 17.0 cm
Print Map to PDF
You can Print your map to PDF from supported browsers like Chrome and Mozilla Firefox.
Chrome
To print the web page you're viewing in Chrome, press Ctrl+P.
For more information on Printing through Chrome browser, refer to their website.Note:
Firefox
To print the web page you are viewing in Firefox, click on the Firefox button at the top of the Firefox
window, (File menu in Windows XP) and select Print.
For more information on Printing through Firefox browser, refer to their website.Note:
43MapInfo Stratus User's Guide
Page 44

Page 45

Linking Maps
MapInfo Stratuss allows you to copy map link for Email or sharing. It displays the
URL of the current location on map.
The following topics provide help on linking maps:
In this section:
• Copying Map Link . . . . . . . . . . . . . . . . . . . . . . . . . . . . . . . .46
7
Page 46

Copying Map Link
Copying Map Link
Copying map link in MapInfo Stratus is simple. To copy a link:
1. In the Map toolbar, click Link .
The Link dialog box appears.
2. Select Copy from the right click menu.
3. You can now paste link to an Email.
4. Click Cancel to close the Link dialog box.
MapInfo™Stratus 4246
Page 47

Support
In this section:
In this section:
• Frequently Asked Questions . . . . . . . . . . . . . . . . . . . . . . .48
8
Page 48

Frequently Asked Questions
Frequently Asked Questions
I just zoomed out and the legend control now shows a layer as disabled
In MapInfo Stratus the administrator can determine the zoom levels at which map layers are displayed.
This is called "Zoom Layering". When a map layer becomes disabled you need to zoom in (or in some
cases zoom out) to make the layer visible. Normally, layers that show very detailed information are
enabled only when you zoom in.
Where is the zoom layering stored?
The zoom layering is stored as the part of layer definition, and cannot be viewed or changed by users
after it has been created and uploaded into MapInfo Stratus.
Why are disabled layers not getting reflected in the PDF print?
This is an expected behavior. The layers which are disabled are not shown on the map or the print PDF.
You can zoom in to show layers for both.
MapInfo™Stratus 4248
 Loading...