

Page 1

MapInfo Professional
Version 12.5
MapInfo Professional User Guide
Page 2

Page 3

Notices
Page 4

Information in this document is subject to change without notice and does not represent a commitment
on the part of the vendor or its representatives. No part of this document may be reproduced or transmitted
in any form or by any means, electronic or mechanical, including photocopying, without the written
permission of Pitney Bowes Software Inc., One Global View, Troy, New York 12180-8399.
©
2014 Pitney Bowes Software Inc. All rights reserved. Pitney Bowes Software Inc. is a wholly owned
subsidiary of Pitney Bowes Inc. Pitney Bowes, the Corporate logo, MapInfo, Group 1 Software, and
MapInfo Professional are trademarks of Pitney Bowes Software Inc. All other marks and trademarks are
property of their respective holders.
Contact information for all Pitney Bowes Software Inc. offices is located at:
http://www.pb.com/contact-us.
©
2014 Adobe Systems Incorporated. All rights reserved. Adobe, the Adobe logo, Acrobat and the Adobe
PDF logo are either registered trademarks or trademarks of Adobe Systems Incorporated in the United
States and/or other countries.
©
2014 OpenStreetMap contributors, CC-BY-SA; see OpenStreetMap http://www.openstreetmap.org
(license available at www.opendatacommons.org/licenses/odbl) and CC-BY-SA
http://creativecommons.org/licenses/by-sa/2.0
libtiff©1988-1997 Sam Leffler,©2014 Silicon Graphics Inc. All Rights Reserved.
libgeotiff©2014 Niles D. Ritter.
Amigo, Portions©1999 Three D Graphics, Inc. All Rights Reserved.
Halo Image Library©1993 Media Cybernetics Inc. All Rights Reserved
Portions thereof LEAD Technologies, Inc.©1991-2014. All Rights Reserved.
Portions©1993-2014 Ken Martin, Will Schroeder, Bill Lorensen. All Rights Reserved.
ECW by ERDAS©1993-2014 Intergraph Corporation, part of Hexagon Group and/or its suppliers. All
rights reserved.
Portions©2014 Intergraph Corporation, part of Hexagon Group All Rights Reserved.
MrSID, MrSID Decompressor and the MrSID logo are trademarks of LizardTech, A Celartem Company.
used under license. Portions of this computer program are copyright©1995-1998 LizardTech, A Celartem
Company, and/or the university of California or are protected by US patent no. 5,710,835 and are used
under license. All rights reserved. MrSID is protected under US and international patent & copyright
treaties and foreign patent applications are pending. Unauthorized use or duplication prohibited.
Contains FME®Objects©2005-2014 Safe Software Inc., All Rights Reserved.
Crystal Reports©2014 SAP AG, All Rights Reserved. Crystal Reports®and Business Objects™are the
trademark(s) or registered trademark(s) of SAP AG in Germany and in several other countries.
Amyuni PDF Converter©2000-2014, AMYUNI Consultants – AMYUNI Technologies. Allrights reserved.
Civic England - Public Sector Symbols Copyright©2014 West London Alliance. The symbols may be
used free of charge. For more information on these symbols, including how to obtain them for use in
other applications, please visit the West London Alliance Web site at http://www.westlondonalliance.org
©
2006-2014 TomTom International BV. All Rights Reserved. This material is proprietary and the subject
of copyright protection and other intellectual property rights owned or licensed to TomTom. The use of
this material is subject to the terms of a license agreement. You will be held liable for any unauthorized
copying or disclosure of this material.
Microsoft Bing: All contents of the Bing service are Copyright©2014 Microsoft Corporation and/or its
suppliers, One Microsoft Way, Redmond, WA 98052, USA. All rights reserved. Microsoft or its suppliers
own the title, copyright, and other intellectual property rights in the Bing service and content. Microsoft,
Windows, Windows Live, Windows logo, MSN, MSN logo (butterfly), Bing, and other Microsoft products
and services may also be either trademarks or registered trademarks of Microsoft in the United States
and/or other countries.
This product contains 7-Zip, which is licensed under GNU Lesser General Public License, Version 3, 29
June 2007 with the unRAR restriction. The license can be downloaded from
http://www.7-zip.org/license.txt. The GNU License may be downloaded from
http://www.gnu.org/licenses/lgpl.html. The source code is available from http://www.7-zip.org.
MapInfo Professional 12.54
Page 5

Copyright
Products named herein may be trademarks of their respective manufacturers and are hereby recognized.
Trademarked names are used editorially, to the benefit of the trademark owner, with no intent to infringe
on the trademark.
5MapInfo Professional User Guide
Page 6

Page 7

Contents
Chapter 1: Introduction.....................................................................................21
What is MapInfo Professional?..........................................................................22
Getting Started....................................................................................................24
Getting Support...................................................................................................26
Getting Technical Support .................................................................................27
Chapter 2: What's New in MapInfo Professional............................................29
New and Changed Features in MapInfo Professional......................................30
Data Access Features.........................................................................................32
Sample Data Enhancements..............................................................................32
New and Existing Tools......................................................................................33
Mapping at a Glance..................................................................................22
Using Your Own Data.................................................................................22
Reviewing the MapInfo Professional Features...........................................23
Accessing Your Documentation..................................................................24
Using the Status Bar ..................................................................................26
Using the Help System...............................................................................26
MapBasic Available Free of Charge on the Web........................................27
Contacting Technical Support.....................................................................27
Tell Us What You Think!..............................................................................28
New Layout Designer Window...................................................................30
New Concurrency Setting for Improved Processing...................................30
Use Your Microsoft Bing Maps License with MapInfo Professional............31
New Coordinate Systems and Projections.................................................31
New Option to Switch Cursor Styles...........................................................31
Feature Manipulation Engine (FME) 2014..................................................32
MapCAD Update........................................................................................33
Chapter 3: The Basics of MapInfo Professional.............................................35
Starting and Leaving MapInfo Professional.....................................................36
Starting MapInfo Professional....................................................................36
Exiting MapInfo Professional .....................................................................36
A Tour of the MapInfo Professional Desktop....................................................37
Working with Toolbars................................................................................37
Page 8

An Overview of the Toolbars.......................................................................37
Data - Where MapInfo Professional Begins......................................................41
What is a Database and Other Basic Terminology.....................................41
What Data Can I Use in MapInfo Professional?.........................................43
Support for Raster Images.........................................................................44
Understanding the Files Associated with MapInfo Professional
Tables.........................................................................................................44
Opening Your Data in MapInfo Professional..............................................45
MapInfo Professional Data File Support.....................................................45
Opening MapInfo Tables.............................................................................48
Opening Data in Remote Tables.................................................................50
Understanding Your Data in MapInfo Professional .........................................52
What is a Layer?.........................................................................................52
Map Objects as Part of Layers...................................................................53
Managing a Map's Layers..........................................................................53
Using Workspaces..............................................................................................54
Reviewing the Windows in MapInfo Professional............................................55
Displaying Data in a Map Window..............................................................56
Displaying Data in a Browser Window........................................................57
Changing a Record's Data, Font, and Style ..............................................62
Displaying Data in a Graph Window ..........................................................62
Displaying Data in a Layout Designer Window...........................................62
Displaying Data in a Layout Window .........................................................63
Other Windows for Displaying Data............................................................63
Working with Tables in the Table List................................................................64
Accessing the Table List.............................................................................64
About the Table List Window .....................................................................64
Selecting Multiple Tables in the Table List..................................................66
Dragging and Dropping in the Table List....................................................66
Sorting in the Table List..............................................................................66
Searching the Table List.............................................................................67
Working with Layers in the Layer Control........................................................67
Accessing Layer Control.............................................................................68
About the Layer Control Window................................................................68
Adding Layers to the Map...........................................................................71
Reordering Map Layers .............................................................................72
Setting the Zoom Layering.........................................................................72
Positioning and Sizing Labels ....................................................................73
Displaying the Lines, Nodes, and Centroids...............................................74
Understanding the Cosmetic Layer............................................................74
Making the Layers "Editable"......................................................................75
Making a Read-Only Table "Editable".........................................................75
Getting Layer Information ..........................................................................75
Selecting Objects in a Layer ......................................................................76
Working with Thematic Layers..........................................................................77
Ordering Thematic Layers..........................................................................77
MapInfo Professional 12.58
Page 9

Displaying Thematic Layers.......................................................................77
Converting Objects into Region Objects ....................................................78
Working with Raster and Grid Layers in Layer Control..............................78
Converting Grid Files to MapInfo Professional Grids (*.mig) .....................79
Working with Seamless Layers..........................................................................79
Features Available with Seamless Layers .................................................79
Working with MapInfo Manager Library Services............................................83
Add to Library.............................................................................................83
Saving, Closing, and Exporting Your Work......................................................84
Saving a MapInfo Workspace.....................................................................84
Exporting to GeoTIFF (*.tif) Format ...........................................................84
Saving a Table or a Copy of a Table...........................................................85
Closing a Table ..........................................................................................86
Opening vs. Importing ...............................................................................86
Exporting Your Data to a New Format........................................................87
Importing and Exporting Data in AutoCAD Format ....................................87
Cropping Images .......................................................................................87
Exporting to ASCII Format .........................................................................88
Exporting to dBase (*.DBF) Format ...........................................................88
Smoothing Map Images during Export.......................................................88
Using the Tools in the Tool Manager.................................................................89
Chapter 4: Configuring MapInfo Professional Preferences..........................91
Summary of Preferences....................................................................................92
Setting Your Preferences....................................................................................92
Setting Your System Preferences......................................................................93
Setting Your Default Units...........................................................................94
Setting Your Undo Options.........................................................................94
Setting Your Color Defaults........................................................................95
Setting Show Guides when Docking Windows...........................................95
Setting Your Date Window for Two-Digit Years..........................................95
Setting Your Copy to Clipboard Preferences..............................................96
Setting Your Image Resolution for Exporting..............................................97
Setting how to Draw Symbols for MapInfo Professional 4.0 or Earlier.......97
Setting Your Vertical Mapper Grid File Display Preferences......................97
Setting Your Aspect Ratio Adjustment........................................................97
Setting Your Startup Preferences......................................................................98
Creating a Startup Workspace...................................................................99
Setting Your Database Connection Preferences........................................99
Setting Your Directory Preferences.................................................................100
Using Search Directories..........................................................................101
Setting the Web Services Preferences............................................................102
Setting the Proxy Server Preferences......................................................102
Setting the WFS Server Preferences.......................................................103
Setting the WMS Server Preferences.......................................................103
9MapInfo Professional User Guide
Page 10

Setting the Geocoding Server Preferences..............................................104
Setting the Routing Server Preferences...................................................105
Setting the Tile Server Preferences..........................................................105
Setting the Library Services Preferences.................................................106
Setting the Custom Proxy Server Preferences.........................................107
Setting up a Geocoding Server........................................................................107
Setting up a Routing Server.............................................................................109
Setting Your Performance Preferences...........................................................110
Setting Your Style Preferences........................................................................111
Setting Your Address Matching Preferences.................................................112
Setting Your Image Processing Preferences..................................................112
Setting Your Notification Preferences.............................................................113
Setting Your Map Window Preferences ..........................................................114
Setting Your Layout Window Preferences......................................................119
Setting Your Browser Window Preferences...................................................120
Changing the Browser Window Background Color..................................120
Setting Your Legend Designer Window Preferences.....................................120
Setting Your Printer Preferences.....................................................................122
Printing Caveats.......................................................................................123
Enabling or Disabling the Subdivided Printing Option..............................124
Setting Your Output Setting Preferences........................................................124
Understanding the Anti-Aliasing Export Preferences...............................127
Chapter 5: Understanding Your Data............................................................129
Working with MapInfo Tables...........................................................................130
Adding to a Table......................................................................................130
Updating a Table.......................................................................................131
Appending Rows to a Table......................................................................132
Appending One Table to Another.............................................................132
Parsing Data from One Column to Multiple Columns...............................132
Placing Graphic Information in Visible Columns.......................................135
Creating a New Table ..............................................................................136
Editing a Table's Structure .......................................................................137
Copying and Renaming a Table...............................................................138
Deleting a Table........................................................................................138
Packing a Table .......................................................................................138
Collecting Data into the Table using Update Column...............................139
Browsing a Table......................................................................................140
Creating a Report of your Data .......................................................................140
Opening an Existing Report ............................................................................141
Saving a Report ................................................................................................141
Chapter 6: Graphing Your Data......................................................................143
Selecting the Right Type of Graph ..................................................................144
Graphing Terms........................................................................................144
MapInfo Professional 12.510
Page 11

3D Graphs................................................................................................144
Area Graphs.............................................................................................145
Bar Graphs...............................................................................................145
Bubble Graphs..........................................................................................145
Column Graphs........................................................................................145
Histogram Graphs....................................................................................146
Line Graphs..............................................................................................146
Pie Graphs................................................................................................146
Scatter Graphs.........................................................................................146
Surface Graphs........................................................................................147
Graphing Your Data...........................................................................................147
Creating a Graph using the Graph Wizard...............................................147
Editing a Graph.........................................................................................148
Working with Multi-Table and Multi-Variable Graphs.....................................154
Exploding a Pie Graph..............................................................................154
3D Graphs - Using the 3D Viewing Angle................................................155
Selections in Graphs and Their Tables.....................................................158
Saving a Graph..................................................................................................159
Using Graph Templates....................................................................................159
Location Preferences................................................................................160
Saving a Graph Template.........................................................................160
Chapter 7: Working with Data in a DBMS.....................................................163
Getting Started..................................................................................................164
Overview of the DBMS Access Setup Process........................................164
Requirements...........................................................................................165
Creating a Data Source Connection ...............................................................165
Creating a Data Source Connection to SQL Server.................................166
Creating a Data Source Connection to PostGIS......................................169
Creating a Data Source Connection to Oracle.........................................171
Creating a Data Source Connection to Microsoft Access .......................172
Reconnecting to your Data Source after Startup...........................................172
Connecting and Opening a Table at the Same Time................................173
Connecting to Oracle after Re-Starting MapInfo Professional.................174
About Supported DBMS Data Types...............................................................175
SQL Server Data Support.........................................................................175
PostGIS Data Support..............................................................................175
Oracle Data Support.................................................................................176
Creating a Map Catalog in the DBMS to Work with Data...............................177
Before you Begin Creating a Map Catalog Table.....................................178
Creating a Map Catalog Table Using EasyLoader...................................178
Adding a Spatial Primary Key to a DBMS Table.............................................179
Making a DBMS Table Mappable to Display it on a Map................................181
Making a Table Mappable ........................................................................181
About Updating Data Bounds in the MapInfo_MapCatalog......................183
11MapInfo Professional User Guide
Page 12

Deciding to work with Linked or Live Access Tables....................................183
Comparing and Contrasting Live and Linked Access to a Table..............184
Opening a DBMS Table in MapInfo Professional...........................................185
Opening a DBMS Table............................................................................185
Creating a New DBMS Table ...................................................................187
Refreshing Live and Linked Remote Tables ............................................189
Unlinking a Table from a Remote Database ............................................189
Saving a DBMS Table ..............................................................................190
Conflict Resolution when Multiple Users Access a Remote Table ..........190
Disconnecting from a Remote Database..................................................192
Working with Styles in DBMS Tables........................................................192
Working with Remote Tables from Specific Databases.................................193
Working with SQL Server Tables..............................................................193
Working with SQL Server with SpatialWare Tables..................................194
Working with PostGIS Tables...................................................................194
Working with Oracle Spatial Tables..........................................................195
Chapter 8: Drawing and Editing Objects.......................................................201
Understanding the Drawing and Editing Tools..............................................202
Using the Drawing and Editing Commands..............................................202
Adding Nodes to an Object (Overlay Nodes Command)..........................203
Drawing Objects................................................................................................203
Specifying an Object's Spatial Attributes .................................................203
Reverting to a Previous Version ..............................................................204
Using the Ruler Window as You Draw......................................................204
Object Styles............................................................................................205
Printing Fill Patterns.................................................................................205
Drawing Polygons and Polylines.....................................................................205
Converting a Polyline to a Region............................................................207
Converting Objects into Polyline Objects ................................................207
Drawing Symbols..............................................................................................208
Changing a Symbol Style on a Map.........................................................208
Supported Fonts for Symbols...................................................................208
Working with Custom Symbols.................................................................209
Working with Text on the Map .........................................................................210
Editing Objects.........................................................................................211
Positioning and Sizing your Map Objects.................................................211
Changing your Map Object Attributes.......................................................214
Reshaping Map Objects...........................................................................215
Using "Snap To" to Select Nodes and Centroids......................................216
Setting Snap Preferences for a Visible Snap Area...................................217
Autotracing Objects..................................................................................218
Smoothing and Unsmoothing Lines..........................................................219
Converting Regions to Polylines...............................................................219
Merging One Map into Another ...............................................................219
MapInfo Professional 12.512
Page 13

Chapter 9: Selecting and Querying Data.......................................................223
Selecting Your Data in MapInfo Professional.................................................224
Characteristics of Selections....................................................................225
Selecting from the Screen........................................................................226
Selecting Tools.........................................................................................227
Unselecting Objects or Records...............................................................230
Querying Your Data in MapInfo Professional.................................................231
Selecting and Using Queries....................................................................231
Making Queries using the Select Command ...........................................234
Making Queries using the SQL Select Command ...................................234
Displaying Query Results Quickly............................................................235
Creating Query Expressions.....................................................................236
Using Select to Create Queries................................................................238
Interactively Selecting Objects.................................................................239
Using SQL Select to Query Data..............................................................240
Saving Queries.........................................................................................243
Using Date- and Time-Based Data in Maps and Queries .......................244
Using Templates for Queries....................................................................250
Deriving Columns.....................................................................................250
Creating Column Aliases..........................................................................251
Aggregating Data......................................................................................251
Joining Tables Using SQL Select.............................................................253
Joining Tables Geographically (Using Geographic Operators) ...............254
Joining Two or More Tables .....................................................................255
Finding Duplicate Values in a Column......................................................256
Calculating the Distance to a Fixed Point.................................................257
Chapter 10: Creating Thematic and Other Themed Maps...........................259
MapInfo Professional in Action........................................................................260
Using Thematic Mapping to Analyze Information..........................................260
Planning Your Thematic Map....................................................................261
Methods of Thematic Mapping.................................................................262
Types of Thematic Maps .........................................................................263
Ranged Maps ..........................................................................................264
Bar Chart Maps .......................................................................................266
Pie Chart Maps ........................................................................................267
Graduated Symbol Maps .........................................................................268
Dot Density Maps ....................................................................................269
Individual Value Maps ..............................................................................271
Grid Surface Maps ...................................................................................272
Creating a Thematic Map..................................................................................273
Step 1 - Choosing a Type of Thematic Template......................................273
Step 2 - Choosing Thematic Values.........................................................274
Step 3 - Customizing Your Thematic Map................................................275
13MapInfo Professional User Guide
Page 14

Working with a Thematic Map Legend.....................................................277
Thematic Maps as Layers .......................................................................277
Changing the Display Parameters of a Map ..................................................278
Modifying a Thematic Map.......................................................................278
Using the Theme Templates.....................................................................278
Saving Your Thematic Settings.................................................................279
Updating Columns using Thematic Mapping.................................................280
Adding Temporary Columns.....................................................................285
Working with Grid Surface Maps.....................................................................286
Working with Grid Handlers......................................................................287
Chapter 11: Buffering and Working with Objects.........................................289
Buffering Your Data...........................................................................................290
Understanding Buffers..............................................................................290
Creating a Buffer .....................................................................................290
Buffer Methods.........................................................................................293
Types of Buffers........................................................................................293
Editing Objects using the Set Target Model...................................................295
Aggregating and Disaggregating Data.....................................................297
Clipping a Region of a Map .....................................................................298
Overview of Combining Map Objects ......................................................298
Clearing a Target .....................................................................................300
Splitting Objects .......................................................................................301
Creating Territories by Combining Objects....................................................301
Combining Selected Objects....................................................................302
Combining Objects Using Column ...........................................................302
Creating a Voronoi Polygon .....................................................................303
Grouping Objects using Multipoint and Collection Object Types..............304
Creating and Manipulating Objects.................................................................304
Chapter 12: Stylizing Your Map for Presentations and Publishing............305
Changing a Map's Style....................................................................................306
Changing a Region's Style ......................................................................306
Changing a Line's Style ...........................................................................307
Changing a Symbol's Style.......................................................................308
Changing the Text Style............................................................................309
Labeling Your Map.............................................................................................310
About Labeling..........................................................................................310
Choosing the Label Content.....................................................................311
Using AutoLabeling..................................................................................312
About Customizing Layer Properties........................................................313
Creating Callouts .....................................................................................316
Label Styles..............................................................................................317
Labeling Interactively................................................................................318
Using Text Objects as Labels...................................................................318
MapInfo Professional 12.514
Page 15

Saving Labels...........................................................................................319
Adding an Adornment to the Map....................................................................319
Adding a Scale Bar to Represent Map Scale...........................................320
Working with Layouts.......................................................................................320
Opening a Layout Designer Window .......................................................321
Adding a Map to the Layout Designer Window........................................321
Adding a Map Legend to the Layout Designer window..........................323
Adding a Thematic Map to the Layout Designer Window........................324
Adding a Table (Browser) to the Layout Designer Window......................324
Adding an Image to the Layout Designer Window...................................325
Adding Text to the Layout Designer Window............................................326
Adding Shapes to the Layout Designer Window......................................327
Saving a Layout in the Layout Designer Window.....................................328
Deleting a Frame from the Layout Designer Window...............................328
Moving Frames.........................................................................................328
Resizing Frames.......................................................................................329
Aligning Frames in the Layout Designer Window.....................................329
Editing in the Layout Designer Window....................................................330
Printing Your Layout.................................................................................331
Exporting Your Layout..............................................................................332
Working with the Classic Layout Window......................................................333
What is a Layout Window?.......................................................................333
Working in the Layout Window.................................................................334
Before You Create a Layout.....................................................................335
Creating a Layout Window ......................................................................337
Using Map Legends in a Layout...............................................................340
Moving Frames in a Layout Window........................................................340
Aligning Objects in a Layout Window.......................................................340
Creating Drop Shadows for Layout Objects.............................................341
Setting the Map Scale for a Layout Window.............................................341
Cloning a Map View..................................................................................342
Creating a Legend for your Map......................................................................342
What is a Legend?....................................................................................342
Creating a Map Legend............................................................................343
About the Legend Designer Window........................................................344
Printing and Exporting Your Results...............................................................346
Printing Your Project.................................................................................346
Exporting a Layout....................................................................................348
Save Window As Supports Raster Formats.............................................348
Chapter 13: Registering Raster Images........................................................351
Working with Raster Images............................................................................352
Determining Map Coordinates .................................................................352
An Introduction to Raster Image Registration...........................................352
Understanding Raster Images in MapInfo Professional...........................353
15MapInfo Professional User Guide
Page 16

Raster Image Format Details....................................................................353
Opening a Raster Image...................................................................................354
Registering the Coordinates of a Raster Image.......................................355
Reprojecting a Raster Map.......................................................................355
Transferring Vector Map Coordinates Directly to a Raster Map...............356
Modifying Control Points for Raster Images.............................................357
Adjusting the Contrast or Brightness of a Raster Image .........................358
Adjusting the Translucency of a Raster Image.........................................358
Printing/Exporting Translucent Raster Images..............................................359
Chapter 14: Putting Your Data on the Map...................................................361
How Do I Get My Data on the Map?.................................................................362
Creating a MapInfo .tab File of Your Data................................................362
When Do I Geocode vs. Create Points?...................................................362
Displaying DBMS and Web Service Data.................................................363
Displaying your Excel (.XLS or .XLSX) Data ..................................................363
Displaying your Access (.MDB or .ACCDB) Data ..........................................364
Displaying your SQLite Data............................................................................365
Opening SQLite Tables.............................................................................366
Displaying your Comma Delimited CSV Data.................................................366
Opening Comma Delimited CSV Files in MapInfo Professional...............367
Exporting to Comma Delimited CSV Format ...........................................367
Displaying your dBase Data ............................................................................367
Displaying your Lotus 1-2-3 Data....................................................................368
Displaying your ESRI Shapefile Data .............................................................368
Registering and Displaying your ASCII Data .................................................370
Importing and Displaying GML File Data .......................................................370
Importing and Displaying GML 2.1 Files...................................................370
Using Universal Data Directly..........................................................................371
Opening Universal Data Directly..............................................................371
Working with the FME Suite.....................................................................373
Understanding MapInfo Professional's Use of the Topography Layer......373
Opening MapInfo Professional Grid Files ......................................................374
Importing Graphic Files ...................................................................................374
Geocoding - Assigning Coordinates to Records ..........................................374
What Do I Need to Know Before Geocoding?..........................................375
Understanding the Geocoding Process....................................................375
Modes of Geocoding................................................................................376
Methods of Geocoding.............................................................................376
Refining Your Geocoding Search ............................................................377
Finding an Exact Street Match.................................................................377
Placing Geocoded Points.........................................................................379
Matching Street Names............................................................................379
Matching Address Numbers.....................................................................380
Matching to Region...................................................................................380
MapInfo Professional 12.516
Page 17

Selecting Records Not Geocoded............................................................382
Locating Newly Geocoded Points.............................................................382
Result Codes............................................................................................383
Ungeocoding a Table ...............................................................................383
Putting Latitude/Longitude Coordinates on a Map .......................................384
Dispersing Points Located in the Same Place..........................................384
Creating Points for Intersections..............................................................384
Geocoding Data using a Server...............................................................384
Displaying Your Data on the Map....................................................................385
Finding Data on your Map........................................................................385
Viewing a List of Open Tables..................................................................386
Displaying Data Details using the Statistics Window ..............................386
Printing Your Results........................................................................................387
Setting up the Page..................................................................................387
Printing Your Map ....................................................................................388
Viewing and Printing Text ........................................................................388
Troubleshooting Print Problems...............................................................389
Chapter 15: Working with Coordinate Systems and Projections...............391
Working with Coordinate Systems..................................................................392
Displaying Coordinates ............................................................................392
Elements of a Coordinate System............................................................392
Understanding Coordinate Systems.........................................................393
Building Blocks of a Coordinate System........................................................397
Coordinate Systems, Projections, and their Parameters..........................397
Projection Types.......................................................................................397
Datums ....................................................................................................399
Units.........................................................................................................400
Coordinate System Origin........................................................................400
Standard Parallels (Conic Projections).....................................................400
Oblique Azimuth (Hotine Oblique Mercator).............................................400
Scale Factor (Transverse Mercator).........................................................400
False Easting and False Northing............................................................401
Range (Azimuthal Projections).................................................................401
About Polyconic Coordinate Systems......................................................401
Examples of Projection Entries in the MAPINFOW.PRJ File...................401
Adding Projections to the MAPINFOW.PRJ File.............................................402
Using the New Projection in a Coordinate System...................................403
Entering a New Coordinate System (Example)........................................404
Understanding Precision in MapInfo Professional........................................404
What is Precision?....................................................................................405
Understanding Affine Transformations...........................................................405
Description of an Affine Transformation...................................................405
Using Earth and Non-Earth Maps....................................................................407
Specifying Coordinates for a Non-Earth Map ..........................................407
17MapInfo Professional User Guide
Page 18

Chapter 16: Working with Data from a Web Service....................................409
Introduction to Web Services...........................................................................410
Accessing Web Services in MapInfo Professional ..................................410
Web Service Authentication.....................................................................410
Enhancing Map Data using a Web Map Service (WMS).................................412
How Does MapInfo Professional Use WMS Servers?.............................412
Supported Image Formats for WMS ........................................................412
Understanding WMS Error Messages......................................................413
Enhancing Map Data using a Web Feature Service (WFS)............................414
WFS Server Requirements.......................................................................415
Geocoding using a Geocoding Server............................................................417
What Are MapMarker and Envinsa Geocoding Services?.......................418
Geocoding a Single Address using a Geocoding Service........................419
Understanding the Geocoding Result Codes...........................................419
Creating Routing Distance and Time Buffers.................................................420
How are Time and Distance Buffers Calculated?.....................................421
Using Driving Region Buffers to Display Data..........................................422
Creating Time or Distance Buffers for Objects.........................................422
Enhancing Map Data using a Mapping Tile Server........................................422
Tile Server Authentication.........................................................................423
Adding a Tile Server Layer to your Map...................................................423
Adding a Layer to your Map from a Map Tile Server................................424
Working with Tile Servers.........................................................................426
Changing the Map Zoom to the Nearest Tile Server Level......................427
Setting Tile Server Layer Properties.........................................................427
Chapter 17: Specialized Topics in MapInfo Professional............................429
Embedding MapInfo Professional Maps.........................................................430
What You Should Know First....................................................................430
Menus and Commands Available While Using the MapInfo Map............430
Limitations of OLE....................................................................................431
Working with Embedded Maps.................................................................431
Sharing Documents with Embedded Maps..............................................431
Using MapInfo Tables with Data Map.......................................................432
Internet Connectivity and MapInfo Professional............................................432
What Are Active Objects?.........................................................................432
HTML Landing Pages...............................................................................433
Redistricting-Grouping Map Objects into Districts........................................433
What is Redistricting and How Can I Use It? ...........................................434
Using the Districts Browser......................................................................435
Using Redistricting....................................................................................436
Options in Redistricting.............................................................................436
Creating Expressions.......................................................................................437
Where Expressions Can Be Used ...........................................................437
MapInfo Professional 12.518
Page 19

Constructing Simple Expressions.............................................................438
Constructing Complex Expressions..........................................................439
Entering Specific Values (Constants) into Expressions ...........................439
Using Mathematical Operators in Expressions ........................................440
Using String Operators in Expressions ....................................................440
Using Comparison Operators in Expressions ..........................................441
Using Geographic Operators in Expressions...........................................443
Using Logical Operators in Expressions ..................................................444
Understanding Operator Precedence ......................................................445
Using Functions in Expressions...............................................................446
Working with the MapBasic Window...............................................................446
Accessing the MapBasic Window.............................................................447
Running a MapBasic Program .................................................................447
Appendix A: Keyboard Shortcuts..................................................................449
Shortcuts for File Menu Items..........................................................................450
Shortcuts for Edit Menu Items.........................................................................450
Shortcut to Tools Menu Items..........................................................................450
Shortcuts to Objects Menu Items....................................................................451
Shortcuts for Query Menu Items......................................................................451
Shortcuts for Options Menu Items..................................................................451
Shortcuts for Map Menu Items.........................................................................451
Shortcuts for Window Menu Items..................................................................452
Shortcuts by Keystroke....................................................................................452
Shortcuts for the Map or Layout Window.......................................................454
When the Map or Classic Layout is Active...............................................454
While Drawing a Polyline or Polygon........................................................455
When Selecting One or More Objects from the Editable Layer or Classic
Layout.......................................................................................................455
Shortcuts for the Browser Window.................................................................456
When the Browser is Active......................................................................456
When Navigating between Cells in the Browser Window.........................456
When Editing Text within the Browser Window........................................457
Shortcuts for the Legend Designer Window..................................................459
When the Legend Designer Window is Active..........................................459
When Selecting One or More Frames in a Legend Designer Window.....460
When Repositioning Legend Frames in the Legend Designer
Window.....................................................................................................460
Shortcuts for MapInfo Professional................................................................461
Appendix B: Elements of a Coordinate System...........................................463
Projections and Their Parameters...................................................................464
Projection Types List................................................................................468
Projection Datums....................................................................................470
Units ........................................................................................................478
19MapInfo Professional User Guide
Page 20

Coordinate System Origin........................................................................479
Standard Parallels (Conic Projections).....................................................479
Oblique Azimuth (Hotine Oblique Mercator).............................................479
Scale Factor (Transverse Mercator).........................................................479
False Northings and False Eastings.........................................................480
Range (Azimuthal Projections).................................................................480
Polyconic Projection.................................................................................480
Equidistant Cylindrical Projection.............................................................480
For More Information on Projections..............................................................481
Contact Information..................................................................................481
Appendix C: Manually Creating a MapInfo_MapCatalog.............................483
Manually Creating a MapInfo_MapCatalog.....................................................484
Manually Making a Remote Table Mappable...................................................485
Appendix D: MapInfo Map Interchange Format............................................487
File Versions and TAB, MIF/MID, and WOR Support......................................488
CharSet....................................................................................................496
Delimiter...................................................................................................497
Unique .....................................................................................................497
Index.........................................................................................................497
CoordSys Clause......................................................................................497
Transform Clause.....................................................................................498
Columns...................................................................................................499
Appendix E: Glossary of Terms.....................................................................501
Glossary of Terms.............................................................................................502
MapInfo Professional 12.520
Page 21

Introduction
Welcome to the Pitney Bowes Software Inc. family of products. As the field of
computer mapping continues to expand, Pitney Bowes Software Inc. leads the
way with new products that are designed to fulfill users' computer mapping needs
from the most basic to the most specialized with MapMarker, our premier address
matching product.
MapInfo Professional is a comprehensive computer mapping tool that enables
you to perform complex geographic analysis such as redistricting, accessing your
remote data, dragging and dropping map objects into your applications, creating
thematic maps that emphasize patterns in your data, and much more.
This guide contains all of the information you need to learn about and be productive
using MapInfo Professional.
1
In this section:
• What is MapInfo Professional? . . . . . . . . . . . . . . . . . . . . .22
• Getting Started . . . . . . . . . . . . . . . . . . . . . . . . . . . . . . . . . .24
• Getting Support . . . . . . . . . . . . . . . . . . . . . . . . . . . . . . . . . .26
• Getting Technical Support . . . . . . . . . . . . . . . . . . . . . . . .27
Page 22
What is MapInfo Professional?
What is MapInfo Professional?
With MapInfo Professional, the power of computer mapping is at your complete disposal. You can display
your data as points, as thematically shaded regions, as pie or bar charts, as districts, etc. You can perform
geographic operations such as redistricting, combining and splitting objects, and buffering. You can also
make queries against your data and access your remote data directly from MapInfo Professional.
For example, MapInfo Professional can show which branch store is the closest to your biggest customers.
It can calculate the distances between customers and stores; it can show you the customers who spent
the most last year; it can color-code the store symbols by sales volume. What makes it all come together
is a visual display of your data on the map.
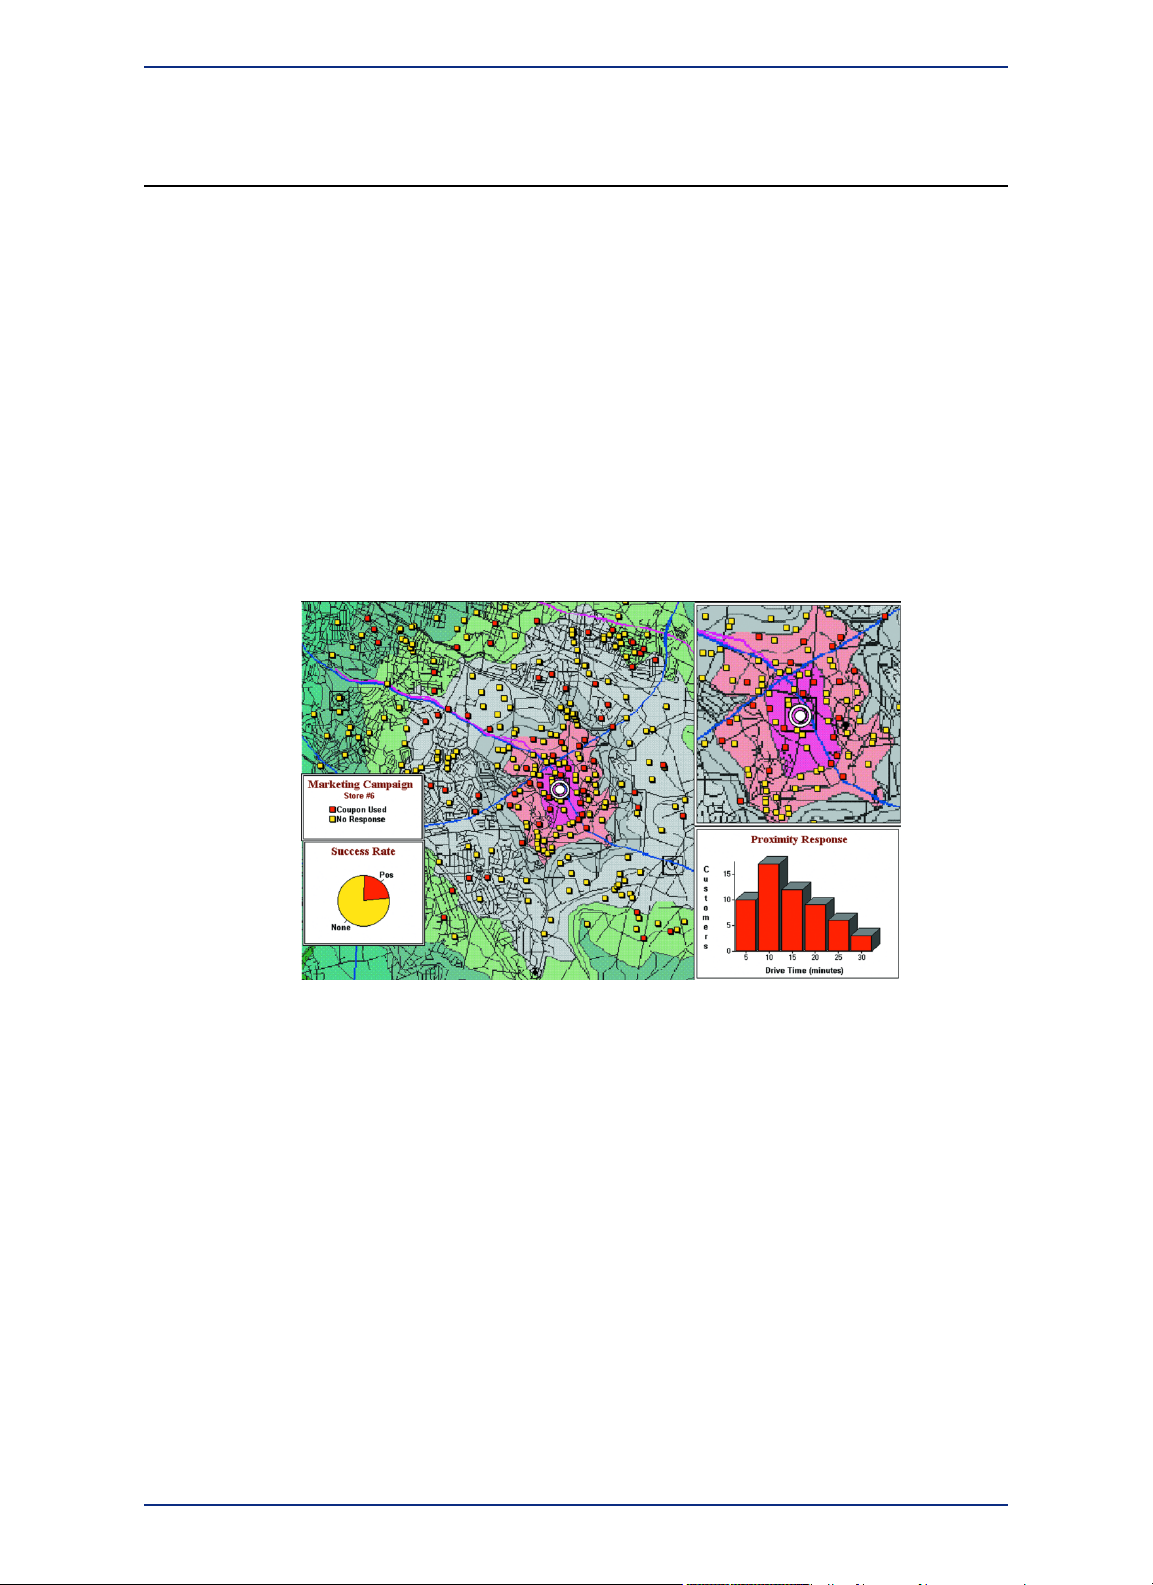
Mapping at a Glance
Huge quantities of information are available today, far more than ever before. Data abounds in
spreadsheets, sales records, and marketing files. Paper and disk store masses of information on
customers, stores, personnel, equipment, and resources. Thematic maps and graphs show distribution
of customers for a marketing campaign.
Figure 1: Thematic Map Example
Nearly all data has a geographic component. An estimated 85 percent of all databases contain some
sort of geographic information such as street addresses, cities, states, postal codes, or even telephone
numbers with area codes and exchange numbers.
Computer mapping can help you sort through all of this information, and using the geographic components
in your data, display your results on a map. This lets you see patterns and relationships in the mass of
information quickly and easily without having to pore over your database.
Using Your Own Data
To begin with, you can use the data you already have, in the form it is already in - spreadsheets such
as Excel, databases such as Access, popular CAD packages, and other GIS applications, to name just
a few. If your data is on a remote database, you can access it directly from MapInfo Professional. If you
have data that is not already online, you can create database files right inside the product, or use data
supplied by Pitney Bowes Software Inc. - such as census data.
Similarly, you can use any of thousands of maps available from Pitney Bowes Software Inc., everything
from street and highway maps to world maps. You can also create your own maps, either in MapInfo
Professional or with a drawing package. You can diagram anything - floor plans, flow charts, even brain
anatomy - can be treated as a map and entered into the product.
MapInfo Professional 12.522
Page 23

Chapter 1: Introduction
After you have organized your data visually, you will save the results to files, or send them to any of the
dozens of printers and plotters MapInfo Professional recognizes.
If you have your data on hand and you can read a map, you are just about ready to begin. Soon, we will
show you an example of how easy it is to put MapInfo Professional's power to work for you.
But first, install MapInfo Professional following the instructions in the MapInfo Professional Install Guide.
If you are new to the product, or new to computer mapping, we suggest you refer to The Basics of
MapInfo Professional for an overview of basic mapping terms and concepts. Use the web-enabled
tutorial to learn about its features, and become accustomed to the more common tasks and functions.
For more product and service information, you can connect directly from MapInfo Professional to our
forum (on the Help menu, point to MapInfo on the Web), or consult our World Wide Web site
(www.mapinfo.com).
Reviewing the MapInfo Professional Features
MapInfo Professional gives you the processing power of databases (including powerful SQL queries)
and the visual power of maps, plus charts and graphs. It is an essential business tool for data analysis,
sales, and presentations.
Here is a look at some of the features MapInfo Professional offers:
• Direct opening of files created with dBASE or FoxBASE, delimited ASCII, comma delimited CSV files,
ESRI shapefiles, Lotus 1-2-3, Microsoft Excel, and Microsoft Access; importing of graphics files in a
variety of formats; a function for creating database files from within the product.
• Multiple views of your data in Map, Browser, and Graph windows. Hot Views allow you to open multiple
views of the same data and update them when you change any one view.
• Live ODBC access to remote database data, such to SQL Server.
• Seamless map layers that allow you to handle several map layers as if they were one layer.
• Legend Designer window, enabling you to create and customize legends for any map layer.
• Thematic maps to create analyses of your data with high visual impact, including grid surface themes,
3DMaps, and Prism maps.
• Use raster underlay capabilities to enhance your work session.
• Querying capabilities ranging from simple data selections from a single file to complex SQL queries
from one or more files.
• Workspaces that save all your settings and views so you can start where you left off.
• HotLinks that let you launch files or URLs directly from a Map window.
• OLE embedding of Map windows into other applications.
• A comprehensive array of drawing and editing tools for customizing your maps.
• Thousands of ready-made maps and functions for creating your own maps.
• Crystal Reports, the industry-standard report-writing program, allows you to create reports of your
tabular data directly in the product.
• A layout window for preparing output.
• Printing and export capabilities for high-quality output
• The ability to change the projection of your map for display or digitizing.
• Object processing functions that help to correct errors in data, set node snap tolerances for different
objects, as well as thin nodes and polygons.
When it is time to run MapInfo Professional, you will feel right at home with its windowing environment.
After you have organized your data visually, you will save the results to files, or send them to your printer
or plotter.
For tips to help you succeed in using MapInfo Professional, see Ensuring Your Success in the Help
System.
23MapInfo Professional User Guide
Page 24
Getting Started
Accessing Your Documentation
MapInfo Professional Documentation Set
The MapInfo Professional User Guide contains a subset of the information found in the MapInfo
Professional Online Help system. If you cannot find the information you are looking for, refer to the Online
Help system, which is installed with the product.
Accessing MapInfo Professional Documentation
You can access the MapInfo Professional files in the Documentationsubfolder located in your installation
directory. You can read these files using Adobe Acrobat Reader, which is available on the installation
DVD or by going to the Adobe web site:
http://get.adobe.com/reader
Getting Started
This section describes that a map is the visual representation of data files where each data file displays
as a layer on the map.
MapInfo Professional helps you analyze your data on a map for activities such as appraisal, conservation,
forecasting, planning, surveying, demarcating, tracking, or managing. You can tailor maps to your specific
uses for analysis.
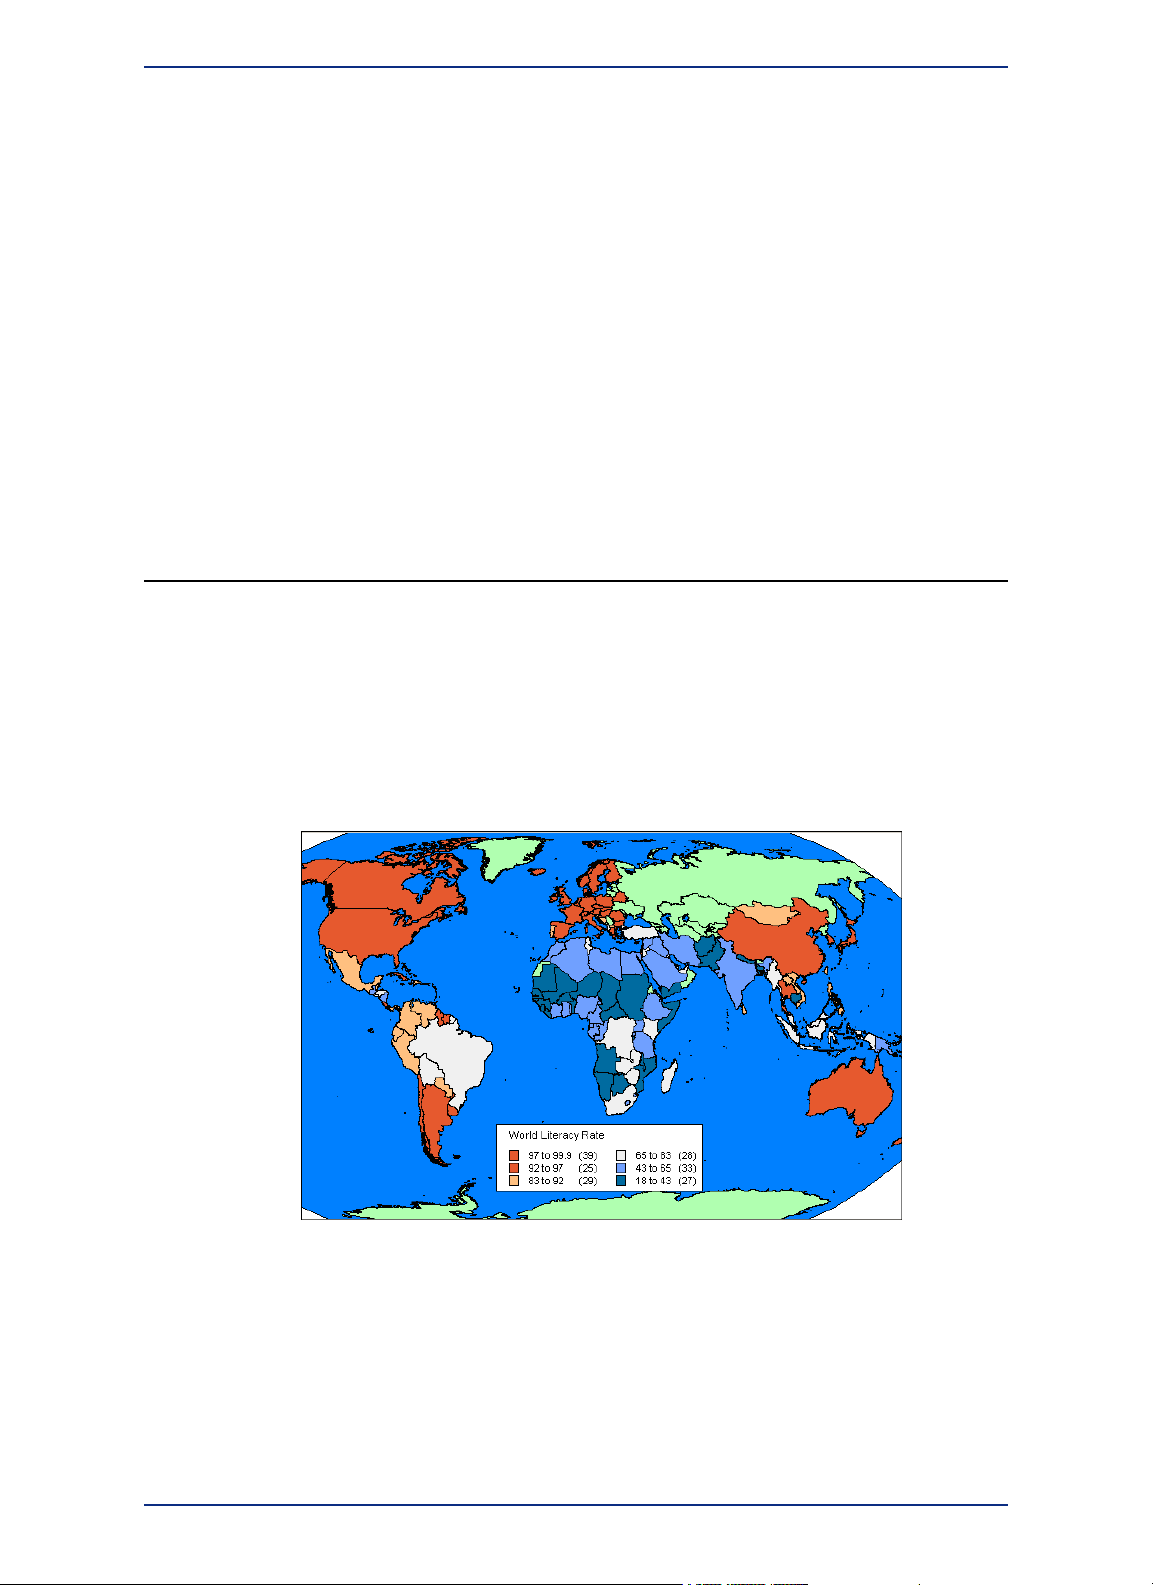
A map is a visual representation of data that has location. MapInfo Professional displays data on the
Earth, such as country boundaries, but can also display data that is relative to itself, such as a building
floor plan. Seeing data visually on a map gives you the locations of where things are, the relative
importance of things through the use of symbols or colors, and the relationships between locations.
Figure 2: World map showing relative literacy rates where each color represents a range of
average values.
Data must be in the form of tables. MapInfo Professional displays data tables as layers on a map. Each
table is a single layer and a map may have many layers (tables) on display. For more information about
how MapInfo Professional represents data on a map, see What is a Layer?.
A data table organizes information by rows and columns, so that you can easily visualize and manage
information in a database, such as SQL Server, or in data management software, such as Microsoft
Excel. MapInfo Professional access data tables in a database directly or lets you import data tables to
work with them directly in MapInfo Professional's native .TAB format.
MapInfo Professional 12.524
Page 25
Chapter 1: Introduction
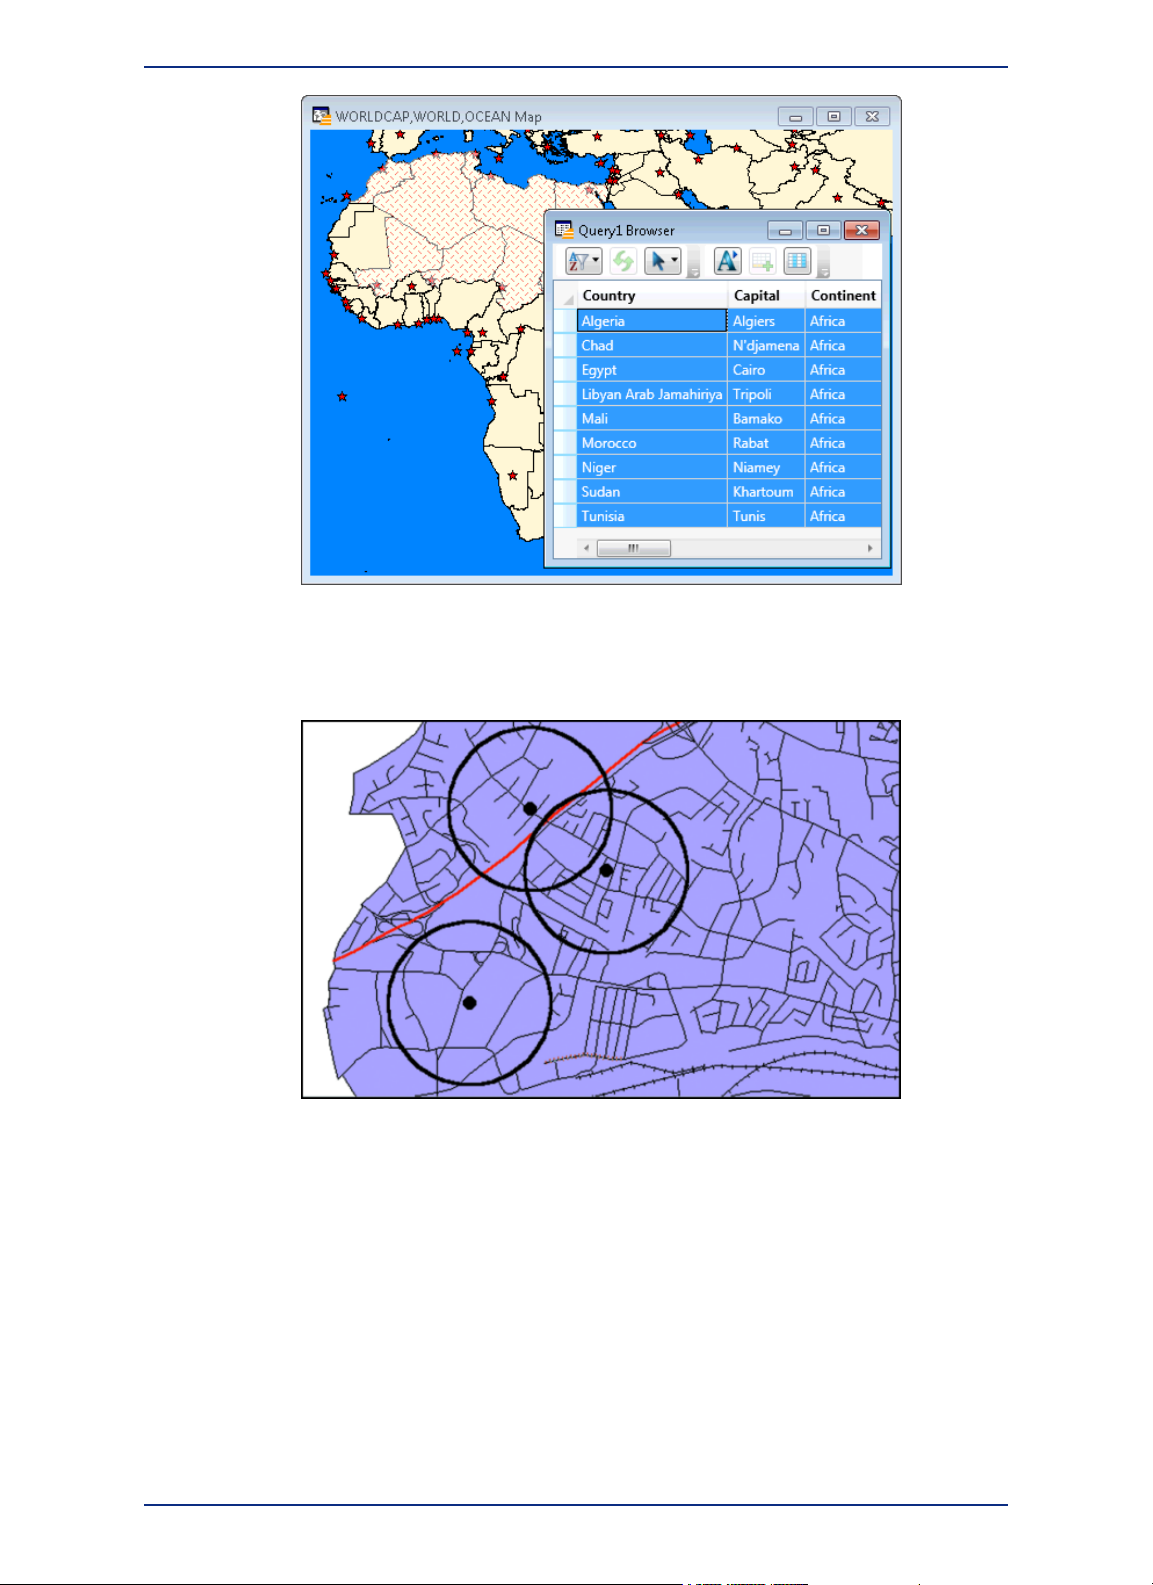
Figure 3: Map displaying three layers: capitol cities, country boundaries, and ocean layers. A
Query Browser window displays a table with the results of a simple selection.
Data is represented on a map as an object, such as a point to mark a location, a polygon to mark the
boundaries of a region, or a line to mark a route.
Figure 4: A simple map showing store locations as points, circles as sales territories, and lines
as roads and railways.
For more information about:
• Data, see Data - Where MapInfo Professional Begins.
• Map objects, see Map Objects as Part of Layers.
In MapInfo Professional you begin by opening your table of data and displaying it in a Map window. Each
table you open displays as a separate layer. Before you launch Mapinfo Professional, you will need to
know where your data tables are located or you will need to set up access to your remote data source,
which is described in Working with Data in a DBMS.
To help you visualize your data and give it context, open a few of the sample data tables that come with
MapInfo Professional, such as country and county boundaries, roadways, or city locations. If you have
not already done so, install the sample data from the MapInfo Professional DVD. For instructions on
how to do this, refer to the MapInfo Professional Install Guide.
25MapInfo Professional User Guide
Page 26

Getting Support
You are then ready to launch MapInfo Professional as described under Starting and Leaving MapInfo
Professional.
There is a lot of information under A Tour of the MapInfo Professional Desktop that describes how
to work with MapInfo Professional. Review this section and the other sections in The Basics of MapInfo
Professional to learn how to work with this product.
For more information about working with data, see:
• Understanding Your Data
• Putting Your Data on the Map in the Help System
• Working with Data in a DBMS
Getting Support
Here at Pitney Bowes Software Inc., we are committed to your success and we provide a wide range of
support to assist you in getting the results you are working toward.
Using the Status Bar
The Status Bar along the lower edge of your window provides helpful information during your mapping
session and allows you to make some changes directly in the Status Bar. To control the display of the
Status Bar, on the Options menu point to Show/Hide Status Bar.
Not all entries display in the Status Bar at all times. Entries display when a feature is active.Note:
• Status Bar Help: To find out what a command does, move the cursor over the command. A brief
description of the command displays in the left pane of the Status Bar along the lower edge of your
screen.
• Zoom, Map Scale, Cursor Location: View any one of these settings in the Status Bar. You can
change which one displays directly from the Status Bar. Click the arrow on the right side of the box to
display a popup list of the three options. Click the setting you want to display. The Status Bar
automatically updates. These display settings are also controlled in the Map Options dialog box (on
the Map menu, point to Options).
• Editable Layers: To keep track of which layer is currently editable, review the list of layers that display
in the Status Bar. You can change the editable layer directly in the Status Bar. Click the arrow to the
right of the box to display a popup list of the layers in the Map window. Click the layer you want to
make editable. The Status Bar automatically updates, showing the new editable layer.
• Selectable Layers: The Status Bar indicates which layer the current selection is from. If there is
nothing selected, the Status Bar reads: Selecting: NONE.
• Browser window Records: When viewing a table in a Browser, the record count displays in the Status
Bar.
• Snap-to-Node: This S key toggle feature is in use when SNAP displays in the Status Bar.
• Autotrace indicator: This T key feature is in use when AUTOTRACE displays in the Status Bar.
• Autonode indicator: This N key feature is in use when AUTONODE displays in the Status Bar.
Using the Help System
MapInfo Professional's comprehensive Help System provides the information you need to learn and use
the product more effectively. You can reach the information in several ways:
• Use the Help System screen to choose topics from "books". Click a book to display its topics, choose
a topic from the list.
• Use the Search feature to search on a specific word. Type the word you want to search for in the first
field, select the matching word in the second, and then the topic in the third box. MapInfo Professional
displays the topic in the pane on the right.
MapInfo Professional 12.526
Page 27

Chapter 1: Introduction
• Use the Index feature to find a topic quickly. Type the first few letters of the word you are looking for.
The index entry that most closely matches your entry is highlighted. Click the index entry you want to
display.
• Use the Favorites tab to collect and store topics you want to refer to frequently.
• Context-Sensitive Feature: Press the F1 key to receive more information on any menu command or
dialog box. The Help window for that item displays.
• Quick Access to the publications web site: Click the underlined Pitney Bowes Software Inc. name at
the bottom of each topic page to go to the Pitney Bowes Software Inc. web site. From here you have
access to product information, upcoming events, tech tips, and a complete set of documentation.
MapBasic Available Free of Charge on the Web
The MapBasic development environment is a free download available from www.mapinfo.com. To get
your copy, go to www.mapinfo.com/mapbasic. There is also information there about building custom
applications and integrating MapInfo Professional into your application using the MapBasic development
environment. For additional SDK development environments, go to www.mapinfo.com/mapxtreme.
To obtain your free copy of MapBasic and access other resources to enhance your use of MapInfo
Professional, you need to register on the Pitney Bowes Software Inc. site before accessing this download
page.
Getting Technical Support
Pitney Bowes Software Inc. offers a free support period on all new software purchases and upgrades,
so you can be productive from the start. Once the free period ends, Pitney Bowes Software Inc. offers
a broad selection of extended support services for individual, business, and corporate users.
Technical Support is here to help you, and your call is important. This section lists the information you
need to provide when you call your local support center. It also explains some of the technical support
procedures so that you will know what to expect about the handling and resolution of your particular
issue.
Please remember to include your serial number, partner number or contract number when contacting
Technical Support.
Contacting Technical Support
Full technical support for MapInfo Professional is provided for the currently shipping version plus the two
previous versions.
To use Technical Support, you must register your product. This can be done very easily during installation
or anytime during normal business hours by contacting Customer Service directly.
Technical Support Contact Information
Extended support options are available at each of our technical support centers in the Americas,
Europe/Middle East/Africa, and Asia-Pacific regions.
To contact the office nearest you, on the Support menu point to Contact Support, or go to our website
at www.mapinfo.com/support.
Technical Support Online Case Management System
The Technical Support Online Case Management system is another way to log and manage cases with
our Technical Support center. You must register yourself the first time you access this site if you do not
already have a user ID.
http://go.pbinsight.com/online-case-management
27MapInfo Professional User Guide
Page 28

Getting Technical Support
Tell Us What You Think!
Want to give MapInfo Professional Engineers feedback? We have an option in the Help menu for
you to provide direct product feedback to Pitney Bowes Software Inc. If you have a need for a new
feature, or you need our product to do something it does not currently do, use this feature to write to us.
Whether you want to complain or complement, let us know so we can meet your MapInfo Professional
needs better.
To send us feedback:
• On the Help menu, point to Send Product Improvement Suggestions to open the customer feedback
form.
Our team of Product Managers and Engineers will collect your feedback and consider your request in a
future release of MapInfo Professional. You will be able to track the activity on your suggestions through
different statuses and maintain a list of your ideas or suggestions. Your suggestions will be grouped with
other similar ideas to help us build a list of new features and workflows for the application. You may be
invited to give your feedback on the scoping and implementation of these suggestions and participate
in surveys that help us narrow down the priority of the features we are working on.
Our goal is to ensure that MapInfo Professional stays on the forefront of your needs and product
requirements. Help us do that important work for you!
MapInfo Professional 12.528
Page 29

What's New in MapInfo Professional
Thank you for upgrading to the most advanced computer mapping product in the
Pitney Bowes Software Inc. software family! As the field of computer mapping
continues to expand, Pitney Bowes Software Inc. leads the way with new products
that are designed to fulfill your computer mapping needs from the most basic to
the most specialized.
For more information about the bug fixes and corrections we have made to MapInfo
Professional in this release, review the release notes at:
http://www.mapinfo.com/publications
2
In this section:
• New and Changed Features in MapInfo Professional . . .30
• Data Access Features . . . . . . . . . . . . . . . . . . . . . . . . . . . . .32
• Sample Data Enhancements . . . . . . . . . . . . . . . . . . . . . . .32
• New and Existing Tools . . . . . . . . . . . . . . . . . . . . . . . . . . .33
Page 30

New and Changed Features in MapInfo Professional
New and Changed Features in MapInfo Professional
You will notice the following licensing improvements:
• Overdraft licenses are now available if you purchased distributable licenses. Overdraft licenses ensure
that you do not have a service disruption if you lose a license during server migrations or failure. You
can overdraft up to 10% of the number of distributable licenses that you own, so if you own 50
distributable licenses you would have up to 5 overdraft licenses available.
• You can now repair up to 10% of the distributable licenses that you own. If you have 20 distributable
licenses as an example, then the License Server Utility will repair up to 2 broken licenses.
For details about these licensing improvements, see the License Server User Guide that installs with
the License Server software.
MapInfo Professional now works with Microsoft Office 2013. You can open and save your data to Office
2013 Excel and Access files, and embed maps into Office 2013 Word documents.
Searches in a Table List window are now more discrete, using all of the terms that you enter in the
search box instead of the entire phrase. A search will find any table alias that matches any of the terms
(separated by spaces) that you enter.
New Layout Designer Window
MapInfo Professional provides a new Layout Designer window that will eventually replace the classic
Layout window. You can continue creating your layouts in the classic Layout window for printing and
distributing maps, or take advantage of some of the enhanced features in the new Layout Designer
window.
The Layout Designer window contains a live map that you can edit, so that you do not need to toggle
between the layout and editing in the Map window. The Layout Designer window shows the map using
the printer resolution, so that you know beforehand what your printout will look like (you will know what
labels will be on the printed map). In contrast, the Map window shows maps using the screen resolution,
which is not an accurate representation of what the printed map would look like (labels in a Map window
may not be on the printed map). It also offers more advanced alignment tools for designing your layout
and lets you insert image files, such as a company logo, directly to the canvas.
For details and instructions on how to work with the Layout Designer window, see Working with
Layouts.
New Concurrency Setting for Improved Processing
MapInfo Professional provides a new concurrency setting to improve processing speed by running some
operations in parallel.
When processing objects, you can select how much of the operation to perform in parallel using more
than one CPU or processor core. When concurrency is set, MapInfo Professional divides the processing
to multiple cores that simultaneously perform the operation. This improves the processing time when
buffering an object in a table or selection, and with overlay operations (such as Split, Erase, Erase
Outside, Polyline Split, and Overlay Nodes).
By default, MapInfo Professional has full concurrency turned on, but you can select the level of
concurrency as a software preference:
• None – a single processor performs the operation. This option provides the least amount of processing
speed.
• Moderate – 25% of the processors on your system perform the operation.
• Intermediate – 50% of the processors on your system perform the operation.
• Aggressive – 75% of the processors on your system perform the operation.
• Full – all processors on your system perform the operation. This is the default setting MapInfo
Professional installs with.
MapInfo Professional 12.530
Page 31

Chapter 2: What's New in MapInfo Professional
For details on how to set the concurrency as a software preference, see Setting your Performance
Preferences.
Use Your Microsoft Bing Maps License with MapInfo Professional
MapInfo Professional now lets you use your own Microsoft Bing Maps license.
Purchasing a new MapInfo Professional license or upgrading an existing license provides access to
Microsoft Bing Maps, a web mapping service, for Bing Aerial and Bing Hybrid maps. These maps are
used by the Add Bing Roads to Map and the Move Map to features in MapInfo Professional. Access
to these maps is for a limited time (see the MapInfo Professional Install Guide for expiration dates). To
continue access after the expiration date, you must keep your MapInfo Professional license on
maintenance. This ensures that you can upgrade to the latest version of MapInfo Professional and
continue to use the Add Bing Roads to Map and the Move Map to features.
If you already have a license for Bing Maps that you purchased from Microsoft, then you can use your
license with MapInfo Professional.
To enter your license information in MapInfo Professional:
1. On the Help menu, point to Licensing and click Bing Key to open the Bing Key Credential dialog
box.
2. Type your license value in the Enter valid key field and click OK.
For more details, see Bing Licensing.
New Coordinate Systems and Projections
There are coordinate system additions or enhancements for:
• Adindan projections
• WA Project Grid
• Balkans coordinate systems
• Krovak coordinate systems
• Swiss coordinate systems bounded
There is a new EPSG code:
• "Longitude / Latitude (NOAA GCS_Sphere)", 1, 161 (this was added to MapInfo Professional 12.0.3)
There is a new PRJ code:
• 5514 – "S-JTSK (Krovak) Coordinate system - Updated"
For a detailed list of enhancements, see Coordinate System Enhancements by Version in the Help
System.
There are new datums in this version:
• #1025 HD72 (Hungarian Datum of 1972) – Updated parameters
• #1026 S-JSTK (Czech)
• #1025 JTSK03 (Slovak Republic)
For datum details, see Seven or Eight Parameter Datums in the Help System.
New Option to Switch Cursor Styles
When working in a Citrix XenApp environment, there may be a delay rendering the 32-bit per pixel cursor
in MapInfo Professional causing a performance issue. Switching to the 1-bit per pixel cursor corrects
this issue.
To switch to the 1-bit per pixel cursor:
1. On the Options menu, point to Preferences to open the Preferences dialog box.
31MapInfo Professional User Guide
Page 32

Data Access Features
2. Click System Settings to open the System Settings Preferences dialog box.
3. Clear the Enable True Color Cursors check box to use the 1-bit per pixel cursor, which displays in
black and white.
Selecting the check box enables the 32-bit per pixel cursor.
Data Access Features
MapInfo Professional now supports:
• Oracle Spatial 11g R2 and 12c R1
For details about working with databases, see Working with Data in a DBMS.
Feature Manipulation Engine (FME) 2014
MapInfo Professional installs with the Feature Manipulation Engine (FME) 2014, which lets you open
data directly to avoid having to translate it separately and work with copies of the data in .tab format.
This FME opens a variety of Universal Data formats including:
• Autodesk AutoCAD (*.DXF, *.DWG)
• Bentley MicroStation Design (V7) (*.POS, *.FC1, *.DGN)
• Bentley MicroStation Design (V8) (*.POS, *.FC1, *.DGN)
• ESRI ArcInfo Export (*.E00)
• ESRI ArcSDE
• ESRI Geodatabase (*.MDB)
• Google Earth (*KMZ, *KML)
• Spatial Data Transfer Standard (*.CATD.DDF)
• Vector Product Format (VPF) Coverage NIMA/NGA (*.FT)
• Geography Markup Language (*.GML). For deatils, see
http://fmepedia.safe.com/articles/How_To/Reading-XML-GML
• Esri Geodatabase (File Geodatabase API) Reader/Writer (*.GDB)
To access the FME and open universal data directly in MapInfo Professional; on the File menu, point
to Open Universal Data. For details, see Using Universal Data Directly
For details about all of the FME supported formats, see FME Readers and Writers (formats supported
by FME 2014) in the FME Desktop Help.
To see what is new in FME 2014, see http://fmepedia.safe.com/articles/FAQ/Whats-Great-2014
Sample Data Enhancements
See the MapInfo Professional Data Directory document on the MapInfo Professional DVD for a description
of the sample data supplied with this product.
MapInfo Professional 12.532
Page 33

Chapter 2: What's New in MapInfo Professional
New and Existing Tools
MapCAD Update
This release updates the MapCAD tool to a new version. This product provides tools that work with
MapInfo Professional to create maps that are appropriate for land development and surveying tasks.
this update was for continued compatibility with MapInfo Professional and includes no new functionality.
The MapCAD tool installs automatically with MapInfo Professional to a subfolder called MapCAD. To
access MapCAD drawing and editing tools and toolbars, on the MapInfo Professional Tools menu, point
to Tool Manager and then MapCAD. The manufacturer provides a full help system to assist you in using
this product. For support, contact MapCAD incorporated directly. Their web site is:
http://www.geoas.de
33MapInfo Professional User Guide
Page 34

Page 35

The Basics of MapInfo Professional
Now that you have installed MapInfo Professional, you are probably anxious to
get mapping. But, if you are new to MapInfo Professional, take a few minutes to
read this chapter to familiarize yourself with the concepts, components, and tools
for successful computer mapping.
In this section:
• Starting and Leaving MapInfo Professional . . . . . . . . . . .36
• A Tour of the MapInfo Professional Desktop . . . . . . . . . .37
• Data - Where MapInfo Professional Begins . . . . . . . . . . .41
• Understanding Your Data in MapInfo Professional . . . .52
• Using Workspaces . . . . . . . . . . . . . . . . . . . . . . . . . . . . . . .54
• Reviewing the Windows in MapInfo Professional . . . . . .55
• Working with Tables in the Table List . . . . . . . . . . . . . . . .64
• Working with Layers in the Layer Control . . . . . . . . . . . .67
• Working with Thematic Layers . . . . . . . . . . . . . . . . . . . . .77
• Working with Seamless Layers . . . . . . . . . . . . . . . . . . . . .79
• Working with MapInfo Manager Library Services . . . . . .83
• Saving, Closing, and Exporting Your Work . . . . . . . . . . .84
• Using the Tools in the Tool Manager . . . . . . . . . . . . . . . .89
3
Page 36

Starting and Leaving MapInfo Professional
Starting and Leaving MapInfo Professional
In this section we cover the very basics of starting MapInfo Professional, using the STARTUP.WOR,
and exiting the program. Since opening a table is basic to getting started in using MapInfo Professional,
we cover that topic here, as well.
Starting MapInfo Professional
The Quick Start dialog box opens every time you start MapInfo Professional, so that you can return to
the previous mapping session or start a new mapping session with different data.
To start MapInfo Professional:
1. Launch MapInfo Professional by doing one of the following:
• Double-click the MapInfo Professional icon on your desktop.
• On the Start menu, point to MapInfo Professional.
2. In the Quick Start dialog box, choose how you want to start your mapping session.
• If you are returning to MapInfo Professional, you can return to the previous mapping session by
choosing Restore Previous Session or Open Last Used Workspace.
• If this is your first look at MapInfo Professional, choose Open a Table to begin. This will open the
Open dialog box, where you can select a data table to open within a Map window or a data Browser
window in MapInfo Professional.
3. Click OK to proceed.
Note:
The Quick Start dialog box displays every time you start MapInfo Professional, but you can
change this behavior in the Startup preferences. On the Options menu, point to Preferences
and click Startup to open the Startup Preferences dialog box and clear the Display the Quick
Start Dialog check box. For details, see Setting the Startup Preferences in the MapInfo
Professional Help System.
Exiting MapInfo Professional
To leave MapInfo Professional, on the File menu, click Exit. There is no confirmation message.
Note:
• For more information, see Leaving MapInfo Professional using the MAPINFOW.WOR Workspace in
If you made changes to a table and did not save them a prompt appears asking you if you want
to save the changes. Unless you choose Save, the changes are lost.
the Help System.
MapInfo Professional 12.536
Page 37
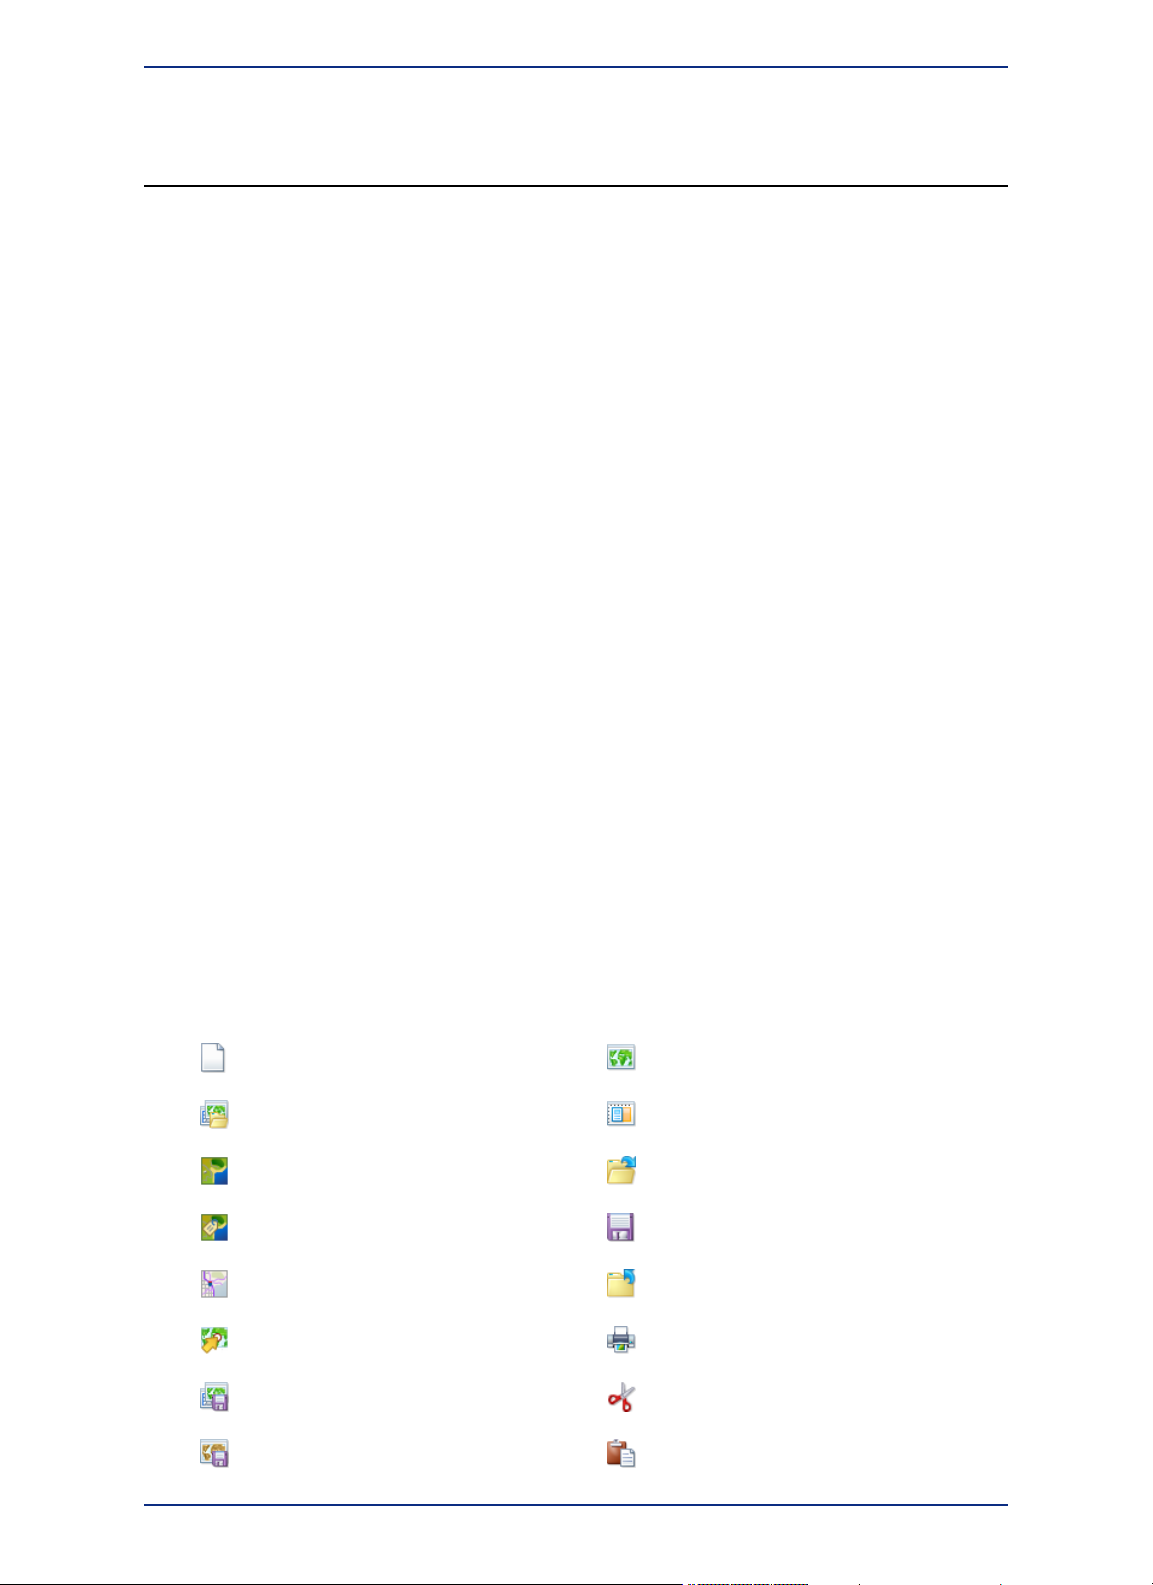
Chapter 3: The Basics of MapInfo Professional
A Tour of the MapInfo Professional Desktop
This section details the tools and commands that are available to you in the MapInfo Professional product.
You may refer to these frequently as you familiarize yourself with MapInfo Professional.
If your copy of MapInfo Professional includes introductory data, you may want to install it now, as described
in the MapInfo Professional Install Guide. You can then view the sample data in MapInfo Professional
as a map while getting familiar with the features of this product.
• For more information, see Opening MapInfo Professional Introductory Data in the Help System.
Working with Toolbars
MapInfo Professional provides toolbars of tool buttons and commands to give you tremendous mapping
creativity at the click of a button.
To reshape the toolbars, click and drag on their borders. Drag the title bar to move them. To dock a
toolbar, drag it to one of the edges of the application window. The toolbar changes shape and positions
as it docks itself. You can easily change it back to the floating view by clicking the background area of
the toolbar and dragging it away from its position. The toolbar retains the same shape as it had before
you docked it.
Displaying or Hiding Toolbars
To show or hide toolbars:
1. On the Options menu, point to Toolbars.
2. Show a toolbar by checking its check box or clear its check box to hide a toolbar.
3. Click Close. The toolbars display or disappear from your screen.
An Overview of the Toolbars
Reviewing the Standard Toolbar
The Standard toolbar contains tools for commonly performed menu functions from the File, Edit, and
Window menus. It also contains tools for quick access to a Redistricting window and Help System.
Many of these tools are familiar to you from working with Microsoft Windows.
New MapperNew Table
New Layout WindowOpen Workspace
OpenBing Aerial
Save TableBing Hybrid
Close AllBing Roads
Print WindowMove Map To
CutSave Workspace
PasteSave Window As
37MapInfo Professional User Guide
Page 38
A Tour of the MapInfo Professional Desktop
New BrowserPrint To PDF
New Grapher WindowCopy
New Redistricter WindowUndo
Reviewing the Main Toolbar
The Main toolbar contains buttons for selecting objects, changing the view of the Map window, getting
information about an object, and showing distances between objects. It also contains buttons that allow
you to change attributes and open the floating thematic legend or Statistics windows.
Select
Marquee Select
Radius Select
Polygon Select
Boundary Select
Unselect All
Invert Selection
Graph Select
Zoom-in *
Accesses the Select tool to select objects/records in a Map, Layout,
or Browser window. Also acts as the default pointer/cursor tool.
Accesses the Marquee Select tool so you can select and search
for map objects within a given rectangle (marquee box).
Accesses the Radius Select tool so you can select and search for
map objects within a circular region.
Accesses the Polygon Select tool so you can select objects within
a polygon.
Accesses the Boundary Select tool so you can select and searches
for map objects within a given region.
Accesses the Unselect All tool so you can clear all of your object
and record selections. Performs the same operation as Unselect All.
Selects all objects or records not included in the current selection,
and cancels the current selection.
Accesses the Graph Select tool. As you click graph objects, such
as a riser bar, pie slice, column, etc., this tool selects the
corresponding records from the table.
Accesses the Zoom-in tool to get a closer area view of a map or
layout.
Zoom-out *
Change View *
Grabber *
Info tool *
HotLink
Label
Accesses the Zoom-out tool so you can get a wider area view of a
map or layout.
Accesses the Change View dialog box so you can specify settings
for Map window width, map scale, resizing, and centering.
Accesses the Grabber tool so you can reposition a map or layout
within its window.
Accesses the Info tool so you can view the tabular data that is
associated with a map object.
Accesses the HotLink tool, so you can launch active objects such
as files or URLs from your Map window.
Accesses the Label tool so you can label objects with information
from the related database.
MapInfo Professional 12.538
Page 39

Chapter 3: The Basics of MapInfo Professional
Drag Map Window *
Layer Control
Ruler
Show/Hide Statistics
from Map
Assign Selected
Objects
Create a Scale Bar
Accesses the Drag Map Window button to drag a MapInfo
Professional map into an OLE container application.
Accesses the Layer Control window so you can specify how the
various tables in a Map window are layered and displayed.
Accesses the Ruler tool to determine the distance between two
points and the length of some path.
Accesses the floating Thematic Legend window.Show/Hide Legend
Accesses the Statistics window to tally the sum and average of all
numeric fields for the currently chosen objects or records.
Sets the target district from the map during a Redistricting session.Set Target District
Assigns selected objects to the target district during a Redistricting
session.
Redisplays the entire map.Clip Region On/Off
Isolates a map region for display.Set Clip Region
Access the Create Scale Bar dialog box, so that you can add a
scale bar to the mapper window.
Table List
Add to Library
* These tools are also available when you access your MapInfo .TAB map within a container application
such as MS Word, PowerPoint, etc.
Reviewing the Drawing Toolbar
The Drawing toolbar contains tools and commands that are used to create and edit map objects. For
more about how to use these buttons, see Using the Drawing and Editing Commands.
Symbol
Polyline
Arc
Accesses the Table List so that you can view a list of open tables,
perform operations on them, and organize or sort them into groups.
Access the Add to Library to create a metadata record for the table
in MapInfo Manager Library.
Accesses the Symbol tool, which allows you to place point symbols
on your map like "push pins."
Accesses the Line tool, which allows you to draw straight lines.Line
Accesses the Polyline tool, which allows you to draw polylines (an
open, connected sequence of lines).
Accesses the Arc tool, which allows you to draw an arc the size and
shape of one quarter of an ellipse.
Polygon
Ellipse
Accesses the Polygon tool, which allows you to draw polygons (a
closed, connected sequence of lines).
Accesses the Ellipse tool, which allows you to create elliptical and
circular objects.
39MapInfo Professional User Guide
Page 40
A Tour of the MapInfo Professional Desktop
Rectangle
Rounded Rectangle
Text
Frame
Reshape
Add Node
Symbol Style
Line Style
Region Style
Accesses the Rectangle tool, which allows you to draw rectangles
and squares.
Accesses the Rounded Rectangle tool, which allows you to draw
rounded rectangles and squares.
Accesses the Text tool, which allows you to add titles, labels, and
annotation to maps and layouts.
Accesses the Frame tool, which allows you to create frames in the
Layout window to display maps, graphs, browsers, and legends.
Toggles in and out of Reshape mode. Reshape allows you to edit
regions, polylines, lines, arcs, and points by moving, adding, and
deleting nodes that define them.
Accesses the Add Node tool, which allows you to add a node to
regions, lines, or polylines when you are in Reshape mode.
Accesses the Symbol Style dialog box where you can change the
style, color, and size of a symbol object.
Accesses the Line Style dialog box where you can change the style,
color, and width of line objects.
Accesses the Region Style dialog box where you can change the
fill pattern, color, and background, plus the border style, color, and
width of region objects.
Text Style
Reviewing the DBMS Toolbar
The DBMS Toolbar contains buttons and commands that are used to access tables residing on a remote
database. These options are only available if you have installed a relational database manager. For
more about how to use these buttons, see Working with Data in a DBMS.
Open DBMS Table
Refresh DBMS Table
Unlink DBMS Table
Make DBMS Table
Mappable
Accesses the Text Style dialog box where you can change the font
typeface, size, style, color, and background of text objects.
Accesses the Open dialog box, which allows you to access a remote
database. If a connection has not been established, you are prompted
to open one. This button is also found in the Open dialog box if
DBMS is installed.
Accesses the Refresh DBMS Table dialog box, which allows you
to refresh a MapInfo Professional linked or live table with the most
recent data residing on the remote database for that linked or live
table.
Accesses the Unlink DBMS Table dialog box, which allows you to
unlink a downloaded table from its remote database.
Accesses the Make DBMS Table Mappable dialog box, which allows
you make a table linked to a remote database mappable in MapInfo
Professional.
Change Symbol for a
Mappable DBMS
Table
Accesses the Change Symbol for a Mappable DBMS Table dialog
box, and allows you to change the symbol style of a mappable DBMS
table.
MapInfo Professional 12.540
Page 41

Chapter 3: The Basics of MapInfo Professional
Disconnect DBMS
Reviewing the Web Services Toolbar
The Web Services Toolbar contains buttons and commands that are used to access web services. For
more about accessing web services, see Working with Data from a Web Service.
Open WMS Table
Open WFS Table
Find Address
Geocode Using
Server
Create Drive Regions
Accesses the Close DBMS Disconnection dialog box, where you
can close a connection to a remote database.
Opens a Web Map Service table into the current map or into a new
map. The Open WMS Table button is available whenever your
computer is connected to the intranet or the Internet.
Opens a Web Feature Service table into the current map or into a
new Map window. The Open WFS Table button is available whenever
your computer is connected to the intranet or the Internet.
Displays the Find Address dialog box to begin geocoding a single
address using a geocoding service.
Displays the Geocode Using Server dialog box to begin geocoding
a table using a geocoding service.
Displays the Create Driving Regions dialog box to begin using
driving region buffers to display data or creating time or distance
buffers for a table.
Web Services
Preferences
Search CSW
Catalogs
Displays the Web Services Preferences dialog box to begin setting
the geocoding server preferences and setting the routing server
preferences.
Opens the Catalog Browser to search for data in available catalog
services.
Data - Where MapInfo Professional Begins
To use MapInfo Professional, you need to match the files that contain your information (data) and maps
that come from MapInfo Professional or that you create yourself. MapInfo Professional organizes all its
information, whether textual or graphic, in the form of tables; each table is a group of MapInfo Professional
files that constitute either a map file or a database file.
MapInfo Professional begins when you open tables, whether they are maps or data from a database.
What is a Database and Other Basic Terminology
A database is a collection of information organized so that it can be readily accessed using a computer.
Databases in MapInfo Professional are often referred to as tables. MapInfo Professional creates a visual
display of the data in tables in the form of a map.
41MapInfo Professional User Guide
Page 42

Data - Where MapInfo Professional Begins
Emergency medical calls thematically shaded by type of call and time of call, with response zones shaded
by number of calls.
To understand MapInfo Professional, you need a basic understanding of database organization, in
particular, three fundamental concepts: record, field, index, and query.
ZIPCodeAddressFirstNameLastName
12205212 Hudson StMarkFraser
12208459 Yates StEvaDonaldson
12180200 BroadwayKimEspinosa
120651 Redbird LnCharlesSmith
1207753 Crescent RdElizabethChang
To understand the database concepts we are about to discuss, consider the table above.
Each row in the list contains information about one person. In database terms, each row is a record.
Each different box of information (Last Name, First Name, etc.) within a record is called a field. Fields
correspond to the columns so that the table shown above contains four different fields.
Database fields are ordered (first, second, third, fourth, etc.), and the basic convention is that the first
field displays as the first column in the database. The second field is in the column to the right of the
first, and so on to the last field, which is displayed in the right most column.
Since the data in a database is not usually in alphabetical order or postal code order or any other pattern
which would make it easy for the computer to find the information, the computer needs a way to organize
the information. A database uses an index to keep track of what information is where and what record
it is tied to. Without indices it would be tedious to find anything in a database with hundreds of records,
not to mention databases with thousands and tens of thousands of records.
A database index works on the same principle as a book index. A book index is an alphabetical list of
topics that appear in the book and the page number or address of the information. Database indices
work in a similar way, except that they generally work behind the scenes. You do not ever see them.
But the computer constructs them and allows you to use them in your work. An index allows the computer
to work with the records according to the order of items in the key field.
MapInfo Professional requires fields to be indexed in order to use the Find command. Indices are also
used to improve performance in SQL Select and joins.
MapInfo Professional 12.542
Page 43

Chapter 3: The Basics of MapInfo Professional
A query is just another word for a question. You query data to collect a particular type of information
from your database. For example, if you wanted to know how many customers live within a certain
number of miles of your store, (and you had that kind of information in your database), you could query
the database to find out that information. The result of the query is query data. You can think of query
data as a subset of your data as in the example - a list of all the customers within 5 miles and none of
the customers who live further away. MapInfo Professional has tools to help you query your data and
display it on a map. For more about querying your data, see Selecting and Querying Data.
What Data Can I Use in MapInfo Professional?
MapInfo Professional allows you to use data that was created in other file formats. When you bring data
into MapInfo Professional for the first time, you need to specify its format. For example, if your data is
in delimited ASCII format, choose Delimited ASCII from the File Format drop-down list.
Data file choices include:
• Microsoft Access
• Microsoft Excel
• dBASE DBF
• ESRI shapefiles
• Raster Images
• Grid Images
• ASCII Delimited Text
• Lotus 1-2-3
• Remote Databases (Oracle, SQL Server, PostGIS)
• Workspace
• Comma Delimited CSV files
For database versions that MapInfo Professional supports, see the MapInfo Professional Install Guide.
When you choose a particular file format, the File Name box will only list files that have the appropriate
extension. For example, if you choose dBASE DBF from the File Format drop-down list, MapInfo
Professional will only list files that are in dBASE format.
When you choose a file other than a MapInfo-formatted file type, MapInfo Professional creates a table
structure for that data based on the type of file that it is.
Note:
When you open that table in future work sessions, MapInfo Professional will treat these files as if they
were in MapInfo Professional's native format. The next time you want to open the table, you should
choose the .TAB format for the table. If you accidentally attempt to open the file again with its original
file format, MapInfo Professional prompts you with the message:
This message displays because MapInfo Professional has already created a table for that file. To use
the file you have already created, click Cancel and open the associated .TAB file.
Also keep in mind that MapInfo Professional supports long filenames and UNC paths. The UNC paths
allow you to access your data without having to remember your drive mappings from one session to
another.
To display your table in the Map window, your data must contain X and Y coordinates. If it does not
already, you can add them using MapInfo Professional. Assigning these coordinates is called geocoding.
More about geocoding follows later in this chapter and in Putting Your Data on the Map.
During the .TAB file creation process, the original file is in no way altered. The file retains its
original properties.
Table definition already exists. Overwrite it?
The Help System contains these related topics:
43MapInfo Professional User Guide
Page 44

Data - Where MapInfo Professional Begins
• Displaying your Excel (.XLS or .XLSX) Data
• Displaying your Access (.MDB or .ACCDB) Data
• Displaying your Comma Delimited Data
• Displaying your dBase Data
• Displaying your Lotus 1-2-3 Data
• Displaying your ESRI Shapefile Data
• Registering and Displaying your ASCII Data
• Importing and Displaying GML File Data
• Working with Data in a DBMS
• Working with Data from a Web Service
Support for Raster Images
MapInfo Professional supports raster image display. Raster images are computerized pictures. These
graphic images can be used as backgrounds for maps you create in MapInfo Professional and can serve
as a reference for your displayed data.
When you bring in a raster image to MapInfo Professional, you may need to register it (specify its map
coordinates) so MapInfo Professional can display it properly. Choosing the Raster Image file format from
the Open dialog box will bring you to the Image Registration dialog box where you can specify the
appropriate map coordinates. Once you register the image, a process that creates a .TAB file for the
image, you can open it as you would open any table in a Map window. Images that you purchase from
MapInfo Professional will already be registered.
If a raster image is georeferenced it will be automatically opened. If a raster image has an associated
world file, you will be prompted to choose the projection. If you open a raster image that does not have
any georeferencing data, you will be prompted to display or register the image.
For a full discussion of raster image display, see Registering SPOT Images in the Help System.
The MapInfo Professional raster handlers support:
• LeadTools to version 15
• MrSID SDK (3.2), to provide support for MG3 files
• Multi-threading; specifically for ECW and the Government handlers (ADRG, ASRP, CADRG, CIB,
NITF)
AirPhotoUSA provides raster images at different elevations for particular areas in the United States. The
AirPhotoUSA map handler allows MapInfo Professional users to open and display the imagery contained
in AirPhotoUSA Map files as a layer. These files are treated just like any other raster file in MapInfo
Professional. The MAPINFOW.PRJ file contains AirPhotoUSA information.
You can use the AirPhotoUSA Conterminous U.S. coordinate system without making any changes.
However, if you want MapInfo Professional to recognize and give a name to that coordinate system, or
to use it for other purposes, you must add it to the MAPINFOW.PRJ.
Understanding the Files Associated with MapInfo Professional Tables
When you open your data file, MapInfo Professional creates a table. This table consists of at least two
separate files. The first file contains the structure of the data. The second file contains the raw data. All
MapInfo Professional tables have the following two files:
• <SOMEFILE>.tab: This file describes the structure of your table. It is a small text file describing the
format of the file containing your data.
• <SOMEFILE>.DAT or <SOMEFILE>.WKS, .DBF, .XLS, .XLSX: These files contain your tabular data.
If you are working with a dBASE/FoxBASE, delimited ASCII, Lotus 1-2-3, Microsoft Excel, or Microsoft
Access file, your MapInfo Professional table will consist of a .TAB file and your data or spreadsheet
file. For raster tables, the equivalent extension might be BMP, TIF, or GIF.
MapInfo Professional 12.544
Page 45

Chapter 3: The Basics of MapInfo Professional
Your data may also contain graphic objects. Once you assign X and Y coordinates to your data records,
your table will also contain graphic objects. In Geocoding - Assigning Coordinates to Records, you
will learn how to assign X and Y coordinates to your data records so you can display them on a map. If
you already have graphic objects in your table, there are two more files associated with the table:
• <SOMEFILE>.MAP: This file describes the graphic objects.
• <SOMEFILE>.ID: This file is a cross reference file that links the data with the objects.
For a Microsoft Access table, there will be a file SOMEFILE.AID associated with the table instead of
SOMEFILE.ID. This file is a cross reference file that links the data with the objects for a Microsoft Access
table.
Your table may also include an index file. The index file allows you to search for map objects using the
Find command. If you want to locate an address, city, or state using the Find command, those fields
must be indexed in your table. The index is located in:
• <SOMEFILE>.IND
Note:
There is a two Giga Byte (2 GB) file limit on these files after which MapInfo Professional displays
an error message: "Cannot write database row. Possibly out of disk space. Out of disk space
while saving table [tableAlias] ..." If you see this message, check the file sizes and consider
reducing the amount of data you are saving.
Opening Your Data in MapInfo Professional
Using Local Data (Located on your Machine)
You can open your Excel (.XLS or .XLSX), dBase (.DBF), Microsoft Access (.MDB or .ACCDB), and
ASCII (.TXT) in MapInfo Professional and display that data on a map. There are three steps to
accomplishing this:
1. Creating a copy of your data in MapInfo format.
2. Creating points on a map using either coordinates in your data or by matching your data to a search
file (see When Do I Geocode vs. Create Points? for this process).
3. Display your data on the map (see How Do I Get My Data on the Map? to complete this process).
Using Remotely Located Data
If you are accessing your data remotely or use an ODBC supported database product, see Getting
Started for additional support.
For information about opening remotely located data, see Opening Data in Remote Tables. For
information about converting, displaying, and printing your data, see Understanding Your Data.
Using Introductory Data
If your copy of MapInfo Professional includes introductory data, you may want to install it now, as described
in the MapInfo Professional Install Guide. You can then view the sample data in MapInfo Professional
as a map while getting familiar with the features of this product.
• For more information, see Opening MapInfo Professional Introductory Data in the Help System.
MapInfo Professional Data File Support
You can open the following file types in MapInfo Professional on the File menu by pointing to Open:
• ACCDB – Microsoft Access 2007 or later files
• CSV – Comma Delimited files
• DBF – dBASE DBF files
• MDB – Microsoft Access files
• TAB – MapInfo .TAB files
45MapInfo Professional User Guide
Page 46

Data - Where MapInfo Professional Begins
• Raster image files – (*.bil, *.sid, *.gen, *.adf, *.img, *.ntf, *.ecw, *.url, *.tif, *.grc, *.bmp, *.gif, *.tga,
*.jpg, *.pcx, *. jp2, *.j2k, *.png, *.psd, *.wmf, *.emf, *.map)
• SHP – ESRI Shapefiles
• TXT – Delimited ASCII files
• WKS – Lotus 1-2-3 files (*.wk1, *.wks, *.wk3, *.wk4)
• WOR – MapInfo workspace files
• MWS – apInfo workspace files
• XLS – Microsoft Excel files
• XLSX – Microsoft Excel 2007 or later files
• Grid images – (*.adf, *.flt, *.txt, *.asc, *.img, *.dem, *.dt0, *.dt1, *.dt2, *.mig, *.grd). This release does
not support .XLSM and .XLSB Excel files.
Note:
Importing File Formats
You can import the following file formats into MapInfo Professional using the Universal Translator (on
the File menu point to Universal Translator):
• Autodesk AutoCAD DWG/DXF (.dxf, .dwg) — up to AutoCAD rel 2013
• Bentley MicroStation Design 7 (.dgn)
• Bentley MicroStation Design 8 (.pos, .fc1, .dgn)
• ESRI ArcInfo Export (.e00)
• ESRI ArcSDE
• ESRI Geodatabase (Personal Geodatabase) (.mdb)
• ESRI Shapefile (.shp)
• Google Earth KML (.kmz, kml)
• Spatial Data Transfer Standard, such as TR01CATD.DDF (*CATD.DFF)
• Vector Product Format (VPF) Coverage, such as POAREA.AFT, POLINE.LFT, POPOINT.PFT (.*ft)
You can import the following file formats into MapInfo Professional on the Table menu by pointing to
Import:
• DXF – The graphic/data interchange format (DXF) for AutoCAD and other CAD packages
• GML – OS MasterMap format
• GML, XML – Geographic Markup Language (GML) 2.1
• IMG – A file format for MapInfo Professional for DOS image files
• MBI – MapInfo Professional Boundary Interchange format (MBI) An ASCII file for MapInfo DOS
• MIF – MapInfo Professional Interchange Format (MIF) MapInfo Professional’s data interchange format
• MMI – MapInfo DOS MMI
Grid Format Direct Support: The following grid handlers support direct read of DEM-USGS Text
(.dem); GTOPO30 (.dem) and DTED levels 1, 2, 3 (.dt0, .dt1, .dt2). These grid handlers are
read-only; they cannot be used to create grid files during the Create Grid Thematic interpolation
process.
boundary files.
(ASCII file format).
Note:
MapInfo Professional imports graphics and textual information from MapInfo Professional Interchange
Format, DXF, MBI, and MMI files. MapInfo Professional imports only graphics from IMG.
Supported Raster Image File Formats
The following are the Raster image file formats that MapInfo Professional supports:
• ADF – ArcInfo coverage Data File (ADF)
• ASC – ASCII text file
• BIL – Satellite Pour l'Observation de la Terre (SPOT) satellite images Spot Image Formats 1.5 and
• BMP – Windows bitmap (BMP) Monochrome: 8 Bit Color, 24 Bit Color
• filename.* – Compressed ARC Digitized Raster Graphic (CADRG) format
You can download raster handlers for NIMA formats such as ADRG, CADRG, ASRP, CIB, USRP,
and NITF formats from the Pitney Bowes Software Inc. website or get them from the Installation
DVD.
4.0: 8 Bit Gray, Format 1.5, 8 Bit Gray, Format 4.0, 24 Bit Color, Format 1.5, 24 Bit Color, Format 4.0
MapInfo Professional 12.546
Page 47

Chapter 3: The Basics of MapInfo Professional
• filename.* – Controlled Image Base (CIB) format
• ECW – Enhanced Compression Wavlet (ECW) format handler by ER Mapper
• EMF – Enhanced Metafile Format
• FLT – Image Filter (FLT)
• GEN – ARC Digitized Raster Graphic (ADRG) format
• GEN – ARC Standard Raster Product to 1.2 (ASRP) 1.2 format
• GIF – Graphics Interchange Format (GIF)
• GIF – Graphics Interchange Format (GIF89a) non-interlaced only Monochrome: 8 Bit Color
• GRC – MapInfo Vertical Mapper
• GRD – MapInfo Vertical Mapper MapInfo Professional treats GRD files as either a grid or raster image.
If the associated .TAB file contains a RasterStyle 6 entry, then MapInfo Professional treats the file as
a grid.
• JFIF – JPEG File Interchange Format (JFIF) 8 Bit Gray, 24 Bit Color, No Subsampling, 24 Bit Color,
YUV422 Subsampling, 24 Bit Color, YUV411 Subsampling
• JP2 – Joint Photographic Experts Group (JPEG) 2000 format MapInfo Professional supports creating
JPEG 2000 files using Save Window As and viewing JPEG 2000 files using the LeadTools raster
handler.
• JPG – Joint Photographic Experts Group (JPG)
• JPEG – Joint Photographic Experts Group (JPEG) 8 Bit Gray, 24 Bit Color, No Subsampling, 24 Bit
Color, YUV422 Subsampling, 24 Bit Color, YUV411 Subsampling
• NTF – National Imagery Transmission Format (NITF) version 2.x format
• PCX – ZSoft Paintbrush
• PCX – Format Version 5 (Paintbrush Version 3.0) Monochrome, 8 Bit Gray, 8 Bit Color, 24 Bit Color
• PNG – Portable Network Graphics (PNG) format
• PSD – Photoshop 3.0
• SID – MrSID format The MrSID raster handler allows you to open and display raster images compressed
in the MrSID format
• TIF – Geographic Tagged Image File Format (GeoTIFF)
• TIF – Tagged Image File Format (TIFF) TIFF Revision 5.0, Monochrome (Class B), Uncompressed,
Monochrome (Class B), PackBits Compression, 8 Bit Gray (Class G), Uncompressed, 8 Bit Color
(Class P), Uncompressed, 24 Bit Color (Class R), Uncompressed
• TIF – Tagged Image File Format (TIFF) CMYK
• TIF – Tagged Information File Format (TIFF) CCITT Group 4
• TIF – Tagged Information File Format (TIFF) LZW
• TXT – Text
• TGA – Targa TGA Truevision File Format Specification 2.0. 8 Bit Gray, 8 Bit Color, 24 Bit Color
• WMF – Windows Metafile Format(WMF). The raster handler will load a rasterized version of the WMF
file.
File Limitations for MapInfo Professional Supported Formats
Keep the following notes in mind when working with these MapInfo formats:
• MapInfo Professional only supports the DXF file import to release 13 through Table > Import. This
has been superseded by the Universal Translator and Open Universal Data feature.
• The Open Universal Data feature supports all DWG and DXF formats up to the current AutoCAD
release 2013. While it is our company’s intention to keep pace with the new releases of FME, if you
extend the application to import AutoCAD DWG and DXF files using a newer version of FME before
we have upgraded our product, errors may occur.
• You can have maximum 500 files open at a time in MapInfo Professional if you remove the
HKEY_LOCAL_MACHINE\SOFTWARE\MapInfo\MapInfo\Common Max Files registry key.
• You can have up to 125 files open at a time for editing in MapInfo Professional.
Feature Manipulation Engine (FME) Format Support
MapInfo Professional installs with the Feature Manipulation Engine (FME) 2014, which lets you open
data directly to avoid having to translate it separately and work with copies of the data in .tab format.
This FME opens a variety of Universal Data formats including:
47MapInfo Professional User Guide
Page 48

Data - Where MapInfo Professional Begins
• Autodesk AutoCAD DWG/DXF – Supports AutoCAD file versions up to and including 2010
• Bentley MicroStation Design (V7) – Supports Intergraph Standard File Format (ISFF) Version 7
• Bentley MicroStation Design (V8) – Supports Intergraph Standard File Format (ISFF) Version 8
• ESRI ArcInfo Export (.e00) – Supports ArcGIS 10.x
• ESRI ArcSDE – Supports ArcSDE 10.x
• ESRI Geodatabase (MDB) – Supports ArcGIS 10.x
• Google Earth KML – Supports KML 2.2
• MapInfo TAB (MFAL) – Support MapInfo File Access (MFAL) version 2.4.0.3
• Geography Markup Language (GML) - Reader supports GML versions 2.1.2, 3.1.1, and 3.2.1 and
Writer supports GML versions 3.1.1 and 3.2.1
• Esri Geodatabase (File Geodatabase API) Reader/Writer (GDB) - Supports 10.0 File Geodatabases
or higher
To open these data formats in MapInfo Professional, on the File menu point to Open Universal Data.
To translate TAB files using FME in MapInfo Professional, on the Tools menu point to Universal
Translator.
For details about all of the FME supported formats, see FME Readers and Writers (formats supported
by FME 2013) in the FME Desktop Help.
To see what is new in FME 2013, see http://fmepedia.safe.com/articles/FAQ/Whats-Great-2013.
Opening MapInfo Tables
Just about everything in MapInfo Professional starts with opening a table. You can display the information
in your tables in a number of ways in MapInfo Professional, as a table, in a browser, and on a map.
To open a local table (which is a data file on your machine):
1. On the File menu, click Open. The Open dialog box displays.
Note:
2. Navigate to the data file you want to open. From the Files of type drop-down list, select the type of
data you will open.
3. From the Preferred View drop-down list, select the view you want of this data .
• Automatic - MapInfo Professional chooses the most appropriate view. If the data is mappable (for
• Browser - MapInfo Professional attempts to open the table in a Browser window.
• Current Mapper - MapInfo Professional attempts to add your data to the current Map window.
• New Mapper - MapInfo Professional attempts to open the table in a new Map window.
• No View - MapInfo Professional opens the table making the data available for other uses, but no
If you are at the Quick Start dialog box (the first dialog box you see after starting MapInfo
Professional), choose the Open button. The Open dialog box displays.
example, graphic objects are attached to the data), for example, MapInfo Professional opens the
table in a Map window. If you have a Map window displayed and the table you want to open is
mappable, MapInfo Professional will automatically open the table in the current Map window. If
the data is not mappable, MapInfo Professional will attempt to open the table in a Browser window.
If the table cannot be mapped or browsed, MapInfo Professional opens the table using the No
View option (no data is displayed).
data is displayed.
Note:
4. Select the Create copy in MapInfo format for read/write to open it in native (.tab) format.
5. To open the file, do one of the following:
When you open a table and select an option in the Preferred View drop-down list, MapInfo
Professional remembers what you selected and uses the same option the next time you
open a table.
If you do not select the Create copy check box, the file opens read-only.Note:
MapInfo Professional 12.548
Page 49

Chapter 3: The Basics of MapInfo Professional
Double click the file you want to open•
• Click the file you want to open to highlight it in the list and click Open.
Using either method, MapInfo Professional opens the data file.
When opening multiple tables, use Shift-click to select adjacent tables and Ctrl-click to select non-adjacent
tables.
Note that although a MapInfo Professional table consists of two or more component files (STATES.TAB,
STATES.DAT, STATES.MAP, etc.), only the .TAB file appears in the File Name box of the Open dialog
box. It is the only component file you must open. For more about these other MapInfo file types, see
Understanding the Files Associated with MapInfo Professional Tables.
In MapInfo Professional you can work with a variety of table types. Some data tables are like the example
table we just discussed. Further subdividing this class of tables are data tables that contain graphic
objects (map objects) and data tables that do not (such as spreadsheets or external database tables).
Raster tables are graphic images that you can display in a Map window. These computerized pictures
do not have the same table structure of record, field, and index as data tables do, and therefore, will not
be discussed in this chapter. For more on raster images, see Working with Raster Images in the MapInfo
Professional Help System.
You can see what windows are currently open by reviewing the list at the bottom of the Window menu.
If one of these "More Windows" windows is the active window, the check box displays beside the More
Windows entry. To make another window active, click the entry in the Window list. The window you
selected comes to the forefront of the MapInfo Professional screen. When you select the More Windows
entry, the Select Window dialog box displays. To activate a window from this list, either double-click
the entry in the Select Window list, or click the entry and click OK.
A Note about the Preferred View Options
Of the five Preferred View options, Automatic and No View will work on all tables, regardless of what
kind of data they contain.
49MapInfo Professional User Guide
Page 50

Data - Where MapInfo Professional Begins
MapInfo Professional attempts to open the table as specified for Browser, Current Mapper, and New
Mapper. If it cannot, it will open the table according to the following rules:
• If Current Mapper is selected, and there is no Map window displayed, MapInfo Professional will
attempt to open the table in a new Map window.
• If Current Mapper or New Mapper is selected and the data is not mappable, MapInfo Professional
will try to open the table in a Browser window.
• If the table cannot be mapped or browsed, MapInfo Professional will open the table using the No View
option (no data is displayed).
For more information, see Renaming a Table and Deleting a Table in the Help System.
Opening Data in Remote Tables
MapInfo Professional also enables you to access remote database data through its ODBC connectivity
support and the Oracle Spatial Object support. The MapInfo Professional ODBC connectivity support
supplies many ODBC drivers that you can easily install.
Oracle spatial databases enable you to store spatial objects with your conventional data in the same
database. This enables you to read and write geographies in Oracle Spatial without the need for a
middleware product such as MapInfo Professional's SpatialWare, or SDE. You also gain better
performance through the Oracle Call Interface (OCI). In addition, Oracle applications can use this same
spatial or non-spatial data through other interfaces (ODBC, OCI, JDBC, PL/SQL, HTTP, IIOP, etc.) or
MapInfo Professional 12.550
Page 51
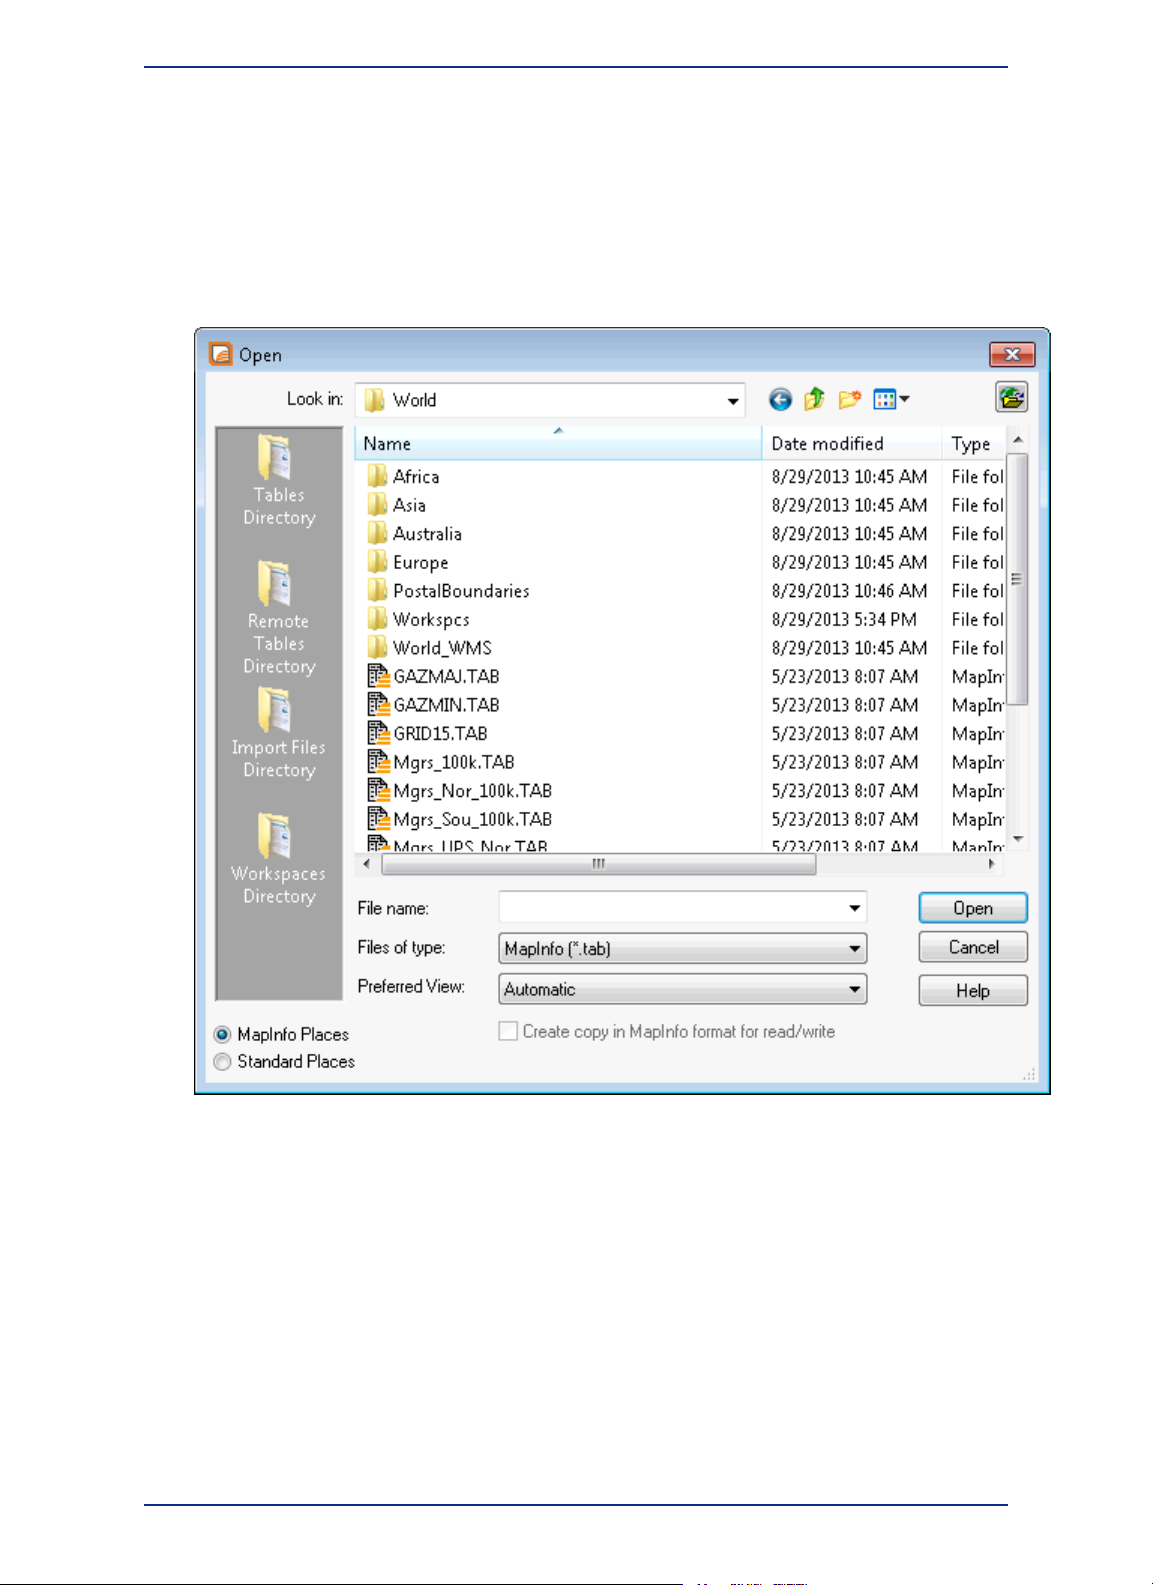
Chapter 3: The Basics of MapInfo Professional
use other spatial or non-spatial tools (MapInfo Professional, ArcView, Intergraph, Excel, Forte, Formida,
etc.).
For more about accessing remote data using ODBC connectivity, see Setting your Database Connection
Preferences in the Help System.
Using the MapInfo Places on Open Dialog Box
The Open dialog box provides a quick way to look for maps you have created.
The Places box. Select the Workspaces Directory option in the Places box, to display the Workspace
(.wor) type in the Files of Type list. If you select any other entry in the Places box, MapInfo (.tab)
displays in the Files of type list.
The Open dialog box provides many ways to quickly find the maps that you have created in a variety of
locations in your system and network.
Note:
When you select the Workspaces Directory option in the Places box, the Files of type drop-down list
changes to Workspace (.wor) type. If you select any other entry in the Places box, MapInfo (.tab) displays
in the Files of type list.
• For more information, see Opening MapInfo Professional Introductory Data in the Help System.
The Places box on the left side of the Open dialog box allows you to select a directory in which
you may have your map and other MapInfo Professional tables and workspaces.
51MapInfo Professional User Guide
Page 52

Understanding Your Data in MapInfo Professional
Opening Special File Types
There are additional file types that MapInfo Professional can read including rasters, grids, and shape
files. For details about working with raster images, see Displaying a Raster Image and Registering the
Coordinates of a Raster Image in the Help System.
Opening a Grid Layer
A grid layer is a type of thematic map that displays data as continuous color gradations across the map.
To produce this type of thematic map, you interpolate point data from the source table. In MapInfo
Professional, a grid file from the data interpolation is generated and displays as a raster image in a Map
window.
• For more information, see Selecting Point Objects in Grid Files in the Help System.
To open a grid layer:
1. On the File menu, click Open to display the Open dialog box.
2. Select Grid Image in the Files of type drop-down list.
3. Navigate to the directory in which your grid image is located and click the file you want to open.
4. Click Open to display the grid image.
Understanding Your Data in MapInfo Professional
Computer maps are organized into layers. Think of the layers as transparencies that are stacked on top
of one another. Each layer contains different aspects of the whole map.
What is a Layer?
In MapInfo Professional you begin by opening your table of data and displaying it in a Map window. Each
table displays as a separate layer. Each layer contains the table plus any map objects, such as regions,
MapInfo Professional 12.552
Page 53

Chapter 3: The Basics of MapInfo Professional
points, lines, and text. Additionally, the layer contains style overrides and zoom layering characteristics
that you can add to give the layer more or less prominence in the Map window.
Figure: Map Layers Example
Map layers form the building blocks of maps in MapInfo Professional. Once you have created your layers,
you can customize them in a variety of ways, add and delete layers, or reorder them.
For example, one layer may contain state boundaries, a second layer may have symbols that represent
capitals, and a third layer might consist of text labels. By stacking these layers one on top of the other,
you begin to build a complete map. You can display one, two, or many tables at a time.
Map Objects as Part of Layers
We mentioned earlier that maps in MapInfo Professional are made up of layers of map objects. There
are five basic types of objects:
• Regions: closed objects that cover a given area. These include polygons, ellipses, and rectangles.
For example, country boundaries, postal code boundaries, sales territories.
• Point objects: represent single locations of data. For example, customer locations, restaurants, parking
meters. Points can also be combined into multipoint objects.
• Line objects: open objects that cover a given distance. These include lines, polylines, and arcs.
Examples are streets, rivers, power lines.
• Text objects: text that describes a map or another object, such as labels and titles.
• Collection objects: combination of region, line, and multipoint objects.
You can have each type of object in a separate layer (most common), or you can combine objects in
the same layer. MapInfo Professional lets you create, edit, customize, and display these objects to make
maps that meet your needs.
For information about drawing and editing map objects, see Drawing and Editing Objects and see
Moving Map Objects in the Help System.
Managing a Map's Layers
The key to controlling your map layers is the Layer Control window. The window shows all the layers
that make up a Map window and the status of the layer attributes. These attributes are: Visible On/Off,
Style Override, Editable, Selectable, and Automatic Labels. ToolTips display over the attribute when you
move your cursor over them to help familiarize yourself with each one. It is easy to change a layer's, or
multiple layers', attributes.
53MapInfo Professional User Guide
Page 54

Using Workspaces
You also have options available to change the display and label settings; modify any thematic maps you
have displayed; and reorder, add, or remove layers.
• For instructions on accessing the Layer Control window, see Accessing Layer Control in the Help
System.
• For instructions on changing layer order in the Layer Control window, see Changing the Order of
Contiguous Layers or Changing the Order of Random Layers topics in the Help System.
Using Workspaces
A workspace is a list of all the tables, windows, and settings you are using, stored in a file with the
extension .WOR or .MWS. Workspaces are a convenient way to return to a previously created map
without having to open each table file individually. The workspace keeps track of the following elements:
• Map, Browser, Graph, 3DMap, Layout, and Layout Designer windows, including their size and position
• Query tables created from base tables using either the Select or SQL Select statements (queries on
queries will not be saved)
• Graphs
• Thematic maps
• Legend Designer windows
• Cosmetic objects
• Labels
• Styles for fonts, symbols, lines, and fill patterns used to display objects
A .WOR file is MapInfo Professional workspace file containing un-compiled MapBasic code that MapInfo
Professional interprets to open a session with tables, windows, and settings the way a user left it. It is
MapInfo Professional version specific depending on features used in it.
A .MWS workspace file originates from the MapXtreme product line and is comprised of XML code to
do things similar to a MapInfo Workspace *.wor with some limitations.
To view the contents in the workspace file, open the .WOR or .MWS file in MapInfo Professional, a text
editor or word processor.
Note:
Opening a Workspace
Any previously opened tables and windows will be left untouched when you open a workspace. However,
to avoid cluttering up your screen with unnecessary windows, use the Close All command from the File
menu before adding the workspace.
There are two MapInfo workspace formats, WOR and MWS. A .wor file is written using MapBasic and
a .mws file is written using XML. The MWS format contains more information about the data sources
than the WOR format does. MapInfo Professional works with both workspace formats, but other MapInfo
products may work with only one of the two formats.
To open either a .wor or a .mws workspace:
1. From the File menu, select Open.
2. In the Open dialog box, from the Files of type list, select Workspace (*.wor, *.mws).
3. From the Look in list, navigate to and select the workspace (.wor or .mws) file to open.
4. Click Open.
When you save a workspace, you cannot save any references to selections or queries made by
the Selection tools or the Query options.
Note:
When you exit MapInfo Professional, the MapInfo Professional workspace (MAPINFOW.WOR)
stores the last session (unless you have set your preferences so that the workspace will not be
written). If there are files you do not want added to your workspace, close them before exiting.
MapInfo Professional 12.554
Page 55

Chapter 3: The Basics of MapInfo Professional
The Help System contains these related topics:
• Opening Multiple Workspaces
• Reading Labels from a MapInfo Workspace File (MWS)
• Limitations opening a MWS Format Workspace
• About Writing Label Overrides to a MapInfo Workspace File (MWS)
• About Reading/Writing Translucency Settings for a Workspace File (MWS)
How Renaming Tables Affects Workspaces
When you change the name of a table listed in a workspace, you invalidate the workspace. Table names
are stored in the workspace file, so if change it, the workspace cannot find it.
For example, if you create a workspace called CUSTOMER.WOR that contains the STATES table. If
you later rename the STATES table to AMERICA, MapInfo Professional will not be able to open the
CUSTOMER.WOR workspace. It will try to open the STATES table and not be able to locate it.
There are three ways to avoid this problem:
• Make any table name changes before you start to build workspaces.
• Open the workspace file in any text editor and manually change the table names.
• Open a workspace. Rename the table(s) using the Rename Table dialog box and immediately save
the workspace.
Saving Printer Information to a Workspace
MapInfo Professional enables you to save your printer information to a workspace, and restore printer
information from a workspace. These settings are located in the Startup preferences (on the Options
menu, point to Preferences, and click Startup). To save printer information to a workspace, check the
Save Printer Information to Workspaces check box. Subsequently, when you save your workspace,
the printer name, paper orientation, paper size, and the number of copies are saved. When this preference
is on, the printer settings are saved in a workspace file.
We recommend that you leave this preference on.Note:
To restore printer information from a workspace, check the Restore Printer Information to Workspaces
box. When you open the workspace, the printer name, paper orientation, paper size, and the number of
copies are restored. This is useful if you are sharing workspaces with other MapInfo Professional 6.0 or
later users who are also using the same printers. You may want to leave it off if you want to send the
workspace to someone who is using a different printer. If this preference is turned off, MapInfo Professional
uses the default printer selected in the Printer preferences.
Note:
You can get additional printer advice in the MapInfo Professional Printing Guide, which is located
in the Documentation subfolder of your installation directory.
Reviewing the Windows in MapInfo Professional
MapInfo Professional allows you to display your data in many different windows and with different views
at the same time. For instance, you can display the WORLD table of country boundaries in a Map window
to view the geographic boundaries. At the same time you can display the tabular data of the WORLD
table in a Browser window to see the country names, population, and other data in the file. If you make
a change in either window, it is reflected in the other.
Only one view can be active at a time. To make a different window active, click its title bar. Notice that
the menu bar changes depending on which window is active. For instance, when you are working in a
Map window when you also have a Browser open, only the Map menu is available on the menu bar.
Make the Browser active. The Browse menu replaces the Map menu.
55MapInfo Professional User Guide
Page 56

Reviewing the Windows in MapInfo Professional
There are many different types of windows you can display your data in, depending upon what you need
your data to communicate. This section covers the many ways you can display your data using MapInfo
Professional. Each of these display methods: map, list, graph, and presentation give your information a
different impact. How you display the information you have should depend upon what effect you want.
Consider these options carefully before you select a display type.
• Map windows present information arranged as conventional maps, allowing you to visualize the
geographic patterns of your data (for details, see Displaying Data in a Map Window). In addition,
Legend Designer windows present information arranged as map legends, so that you can understand
the symbols and themes used in the map (for details, see Creating a Legend for your Map).
• Browser windows present information as tabular lists (just as conventional databases do), allowing
you to fully examine tabular data (for details, see Displaying Data in a Browser Window).
• Graph windows present information arranged as graphs, allowing you to visualize and make
comparisons of the purely numerical patterns (for details, see Displaying Data in a Graph Window).
• Layout windows present information in a polished and attractive way and can be embedded in other
applications such as Microsoft Word or PowerPoint (for details, see Displaying Data in a Layout
Window).
To switch between windows to change which is active, press the Ctrl+Tab keys.Note:
Displaying Data in a Map Window
You use Map windows to display the geographic objects from your table on a map. Map windows can
display information from many tables at once, with each table a separate layer.
Opening a Table in a Map Window
You can create your maps or edit existing maps. You can open a Map window directly on the File menu,
by pointing to Open or by pointing to New Map Window on the Window menu.
Getting Around in the Map Window
There are a wide variety of tools that allow you to zoom, pan, and move objects around the Map window.
Zooming allows you to look more closely or more widely at a particular geography. Panning allows you
MapInfo Professional 12.556
Page 57

Chapter 3: The Basics of MapInfo Professional
to move around a map left, right, up, and down. Moving selected objects in an editable layer is useful
when you want to get your map right.
You can zoom using the mouse wheel or using the keyboard.
In addition to the usual zoom keys on your Main Toolbar ( , , and ), you can use the + and - keys
on the keyboard, to zoom in and out more precisely.
• When you press +, you zoom in by a factor of 2.
• When you press -, you zoom out by a factor of .5.
You can pan in your Map window using the scroll bars or the Arrow keys Up, Down, Left, and Right.
Further, you can move an object in an editable layer more precisely by selecting it and using the following
key combinations.
• Ctrl+Arrow - moves the editable, selected objects 1 pixel at a time
• Ctrl+Shift+Arrow - moves the editable, selected objects 10 pixels at a time
Note:
Changing a Map's Zoom Level
You change a map's zoom level by specifying certain parameters in the Change View dialog box.
To change a map's zoom level do one of the following:
• Choose Map > Change View. The Change View dialog box displays.
• Click the Change View button on the Main toolbar. The Change View dialog box displays.
The Change View dialog box allows you to set various parameters of the map including:
• Display the current zoom, scale or cursor position in the status bar (the default unit of distance is miles
• Change the zoom, scale, and the center point of the current map view.
• Behavior of the map when you resize the window.
• Resize the map to fit the new window, keeping the view the same.
• Set the map to preserve the current scale, so that resizing the window has the effect of letting you see
The Help System contains the following related topics:
• Opening MapInfo Professional Introductory Data
• Setting Margins for a Map Window when Printing
• Editing Text in a Map
These tools also apply to the classic Layout window and maps embedded in a Layout Designer
window.
which is specified in Map > Options).
more or less of the map.
Displaying Data in a Browser Window
You use Browser windows to view and manipulate your data records in traditional row and column form,
typically used in spreadsheets and databases. Each column contains information about that particular
field, such as name, address, phone number, cable ID number, or order amount. Each row contains all
information relating to a single record.
• For more information, see Displaying Data in a Browser Window in the Help System.
About the Browser Format
If you have ever worked with spreadsheets or databases, you are probably familiar with the Browser
format. Each row of the table contains one record, and each column in the record contains information
about a particular field (for example, last name, street address, order number, price, and so forth). The
name of the table appears in the Browser window title bar. Column titles appear directly below the
57MapInfo Professional User Guide
Page 58

Reviewing the Windows in MapInfo Professional
Browser window title bar, appearing as headings. You select a row by single clicking the empty box
appearing to the left of that row.
The Status Bar appears at the bottom left of the MapInfo Professional window. This bar displays the
range of records currently displayed within the Browser window out of the total number of records in
the table.
Opening a Table in a Browser Window
You can edit records in your table, copy records, add new ones, or delete existing records.
To open a Browser directly:
1. On the Window menu, point to New Browser Window.
2. If the Browse Table dialog box opens, then select a table from the list and click OK.
Your data displays within the Browser window.
MapInfo Professional 12.558
Page 59

Chapter 3: The Basics of MapInfo Professional
The table must be editable to make changes to it—it cannot be read-only.
• For more information, see Opening Multiple Browsers, Scrolling through a Table , and Using the Select
Tool to Edit Browser Entries in the Help System.
About Browser Window Tools and Menus
Browser Window Toolbar
The Browser window includes a toolbar of options that apply to the data in the Browser window.
Sort/Filter menu
Reapply
Selection menu
New Row
Displays a pop-up menu with the options to Sort Multi-Column,
Reapply Sort & Filter, Toggle Sort & Filter Off/On, Clear All Sort
& Filters, Clear Filters, Clear Sort, and Create a Query from the
Browser Contents. Unavailable options are shown in grey.
Re-applies your sort and/or filter conditions, so that any recent table
edits are applied.
Displays a pop-up menu with the option to Select All or Unselect
All.
Opens the Text Style dialog box.Text Style
Adds a new row to the end of the table and changes the view to
display the new, empty, row.
Opens the Pick Fields dialog box.Pick Fields
Browse Menu Options
When the Browser window is active, then you will see a Browse menu option in MapInfo Professional's
main menu. Selecting this menu displays the following options:
59MapInfo Professional User Guide
Page 60

Reviewing the Windows in MapInfo Professional
Text Style
Pick Fields
Sort Multi-Column
Reapply Sort & Filter
Toggle Sort & Filter
Off/On
Clear All Sort & Filters
Opens the Text Style Dialog Box where you select how to display the text
in the Browser window. This option is the same as choosing the Text Style
button from the Browser window toolbar menu.
Use Pick Fields to choose which fields display in the active Browser window.
You can also use Pick Fields to temporarily rename a column, creates a
new column that will display in the Browser window, or edit the expression
that defines an existing column.
Opens the Sort dialog box where you would make selections to perform a
multi-column sort in the Browser window. This option is also available from
the Browser window Sort/Filter menu button.
Reapplies your last sort/filter to the data in a Browser window. Re-applying
a sort and/or filter is useful after making changes to the data or after selecting
to turn the sort/filter off. This option is also available from the Browser window
Sort/Filter menu button.
Turns off a sort, so that you can view data as it appears in the table. After
turning a sort off, you can turn it back on to view the sort result. This option
is also available from the Browser window Sort/Filter menu button.
The Clear All Sort & Filters command removes all sort and filters that were
applied to the data in the Browser window. This removes the sort and filters
from memory, so you cannot reapply them again after making this selection.
This option is also available from the Browser window Sort/Filter menu
button.
Clear Filters
Clear Sort
Create a Query from the
Browser Contents
Hide/Show Toolbar
Clears the filter conditions from this column, and refreshes the Browser
window. The Clear Filter button is enabled after you have applied a filter
condition to the currently-selected column. This option is also available from
the Browser window Sort/Filter menu button.
Removes the sort that was applied to the data in the Browser window. This
removes the sort from memory, so you cannot reapply the sort after making
this selection. This option is also available from the Browser window
Sort/Filter menu button.
Opens the Create Query dialog box where you can select to open a new
query in a new Browser window, and add the query as a layer to an existing
map or to a new Map window. This option is also available from the Browser
window Sort/Filter menu button.
Selects and highlights all of the rows in the table that is the Browser window.Select All
Unselects the currently selected objects in a Browser window.Unselect All
The Hide/Show Toolbar command removes the toolbar buttons from view
in the Browser window. After hiding the Browser window tools, the Browse
menu displays the Show Toolbar command.
Displays or hide the grid pattern in the Browser window.Options
Right-Click Context Menu Options
Right-clicking on a column in the Browser window displays a pop-up menu with the following options:
Sorts the column containing text alphabetically starting from A to Z.Sort A to Z
Sorts the column containing text alphabetically starting from Z to A.Sort Z to A
MapInfo Professional 12.560
Page 61

Chapter 3: The Basics of MapInfo Professional
Sort Smallest to Largest
Sort Largest to Smallest
Filter
Clear Filter
Sorts the column containing numbers from the lowest (smallest) value to the
highest (largest) value.
Sorts the column containing numbers from the highest (largest) value to the
lowest (smallest) value.
Opens the Filter dialog box where you can set filter conditions for the column.
A filter may consist of up to two conditions where each condition is built from
a simple set of operations (such as equals, greater than, and so on) and
some set of values. After applying a filter to a column, an icon displays in the
column header to let you know that the column has a filter. You can apply as
many column filters as the number of columns in the table up to a limit of
100. Each new column filter is appended to the previous filters to produce
fewer records in the current view.
Clears the filter conditions from the column and refreshes the Browser
window. This only clears the filter on the right-clicked column, filters and sort
on other columns are preserved. The Clear Filter button enables after you
apply a filter condition to the column.
How a Browser Displays in a Layout
A Browser window displays with the column headings at the very top of the frame. Immediately below,
it displays the contents of the table, starting with the row and column at the upper-left corner of the table.
It displays as many columns and rows as it can fit in the frame, regardless of how many are displayed
in the table. When you resize the frame, the number of rows and columns displayed are adjusted
accordingly. However, fields removed from the table with the Pick Fields command (right-click on the
Browser window and select Pick Fields from the pop-up menu) are not displayed in a table frame.
The number of rows and columns that can be displayed in a frame depends on font size and column
width. The frame displays Table text using the font style and size for that Browser window. When you
want a different type style in the frame, you would select the Text Style button. When you use smaller
type, you can get more rows and columns in a frame.
You can also manually adjust column width in a Browser window without affecting the underlying field
size for the base table. You do this by clicking and dragging the short vertical bars separating the column
names in the Browser window.
The Browser window always has a current cell, which is never in a deleted row. The Browser window
scrolls as necessary to keep the current cell in view. When not in edit mode, the current cell displays
with a black border. When in edit mode, the current cell has a gold outline. You can use keyboard gestures
to move the current cell.
The Help System contains related topics:
• Showing or Hiding a Browser's Grid
• Adding and Editing Text in a Browser
• Entering Multi-Line Text
• Selecting and Deleting Rows in a Browser Window
• Undoing or Redoing an Action
• Adding Fields to a Browser
• Removing Fields from a Browser
• Adding a New Row to a Browser
• Resizing a Browser's Columns
• Printing a Browser View
• Setting Margins for a Browser Window when Printing
• Sorting Data in a Browser Window
• Toggle Sort and Filter Off or On
• Filtering a Column in a Browser Window
• Clearing a Sort and/or Filter
• Re-Applying a Sort and/or Filter
61MapInfo Professional User Guide
Page 62

Reviewing the Windows in MapInfo Professional
• Adding a Filtered View to a Map
• Creating a Default Browser View
• Choosing a Font for Your Browser Window
• Preserving Column and Expression Settings in a Browser Window
• Using the HotLink Tool in a Browser Window
For information about setting the background color for Browser window rows and other preferences,
see Setting your Browser Window Preferences.
Changing a Record's Data, Font, and Style
The Info tool allows you to choose an object or row and see a window displaying information from the
table about that object. Click another object with the Info tool button and its information appears in the
same window. Click the Ctrl-menu box (Close box) of the Info window to make it disappear.
Mouse Wheel Support for Browser indow
When you are working in the Browser window, you can use the mouse wheel to scroll through the
records. Roll the mouse button down to scroll down the list, and roll the mouse button up to scroll up the
list. You can use the Tab key to scroll right and the Shift+Tab keys to scroll left in the Browser window.
Displaying Data in a Graph Window
The Graph window allows you to visualize statistical relationships in graph format. You can create many
different kinds of graphs: 3D, area, bar, bubble, column, histogram, line, pie, scatter, and surface graphs.
You can also choose from a number of different graph templates.
To display a table as a graph:
1. From the File menu, click Open and select the table that you want to display as a graph.
2. On the Window menu, point to New Graph Window.
After the graph displays you can invoke one of several editing dialog boxes from the Graph menu to
modify an extensive array of attributes. You can also move and resize objects within the graph window
until the desired graph is achieved.
For details about using the graph features, see Graph Help System available by selecting (on the Help
menu, point to MapInfo Graphing Help Topics).
Displaying Data in a Layout Designer Window
The Layout Designer window lets you stylize your map for presentation and publishing. You can design
a map layout for print or to export to an image file for distribution.
To open the Layout Designer window, either:
1. On the Standard toolbar, click the Layout Designer tool.
2. On the Window menu, point to New Layout Designer Window.
After the Layout Designer window opens, you can add Map and Browser windows to your layout, add
images and shapes, and create a legend for the map layout. How you styalize the map and browser in
your layout does not affect the styles in your open Map and Browser windows.
You can save your map layout to a workspace to work on it in later sessions. Besides printing a layout
you can also export it to an image to include within a presentation or for distribution.
For details about the Layout Designer window, see Working with Layouts (on the Help menu, point to
Working with Layouts).
MapInfo Professional 12.562
Page 63

Chapter 3: The Basics of MapInfo Professional
Displaying Data in a Layout Window
The Layout window allows you to combine Browser windows, Map windows, Graph windows, and
other graphic objects into one layout which can then be sent to a printer or plotter. You use this type of
window to create presentation graphics. Layout windows have scroll bars at the right and at the bottom
like Map windows and Browser windows.
You can display rulers at the top and to the left to help you in positioning, sizing and aligning objects.
The Zoom displayed in the status bar indicates the magnification factor that is currently applied to the
layout. When the zoom is 37.46%, then the layout is being displayed 37.46% of its actual size. When
the zoom is at 123%, then the layout is being displayed at 123% of its actual size.
Opening a Map in a Layout Window
To use a Layout window, on the Window menu, click New Layout Window.
Note:
The Help System contains these related topics:
• Sending Objects to the Back of a Layout
• Sending Objects to the Front of the Layout
• Printing a Layout
• Setting Printing Margins for a Layout
• How a Map Legend Displays in a Layout
• Printing a Legend in a Layout
• Changing a Map Scale in a Layout
• Moving a Map or a Layout
For instructions for sending objects to the back of a layout, see Displaying Data in the Layout in the Help
System.
For instructions for sending objects to the front of a layout, see Displaying Data in the Layout in the Help
System.
MapInfo Professional has some excellent tools to assist you in moving around the Layout window.
See Getting Around in the Map Window for these details.
Other Windows for Displaying Data
There are two other ways of displaying data that are used less often or can be used in conjunction with
display options we have already reviewed.
• Legend Designer Windows display legends, or keys, to the cartographic data on your map. (Map
legends are the key boxes at the bottom of a map that explain what the map symbols mean.) The
Legend Designer window displays information for any map layer including thematic map layers. The
legend frames can all be in one Legend Designer window, or can be split among several Legend
Designer windows for the same map. Therefore, each map can have one or more Legend Designer
windows containing the frames of your choice. Additionally, you can customize the text and style of
the information presented. Modifications to the legend can be made through shortcut menus you
access by right-clicking in the Legend Designer window or through the Legend Designer menu. You
can learn more about legends in Working with a Thematic Map Legend.
• Redistricting Windows allow you to create groupings of spatial information. This is a little more complex
than these other options. For more information about redistricting windows, see Redistricting in the
MapInfo Professional Help System.
63MapInfo Professional User Guide
Page 64

Working with Tables in the Table List
Working with Tables in the Table List
The Table List window lets you perform operations for open tables in MapInfo Professional using fewer
clicks. You can organize tables into groups and sort them alphabetically and recently opened first. The
Table List window is accessible on the Table menu by pointing toTable List.
The Table List has the following features:
• Modeless, so that you can open it and leave it open for the duration of your session. (Modeless
windows do not have OK or Cancel buttons.)
• Dockable to any of the four sides of the MapInfo Professional window: top, left, bottom, and right. The
Layer Control window and Table List window can also share the same space.
• Drag and drop enabled, so that you can select tables and drag and drop them to a blank area to open
them in a new Map window. When dropping tables on to an existing Map window, MapInfo Professional
adds them to the Map window as new layers.
• Sorting enabled, to sort tables based on ascending order of table alias (name), descending order of
table alias, and recently opened. Sorting criteria persist across different MapInfo Professional sessions.
• Multi-Selection enabled, to select multiple tables using the Ctrl or Shift keys.
• Context Menu enabled, so that when you right-click on table aliases (names) a pop-up menu displays
and you can perform the desired operations.
• Searching enabled, you can search for a table name in the Table List window by typing characters
in a Search text box. The Table List window list refreshes itself to show only those tables that contain
the search characters.
Accessing the Table List
To access the Table List, do one of the following:
Click the Table List tool on the Main toolbar.•
• On the Table menu, point to Table List.
The Table List lets you manage open tables and their attributes. It is resizable. It supports two modes
of display:
• ListView - tables display as a list.
• TreeView - tables group according to the type they belong to.
About the Table List Window
To see the table names of the open tables, expand or collapse the groups using + and -.
Hovering over an entry in the Table List will display the path of the open table as a tool tip.
About the Table List Buttons
Click to switch to tree view mode.Group By Type
Click to switch to list view mode.Ungroup by Type
Click to sort tables in ascending order.Ascending order
Click to sort tables in descending order.Descending order
MapInfo Professional 12.564
Page 65

Chapter 3: The Basics of MapInfo Professional
Recently Opened
First
About the Table List Menu Options
Right-click on a table in the Table List to view a pop-up menu with the following options:
• Select All from - Select this option to select all the rows in the table together. If a table is selectable,
this menu item includes the table name. For unsupported tables, this menu option is unavailable.
• Browse - Select this option to open a table in a Browser window and edit records, copy records, add
new records, or delete existing records.
• Open in new Map Window - Select this option to open the table in a new Map window.
For more information, see Opening MapInfo Tables in the Help System.
• Export - Select this option to open the Export Table to File dialog box to export the table. You can
export graphics and tabular data to MapInfo Professional format (MIF). Only tabular data can be
exported to Delimited ASCII (*.txt), dBASE DBF (*.dbf), and Command delimited CSV (*.csv).
• Refresh - Select this option to refresh WFS, Universal Data, and DBMS tables. It is enabled for single
selection only.
WFS table - It refreshes the WFS layer based on the WFS server settings and the filter options set
for WFS Refresh in the Web Services Preferences. It is enabled for a WFS table when connection to
the Internet or intranet is established.
Click to sort tables based on the order they were opened. The most
recently opened table displays first. In tree view mode, the table type
nodes always display in ascending order. The sorting criteria persist
across different MapInfo Professional sessions.
Universal Data table - It refreshes the Universal Data table, such as AutoCAD®, Microstation Design®,
and ESRI ArcSDE datasets.
DBMS table -It refreshes a MapInfo Professional linked table with the most recent data residing on
the remote database for that linked table. It is enabled when there are no pending edits against the
table.
• Table Structure - Select this option to specify the field name, field type, number of characters (width),
and whether the field is to be indexed for each field in your new database. You also indicate whether
or not the table is mappable by associating graphic objects with records and, if so, whether the map
is to be an earth or a non-earth map. Collectively, this information is the structure of your database.
For more information, see Modify Table Structure Dialog Box in the Help System.
• Create Points - Select this option to create point objects for a database that has X and Y coordinates
or longitude/latitude coordinate information. These points can be displayed on a map. If you do not
have coordinates in your table, then use Geocode to match some other geographic information (such
as street address) against a table that already has graphic objects.
For more information, see Create Points Dialog Box in the Help System.
• Update Column - Select this option to change a column's value by updating a table based on its own
data values or by updating a table based on data from another table. This dialog box remembers the
column that was updated the last time update was run and the expression that was used for updating
a column the last time an update was run.
For more information, see Update Column Dialog Box in the Help System.
• View/Edit Metadata - Select this option to view the metadata of a managed table.
• Add to Library - Select this option to create a metedata record for the layer in the MapInfo Manager
Library. You can perform this operation only after selecting the Catalogs and Library Mode preference
for library services and while at least one unmanaged native table is open.
For more information, see the Catalog Browser Help System.
To set preferences for library services: on the Options menu point to Preferences, select Web
Services, and click the Library Services tab.
65MapInfo Professional User Guide
Page 66

Working with Tables in the Table List
• Close - Closing a table removes it from active use in your current session. When you close a table,
you automatically close all views of that table. When closing a table that displays in a Map window
with other tables, MapInfo Professional removes that table from the window and keeps the Map window
open.
For more information, see Closing a Table in the Help System.
Moving the Table List to Customize your Work Area
The Table List is a floating window, so that you can leave the Table List open throughout your session.
To move the Table List to another location in the application window:
Dock it to any of the four sides of the MapInfo Professional window: top, left, bottom, and right.
•
The Layer Control window and Table List window can also share the same space. You can dock
it also using the docking guides if you enable it from System Preferences. Look for System
Preferences dialog box.
• Undock it by double-clicking the Table List window title bar, so that it floats. You can then move
it to another location in the application window.
Note:
If your computer has two monitors, try dragging the Table List window on to the second monitor.
This arrangement allows more room for Map windows on the first monitor.
Selecting Multiple Tables in the Table List
Multiple tables can be selected with Ctrl, Shift keys, or arrow keys. Only Browse, Open in new Map
Window and Close options are enabled in the context menu for multi-selected tables.
In tree view mode, only tables can be selected. Table type nodes are not selectable.Note:
Dragging and Dropping in the Table List
To open multiple tables in a new Map window, select them (using the Ctrl and Shift keys) and then drag
and drop them on to a blank area. When dropping tables on to an existing Map window, MapInfo
Professional adds them to the Map window as new layers.
Tables can be dropped only on a Map window or an empty area in the MapInfo Professional.Note:
Sorting in the Table List
You can sort tables based on ascending order of table alias (name), descending order of table alias,
and recently opened. Sorting criteria persist across different MapInfo Professional sessions.
The following buttons sort the Table List view:
Recently Opened
First
The sorting criteria persist across different MapInfo Professional sessions.Note:
Click to sort tables in ascending order.Ascending order
Click to sort tables in descending order.Descending order
Click to sort tables based on the order they were opened. The most
recently opened table displays first. In tree view mode, the table type
nodes always display in ascending order.
MapInfo Professional 12.566
Page 67

Chapter 3: The Basics of MapInfo Professional
Searching the Table List
Searching Tables
You can search for a table name in the Table List by typing characters in the Search text box. The
Table List view refreshes itself to show only those tables that contain the search characters.
Clear Search
Typing in the Search text box causes the Search button to change to a Clear Search button. To clear
the contents of the Search text box, click the Clear Search button.
Working with Layers in the Layer Control
The Layer Control window lets you control the layers on display for all maps open in MapInfo Professional.
Select and Modify Many Layers at Once
Select multiple layers at once in the Layer list by using the Shift and Ctrl keys. Selecting a check box
for one of these layers then selects the check boxes for all selected layers. This is useful when turning
several layers off, because the map redraws only once instead of redrawing for each layer selection.
Modify multiple layers at once instead of having to modify layer properties one layer at a time. Use the
Shift and Ctrl keys to select multiple layers in the Layer list, and then click the Layer Properties button
to launch the Layer Properties dialog box. Changes apply to all selected layers making it easier to
ensure consistency in your layer settings. You can also set the style override for all selected layers by
clicking the style swatch for one of the layers, or set the labeling font for all the selected layers by
right-clicking on one of the layers and then choosing Label Font.
You can only modify a selection of similar layers; if you select different types of layers, such as a raster
layer and a pie theme, then the dialog box is not enabled.
Preview Style Changes before committing them
Style dialog boxes that are launched by clicking a style swatch for a layer in the Layer Control list include
a Preview button. Use this Preview button to see what the map will look like with your style changes
before committing the change. You can cancel the preview if you do not like what you see by clicking
the Cancel button in the style dialog box.
Apply Display and Label Overrides for when zooming the Map
At different zoom levels information on the map may be difficult to view. Changing (overriding) the display
style for specific zoom levels can help. As an example, to make the map easier to read, you may want
roadways to display using a thick line when zoomed in to the map, but a very thin line when zoomed out
of the map.
Right-clicking on a layer in the Layer Control list and clicking the Add a Display Override option creates
a display override for that layer. Right-clicking and clicking the Add a Label Override option creates an
override for labels for a layer. The first display override defaults to the zoom range of the layer. Adding
subsequent display overrides splits the zoom range of the first display override. You can then customize
the display style for the layer at each specific zoom level.
Reorder Layers
The Layer list has multi-select capabilities. To change the order of one or more contiguous layers, hold
down the Shift key, select the layers, and drag them up or down. To change the order of one or more
layers that are out of sequence, hold down the Ctrl key, select the layers, and drag them up or down.
When you begin to drag the layers, the cursor will change shape to represent the number of layers being
dragged. If you are dragging one layer, the cursor becomes an arrow icon with a single layer icon attached
67MapInfo Professional User Guide
Page 68

Working with Layers in the Layer Control
to the top. If you are dragging multiple layers, the arrow icon will display multiple layer icons at the top.
If you select layers that cannot be dragged or if you are attempting to insert layers where they cannot
be inserted, the cursor becomes a circle with a line through it.
A selection of layers that is out of sequence will become contiguous upon insertion.Note:
Use the Move Layers Up or Move Layers Down buttons to move one or more layers. You cannot
reorder or remove the Cosmetic layer. It will always be the top layer.
Group Layers
Group layers to organize them, so that you can show or hide the entire group with a single click.
Group Layers are not preserved when you do a Save Workspace As to a .MWS file.Note:
Quick View an Entire Layer
Right-click on a layer name and choose View Entire Layer to see the layer as a whole without going
through a dialog box.
Rename Maps
You can give a descriptive title for your map by right-clicking on the Map name (at the top of the layer
list) and choosing Rename Map.
Suspend or Resume Map Drawing
For those times when you want to make many quick changes, and you do not want the map to redraw
after each change, you can toggle the Automatic Map Drawing button to temporarily turn off map display.
• For more information, see Grouping Layers and Suspend or Resume Map Drawing, in the Help System.
Accessing Layer Control
To access the Layer Control window, do one of the following:
Click the Layer Control tool in the Main toolbar.•
• On the Map menu, point to Layer Control.
About the Layer Control Window
Use Layer Control to manipulate the layers and their attributes to determine the map display.
MapInfo Professional 12.568
Page 69

Chapter 3: The Basics of MapInfo Professional
Each row represents a layer on the map. You can select the following for each layer:
• Selecting the Visible check box displays a layer on the map.
• Clicking the Layer Type icon lets you edit style properties for the items in the layer, such as:
points
lines
regions
• Clicking the Editable icon makes the layer editable.
• Clicking the Selectable icon makes a layer selectable in the Map window.
• Clicking the Automatic Labels icon labels a layer automatically.
The buttons in the Layer Control window are described under About the Layer Control Buttons.
Visual indicators in the Layer list provide more information about a layer:
• When a layer is outside of its zoom range, the layer name is dimmed and there is an asterisk (*) beside
the Visible On/Off check box.
• Selecting an object, such as a point or line, in the Map window causes the layer name to appear in
bold.
• When you select a layer, it is highlighted in the list. You can select multiple layers by using the Ctrl
and Shift keys when making your selections.
See also:
• Map Layers
• Reordering Map Layers
• Grouping Layers
• Suspend or Resume Map Drawing
Layer Types
The Layer Type indicate the types of items in the layer, such as points, lines, regions, theme range, or
raster images. If the layer has a style override, then the icon indicates the style. You can show or hide
layer type icons by clicking the Layer Control Options button in the Layer Control window. Layer Type
icons include:
• For points, lines, and regions, click the icon to open the corresponding style dialog box and edit style
properties for the layer.
points
lines
regions
• A layer with a theme shows a thematic icon. For more about thematic layers, see Working with
Thematic Layers.
Range Theme
Bar Chart Theme
Pie Chart Theme
69MapInfo Professional User Guide
Page 70

Working with Layers in the Layer Control
Graduated Symbol Theme
Dot Density Theme
Individual Theme
Grid Theme
• A map tile server layer or a raster layer displays the following icon:
Raster Layer or Tile Server Layer
• A group layer icon indicates a group of layers. You can drag to move layers in to or out of the group.
Group Layer
Group layers are not preserved when you do a Save Workspace As to a .MWS file.Note:
About the Layer Control Buttons
The following buttons in the Layer Control window help you to control how the map displays layers:
Add Layers
Remove Layers
Move Layers Up
Move Layers Down
Click to open the Add Layer dialog box and add one or more layers
to the map. Select from the list of open tables. Your additions display
in the Layer list.
The Add Layers button enables when there is an active Map window;
the layers you add are for the active Map window. Before clicking
the Add Layers button, make a map active (bring it to the front) by
clicking on the map title in the layer list.
Click to remove selected layers from the Layer list. To select multiple
layers, press the Shift or Ctrl key while selecting layers.
Note:
Click to reorganize one or more layers in the list. To select multiple
layers, press the Shift or Ctrl key while selecting layers.
Click to reorganize one or more layers in the list. To select multiple
layers, press the Shift or Ctrl key while selecting layers.
The order determines which layers obscure the contents of the other
layers; the bottom layer in the list is the most obscured.
The Remove Layers button displays a confirmation dialog
box. If you would rather not see these confirmation prompts,
click the Layer Control Options button and un-check
Confirm Removal of Layers in the Layer Control Options
dialog box.
Layer Properties
Click to open the Layer Properties dialog box and set display
attributes, including label display and labeling rules, for selected
layers.
The Layer Properties button enables after selecting a single layer
or multiple layers of the same type. If you select two different layer
types, such as the cosmetic layer and a raster layer, then this button
does not enable.
MapInfo Professional 12.570
Page 71
Chapter 3: The Basics of MapInfo Professional
Modify Theme
Hotlink Options
Adjust Labeling
Priorities
Selectable Labels
Automatic Map
Drawing
Click to open the Modify Thematic Map dialog box and set display
attributes for a thematic layer. This button is only active after selecting
a thematic layer.
Click to open the Hotlink Options dialog box where you can specify
filename expression, file locations, what activates HotLink, and saving
options to table metadata. See Creating Active Objects in the Help
System. The Hotlink Options button enables only after selecting a
single layer.
Click to open the Adjust Labeling Priorities dialog box where you
can move layers up and down in the list to adjust layer priority when
Automatic Labeling is turned on for layers.
The Adjust Labeling Priorities button is enabled when the active map
has at least two layers that can be labeled (this does not include
raster, theme, or cosmetic layers).
Click to control whether you can select labels when you click on the
map. By default, labels are selectable. You might make labels
unselectable if you find that you are accidentally selecting labels on
the map when you were trying to select points or lines. This is a per
map setting, so each Map window has its own setting. Each map's
Selectable Labels setting is preserved when you save a workspace.
Click to allow map redraw or to turn off map display as changes are
made to layers. Select to suspend automatic redraw when there are
many layers that slow the redraw process.
Layer Control Options
Click to open the Layer Control Options dialog box and set which
maps show in the Layer list, enable confirmation when removing a
layer, disable tooltips in the Layer Control window, and show or
hide icons in the Layer Control window.
Moving the Layer Control Window to Customize Your Work Area
The Layer Control is a floating window, so that you can leave the Layer Control window open throughout
your session. It also docks to the side of the application window, so that you can customize your work
area.
To move the Layer Control to another location in the application window:
Undock it- Double-click the Layer Control window title bar, so that it floats. You can then move it
•
to another location in the application window.
• Dock it - Drag the Layer Control window by the title bar, toward the left or right side of the screen,
so that the Layer Control window snaps in to place.
Note:
If your computer has two monitors, try dragging the Layer Control window on to the second
monitor. This arrangement allows more room for Map windows on the first monitor.
Adding Layers to the Map
You can add one layer to the current Map window at a time or use the multi-select functionality to add
layers simultaneously.
Note:
• For more information, see the Help System.
You can only add layers from tables that are open. If you want to add a layer and you do not see
it in the list, make sure the table that contains that layer is open.
71MapInfo Professional User Guide
Page 72

Working with Layers in the Layer Control
Reordering Map Layers
Map layers display in the order that they are listed in the Layer Control window, with the bottom layer
drawn first and the top layer (which is always the Cosmetic Layer) drawn last. It is important to order
your layers correctly.
For example, you have a layer of customer points and a layer of census tracts. If the layers are incorrectly
ordered in the Map window, MapInfo Professional might draw the customer points first and then display
the census tract layer second. Your points would be obscured by the census tract layer. You can reorder
how layers are displayed in a Map window two ways.
• For more about layers, see Reordering Layers, Changing the Order of Contiguous Layers and Changing
the Order of Random Layers topics in the Help System.
Layer order is also important when you use the Select button. The Select tool selects objects from the
topmost Selectable layer. If you have several objects at the same location, it is difficult to select the exact
one you want. You can reorder your layers in Layer Control so that the layer you want to select from is
the new topmost layer.
MapInfo Professional does not allow you to control the front-to-back ordering of objects within a single
map layer. If you are editing a table, and you draw a line on top of a circle, the line might appear in front
of or behind the circle; you cannot control whether it is in the front or the back. You can, however, control
the front-to-back ordering of objects in a Layout window.
Note:
• For more information, see Removing a Layer from the Map and Changing how a Layer Displays on
If you need to control the ordering of objects (for example, you need to make sure that your lines
display on top of your regions), put the different object types in separate layers. Put your line
objects in one table, and put your region objects in another table. Then use the Layer Control
window to order the layers.
the Map in the Help System.
Setting the Zoom Layering
Sometimes you want a map layer to display only at certain zoom levels. Zoom Layering controls the
display of a map layer so that it displays only when the map's zoom level falls within a preset distance.
For example, you have a layer of streets and a layer of postal code boundaries. When you zoom out
past 10 or so miles, the streets look like a black smudge in the window. This is because the zoom (window
width) is too wide to show detailed street maps. Use Zoom Layering to tell MapInfo Professional to display
MapInfo Professional 12.572
Page 73

Chapter 3: The Basics of MapInfo Professional
the street layer only when the zoom is set to a distance that allows you to see the street detail properly,
for instance, less than 5 miles.
The first map does not have zoom layering set for its street layer. At a zoom of 15 miles across, notice
how difficult it is to see any detail. The second map has zoom layering set to display the streets when
the zoom is less than five miles. Therefore, the streets layer does not display when the window is set at
15 miles.
For more information, see Setting the Zoom Layering in the Help System.
You can display different layers in the same Map window at different zoom levels. For example, you
have a layer of streets, a layer of county boundaries, and a layer of state boundaries. You want the
streets layer to be visible only when the zoom level is less than eight miles. You want the county boundary
layer to display when the zoom level falls between 20 miles and 200 miles. You want the states boundary
layer to be visible only when the zoom level is greater than 100 miles. You can set a different zoom level
for every layer in your Map window.
Note:
For more information, see Changing a Map's Zoom Level in the Help System.
When you add an object, a region, a line, or a polyline in the Map window and zoom out beyond
where the zoom layer would permit you to see that feature, MapInfo Professional turns off zoom
layering so you can continue to see what you are working on. When you complete the add
process, a message displays asking you if you want to leave zoom layering off (so you will still
be able to see the feature). If you click Cancel, MapInfo Professional cancels the zoom layering.
If you click OK, you need to adjust your zoom settings to see this feature again.
Positioning and Sizing Labels
To label a map object using the Label button:
1. Make sure that the layer containing the objects you want to label is selectable. Choose Map > Layer
Control and click the Selectable icon to make the layer selectable.
2. Click the Label button in the Main toolbar.
3. Click on an object with the Label button to display a label for that object.
MapInfo Professional labels the object with the values (from the column that you specified for that layer
in the Layer Properties dialog box on the Label Display tab).
Changing Label Options
Two features in the Layer Properties dialog box help you with label placement: Label Position and
Offset.
To change label options:
1. Choose Map > Layer Control. The Layer Control window opens.
2. In the Layer list, double-click the layer name. The Layer Properties dialog box opens.
3. Select the Label Display tab and specify the desired label options, such as label style.
4. Select the Labeling Rules tab and specify the desired label placement and label adjustments, such
as allow or discard overlapping text, try other positions when overlapping occurs, allow duplicate
text, and label partial objects.
Label Position (also called the anchor point) is the label's position relative to the map object. Click
on one of the buttons to select an anchor point. You have nine choices.
The anchor point is an ongoing attribute of the label. For example, if you anchor a point object's label
at Center Left and you increase the label's font size, the text will grow to the left. This way, the text
can never overwrite the point.
The default anchor point varies with the type of map object you are labeling:
• Regions default to Center.
73MapInfo Professional User Guide
Page 74

Working with Layers in the Layer Control
• Lines default to Below Center.
• Points default to Right.
Label Offset is how far away a label is from its anchor point. Specify the number of half spaces you
want the label to be from the anchor point in the Label Offset box.
5. Click OK.
The map redraws with your changes.
Label Size
Label size does not change with zoom or scale changes. Labels display at the size you specify at all
zoom levels as well as on printed output. Labels are never hidden behind other geographic objects
because they are always the last objects drawn on the map.
Displaying the Lines, Nodes, and Centroids
The Layer Properties dialog box allows you to display line directions, nodes, and object centroids.
Select the Show Line Direction check box when you want to show the direction in which line objects
are drawn. Check the Show Nodes check box to display the nodes in a layer.
The Show Centroids box displays the centroids of each object in a layer. In MapInfo Professional, a
region's centroid does not represent its center of mass. Instead, the centroid represents the location
used for automatic labeling, geocoding, and placement of thematic pie and bar charts. If you edit a map
in Reshape mode, you can reposition region centroids by dragging them.
See the Help System for these related topics:
• Changing a Layer's Labeling Options
• Changing a Region's Centroid
• Changing a Label's Style
• Drawing Autolabels
For instructions on inserting table-based style in the Layer Control window, see Inserting Styles into
Tables in the Help System.
Understanding the Cosmetic Layer
Every Map window in MapInfo Professional has a Cosmetic Layer. Think of the Cosmetic Layer as the
blank transparency that lies on top of the other map layers (transparencies). It can store map titles and
other graphic objects you create during a work session. The Cosmetic Layer is always the top layer of
the map. You cannot remove or reorder the Cosmetic Layer.
You can only make the Cosmetic Layer editable or selectable. Other Layer Control options (labeling,
zoom layering, display mode) are not available for the Cosmetic Layer. To select fill patterns, line types,
symbols, and text font for the Cosmetic Layer, use the Line Style, Region Style, Symbol Style and Text
MapInfo Professional 12.574
Page 75

Chapter 3: The Basics of MapInfo Professional
Style commands from the Options menu. When the Cosmetic Layer is editable, you can access the style
options from the Drawing Toolbar.
The contents of the Cosmetic Layer are linked proportionally to the map. Map objects (except for symbols)
and text in the Cosmetic Layer are proportionally linked to the zoom level of the map. If you draw objects
in the Cosmetic Layer and then change the map's zoom from 30 to 100 miles, the size of the objects will
appear smaller.
The Help System contains these related topics:
• Using the Cosmetic Layer
• Saving Cosmetic Layer Objects
• Saving Objects on the Cosmetic Layer
• Removing Cosmetic Objects
• Disabling the Save Cosmetic Objects Warning Dialog Box
Making the Layers "Editable"
To make changes to the graphic objects in a layer, you must make the layer editable. You can draw
objects on that layer, add text, combine, or delete objects. You can only make one layer editable at a
time.
• For specific instructions, see Making Layers Editable in the Help System.
Making a Read-Only Table "Editable"
If you are working with tables that were opened from Excel, Lotus, or ASCII files, you may have noticed
that they come in as read-only tables. Because the files are not in native MapInfo Professional formats
or standard DBF format, MapInfo Professional is unable to edit the tabular information contained in these
tables.
If you wish to modify the table information, you must save a copy of the table. You can do this when you
open the table in MapInfo Professional by selecting the Create copy in MapInfo format for read/write
check box before selecting Open in the Open dialog box.
• For instructions on making read-only map layers editable, see Making Layers Editable in the Help
System.
Getting Layer Information
You can use the Info tool button to get information pertaining to the map layer.
To get information about an object in a particular layer:
1. Make sure the layer you want information about is the selectable layer.
2. Click Info in the Main toolbar and click the object you want information about.
Note:
Using either method, the Info Tool box displays.
If the information that displays is not what you were looking for, check to see that the layer
you are interested in getting data for is selected.
75MapInfo Professional User Guide
Page 76

Working with Layers in the Layer Control
Note:
When you click a map location using the Info button where two or more selectable map objects overlap,
the data tied to the objects on each layer display in the Info tool window. If you do not want the information
for all layers to display, turn off Selectable for those layers in the Layer Control window.
You can also view an object's label expression in an InfoTip when you use the Select, Info, or Label
buttons. InfoTips work very much like ToolTips. Using one of these tools, place your cursor over an
object. An InfoTip displays the label expression for the object in the topmost selectable layer. To set
InfoTips for a particular layer, adjust the Selectable attribute in the Layer Control window so that the Tips
display for the layer you want. InfoTips are active by default, but you can turn them off in the Map window
preferences (on the Options menu, point to Preferences and click Map window).
Use the Ctrl key with the Info button to toggle through all selectable layers and access
overlapping objects.
Selecting Objects in a Layer
If you only want to select objects for further analysis rather than edit the objects, make the layer selectable.
More than one layer can be selectable at a time. If a layer is editable, it is also selectable.
Many MapInfo Professional functions require that map objects be selected before performing the particular
operation. To use the Select button, Label button or Info button you must first make the layer selectable.
Unlike the editable feature, more than one layer may be selectable at the same time. You may, however,
only select from one layer at a time.
The Select button selects objects from the topmost Selectable layer. To select an object that is not in
the top Selectable layer, you can turn off the Selectable option in Layer Control for every layer above
the layer you want to select from by selecting a layer's Selectable icon to deactivate it. Alternately,
you can leave all layers Selectable and use the Ctrl key in combination with the Select button to cycle
through each Selectable layer.
Note:
• For instructions on making objects in a layer selectable, see Selecting Objects in a Layer in the Help
The instructions for making a layer editable are the same, except that you select Editable On/Off
instead.
System.
MapInfo Professional 12.576
Page 77

Chapter 3: The Basics of MapInfo Professional
For example, if you want to find all customers who live within a fifty kilometers radius of Paris, make the
Street layer selectable. If the map also includes a layer of hospitals (which you do not want to include
in the radius search), turn off the Selectable option for the hospital layer.
The Editable or Selectable options only apply to the Map window itself. You can always select objects
using the Select or SQL Select commands regardless of whether a layer is selectable.
Working with Thematic Layers
When you create a thematic map in MapInfo Professional, the thematic shading is added to your map
as a separate layer. It is drawn on top of the layer, from which it gets the raw data. Separating a thematic
layer from its base layer provides you with several important options:
• Graduated symbol thematic maps do not require that your base layer contain point objects. Instead,
graduated symbol objects are built regardless of the map object type. Therefore, even if your base
layer contains region or line objects, you will still be able to create a graduated symbols map.
• You can have multiple thematic layers per base layer. In some cases, you do not have to add another
base layer to the map to create another thematic layer. You can display more than one thematic layer
at a time, as well as perform bivariate thematic mapping.
• You can use Layer Control to turn the display on or off for a given thematic layer. The layer it is based
on can continue to display. You can also set individual zoom layers on thematic maps.
Ordering Thematic Layers
To display thematic layers properly, they must be in a specific order. This is especially important when
you want to display more than one thematic layer at a time. For example, you would want pie or bar
charts for an area map to display on top of regions that are shaded in order to see them.
The following lists the order of map layers from top to bottom (note that map layers are drawn from the
bottom up):
1. Pies, Bars, or Graduated Symbol thematic layer.
2. Dot Density thematic layer.
3. Ranged thematic layer - where Color or Size Attributes are applied.
4. Ranged (or Individual Value) thematic layer - where All Attributes are applied.
5. Major layer or base layer.
6. Grid thematic layer.
When you create a new thematic layer, MapInfo Professional automatically inserts it into its proper place.
• For more information, see Reordering Thematic Layers in the Help System.
Displaying Thematic Layers
You can turn the display on and off for thematic layers the same way you can for other map layers. All
the display settings in Layer Control are also applicable to thematic layers, enabling you to set a zoom
level for each thematic layer. You can also access the Modify Thematic Map dialog box through Layer
Control by double-clicking a Thematic layer.
Thematic layers are always drawn after their base layer. Therefore, they appear above their base layer
in the Layer Control list, and are indented to distinguish them from other map layers.
Thematic layers are displayed in the list with this naming convention:
<Thematic type> with/by <variable-list>
77MapInfo Professional User Guide
Page 78

Working with Thematic Layers
The type of thematic map is noted first, followed by the list of variables used to create the map. For
example, a pie thematic layer that uses commuting data is listed this way:
Pies with ComAlone, ComCarpool...
The variable list is truncated if there is not enough room to display each variable used in your thematic
analysis. For more information about thematic mapping, see Using Thematic Mapping to Analyze
Information.
Converting Objects into Region Objects
When you convert a circle or ellipse into a region, the region contains 101 nodes. When you convert an
arc into a region, the number of nodes depends on the starting and ending angle of the arc. If the arc
spans 180 degrees (for example, the starting angle is zero and the ending angle is 180), a region based
on the arc will contain 52 nodes; if the arc spans 90 degrees, a region based on the arc will contain 27
nodes; etc.
If you perform extensive map editing, you may need to convert polylines to regions. If you cut or copy a
group of selected nodes, MapInfo Professional treats the set of nodes as a polyline object, and places
the polyline on the clipboard. If you then paste the object, MapInfo Professional places the polyline on
your map. At this point, you may want to perform Convert to Regions, depending on whether you want
the finished object to be a region.
Convert to Regions also allows you to perform node-editing operations (for example, adding and moving
nodes) on objects that ordinarily do not allow node editing. For example, MapInfo Professional does not
allow you to add nodes to rectangle objects; however, if you convert a rectangle object to a region, you
can then add nodes to the region.
To convert objects into region objects:
1. Make the Map window active.
2. Choose the layer containing the objects and make it editable.
3. Select one or more objects from the editable layer.
4. Choose Objects > Convert to Regions.
When you choose Convert to Regions, MapInfo Professional converts each of the selected objects
into a region object. Each object is converted into a separate region; MapInfo Professional does not
combine all selected objects into one region. To combine objects, use the Combine command.
MapInfo Professional automatically assigns the current region style to each of the region objects. To
specify a region style, choose Options > Region Style.
Line, polyline, arc, ellipse, rectangle, and rounded rectangle objects may all be converted to regions.
The Convert to Regions command does not affect point objects, text objects and region objects.
5. For more information, see the Creating Regions from Polygonal Areas Enclosed by Polylines topic
in the Help System.
Working with Raster and Grid Layers in Layer Control
A raster image is a type of computerized image that consists of row after row of tiny dots (pixels). If you
have a scanner and scanner software, you can create a raster image by scanning a paper map. After
you scan a map image and store the image in a file, you can display the file using MapInfo Professional.
In contrast, vector images contain coordinate-based data structures represented by x and y coordinates
(most of MapInfo Professional's data is in vector format).
The Help System contains these related topics:
• Displaying a Raster Image
• Registering the Coordinates of a Raster Image
• Working with Raster Images
MapInfo Professional 12.578
Page 79

Chapter 3: The Basics of MapInfo Professional
• Changing the Display of a Raster Image
Converting Grid Files to MapInfo Professional Grids (*.mig)
The Grid Tools (Create MapInfo Grid from Table of Objects and Create MapInfo Grid from Other Grid
Files) In MapInfo Professional allow you to convert Grid Files to MapInfo Professional Grids (*.mig).
These tools convert any grid file for which there is a grid handler present with the output being in MapInfo
Professional (*.mig) format. You can apply relief shading from a user-specifiable virtual light source and
control the color inflection values. The color files are simple text files that you can edit to specify the
color inflection values by specific value or as a percentage of the range of data values. You can open
and display the new grid after the conversion.
• For specific instructions, see Converting Grid Files to MapInfo Professional Grids and Specifying
Inflection Values with the MapInfo Professional Grid Converter in the Help System.
Adjusting the Translucency of a Grid Thematic Map
The Translucency slider control in the Modify Thematic Map dialog box allows you to control the
percentage that layers show through raster images. A translucent image allows you to partially see
through the image. Translucent images can be layered on top of other layers so that the lower layers
are partially visible through the image.
Note:
• For specific instructions, see Adjusting the Translucency of a Grid Thematic Map in the Help System.
The Grid Appearance dialog box allows you to specify color inflection distribution options for
grid maps.
Working with Seamless Layers
Use or create a seamless map layer to treat a group of base tables as if they were one. A seamless
layer allows you to change display attributes, apply or change labeling or use the Layer Control window
for an entire group of tables at once. You can also retrieve information using the Info tool, and select or
browse any one of the layer's base tables. A base table can be any regular MapInfo Professional table.
Grid layers cannot be made seamless.
This feature is especially useful when you want to display a vector or raster backdrop for your maps
such as joining street or boundary maps. For example, you may have a seamless layer of county
boundaries made up of several individual county tables.
When zooming in on a seamless layer, MapInfo Professional only opens data for displaying the map at
the specific zoom level-only those component tables on display open. If you change the zoom level, then
MapInfo Professional analyzes which tiles to open and which tiles to close, and does not cache the data.
Specific raster handlers open raster images, which are usually slower than vector tables.
Features Available with Seamless Layers
Since a seamless layer is actually made up of several base tables, MapInfo Professional does treat it a
little differently than a regular MapInfo Professional table. You can use the following MapInfo Professional
features with a seamless map layer:
• Layer Control - Use any of the functions except Thematic Mapping from the Layer Control window
on your seamless layer. Add, remove, or reorder layers or set display, zoom layering or label options
for the seamless layer (all base tables) at one time. However, you cannot make a seamless layer
editable.
• Info Tool - Retrieve information about a particular object in a base table.
79MapInfo Professional User Guide
Page 80

Working with Seamless Layers
• Select Tools - Select objects from the seamless layer. You can only select a group of objects if they
reside in the same base table. Press the Shift key while clicking the Select Tool to do so. If you attempt
to select several objects that reside in different base tables, MapInfo Professional will only select
objects in one base table. If you use the Marquee or Radius select tools and the selected area spreads
across two different base tables, MapInfo Professional selects the table in either the center of the circle
or polygon.
• Browse Table - Display a Browser window of a particular seamless table. You are prompted to select
a base table.
Turning Seamless Layers On and Off
If you need to edit the structure of your seamless layer, you will need to turn your seamless layer off.
To turn your seamless layer off:
1. Choose Options > Show MapBasic Window. The MapBasic Window displays.
2. Type set table "tablename" seamless off. MapInfo Professional turns off the seamless layer.
3. Display the table in a Browser to view or edit its table structure. If you edit the table structure, you
will need to recompile the seamless layer.
MapInfo Professional turns off the seamless layer. Display the table in a Browser to view or edit its table
structure. Use the Seamless Table Manager to add or create seamless tables.
To turn the seamless layer on:
1. Choose Options > Show MapBasic Window. The MapBasic Window displays.
2. Type set table "tablename" seamless on. MapInfo Professional turns the seamless layer on again.
Opening a Seamless Map Layer
MapInfo Professional includes sample seamless maps or you can create your own. Some of these data
files are available on the Pitney Bowes Software Inc. web site in the MapInfo Professional Tutorial data.
We recommend you download this data for use with these examples.
From the mapinfo\tutorial\tut-usa\usa\dc\seamless directory, choose dcmetrow. A seamless map
layer of water areas in Washington DC displays. Notice at first glance that the seamless layer looks like
any other MapInfo Professional table. However, the Dcmetrow seamless map layer is made up of the
following base tables:
• VAARLIW.TAB (Arlington Virginia water areas)
• VAALEXW.TAB (Alexandria Virginia water areas)
• DCWASHW.TAB (Washington DC water areas)
To display a sample seamless map:
1. On the File menu, point to Open.
2. From the data directory, choose a seamless layer.
The following is an example of a map layer of water areas in Washington DC.
MapInfo Professional 12.580
Page 81

Chapter 3: The Basics of MapInfo Professional
The structure of each seamless layer includes the path name of each base table plus a description that
defaults to the table name (alias). To view the table structure, turn the seamless layer off and display
the seamless table in a Browser. Refer to Turning Seamless Layers On and Off.
Characteristics of a Seamless Layer
Since a seamless layer is actually made up of several base tables, MapInfo Professional does treat it a
little differently than a regular MapInfo Professional table. You can use the following MapInfo Professional
features with a seamless map layer:
• Layer Control. Use any of the functions except Thematic Mapping from the Layer Control window on
your seamless layer. Add, remove, or reorder layers or set display, zoom layering or label options for
the seamless layer (all base tables) at one time. However, you cannot make a seamless layer editable.
• Info Tool. Retrieve information about a particular object in a base table.
• Select Tools. Select objects from the seamless layer. You can only select a group of objects if they
reside in the same base table. Press the Shift key while clicking the Select button to do so. If you
attempt to select several objects that reside in different base tables, MapInfo Professional will only
select objects in one base table. If you use the Marquee or Radius select buttons and the selected
area spreads across two different base tables, MapInfo Professional selects the objects in the center
of the circle or polygon.
• Browser Table. Display a Browser window of a particular seamless table. You will be prompted to
select a base table.
• For more information, see Creating/Compiling a Seamless Layer in the Help System.
• For more about Seamless Layers in general, see the MapInfo Professional Help System.
The Help System contains these related topics:
• SExperimenting with a Seamless Layer
• SSpecifying Search Paths for Component Tables of a Seamless Layer
• STurning Seamless Layers On and Off
Experimenting with a Seamless Layer
Open a seamless layer, click Layer Control to display the Layer Control window.
81MapInfo Professional User Guide
Page 82

Working with Seamless Layers
In the Layer Control window, you can add, remove, or reorder seamless layers as if they were
conventional MapInfo Professional layers. You can also set Label and Display options for all the tables
in the seamless layer as if they were one table. Notice the editable option for a seamless layer is grayed.
Choose your seamless layer and experiment with order, display, and labeling options.
To retrieve information from a seamless layer:
1. From the Main Toolbar, click the Info button.
2. Click the object for which you want information to open the Info Tool window. It contains the
information about the object you selected including the name of the base table in which it is stored.
To browse the seamless layer:
1. On the Window menu, click New Browser Window to open the Browse Table dialog box.
2. Select a layer (table) from the list and click OK to open the Select Base Table dialog box.
3. Type the name of the base table you want to browse. We typed XX to indicate an unknown table. A
Browser window with the base table you selected displays. If a base table matching your description
is not found, a list of possibilities displays.
Keep in mind, base tables are treated like any other MapInfo Professional tables. Once a base table
from a seamless table is browsed, it will be opened as any other regular MapInfo Professional table.
4. To select a base table from the list, highlight it and click OK.
Specifying Search Paths for Component Tables of Seamless Layers
You can set search paths to look for the component tables of a seamless layer.
To set the search path for the component tables of a seamless layer:
1. On the Options menu, click Preferences and click the Directories button. The Directory Preferences
dialog box displays.
2. In the Search Directories for Tables group, click Add.
3. Specify a drive and directory in the Choose Directory dialog box and click OK.
You can set up to four paths. Use the Up and Down keys to change the search order and use the
Add and Remove buttons to add or remove paths from the list.
4. Click OK to close the Preferences dialog box.
See Also:
Map Layers
MapInfo Professional 12.582
Page 83

Chapter 3: The Basics of MapInfo Professional
Turning Seamless Layers On and Off
Using the Tools in the Tool Manager
Working with MapInfo Manager Library Services
The Library Service lets you access the metadata records published in MapInfo Manager. You can
access Library Services by selecting Options > Preferences > Web Services > Library Services. For
enabling the Library Services, refer to Setting the Library Services Preferences.
After setting the Library Services preferences to Catalogs and Library, the Table List window shows
the status of the tables and if they are managed or not by the MapInfo Manager library.
• If the table list shows against a particular table, it means the table is managed by the MapInfo
Manager.
• If the table list shows against a particular table, it means the table is not managed by the MapInfo
Manager.
• If the table list shows no icon against a particular table, it means that the table is not manageable,
such as a selection table, query table, or seamless table.
To manage a table you can use the following:
• Add to Library icon on the Main toolbar
• Add to Library from the Table menu.
Add to Library
To create a metedata record for a table in MapInfo Manager Library:
1. From the Table menu, select Add to Library.
Note:
2. In the Select Table for Adding to Library dialog box, select the table you want to add to the library.
This operation can be performed only if the Catalogs and Library Mode is selected from Library
Service Preferences and atleast one unmanaged native table is open.
3. In the Select Library Folder dialog box, select the folder where you want to add the selected table.
This dialog displays the folders published by a Library Service in a hierarchical structure. You can
select the appropriate checkboxes from the After upload is complete section to get the preferred
operations after the table uploads. If the table is added sucessfully, its metadata window is displays.
• View Metadata of Managed Table - If this option is enabled, MapInfo Professional displays
• Open Managed Table - If this option is enabled, MapInfo Professional opens a managed table in
You can also select the Add to Library icon on the Main toolbar.
metadata for the uploaded table. This option will persist across different sessions of MapInfo
Professional.
a seperate mapper window. This option will persist across different sessions of MapInfo Professional.
83MapInfo Professional User Guide
Page 84

Saving, Closing, and Exporting Your Work
Saving, Closing, and Exporting Your Work
Preserving your work is an important part of being productive. MapInfo Professional has a wide variety
of ways you can save what you are working on, depending upon what needs to be saved and how you
need to retrieve it.
Saving a MapInfo Workspace
If you work with the same tables repeatedly, you know that opening each one individually every time
you use it can be tedious. With MapInfo Professional's workspace feature, you can automate this process
so you can get back to the business of creating maps and analyzing data sooner.
When you work with MapInfo Professional you generally use many different tables and windows. A Map
window, for instance, is likely to be built of several layers. MapInfo Professional uses workspaces to
save your work setup from session to session. Workspaces prevent you from having to reassemble all
the pieces of your earlier setup from scratch. So, you do not have to reopen tables, re-create maps or
layouts, resize windows, or do anything else just to duplicate what was on your desktop the last time
you were using MapInfo Professional.
Saving a workspace will not save edits you have made to tables in the workspace.Caution:
If you close a window or table and you have thematic maps, graphs, label settings or label edits, or
cosmetic objects pending, MapInfo Professional will prompt you to save the session to a workspace.
• For more information, see Saving a Workspace and Saving a Map Window as a .TAB File in the Help
System.
• For instructions on saving a Map window as a .TAB file, see the Help System.
Saving Your Workspace as an XML-Based MWS File
You can save the maps in your workspace out to an XML format for use with MapXtreme (2004 or later)
applications. When saving a workspace to MWS format, only the map windows and legends are saved.
All other windows are discarded as MapXtreme applications cannot read that information. Once your
workspace is saved in this format, it can be opened with the Workspace Manager utility that is included
in the MapXtreme installation or with an application developed using MapXtreme. The file is valid XML
you can view it using any XML viewer or editor.
You can set the visibility of a modifier theme without regard to its reference feature layer, so you can
turn the visibility of the main reference layer off but still display the theme. In MapXtreme, the modifier
themes (Dot Density, Ranges, Individual Value) are only drawn if the reference feature layer is visible.
To ensure that modifiers marked as visible in MapInfo Professional display in tools like Workspace
Manager, we force the visibility of the reference feature layer so that its modifier themes display.
• For specific instructions, see Saving your Workspace as an XML-Based MWS File in the Help System.
• For more information, see Caveats for Saving Label Expressions to MWS and Caveats for Saving
Thematic Expressions to MWS in the Help System.
Exporting to GeoTIFF (*.tif) Format
MapInfo Professional includes the capability of exporting Map windows to GeoTIFF (*.tif) export format.
GeoTIFF files are designed to connect a raster image to its location on the earth. Georeferencing
information is written directly to the *.tif file so that it can be used in other applications. This section
explains the requirements for exporting maps to GeoTIFF format. Using GeoTIFF format has the following
requirements:
• The window you are exporting is a Map window.
MapInfo Professional 12.584
Page 85

Chapter 3: The Basics of MapInfo Professional
• The Map window's projection contains an EPSG code. Projections that do not have an EPSG code
are not supported.
• The Map window must not be rotated, or contain a raster image that causes a rotation.
GeoTIFF Export Procedure
To export a Map window to a GeoTIFF format file, do the following:
1. Open the desired layers in a Map window, if you do not have your map open already.
2. Make the Map window active.
3. Choose File > Save Window As. The Save Window As dialog box displays on the screen.
4. In the Save in box, select the destination folder of the exported file.
5. In the Save as type drop-down list, click the arrow to see the file format choices. Select GeoTIFF
(*.tif).
6. In the File name box, enter a name for the exported file.
Click Save and continue with the normal Save Window As process.
• For more information about the conditions of GeoTIFF exporting, see Exporting to GeoTIFF Format
in the Help System.
Saving a Table or a Copy of a Table
To save changes to map objects or data, you must save the table. (On the File menu, click Save Table.)
A dialog box displays asking you to choose which table you want to save.
You can also save a copy of the table under a new name, using Save Copy As. This, in essence, creates
a new table. This is helpful in several instances, as when you want to:
• Retain any changes while preserving the original table.
• Save a table with a temporary column (from Update Column).
• Create a new table before you make editing changes to the original table.
• Save spreadsheet files that you wish to modify in MapInfo Professional.
• Save a table in a different projection.
To save a copy of the table:
1. On the File menu, click Save Copy As. The Save Copy of Table dialog box displays.
2. Choose the file to save and click OK.
3. Give the file a new name.
The original table remains unchanged and open for all further changes. The new table does not open
immediately after its creation, but can be opened for use at any time. When choosing a name for your
new table that begins with a number, MapInfo Professional adds an underscore to the beginning of the
table name. For instance, your table 1STREETS.TAB will become _1STREETS.TAB.
Saving a copy of a raster table only saves a copy of the *.tab file, not the image. You cannot change the
projection of a raster or grid table using Save Copy As. To do this go to the Table menu, point to Raster
and click Modify Image Registration and click the Projection button. Then save the file from there.
Since MapInfo Professional supports long filenames, it is easier to give the new table a name that is
descriptive and at the same time distinguishes it from the original file.
The Help System contains these related topics:
• Saving a Copy of your Table as a New Table
• Saving a Copy of Your Table in a Different Projection
• Tables you Cannot Update
• Choosing Ascending vs. Descending Sorts
• Column Name Syntax in the Order By Columns Field
• Rearranging a Table's Column Order
85MapInfo Professional User Guide
Page 86

Saving, Closing, and Exporting Your Work
• Saving Changes Made to a DBMS Table
• Saving a Copy of a Table to a DBMS Server
Closing a Table
Closing a table removes it from active use in your current session. Choose the Close command from
the File menu to close tables. When you close a table, you automatically close all views of that table. If
you close a table that is displayed in a Map window with other tables, MapInfo Professional removes
that table from the window, but the Map window remains open.
In addition, any subset tables of the original table (known as query tables) also close. You can use the
Close command for any table, whether or not it is displayed in a window. Opening and closing tables is
different from opening and closing windows in which you view your tables. You can open a table without
opening any views of the data. Similarly, closing a window does not close the table (or tables) you are
viewing in the window. They are still open and available for use. To close a window, click the Ctrl-menu
box in the upper-left corner of any window and select Close.
If you have made changes to a table but have not yet saved those changes, MapInfo Professional will
ask you if you want to save them before closing the table. To save your changes, choose Save Table
from the File menu.
• For more information, see Closing a Table, Closing All Open Tables, and Closing Multiple Tables in
the Help System.
Opening vs. Importing
You must open a table before you can use it. The Open command activates a dialog box for opening
tables, (opening a table is described below). Choose the appropriate table by double-clicking on it in the
dialog box.
Most programs require you to import files created in some other programs. MapInfo Professional allows
you to work directly with files created in other programs. When you have a file in one of the following
non-MapInfo Professional formats, you do not have to import it:
• dBase DBF
• Delimited ASCII
• Lotus 1-2-3
• Microsoft Access Database
• Microsoft Excel
By not importing data you save time; opening a file is quicker than importing it. You also save disk space.
When you import a file, you make a copy of it. Since MapInfo Professional works directly with files from
other programs, it does not have to make a copy.
When MapInfo Professional opens a file from some other program, it creates a file with a .TAB extension.
This file describes the format of the file that actually contains the data. When you have opened a
non-MapInfo Professional file, such as a Lotus file, in a previous session and attempt to open it again,
the following prompt appears:
Table definition already exists. Overwrite it?
The table definition referred to is the .TAB file. It does not hurt anything if you continue. MapInfo
Professional overwrites the .TAB file and opens the file.
MapInfo Professional 12.586
Page 87

Chapter 3: The Basics of MapInfo Professional
Exporting Your Data to a New Format
You can export your Map window to other file formats with the Save Window As command (on the File
menu, click Save Window As). This enables you to use your map in another application, such as word
processing, presentation, or computer publishing packages.
Supported Export Formats
You can save data in a number of formats in MapInfo Professional. Windows .bmp is the initial default.
The Save Window to File dialog box sets the last-used format as the default. Formats include:
• Windows Bitmap (*.BMP)
• Windows Metafile (*.WMF)
• Windows Enhanced Metafile (*.EMF)
• EMF + Metafile (*.EMF)
• EMF + Dual Metafile (*.EMF)
• JPEG File Interchange Format (*.JPG)
• JPEG 2000 (*.JP2)
• Portable Network Graphics Format (*.PNG)
• Tagged Image File Format (*TIF)
• TIFF CMYK (*.TIF)
• TIFF CCITT Group 4 (*.TIF)
• TIFF LZW (*.TIF)
• Graphic Interchange Format (*.GIF)
• Photoshop 3.0 (*.PSD)
• See Understanding the Advanced Exporting Options in the MapInfo Professional Help System.
• For more information, see Understanding the Advanced Exporting Options and Setting your Output
Setting Preferences in the Help System.
Importing and Exporting Data in AutoCAD Format
Because CAD packages represent drawings in non-earth coordinates, all drawings imported or exported
between MapInfo Professional and CAD suffer some distortion. This comes from trying to display non-earth
information on a spherical coordinate system (like the globe). Coordinate conversions are used to assign
longitude/latitude coordinates to CAD drawings that were created using non-earth coordinates.
Conversions near the equator are more exact than conversions at the extremes of the hemispheres. To
minimize distortion, import and export with no coordinate conversions and avoid translating maps that
cover large areas.
• For more information, see Importing DXF Attributes into MapInfo Professional and Importing Attributes
with Nested Blocks in the Help System.
Cropping Images
When MapInfo Professional exports a window, it does not clip objects that extend beyond the edges of
the windows, but it does export information about where the clipping is.
Other programs always honor the clipping of bitmap files. As for other formats, the behavior varies
depending on the program that is used to display and print the file. Many programs, such as drawing
programs, "explode" the file into individual objects. A file containing several country boundaries would
explode into several polygon objects, one for each country. Programs like these usually ignore the
clipping information that MapInfo Professional stores in the file.
87MapInfo Professional User Guide
Page 88

Saving, Closing, and Exporting Your Work
Other programs, such as word processing programs and spreadsheets, typically open files as one
compound object, without trying to explode them into component objects. These programs usually honor
the clipping information and clip the contents appropriately.
For example, if you are exporting a Map window that displays part of Germany, but not all of it, the
exported file contains the entire image of Germany. It also contains information about where MapInfo
Professional clipped that image in its Map window. But when you open the exported window in your
target application, a drawing package for example, the image of Germany may not be clipped.
Exporting to ASCII Format
MapInfo Professional also allows you to export your tabular data to a delimited ASCII file. This file can
later be edited with a text editor or imported into another package. When you export to ASCII, MapInfo
Professional displays the Delimited ASCII Information dialog box, where you choose your delimiter
character. You can also choose to have the first row of the ASCII file become column titles.
MapInfo Professional also displays a dialog box that you use to indicate the character set for the exported
ASCII file. Different platforms use different character sets. MapInfo Professional must know the platform
where you are going to use the exported file in order to provide the appropriate character set. No graphical
data is exported to ASCII.
Exporting to dBase (*.DBF) Format
MapInfo Professional can export tabular data into dBASE DBF format. Exporting to DBF creates only
the .DBF file. No graphical data is exported to dBASE. When you save your table in DBF format, you
create a .DBF file, as well as some other files. These other files contain graphic information (for example,
MapInfo Professional indices and other information that MapInfo Professional uses).
MapInfo Professional also displays the dBASE DBF Information dialog box that you use to indicate the
character set for the exported DBF file. Different platforms use different character sets. MapInfo
Professional must know the platform where you are going to use the exported file in order to provide the
appropriate character set.
Smoothing Map Images during Export
You can anti-alias a table during the export process to give you more control over your map images.
This is particularly important when you are saving maps created in MapInfo Professional for use in other
Windows-based applications, in particular in slide presentations or for web pages.
Anti-aliasing allows you to smooth images in all types of windows such as Map windows, layouts, legends,
and graphs.
Note:
There are three smoothing options you can use to customize your raster image:
1. Smooth using a Filter value. You can set a flag that selects one of six filters that allow you to choose
2. Smooth using a Mask value. You can select a value that indicates the size of the area you want to
3. Smooth using a Threshold value. You can select a threshold value to indicate which pixels to smooth.
You cannot anti-alias images you are exporting to .EMF or .WMF format, because these are not
true raster formats.
the direction the filter is applied to the image from.
smooth. For example, to create a 3x3 pixel mask value, you would enter a 3 in this field. This would
limit the amount of change in the color of the pixels. Typically mask sizes would be 2-3 pixels when
exporting at screen resolution. If you are exporting at a higher resolution, a larger mask might be
appropriate.
Each pixel in an image has a value based on its color. The smaller the pixel value, the darker the
color. Select this option to smooth all of the pixels above the threshold you enter in this field. When
you set this value to 0, MapInfo Professional will smooth all of the pixels.
MapInfo Professional 12.588
Page 89

Chapter 3: The Basics of MapInfo Professional
You must either set a global preference for these anti-aliasing options or set them locally during the
export process (using the Advanced button).
• For specific instructions, see Smoothing Map Images during Export in the Help System.
Using the Tools in the Tool Manager
MapInfo Professional contains many additional tools that simplify mapping tasks, convert MapInfo
Professional files to different file formats and vice versa, automate tasks for working with DBMS tables,
and more. The Tool Manager helps you run and manage these many utilities easily.
Use the Tool Manger to run, add, edit, or remove tools from the currently registered list of tools in the
Tools menu. You can also configure a tool to run automatically upon startup. If you performed a Custom
installation, you may have elected to not install the tools. In this case when you open the Tool Manager
dialog box, the list box will be empty (on the Tools menu, click Tool Manager).
For a list of available tools and for information about using the tools in MapInfo Professional, see the
MapInfo Professional Help System.
89MapInfo Professional User Guide
Page 90

Page 91

Configuring MapInfo Professional Preferences
Preferences allow you to change a number of default settings, enabling you to
customize certain aspects of the program's behavior. Preference files are stored
on a per-user basis.
In this section:
• Summary of Preferences . . . . . . . . . . . . . . . . . . . . . . . . . .92
• Setting Your Preferences . . . . . . . . . . . . . . . . . . . . . . . . . .92
• Setting Your System Preferences . . . . . . . . . . . . . . . . . . .93
• Setting Your Startup Preferences . . . . . . . . . . . . . . . . . . .98
• Setting Your Directory Preferences . . . . . . . . . . . . . . . .100
• Setting the Web Services Preferences . . . . . . . . . . . . . .102
• Setting up a Geocoding Server . . . . . . . . . . . . . . . . . . . .107
• Setting up a Routing Server . . . . . . . . . . . . . . . . . . . . . . .109
• Setting Your Performance Preferences . . . . . . . . . . . . .110
• Setting Your Style Preferences . . . . . . . . . . . . . . . . . . . .111
• Setting Your Address Matching Preferences . . . . . . . . .112
• Setting Your Image Processing Preferences . . . . . . . . .112
• Setting Your Notification Preferences . . . . . . . . . . . . . .113
• Setting Your Map Window Preferences . . . . . . . . . . . . .114
• Setting Your Layout Window Preferences . . . . . . . . . . .119
• Setting Your Browser Window Preferences . . . . . . . . . .120
• Setting Your Legend Designer Window Preferences . .120
• Setting Your Printer Preferences . . . . . . . . . . . . . . . . . . .122
• Setting Your Output Setting Preferences . . . . . . . . . . . .124
4
Page 92

Summary of Preferences
Summary of Preferences
Here is a brief description of the preference categories.
System
• System Settings - Controls what information is copied to the clipboard, color defaults, aspect ratio,
paper and layout units, the number of Undo objects permitted, how symbol types used prior to version
4.0 are drawn, and how MapInfo Professional handles 2-digit years.
• Startup - Controls whether the program saves the MAPINFOW.WOR upon exiting and loads it upon
start up; whether queries are saved in workspaces; and the display of the Quick Start dialog box upon
startup.
• Directories - Specifies default directories for opening and saving tables, workspaces, MapBasic
programs, import files, ODBC SQL queries, theme templates, graph support files, saved queries, new
grids, and Crystal Report files. Also specifies the directories MapInfo Professional searches for tables
without fully qualified paths referenced in workspaces or MapBasic programs.
• Web Services - Sets refresh, timeout values, server options and other default settings for Proxy
Servers, WMS, WFS, Geocode server, Drivetime server, and Map Tile server web services.
• Performance - Sets how much of the operation to perform in parallel using more than one CPU or
processor core when processing objects; when buffering an object in a table or selection, and with
overlay operations.
• Styles - Sets the default object styles for region, line, symbol, and text objects.
• Address Matching - Controls the house number placement when specifying street addresses.
• Image Processing - Sets the rules for raster reprojection allowing you to choose whether reprojection
is allowed, when, and allows you to select resampling options.
• Notifications - Sets the frequency of notifications and product updates when a new session of MapInfo
Professional is initiated. A notification, typically, is a pop-up that will appear showing links to product
updates or information. Clicking a link will redirect you to the hyperlink address on your web browser.
Windows
• Map Window - Sets the default Map window options; moving duplicate nodes; snap tolerance; units
for distance and area; display of scroll bars in the Map window; display of degrees in either decimal
or degrees, minutes, seconds form; and the display of InfoTips.
• Layout Window - Sets the Layout window preferences to display Rulers, Page Breaks, and to
determine the display options of frame contents.
• Browser Window - Select the color to use for the background on alternating rows in the Browser
window.
• Legend Designer Window - Sets the legend frame default settings as well as swatch size and view
preferences.
Output
• Printer - Controls which printer information is used for all new windows. This printer can be the Windows
default printer, or a printer you designate as your MapInfo Preferred printer. This choice can be
overridden on a per window basis using either the Print or Page Setup dialog boxes.
• Output Settings - Controls the on-screen display of a raster file, the printer output, and exporting
choices.
Setting Your Preferences
To set a preference:
1. On the Options menu, point to Preferences to open the Preferences dialog box.
MapInfo Professional 12.592
Page 93

Chapter 4: Configuring MapInfo Professional Preferences
2. Click one of the buttons to open the dialog box of preferences.
3. Set your preferences and click OK to save them and return to the Preferences dialog box.
4. Click OK to close the Preferences dialog box.
What follows in this section are details to assist you in setting your preferences.
Setting Your System Preferences
Use the System Settings Preferences dialog box to control the default settings that affect how MapInfo
Professional interacts with your system.
To set your system settings preferences:
1. On the Options menu, point to Preferences and click System Settings to open the System Settings
Preferences dialog box.
93MapInfo Professional User Guide
Page 94

Setting Your System Preferences
2. Select your system preferences for MapInfo Professional.
3. Click OK to close the dialogs and save your settings.
Setting Your Default Units
You can set the default paper and layout units, distance units, and area units as a software preference.
To set your default units:
1. On the Options menu, point to Preferences, and then click System Settings to open the System
Settings Preferences dialog box.
2. In the Units panel, select from the following drop-down lists:
• Paper and Layout Units - Specifies the units when you measure the size of objects in a layout
and the size of paper in the Print dialog boxes. Choose a unit of measurement from the drop-down
list. The default is set to inches. You can choose: inches, picas, points, millimeters, and centimeters.
• Distance Units - Specifies the default distance units you want to use for all subsequently created
maps. Options include: US Survey feet, yards, rods, chains, miles, nautical miles, millimeters,
centimeters, meters, and kilometers.
• Area Units - Specifies the default area units you want to use for all subsequently created maps.
Options include: square inches, square links, square feet, square yards, square rods, perches,
square chains, roods, acres, square miles, square nautical miles, square millimeters, square
centimeters, square meters, hectares, and square kilometers.
3. Click OK to close the dialogs and save your settings.
Setting Your Undo Options
To set your undo options in MapInfo Professional:
1. On the Options menu, point to Preferences and click System Settings to display the System
Settings Preferences dialog box.
2. Number of Undo Objects - Enter the number of objects (0 to 800) that can be undone. For example,
•
if you specify the number 50, and then you perform a single editing operation that affects more
than 50 objects, you will not be able to undo the operation. The number of undo objects can also
affect the performance of MapInfo Professional.
MapInfo Professional 12.594
Page 95

Chapter 4: Configuring MapInfo Professional Preferences
The default is 10 objects. You can set it from 0 to 800. Setting the number of objects to 0 deactivates
the system. After you use the Undo option, the system toggles to Redo.
Note:
• Memory Size for Undo - Indicates the memory size in bytes for Undo operations. Maximum is
10,000,000 bytes. The default is 1,000,000 bytes; increasing this entry may result in slower response
time.
For Undo to be available on the Edit menu, the selected object(s) must be smaller in size than
this setting.
3. Click OK to close the dialogs and save your settings.
You cannot use the Undo capability for the following operations: Revert, Save, Save As,
or Modify Table, or any operations whose effects are primarily cosmetic.
Setting Your Color Defaults
When creating a thematic map, you need to distinguish between objects in different thematic layers.
When you create a new thematic layer, MapInfo Professional chooses the initial colors and patterns
based on this setting. Either a range of solid colors or a range of black and white patterns is used.
Changing the color default settings does not affect existing maps or graphs.
1. On the Options menu, point to Preferences and click System Settings to open the System Settings
Preferences dialog box.
2. In the Color Defaults panel, choose one of the following:
• Monitor Setting - Determines if your monitor is color or black and white and then uses either color
or gray scale fill patterns. This is the default setting.
• Black & White - Use this setting to view and print your thematic map in gray scale when working
on a color monitor.
• Color - Use this setting to work on a black and white monitor but print in color on a color printer.
3. Click OK to close the dialogs and save your settings.
Setting Show Guides when Docking Windows
You can dock windows, such as the Layer Control and Table List, and some tools, such as Named
Views and Catalog Browser, to the sides (top, bottom, left, and right) of MapInfo Professional. The
windows are in a fixed position when they are docked and can share the same space-you may dock
multiple windows to the same side of the screen. When the windows are not docked, they are floating
and can be moved anywhere in the window.
There are visual guides that look like arrows that display by default to help you when docking a window
or a tool. You can drag the window or tool to one of the arrows to dock it at that location. These visual
guides display by default. You can show or hide them in MapInfo Professional using a software preference.
To show or hide visual guides when docking a window in MapInfo Professional:
1. On the Options menu, point to Preferences and click System Settings to open the System Settings
Preferences dialog box.
2. Select the Show Guides when Docking Windows check box to display visual guides, in the form
of up, down, left, and right arrows, to help you when docking windows in MapInfo Professional.
Clearing this checkbox hides these guides.
3. Click OK to close the dialogs and save your settings.
Setting Your Date Window for Two-Digit Years
MapInfo Professional converts two-digit input into four digit years using the current century for the dates
(so that 14 becomes 2014). If your data includes dates in the 1900s, then you can turn on date windowing
to select a pivot year below which to use the previous century. If you specify the number 50 as the pivot
95MapInfo Professional User Guide
Page 96

Setting Your System Preferences
year for your data, then the years entered as 00-49 become 2000-2049 and years entered as 50-99
become 1950-1999.
To turn on date windowing:
1. On the Options menu, point to Preferences and click System Settings to open the System Settings
Preferences dialog box.
2. Select Set date window to and enter a number from 0-99 that will be the pivot year below which to
use the previous century.
The number you enter is shown in the example, which illustrates how the date will display with the
prefix 19 or 20. If you enter the number 14, then the example display as:
Years entered as 00-13 become 2000-2013
Years entered as 14-99 become 1914-1999
3. Click OK to close the dialogs and save your settings.
If you select the Turn date windowing off option, then MapInfo Professional uses the current century
for two-digit dates.
Setting Your Copy to Clipboard Preferences
By default, MapInfo Professional copies text, bitmaps, metafile items, and Map objects to the Clipboard.
You can choose which of these objects copy to the Clipboard as a software preference.
To set how you would like to copy objects to the Clipboard:
1. On the Options menu, point to Preferences and click System Settings to open the System Settings
Preferences dialog box.
2. Select the check boxes for those objects you want to copy to the Clipboard, or clear check boxes for
those objects that you do not.
• Copy Text to Clipboard - Check to specify that you want text copied to the Clipboard.
• Copy Bitmap to Clipboard - Check to specify that you want Bitmaps copied to the Clipboard.
• Copy Windows Metafile (WMF) to Clipboard - Check to specify that you want metafiles copied
to the Clipboard.
• Copy MapInfo Map Object to Clipboard - Check to specify that you want map objects copied to
the Clipboard.
3. Click OK to close the dialogs and save your settings.
Setting Your Clipboard to Copy Maps in to Word, Excel, or PowerPoint
To copy a map to the Clipboard and then past it in to a Microsoft Office document, such as Word, Excel
or PowerPoint, you must first customize the Clipboard behavior so that only specific types of metafiles
copy to the Clipboard.
1. On the Options menu, point to Preferences and click System Settings to open the System Settings
Preferences dialog box.
2. In the Copy to Clipboard group, check the Copy Enhanced Metafile (EMF) to Clipboard check
box.
3. Choose one of the following:
• Copy EMF to Clipboard - Choose this if you expect to bring your maps into an application that
supports only EMF, such as Microsoft's Office 2003.
• Copy EMF+ to Clipboard - Choose this if you expect to bring your maps into an application that
supports EMF+, such as Microsoft Office 2007 or 2010.
• Copy EMF+ Dual to Clipboard - Choose this (a combination of EMF and EMF+) to use your maps
in applications that may or may not support EMF+, such as when you have Microsoft's Office 2003
and Office 2007 on the same machine.
Note:
EMF+Dual format will produce a larger file than EMF+. But it provides better compatibility
with older application that do not support EMF+.
MapInfo Professional 12.596
Page 97

Chapter 4: Configuring MapInfo Professional Preferences
4. Click OK to close the dialogs and save your settings.
Setting Your Image Resolution for Exporting
You can control the resolution of a window when exporting it using a software preference. MapInfo
Professional uses this preference whenever you copy windows to the Clipboard, export your work to
metafile and raster formats, and use the Save Window As export process. If you do not set this resolution
manually, the product assumes 96 dpi. The maximum setting for this field is 1200 dpi.
To set your image resolution preference:
1. On the Options menu, point to Preferences and click System Settings to open the System Settings
Preferences dialog box.
2. In the Window Export and Clipboard Resolution box, type a new dpi value between 96 and 1200.
The default is 96 dpi, which is the screen resolution.
3. Click OK to close the dialogs and save your settings.
Setting how to Draw Symbols for MapInfo Professional 4.0 or Earlier
You can indicate how you want to draw symbols from early versions of MapInfo Professional (before
4.0). By default, MapInfo Professional draws these vector symbols using the True Type font. You can
change the default to use characters from the MapInfo Symbols font.
To draw vector symbols with characters from the MapInfo Symbols font:
1. On the Options menu, point to Preferences and click System Settings to open the System Settings
Preferences dialog box.
2. Select the Display Pre-Version 4 Symbols using the True Type font check box.
Check this to draw vector symbols with characters from the MapInfo Symbols font. Clear this check
box to draw vector symbols (default).
3. Click OK to close the dialogs and save your settings.
Setting Your Vertical Mapper Grid File Display Preferences
To set the display preferences for Vertical Mapper grid files:
1. On the Options menu, point to Preferences and click System Settings to display the System
Settings Preferences dialog box.
2. Select the Display Vertical Mapper grd files as option to determine how to display Vertical Mapper
GRD files within MapInfo Professional. These options allow you to display your Vertical Mapper GRD
maps as grid files and not as raster files. Vertical Mapper creates GRD\TAB files that display using
the raster handler. This preference contains a Grid option, so that Vertical Mapper grid files use the
Info tool and displays file information in 3D windows.
• Grids - Select this option to display your Vertical Mapper GRD files as grid files when you open
them. Get the added support of the MapInfo Professional toolbar features
• Raster - Select this option to treat your Vertical Mapper GRD files as raster layers when you open
them.
• Default - Select this option to treat your Vertical Mapper GRD files as Raster or Grid files depending
on the existence of the Rasterstyle 6 1 code in the TAB file: if the code does not exist then the file
opens as a raster file, if the code does exist then the file opens as a grid file.
3. Click OK to close the dialogs and save your settings.
Setting Your Aspect Ratio Adjustment
The aspect ratio is the relationship between the height and width of the screen. It can be adjusted to
deal with various problems. When you are running under Windows, for example, and you choose Window
97MapInfo Professional User Guide
Page 98

Setting Your Startup Preferences
Size as the map size when you print your map, the printout of the map is smaller than it appears on the
screen. To compensate, measure the display area of your screen and enter those dimensions in the
Aspect Ratio Adjustment box.
1. On the Options menu, point to Preferences and click System Settings to open the System Settings
Preferences dialog box.
2. In the Aspect Ratio Adjustment group, set the following:
• Use custom screen size - Select this checkbox to have MapInfo Professional calculate the display
area of your monitor and display its estimated width and height dimensions. Use these dimensions
or enter your own width and height values.
• Width - Enter the width of your monitor's display area in inches.
• Height - Enter the height of your monitor's display area in inches.
3. Click OK to close the dialogs and save your settings.
Setting Your Startup Preferences
You can set preferences for how MapInfo Professional behaves when you start the software for:
• Showing or hiding the Quick Start dialog box.
• Using a default DBMS connection.
• Your MAPINFOW.WOR workspace properties such as whether printer information and queries are saved
to workspaces.
To set default DBMS Connections, see Setting up your Database Connection Preferences in the Help
System.
To set your startup preferences for MapInfo Professional:
1. On the Options menu, point to Preferences and click Startup to open the Startup Preferences
dialog box.
2. Select from the following preferences:
• Save MAPINFOW.WOR when Exiting MapInfo - Select this check box to save your setup to the
MAPINFOW.WOR workspace when you exit MapInfo Professional. When you clear this check box,
MapInfo Professional does not save the MAPINFOW.WOR unless you save it explicitly.
• Load MAPINFOW.WOR when Starting MapInfo - Select this check box to display MAPINFOW.WOR
when you enter MapInfo Professional.
To enable this check box, you must clear the Display Quick Start Dialog check box.Note:
• Save Queries in Workspaces - Select this check box to save the queries you create during a
mapping session in the workspace. If you do not select this check box and the selected map has
only one layer based on a query, the query is not saved and the application writes a map definition
with an empty layer list. MapInfo Professional cannot support subselects in queries.
Note:
• Save Printer Information into Workspaces - Select this check box to save the printer name,
paper orientation, paper size, and the number of copies from your printer settings into the workspace.
This also includes any overrides you might have made to the default printer settings in the Printer
preferences. We recommend that you leave this preference on.
• Restore Printer Information to Workspaces - Select this check box to restore the printer name,
paper orientation, paper size, and the number of copies when you open the workspace. This is
useful if you are sharing workspaces with other MapInfo Professional users who are also using
the same printers.
The operators Any and All are not supported in the MapXtreme 2004 or later versions of
MapInfo SQL and, therefore, subselects are not supported either. MapInfo Professional
cannot map selections with Group By, so Group By clauses are ignored. MapInfo
Professional only translates the Order By clause.
MapInfo Professional 12.598
Page 99

Chapter 4: Configuring MapInfo Professional Preferences
Note:
• Default DBMS Connection - Select this check box to set a DBMS connection that will open each
time you begin a MapInfo Professional session. Click Set to select the connection.
• Display Quick Start Dialog - Select this check box to display the Quick Start dialog box
automatically when you start MapInfo Professional. This check box is selected by default. Clear
the Display Quick Start Dialog check box to prevent it from displaying when you start subsequent
MapInfo sessions.
3. Click OK to close the dialogs and save your settings.
If this preference is turned off, or if the printer indicated is not available, the printer settings
for the workspace revert back to the default printer set in the Printer preferences.
Creating a Startup Workspace
STARTUP.WOR is the name you give to a workspace from which MapInfo Professional is run. You can
create it so that MapInfo Professional automatically opens various tables and windows on startup. When
you use STARTUP.WOR, MapInfo Professional performs the startup actions regardless of what you did
in your previous MapInfo Professional session or how you have set preferences for MAPINFO.WOR.
To create a workspace:
1. Open the tables and windows you want in your workspace. Size and position them as you please.
2. On the File menu, point to Save Workspace.
3. Name your workspace "Startup" and save the workspace into your "home" directory. By "home"
directory we mean your private Windows directory.
When you run MapInfo Professional, the following occurs in the order shown:
1. If there is a STARTUP.WOR in the MapInfo Professional program directory, it is run.
2. Then, if there is a STARTUP.WOR in your home directory it is run. (When there is a STARTUP.WOR
in both the MapInfo Professional program directory and your home directory, both will= run.)
3. Then, if any file names are given on the command line-or if you double-click a document, MapInfo
Professional loads those files. MapInfo Professional support adding workspaces (.WOR), running
applications (.APP), and opening databases (.TAB) on the command line.
4. Only if MapInfo Professional did not add a workspace or run a program from the command line does
it then check the AutoLoad preference and load MAPINFOW.WOR from the user's home directory.
When the preference is set, and the file is found, it is loaded. Note that if we had a workspace or
application on the command line, we skip the AutoLoad.
5. Finally, if MapInfo Professional did not load a workspace or run an application from the command
line, and it did not AutoLoad MAPINFOW.WOR, then MapInfo Professional shows the Tool palette.
Setting Your Database Connection Preferences
If you have a favorite database connection setting, we have established a startup preference setting to
create that connection automatically at the beginning of your session.
To set your database connection startup preference:
1. In the Options menu, click Preferences and then Startup to open the Startup Preferences dialog
box.
2. Click Set to open the Select DBMS Connection list.
3. Select an existing entry in the list. Click OK to accept the preference.
To establish a new database connection. Click New and select the connection type you want to
search for.
• If you select ODBC, the Select Data Source dialog box displays and you can search for the
database from this dialog box. Select the database connection and click OK to return to the Startup
Preferences dialog box.
99MapInfo Professional User Guide
Page 100

Setting Your Directory Preferences
• If you select Oracle Spatial, the MapInfo Oracle Connect dialog box displays and you must enter
the user name, password, and server name of the database you are adding. Click OK to save your
entries and return to the Startup Preferences dialog box.
After selecting a DBMS connection, it displays in the Default DBMS Connection field and is set to
connect each time you open MapInfo Professional.
4. Click OK to close the dialogs and save your settings.
You can also make a DBMS connection from any of these three dialog boxes: Open, Create New Table,
and Save Copy As.
Note:
See Also:
Tables
Workspaces
For database versions that MapInfo Professional supports, see the MapInfo Professional Install
Guide.
Setting Your Directory Preferences
You can specify the default directories in which MapInfo Professional looks for files as a software
preference. You can specify directories for:
• Tables
• Remote tables
• Workspaces
• MapBasic programs
• Import files
• DBMS SQL queries
• Theme templates
• Saved queries
• New grids
• Crystal Report files
• Graph support files
• Shapefile tables
The default directories that you set display in the File menu dialog boxes when you open or save files.
This includes the four locations that are part of the Open dialog box. When you open a file, you can
select an icon from the MapInfo Places Bar for what you set, such as a Workspace Directory icon to
display the workspace directory that you set as a preference.
To set your directory preferences:
1. On the Options menu, point to Preferences and click Directories to open the Directory Preferences
dialog box.
MapInfo Professional 12.5100
 Loading...