

Page 1

MOLECULAR SPECTROSCOPY
SPECTRUM TWO N™
User’s Guide
Page 2

Release History
Part Number Release Publication Date
L1050300 B November 2017
Any comments about the documentation for this product should be addressed to:
User Assistance
PerkinElmer, Inc.
710 Bridgeport Avenue
Shelton, CT 06484-4794
U.S.A.
Or emailed to: IRTechSupport@PERKINELMER.COM
Notices
The information contained in this document is subject to change without notice.
Except as specifically set forth in its terms and conditions of sale, PerkinElmer makes no
warranty of any kind with regard to this document, including, but not limited to, the
implied warranties of merchantability and fitness for a particular purpose.
PerkinElmer shall not be liable for errors contained herein for incidental consequential damages in
connection with furnishing, performance or use of this material.
Copyright Information
This document contains proprietary information that is protected by copyright.
All rights are reserved. No part of this publication may be reproduced in any form whatsoever or
translated into any language without the prior, written permission of PerkinElmer, Inc.
Copyright © 2017 PerkinElmer, Inc.
Trademarks
Registered names, trademarks, etc. used in this document, even when not specifically marked as such,
are protected by law.
PerkinElmer is a registered trademark of PerkinElmer, Inc.
AssureID, Spectrum, Spectrum Two, Spectrum Two N, and Spotlight are trademarks of PerkinElmer, Inc.
Silver Gate is a trademark of Specac.
Page 3

Contents
Introduction ............................................................................................... 5
About This Manual ............................................................................................ 6
Conventions Used in this Manual ........................................................................ 7
Notes, Cautions and Warnings ..................................................................... 7
Warnings and Safety Information ........................................................... 11
Overview .........................................................................................................12
Safety Summary ...............................................................................................13
General Safety .................................................................................................14
Electrical safety .........................................................................................14
Optical radiation ........................................................................................15
Location and Ventilation ...................................................................................16
To allow for adequate cooling ....................................................................16
To allow any nitrogen used to disperse .......................................................16
Use of flammable solvents and samples ......................................................16
Warning Signs on the Instrument ......................................................................17
EMC Compliance ..............................................................................................18
Europe ......................................................................................................18
South Korea ..............................................................................................18
United States (FCC) ...................................................................................18
An Overview of the Spectrum Two N ....................................................... 19
A Guided Tour of the Spectrum Two N ..............................................................20
Optical system ...........................................................................................21
Sample compartment .................................................................................21
Power switch and communication ports ......................................................23
Portability..................................................................................................23
Accessories ......................................................................................................24
Unpacking and Installation ...................................................................... 25
Requirements ..................................................................................................26
Electrical requirements ...............................................................................26
Environment ..............................................................................................26
Specifications ...................................................................................................27
Unpacking the Spectrometer .............................................................................28
Opening the shipping container ..................................................................28
Choosing Your Connection Method ....................................................................30
Installing your Spectrum Two N ........................................................................32
Connecting the spectrometer to the electrical supply ...................................33
Connecting the spectrometer to the PC using the USB cable .........................34
Connecting the spectrometer to the PC using the wireless router ..................36
Connecting the spectrometer to the PC using an Ethernet cable ...................39
Connecting the spectrometer via a network .................................................40
Instrument Install Wizard ...........................................................................42
Changing the Sampling Accessory .....................................................................43
Moving the Spectrometer ..................................................................................46
Getting Started with Spectrum Software ................................................ 47
Overview .........................................................................................................48
Starting Spectrum Software ..............................................................................49
The Spectrum Workspace .................................................................................51
Using the Spectrum on-screen Help system .......................................................54
Scanning Samples ............................................................................................55
Optical Attenuators for Use with Optional InGaAs Detector .................................57
Quality Checks .................................................................................................58
Processing Spectra ...........................................................................................60
Spectral correction .....................................................................................60
Identification .............................................................................................61
Quantification ............................................................................................65
Macros ......................................................................................................69
Page 4

Scanalyze ................................................................................................. 70
Saving Spectra, Exporting Spectra and Reporting ...................................................... 71
Saving spectra .......................................................................................... 71
Exporting spectra ...................................................................................... 72
Send To ................................................................................................... 74
Reporting ................................................................................................. 75
Printing .................................................................................................... 76
Instrument Settings ......................................................................................... 77
Changing the Resolution .................................................................................. 78
Component Checks .......................................................................................... 80
Humidity Shield ............................................................................................... 82
Power Save Mode ............................................................................................ 84
Using the button on the front of the instrument .......................................... 84
Using Power Save Mode in Spectrum software ............................................ 85
Ready Checks and Instrument Verification......................................................... 86
Atmospheric (CO2/H2O) Suppression ................................................................. 89
AVI Correction ................................................................................................. 90
AVI Calibration .......................................................................................... 91
Exit Spectrum Software .................................................................................... 92
Maintenance ............................................................................................. 95
Overview......................................................................................................... 96
Cleaning the Spectrometer ............................................................................... 97
Changing the Desiccant.................................................................................... 98
Purging the Spectrometer .............................................................................. 101
Purging the sample compartment............................................................. 102
Purging the instrument ............................................................................ 103
Replacing the Source ..................................................................................... 107
Installing/Replacing Windows ......................................................................... 109
Replacing the Main Board Air Filter ................................................................. 111
Additional Parts ............................................................................................. 114
Optional parts ......................................................................................... 114
Replacement parts .................................................................................. 115
Appendices ............................................................................................. 117
Appendix 1: Connector Details ........................................................................ 118
Appendix 2: Instrument Performance Validation Kits ........................................ 119
Appendix 3: Decontamination and Cleaning ..................................................... 120
Appendix 4: WEEE Instructions for PerkinElmer Products ................................. 121
Appendix 5: Calibration Procedure for Optical Attenuators ................................ 122
Index ............................................................................................................ 123
Page 5

Introduction
Page 6

6 . Spectrum Two N User's Guide
About This Manual
This manual provides instructions for the installation, use and maintenance of the
Spectrum Two N spectrometer. It contains the following sections:
• Introduction
• Warnings and Safety Information
• An Overview of the Spectrum Two N
• Unpacking and Installation
• Getting Started with Spectrum Software
• Maintenance
• Appendices.
NOTE: This manual shows details for using your instrument with the Spectrum software
package (version 10.6 or later). If you have Spectrum ES or AssureID software,
please refer to the Administrator’s Guide for your software, which can be found on
the
Spectrum Two Manuals CD
Help.
(part number L1050242), or refer to the on-screen
For further information on collecting, viewing and processing spectra using Spectrum
software, refer to the help file that you can access from the Help menu, or by clicking Help
on a dialog.
Page 7

Introduction . 7
Conventions Used in this Manual
Normal text is used to provide information and instructions.
Bold text refers to text that is displayed on the screen.
UPPERCASE text, for example ENTER or ALT, refers to keys on the PC keyboard. “+” is
used to show that you have to press two keys at the same time, for example, ALT+F.
All eight-digit numbers are PerkinElmer part numbers unless stated otherwise.
The term “instrument” refers to either the Spectrum Two N FT-NIR spectrometer, and any
sampling accessory fitted.
Notes, Cautions and Warnings
Three terms, in the following standard formats, are also used to highlight special
circumstances and warnings.
NOTE: A note indicates additional, significant information that is provided with some
procedures.
Page 8

8 . Spectrum Two N User's Guide
personal injury
警告
警告
We use the term WARNING to inform you about situations that could
result in
these circumstances are in a box like this one.
WARNING
Warning (Warnung)
Bedeutet, daß es bei Nichtbeachten der genannten Anweisung zu einer
Verletzung des Benutzers kommen kann.
Warning (Advarsel)
Betyder, at brugeren kan blive kvæstet, hvis anvisningen ikke overholdes.
Warning (Peligro)
Utilizamos el término WARNING (PELIGRO) para informarle sobre
situaciones que pueden provocar daños personales a usted o a otras
personas. En los recuadros como éste se proporciona información sobre este
tipo de circunstancias.
Warning (Danger)
to yourself or other persons. Details about
Nous utilisons la formule WARNING (DANGER) pour avertir des situations
pouvant occasionner des dommages corporels à l'utilisateur ou à d'autres
personnes. Les détails sur ces circonstances sont données dans un encadré
semblable à celui-ci.
Warning (Pericolo)
Con il termine WARNING (PERICOLO) vengono segnalate situazioni che
potrebbero provocare incidenti alle persone. Troverete informazioni su tali
circostanze in un riquadro come questo.
Warning (Waarschuwing)
Betekent dat, wanneer de genoemde aanwijzing niet in acht wordt genomen,
dit kan leiden tot verwondingen van de gebruiker.
Warning (Aviso)
Significa que a não observância da instrução referida poderá causar um
ferimento ao usuário.
Warning (
我们使用“警告”这一术语来通知您有关可能会对您自己或他人造成人
)
身伤害的情况。
有关这些情况的详细信息可在此类方框中找到。
Warning (
使用者及びその他周辺に危害が及ぶ恐れがある場合は、
この様なボックスの中に注意事項が表示されています。
)
Page 9

Introduction . 9
We use the term CAUTION to inform you about situations that could
serious damage to the instrument or other equipment.
小心
本仪器或其它设备造成严重损害
注意
CAUTION
result in
Details about these circumstances are in a box like this one.
Caution (Achtung)
Bedeutet, daß die genannte Anleitung genau befolgt werden muß, um einen
Geräteschaden zu vermeiden.
Caution (Bemærk)
Dette betyder, at den nævnte vejledning skal overholdes nøje for at undgå en
beskadigelse af apparatet.
Caution (Advertencia)
Utilizamos el término CAUTION (ADVERTENCIA) para advertir sobre
situaciones que pueden provocar averías graves en este equipo o en otros. En
los recuadros como éste se proporciona información sobre este tipo de
circunstancias.
Caution (Attention)
Nous utilisons le terme CAUTION (ATTENTION) pour signaler les situations
susceptibles de provoquer de graves détériorations de l'instrument ou
d'autre matériel. Les détails sur ces circonstances figurent dans un encadré
semblable à celui-ci.
Caution (Attenzione)
Con il termine CAUTION (ATTENZIONE) vengono segnalate situazioni che
potrebbero arrecare gravi danni allo strumento o ad altra apparecchiatura.
Troverete informazioni su tali circostanze in un riquadro come questo.
Caution (Opgelet)
Betekent dat de genoemde handleiding nauwkeurig moet worden opgevolgd,
om beschadiging van het instrument te voorkomen.
Caution (Atenção)
Significa que a instrução referida tem de ser respeitada para evitar a
danificação do aparelho.
Caution (
我们使用“小心”这一术语来通知您有关可能会对
)
的情况。
有关这些情况的详细信息可在此类方框中找到。
Caution (
分光器や他の機材等に深刻なダメージを与える恐れがある場合は、
この様なボックスの中に表示しています。
)
Page 10

10 . Spectrum Two N User's Guide
Page 11

Warnings and Safety
Information
Page 12

12 . Spectrum Two N User's Guide
Overview
This chapter describes the general safety practices and precautions that must be observed
when operating the Spectrum Two N FT-NIR spectrometer.
This advice is intended to supplement, not supersede, the normal safety codes in the user's
country. It is also a supplement to the PerkinElmer standard Safety and Health Policy. The
information provided does not cover every safety procedure that should be practiced.
Ultimately, maintenance of a safe laboratory environment is the responsibility of the analyst
and the analyst's organization.
Please consult all manuals supplied with the Spectrum Two N and accessories before you
start working with the instrument. Carefully read the safety information in this chapter and in
the other manuals supplied. When setting up the instrument or performing analyses or
maintenance procedures, strictly follow the instructions provided.
Page 13

Warnings and Safety Information . 13
Safety Summary
The Spectrum Two N FT-NIR spectrometers have been designed to comply with a wide
variety of international standards governing the safety of laboratory equipment. In routine
use, the instruments pose virtually no risk to you. If you take some simple, common-sense
precautions, you can make sure that you maintain the continued safe operation of your
instrument:
• DO make sure that the power supply is properly connected to the electrical supply; in
particular make sure that the ground (earth) is securely connected.
• DO disconnect the electrical power cable before opening any ports or covers on the
instrument, unless otherwise directed in the maintenance procedures described in this
manual, or in Spectrum, Spectrum ES or AssureID software.
• DO NOT open the main instrument cover. There are no user-serviceable parts inside the
main cover, and tampering with the seal will invalidate your warranty.
• DO keep the instrument dry. Avoid spilling liquid onto the instrument. Clean all external
spills immediately.
• DO NOT use a flammable gas to purge the instrument. The instrument contains a hot
source, and a fire or explosion will result. Only use clean, dry, oil-free nitrogen or air to
purge the instrument.
• DO read the more detailed information on warnings and safety in the following pages to
ensure the safe operation of the instrument.
Page 14

14 . Spectrum Two N User's Guide
General Safety
The Spectrum Two N FT-NIR spectrometers have been designed and tested in accordance
with PerkinElmer specifications and in accordance with the safety requirements of the
International Electrotechnical Commission (IEC).
CE (Conformity European) Marking – Safety and EMC
The instruments conform to IEC publication 61010-1 (“Safety requirements for electrical
equipment for measurement, control, and laboratory use”) and therefore meets the
requirements of EC low voltage directive 2014/35/EU and EN 61326-1 standard for emission
and immunity Electromagnetic Compatibility (EMC) directive 2014/30/EU.
Canadian Standards Association
The instruments conform to Canadian Standards Association CSA 61010-1 and Underwriters
Laboratories UL 61010-1.
Environmental Conditions
If the instrument is used in a manner not specified by the manufacturer, the protection
provided by the instrument may be impaired. Only use the instrument under the following
environmental conditions:
Temperature 4 °C to 45 °C
Relative Humidity 90% maximum (non-condensing)
If the equipment is used in a manner not specified herein the
protection provided by the equipment may be impaired.
WARNING
AVERTISSEMENT
Si l'équipement est utilisé d'une manière non spécifiée ici, la protection
fournie par l'équipement peut être altérée.
Electrical safety
• Connect the instrument power supply to a power outlet that includes a switch or other
means of disconnection from the electricity supply.
• Only plug the instrument power supply into a socket power outlet that is provided with
a protective earth connection.
• The instrument must be disconnected from all voltage sources before it is opened for
any adjustment, replacement, maintenance or repair, unless otherwise directed in the
maintenance procedures described in this manual, or in Spectrum, Spectrum ES or
AssureID software.
Page 15

Warnings and Safety Information . 15
To ensure safe and satisfactory operation of the instrument, it is
essential that the green or green/yellow ground (earth) wire of the
WARNING
power cord is connected to a ground that complies with the regulations
of the local electricity supply authority (or equivalent body); ground
circuit continuity is essential for safe operation of the equipment.
AVERTISSEMENT
Pour assurer un fonctionnement sûr et satisfaisant de l'instrument, il
est essentiel que le fil de terre vert ou vert / terre du cordon
d'alimentation soit raccordé à un sol conforme à la réglementation de
l'autorité locale d'alimentation électrique (ou du corps équivalent) ; La
continuité du circuit au sol est essentielle pour un fonctionnement sûr
de l'équipement.
Only connect equipment that meets the requirements of IEC 61010-1, IEC 60950 or
equivalent standards.
A Spectrum Two N has:
• An IEC Installation Category (Overvoltage Category) II classification - suitable for
connection to local level power supplies.
• An IEC Pollution Degree 2 classification - usually only non-conductive atmospheric
pollution of the equipment occurs; occasionally, however, a temporary conductivity
caused by condensation must be expected.
The power supply adaptor has been designed to be safe under the following environmental
conditions:
• Indoor use
• Altitude up to 2000 m (above mean sea level)
• Ambient temperatures of 0 °C to 50 °C
• Mains supply fluctuations not exceeding ±10% of the nominal voltage.
If it is necessary to fit a plug on the power cable supplied, use the wire color code below:
Plug Pin Wire Color (100–120 V) Wire Color (220–240 V)
Ground (Earth) Green or Green/Yellow Green/Yellow
Live Black Brown
Neutral White Blue
Optical radiation
The instrument complies with the requirements of the Artificial Optical Radiation Directive
2006/25/EC.
Page 16

16 . Spectrum Two N User's Guide
avertissement.
comme une armoire à fumée.
Location and Ventilation
To allow for adequate cooling
• Do not site the instrument near to room-heating equipment, for example,
central-heating radiators.
• Do not block the ventilation cooling holes under the instrument.
• Do not cover the power supply adaptor.
To allow any nitrogen used to disperse
Do not site the instrument in a poorly ventilated area if nitrogen will be
used as a purge gas.
Oxygen depletion in an enclosed space does not trigger a gasping
WARNING
reflex, and errors of judgment, confusion, or unconsciousness can
occur in seconds and without warning.
AVERTISSEMENT
The spectrometer has a connector that enables the sample compartment to be purged using
clean, dry, oil-free air or nitrogen. The recommended flow rate is 4 L/min. It also has two
connectors that enable the instrument body to be purged. The recommended flow rate is
2 L/min.
The sample compartment purge vents to its surroundings. The instrument purge outlet can
be connected with tubing to vent outside the working environment, for example to a fume
cabinet.
Ne placez pas l'instrument dans une zone mal ventilée si l'azote est
utilisé comme gaz de purge.
L'appauvrissement de l'oxygène dans un espace clos ne déclenche pas
un réflexe gonflant, et des erreurs de jugement, de confusion ou
d'inconscience peuvent se produire en quelques secondes et sans
Use of flammable solvents and samples
The instrument contains a hot source, and contact with flammable
vapors may cause an explosion. Flammable solvents or samples should
not be stored on or near the instrument. During sample preparation,
WARNING
such materials should be handled in a safe area away from the
instrument, such as a fume cabinet.
AVERTISSEMENT
L'instrument contient une source d'énergie chaude, et le contact avec
des vapeurs inflammables peut provoquer une explosion. Les solvants
ou échantillons inflammables ne doivent pas être stockés sur ou près
de l'instrument. Pendant la préparation de l'échantillon, ces matériaux
doivent être manipulés dans un endroit sûr à l'écart de l'instrument,
Page 17

Warnings and Safety Information . 17
Warning.
Avertissement.
actions à prendre.
Warning Signs on the Instrument
Refer to accompanying documents in all cases where this symbol is used
to find out the nature of the potential hazard and any actions which have
to be taken.
Reportez-vous aux documents d'accompagnement dans tous les cas où
ce symbole est utilisé pour connaître la nature du danger potentiel et les
A warning label is attached to the source compartment (Figure 1). Refer to
on page 107.
Source
Figure 1 Labels (rear of instrument)
A warning label is attached to the desiccant compartment and near the instrument purge
inlet port (Figure 2). Refer to
instrument
on page 103, as applicable.
Changing the Desiccant
on page 98 or to
Replacing the
Purging the
Figure 2 Labels (base of instrument)
Page 18

18 . Spectrum Two N User's Guide
Note:
EMC Compliance
Europe
All information concerning EMC standards is in the Declaration of Conformity, and these
standards may change as the European Union adds new requirements.
PerkinElmer instruments have been designed and manufactured, having regard to the state
of the art, to ensure that:
• the electromagnetic disturbance generated does not exceed the level above which
radio and telecommunications equipment or other equipment cannot operate as
intended;
• it has a level of immunity to the electromagnetic disturbance to be expected in its
intended use which allows it to operate without unacceptable degradation of its
intended use.
South Korea
This device complies with MSIP (Ministry 0f Science, ICT, and Future Planning) EMC
Registration requirements, conducted at 220 V, 60 Hz by a laboratory accredited for Korean
EMC testing. This instrument is registered as a Class A instrument for business use only.
Product seller and user should notice that this equipment is not for house hold use.
A급 기기 (업무용 방송통신기자재)
이 기기는 업무용(A급) 전자파적합기기로서 판
매자 또는 사용자는 이 점을 주의하시기 바라
며, 가정외의 지역에서 사용하는 것을 목적으
로 합니다.
United States (FCC)
United States (FCC) This equipment has been tested and found to comply with the limits for
a Class A digital device, pursuant to part 15 of the FCC Rules. These limits are designed to
provide reasonable protection against harmful interference when the equipment is operated
in a commercial environment. This equipment generates, uses, and can radiate radio
frequency energy and, if not installed and used in accordance with the instruction manual,
may cause harmful interference to radio communications. Operation of this equipment in a
business/industrial/commercial environment is likely to cause harmful interference in which
the user will be required to correct the interference at your own expense. Changes or
modifications not expressly approved by the manufacturer could void your authority to
operate the equipment in compliance with FCC rules.
Changes or modifications not expressly approved by PerkinElmer could cause the instrument
to violate FCC (U.S. Federal Communications Commission) emission regulations, and because
of this violation could void the user’s authority to operate this equipment.
Page 19

An Overview of the
Spectrum Two N
Page 20

20 . Spectrum Two N User's Guide
A Guided Tour of the Spectrum Two N
PerkinElmer Spectrum Two N spectrometers are compact, robust instruments that can be
used in non-laboratory environments.
Figure 3 Spectrum Two N Spectrometer
• Spectrum Two N FT-NIR spectrometers with standard detector:
– Standard, high-performance, room-temperature LiTaO
(lithium tantalate) NIR
3
detector.
– Optical system with CaF
of 14,700 to 2,000 cm
windows enables you to collect data over a total range
2
−1
at a best resolution of 1.0 cm−1 at 7,200 cm-1.
– Standard APV/AVI configuration.
For APV, an internal, software-controlled filter wheel comes complete with traceable
reference materials for automatic performance verification. Also, the methane cell
provided enables the production of standard data to be referenced to fundamental
band positions using the Absolute Virtual Instrument (AVI) feature.
• Spectrum Two FT-IR spectrometers with temperature-stabilized detector:
– Temperature-stabilized, high-performance, InGaAs (indium gallium arsenide) NIR
detector for enhanced signal-to-noise.
– Optical system enables you to collect data over a total range of 14,700 to
3,800 cm
−1
at a best resolution of 1.0 cm−1 at 7,200 cm-1 with CaF2 windows.
– Standard APV/AVI configuration.
For APV, an internal, software-controlled filter wheel comes complete with traceable
reference materials for automatic performance verification. Also, the methane cell
provided enables the production of standard data to be referenced to fundamental
band positions using the Absolute Virtual Instrument (AVI) feature.
The instrument is connected to a PC, either point-to-point (USB 2.0 or Ethernet), over a
network, or via a wireless network using the optional wireless router.
The Spectrum software supplied enables you to control the instrument and to manipulate the
spectra that you collect. The spectrometers can operate in ratio, single-beam, or
interferogram mode.
Page 21

An Overview of the Spectrum Two N . 21
Sample compartment lid
Slide holder
Optical system
The optical system is under the main cover of the instrument. The instrument is sealed at the
factory, and the main cover of the instrument should not be opened.
No panel of the spectrometer should be removed unless following the maintenance
procedures described in this manual. In particular, maintenance procedures that risk ingress
of water vapor into the instrument should be performed only using the appropriate
maintenance wizard in Spectrum, Spectrum ES or AssureID Software. See
page 95 for more information.
Maintenance
Stability of the optical system
The system is purged and sealed at the factory. A supply of desiccant placed within the
system removes any water vapor and carbon dioxide that may enter. The unique humidity
shield design (part of the OpticsGuard™ system) protects the spectrometer from
environmental conditions, meaning it can be used in more challenging environments. In
addition, the internal humidity sensor, in conjunction with the Humidity Shield feature in
Spectrum software, warns you when the desiccant needs changing. Refer to
on page 82 for further information.
Humidity Shield
on
In the Spectrum Two N FT-IR spectrometer, CaF
compartment from the purged optical system.
You can purge the sample compartment with clean, dry, oil-free air or nitrogen. Either one
removes water vapor; however, nitrogen is preferable because it also removes atmospheric
carbon dioxide.
windows separate the sample
2
Sample compartment
The instrument has a versatile, purgeable sample compartment (Figure 4) located at the
front of the instrument. Open the sample compartment by lifting the cover using the recess
at the front.
Figure 4 Sample compartment
Page 22

22 . Spectrum Two N User's Guide
The infrared beam enters the sample compartment through a window on the left. After
passing through the sample, it enters the detector area through a window on the right side
of the sample compartment.
The CaF2 sample compartment windows fitted in some Spectrum Two N
FT-NIR spectrometers, although coated to prevent damage by small
amounts of condensation, may be damaged by large amounts of
condensation build-up in the rim of the windows.
CAUTION
Take care not to scratch the windows when installing accessories or using
sample tools.
Les fenêtres du compartiment d'échantillons CaF
installées dans certains
2
spectromètres Spectrum Two N FT NIR, bien que revêtues pour éviter
ATTENTION
d'être endommagées par de petites quantités de condensation, peuvent
être endommagées par de grandes quantités d'accumulation de
condensation dans la jante des fenêtres.
Veillez à ne pas gratter les fenêtres lors de l'installation d'accessoires ou à
l'aide d'outils d'échantillonnage.
Standard accessories are mounted on a baseplate. The standard baseplate has a slide holder
that can be fitted at two positions, fixed by a single screw (Figure 5).
Figure 5 Slide holder on standard baseplate
The slide holder has two slide positions that enable you to insert a sample and a J-stop card
for measurements at high resolutions.
For more information on using the J-stop cards, see
Changing the Resolution
on page 78.
Page 23

An Overview of the Spectrum Two N . 23
Power ON
LED
Power switch and communication ports
The DC power connector and communication ports are on the rear of the instrument.
The Power on LED on the front of the instrument will light green when the instrument is
connected to mains power and is switched on (Figure 6).
Figure 6 Power ON LED
NOTE: The Spectrum Two N spectrometer is usable within 15 minutes of being switched on
after being switched off overnight. However, if your instrument has recently been
transferred from a much colder environment, it is advisable to run a background
spectrum before every sample for the first couple of hours of use.
Portability
The compact and robust design of the Spectrum Two N means that the instrument can be
easily transferred between environments. The simple user-installation, and fast warm-up
time, means that the instrument can be set up quickly. The range of accessories available
help you to move your analysis out of the laboratory. Optional wireless connectivity enables
portable PC control, and the multiple power options enable you to use your spectrometer
with, or without, external mains power (Figure 7).
Figure 7 Spectrum Two N with wireless router and battery pack
NOTE: The battery pack can also be used as an uninterruptable power supply (UPS).
The Portability Pack includes a battery pack and 12 V car auxiliary port adaptor, spectrometer
carry case and a wireless router kit. The individual components of the Portability Pack are
also available separately. Refer to
Optional parts
on page 114.
Page 24

24 . Spectrum Two N User's Guide
Accessories
There is a range of optional sampling accessories available for the Spectrum Two N FT-NIR
spectrometer that fit in the sample compartment, including:
• Spectrum Two N NIRM – Near Infrared Reflectance Module – L1390205
The Near Infrared Reflectance Module (NIRM) has a patented collection optics system
designed for robust, accurate operation, offering increased performance with dramatically
improved inter-unit variability. The design is less sensitive than conventional designs to
sample height and tilt. It is designed with built-in automatic fast interleaved scanning
which alleviates drift and improves measurement time. The NIRM contains a high
performance stabilized InGaAs detector system as standard. (Figure 8).
Refer to the
NIRM User’s Guide
Spectrum Two Manuals CD
accessory.
(part number L1050301) available as a pdf on the
(part number L1050242) for information on using the
Figure 8 Spectrum Two N FT-NIR with the NIRM Accessory
• Spectrum Two N HTM– Heatable Transmission Module – L1390029
The Heatable Transmission Module (HTM) for the Spectrum Two N™ NIR allows for
easy elevated temperature measurements on samples in the mid-IR or Near-IR regions
of the spectrum, the module accepts fixed pathlength sealed cells, cuvettes, or
disposable vials..
Refer to the
available as a pdf on the
information on using the accessory.
• Spectrum Two N RSM – Remote Sampling Module – L1390040
Spectrum Two N sample compartment interface fitted with universal connectors for
compatibility with a wide range of fiber probes. Includes built high performance InGaAs
detector.
Refer to the
available as a pdf on the
information on using the accessory.
It is easy to remove an accessory and replace it with another. Refer to
Sampling Accessory
on the baseplate plugs into a socket on the rear wall of the sample compartment. The
instrument identifies the type of accessory and automatically updates the instrument
settings.
Heatable Transmission Module (HTM) User’s Guide
Spectrum Two Manuals CD
(part number L1050242) for
Remote Sampling Module (RSM) User’s Guide
Spectrum Two Manuals CD
on page 43. For the baseplate-mounted accessories, a coded connector
(part number L1050242) for
(part number L1050302)
(part number L1050303)
Changing the
Page 25

Unpacking and
Installation
Page 26

26 . Spectrum Two N User's Guide
Requirements
NOTE: Read the warnings and safety information chapter in this manual before you install
the instrument. It contains important information.
Electrical requirements
The Spectrum Two N power supply adaptor can operate on electricity supplies of 50 or 60 Hz
and in the 100 to 230 V range without any adjustment.
The maximum power consumption of the system is 65 VA (approximately 40 W) when
powering the wireless router. In Power Save mode the mains power consumption is <10 VA
(approximately 6 W) and the DC power consumption is 0.2 W.
The line supply must be within 10% of the nominal voltage.
If possible, do not connect the instrument to circuits that have heavy-duty equipment
connected, such as large motors.
If possible, do not use photocopiers, discharge lamps, radio transmitters, and other
equipment with large or frequent transient loads on the same supply circuit.
Environment
To obtain the best performance from your instrument:
• Place the instrument in an environment that is relatively dry and dust-free.
• Make sure that the bench top is free from vibration or mechanical shocks.
• Do not place the instrument or the PC near to room-heating equipment, such as
central-heating radiators.
• Do not position the instrument in direct sunlight as this may cause overheating.
• Ensure that there is sufficient clearance underneath the instrument to permit an
adequate flow of cooling air.
• The area near the PC must be free of strong magnetic fields, direct sunlight, and
heating or cooling units or ducts.
Page 27

Unpacking and Installation . 27
Specifications
Specification Value
Dimensions 450 × 300 × 210 mm (W × D × H )
Weight Approximately 13 kg
Power input 100–230 V, 50/60 Hz, Max 65 VA
Laser Class 1
Detector LiTaO3 or InGaAs
Operating temperature range 5 °C to 45 °C*
Storage temperature range −20 °C to 60 °C
Maximum relative humidity 80% (non-condensing) with CaF2 windows
* If you intend to operate your instrument regularly at temperatures of 40 °C or higher, for optimum
performance we recommend that you repeat the Wavelength Calibration at the appropriate operating
temperature. Refer to the on-screen help for your software application.
Page 28

28 . Spectrum Two N User's Guide
Faites attention lors de l'installation de votre spectromètre Spectrum Two
Unpacking the Spectrometer
Take great care when installing your Spectrum Two N FT-NIR
spectrometer, and follow the procedures described in this manual. If you
CAUTION
require further assistance, please contact
IRTechSupport@PERKINELMER.COM
.
ATTENTION
N FT NIR et suivez les procédures décrites dans ce manuel. Si vous avez
besoin d'aide supplémentaire, contactez
IRTechSupport@PERKINELMER.COM.
Opening the shipping container
Your spectrometer is packed inside the shipping container, sealed inside a silver bag that
protects the windows from condensation.
1. Remove the items from the box, and check that all the following parts are present:
Part Number Description Quantity
L9004169 USB 2.0 Cable (2 m) 1
L9002298 Power supply 1
L1180478 NIR Polystyrene TRM Kit 1
L1600232 Spectrum Two J-stop card kit containing:
0.5 cm
−1
, 1 cm−1, 2 cm−1, and 4 cm−1 J-stop cards
1
LX108873
OR
LX108941
OR
LX108875
L1050280 Spectrum Two Installation Video CD 1
L1050229 Spectrum Two Installation Guide (USB connection) 1
L1050242 Spectrum Two Manuals CD 1
If any items are missing or damaged, contact IRTechSupport@PERKINELMER.COM
assistance.
Spectrum Standard Software (DVD)
Spectrum Standard Software (USB Flash Drive)
Spectrum ES Software (DVD)
1
for
Page 29

Unpacking and Installation . 29
sur les fenêtres CaF2. Cela signifie le laisser
2. Carefully remove the instrument from the shipping container, but not from the bag in
which it was shipped.
Retain the original packaging in case you need to ship the instrument to a new location.
The spectrometer should be allowed to reach the temperature of its
surroundings before it is removed from the protective bag to prevent
CAUTION
condensation forming on the CaF
windows. This means leaving it for at
2
least 3 hours after removal from the shipping container.
ATTENTION
Le spectromètre doit être autorisé à atteindre la température de son
environnement avant d'être retiré du sac de protection afin d'empêcher
la formation de condensation
pendant au moins 3 heures après le retrait du conteneur d'expédition.
3. When the spectrometer has been allowed to warm to the temperature of its
surroundings, remove it from the bag and place it on the bench where it is to be used.
Ensure that you can reach the rear of the spectrometer to enable you to connect the
cables.
NOTE: Do not connect your instrument to the PC using the USB cable provided until you
have run the software installation wizard.
Any accessories will be shipped in separate boxes.
Page 30

30 . Spectrum Two N User's Guide
Spectrometer
PC connector
Mains power
DC power
connector
Mains power
USB 2.0 cable
Choosing Your Connection Method
NOTE: Do not connect your instrument to the PC using the USB cable provided until you
have run the software installation wizard.
The Spectrum Two N spectrometer is supplied with a USB 2.0 cable and a mains power
supply adaptor with a DC connector (Figure 9). The mains power cord supplied will depend
on your region.
connector
adaptor
cord connector
Figure 9 Connection cables supplied with the Spectrum Two
There are four ways you can connect to your spectrometer:
• Using the supplied USB 2.0 cable to connect directly to the PC.
This is the preferred method for direct connection to the spectrometer. The instrument
will be configured automatically when you start Spectrum software.
• Using an Ethernet cable (not supplied) to connect directly to the PC.
If you want to connect your instrument directly to the PC using the Ethernet port, refer
to the Administrator’s Guide for your software for information on configuring the PC
network adaptor. We recommend that you do this
before
installing Spectrum,
Spectrum ES, or AssureID software.
• Over a wireless network using the PerkinElmer-configured wireless router (part number
L1600246, not supplied with the spectrometer).
The optional wireless router enables you to locate your spectrometer away from the PC.
This facilitates use of the spectrometer inside a fume cabinet or in a manufacturing
environment.
Once you are connected to the instrument using the PerkinElmer FT-IR Wireless
network, the instrument will automatically be configured on starting Spectrum software.
• Over a network using the Ethernet port.
If you want to connect your instrument over a network using the Ethernet port, refer to
the Administrator’s Guide for your software for information on configuring the IP
address of your instrument, and details of the Instrument Install Wizard.
Page 31

Unpacking and Installation . 31
A C B
E
D
The features on the rear of the spectrometer are shown in Figure 10.
Figure 10 Communication ports on the Spectrum Two
Table 1 Communication ports
Port/LED Use
A USB port
This is the standard interface between the PC and the
instrument.
B ETHERNET port Ethernet connector.
This is the standard interface between a Local Area Network
(LAN) and the instrument.
C EXT DETECTOR
port
D Rear diagnostic
LED
This port enables to you power the optional wireless router,
accessory alignment tool, or connect an external accessory.
Provides information on the status of the instrument.
Refer to Table 2 on page 34.
E DC power port The DC power port is used to connect the spectrometer to
the power supply. You can use the mains power supply
adaptor and cable supplied, or you can use the optional
battery pack or car adaptor.
NOTE: For more details of the port connector types, refer to
on page 118.
Appendix 1: Connector Details
Page 32

32 . Spectrum Two N User's Guide
Installing your Spectrum Two N
NOTE: Do not connect your instrument to the PC using the USB cable provided until you
have run the software installation wizard.
NOTE: If you wish to connect to your instrument using an Ethernet cable, you will need to
configure the PC network adaptor. We recommend that you do this before installing
your software.
To install your software package (Spectrum, Spectrum ES, or AssureID, as required),
insert the supplied DVD or USB Flash Drive and follow the instructions on the screen.
You will need to select Spectrum Two as the Installation Type in Spectrum and
Spectrum ES software.
If required, full installation instructions are provided in the Administrator’s Guide for
your software, which can be found on the
instrument.
If you are supplying your own computer, make sure that it meets the minimum
requirements for hardware and software set out in the “PC Requirements” section of the
Administrator’s Guide.
Spectrum Two Manuals CD
supplied with your
Spectrum and Spectrum ES software applications are available in German, English, Spanish,
French, Japanese, Brazilian Portuguese and Simplified Chinese. The software language
displayed is determined by the Region and Language settings defined for the operating
system on the PC.
During the Spectrum software installation you will be provided with USB and wireless
connection instructions (Figure 11). Connect your instrument to the mains power, and then
set up your USB or wireless connection. For other connection methods, you do not need to
connect up your instrument at this point. Refer to
using the USB cable
on page 36, as applicable.
router
on page 34 or
Connecting the spectrometer to the PC using the wireless
Connecting the spectrometer to the PC
Figure 11 USB and Wireless Connection Instructions dialog
Page 33

Unpacking and Installation . 33
Power adaptor
connector
Diagnostic
LED
18 V DC power
adaptor port
Power ON
LED
Connecting the spectrometer to the electrical supply
The Spectrum Two N power supply adaptor can operate on electricity supplies of 50 or 60 Hz
and in the 100 to 230 V range without any adjustment. The mains power cord supplied will
depend on the requirements of your region.
NOTE: If it is necessary to fit a different plug on the power cord to the one supplied, refer to
Electrical safety
1. Ensure that your instrument is located near an appropriate mains power outlet.
2. Connect the cable from the power supply adaptor to the 18 V DC port on the rear of the
instrument (Figure 12).
starting on page 14.
Figure 12 Power adaptor port on rear of the instrument
3. Connect the region-specific mains power cable provided to the power supply adaptor,
and connect it to the mains power supply.
4. Switch on the power at the mains supply.
The instrument will power up automatically. The Power ON LED on the front of the
instrument will be lit green (Figure 13).
Figure 13 Power ON LED
Your instrument will initialize and will then be ready to communicate with the PC. This will
take approximately 2 minutes. During the initialization procedure the diagnostic LED on the
rear of the instrument appears yellow as the instrument runs a series of self-checks. At the
end of the initialization period, the diagnostic LED will flash orange.
Page 34

34 . Spectrum Two N User's Guide
Table 2 LED status
LED Appearance Status
Power ON
(front of
instrument)
Diagnostic
(rear of
instrument)
Green, solid Instrument is on.
Yellow, flashing Instrument is in Power Save mode (software controlled).
Yellow, solid Instrument is in Power Save mode (not software
controlled).
Off Instrument is off.
Check that the instrument is connected to the mains
power.
Yellow, solid Instrument is running self-checks on initialization.
Orange, flashing Instrument is connected to mains power and is initialized.
Red, flashing Instrument has failed self-checks on initialization. You will
not be able to connect to the instrument in the software.
Refer to IRTechSupport@PERKINELMER.COM for assistance.
Off Instrument is off.
Check that the instrument is connected to the mains
power.
Before connecting your spectrometer to the PC you must install Spectrum, Spectrum ES or
AssureID software.
NOTE: Once your instrument has been set up in one software application it will be available
for use by all PerkinElmer FT-IR software installed on the PC.
Connecting the spectrometer to the PC using the USB cable
Before connecting your spectrometer to the PC via the USB cable you must run the Spectrum
or Spectrum ES software installation. This is so that the appropriate drivers for the USB port
are installed.
For Spectrum and Spectrum ES software, only connect the USB cable when prompted by the
software Installation Wizard.
If you are using AssureID as stand-alone software, and have not previously installed
Spectrum with Spectrum Two Installation Type, you will need to install the drivers for the
USB connection. Refer to the
more information.
AssureID Administrator’s Guide
(part number L1050019) for
Page 35

Unpacking and Installation . 35
USB port
USB 2.0 cable spectrometer
The following procedure describes connection using the USB 2.0 cable supplied with your
instrument for Spectrum or Spectrum ES software:
1. When prompted by the Spectrum software installer, plug one end of the USB 2.0 cable
provided into the USB port on the rear of the instrument (Figure 14).
connection
Figure 14 USB 2.0 cable connector and USB port
2. Plug the other end of the cable into a USB 2.0 port on your PC.
3. Click Test USB on the USB and Wireless Connection Instructions dialog.
The software checks that the USB drivers have installed correctly and the result is
displayed (Figure 15).
Figure 15 USB Wireless Connection Instructions – successful
If the test fails, check that the instrument is connected to the mains power and is
connected to the PC using the USB 2.0 cable provided, and then retry the test.
If the test still fails, go to IRTechSupport@PERKINELMER.COM for assistance.
Page 36

36 . Spectrum Two N User's Guide
EXT DETECTOR port
POWER port
4. Continue the Spectrum software installation, following the instructions displayed
on-screen.
You are now ready to start Spectrum software. The first time you log on to Spectrum with a
Spectrum Two instrument connected to the PC via a USB cable, the instrument is installed
and configured automatically.
NOTE: For AssureID, install the USB drivers, connect your spectrometer as shown in
Figure 14, start AssureID, and then run the Instrument Install Wizard (see page 42).
Refer to the
information.
AssureID Administrator’s Guide
(part number L1050019) for more
Connecting the spectrometer to the PC using the wireless router
The following procedure describes connection using the PerkinElmer-configured wireless
router (not supplied with the instrument). The wireless router is powered by the EXT
DETECTOR port on the rear of the Spectrum Two N instrument. The cable required is
supplied with the wireless router.
NOTE: If you are powering your instrument using the optional Spectrum Two N Battery Pack
(part number L1600233), powering the wireless router will reduce the runtime of the
battery.
1. Unpack your wireless router, and position it near the instrument.
2. Connect the wireless router to the EXT DETECTOR port at the rear of the spectrometer
using the cable supplied (part number L1602706), as shown in Figure 16.
Figure 16 Wireless router connected to the EXT DETECTOR port
Page 37

Unpacking and Installation . 37
Port 4
ETHERNET port
Power adaptor
connector
Diagnostic
LED
18 V DC power
adaptor port
3. Connect one end of the Ethernet cable to the ETHERNET port on the rear of the
spectrometer and the other end to one of the ports numbered 1 to 4 on the rear of the
router (Figure 17).
Do not
use the blue port labeled INTERNET on the wireless router.
Figure 17 Ethernet cable connected to Port 4 on the wireless router and the
Spectrum Two
4. Connect the cable from the power supply adaptor to the 18 V DC port on the rear of the
instrument (Figure 18).
Figure 18 Power adaptor port on rear of spectrometer
5. Connect the Spectrum Two N power supply cable to the mains power.
6. Ensure that the Power ON LED on the front of the Spectrum Two N is lit green.
For more information on powering up your spectrometer, refer to
spectrometer to the electrical supply
on page 33.
Connecting the
Page 38

38 . Spectrum Two N User's Guide
WIRELESS LED lit
POWER LED not
POWER LED lit
7. Ensure that the POWER LED on the front of the wireless router is lit green (Figure 19).
The POWER LED will flash while the router initializes.
Figure 19 POWER LED on the wireless router
8. Wait for the POWER LED on the router to stop flashing and ensure that the WIRELESS
LED is lit (Figure 20).
flashing
Figure 20 Wireless router LEDs indicate ready for use
9. Switch on your PC and then connect to the PerkinElmer FT-IR Wireless network.
You will need to enter the network security key provided on the side of your router.
Figure 21 Connecting to the PerkinElmer FT-IR Wireless network (example only)
The exact procedure for connecting your PC to the wireless network will depend on your
wireless hardware and on the PC operating system.
Page 39

Unpacking and Installation . 39
You are now ready to start your software application. The first time you log on to Spectrum
with a Spectrum Two N instrument connected to the PC via a wireless connection, the
instrument is installed and configured automatically for you.
NOTE: For AssureID, connect your spectrometer as described in steps 1–9, start AssureID,
and then run the Instrument Install Wizard (see page 42). Refer to the
Administrator’s Guide
NOTE: Although you can have more than one instrument on the wireless network, providing
that each instrument has a unique IP address, you can only connect to one
spectrometer at a time. PerkinElmer FT-IR software does not support simultaneous
connection to multiple instruments on the same PC.
(part number L1050019) for more information.
AssureID
Connecting the spectrometer to the PC using an Ethernet cable
If you want to connect directly to your spectrometer via an Ethernet cable (not supplied),
you must:
1. Configure the PC network adaptor to communicate with your spectrometer.
To connect to your instrument using an Ethernet port you will need to set up the TCP/IP
protocols on the PC to be compatible with the spectrometer. You must do this
you start your software with your instrument connected to the PC.
If your PC is not on a network, you should type 167 . 116 . 185 . 70 as the IP address
and type 255 . 255 . 0 . 0 as the subnet mask.
before
Refer to the Administrator’s Guide for your software for a full procedure.
Page 40

40 . Spectrum Two N User's Guide
Ethernet port
Ethernet cable
2. Plug one end of an Ethernet cable into the ETHERNET port on the rear of the
instrument (Figure 22).
Figure 22 Ethernet cable connected to the ETHERNET port
3. Plug the other end of the cable into an Ethernet port on your PC.
You are now ready to start Spectrum software. The first time you log on to Spectrum with a
Spectrum Two N instrument connected to the PC using an Ethernet cable, the instrument is
installed and configured automatically for you.
NOTE: For AssureID, configure the PC network adaptor, connect your spectrometer as
shown in Figure 22, start AssureID, and then run the Instrument Install Wizard (see
page 42). Refer to the
more information.
AssureID Administrator’s Guide
(part number L1050019) for
Connecting the spectrometer via a network
If you want to install your spectrometer using an Ethernet connection over a network you
must:
1. Assign the instrument a unique IP address that is compatible with your network using
the Set IP Address Utility.
To run the utiliity, double-click Set IP Address, which is found in C:\Program Files\
PerkinElmer\ServiceIR or C:\Program Files (x86)\PerkinElmer\ServiceIR.
NOTE: The TCP/IP address of the PC must be compatible with the instrument’s IP address
so that you can connect to the instrument using the Set IP Address utility. Refer to
Connecting the spectrometer to the PC using an Ethernet cable
Select your instrument from the drop-down list. The default IP address of the
instrument is 167 . 116 . 185 . 71.
You can then assign a new IP address for the instrument.
above.
Page 41

Unpacking and Installation . 41
Ethernet
Ethernet cable
When using a network, the TCP/IP port of the PC will normally obtain an automatic
address from a DHCP server. To communicate with the instrument over a network, the
instrument must have a compatible network address.
A subnet mask of 255 . 255 . 0 . 0 means that the first two parts of the instrument IP
address must match the network IP address given to the PC by the DHCP server.
If, for example, the IP address of your PC is 195 . 112 . 170 . 255 and the subnet mask
is 255 . 255 . 0 . 0, then your instrument IP address must be 195 . 112 . x . x.
Refer to the Administrator’s Guide for your software for a full procedure.
2. Plug one end of an Ethernet cable into the ETHERNET port on the rear of the
instrument (Figure 23).
port
Figure 23 Ethernet cable connected to the ETHERNET port
3. Connect the other end of the Ethernet cable to the network router.
4. Add the instrument to the software using the Instrument Install Wizard, entering
the IP address of the instrument when prompted.
Page 42

42 . Spectrum Two N User's Guide
Instrument Install Wizard
If you connected your spectrometer to a network using the Ethernet connection, or if you are
using AssureID software to connect to the spectrometer, you will need to run the Instrument
Install Wizard.
If you have AssureID software, select Configure Instruments from the Configure
Instruments and Accessories group on the Tools menu.
The Instrument Install Wizard starts.
OR
If you have Spectrum or Spectrum ES software, select Add Instrument from the
Instruments group on the Setup menu.
The Instrument Install Wizard starts.
Details of the Instrument Install Wizard can be found in the Administrator’s Guide for
your software, which can be found on the
Spectrum Two Manuals CD
.
Page 43

Unpacking and Installation . 43
Sample
cover
Slide holder on
baseplate
Changing the Sampling Accessory
NOTE: For full installation and usage instructions for your accessory, refer to the appropriate
User’s Guide available as a pdf on the
L1050242).
1. If you are installing a NIRM, you will need to remove the sample compartment cover
(Figure 24), if fitted.
Open the cover, raise it to the vertical position and then lift it upwards, clear of the
instrument.
Store the cover in a safe place for future re-use.
Spectrum Two Manuals CD
(part number
compartment
Figure 24 Removing the sample compartment cover
2. Remove the current sampling accessory by pulling the baseplate of the accessory
towards you (Figure 25).
Figure 25 Removing the sampling accessory
Page 44

44 . Spectrum Two N User's Guide
Slide accessory
3. If you are installing a NIRM, pivot the accessory on the ledge at the front of the sample
area), and then tip it backwards). Push it firmly, ensuring that the top of the accessory
connects properly with the lid of the instrument.
If the accessory is pivoted too far forward on the sample area ledge it will not move
correctly into position.
OR
For other baseplate-mounted accessories, drop the accessory baseplate gently onto the
ledge (Figure 26) and then slide it horizontally into the sample compartment.
Push the accessory firmly to ensure that the connector on the rear of the baseplate
engages properly with the spectrometer connector.
into connector
Figure 26 Installing the sampling accessory
Page 45

Unpacking and Installation . 45
Spectrum automatically recognizes which accessory is installed, and displays the accessory
information on the Setup Instrument tabs.
Figure 27 Setup Instrument Basic tab showing a NIRM
For information on using your accessory, refer to the User’s Guide supplied with your
accessory. For PerkinElmer Spectrum Two accessories, these can be found as pdf files on the
Spectrum Two Manuals CD
(part number L1050242).
Page 46

46 . Spectrum Two N User's Guide
Moving the Spectrometer
Before moving the spectrometer, switch off the power supply, and
WARNING
AVERTISSEMENT
The spectrometer can be lifted using the shaped handholds on its sides, as shown in
Figure 28.
disconnect the power cable.
Avant de déplacer le spectromètre, éteignez l'alimentation et
débranchez le câble d'alimentation.
Figure 28 Lifting the Spectrum Two N
For transportation between a car or laboratory, or between laboratories within your
establishment, we recommend that you use the Spectrum Two Carry Case (part number
L9004199).
If you need to ship your spectrometer, or return it to PerkinElmer following instrument
replacement, you should use the original packaging.
NOTE: Refer to
information.
Although the Spectrum Two N spectrometer is usable within 15 minutes of being switched on
after being switched off overnight, if your instrument has recently been transferred from a
much colder environment it is advisable to run a background spectrum before every sample
for the first couple of hours of use.
Appendix 3: Decontamination
and Cleaning on page 120 for more
Page 47

Getting Started with
Spectrum Software
Page 48

48 . Spectrum Two N User's Guide
Overview
This section describes some of the basic functionality available in Spectrum software. It will
guide you through the process, from when you start Spectrum software to when you export
your data, directing you to additional information where applicable.
It will show you how you can:
• Log in to Spectrum software
• Familiarize yourself with the Spectrum customizable workspace and the additional user
assistance that is available: on-screen Help and Tutorials
• Check that the components of your spectrometer are working
• Collect a simple sample measurement
• Check/improve the quality of your spectrum
• Process your data in Spectrum software
• Extract your data from Spectrum software
• Change some advanced instrument settings
• Save energy with the Power Save mode
• Determine if your system is working as expected
• Exit Spectrum software, retaining your current work if required.
Page 49

Getting Started with Spectrum Software . 49
Starting Spectrum Software
1. Ensure that the instrument is connected to the mains power.
The Power LED on the front of the instrument should be lit green. If it is yellow, and
you wish to connect to the instrument straight away hold down the power button on the
front of the spectrometer for two seconds until the LED is lit green.
The instrument will initialize, which will take approximately 2 minutes.
NOTE: The Spectrum Two N spectrometer is usable within 15 minutes of being switched on
after being switched off overnight. However, if your instrument has recently been
transferred from a much colder environment, it is advisable to run a background
spectrum before every sample for the first couple of hours of use.
2. From the Start menu select Programs; the PerkinElmer Applications group; the
Spectrum sub-group and then the Spectrum application.
OR
Double-click the shortcut icon on the desktop.
The Spectrum start-up splash-screen is displayed, followed by a dialog that may require
your login details:
3. If required, enter your User name and Password, and then click OK.
The default user name and password are Administrator and administrator, respectively.
If you already have an instrument set up in Spectrum or AssureID software for this user
on this PC, the Instrument Connection dialog may be displayed, unless Auto-Connect is
set up for the instrument. If Auto-Connect is enabled, Spectrum will automatically
connect to the instrument.
NOTE: We recommend that you create a new user and password the first time you log on to
Spectrum.
Page 50

50 . Spectrum Two N User's Guide
4. Select the Instrument you want to use and then click Connect.
OR
If you want to work with data that has been collected previously, without connecting to
an instrument, select work offline.
Spectrum starts.
The first time you connect to your instrument the Component Checks will run.
5. When the Component Checks are complete, if there are no errors click OK.
You are now ready to collect data.
If a problem is identified, refer to
Component Checks
on page 80 for more information.
Page 51

Getting Started with Spectrum Software . 51
The Spectrum Workspace
The Spectrum window, with the default layout for a Spectrum Two N installation, is shown in
Figure 29.
Figure 29 Spectrum window
A Global Toolbars F Graph Bar
B Data Explorer G Navigation Pane
C Viewing Area H Process Bar
D Information Pane I Status Bar
E Dialog Pane
The window is divided into four panes:
• The Viewing Area (C), in the center, where spectra or results are displayed.
• The Data Explorer (B), on the left, which you use to manage your spectra.
• The Navigation Pane (F), on the right, which contains shortcuts.
• The Dialog Pane (E), at the bottom, which you use to adjust parameters or enter
information when, for example, setting up your instrument.
To open or close a pane, click .
NOTE: You can also click and drag the edge of a pane to resize it.
Viewing Area
The Viewing Area (C) is a tabbed display. The tabs displayed depend on whether you have
an individual spectrum displayed, or whether you have selected a folder of spectra, known as
a Samples View, in the Data Explorer. Tabs may be added that show the results of some
processes, such as Compare, Search and Quant.
During scanning, the Live tab – which shows the spectrum in real time – may be displayed.
Page 52

52 . Spectrum Two N User's Guide
Data Explorer
Data Explorer (B), on the left, which you use to manage your spectra.
The item(s) selected in the Data Explorer will be displayed in the Viewing Area.
You can also use the Data Explorer to access the Sample Table, which enables you to set up
multiple samples for data collection.
Navigation Pane
The Navigation Pane (F), on the right, which contains shortcuts.
The Setup options are the same as the Setup menu items. The Equations and Spectral
Libraries options on the Navigation Pane enable you to see a list of the available equations
and libraries, respectively.
You can reorder the shortcuts in the Navigation pane so that those you use most often are
easier to access. Simply drag-and-drop the shortcut to a new position.
Dialog Pane
The Dialog Pane (E), at the bottom, which you use to adjust parameters or enter information
when, for example, setting up your instrument or a Compare processes.
The contents of the Dialog Pane reflect the shortcut selected in the Navigation Pane.
Global Toolbars
At the top of the workspace are the Global toolbars (A), which include the File bar and the
Measurement bar (displayed by default), and the optional Instrument Settings bar.
NOTE: The Spectrum toolbars can be individually customized, and new toolbars can be
added. For more information, refer to the Spectrum on-screen Help and the tutorial
Customizing Toolbars. These can be accessed from the Help menu.
Graph Toolbars
If the Graph or Samples View tab is displayed, you can see the local Graph toolbars. The
Graph bar (G) contains some tools that enable you to change how data is displayed in the
graph, and the Process bar (H) enables you to access shortcuts to processes that enable you
to manipulate your data.
NOTE: The Spectrum toolbars can be individually customized, and new toolbars can be
added. For more information, refer to the Spectrum on-screen Help and the tutorial
Customizing Toolbars. These can be accessed from the Help menu.
Information Pane
Below the graph in the viewing area is the Information Pane (D). This shows a curve selector
if you have selected a Samples View in the Data Explorer or, if an individual spectrum is
selected, shows the results for that spectrum.
Page 53

Getting Started with Spectrum Software . 53
Status Bar
The Status Bar (I) located at the bottom of the workspace shows user information,
messages, and the current status of the instrument.
Figure 30 Status bar
Page 54

54 . Spectrum Two N User's Guide
Using the Spectrum on-screen Help system
Use the Spectrum Help system to find further information about using Spectrum software to
control, set up and adjust your instrument.
To open the Help file, select Contents from the Help menu. This menu also includes links to
on-screen tutorials (Tutorials), and information about the software (About).
Figure 31 Help menu in Spectrum Software
Page 55

Getting Started with Spectrum Software . 55
Scanning Samples
When you connect to your Spectrum Two N, the instrument settings will default to
appropriate values for your instrument and accessory. These should be suitable for most
applications. The default scan range is 10,000 to 4,000 cm
The Measurement bar (Figure 32) displayed by default at the top of the workspace includes
the tools you need to collect a spectrum from a sample. You can also select these commands
from the Measurement menu.
Figure 32 Spectrum Two Measurement bar
1. If you want, enter a unique Sample ID and Description for the sample on the
Instrument Settings toolbar.
Alternatively you can use the Autoname function to enter a unique Sample ID and
Description for each scan. The default Sample ID is [User name]_nnn, but you can
configure this on the Setup Instrument Data Collection tab. For more information, see
the Spectrum on-screen help.
If using an NIRM Accessory, ensure that the window is clean before collecting a
background.
The background spectrum is displayed briefly, and then the Viewing Area is prepared
for data collection from your sample.
−1
.
2. Place your sample in the instrument and then click .
By default, during scanning the sample data is displayed on the Live tab in the Viewing
Area.
The completed spectrum is displayed on the Graph tab (Figure 33), and added to the
current Samples View in the Data Explorer. Your spectrum will be saved automatically.
Auto-Save Spectra
See
The results of the Quality Checks, selected by default on the Setup Instrument
Advanced tab, are displayed in the results for the spectrum. See
page 58 for more information.
NOTE: If Preview is selected on the Measurement toolbar; the spectrum will be displayed on
the Live tab in the Viewing Area. This live spectrum will be automatically updated,
but no data will be collected. This enables you to verify that your sample is suitable
or, if using a sample accessory. When you are happy with the spectrum, click to
begin collecting data.
If, for any reason, you want to stop scanning your sample, click .
on page 71 for more information.
Quality Checks
on
Page 56

56 . Spectrum Two N User's Guide
Figure 33 Spectrum displayed in the Viewing Area
If you want to change any of the default instrument settings, select Instrument from the
Setup menu to display the Setup Instrument tabs. For more information see
Settings
on page 77.
Instrument
Page 57

Getting Started with Spectrum Software . 57
Optical Attenuators for Use with Optional InGaAs Detector
The high detectivity of InGaAs (indium gallium arsenide) detectors makes them prone to
saturation, a condition that results in non-linear detector responses. Limiting the optical
throughput to the detector is used to prevent detector saturation and can be accomplished
through the use of optical attenuators. For spectrometers equipped with the temperaturestabilized, high-performance InGaAs detector, four optical attenuators are supplied having
nominal percent transmittance values of 0.5%, 1%, 2%, and 4% T. For information
regarding calibration of optical attenuator see
Attenuators
performed with this attenuator in place. The optical attenuators are inserted into a slot
located on the detector side sample compartment window, as shown in Figure 34.
. The 1% beam attenuator is the default attenuator, all final factory tests are
Appendix 5: Calibration Procedure for Optical
Figure 34 Positioning of optical attenuator in sample compartment of Spectrum
Two N FT-NIR spectrometer.
In the event of detector saturation a warning message will appear in the Spectrum 10
software on the bottom right-hand corner as shown in Figure 35.
Figure 35 Warning message displayed in Spectrum 10 software under conditions
of detector overload
Page 58

58 . Spectrum Two N User's Guide
Quality Checks
Quality Checks identify possible problems in the collected spectrum and suggest ways of
improving the measurement.
Quality Checks can be selected on the Setup Instrument Advanced tab (Figure 34). Simply
select the Quality Checks that you want to perform from the list in the Setup Instrument
Advanced tab and, if required, adjust the threshold Range using the slider bars to suit your
application.
To display more information about an individual test, double-click on its name in the list to
display the Quality Checks Help.
Figure 36 Setup Instrument Advanced tab in Spectrum
When you collect your spectrum, the selected tests are performed as the data is collected
and a signal light (green , amber , or red ) indicates the result.
Signal Result Meaning
Passed The quality of the spectra is satisfactory.
Caution There is a problem that you may want to investigate to improve the
quality of the spectra you are collecting.
Warning There is a serious problem that you should attempt to solve before
collecting further spectra.
Page 59

Getting Started with Spectrum Software . 59
The result is displayed in the Results Table, and in the Information Pane for an individual
spectrum. For example, the Quality Checks reported multiple warnings for the spectrum shown in
Figure 35.
Figure 37 Quality Checks result shown in the Information Pane
To see which Quality Checks passed and which identified a problem, select the History tab of the
spectrum in the Viewing Area and refer to the Quality Checks section of the tab (Figure 36).
Figure 38 History tab showing the results of the individual Quality Checks
For each check that failed, refer to the Quality Checks Help for suggestions on how to stop it
occurring again.
Page 60
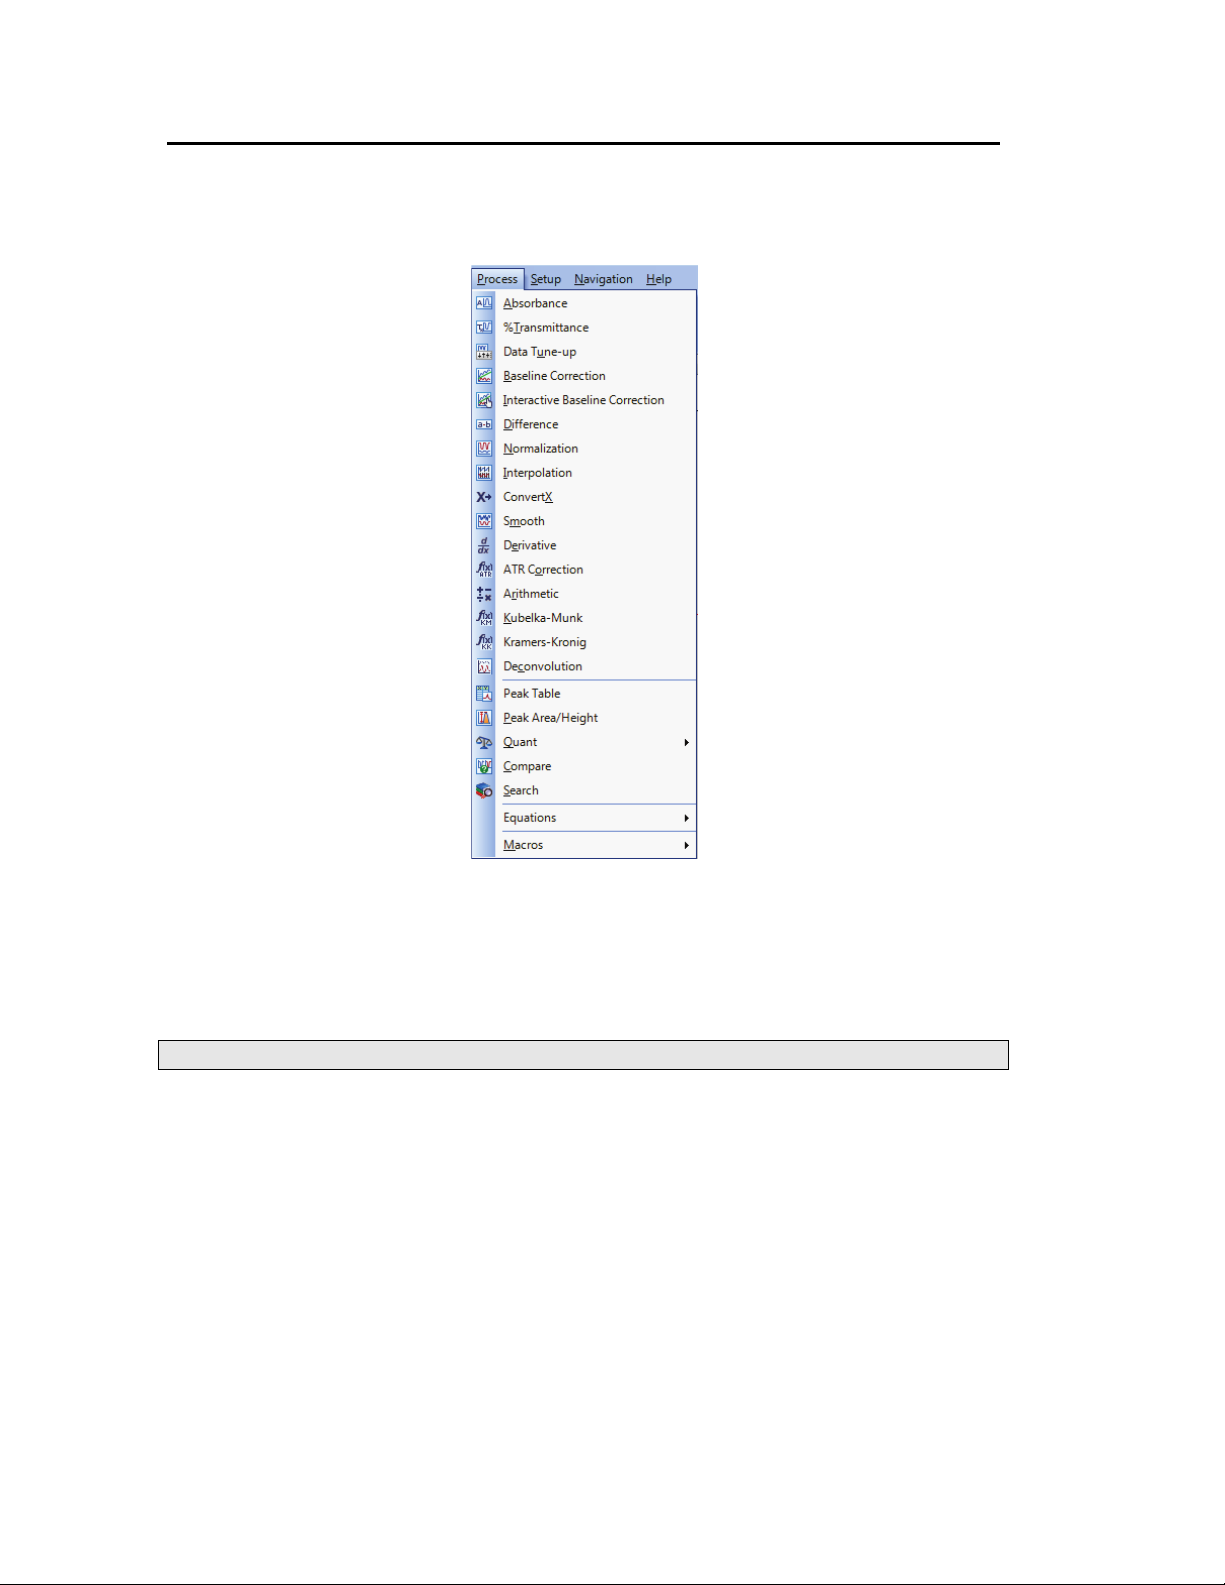
60 . Spectrum Two N User's Guide
Processing Spectra
To process your data in Spectrum software, ensure that the spectra you wish to process are
selected in the Data Explorer and then select the appropriate option from the Process menu
(Figure 37).
Figure 39 Process menu in Spectrum
When the spectra have been processed, if the process generated new spectra they will be
added to the Data Explorer with _n appended to the name to create a unique Sample ID.
Spectra created by processing are not saved automatically. For more information, see
spectra
NOTE: For full details of each process, refer to the Spectrum on-screen Help.
on page 71.
Saving
Spectral correction
Several processes in Spectrum enable you to adjust your spectra after data collection. For
example, there are commands for the conversions of ordinate units, such as: Absorbance,
Transmittance, Kubelka–Munk and Convert X.
Page 61

Getting Started with Spectrum Software . 61
You can also correct for baseline slope in your spectra. In Spectrum you can do this in two
ways: using an automatic baseline correction, or using an interactive baseline correction
(i-baseline) that enables you to define base points for the conversion (Figure 38).
Figure 40 Spectrum with baseline corrected using i-baseline
NOTE: The Processing Your Data tutorial includes a description of ordinate-unit
conversion, automatic baseline correction, and peak detection and labeling.
Identification
Several processes in Spectrum can be used to help identify your sample.
Peak Table
The results of a peak table can be used to compare peaks with another sample – for
example, one published in a pharmacopoeia. The results of the process are displayed on the
Peak Table tab in the Viewing Area (Figure 39).
Figure 41 Peak Table tab
Select Peak Detection from the Setup menu to display the Setup Peak Detection tab
and define the thresholds and the algorithm used to identify the peaks.
NOTE: You can also add peak labels to the spectrum using the same thresholds using the
Label Peaks option on the View menu.
Page 62
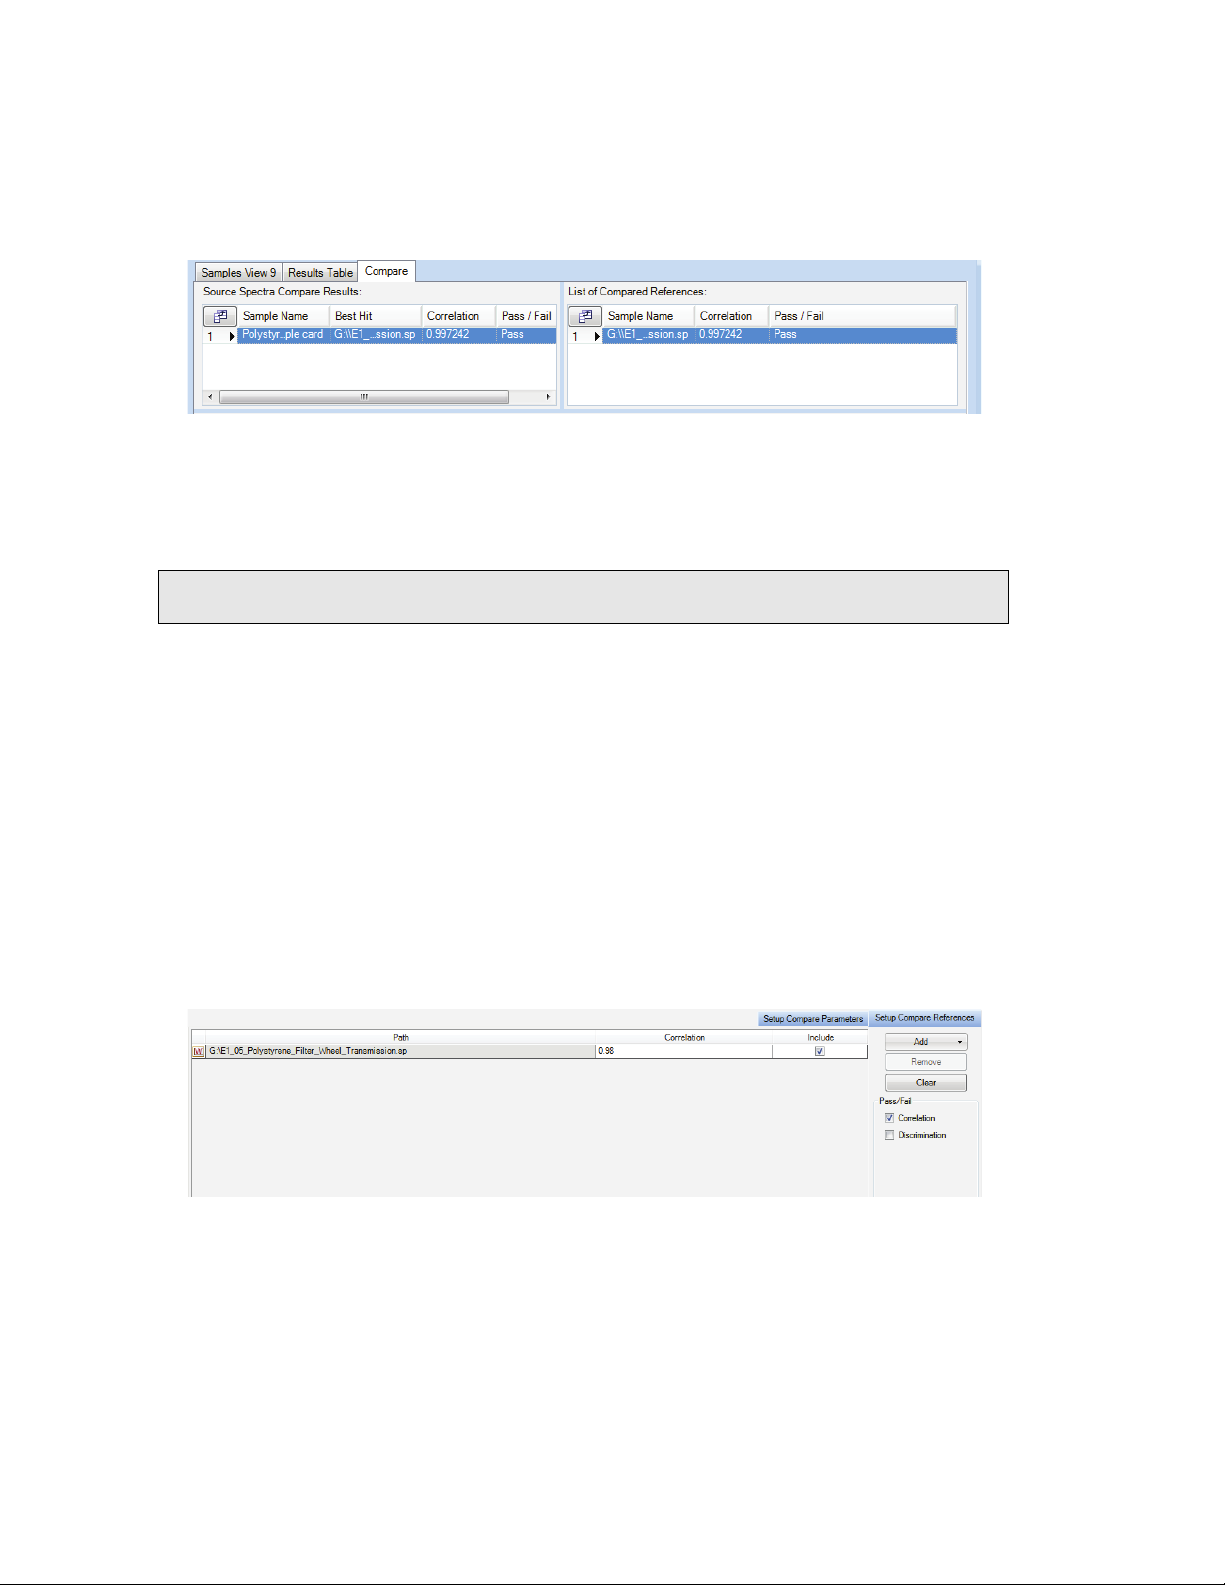
62 . Spectrum Two N User's Guide
Compare
The Compare process estimates similarity between spectra by comparison with a reference
spectrum or spectra, and is used to confirm the identity of a sample. The results are
displayed on the Compare tab in the Viewing Area (Figure 40).
Figure 42 Compare tab
In this example, the spectrum has been confirmed to be the same as the reference
spectrum, where the Correlation was defined at 0.98. The Correlation result is greater than
0.99, where 1.00 would mean that the spectra were identical.
NOTE: For an example of a Report generated showing the Compare results, refer to
Reporting on page 75.
The parameters used in the Compare process are defined on the Setup Compare tabs.
Select Compare from the Setup menu to display the Setup Compare tabs.
On the Setup Compare References tab (Figure 41) you can load a single spectrum file or a
folder of spectra. Then set the Correlation and/or Discrimination thresholds to define the
Pass/Fail result.
Correlation expresses the degree of similarity between the spectra, where 1 is identical, and
0 is wholly unrelated. Discrimination ensures that the closest match is sufficiently separated
from the next closest match. Its value is the difference in the Correlation values of the first
two results on the Compare tab.
Only files or folders with Include enabled will be used in the Compare.
Figure 43 Setup Compare References tab
Page 63

Getting Started with Spectrum Software . 63
On the Setup Compare Parameters tab (Figure 42) you can define a limited wavelength
range of your spectrum to be compared with the reference spectrum or spectra, and apply
filters that try to eliminate differences in spectra that are not related to differences in the
sample, such as differences between instruments or environmental condition. Refer to the
Spectrum on-screen help for more information.
Figure 44 Setup Compare Parameters tab
NOTE: The Comparing Spectra tutorial worked example compares the results of a spectra
subtraction (using the Difference process) to a reference spectrum.
Search
The Search process is used to confirm the identity of an unknown sample by comparison with
a reference library or spectra. The results are displayed on the Search tab in the Viewing
Area (Figure 43).
Figure 45 Search tab
In the upper left quadrant the name of your source spectrum or spectra are displayed, with
the Search Best Hit. In this example the Best Hit was acetophenone. For each source
spectrum selected, all the results are displayed in the Search Hit list. If you want to select an
alternative Search Best Hit, you can click Accept as best hit.
The best hit spectra are displayed in a graph below the Source Spectra Search Results, in the
lower left quadrant of the Search tab.
NOTE: You can also use the Search process for a Mixture Search. Refer to the Spectrum
on-screen help for more information.
Page 64

64 . Spectrum Two N User's Guide
The parameters used in the Search process are defined on the Setup Libraries and Search
tabs.
Select Search from the Setup menu to display the Setup Libraries and Search tabs.
Select which folders or files are available as Spectral Libraries on the Setup Spectral Libraries
tab (Figure 44), and specify which of the available spectral libraries should be included in the
Search Process. Only files or folders with Include enabled will be used in the Search.
Figure 46 Setup Spectral Libraries tab
On the Setup Search Parameters tab (Figure 45), enter the maximum number of best hits to
display in the Search tab when a Search process is run. By default your spectrum is
compared with each reference spectrum over the range where the spectra overlap. But if you
are particularly interested in a region select a User defined range, and/or if you want to
exclude regions from the spectra, enter the appropriate Start and End values in the Blank
Regions section.
Figure 47 Setup Search Parameters tab
The Libraries available in Spectrum are listed in the Spectral Libraries section of the
Navigation Pane. Double-click on the library icon to administer your library (for user-defined
libraries you can add or remove spectra), or to view information about the library or spectra
(Figure 46). For example, you can view any properties associated with a particular spectrum
or the image of a structural unit.
Figure 48 Library details
Page 65

Getting Started with Spectrum Software . 65
NOTE: The Search tutorial provides an example of using the Search process to identify an
unknown contaminant in a sample.
Quantification
Peak Area/Height
Use the Peak Area/Height process to produce a table of the peak areas and/or peak heights
for your spectrum or spectra. You can process spectra individually, or select a spectrum on
which to define the parameters that will be used for a number of spectra.
The height can be defined at a point (Height), or as the maximum height between two
points (Max Height). The Bases section enables you to define the baseline that is used
when determining the peak area or height.
Figure 49 Peak Area/Height dialog
When the Peak Area/Height process is run, the results are shown on the Peak Table tab
(Figure 39).
Quant
The Quant process is used to quantify properties of a sample by using one or more Quant
methods created using the Spectrum Quant Builders. The Spectrum Quant Builder software
enables you to build a method using a set of standard spectra that you have collected. Once
the method has been built and then validated in the Quant Builder software, it can be used
to quantify a component in your sample spectrum.
Page 66

66 . Spectrum Two N User's Guide
The results are displayed on the Quant tab in the Viewing Area (Figure 48), and in the
Results table. In this example, the Prediction Property calculated by the Beer’s Law algorithm
was FAME (fatty acid methyl ester) concentration in % v/v.
Figure 50 Quant tab
In the upper left quadrant your source spectrum or spectra are displayed, with the Quant
prediction results. For each source spectrum selected, more information is shown in the
Details section.
For each sample, the source spectrum and any spectra generated as part of the analysis are
displayed in the graph below the Quant results, in the lower left quadrant of the Search tab.
The Quant methods used in the Quant prediction are defined on the Setup Quant Methods
tab:
Select Quant from the Setup menu to display the Setup Quant tabs.
Select which Quant methods are available on the Setup Quant Methods tab (Figure 49), and
specify which of the available methods should be included in the Quant prediction. Only files
or folders with Include enabled will be used to process the spectra.
Figure 51 Setup Quant Methods tab
Page 67
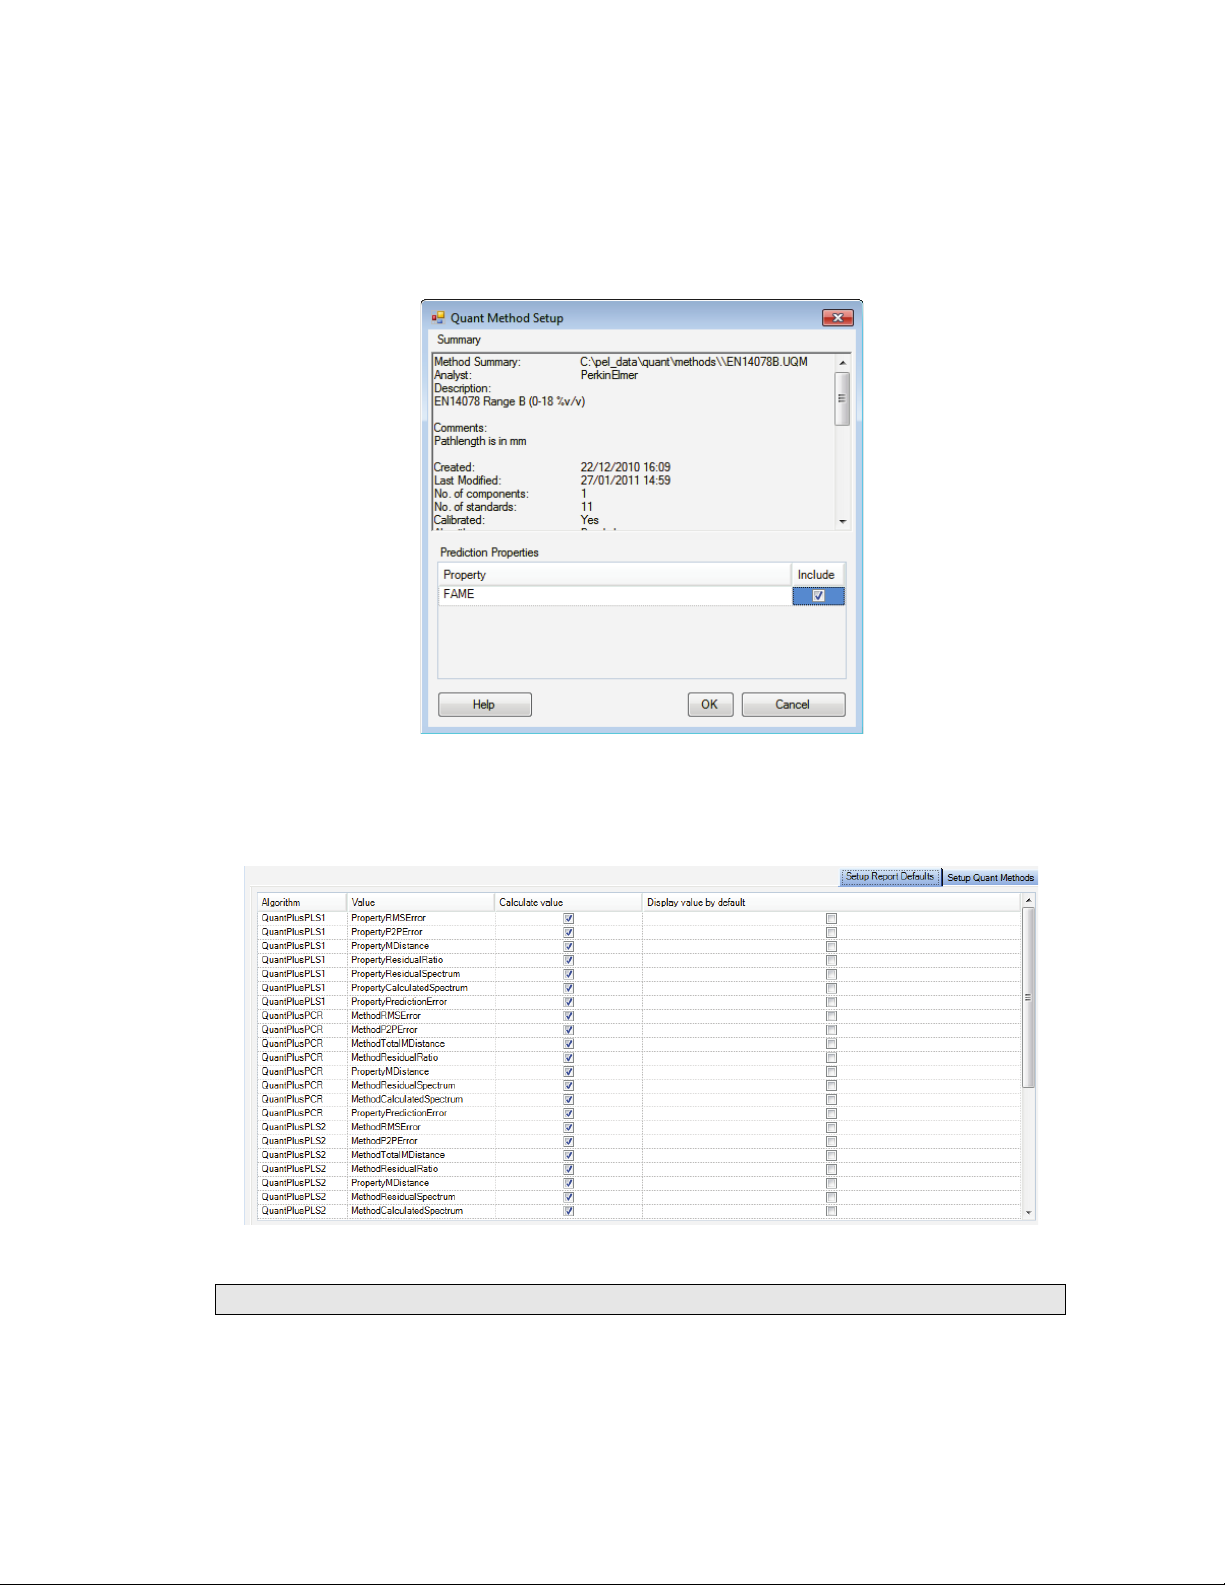
Getting Started with Spectrum Software . 67
More information about the method selected is shown in the Quant Method Setup dialog
(Figure 50):
Select Settings on the Setup Quant Methods tab.
Here you can view a summary of the Quant method and, where the Quant calibration
includes more than one prediction Property, select which ones will be included when the
Quant method is run Figure 50).
Figure 52 Quant method details
On the Setup Report Defaults tab (Figure 51), select which prediction results will be
displayed for each algorithm type in the Results Table when a Quant prediction is run.
Figure 53 Setup Quant Results tab
NOTE: Refer to the Spectrum on-screen Help for more information.
Page 68

68 . Spectrum Two N User's Guide
Equations
A list of the available Equations is displayed on the Setup Equations tab. The Equations are
also added to the Equations sub-menu of the Process menu.
To add a new Equation, select Equations from the Setup menu to display the Setup
Equations tab, and then select Add.
The Equation tab will be displayed (Figure 52).
Figure 54 Equation tab
You can type in an equation, or click on items in the Operators, Functions or Variables
lists. Each function has a number of required or optional arguments. A tooltip will be
displayed when you enter a function to show you the correct syntax. The first argument is
often <spectrum>, which if set to All will be applied to all spectra selected, but you can
Browse to select a specific spectrum.
Any results in the Results table will be available as Variables, as well as the pathlength set
on the Setup Pathlength tab. In this way you can add numeric custom columns in the Sample
Table for your spectra and these entries will be available for use in equations.
When you have finished entering your equation, you can click Check to verify your equation.
NOTE: The Macros tutorial provides an example of using an Equation to calculate the area
of a peak.
Page 69

Getting Started with Spectrum Software . 69
The Results formatting tab enables you to define Pass / Fail criteria and select how the result will
be displayed. For example, you can color the cell in the Results Table green if the result is a Pass.
Figure 55 Results formatting example
To view the details of, or modify, an equation:
Select Equations in the Navigation Pane and then select the appropriate icon.
OR
Select the Equation on the Setup Equations tab, and then click Settings.
To run the equation, select the spectrum or spectra you want to process in the Data
Explorer, and then select the equation from the Equations sub-menu of the Process menu.
Macros
As well as performing the individual process commands you can combine these to create a
workflow or Macro. Macros can also include Instrument Setup (Figure 54) and Data
Collection, and export and reporting commands to enable you to structure your analysis from
setting the instrument parameters to generating your results.
Figure 56 Macros Settings dialog showing an Instrument Setup step
NOTE: Refer to the Macros tutorial and the on-screen Help for more information.
Page 70

70 . Spectrum Two N User's Guide
Scanalyze
As well as Macros, you can use the Scanalyze feature in Spectrum to scan a spectrum and
then immediately process it using the Compare, Verify, Quant or Search options. During
multiple accumulations, the results are displayed and then updated as the data collection
progresses.
Figure 57 Scanalyze options
The Compare, Verify, Quant and Search processes must first be set up using the appropriate
Setup menu option.
NOTE: You must have a valid background for the Scanalyze option to be available.
Page 71

Getting Started with Spectrum Software . 71
Saving Spectra, Exporting Spectra and Reporting
There are various features in the software to help you present your data outside Spectrum.
Saving spectra
All spectra in Spectrum software are saved to *.sp format by default.
To find out if a spectrum has been saved, refer to the Results Table (if a Samples View is
selected) or the Information Pane. Spectra that are not saved are marked by a red cross.
In Figure 56 the original spectra have been saved to disk, but the processed spectrum, with
_1 appended, has not.
Figure 58 Saved and unsaved spectra displayed in the Results Table
You can save your spectra in the following ways:
• Using the Auto-Save option when collecting spectra
• Using the Save, Save As and Save All options from the File menu
• Using an Output step in a Macro
• Using the context menu in the Viewing Area.
Auto-Save Spectra
In Spectrum software, Auto-Save is selected by default (Figure 57). This will save your
spectra to the folder specified after each measurement.
Figure 59 Auto-Save spectra on the Setup Instrument Data Collection tab
The default Save Location, here C:\pel_data\spectra, was defined during the software
installation. If you wish to change the location, or deselect this option, refer to the Setup
Instrument Data Collection tab.
Page 72

72 . Spectrum Two N User's Guide
Save, Save As, Save All
Save will save the selected spectrum, or the spectra in the selected Samples View, to the
current default save location.
Save As displays a dialog for the spectra selected that enables you to change the file name
and the destination directory (Figure 58). You can also change the default save location for
all spectra.
Figure 60 Save Spectra As dialog
Save All displays a dialog similar to that shown in Figure 58, but listing all the spectra open
in Spectrum.
Save Binary
Use the Save Binary option in the graph to save the spectrum as a *.sp file. Select a curve
and then right-click to display a context menu. Select Save Binary, and then browse to a
save location.
Exporting spectra
You can export spectra in several ways:
• Using the Auto-Save Export option when generating spectra
• Using the Export option from the File menu
• Using an Output step in a Macro
• Using the context menu in the Viewing Area (ASCII format only).
You can export your spectra to csv format, JCAMP-dx, ASCII, or a custom format. The
settings for the Custom Defined Format are selected on the Setup Export tab. Refer to the
Spectrum on-screen Help for more information.
Page 73

Getting Started with Spectrum Software . 73
Auto-Save Export
If you select Export on the Setup Instrument Data Collection tab, your spectra will be
exported to the location specified after each measurement (Figure 59).
Figure 61 Auto-export on the Setup Instrument Data Collection tab
The default Save Location, here C:\pel_data\spectra, was defined during the software
installation. To select this option, or to change the default save location, refer to the Setup
Instrument Data Collection tab.
Export
You can export your spectra at any time using the Export option from the File menu. The
Export Data dialog displayed lists the selected spectrum or the spectra in the selected
Samples View (Figure 60). You can enter a file name and the destination directory, and then
choose the file format the spectra will be exported to.
Figure 62 Export dialog
Save ASC
Use the Save ASC option in the graph to save the spectrum as an ASCII file (*.asc). Select a
curve and then right-click to display a context menu. Select Save ASC, and then browse to a
save location.
Page 74

74 . Spectrum Two N User's Guide
Send To
The Send To option (Figure 61) sends the contents of the current window to the selected
application.
Figure 63 Send To
To see the options on the Send To menu, you must have the appropriate software installed
on your PC. To see the Send to Email option, you first need to set up your email account
settings on the Setup Email tab.
NOTE: If you cannot see the Word or Excel option, but you do have Microsoft® Office
installed on your PC, refer to the
L1050095) for troubleshooting information.
Spectrum Administrator’s Guide
(part number
You can also use the Send To menu to send your data to Bio-Rad’s KnowItAll Informatics
System®, if you have the software installed.
To display the Setup Email tab:
Select Export and Email from the Setup menu, and then select the Setup Email tab.
Figure 64 Setup Email tab
When you select Send To Email, the contents of the current window are added to an email
form as an attachment. You can then enter the recipient’s email address, type your message
and add any additional attachments before sending the message.
Page 75

Getting Started with Spectrum Software . 75
Reporting
You can generate a report of your data in two ways:
• Using the Report option from the File menu
• Using an Output step in a Macro.
NOTE: Reports are also generated using customized templates for Instrument Verification
Checks and Ready Checks. See
for more information.
Report
You can generate a report of your results at any time using the Report option from the File
menu (Figure 63).
Ready Checks and Instrument Verification
on page 86
Figure 65 Report dialog
You can generate a report as *.rtf (rich text format) or *.pdf (portable document format)
files and then save the report to a file, print it, or attach it to an email.
NOTE: To see the Email Report option you must set up your email account settings on the
Setup Email tab.
The default Folder for Reports, here C:\pel_data\reports, was defined during the software
installation. To change the default location, browse to a new folder.
Page 76

76 . Spectrum Two N User's Guide
Reports are generated using a template. You can select the sections you want to include in
your report on the Report Edit tab. The items listed depend on the template selected. In the
example shown in Figure 64, we have included the spectrum and the Compare results.
Figure 66 Example report showing Compare result
NOTE: You can also create a report as part of an Output step in a Macro. See the Macros
tutorial and the Spectrum on-screen help for more information.
Printing
The Print and Print Preview options from the File menu send the contents of the current
window displayed to the printer. Print Preview enables you to change your Page Setup, such
as the paper size and orientation, before printing.
NOTE: You can also print your data as a Report.
Page 77

Getting Started with Spectrum Software . 77
Instrument Settings
If you want to change any of the default instrument settings, use the Setup Instrument tabs.
Select Instrument from the Setup menu to display the Setup Instrument tabs.
To amend any value, select the parameter and then enter your new value, or select a
value from the drop-down list.
Figure 67 Setup Instrument Basic tab
On the Setup Instrument Basic tab you can set the Start and End points of the scan range
(by default in wavenumbers, but the abscissa units can also be set to nanometers or
microns) and the Accumulations required, either as a number of scans, or as a length of
time. You can also set the Resolution (in cm
You can also save and export instrument settings as *.set files for use in an Instrument
Setup step in a Macro, or for transferring instrument settings between compatible
instruments or between PCs, using Load and Save (Figure 65).
Refer to the Spectrum tutorial Setting Up Your Instrument for more information on the
Setup Instrument tabs, or refer to the appropriate topic for each tab in the Spectrum
on-screen Help.
NOTE: The Instrument Settings and Measurement toolbars can be configured to contain any
setting available on the Setup Instrument tabs.
−1
).
Page 78

78 . Spectrum Two N User's Guide
Sample slide holder
J-stop card holder
Changing the Resolution
The Resolution setting is on the Setup Instrument Basic tab in Spectrum software (Figure 27).
The resolution achievable in the instrument is determined by both the optical path difference
in the interferometer and the beam divergence in the interferometer as seen by the detector.
The Spectrum Two N spectrometer has a slot in the double-sided slide holder that enables
you to insert a J-stop card before the sample (Figure 66).
Figure 68 The double-sided slide holder
J-stop cards set the upper limit to the resolving power (wavenumber/resolution) of the
instrument by limiting the beam divergence. Hence, to achieve a resolution defined by the
optical path difference (for example, 2 cm
−1
), as specified by the Resolution on the Setup
Instrument Basic tab, a certain beam divergence is required and this is dictated by a given
J-stop aperture diameter. J-stop cards are provided with Spectrum Two to enable 8, 4, 2 and
−1
resolutions at 7200 cm−1.
1 cm
At a given wavenumber, the smaller the J-stop aperture, the finer the resolving power
(assuming we are not limited by the optical path difference scanned by the interferometer).
Hence, at 7200 cm
power of 1800. However, this same diameter may be used achieve 2 cm
−1
at 1800 cm−1, providing that the optical path difference (set by the Resolution
1 cm
−1
the 4 cm−1 J-stop card has a given diameter to deliver a resolving
−1
at 3600 cm−1 or
setting in the software) is set up appropriately. This can be useful where higher resolution is
needed for low-energy situations, where it is only required to achieve resolutions up to lower
wavenumber ranges. For example, using a 4 cm
3600 cm
times) than using the 2 cm
For normal operation at 4 cm
−1
only can enable higher signal-to-noise to be achieved (or permit shorter scan
−1
J-stop card which would deliver 2 cm−1 resolution to 7200 cm−1.
−1
resolution as defined in the software, the Spectrum Two
optics are designed to deliver an approximately 4 cm
wavenumber calibration without the use of the 4 cm
−1
J-stop to deliver 2 cm−1 resolution to
−1
instrument lineshape and specified
−1
J-stop card (assuming the sample is
not acting to restrict the beam). However, when highest wavenumber accuracy in direct
transmission measurements is required, we recommend use of the optional AVI function with
the 4 cm
−1
J-stop card installed. This ensures the purest lineshapes at higher wavenumbers.
NOTE: This assumes the sample is not restricting the beam and itself forming an effective
J-stop. For highest accuracy work, we recommend to always ensure the sample is
larger than the J-stop diameter.
Page 79
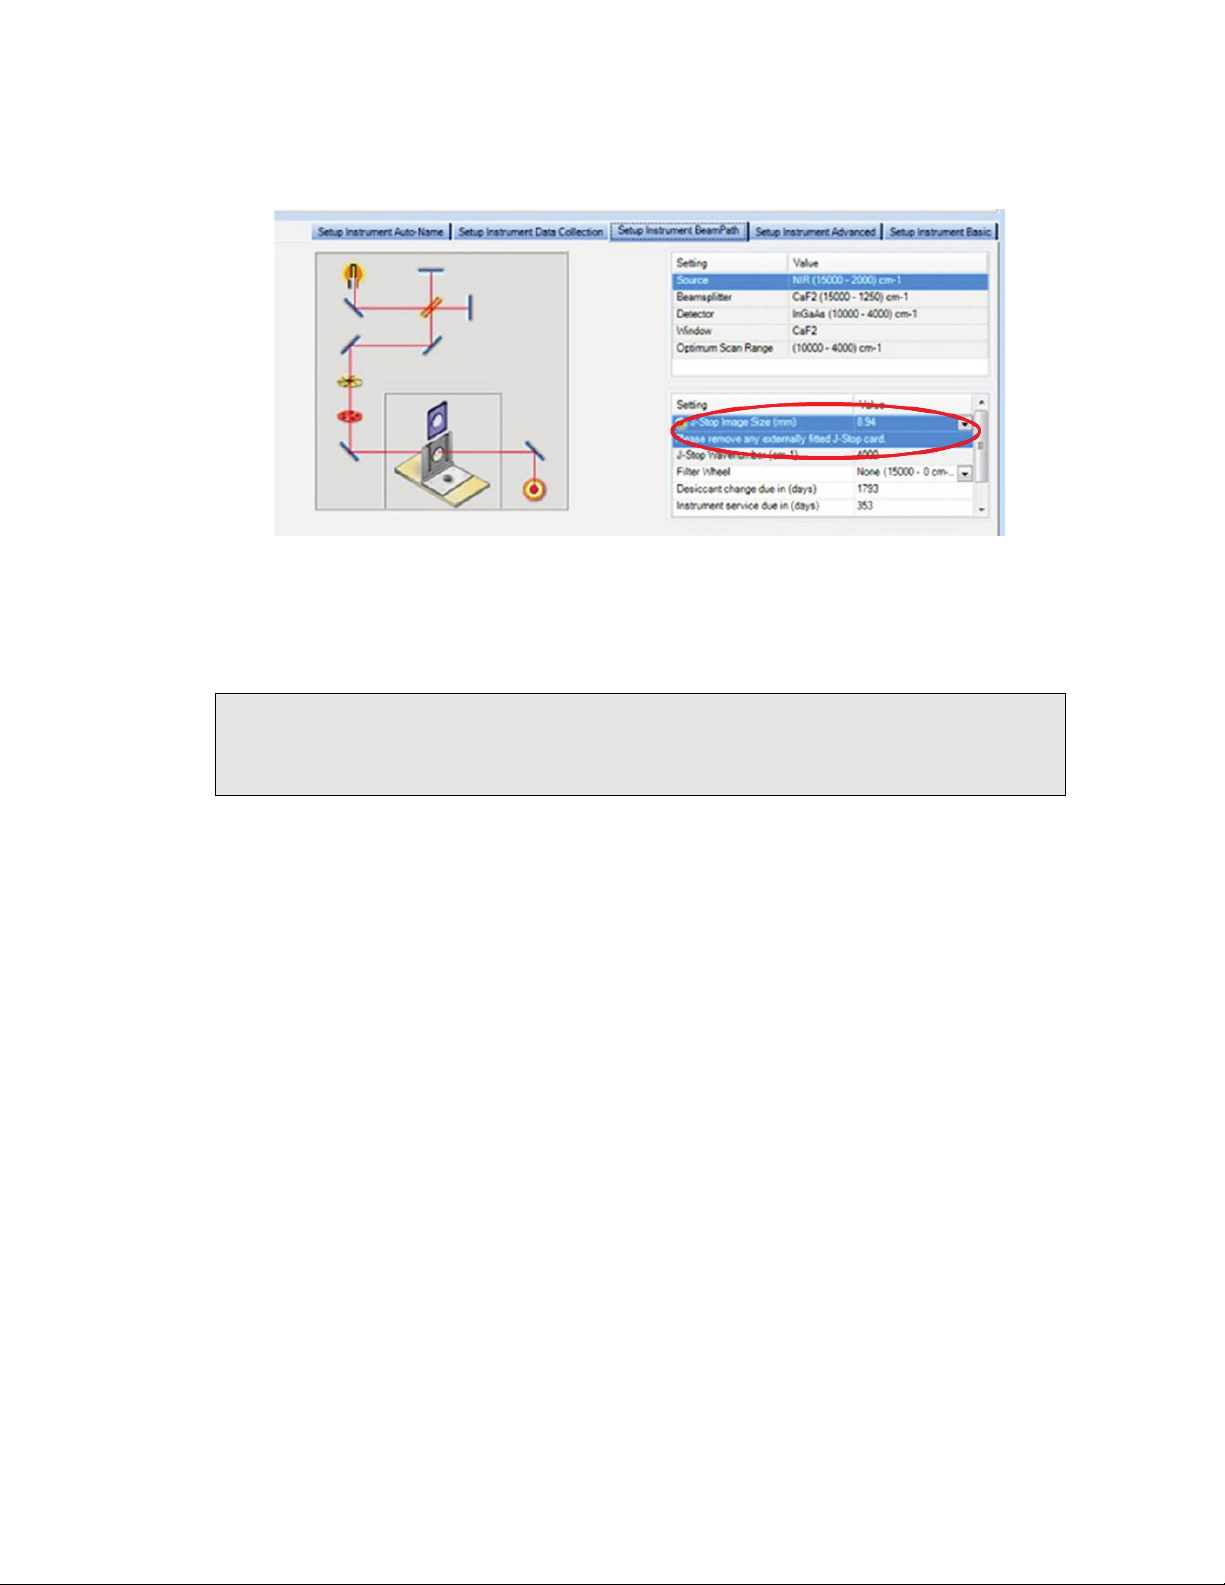
Getting Started with Spectrum Software . 79
If you change the Resolution (cm−1) in Spectrum software with the slide holder installed in
the sample compartment, a message will be displayed on the Setup Instrument BeamPath
tab, and in the Status Bar, prompting you to insert one of the J-stop cards in the slide holder,
or to remove any external J-stop card (Figure 67).
Figure 69 Setup Instrument BeamPath tab
The J-Stop size selected and the Resolution will be recorded as part of the Instrument
Settings on the History tab of the spectrum. See the Spectrum on-screen help for more
information.
NOTE: For accessories other than the Slide Holder, you cannot insert a J-stop card.
Therefore, increasing the resolution (resolution values below 2 cm−1) decreases the
J-Stop Wavenumber, the maximum wavenumber at which you can achieve that
resolution.
Page 80

80 . Spectrum Two N User's Guide
Component Checks
The Component Checks are run automatically the first time you connect to the instrument.
You can select to run component checks each time you connect to the instrument, on
demand, or after a scheduled number of days on the Setup Laboratory Actions tab in the
Laboratory Scheduler. Refer to the Spectrum on-screen Help for details.
To run the Component Checks on demand:
Select Component Checks from the Instrument Checks sub-menu on the
Measurement menu.
The Component Checks dialog is displayed (Figure 68) and the tests are run. Each item
is assigned a pass or fail status . If the Component Checks identify a problem,
further information or instructions will be provided in the Recommended Action section.
Figure 70 Component Checks dialog
Page 81

Getting Started with Spectrum Software . 81
If the Component Checks identify that a user-maintainable part needs to be replaced, for
example the source or desiccant, a link to the appropriate Replacement Wizard will be
displayed (Figure 69). The Replacement Wizard will provide step-by-step instructions for
replacing the part. Refer to the relevant section in
more information.
Maintenance
, starting on page 95, for
Figure 71 Component Checks dialog with source failure
If the Component Checks identify a problem that may require investigation by a PerkinElmer
Service Representative, refer to IRTechSupport@PERKINELMER.COM for assistance.
If your PerkinElmer Service Engineer requires the log files created during the Component
Checks, these are located at:
• C:\ProgramFiles\PerkinElmer\ServiceIR\Component Checks\[Instrument Serial Number]
OR
• C:\ProgramFiles (x86)\PerkinElmer\ServiceIR\Component Checks\[Instrument Serial
Number]
for Windows XP/Windows 7 (32-bit) or Windows 7 (64-bit), respectively, where “C:” is the
drive on which Spectrum software is installed.
Page 82

82 . Spectrum Two N User's Guide
Humidity Shield
The humidity shield displays the current internal humidity of the spectrometer as measured
by the humidity sensor inside the instrument.
Select Humidity Shield from the Measurement menu.
The Humidity Shield dialog is displayed.
Figure 72 Humidity Shield
The information your humidity shield may display is listed in Table 3.
Table 3 Humidity Shield status information
Status Appearance Humidity
Range
Normal 0% <10% No action is required.
High 20% 20–39% Desiccant change is recommended.
Critical 40% ≥40% Replace the desiccant immediately to avoid
If the humidity of your instrument reaches high or critical levels, the humidity sensor will
display a warning message on the Status bar.
Action Required
instrument damage.
Figure 73 Humidity sensor High and Critical warning messages
NOTE: The humidity is also checked during the Component Checks.
Page 83

Getting Started with Spectrum Software . 83
The expiry date of the desiccant is based on the date the desiccant was last changed. It
gives an indication of when the desiccant is expected to expire in normal conditions (up to
five years). However, if your spectrometer is used or stored in an environment that has high
levels of humidity you are advised to use the Humidity Shield to check the humidity of your
instrument more frequently.
To replace your desiccant you must use the Desiccant Replacement Wizard:
Click Replace desiccant.
Follow the instructions on-screen. See
information.
Changing the Desiccant
on page 98 for more
Page 84

84 . Spectrum Two N User's Guide
Power Save Mode
There are two ways you can put the instrument into a low-power mode: by pressing the
power button on the front of the instrument or using the Power Save option in Spectrum
software.
NOTE: If the power to the instrument is suddenly cut off, for example by disconnecting the
power supply, then you must connect the instrument to Spectrum software once the
power supply is re-established to apply any Power Save mode settings.
Using the button on the front of the instrument
To put the instrument in low-power mode:
Press the Power On button on the front of the instrument (Figure 72) for approximately
2 seconds until the LED turns from solid green to solid yellow.
If you are connected to the instrument in Spectrum software, the Setup Instrument tabs
Measurement menu and the Scan toolbars will be disabled.
Figure 74 Power button on the instrument
NOTE: If you use the Power button to put the instrument in low-power mode, the
instrument will not be under software control. Consequently, any scheduled Power
Save mode event in Spectrum software will not occur until after you have manually
repowered the instrument.
To power up the instrument again:
Press the Power button on the front of the instrument for approximately 2 seconds until
the LED turns green.
The instrument will take a couple of minutes to initialize. When the initialization is
complete, and if you were connected to the instrument previously, the Setup
Instrument tabs and Scan toolbars will be available.
Page 85

Getting Started with Spectrum Software . 85
Using Power Save Mode in Spectrum software
You can use the Power Save option in Spectrum software to control when the instrument is
in standby or powered up. You can set up the Power Save options independently for each
day of the week.
Select Laboratory Scheduler from the Setup menu, and then select the Setup Power
Save tab (Figure 73).
Enter the Power On and Power Off times for each day.
Figure 75 Setup Power Save tab
The instrument will enter Power Save mode at the scheduled time.
NOTE: Shortly before the instrument enters Power Save mode, a message will be displayed.
You then have the option to postpone the event for up to 2 hours.
The instrument’s internal clock is synchronized with the last PC to make a connection. To
update the clock, either after manually changing the PC time, or after an event such as
Daylight Savings Time, connect to the instrument using either Spectrum, Spectrum ES or
AssureID.
To put the instrument in Power Save Mode at any time:
Select Power Save Mode from the Measurement menu.
During Power Save
When the instrument is placed in Power Save Mode the LED on the front of the instrument
will flash yellow to indicate that the instrument will start up again at the scheduled time.
Power on event
At the scheduled time, or if the Power On button is pressed, the LED turns from flashing
yellow to solid green. The instrument will then take a couple of minutes to initialize. When
the initialization is complete, and if you were connected to the instrument previously, the
Setup Instrument tabs and Scan toolbars will be available.
NOTE: If you use the Power button on the front of the instrument to put the instrument in
low-power mode, the instrument will not be under software control. Consequently,
any scheduled Power Save mode event in Spectrum software will not occur until after
you have manually repowered the instrument.
Page 86

86 . Spectrum Two N User's Guide
Ready Checks and Instrument Verification
There are three types of Instrument Checks in Spectrum software (Figure 74):
• Component Checks, which check that the components of your instrument are working.
For more information refer to
You are advised to run these each time you start your instrument.
• Ready Checks, which check that your system – that is, instrument and accessory – are
fit-for-purpose.
You are advised to run appropriate Ready Checks before starting your sample analysis.
For the Contamination Check, this would be before preparing each sample.
A Ready Check is specific to the current instrument configuration.
• Instrument Verification, which provides basic checks to determine that your instrument
is performing within parameters.
These tests should be performed according to the working practices of your laboratory,
but usually weekly, or monthly, would be appropriate.
Component Checks
on page 80.
Figure 76 Instrument Checks sub-menu of the Measurement menu
Ready Checks
A Ready Check demonstrates that an aspect of the performance of your complete system,
including sampling accessory, is fit-for-purpose. When defining tolerances for Ready Checks,
you should consider what the definition of that is for your individual application.
Page 87

Getting Started with Spectrum Software . 87
To run the tests, select Instrument Checks and then Ready Checks from the
Measurement menu, and then select the Ready Check you want to run.
You can run the ready checks individually or run all the Ready Checks selected on the
Setup Ready Checks tab using the Run Selected option. Follow the instructions
on-screen.
Figure 77 Ready Checks dialog
• The Contamination Check is applicable to sampling accessories that include a
component, such as a top plate, that may require cleaning between samples. The check
compares a background spectrum taken after your sample has been removed with a
reference background spectrum taken when the accessory was perfectly clean. The
ratioed spectrum is then examined in absorbance for any sample residue.
You require a suitable reference background spectrum and can enter details for up to
three peaks that are characteristic of the possible contaminant.
• The Quant Control Check enables you to verify your Quant Method before scanning your
samples. The concentration of a control sample is calculated using the Quant Method,
and compared with the known concentration. If it is within limits defined during setup,
the check passes.
• The Abscissa Check collects a background spectrum and then collects the spectrum of a
polystyrene reference sample (either using the polystyrene reference in the filter wheel,
or a polystyrene reference inserted in the slide holder). It then measures the
wavenumber at the specified peaks. If the wavenumber value is within the tolerances
defined during setup, the check passes.
• The Throughput Check collects a spectrum and measures the ordinate value at each of
the specified abscissa positions. If the measured ordinate value is above the lower limit,
the check passes.
• The Noise Check collects two background spectra and then measures the RMS (%T)
and Peak-to-Peak (%T) noise over a range and report the baseline Trend. If the values
are within limits defined during setup, the check passes.
At the end of the tests a report will be generated (by default) containing the results.
Refer to the Spectrum on-screen help for more information on setting up Ready Checks.
Page 88
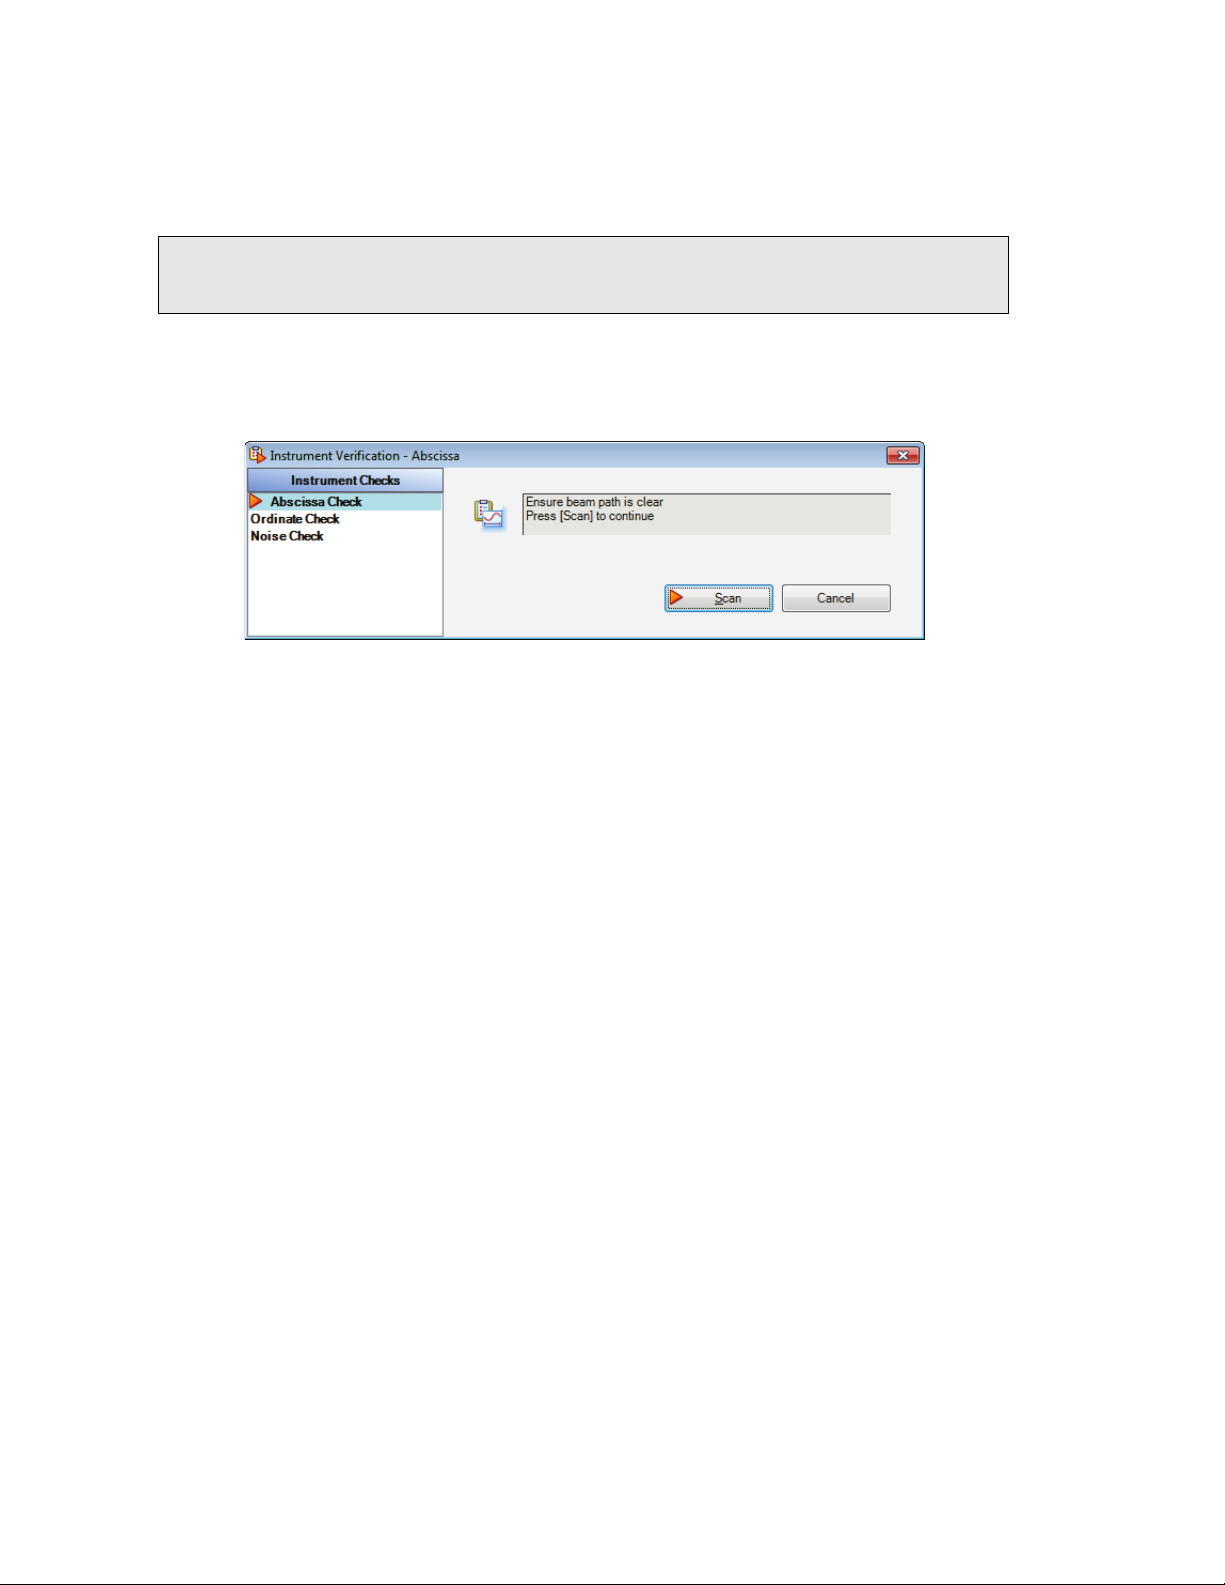
88 . Spectrum Two N User's Guide
Instrument Verification
You can run the basic Instrument Verification Checks without changing any settings.
However, you can select further tests and modify the default values for each test.
NOTE: Before performing any Instrument Verification tests you should remove any sampling
accessory from the beam path. If your instrument does not have an internal filter
wheel, then you will need the slide holder inserted in the beam path.
To run the tests, select Instrument Checks and then Instrument Verification Checks
from the Measurement menu.
Follow the instructions on-screen.
Figure 78 Instrument Verification dialog
The Abscissa Check collects a background spectrum and then collects the spectrum of a
NIR polystyrene reference sample. It then measures the wavenumber at the specified
peaks. If the wavenumber value is within the tolerances defined during setup, the check
passes.
The Ordinate check by default uses a reference card inserted in the slide holder. You
can choose another reference material for the tests, but you will need to change the
default settings.
The Noise Check collects two background spectra and then measures the RMS (%T)
and Peak-to-Peak (%T) noise over a range and reports the baseline Trend. If the values
are within limits defined during setup, the check passes
At the end of the tests a report will be generated (by default) containing the results.
You can run up ASTM Level 0 tests, or tests that comply with the requirements of several
national pharmacopoeias. Refer to the Spectrum on-screen help for more information on
setting up Instrument Verification Checks.
Page 89

Getting Started with Spectrum Software . 89
Atmospheric (CO2/H2O) Suppression
Atmospheric suppression, selected by default on the Setup Instrument Advanced tab
(Figure 77), is an atmospheric correction routine.
Figure 79 Setup Instrument Advanced tab in Spectrum
This routine is more powerful than simple subtraction, overcoming the following issues:
• Non-linearity due to resolution
• The measured spectrum is temperature dependent
• Lineshape and calibration are affected by J-stop and sample or accessory.
When CO2/H2O is switched on, the software uses a single reference spectrum derived from
high-resolution data and our understanding of the instrument to model the lineshape, then
finds the current real instrument parameters by least-squares fitting to the measured
spectrum.
Figure 80 Correction of an MIR spectrum at 4 cm
−1
resolution
Page 90

90 . Spectrum Two N User's Guide
AVI Correction
If available for your current instrument and sampling configuration, AVI correction can be
selected on the Setup Instrument Advanced tab in Spectrum (Figure 79).
Figure 81 Setup Instrument Advanced tab in Spectrum
The objectives of Absolute Virtual Instrument (AVI) correction are:
• Consistent performance over time and between instruments
• Traceability for all measurements.
Although FT-IR spectrometers use a reference laser, the wavenumber calibration and
lineshape are affected by differences in beam divergence and uniformity. This is true for all
FT-IR spectrometers. Differences can occur between instruments, when using different
sampling accessories and when components are changed. AVI enables calibration and
lineshape to be maintained.
The Absolute Virtual Instrument is an instrument with theoretical performance, such that the
result of measuring a known sample on such an instrument can be predicted. So, if we
measure with a real instrument and calculate the software transform to match the theoretical
result, we can apply this transform to future measurements.
The Absolute Virtual Instrument is defined by wavenumber calibration, instrument lineshape
and ordinate accuracy.
When AVI is switched on, the software measures the current instrument profile relative to an
absolute standard (a methane cell) and an ideal lineshape function, and applies a correction.
Page 91

Getting Started with Spectrum Software . 91
−1
Figure 82 Spectra of methane at 4 cm
AVI (bottom)
AVI correction can only be performed if an AVI Calibration has been set up for the current
configuration and resolution.
resolution as measured (top) and with
AVI Calibration
To set up an AVI Calibration:
Select Standardize from the Measurement menu.
OR
Select AVI from the Adjustments Toolbox, accessed via the Setup Instrument
Advanced tab.
Follow the instructions on-screen. For further information, refer to the Spectrum
on-screen Help file.
Figure 83 AVI Calibration dialog prompting the user to insert the methane cell
Page 92

92 . Spectrum Two N User's Guide
Exit Spectrum Software
When you exit Spectrum software you can choose a Save Option appropriate for what you
want to do next time you use Spectrum.
If you want to continue working with the same data, or to collect more samples listed in your
Sample Table, you can resume your session next time with all your data loaded. If you
choose not to reload your data, you can make sure that any unsaved data is saved to the
appropriate default location you chose at installation.
To exit Spectrum:
1. Select Exit from the File menu.
OR
Click the at the top right of the Spectrum window.
The Save Options dialog is displayed.
2. Select whether to:
Save unsaved datasets – save any unsaved data, and open Spectrum with your
default settings and layout next time, which enables you to preserve your current
workspace for when you next log on to Spectrum at this PC.
Save for reload next time – save any unsaved data, and reload the current spectra,
settings and layout next time, which enables you to carry on with your work from where
you left off when you next log on to Spectrum at this PC.
Exit without saving datasets – exit without saving any unsaved data, layout or
settings information, which restores the default workspace when you next log on to
Spectrum at this PC.
Page 93

Getting Started with Spectrum Software . 93
Page 94

Page 95

Maintenance
Page 96

96 . Spectrum Two N User's Guide
Overview
This section covers the maintenance that can be carried out by a user.
It describes:
• Cleaning the spectrometer
• Replacing the desiccant
• Purging the sample area
• Purging the instrument optics
• Replacing the sample compartment windows
• Replacing the source
• Replacing the main board air filter.
NOTE: You
AssureID software to replace the source, desiccant or sample compartment windows,
as described in this section. During the maintenance procedure, the internal
temperature of the instrument is maintained to prevent the ingress and condensation
of water vapor, which could damage the optics.
must
use the appropriate Replacement Wizard in Spectrum, Spectrum ES or
Page 97

Maintenance . 97
Cleaning the Spectrometer
Clean the outside of the instrument using a damp cloth. If necessary, a mild detergent may
be used. Before you clean the entire instrument, always perform a patch test on an
inconspicuous area.
Avoid spilling liquid into the instrument. Clean all external spills immediately.
Page 98

98 . Spectrum Two N User's Guide
)
recommandons de modifier le déshydratant plus souvent et de surveiller
Changing the Desiccant
Expect to change the desiccant in the spectrometer approximately every
five years. Old, used desiccant releases moisture.
CAUTION
In regions experiencing high humidity levels we recommend that you
change the desiccant more often, and that you monitor the internal
humidity of your instrument using the Humidity Shield (refer to page 82
regularly.
Attendez-vous à changer le dessicant dans le spectromètre environ tous
les cinq ans. Ancien, le dessiccateur utilisé libère de l'humidité.
ATTENTION
Dans les régions où le taux d'humidité est élevé, nous vous
l'humidité interne de votre instrument à l'aide de l'humidité (voir page
81) régulièrement.
The desiccant change interval is set in the Desiccant change due in (days) option on the
Setup Instrument BeamPath tab in Spectrum software (Figure 82).
Figure 84 Setup Instrument BeamPath tab in Spectrum
If the desiccant change due date has passed, a warning will be displayed in the Status Bar
and in the table on the Setup Instrument BeamPath tab.
The warning is displayed until you update the software that the desiccant has been changed.
To reset the desiccant change interval, select the current value, click Changed to clear any
warning messages.
You may also be prompted to change your desiccant during the Component Checks.
To replace the desiccant, you will require the desiccant replacement kit (part number
L1600244). The kit contains a wrench and two bags: one large and one small.
Inspect the humidity indicator card in the plastic bag containing the larger of the two bags. If
the card is pink it indicates moisture in the bag, and you should discard the desiccant pack.
Only use the replacement desiccant bag if the indicator is blue.
Page 99

Maintenance . 99
Old, used desiccant releases moisture and can cause high humidity
levels inside the instrument resulting in catastrophic failure of KBr optics.
CAUTION
Do not use damaged packs of desiccant. Make sure that the packs you
use have not been left in contact with the air.
ATTENTION
Un dessiccateur usé libère de l'humidité et peut causer des niveaux
élevés d'humidité à l'intérieur de l'instrument, entraînant une panne
catastrophique de l'optique KBr.
Ne pas utiliser de paquets endommagés de dessiccateur. Assurez-vous
que les paquets que vous utilisez n'ont pas été laissés en contact avec
l'air.
The instrument must be switched on and you must be connected to the instrument in
Spectrum, Spectrum ES or AssureID software. You can start the Desiccant Replacement
Wizard from the Adjustments Toolbox or, if the Component Checks identify high humidity as
a problem, by selecting Run Desiccant Replacement Wizard on the dialog. You can also
start the wizard by clicking Replace desiccant on the Humidity Shield dialog.
NOTE: In AssureID software, the Adjustments Toolbox is available from the Configure
Instruments and Accessories group on the Tools menu.
To replace the desiccant when connected to Spectrum software:
1. Select Instrument from the Setup Menu.
The Setup Instrument tabs are displayed.
2. Select the Setup Instrument Advanced tab and then click Toolbox.
The Adjustments Toolbox dialog is displayed.
Page 100

100 . Spectrum Two N User's Guide
3. Click .
The Desiccant Replacement Wizard is displayed.
4. Follow the instructions on-screen.
When you have the completed the procedure the Desiccant change due in (days) is reset
automatically to 1800 days.
 Loading...