


 Loading...
User's Guide
Version 2.0
Document Number: 012-11074D

SPARKvue® |
User's Guide |
SPARKvue disclaimers
Document Number: 012-11074D
Version 2.0
Limited Warranty
Fora description ofthe productwarranty,see the PASCOcatalog.
Copyright
This user’s guide is copyrighted with all rights reserved. Permission is granted to nonprofiteducational institutions forreproduction ofany partofthis manual,providing the reproductions are used only in theirlaboratories and classrooms,and are notsold for profit. Reproduction underany othercircumstances,withoutthe written consentof PASCOscientific,is prohibited.
Trademarks
PASCO,PASCOscientific,DataStudio,PASPORT,SPARK,SPARK Science Learning System,SPARKlab,SPARKbook,SPARKvue,Xplorer,and XplorerGLX are trademarks orregistered trademarks ofPASCOscientific,in the United States and/orin othercountries. All otherbrands,products,orservice names are ormay be trademarks orservice marks of,and are used to identify products orservices oftheirrespective owners. For more information visit www.pasco.com/legal.
Software Licenses
All required licenses forsoftware components ofSPARKvue and the SPARK Science Learning Systemcan be found on the CD-ROMorDVD-ROMincluded with the product orare included in the software download. To obtain source code forGPL/LGPL licensed software components,contactPASCOatby phone at1-800-772-8700 (in the U.S),+1 916 786 3800 (worldwide),orby email atsupport@pasco.com
Document Number: 012-11074D |
i |

SPARKvue® |
Teacher and Technical Support |
Teacher and Technical Support
Forhelp with SPARKvue and otherPASCOproducts,you can contactPASCOTeacher and Technical Supportstaffby phone,email,oron the Web.
Phone: |
1-800-772-8700 (in the U.S.) |
|
+1 916 786 3800 (worldwide) |
||
|
||
Email: |
support@pasco.com |
|
Web: |
www.pasco.com/support/ |
|
Tech Notes: |
www.pasco.com/support/technical-support/technote/ |
Document Number: 012-11074D |
ii |

|
SPARKvue® |
User's Guide |
|
Contents |
|
|
|
SPARKvue disclaimers |
|
i |
|
Teacher and Technical Support |
|
ii |
|
Contents |
|
iii |
|
1 |
Introduction |
|
1 |
|
AboutSPARKvue |
|
1 |
|
Getting started |
|
1 |
2 |
Starting an experiment |
|
2 |
|
Installing SPARKvue |
|
2 |
|
Launching SPARKvue |
|
2 |
|
Connecting an interface and sensors to yourcomputer |
|
2 |
|
SPARK Science Learning System |
|
3 |
|
Connecting a SPARK Science Learning Systemto yourcomputer |
3 |
|
|
Connecting sensors to the SPARKvue |
|
4 |
|
Connecting PASPORT sensors to the SPARK SLS |
|
4 |
|
Connecting a temperature probe to the SPARK SLS |
|
4 |
|
Connecting a voltage probe to the SPARK SLS |
|
4 |
|
XplorerGLX |
|
5 |
|
Connecting the XplorerGLX to yourcomputer |
|
5 |
|
Connecting sensors to the XplorerGLX |
|
5 |
|
Connecting PASPORT sensors to the GLX |
|
5 |
|
Connecting temperature probes to the GLX |
|
5 |
|
Connecting a voltage probe to the GLX |
|
6 |
|
Xplorerdatalogger |
|
6 |
|
PowerLink |
|
6 |
|
USB Link |
|
6 |
|
Connecting a bluetooth device |
|
6 |
|
iPad |
|
7 |
|
Android |
|
7 |
|
|
|
|
|
Document Number: 012-11074D |
|
iii |

SPARKvue® |
User's Guide |
Mac and Windows |
7 |
Connecting multiple interfaces to yourcomputer |
8 |
Monitoring live data |
8 |
Moving on fromthe Home screen |
8 |
Opening a SPARKlab |
9 |
Showing a SPARKlab |
9 |
Building a SPARKlab |
10 |
A. Fromthe Home screen create a new SPARKlab: |
10 |
B. Within a SPARKlab add a new page: |
10 |
Add additional pages: |
11 |
3 Setting up an experiment |
12 |
Customizing data collection |
12 |
Setting the sample rate |
12 |
Putting SPARKvue into periodic sampling mode |
12 |
Putting SPARKvue into manual sampling mode |
13 |
Setting an automatic stop condition |
13 |
Customizing how numbers are displayed |
14 |
Setting the numberofdecimal places displayed |
14 |
Setting the numberofsignificantfigures displayed |
14 |
Displaying numbers in scientific notation |
15 |
Changing the units ofa measurement |
15 |
Changing the units ofa measurementin an existing display |
15 |
Changing the defaultunits ofa measurement |
16 |
Calibrating sensors |
16 |
Selecting a measurementto calibrate and a calibration type |
16 |
Performing a calibration |
17 |
Performing a 2-pointcalibration |
17 |
Performing a 1-pointoffset-only calibration |
18 |
|
|
Document Number: 012-11074D |
iv |
|
SPARKvue® |
User's Guide |
|
Performing a 1-pointslope-only calibration |
18 |
|
Calibrating a Drop Countsensor(example) |
18 |
|
Using sensoradapters |
19 |
|
Connecting a sensorthrough a Digital AdapterorPhotogate Port |
19 |
|
Connecting a sensorthrough an Analog Adapter |
20 |
4 |
Data recording |
21 |
|
Recording a run ofperiodically sampled data |
21 |
|
Recording a setofmanually sampled data |
21 |
|
Deleting data runs |
22 |
5 |
Data display |
23 |
|
Displaying data in a line graph |
23 |
|
Creating a new line graph |
23 |
|
A. Fromthe Home screen create a new SPARKlab: |
23 |
|
B. Within a SPARKlab add a new page: |
23 |
|
Showing and hiding the line graph tool palette |
25 |
|
Adjusting the scale ofa line graph |
25 |
|
Scaling a graph to fitall data |
25 |
|
Scaling by directmanipulation |
26 |
|
Selecting data to show in an existing line graph |
26 |
|
Showing and hiding data runs in a graph |
26 |
|
Changing the variable on the x- ory-axis |
27 |
|
Selecting data foroperation in a line graph |
28 |
|
Selecting a data run foroperation in a line graph |
28 |
|
Selecting partofa data run foroperation in a line graph |
28 |
|
Annotating data in a line graph |
30 |
|
Adding an annotation |
30 |
|
Editing ordeleting an annotation |
31 |
|
Displaying data in a Multiple y-axis graph |
31 |
|
|
|
|
Document Number: 012-11074D |
v |
SPARKvue® |
User's Guide |
|
Creating a multiple y-axes line graph |
|
31 |
A. Fromthe Home screen create a new SPARKlab: |
|
31 |
B. Within a SPARKlab add a new page: |
|
32 |
Working with multiple y-axes |
|
34 |
Displaying data in a bargraph |
|
34 |
Creating a new bargraph |
|
34 |
A. Fromthe Home screen create a new SPARKlab: |
|
34 |
B. Within a SPARKlab add a new page: |
|
34 |
Showing and hiding the bargraph tool palette |
|
36 |
Showing data in bargraphs |
|
36 |
Adding bars and barnames in bargraphs |
|
36 |
Editing bars and barnames in bargraphs |
|
37 |
Adding data in bargraphs |
|
37 |
Entering data into bargraph manually |
|
38 |
Collecting data forbargraph using a sensor |
|
38 |
Adding additional data runs to a bargraph |
|
38 |
Adding additional data runs to a bargraph using sensorreadings |
39 |
|
Showing and hiding data runs in a bargraph |
|
39 |
Selecting data foroperation in a bargraph |
|
40 |
Annotating data in bargraphs |
|
40 |
Adding annotations to bars |
|
41 |
Editing ordeleting annotations to bars |
|
41 |
Showing numeric values on bars |
|
42 |
Viewing bargraphs |
|
42 |
Scrolling a bargraph |
|
43 |
Scaling a bargraph to show all data |
|
43 |
Scaling a bargraph by expanding orcompressing the axes |
|
43 |
Customizing axes labels and units on bargraphs |
|
44 |
|
|
|
Document Number: 012-11074D |
|
vi |
SPARKvue® |
User's Guide |
Displaying data in a table |
44 |
Creating a table |
44 |
A. Fromthe Home screen create a new SPARKlab: |
44 |
B. Within a SPARKlab add a new page: |
45 |
Showing and hiding the table tool palette |
46 |
Scrolling a table |
46 |
Selecting data to show in an existing table |
47 |
Selecting a run fordisplay in an existing column |
47 |
Changing the variable displayed in an existing column |
47 |
Adding a column |
48 |
Removing a column |
48 |
Selecting cells foroperation in a table |
49 |
Displaying data in a digits display |
50 |
Creating a new digits display |
50 |
A. Fromthe Home screen create a new SPARKlab: |
50 |
B. Within a SPARKlab add a new page: |
51 |
Showing and hiding the digits display tool palette |
52 |
Changing the variable in a digits display |
52 |
Displaying data in a meter |
52 |
Creating a new meter |
53 |
A. Fromthe Home screen create a new SPARKlab: |
53 |
B. Within a SPARKlab add a new page: |
53 |
Showing and hiding the metertool palette |
54 |
Adjusting the scale ofa meter |
54 |
Scaling a meterto fitall data |
55 |
Setting the scale ofa meter |
55 |
Changing the variable displayed in a meter |
55 |
Customizing the appearance ofa meter |
56 |
|
|
Document Number: 012-11074D |
vii |

SPARKvue® |
User's Guide |
6 Image capture |
57 |
Connecting a camera orothervideo device |
57 |
Creating a new camera image |
57 |
A. Fromthe Home screen create a new SPARKlab: |
57 |
B. Within a SPARKlab add a new page: |
58 |
Displaying a camera image |
58 |
Fromthe Home screen |
58 |
Fromwithin a SPARKlab |
59 |
Showing and hiding the image tool palette |
59 |
Capturing a camera image |
60 |
Switching between live and captured camera images |
60 |
Selecting a captured camera image fordisplay |
61 |
Adjusting the scale and position ofa camera image |
61 |
Zooming in |
61 |
Zooming out |
62 |
Scale to fit |
62 |
Panning a camera image |
62 |
Measuring in a camera image |
62 |
Placing a Measurementtool |
62 |
Moving a Measurementtool |
63 |
Deleting a Measurementtool |
64 |
Calibrating camera image measurements |
64 |
Drawing on a camera image |
65 |
Drawing |
66 |
Erasing |
66 |
Erasing all |
67 |
Annotating a camera image |
67 |
Adding an annotation |
68 |
|
|
Document Number: 012-11074D |
viii |
SPARKvue® |
User's Guide |
Moving an annotation |
69 |
Editing an annotation |
69 |
Deleting an annotation |
69 |
Naming an image |
70 |
Deleting and Renaming an image |
70 |
Exporting an image |
71 |
7 Data analysis |
72 |
Analyzing data in a graph |
72 |
Viewing statistics in a line graph |
72 |
Applying a curve fit |
74 |
Removing a curve fit |
75 |
Drawing a prediction |
75 |
Finding the x- and y-values ofa point |
75 |
Finding the x- and y-difference between two points |
77 |
Finding the slope ata pointon a data plot |
78 |
Finding the correlation coefficient(r) |
79 |
Displaying the RMSE Root-Mean-Square Error |
81 |
Analyzing data in a multiple-y axes graph |
82 |
Viewing Statistics in a bargraph |
82 |
Viewing statistics in a table |
83 |
Viewing statistics in a digits display |
85 |
Viewing statistics in a meter |
86 |
8 Calculations and manually entered data |
88 |
Working with calculations |
88 |
Opening the calculatorscreen |
88 |
Creating a calculation |
88 |
Displaying a calculation |
89 |
Entering data manually |
90 |
|
|
Document Number: 012-11074D |
ix |
|
SPARKvue® |
User's Guide |
|
Opening the measurements list |
90 |
|
View the available measurements |
90 |
|
View the available User-entered Data |
91 |
|
Creating a data setformanual entry |
91 |
|
Creating a data setformanually entered numbers |
91 |
|
Creating a data setformanually entered text |
91 |
|
Preparing a table formanual data entry |
91 |
|
Entering data into a manual data set |
92 |
|
Displaying manually entered data |
92 |
|
Editing manually entered data |
93 |
|
EnterUser-defined Data |
93 |
9 |
Building SPARKlab pages |
94 |
|
Starting a new SPARKlab page |
94 |
|
A. Fromthe Home screen create a new SPARKlab: |
94 |
|
B. Within a SPARKlab add a new page: |
94 |
|
Aboutadding elements to a SPARKlab page |
95 |
|
Removing orreplacing an image ormedia file |
95 |
|
Adding a background image |
96 |
|
Deleting a SPARKlab page |
96 |
10 |
Saving and sharing |
98 |
|
Saving a SPARKlab (Locally and Online) |
98 |
|
To save yourwork locally: |
98 |
|
To save yourwork using Online Storage Services: |
98 |
|
Printing a lab |
99 |
|
Exporting data |
99 |
|
Opening a saved lab |
100 |
|
Using Online Storage Services |
100 |
|
Log in to Online Storage Services |
100 |
|
|
|
|
Document Number: 012-11074D |
x |

|
SPARKvue® |
User's Guide |
|
Open a file fromOnline Storage Services |
101 |
|
Save a file to Online Storage Services |
101 |
11 |
Keeping a journal |
102 |
|
Taking a snapshot |
102 |
|
Opening the journal |
102 |
|
Adding a caption to a snapshotorediting an existing caption |
103 |
|
Navigating in the journal |
103 |
|
Deleting a journal entry orsnapshot |
103 |
|
Rearranging journal entries |
103 |
|
Closing the journal |
103 |
|
Saving a journal |
104 |
|
Printing a journal |
104 |
12 |
Common tasks |
105 |
|
Turning pages |
105 |
|
Returning to the Home screen |
105 |
|
Entering symbols and Greek letters |
105 |
|
Opening the AboutSPARKvue screen |
106 |
|
Setting the language |
106 |
Document Number: 012-11074D |
xi |
SPARKvue® |
1 Introduction |
About SPARKvue |
1 Introduction
n"About SPARKvue": 1
n"Getting started": 1
n"Teacher and Technical Support": ii
About SPARKvue
SPARKvue software combines multimedia curriculum,real-time data collection,and powerful scientific analysis tools in an easy-to-use,icon-based userinterface. SPARKvue is compatible with all PASCOPASPORT sensors and interfaces.
SPARKvue is designed to become the centerofyourschool's discovery-based science learning environment,providing both teacherand studentthe embedded supportfor exploring scientific concepts.
SPARKvue includes free pre-installed SPARKlabs™ — standards-based guided inquiry labs in a unique electronic notebook format. These SPARKlabs integrate background content,data collection and analysis,even assessment —all within the same environment. Everything you need is rightthere in context.
Getting started
There are three basic ways to startan investigation in SPARKvue.
nOpen an embedded SPARKlab and follow the on-screen instructions
nShow a SPARKlab with one measurementin a graph,table,digits display,and meter
nBuild a customSPARKlab with yourchoice ofdata,displays,text,and pictures
To startlearning SPARKvue,install the software,connectan interface to yourcomputer, plug in a sensor,and startthe software fromthe desktop icon. Ifyou need help doing a task,you'll find step-by-step instructions in this guide.
Document Number: 012-11074D |
1 |
2 |
Starting an experiment |
SPARKvue® |
Installing SPARKvue |
2Starting an experiment
1."Installing SPARKvue": 2
2."Launching SPARKvue": 2
3."Connecting an interface and sensors to yourcomputer": 2
4."Monitoring live data": 8
Installing SPARKvue
1.Download SPARKvue from www.pasco.com/sparkvue/ orinsertthe SPARKvue USB drive into yourcomputer.
2.Follow the instructions provided with the download orUSB drive to complete the installation.
Launching SPARKvue
Click the SPARKvue icon to launch SPARKvue.
Connecting an interface and sensors to your computer
SPARKvue software running on yourcomputerormobile device receives data fromone ormore connected orbuilt-in sensors. In SPARKvue,sensors thatare builtinto a computerordevice are called Onboard sensors,such as Onboard Microphone,Onboard LightSensor,and so forth.
SPARKvue is compatible with mostcommon onboard sensors as well as several types ofexternal interfaces thatprovide access to sensors,including AirLink 2,SPARKLink, SPARKLink Air,SPARK Science Learning System,USBLink,and XplorerGLX. To collectdata with SPARKvue,you will need a computerormobile device with atleastone onboard sensororbe connected to an external interface with sensors attached.
You can connectmultiple interfaces to one computerin orderto do an experimentthat requires more sensors than can be connected to a single interface. The interfaces can be ofthe same type ordifferenttypes.
Use the following links to find instructions forconnecting interfaces and sensors to your computerormobile device.
Document Number: 012-11074D |
2 |
SPARKvue® |
2 Starting an experiment |
Connecting an interface and sensors to your computer |
n"SPARK Science Learning System": 3
n"Xplorer GLX": 5
n"Xplorer datalogger": 6
n"PowerLink": 6
n"USB Link": 6
n"Connecting a bluetooth device": 6
n"Connecting multiple interfaces to your computer": 8
SPARK Science Learning System
The SPARK Science Learning System(SPARK)includes ports fortwo PASPORT sensors,a temperature probe,and a voltage probe. When itis notconnected to a computer,the device records data and displays iton its own screen;however,when connected to a computer,itpasses data through to be recorded and displayed on the computer. Itis powered eitherby its AC adapter,orby its rechargeable battery.
n"Connecting a SPARK Science Learning System to your computer": 3
n"Connecting sensors to the SPARKvue": 4
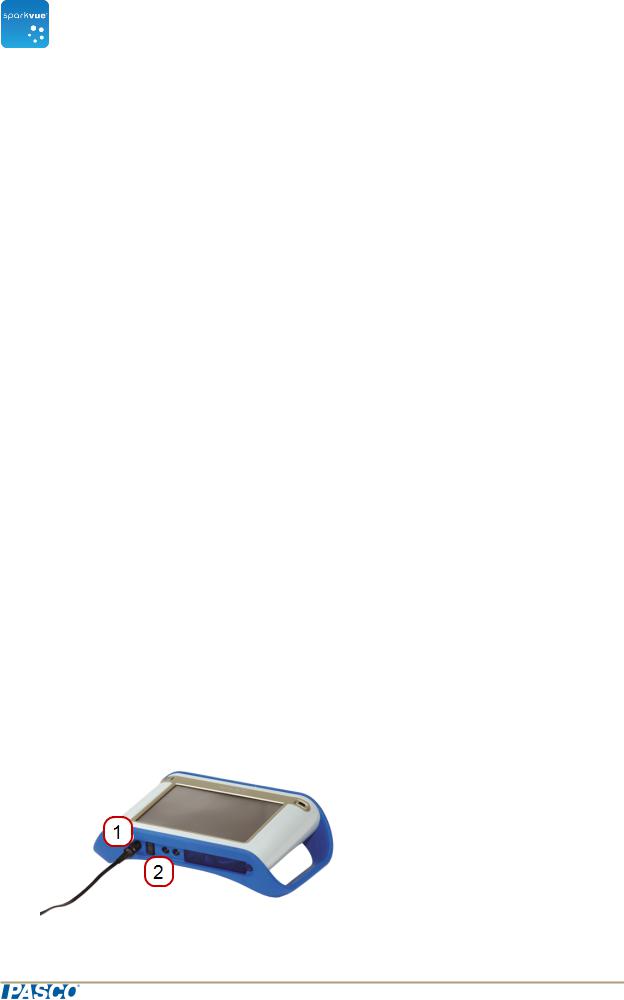
Connecting a SPARK Science Learning System to your computer
1.Use an A-to-mini-B USB cable (such as PASCOpartPS-2528)to connectthe smallerUSB portofthe SPARK to a USB porton yourcomputer(ora USB hub connected to the computer).
2.Connectthe AC adapter(included with the SPARK)to a wall outletand to the AC adapterporton the bottomofthe SPARK.
You can skip this step ifthe SPARK battery is charged and you wish to letitrun on battery power.
3.Press and hold the powerbutton. The SPARK turns on and boots up.  AC adapterport.
  Powerbutton.
Document Number: 012-11074D |
3 |
SPARKvue® |
2 Starting an experiment |
Connecting an interface and sensors to your computer |
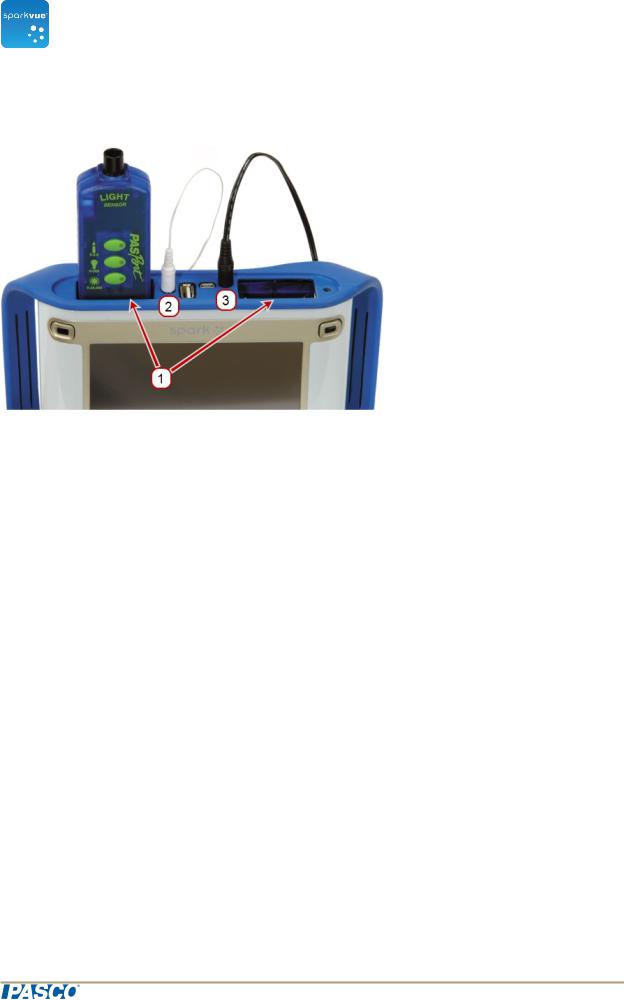
Connecting sensors to the SPARKvue
 PASPORT ports.
  Temperature port.
  Voltage port.
You can use up to two PASPORT sensors plus a temperature probe and a voltage probe.
Complete one ormore ofthe following tasks to connectsensors to the SPARK.
n"Connecting PASPORT sensors to the SPARK SLS": 4
n"Connecting a temperature probe to the SPARK SLS": 4
n"Connecting a voltage probe to the SPARK SLS": 4
Connecting PASPORT sensors to the SPARK SLS
1.Plug a PASPORT sensorinto one ofthe PASPORT ports on the top ofthe SPARK SLS.
2.Optionally,plug a second PASPORT sensorinto the otherPASPORT port.
Connecting a temperature probe to the SPARK SLS
Plug the included fast-response temperature probe (orothertype oftemperature probe) into the temperature porton the top ofthe SPARK SLS.
Connecting a voltage probe to the SPARK SLS
Plug the included voltage probe into the voltage porton the top ofthe SPARK SLS.
Document Number: 012-11074D |
4 |

SPARKvue® |
2 Starting an experiment |
Connecting an interface and sensors to your computer |
Xplorer GLX
The XplorerGLX includes ports forfourPASPORT sensors,two temperature probes, and a voltage probe. When itis notconnected to a computer,the device records data and displays iton its own screen;however,when connected to a computer,itpasses data through to be recorded and displayed on the computer. Itis powered eitherby its AC adapter,orby its rechargeable battery.
n"Connecting the Xplorer GLX to your computer": 5
n"Connecting sensors to the Xplorer GLX": 5
Connecting the Xplorer GLX to your computer
1.Use USB cable (included with the GLX)to connectthe smallerUSB portofthe GLX to a USB porton yourcomputer(ora USB hub connected to the computer).
2.Connectthe included AC adapterto a wall outletand to the AC adapterporton the rightside ofthe GLX.
You can skip this step ifthe GLX’s battery is charged and you wish to letitrun on battery power.
3.Press and hold the powerbutton.
4.The GLX turns on and boots up. IfSPARKvue is running,the GLX screen displays a message indicating thatitis connected.
Connecting sensors to the Xplorer GLX
You can use up to fourPASPORT sensors plus two temperature probes and a voltage probe.
Complete one ormore ofthe following tasks to connectsensors to the GLX.
n"Connecting PASPORT sensors to the GLX": 5
n"Connecting temperature probes to the GLX": 5
n"Connecting a voltage probe to the GLX": 6
Connecting PASPORT sensors to the GLX
1.Plug a PASPORT sensorinto one ofthe PASPORT ports on the top ofthe GLX.
2.Optionally,plug additional PASPORT sensors into the otherPASPORT ports.
Connecting temperature probes to the GLX
1.Plug one ofthe included fast-response temperature probes (oranothertype oftemperature probe)into one ofthe temperature ports on the leftside ofthe GLX.
2.Optionally,plug a second temperature probe into the othertemperature port.
Document Number: 012-11074D |
5 |

SPARKvue® |
2 Starting an experiment |
Connecting an interface and sensors to your computer |
Connecting a voltage probe to the GLX
Plug the included voltage probe into the voltage porton the leftside ofthe GLX.
Xplorer datalogger
The Xplorerdataloggercontains a single portfora PASPORT sensor. When itis notconnected to a computer,the device records data and displays iton its own screen;however,when connected to a computer,itpasses data through to be recorded and displayed on the computer. When connected to a computer,itis powered by the USB port,and itdoes notrequire batteries.
1.Use the included USB cable to connectthe Xplorerto a USB porton yourcomputer(ora powered USB hub connected to the computer).
2.Connecta PASPORT sensorto the Xplorer.
PowerLink
The PowerLink contains ports forup to three PASPORT sensors. Italso includes two USB ports thatotherinterfaces can be connected to. Itis powered by its AC adapter,or by replaceable batteries.
1.Connectthe AC adapter(included with the PowerLink)to a wall outletand to the AC adapterporton the back ofthe PowerLink,orinstall two “C”batteries in the PowerLink.
2.Use the included USB cable to connectthe PowerLink to a USB porton yourcomputer(ora USB hub connected to the computer).
3.Connectup to three PASPORT sensors to the PowerLink.
USB Link
The USB Link contains a single portfora PASPORT sensor.
1.Connectthe USB Link to a USB porton yourcomputer(ora powered USB hub connected to the computer).
2.Connecta PASPORT sensorto the USB Link.
Connecting a bluetooth device
The bluetooth device can connectto only one hostata time and mustremain within approximately 10 meters. (An errormessage displays ifthe device is already connected to anothersystem.)
Document Number: 012-11074D |
6 |
SPARKvue® |
2 Starting an experiment |
Connecting an interface and sensors to your computer |
The AirLink2 and SPARKlink Aircan also connectvia USB.
Note:Ifprompted,enterpass code "1234" forSPARKlink Airdevices.
iPad
1.Use the standard iPad process to pairthe PASCObluetooth device.
2.Connectsensors as needed.
Android
1.Use the standard Android process to pairthe PASCObluetooth device.
2.Continue to step 1 ofthe Mac and Windows process.
Mac and Windows
To connect a device (no pairing necessary)
1.Turn on the AirLink2,SPARKlink Airorothersupported bluetooth device.
2.Click the Device Tools button to open the Device Tools screen.
3.Click the Connect Sensor
 via
via Bluetooth button.
SPARKvue searches foravailable bluetooth sensors and lists the supported devices within range.
Note:In a classroomsetting,there may be many devices available forconnection. To ensure you are connecting with the correctPASCOdevice,check the back for its identification number.
Note:Ifthe device is notlisted,pairthe device using the standard Mac orWindows process before continuing.
4.Click Connect.
The selected device will change from Connect to Disconnectupon successful connection.
5.Click OK twice to close the Device Tools screen.
6.Optional:plug in sensors into the bluetooth interface.
To disconnect a device
Document Number: 012-11074D |
7 |
2 |
Starting an experiment |
SPARKvue® |
Monitoring live data |
1.Click the Device Tools button to open the Device Tools screen.
2.Click the Connect Sensor
 via
via Bluetooth button.
3.Click Disconnect.
The selected device will change from Disconnect to Connect upon successful connection.
4.Click OK twice to close the Device Tools screen.
Connecting multiple interfaces to your computer
nIfthe computerhas enough available USB ports,connecteach interface to a USB on the computer.
nIfthe computerhas only one available USB port,connecta powered USB hub to the computer,and connectthe interfaces to the hub.
nIfatleastone ofthe interfaces is a PowerLink,you can connectthe PowerLink to the computerand connecttwo additional interfaces to the USB ports on the back ofthe PowerLink.
Monitoring live data
Live data fromall connected sensors are displayed wheneverthe Home screen is open.
The Home screen is the firstscreen thatappears when SPARKvue starts.
Ifthe Home screen is notvisible,click the Home button to return to the Home screen.
Moving on from the Home screen
With the Home screen displayed,you are ready to move into a SPARKlab. A SPARKlab is a multiple page environmentwhere yourscience investigation takes place.
Complete one ofthe following tasks to open an embedded SPARKlab,show a measurementin a SPARKlab,orbuild a customSPARKlab.
n"Opening a SPARKlab": 9
n"Showing a SPARKlab": 9
n"Building a SPARKlab": 10
Document Number: 012-11074D |
8 |
SPARKvue® |
2 Starting an experiment |
Moving on from the Home screen |
Opening a SPARKlab
SPARKvue includes embedded SPARKlabs. Additional no-costlabs are available from PASCO. Complete these steps to open a SPARKlab:
1.Connectthe sensors required forthe SPARKlab thatyou wish to do.
2.Ifthere are unneeded sensors connected,disconnectthem.
3.In the SPARKlabs pane,navigate to the foldercontaining the SPARKlab thatyou would like to open.
4.Click a SPARKlab to preview.
The lab preview opens in the rightpane.
5.Click the preview to open the lab. The SPARKlab opens.
Follow the on-screen instructions to continue yourscience investigation.
6.Click the Page Navigator to turn pages.
Showing a SPARKlab
A show-path SPARKlab is the fastestway to record data and display itin a graph,table, digits display,and meter.
Complete these steps to show a SPARKlab:
1.Connecta sensor.
2.In the Home screen,click the measurementthatyou would like to show. The selected measurementis highlighted.
3.Click Show.
Note:A measurementmustbe selected for Show to be available. A four-page SPARKlab opens.
4.Click the Start button to record data.
Click the Page Navigator to see yourdata in the differentdisplays.
Document Number: 012-11074D |
9 |
SPARKvue® |
2 Starting an experiment |
Moving on from the Home screen |
Building a SPARKlab
When you build a customSPARKlab,you design each page with yourchoice ofmeasurements and displays. You can also add textand pictures.
Connecta sensor(orsensors)and complete these steps to startbuilding a SPARKlab.
A. From the Home screen create a new SPARKlab:
Touch Build.
Continue to step 1.
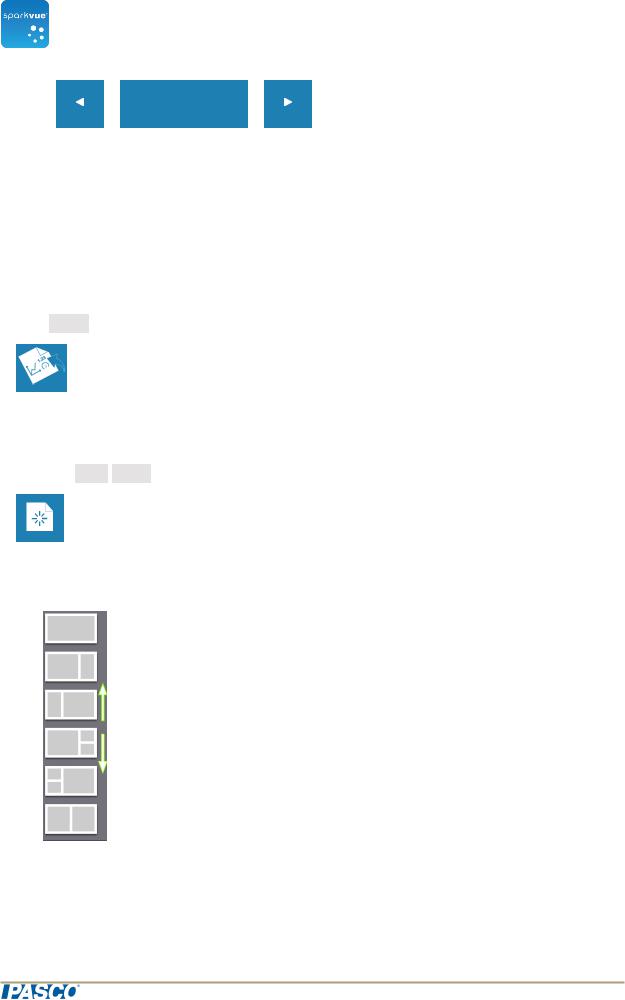
B. Within a SPARKlab add a new page:
Touch the New Page button.
Continue to step 1.
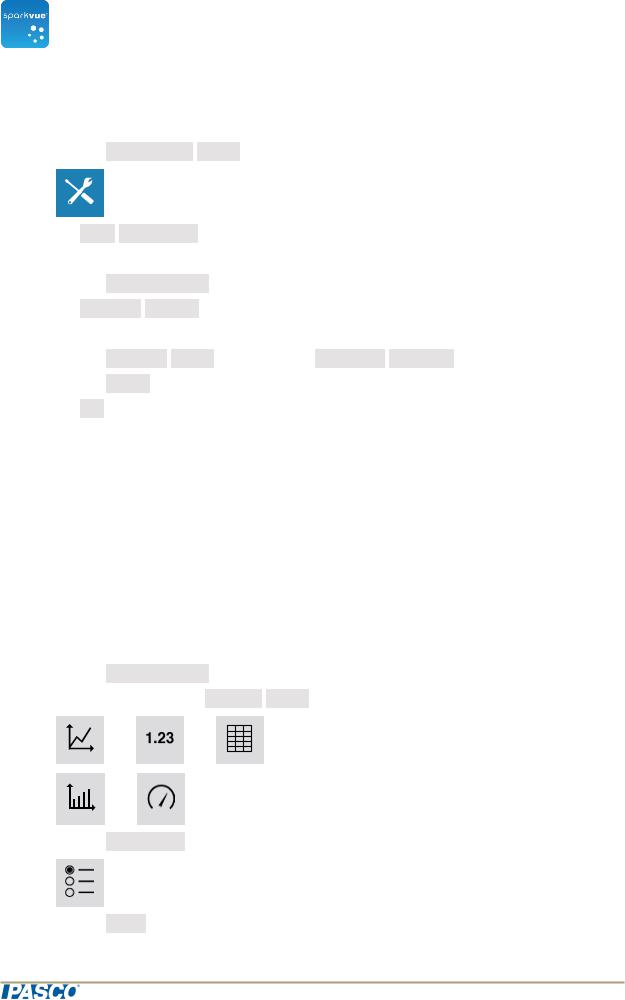
1. Selecta template fromthe library.
Scroll up and down to view templates
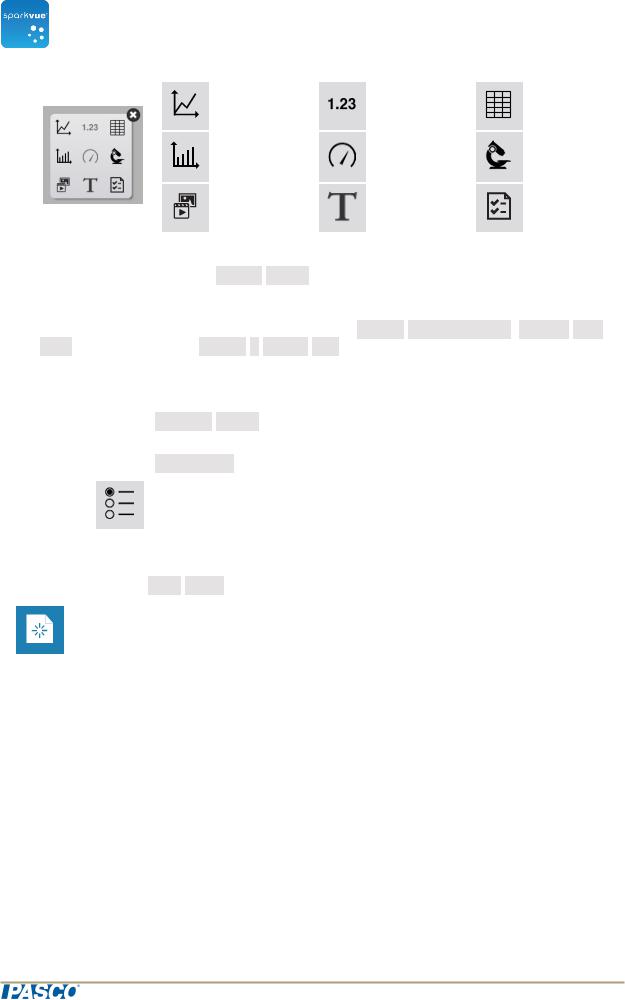
2. Touch a display type foreach placeholder.
Document Number: 012-11074D |
10 |
SPARKvue® |
2 |
Starting an experiment |
|
Moving on from the Home screen |
|||
Line |
Digits |
Table |
|
Graph |
|||
|
|
||
BarGraph |
Meter |
Camera |
|
Media |
Text |
Assess- |
|
ment |
|||
|
|
||
3.ForTextBoxes:Type in textinto the TextBox.
4.ForCameras:Touch the Image Tools button. See Capturing a camera image.
5.Forotherdata displays:Selectthe data foreach display on the page.
a.Touch the display data label(s),forexample: Select Measurement, X-Axis
 Vari- able,Y-Axis Variable, Select
 a
a Media
Media File,Add an Assessment
or
b.Open the display properties and selectthe data.
i.Touch the Display Tools button nearthe lowerorupperleftcornerofthe display.
ii.Touch the Properties button.
Add additional pages:
Repeatedly click the New Page button to add pages to yourSPARKlab.
Document Number: 012-11074D |
11 |
SPARKvue® |
3 Setting up an experiment |
Customizing data collection |
3 Setting up an experiment
n"Customizing data collection": 12
n"Customizing how numbers are displayed": 14
n"Calibrating sensors": 16
n"Using sensor adapters": 19
Customizing data collection
You can startrecording data using the defaultsettings,orcomplete one ormore ofthe following tasks to change the sampling rate orsampling mode.
n"Setting the sample rate": 12
n"Putting SPARKvue into periodic sampling mode": 12
n"Putting SPARKvue into manual sampling mode": 13
n"Setting an automatic stop condition": 13
Setting the sample rate
With SPARKvue in periodic sampling mode (the defaultmode),complete these steps to sethow many data points are recorded each second orhow much time elapses between data points:
1.Click the Sampling Options button.
2.The Sampling Options screen opens.
3.Click the Sample Rate box and click a value.
4.Click the Sample Rate
Rate Unit box and click Hz, seconds, minutes,or hours.
5.Click OK.
Putting SPARKvue into periodic sampling mode
In periodic sampling mode (the defaultmode,sometimes known as “continuous”mode), SPARKvue records data points atregularintervals. IfSPARKvue is in manual sampling mode,complete these steps to putitinto periodic sampling mode:
Document Number: 012-11074D |
12 |

SPARKvue® |
3 Setting up an experiment |
Customizing data collection |
1.Click the Sampling Options button.
The Sampling Options screen opens.
2.Click Periodic.
3.Click OK.
Putting SPARKvue into manual sampling mode
In manual sampling mode,a single value fromeach measurementis recorded each time you manually triggerSPARKvue. Complete these steps to putSPARKvue into manual sampling mode:
1.Click the Sampling Options button.
The Sampling Options screen opens.
2.Click Manual.
3.Click OK.
Setting an automatic stop condition
When a stop condition is set,SPARKvue automatically stops recording data aftera set time interval.
Complete these steps to seta stop condition:
1.Click the Sampling Options button.
The Sampling Options screen opens.
2.Under Automatic Stop
Stop Condition:,click the Condition: box and click Stop
 after
after duration.
3.Click the Value box and entera time value.
4.Click the Units box and click units oftime.
5.Click OK.
Document Number: 012-11074D |
13 |

SPARKvue® |
3 Setting up an experiment |
Customizing how numbers are displayed |
Customizing how numbers are displayed
n"Setting the number of decimal places displayed": 14
n"Setting the number of significant figures displayed": 14
n"Displaying numbers in scientific notation": 15
n"Changing the units of a measurement": 15
Setting the number of decimal places displayed
1.Click the Experiment Tools button.
The ExperimentTools screen opens.
2.Click Data Properties.
The Data Properties screen opens.
3.Click the Measurement box and click a measurementorothervariable.
4.Click the Number Style box and click Fixed
 Precision.
5.Click the Digits box and selectthe numberofdigits to be displayed afterthe decimal point.
6.Click OK.
Setting the number of significant figures displayed
1.Click the Experiment Tools button.
The ExperimentTools screen opens.
2.Click Data Properties.
The Data Properties screen opens.
3.Click the Measurement box and click a measurementorothervariable.
4.Click the Number Style box and click Significant
 Figures.
5.Click the Digits box and selectthe numberofsignificantfigures to be displayed.
6.Click OK.
Document Number: 012-11074D |
14 |
SPARKvue® |
3 Setting up an experiment |
Customizing how numbers are displayed |
Displaying numbers in scientific notation
1.Click the Experiment Tools button.
2.Click Data Properties.
The Data Properties screen opens.
3.Click the Measurement box and click a measurementorothervariable.
4.Click Number Format.
The numberformatoptions appear.
5.Click the Number Style: box and click Scientific
 Notation.
6.Click the Digits box and selectthe numberofdigits to be displayed.
7.Click OK.
Changing the units of a measurement
Do one orboth ofthe following tasks to selectdifferentunits fora measurement.
n"Changing the units of a measurement in an existing display": 15
n"Changing the default units of a measurement": 16
Changing the units of a measurement in an existing display
Complete these steps to change the units ofa measurementdisplayed in an existing graph,digits display,table,ormeter:
1.Click the Measurement button to change;skip to step 4.
2.Or,click the applicable Display Tools button to open the tools palette.
3.Click the Properties button to open the Properties screen.
4.Click the Units box and selecta unitofmeasure.
Document Number: 012-11074D |
15 |
SPARKvue® |
3 Setting up an experiment |
Calibrating sensors |
5.Click OK.
The display shows the measurementwith the selected units.
Changing the default units of a measurement
Complete these steps to change the units thatwill be used by defaultwhen you selecta measurementin the future:
1.Click the Experiment Tools button to open the ExperimentTools screen.
Note: The Experiment Tools button is visible in data collection mode.
2.Click Data Properties to open the Data Properties screen.
3.Click the Measurement box and selecta measurement.
4.Click the Units box and selectunits ofmeasure.
5.Click OK.
The nexttime you selectthatmeasurementfordisplay,itwill appearwith the units thatyou selected.
Calibrating sensors
Sensorcalibration is an optional step thatcan help to make measurements more accurate.
Complete the following tasks to selecta measurementand calibration type and perform
acalibration.
1."Selecting a measurementto calibrate and a calibration type": 16
2."Performing a calibration": 17
Selecting a measurement to calibrate and a calibration type
1.Click the Experiment Tools button.
The ExperimentTools screen opens.
2.Click Calibrate Sensor.
The Calibrate Sensor: Select Measurement screen opens.
3.Click the Sensor box and click the sensorto be calibrated.
Document Number: 012-11074D |
16 |

SPARKvue® |
3 Setting up an experiment |
Calibrating sensors |
4.Click the Measurement box and click the measurementto be calibrated.
5.Click the Calibration Type box and click a calibration type.
See the instructions provided with yoursensorforinformation aboutwhattype of calibration is appropriate foryoursensor.
6.Click Next.
The Calibrate Sensor Enter Values screen opens.
7.Continue to "Performing a calibration": 17.
Performing a calibration
Afteryou have selected a measurementto be calibrated and a calibration type (see previous task),you are ready to performa calibration.
Depending on the calibration type thatyou have selected,performa 2-pointcalibration, a 1-pointoffset-only calibration,ora 1-pointslope-only calibration.
n"Performing a 2-point calibration": 17
n"Performing a 1-point offset-only calibration": 18
n"Performing a 1-point slope-only calibration": 18
n"Calibrating a Drop Count sensor (example)": 18
Performing a 2-point calibration
In the Calibrate Sensor Enter Values screen,complete these steps:
1.Apply a known quantity to the sensor. Forexample,place a pH probe in a pH 4 buffersolution.
2.Under Calibration Point
Point 1Click the Standard
 Value box and enterthe known value.
Forexample,enterthe known pH ofthe buffersolution.
3.Under Calibration Point
Point 1Click Read
 From
From Sensor.
The value measured by the sensoris transferred to the Sensor Value box.
4.Apply a differentknown quantity to the sensor. Forexample,place the pH probe in a pH 7 buffersolution.
5.Under Calibration Point
Point 2Click the Standard
 Value box and enterthe known value. Forexample,enterthe known pH ofthe buffersolution.
6.Under Calibration Point
Point 2Click Read
 From
From Sensor. The value measured by the sensoris transferred to the Sensor
 Value box.
7.Click OK.
Calibration is complete.
Document Number: 012-11074D |
17 |

SPARKvue® |
3 Setting up an experiment |
Calibrating sensors |
Performing a 1-point offset-only calibration
In the Calibrate Sensor Enter Values screen,complete these steps:
1.Apply a known quantity to the sensor. Forexample,place a temperature probe in ice waterknown to be 0 °C.
2.Under Calibration Point
Point 1 Click the Standard
 Value box and enterthe known value.
Forexample,enterthe known temperature ofthe water.
3.Under Calibration Point
Point 1 Click Read
 From
From Sensor.
The value measured by the sensoris transferred to the Sensor Value box.
4.Click OK.
Calibration is complete.
Performing a 1-point slope-only calibration
In the Calibrate Sensor Enter Values screen,complete these steps:
1.Apply a known quantity to the sensor. Forexample,place a dissolved oxygen probe in a bottle known to contain 9.1 mg/L ofdissolved oxygen.
2.Under Calibration Point
Point 2 Click the Standard
 Value box and enterthe known value.
Forexample,enterthe known dissolved oxygen concentration.
3.Under Calibration Point
Point 2 Click Read
 From
From Sensor.
The value measured by the sensoris transferred to the Sensor Value box.
4.Click OK.
Calibration is complete.
Calibrating a Drop Count sensor (example)
Tip: The Drop Dispenserhas two stopcocks. The top stop cock is used to regulate flow rate and the bottomstopcock is used to turn the flow on and off. The bottomstopcock should eitherbe in the completely open orcompletely closed position.
The drop counteris calibrated,using the SPARKvue ExperimentTools to correlate the numberofdrops counted to the volume ofliquid dispensed fromthe Drop Dispenser.
1.Attach the Drop Dispenser(syringe,two stopcocks and drop tip)to a supportrod.
2.Fill the syringe with titrant.
3.Open both stopcock valves and adjustthe valve on the top stopcock so thatthe drops fall ata rate ofabout1 drop persecond. Close the bottomvalve afterthe rate is achieved.
4.Connectthe Drop Counterand launch SPARKvue.
Document Number: 012-11074D |
18 |
Loading...