

Page 1

Operating Manual
and
User’s Guide
S1024DW Miniature Fiber Optic
Spectrometers and Accessories
Ocean Optics, Inc.
380 Main Street
Dunedin, FL 34698
(727) 733-2447
(727) 733-3962 fax
For the latest information, consult our web site:
www.OceanOptics.com
Or, e-mail our Technical Service Department:
TechSupport@OceanOptics.com
070699
Page 2

Copyright © 1999 Ocean Optics, Inc.
All rights re served. No part of this p ublication may be reproduced, stored in a retrieval
system, or transmitted, by any means, electronic, mechanical, photocopying, recording, or
other w ise, without wr it t en permission from Ocean Optic s , I n c.
This manual is sold as part of a spectrometer order and subject to the condition that it shall
not, by way of trade or otherwis e, be lent, re-sold, hired out or otherwise circulated without
the prior consent of Ocean Optics, Inc. in any form of bi nding or cover othe r than that in
which it is pu blished.
Every effort has been made to make this man ual as complete and as accurate as possible, but
no warranty or fitness is implied. The information p rovided is on an “a s is” basis. Ocean
Optics, Inc. shall ha v e neit her lia b ilit y n or res pon si bil it y to any per son or entit y with re spe ct
to any loss or damages arising from the information c o ntained in this manual.
Page 3

Table of Contents
Introduction
Software and Serial Port Interface Installation
Light Sources
D-1000 Deuterium Light Source............................................................................................ 8
DT-1000 Deuterium Tungsten Halogen Light Source ...........................................................10
LS-1 Tungsten Halogen Light Source ..................................................................................13
PX-2 Pulsed Xenon Lamp...................................................................................................15
HG-1 Mercury Argon Calibration Source..............................................................................17
LS-1-CAL Calibrated Light Source.......................................................................................20
Sampling Chambers
CUV-VIS, CUV-UV Cuvette Holders....................................................................................23
CUV-VIS-10, CUV-UV-10 Cuvette Holders..........................................................................25
CUV-ALL 4-way Cuvette Holder ..........................................................................................26
CUV-FL-DA Direct Attach Cuvette Holder ............................................................................28
ISS Integrated Sampling System.........................................................................................30
FHS In-lin e Fi l te r Ho lde r s....................................................................................................32
LPC Long Pass Flow Cells ..................................................................................................34
Sampling Optics
74-UV and 74-VIS Collimating Lenses.................................................................................36
74-UV-90 Right Angle Reflector...........................................................................................37
74-OPM Optical P ost M ount ................................................................................................38
74-ACH Adjustabl e Collimating Lens Holder........................................................................39
FVA-UV Fiber Optic Variable Attenuator..............................................................................40
WS-1 Diffuse Refl ec tance Standard.....................................................................................41
ISP-REF Integrating Sphere ................................................................................................42
....................................................................................................................... 1
...................................................... 3
.................................................................................................................... 7
......................................................................................................22
..............................................................................................................36
Fiber Optic Probes and Accessories
R200 Reflection P robes.......................................................................................................44
RPH-1 Reflection Probe Holder...........................................................................................46
T200 Transmission Pr obes..................................................................................................47
CC-3 Cosine-Correct ed Irradiance Probes...........................................................................48
Optical Fiber Assemblies
Experiment Tutorial
Absorbance Experiments.....................................................................................................52
Transmission Experiments...................................................................................................53
Reflection Experiments........................................................................................................54
Relative Irradiance Experiments..........................................................................................55
Time Acquisition Experiments..............................................................................................56
.............................................................................................49
.......................................................................................................51
Appendix A: Adjusting the Focus of a Collimating Lens
Appendix B: S1024DW Pin-outs and Jumpers
Appendix C: External Triggering
.......................................................................44
..................................58
.....................................................59
...............................................................................61
Page 4

Introduction
Ocean Optics miniature fiber op tic spectrometer s and accessori es h ave revolut ionized the analytical
instrumentation market by dramatically reducing the size and cost of optical sensing systems. More than
10,0 0 0 Ocean Optics spectromet ers have been sold worl d wide -- stri king evidence of t he far-reaching
impact of low-cost, minia ture componen ts for fiber op tic spectroscopy. Di verse field s s u ch as research and
development, industrial process contr ol, medical diagnostics and environmental monitoring have benefited
from access to Ocean Optics technology.
The Modular Approach
A typical Ocean Op tics small- fo ot p rint system compr ises of five basi c elements: a Miniat ure Fiber Op tic
Spectrometer , an A/D converter , our operatin g software, a light or ex citation source, and sa mp ling optics .
The light or excitation source supplies light through the illumination or excitation fiber to the sample and
then li ght interacts with the sample. The light is then collected and transmitted through the r ead fiber to th e
spectrometer . Th e s p ectromet er measures the amount of li gh t and the A/D converter transform s the analog
data collected by the spectrometer into digital information that is passed to the software, providing the user
with application-specific information.
This modular approach -- components are easily mixed and matched -- offers remarkable applications
flexibility. Users pick and choose from hundreds of products to create distinctive systems for an almost
endless variety of optical-sensing applications.
S1024DW Miniature Fiber Optic Spectrometer
The S1024DW Deep Well Detector Spectrometer is a 1024-element photodiode array detector for those
applications requiring extremely high signal-to-noise (2000:1) measurements. With the S1024DW, the user
can ach ieve micro-absorbance unit r esol ution. In fa ct, the user can relia bl y see an absorbance change of less
than 0.00001 absorbance units. Furthermore, the S1024DW can be multiplexed with up to 8 spectrometer
channels and is ideal for high light level applications such as dissolution testing.
The S1024DW accepts light energy tran sm itted thr ough singl e- s tr and optical fiber and disper ses it via a
fixed grating across the photodiode array, which is responsive from 200-1100 nm. An SMA 905 connector
allows for easy coupling to an extensive line of fiber optic light sources, probes, chemical sensors, and
other spectrophotometric accessor ies.
SAD500 Serial Port Interface
The S1024DW interfaces to our SAD500 Serial Port Interface, a 12-bit, 8-channel, microprocessor-controlled
A/D con verter with a 500 kHz sampl ing frequency. The SA D5 00 can be used to interface to desktop or
portable PCs, as well as to PLCs and other devices that support the RS-232 communication protocol. The
SAD500 A/D converter allows the S1024DW spectrometer to acquire spectra using integration times as rapid
as 31 millisecond s . For incr ea s ed s p eed , the SAD500 can be software configured to transmit only a por tion of
the spectra or the averages of multiple spectral acquisitions, or a combination of both.
OOIBase32 Spectrometer Operating Software
OOIBase3 2 Spectrom eter Opera ting Software is our n ext g en eration of oper ating softwa re for all Ocean
Optics spectrometers. OOIBase32 is a 32-bit, user-customizable, advanced acquisition and display program
that provides a r eal-time interface t o a variety of signal-processin g functions for Windows 95/98 and
Windows NT users. With OOIBase32, you have the ability to perform spectroscopic measurements such as
absorba nce, refl ectance an d emission ; control all system parameters; collect data from up t o 8 spectrometer
channels simultaneously and display the results in a single spectral window; and perform reference
monito r ing and time acq uisition experiments .
1
Page 5

OOIBase3 2 is the lates t edition of operating software for all Ocean Optics sp ectrometers. This change from
16-bit to 32-bit operating software reflects Ocean Optics’ decision to upgrade its software to accommodate
the increase of 32-bit oper at ing systems. OOIBase32 still includ es th e function s of the original OOIBase,
but numerous editing, viewing, and spectral process ing functions ha ve been added.
For detailed instructions on all of the features, menu items, and options in OOIBase32, please refer to
OOIBase32 Spectrometer Operating Software Manual
the
the OOIBase32 online help files.
included with y our spectrometer ord er or
In This Manual
This manual provides u sers with direct ions on configuring your SAD500 wit h your c omputer and operating
the S1024DW Miniature Fiber Optic Spectrometer. In addition, this manual covers instructions for using
some of our most popular spectroscopic components including light sources, sampling chambers, sampling
optics, fiber optic probes, and optical fiber ass embli e s . The
directions on taking absorbance, transmission, relative irradiance, and reflection measurements. Additional
information i s included in A p pendices, s u ch as the pin- outs and jump er s of the spectrometer, instruct ions
on adjusting the focus of a collimating lens, and directions on external triggering.
Experiment Tutorial
section provides specific
Packing List
A packing list comes with your order. It is located inside a plastic bag attached to the outside of the shipment
box. The invoice is mailed separately. The items listed on your packing slip include all of the components in
your order. However, some items on your packing list are actually items you have specified to be installed
into your spectrom eter, such as th e gr ating, d et ector coll ection lens , an d s lit. The pack ing list also includes
information s uch as the shippin g addre s s , bil l i ng address, and c ompon ents on back order. What you won’t
find on the packing list is OOIBa s e3 2 , the free operating softwa re that com es with ever y spect rometer order.
Wavelength Calibration Data Sheet
In your shipment box you will find your spectrometer in a silver-gray anti-static bag. Also inside this bag is
a cali br ation sheet wrapped around the oper ating soft ware diskettes. A calibrati on sheet comes wit h every
spectrometer channel, contains im p or tant infor mation sp ecific to your spectrom eter, and sh ou ld be retained.
Return Merchandise Authorization
Custom ers somet im es fi n d that they need Ocean Optics to make a change or an upgra de to their s ystem. In
order for Ocean Op tics to make th ese changes, the custom er must first contact u s and obtain a Return
Merchandise Authorization (RMA) number. Please contact an Applications Scientist for specific
instruc tions when re turning a pro d uct.
2
Page 6

Software and Serial Port Interface Installation
Step 1: Interface the SAD500 to your PC
The SAD5 00 Serial Por t Interface is a microprocessor-controlled A/D converter for s er ial port connection
or stand-alone operation. The SAD500 can be used to interface to desktop or portable PCs, PLCs, and other
devices that support the RS-232 communication protocol. Interfacing the SAD500 to a desktop or portable
PC is simple.
1. If you ordered your SAD500 mounted onto your S1024DW spectrometer, simply connect the 6-pin
DIN end of the ser i al cable to the SAD 500 and the DB9 end to your PC. S ome PCs ma y require a 9 -pin
to 25-pin c onver ter (not in cluded ). If you ordered your SAD 500 in its own housing, attach the 25- pin
conductor ribbon cable from the S1024DW-series spectrometer to the SAD500. Then connect the 6-pin
DIN end of the ser i al cable to the SAD 500 and the DB9 end to your PC.
2. For either configuration, note the serial port number (also called COM Port) on the PC to which you
are interfacing. (Older PCs may not have numbered ports.)
3. Plug th e +12VDC wall tr ansformer into an outl et and connect it to the SAD50 0.
Step 2: I ns ta ll OOIBase3 2
1. Before installing OOIBase32, make sure that no other applications are running.
2. In s ert “Di sk 1” into your floppy dri ve . (Whe n prompted, inst a l l Disks 2, 3, and 4.) Execute Set up.exe .
3. At th e “Welcome” dia log box, click Next>.
4. At th e “Dest ination Loca tion” dialog box, choose Browse, pick a destination directory and cli ck Nex t>.
5. At the “Backup Replaced Files” dialog box, select either Yes or No. We recommend choosing Yes. If
you select Y es , choose Browse to pick a d es tination directory and cli ck Next>.
6. At the “Installation Complete” dialog box, choose Finish>.
7. When the installation is complete, you will be prompted to restart your computer.
necessary for you to restart your computer before you run OOIBase32 for the first time.
It is absolutely
Step 3: Run OOIBase32
After you restart your computer, navigate to the OOIBase32 icon and select it. The first time you run
OOIBase32 after installation, you mu s t foll ow several prompts before you can beg i n taki ng mea s ureme nts.
Operator and Serial Number Dialog Box
Fir st, a prompt to enter a user name and serial n um ber appear s. Certain data files will in clude this
info rma tion in the head er. (If, at a later date, you wish to ch ang e the opera tor name and serial number,
Edit | Settings
select
of your OOIBase32 software on the Disk 1 label. Click
from the menu and then choose the
Default Spectrometer Configuration File
Next, the following message appea rs:
This appears to be the first time OOIBase32 has been executed. Please select a
spectrometer configur ation file from t he following screen. This s pectrom et er conf igur ation
file will be us ed each time OOIBase32 is started.
A file open dialog box then appears. You must choose the default spectrometer configuration file. Navigate
to the OO I Ba s e3 2 direct ory, and choose the file with
preced ed b y the serial nu mber of your spectromet er. (A default spectrom eter config uration fi le will be
named something similar to
I2J613.spec
.)
Registration
OK
.
.spec
as the extension. The
tab.) You can find the serial number
.spec
extension is
3
Page 7
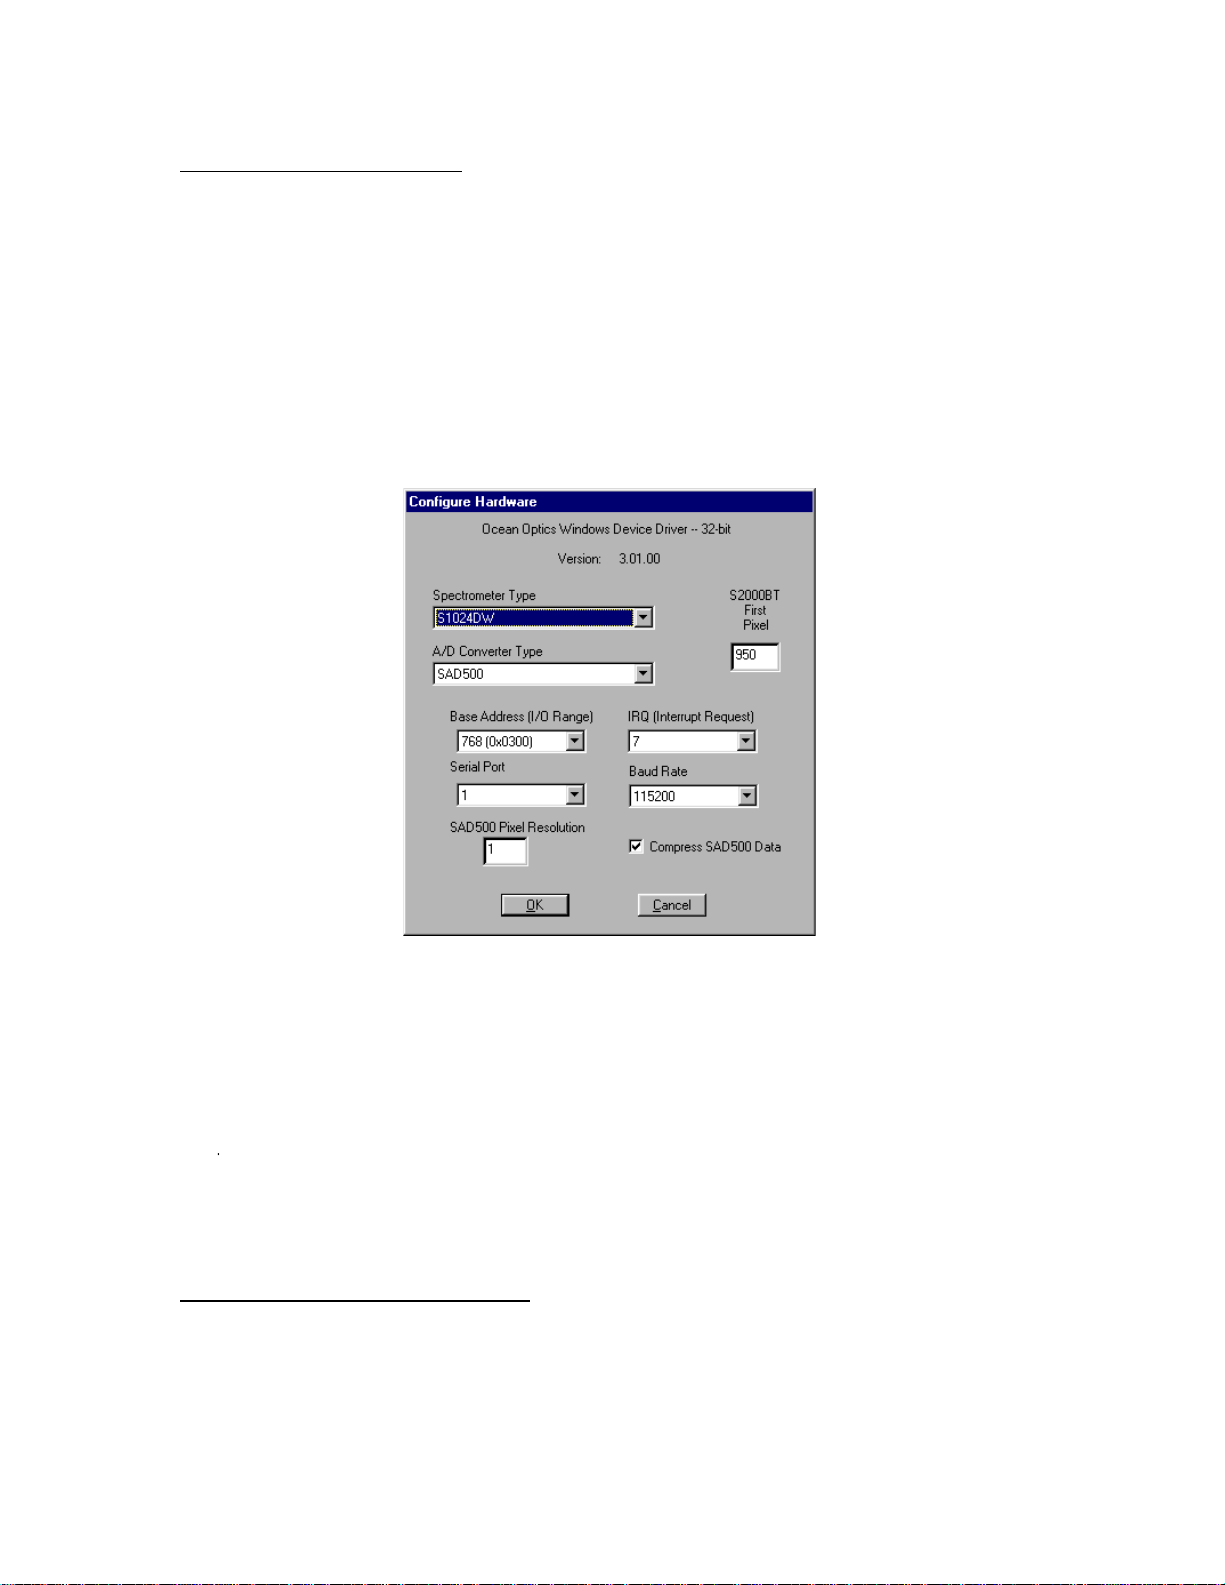
Configure Hardware Dialog Box
Next, the
once -- when OOIBase32 is first installed and the software first runs. You must specify your hardware
conf ig u ration in this di alog box.
1. Under
2. Under
3. Under
4. Under
5. Under
Conf ig ure Hardwa re
Spectrometer T y p e
A/D Converter Type
Serial P o rt
, choose the COM port number your computer is using to interface to your SAD500.
dialog box opens . The parameters i n this d i alog box are usually set only
, choose S1024DW.
, choose SAD500.
See the Tr oubleshooti ng se c tion on page 6 for help in determ i ning the COM P ort number.
Baud Rate
SAD Pixel Resolut ion
th
n
pixel of the spectrometer is transmitted from the SAD500 to the PC. Your resolution value
, select the speed at which the SAD500 will operate.
, en t er resolut ion values from 1 to 500. This va lue specifi es that ever y
depends on your experiment. By sacrificing pixel resolution, you gain speed. The transfer of one
complete spectra requires ~0.3 seconds when communicating at 115,200 baud rate. If you need your
information in <0.6 seconds, increase the resolution or enable data compression (see below).
6. Enable the
Compress SAD500 Data
functi on to minimize the amount of data transferred over the RS232 connection. Transmission of spectral data over the serial port is a relatively slow process. Enabling
this function insures that every scan transmitted by the SAD500 will be compressed, greatly increasing
the data transfer speed of the SAD500.
7. For your setup, only these parameters apply to your system. (Ignore the other settings; the driver will
only read settings that per tain to the spectrometer and A/D converter you have chosen .) Click OK. You
can always chang e these settings once OOIBase32 is fu lly operat ional by select ing
Configure | A/D Interface
.
Spectr ome t er |
If you do n ot see the “Configure Hardware” s cr een when you start OOIBas e3 2 , exit OOI Base32 by
selecting
File | Exit
. Then select
Start
|
Run
, and type
C:\windows\ooidrv.ini
. Notepad will
open. Edit the initialization file for our device driver by finding the “Initialized” entry and making
sure this line reads
Initialized=0
. Save the OOIDRV.INI file and exit Notepa d. Restar t
OOIBase32. You should now see the “Configure Hardware” dialog box.
Spectrometer Configuration Dialog Box
Now tha t OO I Ba s e3 2 is running , you need to configure your s ystem. Select
from the menu. Go through each page in the
Spectrometer Configuration
paramet e rs. (For det ailed i nform a tion on each page of this dialog box, see the
Operating Software Manual
or the software’s help files.)
4
Spectrometer | Configure
dialog box to set system
OOIBase32 Spectrometer
Page 8
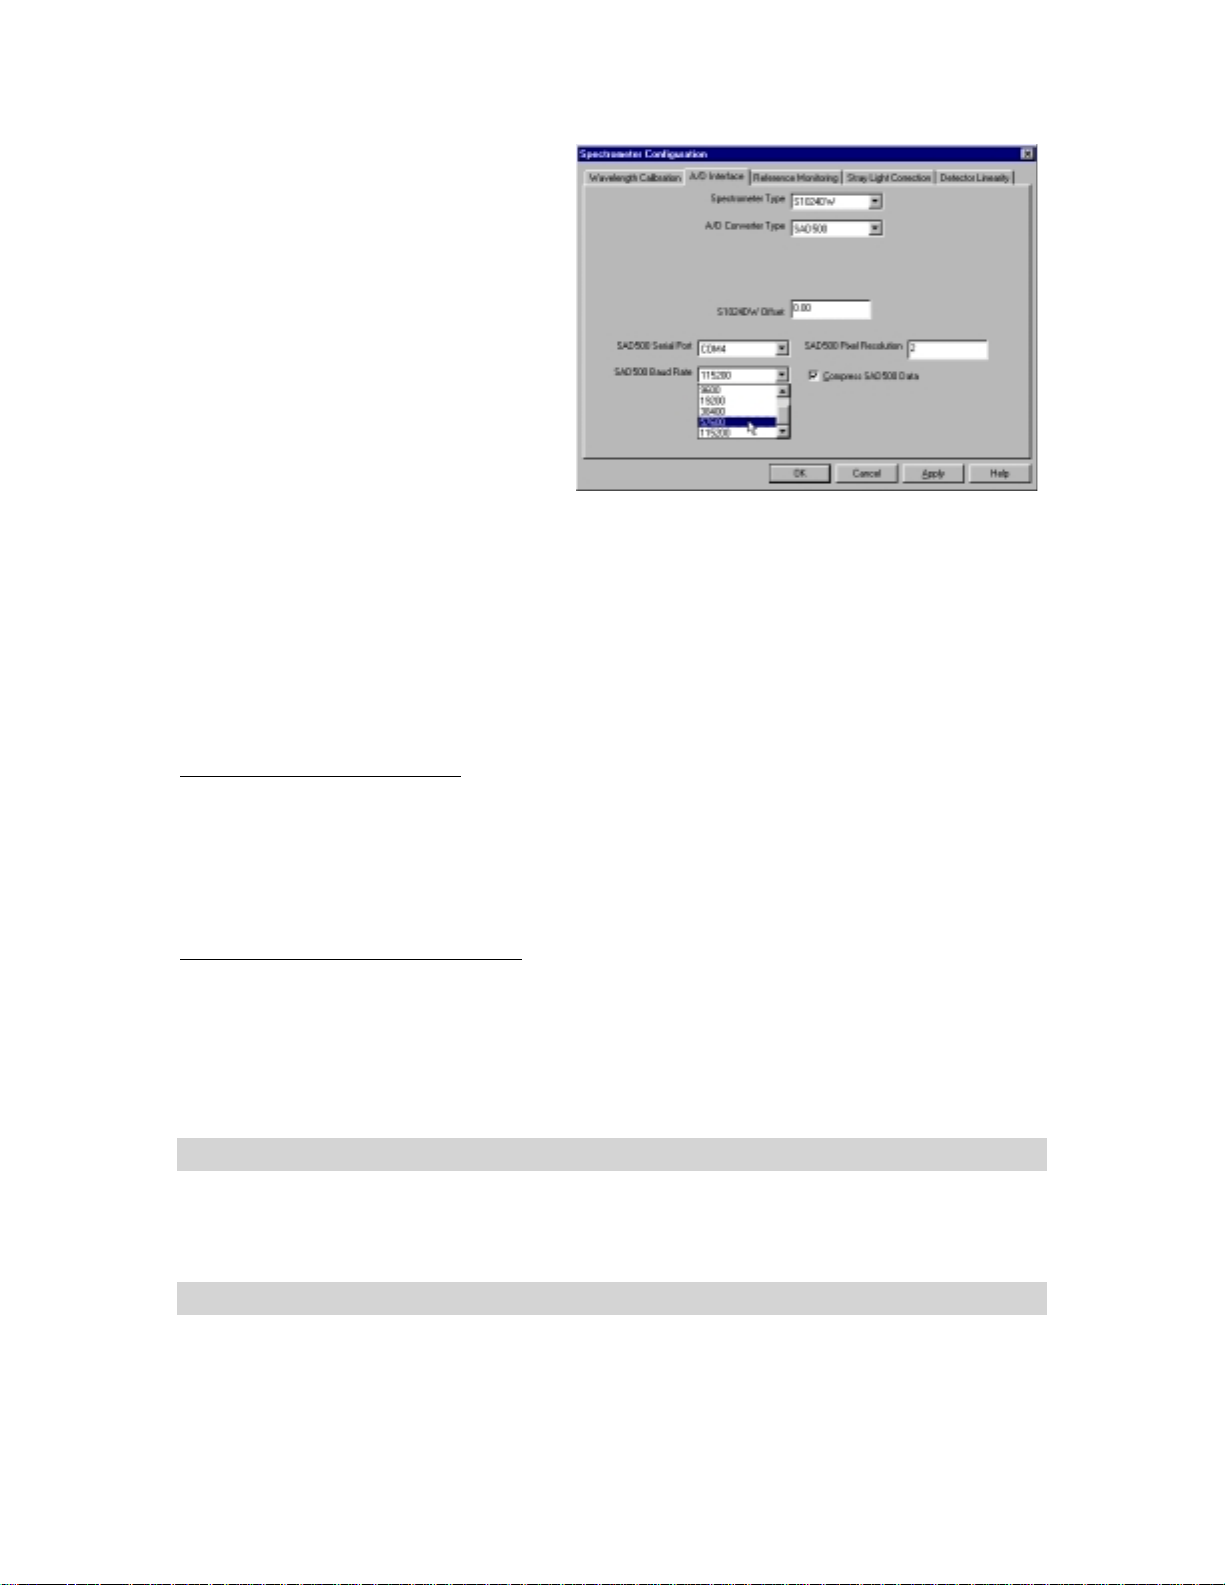
• In the
• In the
• The
At this point, OOIBase32 should be acquiring data from your spectrometer. There should be a dynamic trace
responding to light near the bottom of the displayed graph.
When you exit OOIBase32, all of this configuration information will be stored in the spectrometer
configuration file. The next time you run OOIBase32, the software will use the
file as the standard for your spectrometer configuration. If you wish, save the spectrometer configuration
file with a different name by choosing
Wavelength Calibration
coeffi cients for each spectrometer ch an nel
in your system have already been loaded
as part of the spectrometer configuration
file. Check the
spectrometer chan nel in your system.
A/D Interface
settings and va lues as you di d in the
Conf igure Hardware
S1024DW Offset function allows you to
adjust th e signal baseline. Some
S1024DW units have a negative baseline,
which d oes not affect any data since all
data is referenced f ro m the same bas eline.
If your unit has a negative baseline and
you want to insure the baseline (and
therefore your data) is positive, you can enter an offset value to raise the baseline.
Detector Linearity
Enabled
box for each
page, enter the same
dialog box. The
page is for spectrom eters other than the S1024DW.
page, the
Spectrometer | Save Configurati on As
[your serial number].spec
from the OOIBase32 menu.
OOIBase32 Settings Dialog Box
At this point, it is a good idea, though not necessary, to configure several OOIBase32 operation parameters.
Choose
of this di a log box to selec t options for sa ving, opening, an d printing data; to choose waveform sound files
for various program events; to configure default setting files; and to select other important options such as
storing and copying data and choosing warning messages. (For detailed information on each page of this
dialog box, see the
Edit | Settings
OOIBase32 Spectrometer Operating Software Manual
from the menu to open the
OOIBase32 Settings
dialog box. Go through each page
or the software’s help files.)
Configure Data Acquisition Dialog Box
Fina lly, select
parameters in the
time and choose averaging and boxcar smoothing values. The
the ext ernal tri g ger mode and automatically save dat a for each ext ernal trigger. The
to control external str obe events with the spectrometer. (For detail ed information on each pa g e of t h is
dialog box, see the
Spectrum | Configure Data Acquisition
Configure Data Acquisition
OOIBase32 Spectrometer Operating Software Manual
dialog box. The
from the menu to set your data acquisition
Basic
External Trigger
page allows you to set the integration
page allows you to specify
Strobe
page a llows you
or the software’s help files.)
Step 4: Connect sampling optics
Check the
optics suc h as light s ources, sampling cham be rs, fibers, and other accessories .
Table of Contents
to find st ep - b y-step direction s for s etting up an d operatin g sp ecific sam p ling
Step 5: Start the software and receive data
Run OOI Base32 in Scope M ode and tak e a dark spectrum and a refer ence spectrum (see the
Tutorial
sample measurements.
section for details). Choose the absorbance, transmission, or relative irradiance mode to take your
5
Experiment
Page 9
Troubleshooting
Occasionall y, there will be problems associat ed wi th your PC configuration and the software. Here are a
few tips to assist you.
• To ensure that the software and h ar d wa re are in-syn ch, exit OOI Ba s e3 2 , cycle power on the SAD50 0
and restart OOIBase32.
• In Windows 95/9 8, you ca n find out your Serial Port number by selecting
Panel.
Then double-click on the
Ports (COM & LPT)
and this will display the COM port numbers. Ensure that there is no yellow or
System
icon and s elect the
Device Manager
Start | Settings | Control
tab. Double-click on
red warning sign next to the COM Port you are attempting to use.
• If the ports on your PC are not labeled and you don’t know which COM port you are using for your
SAD500, you may have to resort to trial and error. If you choose the wrong serial port number, you
will not see a dynamic trace responding to light near the bottom of the displayed graph. Instead, you
will see a straight line.
• The default baud rate is 57,600. If your computer is not capable of communicating at this speed, select
Spectrometer | Configure
SAD500 Baud Rate
, select a s lower baud ra t e.
from the O OIBase32 m en u an d choose the
A/D Interface
page. Under
• On some computers, users may have to disable any virus protection software to ensure timely and
complete transfer of the data.
Getting Help
Comprehensive online assistance is available from OOIBase32’s Help menu. The Help files provide
instructions on all buttons, options, items, and dialog boxes in OOIBase32. However, if the online Help
does not answer your question, please con tact Ocean O pt ics.
Ocean Optic s, Inc.
380 Main Street
Dunedin, FL 34698
(727) 733-2447
(727) 733-3962 f ax
TechSupport@OceanOptics.com
SAD500 Specifications
A/D resolution: 12-bit
A/D sampling frequency: 500 kHz (maximum)
Communication port: RS-232
Baud rate: 2400-115,200
Input voltage: 10 – 24V
Input current: 130 mA without spectrometer
Interface cable: 9-pin connector to PC, 25-pin connector to spectrometer
Multiple-channel capability: supports up to 8 spectrometer channels
Spectrometer compatibility: supports all S1024DW spectrometers
Software compatibility: supports all 32-bit Ocean Optics software products
Spec trometer integ ration time:
31 milliseconds to 60 seconds (S1024DW spectrometers)
5 milliseconds to 60 seconds (S2000 spectro mete rs)
6
Page 10
Light Sources
Ocean Optics light sources provide illumination and excitation sources in the UV, VIS or Shortwave
NIR ran g e for absorban ce or reflection measurement s, d iscrete line spectra for waveleng th calibrations,
and cal ibrated a bsol u te inten s ity standards for irra diance measurement s. Wall transformers are
supplied for laboratory use. Except for the deuterium lamps, all sources are powered by +12 VDC to
facilitate their use in the field. The S1024DW accepts light energy and disp erses it via a fi xed grating
across the array, which is responsive from 200-1100 nm. Though some light sources emit energy
<200 nm, or emit energy to 2
detector’s responsivity (200-1100 nm).
The D-1000 Deuterium Light Source is a high-output, fiber optic
light source optimized for the UV. It produces intense, continuous
spectral output from ~200-400 nm.
The DT-1000 Deuterium Tungsten Halogen Light Source combines
the con tinuous spectrum of a UV and VIS/NI R li gh t s ource in a
single optical path. Its output range is ~200-1100 nm.
µ
m, their u s e with Ocean O pt ics spectrom eters is limited by our
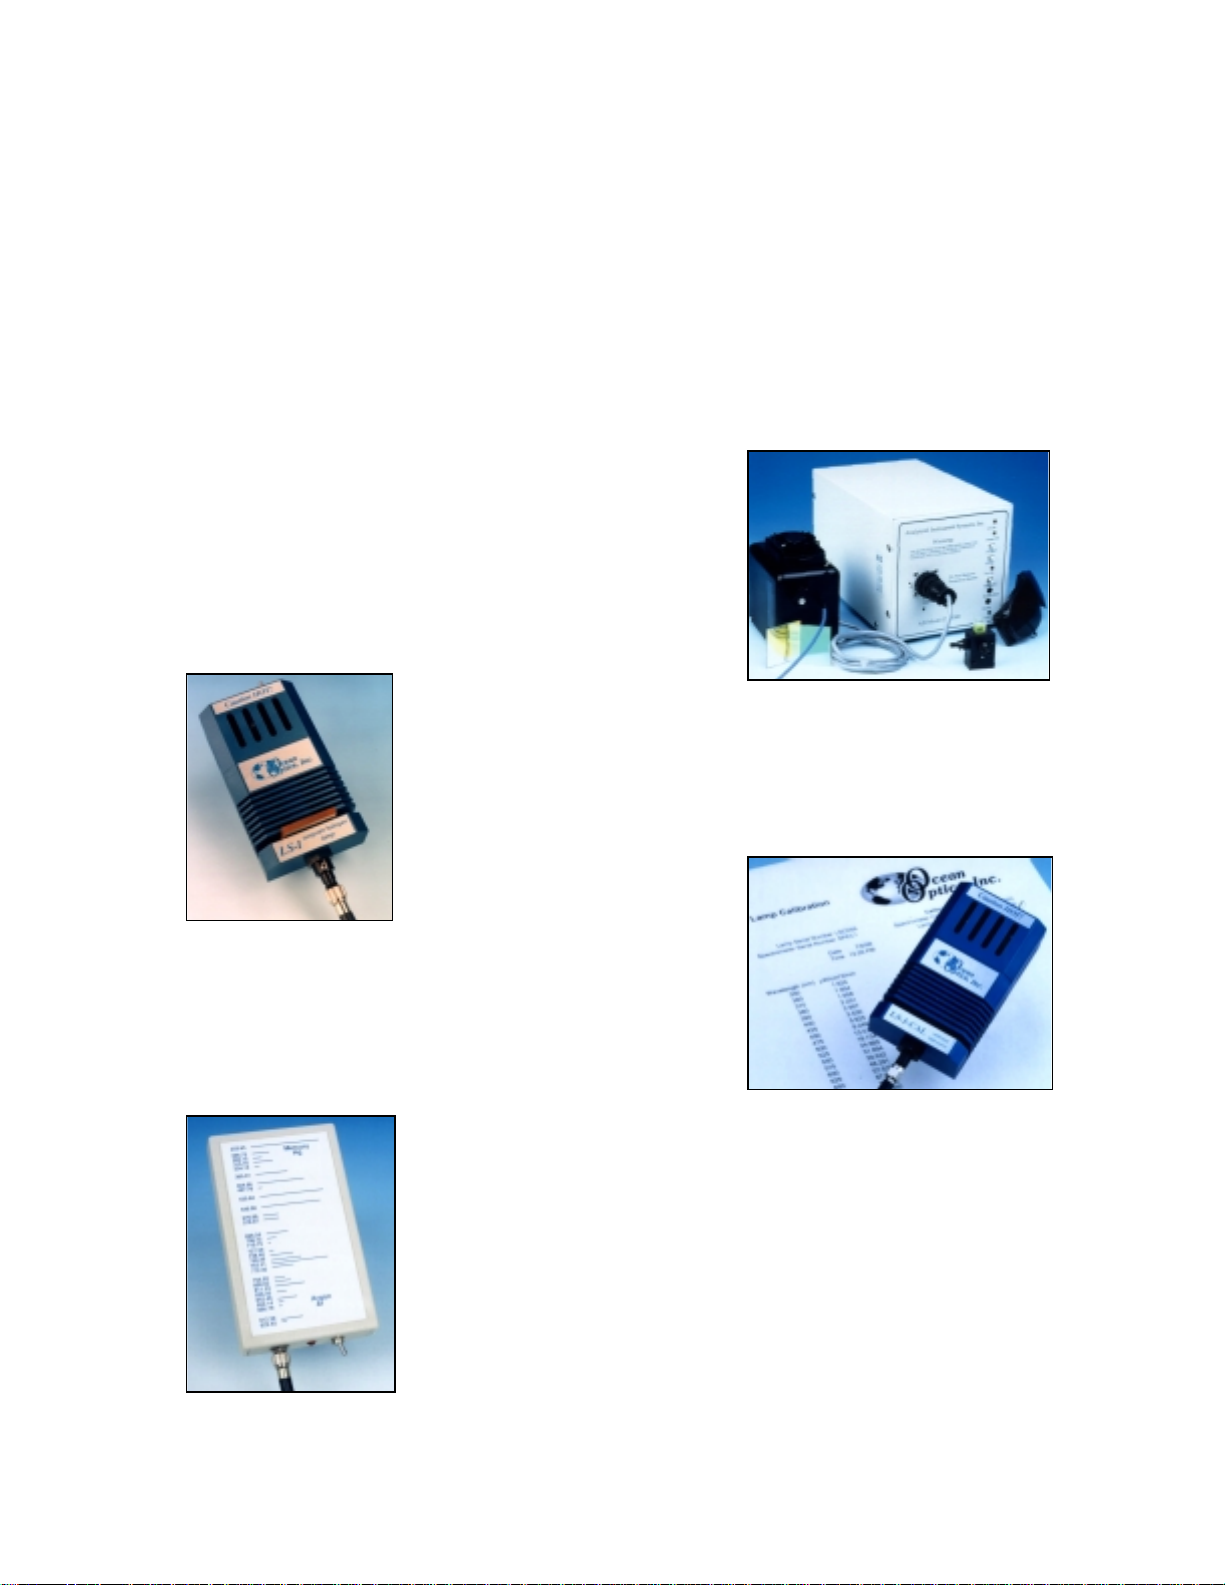
The LS-1 Tungsten Hal og en Light S ource is a versatile sour ce for the
VIS-Shortwave NIR (360 nm-2 µm). It offers high color temperature, a
long life and a built-in filter slot for color-correcting and other uses.
The LS-1 -CAL Calibrated Ligh t Source is a NIST-traceable
calibrated light source for the VIS-Shortwave NIR (300-1050 nm).
It has a highly Lambertian internal diffuser, and is specifically
calibrated for optical fibers. The calibration data includes absolute
inten s ities at th e fi ber entran ce port for wavel engths bet we en
300-1050 nm.
The PX-2 Pulsed Xenon Lamp (~225-700 nm) is a 220 Hz short-arc
flashlamp. It produces high-energy pulses of brief duration and has two
trigger modes for the hardware or software controlled flash rate.
The HG-1 Mercury Argon Calibration Source produces Mercury and
Argon emission lines from 253-922 nm for use in performing fast, reliable
spectrometer wavelength calibrations.
7
Page 11

Light Sources: D-1000 Deuterium Light Source
D-1000 D
The
for the UV. The D-1000 produces intense, continuous spectral output from ~200-400 nm, making it especially
useful for UV spectroscopy. The D-1000 has a highly stabilized microprocessor-based power supply designed
for optimum stability, with a maximum fluctuation of just 0.05% peak-to-peak and drift of +/- 0.5%/hr. The
lamp can be controlled from th e s witches on th e front pan el or through dig ital lin es.
• D-1000 Deuterium Light Source
• Safety eyewear for protection against dangerous ultraviolet radiation
• Power cord for connecting D-1000 to outlet
• Allen wrench for adjusting the focus of the collimating lens
The beam emerging from the D-1000 produces visible light and invisible ultraviolet radiation. Direct
!
contact with the beam could cause serious eye injury. Safety eyewear must be worn at all times while
operating the D-1000. Do not remove any safety device installed.
Dan gerous volt ages presen t.
Only qualified service personnel should service the D-1000.
""""
This instrument should not be used for any clinical or diagnostic purposes.
""""
Handle with care. Dropping the D-1000 ma y caus e p erman ent damag e.
""""
For optimum performance below 230 nm, use a solarization-resistant fiber with this lamp.
""""
EUTERIUM LIGHT SOURCE
is a high-output, high stability fiber optic light source optimized
Parts I nc luded
Caution!
Operation
1. Put on safety eyewear.
2. Lift t he black protective shutt er cover ing the fiber opt ic port . Remov e t he red pla s t ic cap that cov ers
the SMA connect or and insta l l a n optical fiber. (For be s t results, use our sola rizat ion-resi s t a nt fibe rs. )
3. Plug the power cord into the rear of the D-1000. Plug the other end into a 110 VAC outlet.
4. Locate the black p ower s wi tch at the rear of the D-10 0 0, just above where the p ower cord conn ects to
the D-1000. Turn on the power. When the power is on, the green
right of the front pan e l will l ight.
5. Push in the
Pushing in the
deuterium lam p i on izes the available deu t erium. At this point , th e yell o w
panel will light. Next, after ~30 seconds, the red
light. (The
deuterium lamp is ready for your application. Best results are obtained after the lamp has warmed up
for 30 minutes.
6. Without a solarization-resistant fiber, the spectral output will decrease significantly as a function of
time at wavelengths lower than 230 nm.
7. To turn off the deuterium lamp, first press the white
flip the power switch at the rear of the D-1000, just above where the power cord connects to the
D-1000. The green
8. Lift up th e black protec tive shutter and disconnect your op tical fiber from the SM A c onnector.
9. Replace t he red plas tic cap over the SMA connector.
UV Start
UV Start
Heater On
Pow er On
button located on the front panel. This white button turns on the deuterium lamp.
button in itiates the start up sequence for th e lamp. Firs t, the heater in the
UV On
light located at the top of the front panel will
light will turn off at the same time.) Once the red
UV Off
light on the front panel will go out.
Pow er On
button located on the front panel. Then,
light located at the bottom
Heater On
UV On
light on the front
light is lit, the
8
Page 12
Bulb Replacement
1. Order a replacement bulb, item D-1000-B, from Ocean Optics.
2. Make sure the D-1000 is turned off, the power cord is disconnected and the lamp has cooled.
3. Use a Phillips-head sc rewdriver to rem ove all 12 screws from t he si de pane ls of th e D -1000 c asing .
not
remove any screws fr om the front, back, or bottom panels. Re move the cover.
4. Locate the deuterium bulb. It is located at the front of the housing, mounted on a black platform. Three
wires lead from the bottom of the bulb to the bright green electronic board: one red wire (with a time
indicator on it) and two black wires.
5. Use a Phillips-h ead screwdriver to loosen the scr ews securing these three wires t o the green elect ronic
boar d. Once the screws are loose, gently rem ove the red wir e and the two black wi res. You d o n ot n eed
to compl etely rem ove the screws to detach th e wi res. (Note that on the gr een electr on ic board, ju s t
right of ea ch wir e , is a letter. To th e right of t he red wire i s t he let ter “A” . To the r ight of one bla c k
wire i s the letter “H” and to the right of the second black wire is the letter “C”.)
6. In order to remove the bulb, you will need to unscrew the nut holding the collimating lens and SMA
connector in place. It is positioned in such a way that if the nut remains in place, you will not be able to
take out the deuterium bulb. Use a 3/8” wrench to rem ove the nut.
7. Use a Phillips-head sc rewdriver to rem ove the two s c rews s e cur i ng th e bu lb to the black pla tform.
8. Remove the old bu lb unit.
9. Insp ect the new bulb unit, but
avoid touching the glass casing
(or envelope) around the bulb as the
oils from your skin will deteriorate the bulb. Inside the envelope is a triangle-shaped filament. The
filament has a
square
opening. The light passes through the square opening to the collimating lens.
Take the new bulb, ca refully feeding th e three wires th rough th e hole in the bla ck p latform, an d
position it so that the square opening in the filament faces the collimating lens.
10. Screw in the two screws that secure the bulb to the black platform.
11. Screw on the nut that holds the collimating lens in place.
12. Secure the three wires to the gr een electron ic board. At tach the red wire to the top screw, labeled “A”.
Attach the bla c k wires to the sc rews on the boa rd labeled “ H” and “C”.
black wire is attached to screw “H” or “C”
.
It does not matter which
13. Put the D-1000 cover back on and secure it with the 12 screws.
Do
For directions on adjusting the focus of the collimating lens on the D-1000, turn to
Appendix A
Specifications
Spectral range: ~200-400 nm
Time to stabilized output: ~30 minutes
Power consumption: 25-30 Watts
Bulb lifetime: 1,000 hours (replacement bulbs available)
Stability: peak-to-peak = 0.05% (maximum); drift of +/-0.5%/hour
Ape rtu re: 0.5 mm (at lamp )
Connector: SMA 905
Window material: 0.4 mm thickness UV-transmissive glass
Lamp voltage: 85 volts DC (nominal)
Operating lamp current: 300 mA DC (+/- 1mA)
Timing: microprocessor-based
Inputs: trigger inputs for lamp (on/off)
Outputs: levels for lamp (on/off), filament (on/off)
120 volts AC @ 0.50 A, 50-60 Hz
Power requirements:
220 volts AC @ 0.25 A, 50-60 Hz
100 volts AC @ 0.60 A, 50-60 Hz
240 volts AC @ 0.20 A, 50-60 Hz
.
9
Page 13

Light Sources: DT-1000 Deuterium Tungsten-Halogen
!
Light Sou rce
DT-1000 D
The
deuterium UV light source and a tungsten-halogen VIS/Shortwave NIR light source in a single optical path.
The combined light source produces a powerful, stable output from ~200-1100 nm. It also has a highly
stabilized microprocessor-based power supply designed for optimum stability.
EUTERIUM TUNGSTEN-HALOGEN LIGHT SOURCE
Parts I nc luded
• DT-1000 Deuterium Light Source
• Safety eyewear for protection against dangerous ultraviolet radiation
• Power cord for connecting DT-1000 to outl et
• Allen wrench for adjusting the focus of the collimating lens
Caution!
The beam emerging from the DT-1000 produces visible light and/or invisible ultraviolet radiation.
!
.
Dir ect contact with the beam cou ld cause serious eye injury. Saf ety eyewear must be worn at all times
while operating the DT-1000. Do not remove any safety device installed.
Dan gerous volt ages presen t.
Only qualified service personnel should service the DT-1000.
""""
This instrument should not be used for any clinical or diagnostic purposes.
""""
Handle with care. Dropping the instr um en t may cause per manen t dam age.
""""
For optimum performance below 230 nm, use a solarization-resistant fiber with this lamp.
""""
combines the continuous spectrum of a
Operation
Allow several minutes for the lamp to warm up and for the power to stabilize, regardless of the bulb being
used. Best results are obtained after 30 min u tes. The sp ectral output as delivered by an optical fiber will
decrease significantly at wavelengths lower than 230 nm due to attenuation in the lamp envelope, the
decrease in detect or efficiency in the spectrom eter, and att enuation b y the fiber.
1. Put on safety eyewear.
2. Lift t he black protect ive shutter cover ing the fiber optic por t. Install an opti ca l fiber. (For best results,
use our solarizat i on-r esi st ant fibers.)
3. Plug the power cord into the rear of the DT-1000. Plug the other end into a 110 VAC outlet.
4. To turn on the power for the DT-1000, flip the power switch at the rear of the unit, just above where the
power cord connects to the DT-1000. When the power is on, the green
bottom r ight of the front panel will light. At this time the user can now po wer up the deuterium or
tung sten-hal og en sou rce or both . ( S ee
source
.) To turn off the DT-1000, both deuterium and tungsten-halogen sources must be off first. Only
then can the user flip the power switch at the rear of the unit to the off position. The green
light will turn off.
5. Lift up th e black protec tive shutter and disconnect your op tical fiber from the SM A c onnector.
Operating the D euterium source
Operating the Deuterium source
6. To power the deuterium lamp, push in the
button turns on th e d eu terium lamp. Pushin g in the
UV Start
button located on the front panel. This white
UV Start
button ini tiates th e start-up s eq u ence for
Power On
Operating the Tungsten - Halogen
and
light located at the
Power On
10
Page 14

the lamp. First, th e heater in the deuteri um lamp ionizes th e available d eu terium. At this poin t, the
Heater On
yellow
the top of the front panel will light. (The
7. To turn off the deuterium lamp, press the white
On
light shou ld go out.
light on th e front pan el will light. Aft er ~30 second s, the red
Heater On
light will turn off at the same time.)
UV Off
button located on the front panel. The red
UV On
light located at
UV
Operating the Tungsten-Halogen source
8. To power the tungsten-halogen lamp, push in the white button labeled
light will come on.
9. To turn off the tung st en-halogen lamp, pres s the white
The red
Vis. On
light will go out.
Visible On
button loca ted on t he front panel.
Visible On
. The red
Vis. On
Bulb Replacement
Replacing the Deuterium bulb
1. Order a deuterium replacement bulb, item DT-1000-BD, from Ocean Opt ics.
2. Make sure the DT-1000 is turned off, the power cord is disconnected, and the source has cooled.
3. Use a Phillips-head screwdriver to remove all 12 screws from the side panels of the DT-1000 casing.
Do not
remove any screws from the front, back, or bottom panels. Remove the cover.
4. Locate the deuterium bulb. It is located at the front of the housing, mounted on a black platform. Three
wir e s lead from th e bottom of the bulb to the gre en el ec t roni c board : one red wire and two black wires.
5. Use a Phillips-h ead screwdriver to loosen the scr ews securing these three wires t o the green elect ronic
boar d. Once the screws are loose, gently rem ove the red wir e and the two black wi res. You d o n ot n eed
to compl etely rem ove the screws to detach th e wi res. (Note that on the gr een electr on ic board, ju s t to
the ri gh t of ea ch wire, is a letter. To the right of th e red wire is the letter “A”. To the right of one black
wire i s the letter “H” and to the right of the second black wire is the letter “C”.)
6. Use a Phillips-head sc rewdriver to rem ove the two s c rews s e cur i ng th e bu lb to the black pla tform.
7. Remove the old bu lb unit.
8. Insp ect the new bulb unit, but
oils from your skin will deteriorate the bulb. Inside the envelope is a triangle-shaped filament. The
filament has a
Take the new bulb, ca refully feeding th e three wires th rough th e hole in the bla ck p latform, an d
position it so that the square opening in the filament faces the collimating lens.
9. Screw in the two screws that secure the bulb to the black platform.
10. Secure the three wires to the gr een electron ic board. At tach the red wire to the top screw, labeled “A”.
Attach the bla c k wires to the sc rews on the boa rd labeled “ H” and “C”.
black wire is attached to screw “H” or “C”
11. Put the DT-1000 casing back on an d secure it with the 12 screws.
square
opening. The light passes through the square opening to the collimating lens.
avoid touching the glass casing
.
(or envelope) around the bulb, as the
It does not matter which
Replacing the Tungsten-Halogen bulb
1. Order a tungsten-halogen replacement bulb, item DT-1000-BT, from Ocean Optics.
2. Remove all 12 screws from the side panels of the DT-1000 casing using a Phillips- head screwdriver.
Do not
remove any screws from the front, back, or bottom panels. Remove the cover.
3. Locate the tungsten-halogen bulb. It is inserted on the top of a cylindrical unit held by a set screw in a
hole in the black platform. The cylindrical unit is positioned behind the deuterium bulb. Two thin wires
lead from the bott om of the unit to a socket on the electroni c board.
4. Gently grip the top of the bulb and pull it away from the cylindrical unit. Discard the bulb.
5. Insert the new bulb into the top of the cylinder, being careful to position the bulb’s pins over the holes
in the t op of the cylinder.
""""
The c ylindric al unit is held in place with a small set screw. By loos ening i t, th e user can sli de the
bulb unit up and down, positioning it in front of the attenuator, a metal disc that attenuates the light
before going through the collimating lens. Another set screw holds the attenuator in place.
6. Put the DT-1000 casing back on and secure it with the 12 scr ews.
For directions on adjusting the focus of the collimating lens on the DT-1000, turn to
11
Appendix A
.
Page 15
Specifications
Spectral range: ~200-11 00 nm
Time to stabilized output: ~30 minutes
Deuterium bulb lifetime: 1,000 hours
Tungsten-halogen bulb lifetime: 900 hours
Power consumption: 25-30 Watts
Stability:
Ape rtu re: 0.5 mm (at lamp )
Connector: SMA 905
Lamp voltage: 85 volts DC (nominal)
Operating lamp current: 300 mA DC (+/- 1mA)
Inputs: trigger inputs for lamp (on/off)
Outputs: levels for lamp (on/off), filament (on/off)
Power requirements:
peak-to-peak = 0.05% (maximum)
drift of +/-0.5%/hour
120 volts AC @ 0.50 A, 50-60 Hz
220 volts AC @ 0.25 A, 50-60 Hz
100 volts AC @ 0.60 A, 50-60 Hz
240 volts AC @ 0.20 A, 50-60 Hz
12
Page 16

Light Sources: LS-1 Tungsten Halogen Light Source
!
LS-1 T
The
Shortwave NIR (360 nm-2
temper ature and extremely efficient output.
• LS-1 Tungsten Halogen Light Source
• 12 VAC power supply
• Allen wrench for adjusting the collimating lens
UNGSTEN HALOGEN LIGHT SOURCE
µ
m). The lamp, with either a 900-hour or 10,000-hour bulb, offers high color
is a versatile, white-light lamp utilized for the VIS-
Parts I nc luded
Caution!
The LS-1 becomes
DO NOT in sert plastic or flamma bl e materials in the filt er s lot. The material s could melt or ignite.
The unit could ignite flammable materials that come in contact with the metal housing.
HOT
during operation. No cooling fan is installed in the LS-1. Handle with care.
Operation
Turning On the Lamp
1. Plug the wall transformer end into a standard 110 V outlet. Plug the 12 V output end into the back of
your L S -1.
2. Scr e w a fiber into t he SMA c onnector on you r LS- 1.
3. Find the on/off switch on the back of the lamp and turn the lamp on. Allow the lamp to warm up for
approxi m atel y 30 minutes.
Using the Filter Slot
The slot between the lamp and the fiber coupler can be used to hold filters or light blocks. You can place a
filter into the filter slot; however, be aware of the following:
• The filter slot accepts filters up to 3 mm thick.
• Because the lamp can become hot, avoid plastic filters as they may melt.
• The uni t could igni te flammabl e materials that come in contact with the meta l h ou s ing.
• There is no filter clamping screw for holding filters in place.
The most useful filters include the following:
• an FG-3 blue filter for increasing the relative energy near 400 nm and 800 nm compared to 600 nm
• an IR cutoff filter to reduce stray light below 750 nm
• a 550 nm long pass filter to eliminate second-order effects on Shortwave NIR measurements
Replacing the Bulb
1. Order a rep lacement bu lb (LS- 1-B for a 90 0-hour bulb or LS-1 -LL-B for a 10,000- hour bu lb).
2. Turn off the LS-1 and allow the lamp to cool.
3. Use an Allen wrench to loosen the set screw on the bottom of the lamp. You do not need to remove the
set screw. This screw holds the bulb in place.
13
Page 17
4. Locate the two set screws at the ba ck of t he lamp, one above each ba ck leg. These two screws keep t he
two halves of the lamp together. Remove the two screws.
5. Gently separate the two halves of the lamp.
6. Carefully pull the bulb out of its housing. Detach the wire and lamp leads from the socket. Remove the
old bulb un it an d discard.
7. Plug th e new bulb into the socket.
8. Slide the new bulb forward into the front of the lamp as far as it will go.
9. Gently tighten the set screw on the bottom of the lamp.
10. Close together the two halves of the lamp, being careful not to pinch the wires.
11. Replace the two screws at the back of the lamp.
For directions on adjusting the focus of the collimating lens on the LS-1, turn to
Appendix A
.
Specifications
Spectral range:
Dimensions:
Power input: 12 VDC/800 mA, 7-20 VDC/0.5-2 amps
Power output: 6.5 watts
Bulb life: 900 hours (standard), 10,000 hours (long-life)
Bulb color temperature: 900-hour bulb = 3100K, 10,000-hour bulb = 2800K
Out put to bulb: 5 volts/1.3 am ps
Output regulation: 0.2% voltage
Time to stabilized output: ~30 minutes
Bulb output: 7400 foot-candles (7.4MSCP)
Connector: SMA 905
*
The LS-1 has a spectral range of 360 nm-2 µm, however the range is limited to the spectral response
of the detector. For the S1024DW, the detector’s response goes to 1100 nm.
360 nm - 2 µm*
9.0 cm x 5.0 cm x 3.2 cm (LWH), 3 . 5
”
x 2.0” x 1.25” (LWH)
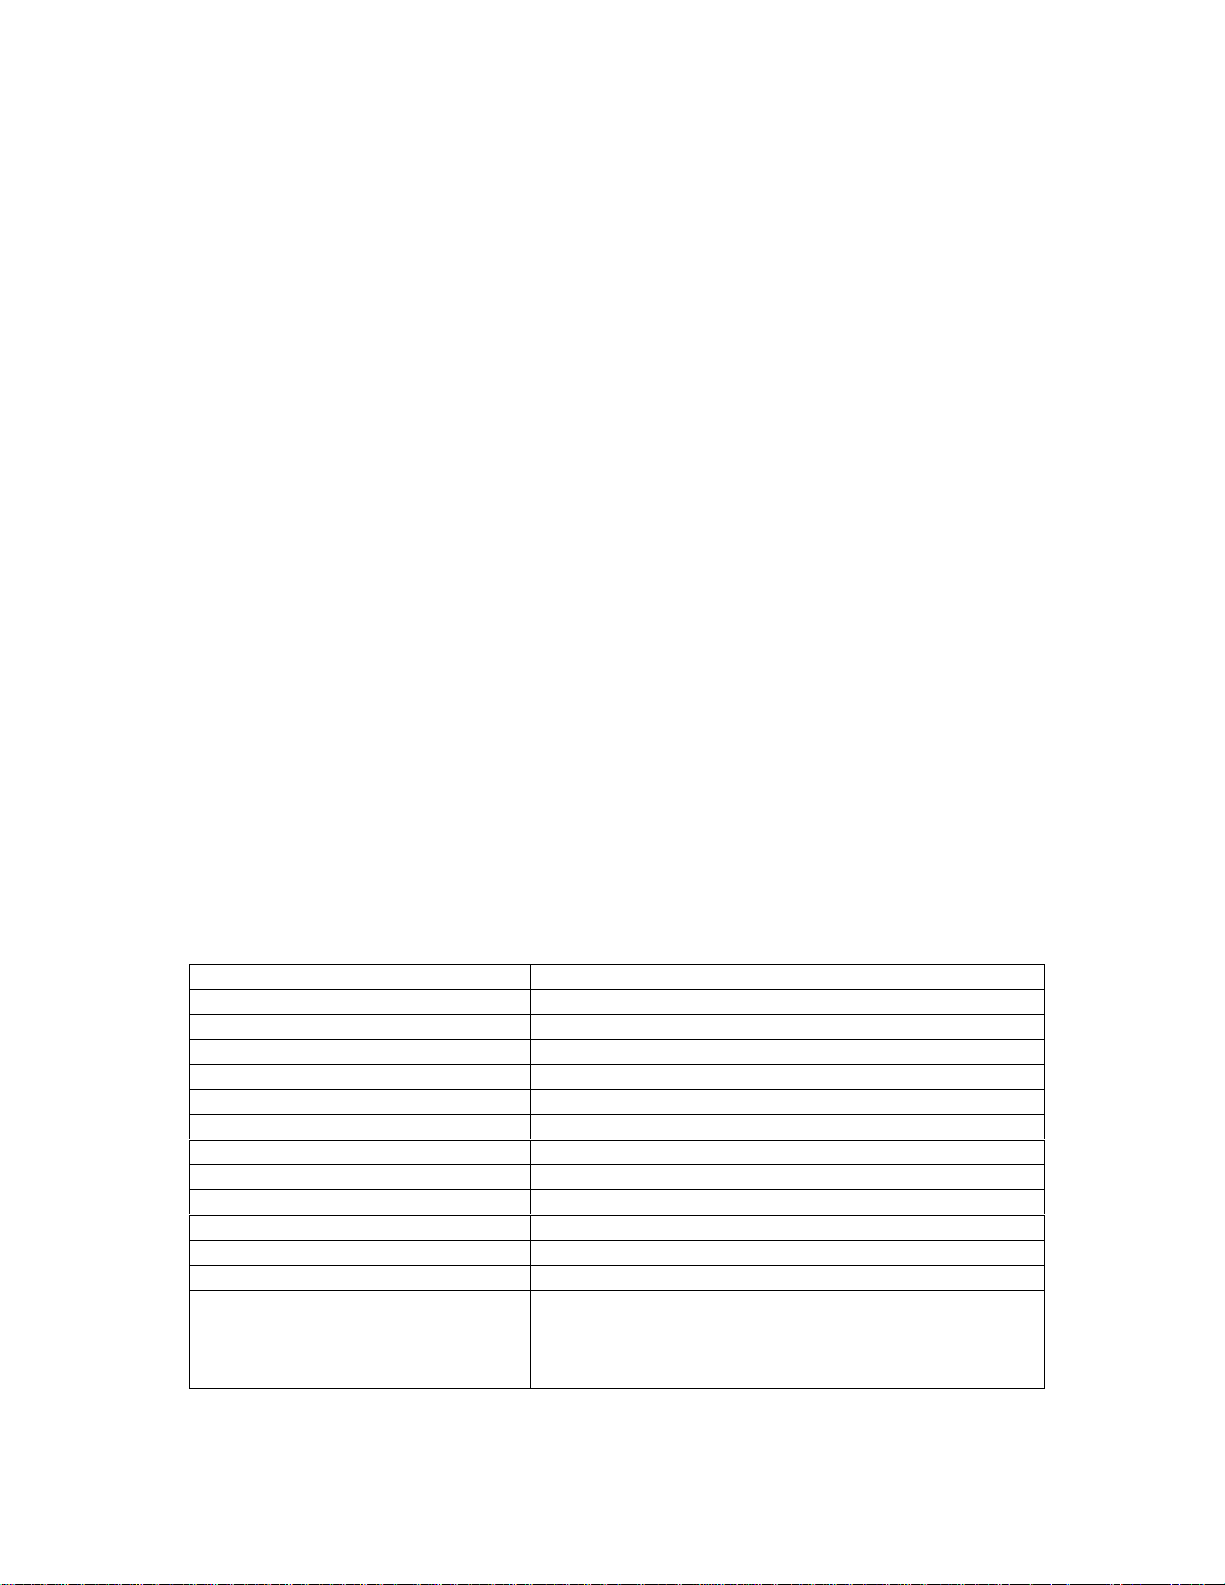
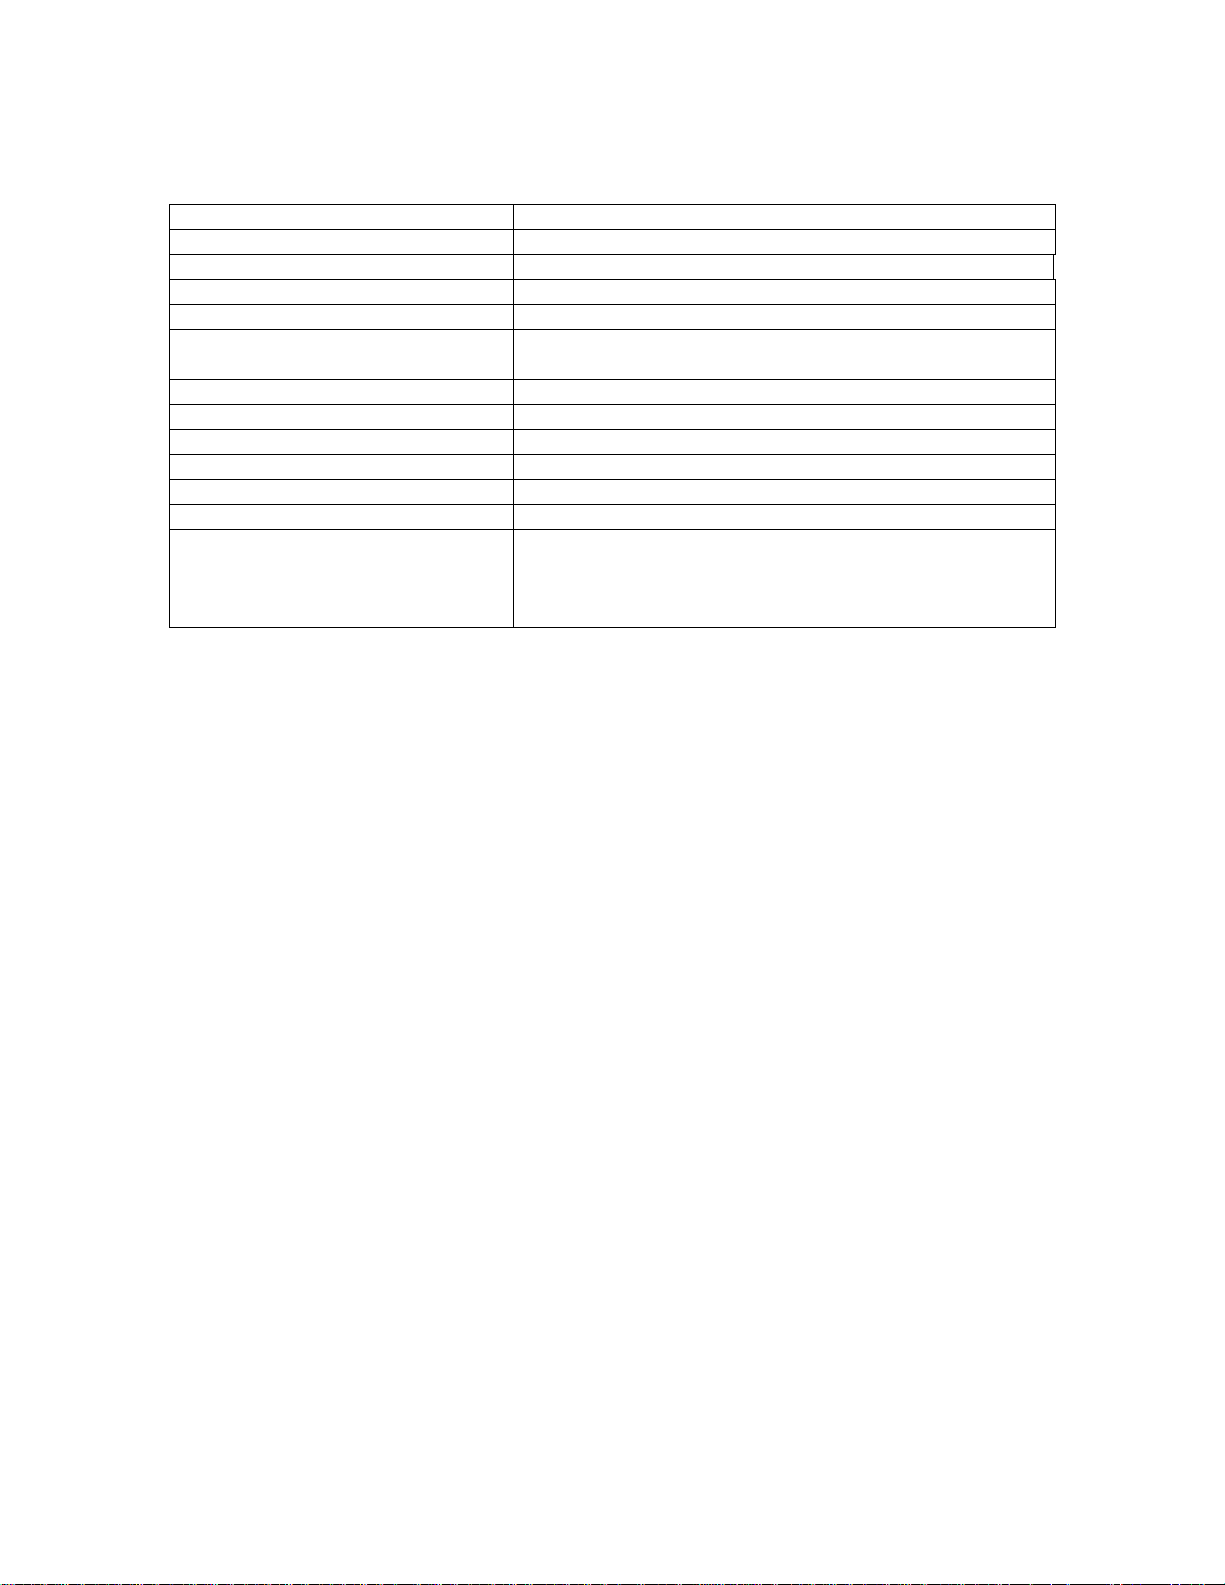
Spectral Output
These gr aphs repres ent normalized bla ck body curves for tung sten halogen li ght sources with 2800K an d
3100K color temperatures. The observed spectral output of the LS-1 will vary due to bulb type, the
spectrometer configuration, the sampling optics used, and inherent fluctuations in LS-1 output.
1.2
1
0.8
0.6
0.4
Normalized Intensity
0.2
0
300 500 700 900 1100 1300 1500 1700 1900
Wavelength (nm)
900-hour bulb / 3100K 10,000-hour bulb / 2800K
14
1.2
1
0.8
0.6
0.4
Normalized Intensity
0.2
0
300 500 700 900 1100 1300 1500 1700 1900
Wa ve l e n gth (nm )
Page 18

Light Sources: PX-2 Pulsed Xenon Lamp
PX-2 P
The
absorba nce, reflection, fluorescence and ph osphorescence measurements. The PX-2 opera tes at speeds u p
to 220 Hz and offers critical pulse-to-pulse stability.
• PX-2 Pulsed Xenon Lamp
• 15-pin cable for connecting the PX-2 to the spectrometer
• 12V DC wall transformer for supplying power to the PX-2
The beam emerging fr om the PX-2 produ ces u ltraviolet radiation . Direct cont act with the bea m could
!
cause serious eye injury. Never look directly into the light source.
Dan gerous volt ages presen t. Never operat e the PX-2 with out its hou s i ng intact.
The SMA con nector may get
This instrument should not be used for any clinical or diagnostic purposes.
""""
Handle with care. Dropping the instr um en t may cause per manent dam age.
""""
ULSED XENON LAMP
is a high flash rate, short-arc xenon lamp for applications involving
Parts I nc luded
Caution!
HOT
during operation.
Operation
The lamp is triggered with TTL pulses delivered through the 15-pin connector located at the rear of the
unit. Our S1024DW- s eries spectrometers and software, or any sour ce o f TTL signa ls, supplies these pul s es.
The lamp is powered by a 12V DC transformer, or from a 12V battery if field use is desired.
1. Plug the wall transformer into a 110V outlet. Plug the other end of the cord into the jack at the rear of
the PX- 2 .
2. Install the 15-p in cable int o the rear of the PX-2. Conn ect the other end to the 15-pin connect or on an
S1024DW.
3. Connect an optical fiber to t he SMA -term i nate d fiber optic port on the front panel.
4. Turn the power switch located at the rear of the source to the “ON” position.
5. Select ei ther “MULT I P LE ” or “SINGLE ” fl ash mode by moving the toggle on the rear of t he source.
You will need to match this mode in the operating software.
6. Config ure OOIBase3 2 operating software to operate the PX-2. In the
bar, ch eck the
Data Acquisition
7. The fla sh should fir e wi th a clearl y au d ible “pin g. ”
Strobe Enable
from the men u and then choosin g t he
box. You can also enable this function by selecting
Strobe
Acquisition Parameters
Spectrum | Configure
page of the dialog box.
dial og
Applic at ion Tips
Single Flash Mode
Using the Single flash mode results in one flash per integration cycle. Since the PX-2 has a maximum
repetition rate of 220 Hz, the minimum integration allowed in this mode is 31 milliseconds.
15
Page 19
Multiple Flash Mode
When u sing the Multi p le flash mode the user needs to ensur e tha t a constant nu m ber of flashes occurs for
every integration cycle by setting the pulse rate and integration time. This achieves a continuous and stable
signal. The pulse rate is determined by a jumper setting inside the S1024DW (JP3). The integration time is
controlled via the operating softwar e. To achieve a constant n um ber of flash es p er integration cycle, the
integration time must be a multiple of those shown in the following table:
S1024DW JP3 setting
(factory default)
216
14
2
12
2
10
2
Integr atio n t ime must be a
multiple of
128
32
8
N/A
The PX-2 repetition rate is controlled via the S1024DW (JP3), but is also dependent upon the frequency of
your A/D card. With the S1024DW, the SAD500 operates at 200 kHz, the fastest rate the S1024DW allows
the SAD500 to operate. The table below shows the rep rate for the various combinations of hardware and
jumper settings. (Note that the default setting fr om the factory is 2
JP3 Post # Function Frequency (Hz)
1 Not enabled - for future software control
2 Divide by 2
3 Divide by 2
4 Divide by 2
5 Divide by 2
10
12
14
16
16
.)
195
48.8
12.2
3.1
Specifications
Spectral range: 220-750 nm
•
Approximate dimensions:
Power input:
Trigger input: external TTL positive pulse via 15-pin connector
Output:
Pulse duration: 5 microseconds (at 1/3 height of pulse)
Lifetime:
Apertu re: 3 mm
Connector: SMA 905
Timing signals available from
S1024DW spectrometers:
14 cm x 10.5 cm x 4 cm (LWH)
•
”
x 4.1” x 1.5” (LWH)
5.5
•
1.3 A @ 11V @ 220 Hz
•
100 mA @ 12V @ 10Hz
•
45 millijoules per pulse maximum
•
9.9 watts average power
•
220 Hz pulse rate maximum
9
pulses (estimated 230 days continuous operation at 50 Hz
10
pulse rate)
•
Multiple mode = up to 220 Hz (varies with A/D sampling
frequency)
•
Single mode = varies with scan rate
16
Page 20

Light Sources: HG- 1 Mercury Argon Calibration Source
!
!
HG-1 M
The
Shortwave NIR spectrophotometric systems. The HG-1 produces Mercury and Argon lines from 253-922 nm,
for us e in p erforming fa s t, accurat e s p ectrometer wa vel ength calibrati ons. The HG-1 h as an SMA 905
termination for connecting to optical fibers.
The beam emerging fr om the HG-1 produ ces ultraviolet radiation . Direct contact with the beam could
!
cause serious eye injury. Never look directly into the light source.
The SMA con nector may get
Dangerous voltages presen t. No user-serviceabl e p arts inside.
Never take apart th e HG- 1 . The HG-1 con tains mercury.
ERCURY ARGON CALIBRATION SOURCE
HOT
during operation.
Operation
1. Plug the wall transformer end into a standard 110 V outlet. Plug the 12 V output end into the back of
your HG-1. Or, insert a 9V battery (not included).
2. Screw a fi ber into th e S MA con nector on your HG-1. If your spectr om eter does n ot have an entrance
slit, use a 50 µm diameter (or smaller) optical fiber. Larger fibers and slits will have lesser optical
resolution. Also, keep in mind that if the spectrometer has no slit and your experimentation involves
using optical fibers of different diameters, wavelength calibration will be necessary. Calibration is also
recommended each time you un screw the fiber from the s p ectrometer .
3. Find the on/off switch next to the SMA connector and turn the lamp on. The red indicator will light
when the lamp is on.
is a wavelength calibration source for UV-VIS-
Caution!
Calibration
Users can perform wa vel ength calibrati on wi th a spreadsheet progr am such as Microsoft Excel , or a
calculator that performs polynomial regressions. The following describes how to calibrate the wavelength
of your spectrometer using the HG-1. Though each spectrometer is calibrated before it leaves Ocean
Optics, the wavelength for all spectrometers will drift slightly as a function of time and environmental
conditions. To recalibrate the wavelength of your spectrometer, just follow these simple steps.
What You Are Doing:
The rela tionship b etween pixel number a nd wavelength is a second-order polynomial . . .
= I +
λ
p
. . . where λ is the wavelength of pixel p, I is the wavelength of pixel 0, C1 is the first coe fficien t (nm/pixel)
and C
is the second coefficient (n m/pixel2). You will be calculating the valu e for I and th e two Cs.
2
C
+
p
1
What You Will Need:
• Your HG-1 Mercury-Argon lamp.
• Your spectrometer.
• An optical fiber. For spectrometers without a built in slit, a 50-
• Either a spread sheet progr am ( Excel or Qua ttro Pro, for example) or a calculator that per forms second -
order linear r egression s. ( I f you are using Mi crosoft Excel , select
Analysis ToolPak
that
has been chosen.)
C2p
2
µ
m fiber works best.
Tools | Add-Ins
and mak e sure that
17
Page 21
What You Will Need To Do:
1. After placing OOIBase32 into Scope Mode, take a spectrum of the HG-1. Adjust the integration time
until there are several peaks on the screen that are n ot off-scale.
2. Move the cursor to one of the peaks and carefully position it so that it is at the point of maximum
inten s ity. Record the pixel number that is di s p layed in the status bar. Repeat this s tep for all of th e
peaks in your spectrum.
3. Using your spreadsheet, create a table like the one sh own bel ow. In the first column , p lace the exa ct
wavelength of the spectral lines that you used. In the second colu mn of this wor ksheet, pla ce the
observed pixel number. In the third column, place the pixel number squared.
Independent Dependent Values computed from
Variable Variables the regression output
TRUE
Wavelength (nm)
253.65
296.73
302.15
313.16
334.15
365.01
404.66
435.84
546.08
696.54
706.72
727.29
738.40
750.39
Pixel # Pixel #
105
179
188
206
243
298
368
423
626
921
942
984
1007
1033
11025
32041
35344
42436
59049
88804
135424
178929
391876
848241
887364
968256
1014049
1067089
2
Predicted
Wavelength
253.516577
296.979662
302.220703
312.6735
334.037188
365.489132
404.991651
435.615094
545.48766
696.302678
706.638812
727.151647
738.294786
750.814613
Difference
0.133422619
-0.249662049
-0.070702657
0.486499891
0.112812248
-0.479132164
-0.331651335
0.224905808
0.592339659
0.237321917
0.081187518
0.138352544
0.105214107
-0.424612735
4. Now you are ready to calcu late the wa vel ength calibrati on coefficients. In your s preadsheet program,
find the functions to perform linear regressions:
• in Q uattr o P ro, l ook unde r
• in Excel, look under
Tools | Advanced Ma th
Tools | Data A n alysis
5. Select t he true wavel ength a s the dependen t variable (Y ) . S elect BOTH the pixel nu mber and pixel
number squared as the independent variables (X). After you execute the regression , an output similar
to the one shown be low is obtained.
Regression Statistics
Multiple R 0.999998327
R Square 0.999996654
Adjusted R Square 0.999996096
Standard Error 0.371756477
Observations 15
intercept
Coefficients Standard Error
Intercept 190.713498 0.369047536
X Variable 1 0.604451305 0.001684745
X Variable 2 -6.02547E-05 1.41503E-06
second coefficient
18
first coefficient
Page 22

6. You will need to record the Intercept as well as the First and Second Coefficients. Also, look at the
value for R s quared. It shoul d be very close t o 1. If it is not, you have probably assi gned one or more
spectral lines incorrectly.
7. Select the menu option
Spectrometer | Configure | Wavelength Calibration
to update the
wavelength coefficients within O O I Ba s e3 2.
8. Repeat this pr ocess for each channel in your spectrometer.
Spectral Output
Mercury emission lines are <600 nm.
Argon emissi on lines are >600 nm,
and are shown here on the right on an
exaggerated amplitude scale. Below is
a list of th e most p rominent mercur y
and argon peaks.
Mercury Lines
253.65
296.73
302.15
313.16
334.15
365.01
404.66
435.84
546.08
576.96
579.07
Argon Lines
696.54
738.40
750.39
763.51
772.40
794.82
800.62
811.53
826.45
842.46
912.30
4500
4000
3500
3000
2500
2000
1500
Ar bi t rary I nt e ns i t y
1000
500
0
200 400 600 800 1000
Wavelength (nm)
Specifications
Output:
Spectral range: 253-922 nm
Dimensions:
Power requirements: 12 VDC wall transformer (comes with unit) or 9 VDC battery
Internal voltage: 600 volts at 30 kHz
Bulb life: ~3,500 hours
Amplitude stabilization: ~1 minute
Apertu re: 3 mm
Connector: SMA 905
low-pressure gas discharge lines of Mercury and Argon
11.4 cm x 6.98 cm x 2.54 cm (LW H), 4.5
”
x 6.98” x 1.0” (LWH)
19
Page 23

Light Sources: LS-1-CAL Calibrated Light Source
!
LS-1-CAL C
The
with known absolute intensity values at several wavelengths, expressed in
intensity of the LS-1-CAL can be traced to an intensity standard provided by National Institute of Standards
and Technology (NIST), it can be used in measuring absolute spectral intensities. This lamp has a highly
Lambertian internal diffuser, and its 900-hour bulb has a 3100K color temperature.
• LS-1 -CAL T ungs ten Halogen L ight S ource
• Switching AC adapter for stabilizing power
• Power cord for supplying power to the power supply
• Two Lamp Ca libration repor ts; one for usi ng a bare fiber and one for u sing a CC-3 cos ine-corr e c ted
irradia nce probe
• A disk that holds files for both calibration reports
• Allen wrench for adjusting the collimating lens
ALIBRATED LIGHT SOURCE
for the VIS-Shortwave NIR (300-1050 nm) provides the user
µ
W/cm
2
. Since the spectral
/nm
Parts I nc luded
Caution!
The LS-1 -CAL becomes
DO NOT insert flammable materials in the filter slot. The materials could melt or ignite.
The LS-1 -CAL is not des igned as an illuminati on sou rce for abs orbance, transmission or r efl ection
""""
measurements. The LS-1 Tungsten Halogen Light Source should be used for those applications.
HOT
during operation. Handle with care.
Setting Up
Before beginning, make sure you have your LS-1-CAL, your spectrometer, an SMA-terminated optical
fiber or CC-3 cosine corrected irradiance probe, and Ocean Op tics OOIIrrad softwar e. (If you have an
IRRAD2000 spectroradiometric system, use a 200
setup -- one that is highly sensitive, for example -- you may not be able to use the LS-1-CAL as a
cal ibrat ion s ource. )
µ
m or s maller fiber. If you have a nother spe c t rometer
Calibration
1. Plug th e s witching AC ad ap ter (the black rectan g le-shap ed box) into the ba ck of the LS-1- C A L. The
adapt er stabilizes the power coming into the lamp to in s ure constant spectral intensity.
2. Plug the other end into the back of the switching AC adapter. Plug the wall transformer end of the
power cord into a standard 110V outlet.
3. Take off the fiber cover and screw a fiber all the way into the SMA connector.
Whatever optical setup you wish to use for your application, you must also use for your calibration.
For examp le, if you use a 200 µm fiber with a CC -3 cosine c orrec ted irradi ance probe for your
application, you must use the same 200 µm fiber and CC-3 for your calibration.
4. Find the on/off switch on the back of the lamp and turn the lamp on.
5. Let the lamp warm up for 1 5 minutes.
6. Insert the disk that came with your lamp. The disk contains two ASCII files. These files have the same
information as the Lamp Calibration reports that came with your LS-1-CAL. One file has the
cali bration numbers for calibrating the lamp with a bare fiber; its name con tains the lamp’s serial
20
Page 24

number, followed by
CC-3 cosine-corrector an d fiber; its nam e contains th e lamp’s seria l n umber, follow ed b y
FIB.LMP
. The second file has the calibration numbers when calibrating with a
CC3.LMP
.
7. Copy these two files into your OOIIrrad directory.
8. Start OOIIrrad by selecting
9. Under the
Lamp
menu options, choose
Start | Programs | OOIIrrad | OOIIrrad
Select Lamp
. A window opens in which you must ch oose the
.
Lamp Calibration report file that reflects your optical setup.
10. Under the Spectrometer menu function, choose
Configure Fibers
. Enter th e fi ber diameter values for
each channel in your setup. If using a bare fiber, enter
the fiber’s diamet er here . If using a fiber with a CC-3
cosine corrector, enter 3, 900. Whatever optical set u p
you wish to use for your application, you must also use
for your calibra tion. For example, if you are going to
use a 200
your application, you must use the same 200
µ
m fiber with a CC-3 cosine corrector for
µ
m fiber
and th e same cosine cor rector for your calibration.
11. To the right of the di splayed spect rum, enter the
parameters for your setup next to
Smoothing Size
Integration Period (ms)
, and
Scans to Avg
,
.
• Scans to Avg: Enter a value to implement a
sample averaging function that averages x number
of spectra. The higher the val ue, the bett er the
Signal-to-Noise.
• Smooth ing Size: Enter a value to implemen t a smoothing technique that averages across s p ectral
data. A value of 5, for example, averages each data point with 5 points to its left and 5 points to its
righ t. The great er th is value, the smoother the data and th e higher the S:N. However , if the value is
too high, a loss in spectral resolution will result.
• Integration Period (ms): Enter a time in milliseconds to regulate the amount of time the detector
“looks” at the incoming photons. If your Scope Mode intensity is too low, increase this value. If
the int ensity is t oo hi gh, decrease the valu e. While watching the gra ph tr ace, adjust the integration
time until the signal intensity level is approximately 3500 counts.
12. Under
Spectrometer
menu options, choose
Calibrate
and then the channel you are calibratin g.
13. A dialog box opens with the message “Verify lamp was ON for at least 15 minutes for a REFERENCE
scan.” Click OK. You have just taken your reference measurement.
14. Anoth er di alog box open s with the messag e “Bl ock light pat h to spectr om eter for a DARK scan.”
Before clicking OK, be sure to block the light path by inserting an opaque object into the lamp’s filter
slot. Do not turn the lamp off. Click OK.
15. The spectromete r is no w calibrated .
Specifications
Spectral range (calibrated): 360-1050 nm
Dimensions:
Power input: 12 VDC/800 mA (regulated)
Power output: 6.5 watts
Bulb life: 900 hours (recalibrate after ~50 hours of use)
Bulb color temperature: 3100K
Out put to bulb: 5 volts/1.3 amps
Output regulation: 0.2% voltage
Time to stabilized output: ~30 minutes
Connector: SMA 905
9.0 cm x 5.0 cm x 3.2 cm (LWH); 3 . 5
21
”
x 2.0” x 1.25” (LWH)
Page 25

Sampling Chambers
Ocean Optics offers a comprehensive line of compact, low-cost sampling chambers for a variety of UVVIS-Shortwave NIR applications. All sampling chambers have SMA terminations for easy coupling to
optica l fibers. Op tions incl u d e a variety of cuvet te holders for 1-cm an d 10 -cm cuvettes, in-lin e fi lter
holders, flow cel ls, a nd oth e r samp l i ng devices.
Stan dard cuvett e h ol d ers are avail able for 1- cm an d 10-cm cuvett es ,
and coup le via SMA-terminat ed op tical fibers to our sp ectrometers
and li gh t s ources to cr eate small- fo ot p rint systems for a bsorbance
experiments. Each cuvette holder comes with a pair of 5-mm diameter
f/2 collimating lenses optimized for UV-VIS-NIR or VIS-NIR
applications, and has a slot for optical filters. Also available is the
CUV-FL-DA, a 1-cm cuvette holder that attaches directly to
light sources.
The CUV-ALL
couplings at four collimators -- a pair of 5-mm diameter f/2 collimating
lenses optimized for the UV-VIS and a pair optimized for the VIS-NIR.
Opti cal fibers can be attach ed a t these collimators to read or illuminate
the sample. When combined with our spectrometers and light sources,
the CUV-A LL can measure absorbance, flu orescence, s catterin g , or any
combin ation of th ese op tical ph enomena.
ISS Integrated Sampling System consists of a compact tungsten-halogen light
source with integrated cuvette holder for 1-cm cuvettes. This versatile sampling
device coup les to our miniature spectrom eters via op tical fibers to create fully
integrated, small-footprint sampling systems for VIS-NIR absorbance and
tran sm ission meas urements . The ISS is designed speci ally for use with
S1024DW Spectrometers.
FHS In-Line Filter Holders for the UV-VIS-NIR or VIS-NIR
provid e a convenien t platform for rapid absorbance or transmission
measurements of optical and other filters. Filter holders come with a
pair of 5-mm diameter collimating lenses, and accept 1” round or
any size square optical filters, up to 6 mm in thickness. FHS
assemblies are typically used either to measure filters or to put
filters into optical setups.
is a cuvette holder for 1-cm cuvettes that has fiber optic
LPC Long Pass Flow Cells couple to our fiber optic spectrometers and
compact light sources to measure low-concentration (ppb-ppt) aqueous
samples. LPC Flow Cells are available in 1-meter, 5-meter and 10-meter
path lengths for absorbance measurements, and in a 1-meter path length
with built-in 365-nm excitation source for fluorescence measurements.
Each assembly has 560 µm inner-diameter Teflo n tubing with an internal
volume of 250 µl/meter, and will function with most liquids having a
refractive index >1.30.
22
Page 26

Sampling Chambers: CUV-VIS, CUV-UV Cuvette Holders
CUV-VIS
The
optical fibers to our s pectr ometers an d light sourc e s to create small- footpr i nt spe c trophotom e tric s ystems for
absorbance and transmission experiments. These holders can be optimized for VIS-NIR (~360-1100 nm) or
UV-VIS-NIR (~200-1100 nm) applications.
CUV-UV C
and
UVETTE HOLDERS
for 1 -cm path length cuvettes couple via SM A - terminat ed
Parts I nc luded
• Cuvette holder assembly for holding 1-cm cuvettes
• Black co ver for eli minating ambient light
• Two barbed fittings for connecting a temperature stabilizing water source
• Screwdriver for adjusting the fit of the cuvette
• Allen wrench for adjusting the collimating lenses
Operation
Attaching the Fibers
1. Attach one end of a SMA-terminated optical fiber to one of the collimating lenses. Attach the other end
of this fiber – the illumination fiber – to a light source.
2. Attach another SMA-terminated optical fiber to the other collimating lens. Attach the other end of this
fiber – the read fiber – to the spectrometer.
Using the Fiber Supports
1. Snap th e clamps around the fiber s after the fibers are scr ewed into th e li ght source and spectr om eter.
2. Lift the clamps until they support the fibers.
3. Unsna p th e clamps to rem ove the fibers.
Installing Filters
1. Loosen the filter clamping screw with the provided screwdriver.
2. Insert the filter into the filter slot. The filter slot can accommodate filters up to 6 mm thick.
3. Clamp the filter in pl ace by gently tightening the cla mp ing screw finger-ti gh t.
Adjusting the Fit of the Cuvette
The Cuvette Holder is designed to hold 1-cm square cuvettes. When properly adjusted, the cuvette should
fit snugly into the holder.
1. Loca te th e two ball plunger s crews.
2. Remove t he fiber cla mps for easi er access to the screws.
3. Use t he provided s c rewdriver to loosen the two ba ll plunger screws until the ball end of th e s crews is
just visible in the cell holder and insert your cuvette into the holder.
4. Tighten the ball plunger screws until the ball contacts the cuvette and starts to compress. Do not
over-tighten.
Using the Temperature Stabilization Feature
This feature is used to heat or cool the cuvette holder base and cuvette.
1. Remove the plugs from the top side of the base. (The plug on the right side of the base should stay in
place but may require thread tape.)
2. Replace the plugs with the two barbed fittings (or any 1/8” NPT pipe thread fittings). Thread tape may
be required on the fittings to prevent leakage.
3. Connect the fittings to a water source. Water will circulate through the base.
23
Page 27

Specifications
Path length: 1 cm
Collimating lenses (VIS-NIR): BK 7 glass, 5 mm diameter, f/2
Collimating lenses (UV-VIS-NIR): Dynasil quartz, 5 mm diameter, f/2
Collimating lens termination: SMA 905
Collimating lenses assembl y (sam ple
compartment) dimensi ons:
Filter slot:
Base ma terial: aluminum
Base length:
Connections in base:
Water input fittings:
Typical optical fibers specified for optimum
performance (light throughput and optical
resolution)**:
* Though the VIS-NIR lens is optimized for use to 2 µm, it can b e confi gured to “see” only to 1100 nm
with our S1024DW spectrometer.
** For all intents, there is no single combination of optical fibers that will satisfy the requirements of
every application. As a rule, however, it is best to use a large-diameter (>50 µm) illumination fiber to
get the maximum light throughput, and a small-diameter (<50 µm) read fiber to achieve the best
optic al reso lution.
”
x 1.5” (LW)
2.0
accepts filters up to ¼
”
5.5
•
water inlet
•
water outlet
•
extra connection
”
NPT pipe thread
1/8
•
200 µm illumination fiber
•
50 µm read fiber
”
(6 mm) in th i c kn ess
24
Page 28

Sampling Chambers: CUV-VIS-10, CUV-UV-10 Cuvette Holders
CUV-VIS-10
The
and li gh t s ources to cr eate spectrophotomet ric system s for absorba nce and transmission measurements of
aqueous solutions and gases for VIS-NIR (~360-1100 nm) or UV-VIS-NIR (~200-1100 nm) applications.
CUV-UV-10 C
and
UVETTE HOLDERS
for 10-cm cuvettes couple to our spectrometers
Parts I nc luded
• Cuvette Holder assembly for holding 10-cm cuvettes
• Black C over for eli minatin g am bient light
• Two Bar bed F itting s for connecting a temperature stabilizing wa t er source
• Screwdriver for adjusting the fit of the cuvette
• Allen wrench for adjusting collimating lenses
Operation
Attaching the Fibers
1. Attach one end of a SMA-terminated optical fiber to one of the collimating lenses. Attach the other end
of this fiber -- the illumination fiber -- to a light source.
2. Attach another SMA-terminated optical fiber to the second collimating lens. Attach the other end of
this fiber -- the read fiber -- to the spectrometer.
Using the Fiber Supports
1. Snap th e clamps around the fiber s after the fibers are scr ewed into th e li ght source and spectr om eter.
2. Lift the clamps until they support the fibers. To remove the fibers, simply unsnap the clamps.
Installing Filters
1. Tighten the thumb wheel completely when not using a filter.
2. Loosen the thumb wheel on the left side of the cuvette holder, creating enough space for the filter.
3. Insert the filter into the filter slot, which can hold filters up to 6 mm thick, and tighten the thumb wheel.
Using the Temperature Stabilization Feature
This feature is used to heat or cool the cuvette holder base and cuvette.
1. Remove the two pl ugs from the top sid e of the ba s e . (The plug on the r ight side of the base s hould sta y
in pla ce bu t may require thread ta p e.)
2. Replace the plugs with the two barbed fittings (or any 1/8” NPT Pipe thread fittings). Thread tape may
be required on the fittings to prevent leakage.
3. Connect the fittings to a water source. Water will circulate through the base.
Specifications
Collimating lenses (VIS-NIR): BK 7 glass, 5 mm diameter
Collimating lenses (UV-VIS-NIR): Dynasil 1100 quartz, 5 mm diameter
Base material and length:
Water input fittings:
Aluminum, 5.5
”
1/8
NPT pipe thread
”
25
Page 29

Sampling Chambers: CUV-ALL 4-way Cuvette Holder
CUV-ALL 4-W
The
couple t o opt ical fibers, light sources, and spectr om eters to mea s ure absorbance, fluorescence, scatterin g, or
any combination of these optical phenomena.
• CUV-ALL assembly for holding 1-cm cuvettes
• Black C over for eli minatin g am bient light
• Two Bar bed F itting s for connecting a temperature stabilizing wa t er source
• Screwdriver for adjusting the fit of the cuvette
• Allen wrench for adjusting the collimating lenses
AY CUVETTE HOLDER
Attaching the Fibers for Absorbance Measurements
1. For UV measurements, attach one end of a SMA-terminated optical fiber to one of the collimating
lenses wit h a red lens cap. At t ach the ot her end of th is fiber to a UV light sourc e . Attach an ot her SMAterminated optical fiber to the collimating lens directly opposite of the first fiber. It too has a red lens
cover . A ttach the other end of this fiber to the spectrom eter.
2. For VIS measurements, attach one end of a SMA-terminated optical fiber to one of the collimating
lenses wit h a black lens cover . Att ach th e other end of this fiber to a l ight s ource . A ttach anoth er SMAterminated optical fiber to the collimating lens directly opposite of the first fiber. It too will have a
black lens cover. Attach the other end of th is fiber to the spectrom eter.
for 1-cm path length cuvettes has four collimating lenses that
Parts I nc luded
Operation
Attaching the Fibers for Fluorescence Measurements
1. Attach one end of a SMA-terminated optical fiber to one of the collimating lenses. Attach the other end
of this fiber to a light or excitation source. Typically, for fluorescence measurements, the illumination
fiber connects t o a UV lens.
2. Attach another SMA-terminated optical fiber to the collimating lens to the immediate left or right of
the first fiber. The two collimators must be positioned at 90° for fluorescence measurements. Attach
the other end of thi s fi ber to the spectrometer. Typically, for fluorescence measurem ents, the read fiber
conn ects to a VIS lens.
Using the Fiber Supports
1. Snap th e clamps around the fiber s after the fibers are scr ewed into th e li ght source and spectr om eter.
2. Lift the clamps until they support the fibers.
3. Unsna p th e clamps to rem ove the fibers.
Adjusting the Fit of the Cuvette
The CUV-A LL is preset for use with a 1 - cm qu ar tz cuvette. When properly adjust ed, the cuvet te shoul d fit
snugly in the holder.
1. Locate the two ball plunger screws. They are under two of the four collimating lenses.
2. Remove t he fiber cla mps for easi er access to the screws.
3. Use t he provided s c rewdriver to loosen the two ba ll plunger screws until the ball end of th e s crews is
just visible in the cell holder.
4. Insert your cuvette into the holder.
5. Tighten the ball plunger screws until the ball contacts the cuvette and starts to compress. Do not
over-tighten.
26
Page 30

Installing Filters
1. Loosen the filter clamping screw with the provided screwdriver.
2. Insert the filter into the filter slot. The filter slot can accommodate filters up to 6 mm thick.
3. Clamp the filter in pl ace by gently tightening the cla mp ing screw finger-ti gh t.
Using the Temperature Stabilization Feature
This feature is used to heat or cool the cuvette holder base and cuvette.
1. Remove the two pl ugs from the top sid e of the ba s e . (The plug on the r ight side of the base s hould sta y
in place but might require thread tape.)
2. Replace the plugs with the two barbed fittings (or any 1/8” NPT pipe thread fittings). Thread tape
might be required on the fittings to prevent leakage.
3. Connect the fittings to a water source. Water will circulate through the base.
Specifications
Path length: 1 cm
Collimating lenses (VIS-NIR): (2) BK 7 glass, 5 mm diam eter, f/2
Collimating lenses (UV-VIS-NIR): (2) Dynasil 1100 quartz, 5 mm diameter, f/2
Collimating lens termination: SMA 905
Filter slot:
Base ma terial: aluminum
Water input fittings:
accepts filters up to ¼
”
1/8
NPT pipe thread
”
(6 mm) in thickness
27
Page 31

Sampling Chambers: CUV-FL-DA Direct Attach Cuvette Holder
CUV-FL-DA C
The
termin ated opti cal fibers t o our spectrometer s, cr eating an incredibl y small-footp rint spect rophotometri c
system f or fluores cence as well as absorbance experi ments. The C UV- F L- DA , optimized for UV-VIS - N I R
(200-1100 nm) applications, holds 1-cm square cuvettes.
The CUV-F L- DA is especia lly useful for fluorescence measu rements. Mirrored screw plug s have been
incor p orated into the CUV-FL-DA to make th e fl u orescence signal stronger. These mirrors are UVenhanced alumin um-coat ed for optimal signal reflection. One mirrored screw plug col lects th e fl u orescence
that woul d otherwi se be lost. The second scr ew plug works to reflect the excitation energ y back through the
sample. The increase in signal intensity is also a result of the direct attachment of the CUV-FL-DA to the
light source.
The CUV-FL-DA has a 74-UV collimating lens to collect the light and funnel it to the fiber. Collection
efficiency, spa tial resol ution, transmission angle, an d accep tance (or collection) angl e are adjusta ble and
are easily optimized. The CUV-FL-DA is packaged with the collimating lens screwed on at a 90° angle
from the light source for fluorescence measurements. However, th e len s is removable a nd can be rel oca ted
for “straight- through” absorbance m easurements.
UVETTE HOLDER
Using with the D-1000 and DT-1000
To attach the CUV-FL-DA to the D-1000 or the DT-1000 the safety shutter must first be removed.
1. Use a Phillips-head screwdriver to remove all 12 screws from the side panels of the D-1000 or DT-1000
casing.
2. Remove t he screws secu ring the s afety shutter in pla ce.
3. The collimating lens for the lamp must also be removed. Using the Allen wrench, remove the small
silver screw on the inner barrel of the lens and pull out the lens.
4. Place the CUV-FL-DA o ver the SMA t er mination an d secu re the holder to the lamp by gently
tightening the set screw on the CUV-FL-DA.
Do not
remove any screws from the front, back, or bottom panels. Remove the cover.
att aches dir ectly to our li gh t sources an d cou p les via SMA-
Operation
Adjusting the Fit of the Cuvette
The CUV-F L- DA is preset for use with a 1-cm cuvette. When properly adjust ed , the cuvett e should fit
snugly in the holder.
1. Visua lly check that the mirr ored screws are flush with the ins id e of t he holder (of c ourse th e cu vet te is
absent). If necessary, ad ju s t the mirrored screws so that they are flush with the insid e of the holder.
2. Loca te th e two ball plunger s crews.
3. Loos e n th e t wo ball plung er screws until the ball end of th e s crews is j ust vi s ible in the c ell hol der.
4. Insert your cuvette into the holder.
5. Tighten the ball plunger screws until the ball contacts the cuvette. Do not over-tighten.
Installing Filters
1. Loosen the filter clamping screw with a screwdriver.
2. Insert the filter into the filter slot. The filter slot can accommodate filters up to 6 mm thick.
3. Clamp the filter with the scr ewdr iver.
28
Page 32

Specifications
Path length: 1 cm
Dimensions:
Material: Black anodized aluminum
Hole diameter for mounting to light source:
Collimating lens: Dynasil 1100 quartz (200-1000 nm), 5 mm diameter
Collimating lens termination: SMA 905
Filter slot:
Reflection mirrors:
Mirror diameter:
Size of light beam reaching sample:
”
1.4
x 1.4” x 1.0” (L x W x H)
”
0.375
accepts filters up to ¼
UV-enhanced, aluminum-coated for optimal signal reflection
and collection
”
0.3
(7.5 mm)
”
¼
minimum divergent
”
(6 mm) in thickness
29
Page 33

Sampling Chambers: ISS Integrated Sampling System
I
The
NTEGRATED SAMPLING SYSTEM
source. It couples to a spectrometer with optical fiber to cr eate a small- footprint system for VI S - N I R
(~360-1100 nm). The ISS has a 10,000-hour bulb.
• ISS cuvette holder and light source assembly
• 12VDC wal l trans former for provid ing pow er
• 1-cm square, plastic cuvette for holding samples
• Screwdriver for adjusting the fit of the cuvette
• Allen wrench for adjusting the collimating lens
Attaching the Fibers
1. Attach a SMA-terminated optical fiber to the collimating lens.
2. Attach the other end of this fiber -- the read fiber -- to the spectrometer.
Adjusting the Fit of the Cuvette
The ISS is preset for u s e wi th a 1 - cm cuvette. When properly adjust ed , the cuvett e should fit sn ugly into
the holder.
1. Loca te th e two ball plunger s crews.
2. Use th e s cr ewdriver to l oosen the two bal l plunger screws until the ends are visible in the holder.
3. Insert your cuvette into the holder.
4. Tighten the screws until the ball contacts the cuvette and starts to compress. Do not over-tighten.
is a fully integrated 1-cm cuvette holder and tungsten halogen light
Parts I nc luded
Operation
Installing Filters
1. Loosen the filter clamping screw with an Allen wrench.
2. Insert the filter into the filter slot. The filter slot can accommodate filters up to 6 mm thick.
3. Clamp the filter in place by gently tighten ing with an Allen wren ch.
Turning On the Lamp
1. Plug the wall transformer end into a 110 V outlet. Plug the 12 V output end into the back of your ISS.
2 Screw a fiber in to the SMA connector.
3 Find the on/off switch on the back of the lamp and turn the lamp on.
Replacing the Bulb on the ISS
1. Order a replacement bulb.
2. Turn off the lamp and allow it to cool.
3. Use your Allen wrench to loosen the set screw on the bottom of the lamp. You do not need to remove
the set screw. This screw h old s the bulb in place.
4. Locate the two set screws at the ba ck of t he lamp, one above each ba ck leg. These two screws keep t he
two halves of the lamp together. Remove the two screws.
5. Gently separate the two halves of the lamp and pull the bulb out of its housing.
6. Detach the wire and sock et from the lamp leads. Rem ove bulb unit and discard.
7. Plug the new bulb into the socket and slide it forward into the front of the lamp as far as it will go.
8. Tighten the set screw on the bottom of the lamp.
9. Close the two halves without pinching the wires. Rep lace the two scr ews at the ba ck of t he lamp.
30
Page 34

Specifications
Path length: 1 cm
Collimating lens: BK 7 glass ( ~360 nm - 2 um*), 5 mm di ameter, f/2
Collimating lens termination: SMA 905
Filter slot:
Base ma terial: alumin um
Spectral range: 360 nm - 2 um*
Dimensions:
Power input: 12 VDC/800 mA, 7-20 VDC/0.5-2 amps
Power output: 6.5 watts
Bulb life: 10,000 hours
Bulb color temperature: 2800K
Out put to bulb: 5 vol t s/1. 3 amps
Output regulation: 0.2% voltage
Time to stabilized output: ~ 30 minutes
Bulb output: 7400 foot-candles (7.4MSCP)
accepts filters up to ¼
9.0 cm x 5.0 cm x 3.2 cm (LWH)
”
3.5
x 2.0” x 1.25” (LWH)
”
(6 mm) in thickness
* The useable range of each ISS sampling device is limited to the wavelength range of the
spectrometer to which it is coupled -- i.e., though ISS lenses are optimized for use to 2
be configured to “see” only to 1100 nm with our spectrometers.
µ
m, they can
31
Page 35

Sampling Chambers: FHS In-line Filter Holders
FHS-VIS
The
fast, convenient absorbance/transmission measurements of optical and other filters. Optimized for VISShortwave NIR (~360-1000 nm) or UV-VIS-Shortwave NIR (200-1100 nm) measurements, each holder
has a pair of 5-mm diameter f/2 collimating lenses to maximize light throughput, and comes with a manual
light-block wheel for taking dark readings.
The FHS In-line Filter Holder accepts 1” r ound or any size > 1/ 2” square opt ical filters, up to ¼” (6 mm) in
thickness. Plastic supports hold SMA-terminated fibers steady during use. The light that passes through the
filter is collimated. This process makes it possible to measure either glass or interference filters.
and
FHS-UV I
N-LINE FILTER HOLDERS
are low-c ost spect rophotometric acces sories for
Operation
Installing Filters
1. Loosen the filter thumb wheel on the left side of the filter holder to create enough space for the filter
you wi s h to use.
2. If the filter is round, place it in the filter slot.
3. If the filter is square, place it in the filter slot at a 45° angle, s o the filter is in the beam path.
4. Clamp the filter in pl ace by tightening the th u mb wheel.
5. When fi lters are n ot bei ng used in the holder, tighten the th umb wheel com p letely.
Using the Fiber Supports
1. Snap th e clamps around the fiber s after the fibers are scr ewed into th e li ght source and spectr om eter.
2. Lift the clamps until they support the fibers.
3. Unsna p th e clamps to rem ove the fibers.
Using the Shutter
Use the shutter to take dark readings.
• The shutter is in the OPEN position when the knurled light-block wheel shows a scored depression
(shown ope n on the drawing) .
• The shutter is in the CLOSED position when the light-block wheel is rotated so only the knurling
shows (the wheel will lock into this position with a positive action).
32
Page 36

Specifications
BK 7 glass (~360 nm - 2 µm*)
FHS-VIS Collimati n g lenses (VI S-NIR):
FHS-UV Collimati ng lenses (UV- VIS- NIR):
Collimating lens termination: SMA 905
Filter slot:
Base ma terial: alumin um
* The useable range of the filter holder is limited to the wavelength range of the Ocean Optics
spectrometer to which it is coupled -- i.e., though the lens is optimized for use to 2 µm, it can be
con figured t o “see” only to 1100 nm with our spectrometer.
5 mm diameter
f/2
Dynasil 1100 quartz (~200-1000 nm)
5 mm diameter
f/2
accepts filters 1” round or any size >1/2” square,
up to 1/4” (6 mm) in thickness
33
Page 37

Sampling Chambers: LPC Long Pass Flow Cells
LPC L
The
sources via SMA terminations for simple, efficient measurement of low-volume or low-concentration
(ppb-ppt) aqueous samples. LPC Flow Cells are available in 1-meter, 5-meter and 10-meter path lengths
for absorbance measurements. The Flow Cells will function with most liquids (one exception:
perfluorinated solvents) having a refractive index >1.30.
!
!
!
""""
""""
""""
ONG PASS FLOW CELLS
DO NOT USE PERFLUORINATED SOLVENTS WITH THE LPC BECAUSE THE AMORPHOUS
FLUOROPOLYMER TUBING IS SOLUBLE IN THESE CHEMICALS.
DO NOT ex ceed a fluid pressure of 45psi.
LPC Flow Cells will function with most liquids (one exception: perfluorinated solvents) having a
refractive index >1.30.
Ens ure the plum bi ng fi t tings t hrough the front pa nel are tigh t an d free of le aks.
Minimize the injection of bubbles into the LPC since they will cause erratic results. Continuous
pumping will typically flush the bubbles through the system.
At th e en d of each experimental s ess ion, flush the system wit h solven t and then p um p dry. Avoid
leaving fluid in the LPC for extended periods of time.
from O cean Optics cou p le to our spectromet ers and compact light
Caution!
Operation
Using the Plumbing Connections
On the fr ont panel, there are t wo pl u mbing feed-through ports. It does n ot matter which one is used for the
plumbing input or the plumbing output. However, for experimental consistency, once you have assigned
which fitting will be the plumbing input and which one will be the plumbing output, try not to switch the
plumbing configuration. The tubing goes over the plumbing fittings, which are standard ¼-28 threads. The
tubing should fit snugly over the fittings and be free of leaks.
• Attach one end of the tubing to your pump. The pump used must not pump the solution so fast that
the flu id pressure exceeds 45psi. Remember to always turn off the pump in-between taking a
refer ence and taking sample measuremen ts. Make sur e you have a proper was te recepta cle for the
other end of the t ubing .
• The plumbing connections inside the LPC are standard industry fittings. No maintenance should be
required. However, if leaks develop, the plumbing connections will need to be tightened. To tighten
the connections, first remove the back panel. Carefully slide off the top cover, being
damage or pinch the tubing or fiber. Hand-tighten the fittings and reassemble the cover and back panel.
Installing Fibers
On the fr ont panel, there are t wo fiber feed-th rough por ts. It does not matter which one is used for th e fiber
input or the fiber output. However, for e xperiment al con s istency, once you have assigned which fi be r por t
will be the input and which one will be the output, try not to switch the fiber configuration. The fiber inside
the LPC has a core diameter of 200
coupli ng efficiency.
• Attach one end of a n ill uminat ion fiber to a port on the LPC and the othe r end to your light s ource.
• Atta ch one end of a read fi ber to the secon d port on the LP C an d the other en d t o your spectr om eter.
µ
m. External coupling fibers should be 200 µm or larger for maximum
careful
not to
34
Page 38

Assessing if the LPC is Free of Particles
Fluids need to be relatively particle-free. Particles larger than 20 µm can be trapped inside the tubing and
can then block or scatter a significant amount of light. To rid the LPC of particles, follow these steps:
1. Pump the sample fluid through the LPC.
2. While in Scope Mode, save a dark spectrum with the light source off and a reference spectrum with th e
light source on.
3. Continue to pump the sample fluid and switch to the Absorbance Mode. Ideally, you should see a
spectrally flat line. Par ticle effects manifest themselves as an exp onential ly decreasing curve fr om shorter
to longer wavelengths. The length of time that you pump the sample and the magnitude of the absorbance
peak depends upon the time required and the minimum detectable absorbance value for your specific
analyses. Pre-filtering of the sample may be required to eliminate this exponentially decreasing
absorbance spectrum if it is significant to your analyses.
Specifications
Path lengths:
Tubing:
Refractive index: 1.29
Internal volume:
Chemical resistance:
Recommended optical fibers for coup ling to
spectrometers, light sources:
Plumbing fittings: standard ¼” x 28 chromatography fittings
1-meter, 5-meter and 10-meter options (standard);
custom lengths also available
•
Teflon Amorphous Fluoropolymer 2400
•
~560 µm in ner diamet er, ~8 00 µm outer diam et er
250 µl/meter
tubing can be altered by perfluorinated solvents,
FREON 113, and Perclene
•
400 µm illumination fiber (UV-VIS)
•
200 µm or 400 µm read fiber (UV-VIS)
35
Page 39

Sampling Optics
Ocean Optics offers n u merous spect roscopic accessor ies. A short descripti on of those access ories featured
in this manual is listed below.
• The 74 - UV an d 7 4- V I S C ol limating Lenses scr ew on to the end of SMA-terminated optical fibers and
other sampling optics to convert divergent beams of radiation (light) into a parallel beam.
• The 74-UV-90 Reflector for collimating lenses has a mirror located under its cap that reflects light
from the collimating lens to 90°.
• The 74-OPM Optical Post Mount is a 3/8-24 threaded black anodized aluminum assembly used for
mounting collimating lenses on breadboard laboratory tables, rail carriers and other bench plates.
• The 74-ACH Adjustable Collimating Lens Holder is a versatile assembly for mounting lenses at
multiple positions, and is especially useful for large or thick samples.
• FVA-UV Fiber Optic Variable Attenuator decreases the magnitude of light entering the optical bench.
• The WS-1 Di ffuse Reflect ance Standard is a com p act physical standar d for u s e in p erforming di ffuse
reflect ance meas urements , especially color ana lysis.
• The ISP-REF Integrating Sphere is an illuminated sampling optic that couples via optical fiber to our
spectrometer s to m easure refl ect ance of soli d ob jects or emission of spectral s ources.
Sampling Optics: 74-UV and 74-VIS Collimating Lenses
74-UV
The
other sampling optics to convert divergent beams of radiation (light) into a parallel beam. In order to
obtain accurate data, the light entering the sample and the light collected after exiting the sample must be
well collimated.
and
74-VIS C
OLLIMATING LENSES
scr ew on t o t he end of SMA-terminat ed optical fibers and
Applic at ion Tips
• Using a collimating lens is easy. Screw a collimating lens onto the end of any SMA-terminated port to
collect, shape, or focus light.
• Collimating lenses are useful for any optical setup that requires the acceptance or transmission of
parallel beams of light at either the illumination source or at the entrance optics -- or at both ends
(illu mination an d read) of the s etup. That's importan t because th e op tical fibers Ocean Optics speci fi es
for use with its spectrometers and light sources have a field of view (FOV) of ~25° -- an acceptance
angl e that may not be ap propriat e for some experiment s. C ol limating l enses are adjustable, providing
FOV angl es from collimation (near 0°) to ~45°. Without the collimating lenses, the light would
disperse more than is required for efficient transmissi on an d col l ection of the signal.
• For directions on adjusting the focus of a collimating lens, see
Appendix A
.
Specifications
Lens diameter: 5 mm
Lens length: 10 mm
f-number: f/2
74-UV materia l :
74-VIS material:
Lens barrel: stainless steel with black oxide finish
Threads: 3/8-24
Dynasil 1100 quartz (200 nm – 1. 5 µm)
BK 7 glass (360 nm - 2 µm)
36
Page 40

Sampling Optics: 74-UV-90 Right Angle Reflector
74-90-UV R
The
mounting collimating lenses at right angles, and is useful for applications involving limited space and
incon venient optical fiber r ou ting.
• The 74 - 90 - UV Rig ht Angle Reflector has a plane mirror located under its cap that reflects light from
the collimating lens to 90°. This mirror is coated with a UV-enhanced aluminum substrate that is >90%
reflective from 200-1100 nm.
• The 74-UV-90 has two 3/8-24 threaded ports -- at top and bottom -- that accommodate collimating
lenses. The top port has a 3/8” x 1” threaded nipple that can be removed for connecting to a male
adapter.
• Using the 74-90-UV is easy. Simply screw the reflector on to the end of any SMA-termination to
collect, shape, and focus lig h t to 90°.
• For directions on adjusting the focus of a collimating lens, see
Assembly material: black anodized aluminum
Dimensions: 0.65” x .065” x 0.787” (LWH)
Mirror coating: UV-enhanced aluminum
Mirror reflectivity: >90% from 200-1100 nm
Threads:
IGHT ANGLE REFLECTOR
is a 3/8-24 threaded black anodized aluminum assembly for
Applic at ion Tips
Appendix A
.
Specifications
3/8-24 (ports)
3/8 x 1” (nipple)
37
Page 41

Sampling Optics: 74-OPM Optical Post Mount
4-OPM O
The 7
mounting collimating lenses on breadboard laboratory tables, rail carriers and other bench plates.
• The 74-OPM Optical Post Mount has an 8-32 x ½” bore for mounting collimating lenses on
breadboard laboratory tables, rai l c arriers an d ot her bench plat es. The 7 4-OPM is 1-1/ 2” in diameter
and 0.4” thick, and can be used to mount lenses securely in place, in a variety of positions.
• Mount the O ptical Post M ount on to a post for your laboratory br eadboa rd or a ny other bench pla te.
Post an d s cr ew a re not included.
• Screw either a fiber or a collimating lens into the Optical Post Mount.
Assembly material: black anodized aluminum
Dimensions:
Threads: 3/8-24
Bore for mounting: 8-32 x ½”
PTICAL POST MOUNT
is a 3/8- 24 threaded black anodiz e d alum i num as s e mbly used for
Applic at ion Tips
Specifications
1-1/2” diameter x 0.4” thick
38
Page 42

Sampling Optics: 74-ACH Adjustable Collimating Lens Holder
74-ACH A
The
DJUSTABLE COLLIMATING LENS HOLDER
multiple positions, and is especially useful for transmission measurements of large or thick samples not
easily accommodated by other sampling optics such as our FHS-UV and FHS-VIS In-line Filter Holders.
Applic at ion Tips
• The 74-A C H c onsists of an a nodized al uminum base and adjustable mount bars.
• Each bar has four 3/8-24 threaded holes, spaced 1” apart starting 1” from the top of the bar, to
accommodate collimating lenses.
• The bars can be adjusted on the base by loosening two 10-32 threaded set screws with a 5/32” hex-head
wrench (not inclu ded).
• The bar s can be set far enough apar t to accept samples up to ~10 cm thick.
• The base is scored at ½ cm in terval s as a path length g ui de.
Specifications
is a versatile assembly for mounting lenses at
Asse mb ly material:
Dimensions:
Threads:
Measurement bar:
base is blue anodized aluminum
mount bars are black anodized aluminum
base is 3” x 6” x ¼” thick
mount bars are 1” wide x 0.3” thick
entire assembly is 6” in height
mounting bars accept 3/8-24 threads
set screws for mounting bars have 10-32 threads
(use 5/32” hex-head wrench to loosen)
has ½ cm gradations as path length measurement guide
(t otal l ength i s 10 cm)
39
Page 43

Sampling Optics: FVA-UV Fiber Optic Variable Attenuator
FVA-UV F
The
amount of light be ing trans m itted by a fiber and the amount of light enteri ng th e optica l be nch of the
spectrometer. Each end of the attenuator has SMA 905 terminations for connecting the attenuator to light
sources, sample holders, and fibers. The FVA-UV attenuates light uniformly at all wavelengths.
IBER OPTIC VARIABLE ATTENUATOR
Applic at ion Tips
• The attenuator can be u sed for app lication s wh ere more light reaches the spectrom eter than likely can
be digi tized successfully by the spectrometer's detector . Some absorbance experiments may also
require signal attenuation, as too much light can saturate the reference measurement.
• In some instances, detector satura tion can be avoi d ed by adjusti n g (th rough soft ware) th e s p ectrometer
integration time to limit the interval during which the detector collects light -- somewhat akin to
changing the shutter speed on a camera to a faster exposure time. Other options include using different
gratings, changing the optical bench entrance aperture (by installing slits or using small-diameter
optical fibers), or adding neutral-density filters to the optical path. The FVA-UV fits in where these
intensity-reduction techniques are either unworkable or undesirable.
Operation
• The attenuator comes with two collimating lenses, one screwed in at each side. The thumb wheel
position is held in place with a set screw.
• A 6-32 white nylon screw pinches the mechanical adjustment wheel. Loosening the white nylon screw
all ows the mechan ical adjustm en t wheel to be turned. Wh en the wheel is positioned to your likin g,
tight en the white n ylon screw to keep the wheel in place during your mea surement. The wheel is
placed between two Tefl on was her s to provide sm ooth op e ration an d is knurled along the edge for
fingertip gripping.
• To completely close the attenuator, turn the wheel to the white line marking and tighten the white
nylon screw. You will hear a “snap” in the closed position.
is an opto-mechanical device that controls th e
Using the Adapters
With th e F V A- A D P-UV and FVA- A DP - V I S , u sers can connect the atten uator dir ectly to any light source
having a collimating lens at its aperture. To use these adapters, simply:
1. Use an Allen wrench to loosen the set screw of one of the collimating lenses on the attenuator and take
out th e in ner barrel.
2. Slip in the adapter an d tighten th e s et s crew.
3. Loosen the set scr ew on the collima ting lens of the light source. Remove the inn er barrel of the lens
and slide the adapter/attenuator into the collimating lens. Tighten the set screw.
Specifications
Dimensions: 1.5” x 1.5” x 1. 0”
Assembly ports: 3/8-24 threads for collimating lenses
Adjustment wh eel:
Adjustment wheel l ock: 6-32 Nylon thumb screw
Connector: SMA 905
diamet er = 3/32”
material = black anodized aluminum with knurled edge
40
Page 44

Sampling Optics: WS-1 Diffuse Reflectance Standard
WS-1 D
The
diffus e reflecta nce measurements, esp eciall y color anal ysis. The refl ectance material tha t com p rises th e
WS-1 is Spectralon
reflective surface for applications from 200 nm to 2.5
practical use of the WS-1 is limited to 200-1100 nm.) The reflective area of the WS-1 is 1.25” in diameter.
The di ffus ing material is encas ed in a small, black recept acle with a screw-on top.
Reflection is the return of radiation by a surface, without change in wavelength. Reflection is expressed as
a percen tage rela tive to the refl ect ion from a st an d ard substa n ce, such as the WS - 1 white refer ence
material. The WS-1 is mostly used in a setup with a reflection probe and reflection probe holder for diffuse
reflect ion measurements or wi th the ISP-RE F Integrating Sphere. T o us e th e WS - 1 as a r eference in a
diffuse reflection measurement:
1. Make sure you are in Scop e Mode. Tak e a r eference sp ectrum by fir st making sure nothing is bl ock ing
the light path going to your reference. P lace the refl ection probe over the WS - 1. For best r es u lts, use
our Reflection Probe Holder to keep the reflection probe firmly at a 45° angle.
2. Take the reference reading by clicking the
File | Store Reference Spec t r um
IFFUSE REFLECTANCE STANDARD
, a highly Lambertian thermoplastic substance that provides a nearly 100% diffuse
.
is a compact physical standard for use in performing
µ
m. (Wi th an Ocean Optics s p ectrometer, the
Operation
Store Reference Spectrum
icon on the tool bar or se lecting
Specifications
Reflectance material: Spe ctralon
Reflectivity: >99%
Wavelength r ange:
Reflect ive area diamet er:
* With an Ocean Optics spectromete r, the use o f the WS-1 is limited to 200-1100 nm.
200 nm - 2.5 µm*
1.25”
41
Page 45

Sampling Optics: ISP-REF Integrating Sphere
ISP-REF I
The
Ocean Optics miniature fiber optic spectrometers to measure reflectance (from 360-1000 nm) of solid
objects or emission (from 200-1100 nm) of spectral sources. The ISP-REF Integrating Sphere has a transfer
optic ass e mbly for res t ricti ng the fiber viewi ng an gle, a 0.4” ap erture samp le port , and a bu ilt- in light
source (tungsten halogen) with 12-volt DC adapter.
• The Integrating Sphere has two primary functions: 1) to provide even surface illumination for reflectance
measurements, s u ch as d eterminin g th e col or of flat surfaces; and 2) to collect light and funnel it to an
optical fiber for emi s sion experiments, su ch as measuri ng the s pectr al properties of an LED.
• The ISP-REF Integrating Sphere is small and compact -- it's just 2.11” x 2.25” x 3.25” (LWH) and
weighs le s s than 1 poun d -- yet i s durable enough for use outside t he laborat ory. All instrument
electronics - - including th e lamp, which can be repla ced b y simply removi n g two s crews -- ar e
mounted into the bottom section of the unit.
• The refl ectivity value obta ined by calcu lating the difference between the inclu s ion and excl u s ion of
specular reflect ion is a direct measurement of the gloss of the surface. For an ex cellent ex planati on of
diffus e and specular reflect ance, an d of th e use of integr ating sph eres, see “Non standar d Sp ectroscopi c
Measurements,” Spectroscopy, June 1997.
• The color tempera ture of the Tungsten Hal ogen lamp is 3 10 0 K .
• The sphere is made from Spectralon, a white diffusing material that provides a highly Lambertian
reflecting surface. A simple switch allows users to manipulate the sampling optic for the inclusion (I)
or excl u s ion (E) of specul ar reflect ance.
NTEGRATING SPHERE
is an illuminated sampling optic that couples via optical fiber to
Applic at ion Tips
Operation
1. Locate the on/off switch on the front of the lamp. The “1” position is the on position. The “0” position
is the off position. Turn the lamp on.
2. Locate the shutter switch. It is located on the back of the sphere. The “I” (for includes) position means
that th e resulting reflection measurement includes both specular and diffuse r efl ections. The “E” (for
exclud es) position means that the resulting reflection measurement excludes specular reflection (the
user will only obtain diffuse reflection measurements). Move the switch to the mode necessary for
your application.
Using the Optical Fiber Ports
• The ISP - RE F In tegrating Sphere has SMA connectors for two optical fibers. The conn ector, or por t
marked “S” (for sample) is used to couple an optical fiber to the spectrometer to measure the reflection
from a flat surface.
• The secon d port, mark ed “R” (for refer ence), offers two features not available with most other
integrating s pheres. On e function of th e R por t is to couple an optical fiber to a secon d channel in the
spectrometer. This channel can be used to monitor the Integrating Sphere's built-in tungsten halogen
lamp, which provides even surface illumination. The other function of the R port is for the coupling of
an optical fiber to collect light. This may be advantageous for applications involving the collection of a
wide-angle beam of l ight, especi ally where the beam is much larger th an the size of the en trance optics.
42
Page 46

Specifications
Spectral range (of illumination source): ~360-1000 nm
Dimensions: 2.11” x 2.25” x 3 .25” (LWH)
Sph ere di amet er:
Sample port aperture: 0.4”
Sphere material: Spectralon
Reflectance measurement s: specular included or ex cluded
Bulb life: 900 hours
Bulb color temperature: 3100K
Connector: SMA 905
1.5”
43
Page 47

Fiber Optic Probes and Accessories
Ocean Opt ics fibe r optic probes can be coupled to our m iniature fi be r opt ic spe ctrometer s and li ght sources
to create a variety of optical-sensing systems. Each probe consists of silica-core, silica-clad optical fiber
(0.2 2 NA) and a sampling optic, and are available for UV-VIS (high OH content) or VI S - N I R (l ow OH
content) applications. All standard fiber optic probes are 2 meters in length and have SMA terminations.
Custom probe assemblies are also available.
Fiber Optic Probes and Accessories: R200 Reflection Probes
R200 R
to create small - footp rint optical-s ensing system s f or fluor es cence and refl ection m easuremen ts. Ocean
Optics offers several variations on the Reflection Probe:
• The
• For reflection experiments across the UV-VIS-Shortwave NIR (200-1100 nm), users can specify the
• Also available is the
• One other option is the
EFLECTION PROBES
R200-7 R
around 1 re ad fiber -- e ach of wh ich is 200 µm in diameter. A 3.0” x 0.25” stainless steel ferrule
houses the fiber bundle. Other options of this standard probe assembly include the R400-7, which has a
bun dle of optical fibers 4 00 µm in diameter, and the RP200-7, which has a 3.0” x 0.25” plastic ferrule
to house the fiber bundle. The RP200-7 is useful where a stainless steel ferrule may not be suitable,
such as some applications involving corrosive samples.
R200-MIXED
and 6 VIS/NIR illumination fibers, plus 1 UV/VIS fiber and 1 VIS/NIR read fiber. In addition, the
R200-MIXED has a 3.0” x 0.25” stainless steel ferrule to house its fiber bundles, and couples easily to
a dual-channel spectrometer in which each channel is set for a different wavelength range.
fiber optic to monitor an illumination source such as our LS-1 Tungsten Halogen Light Source. The
R200-REF is useful when a reflection experiment either does not allow the user to take frequent
refer ence scans or r equires an i lluminati on s ou rce with an unstable sp ectral output.
fibers -- 6 illumination fibers around 1 read fiber -- and a 3.0” x 0.25” stainless steel ferrule with a 45°
window. This angl ed window rem oves the effect s o f specular reflection when the probe is immersed in
dense liquids and powders.
EFLECTION PROBE
. The R200-MIXED consists of fourteen 200 µm-diameter optical fi bers -- 6 UV/VI S
coupl e to Ocean Optics miniature fiber op tic spectrometer s and light sources
consists of a bundle of 7 optical fibers -- 6 illumination fibers
R200-REF
R200-ANGLE R
, which consists of an R200-7 Reflection Probe and an additional
EFLECTION PROBE
, which has a bundle of seven 200 µm
Caution!
The distance fr om the probe tip to the sampl e directly affe cts th e s i gn al. For quantitati ve result s, the
""""
dist ance and angl e mu s t be held const ant.
Handle with care. Dropping the probe may cau s e p ermanent damage.
""""
Operation
The reflection probe consists of a 6-fiber leg that should be coupled to the light source, and a single-fiber
leg that goes to the spectrometer.
1. Insp ect the ends of th e fi ber legs. The hole in the S M A connector i s not iceably larger in the illuminat ion
leg than the hole in the spectrometer leg. Also, the spectrometer leg should have colored bands.
2. Install the illumination leg in the light source.
3. Install the spectro meter leg in the spectrome ter.
4. Using the RPH-1 Reflection Probe Holder or some other holding device, point the probe at the surface
to be measured.
44
Page 48

Specifications
Fiber core diameter:
Fiber core/cladding: silica
Fiber bundle: 6 illumination fibers around 1 read fiber
Numerical aperture: 0.22
Optimization: UV/VIS (200-750 nm) and VIS/NIR (450-1000 nm)
Ferrule: Stainless steel or plastic
Ferrule dimensions: 3.0” x 0.25”
Terminations: SMA 905
Sheathing: Blue PVC with Kevlar reinforcement
Temperature range: -20° C to 80° C
Probe assembly length:
200 µm or 400 µm
2 meters (breakout is halfway); custom probe s are
also available
45
Page 49

Fiber Optic Probes and Accessories: RPH-1 Reflection
Probe Holder
RPH-1
The
and 90° to hold our R200 Re flect ion Probes or oth e r 0.25” O.D. probes d uring refl e c tion measureme nts.
Common applicat ions incl ud e measurin g the reflection properties of mir rors and anti-reflection coa tings,
and measuring the visual properties of c olor in paints, graphic art s, pla s tics, a nd food p rodu cts.
Reflection is the return of radiation by a surface, without a change in wavelength. The reflection may be:
• Specular, in which the angle of inciden ce is equal to the angel of refl ection. If taking specular
• Diffuse, in which the angle of incidence i s n ot equal to the angle of reflect ion. I f ta king diffuse
Every surface returns both specular and diffuse reflections. Some surfaces may return mostly specular
reflect ion, others more di ffuse reflection. The glossier the surfa ce, the more specular th e r eflection .
REFLECTION PROBE HOLDER
reflection measurements, position the reflection probe in the 90° aperture of the RPH-1.
reflection measurements, position the reflection probe in the 45° aperture of the RPH-1.
Specular Reflectance Measurements
For a specular reflection measurement, attach the illumination leg of your reflection probe to a light source,
and th e r ead leg to the spectrometer. Pla ce the end of the pr obe i n the 90° aperture of th e RPH-1 . Use the
cap screw on the hold er to secure th e probe at the des ired distance from the sample.
1. Fir st, take a reference spectrum. Make sure nothin g is bl ock ing the light path going to your reference.
Place the reflection probe/ p robe hold er over a firs t-surfa ce mirror. Take the refer e nce reading.
2. Next, take a dark spectrum. Completely block the light path going to your sample. Do not turn off the
light source. Take the dark reading.
3. Finally, take your reflection measurement. Make sure the sample is in place and nothing is blocking the
light going to your sample. If using OOIBase32, click on the
(The Tr ansmission Mode uses the same form ula for tran smission and reflecti on measurements. )
is an anodized aluminum pla tform with machined hol es at 45°
Operation
Transmission
icon to take your spectrum.
Diffuse Refle ctance Measu rements
For a diffuse reflection measurement, attach the illumination leg of your reflection probe to a light source,
and th e r ead leg to the spectrometer. Pla ce the end of the pr obe i n the 45° aperture of th e RPH-1 . Use the
cap screws on the hol d er to secure th e probe at the des ired dist ance from th e sa mp le.
1. Fir st, take a reference spectrum. Make sure nothin g is bl ock ing the light path going to your reference.
Place the reflection probe/ p robe holder over a diffuse stan dard. Take th e r eference reading.
2. Next, take a dark spectrum. Completely block the light path going to your sample. Do not turn off the
light source. Take the dark reading.
3. Finally, take your reflection measurement. Make sure the sample is in place and nothing is blocking the
light going to your sample. If using OOIBase32, click on the
(The Tr ansmission Mode uses the same form ula for tran smission and reflecti on measurements. )
A typical configuration for a reflection experiment.
Transmission
icon to take your spectrum.
46
Page 50

Fiber Optic Probes and Accessories: T200 Transmission
Probes
T200 T
optical-sensing systems for measurin g transmi ssion in chemical solutions and other liq uids. The standard
T200 has 1 i l luminati on fiber and 1 re ad fiber and a 0.25” outer diameter stainl e s s s teel fe rrule. The probe s
come with either a fixed or removable tip (2-mm, 5-mm or 10-mm path length removable tips).
RANSMISSION DIP PROBES
coupl e to our spectrometers and ligh t sou rces to cr eate small- foot print
Caution!
Handle with care. Dropping the instr um en t may cause per manent dam age.
""""
Bubbles will interfere with your readings. Regularly inspect the sample region for bubbles.
""""
Operation
The T200 Transmission Dip Probe consists of two identical fibers in a bifurcated assembly. A plano-convex
lens shapes the light coming out of the illumination fiber. The light is transmitted through the sample, hits the
mirror, reflects off the mirror, and interacts with the sample again before being transmitted back through the
probe via the read fi ber. Because the light tr avels through the sampling regi on twice, th e op tical path length i s
actually twice the length of the sample aperture. The transmission cell is used to measure absorbance of the
fluid that fills the sample compartment between the fibers and the mirror, which is a UV-enhanced aluminum,
second-surface mirror.
1. Connect one leg of the probe to th e light source and connect the other leg to the spectrometer. I t does
not matter which leg of the probe is connected to the light source or spectrometer.
2. In ord er to achieve th e best signal, use an Allen wrench to loosen the set scr ew on the inner fi ber barrel
asse mbly a nd sli de it up and down to change th e inten s i ty of the light ret urned until a signal in Scope
Mode reaches approximately 3500 counts. The position of the inner barrel has been optimized at the
time of manufacture for aqueous media applications using a 10 mm tip. If your application requires
measuring gases you will have to move the inner barrel for maximum throughput.
3. Immer s e the probe in distilled wa ter or the sol vent of your choice and ta k e a reference s p ectra.
4. Remove the probe from the reference material, block the light path going to the spectrometer and take
a dark spectrum. (Do not turn the light off.)
5. Make sure the light path is clear, place the probe in your sample solution and take your sample spectra.
To repl ace the probe t ip, simply unscrew the probe tip an d screw in eith er a 2-mm path length, 5-mm pa th
length, or 10-mm path length repl aceable ti p for the Tran s m ission Dip Probe.
Specifications
Fiber core diameter:
Fiber core/cladding: Silica
Fiber bundle: 1 illumination fiber and 1 read fiber
Numerical aperture: 0.22
Optimization: UV/VIS (200-750 nm) and VIS/NIR (450-1000 nm)
Ferrule:
Terminations: SMA 905
Probe assembly length:
200 µm
Stainless steel or plastic, 3.75” x 0.25”
2 meters (breakout is halfway); custom probes are also available
1 meter for plastic ferrule option
47
Page 51

Fiber Optic Probes: CC-3 Cosine-Corrected Irradiance Probes
Cosin e-corrected fiber op tic irradiance probes are spectroradiom etric sampling opti cs d es igned to coll ect
radiation (light) from a 180° field of view, thus el iminatin g optical interface problems a ss oci ated wit h the
light collection sampling geometry inherent to other sampling devices. The
I
RRADIANCE PROBE
CC-3-UV C
The
for applications from 200 nm - 2
, optimized for applications from 350-1000 nm, has opaline glass diffusing material.
OSINE CORRECTED IRRADIANCE PROBE
µ
m.
has Teflon diffusing material and is optimized
Applic at ion Tips
Each cosine corrector has a 0.25” O.D. barrel with a smooth yet rugged black oxide finish. The diffusing
material is a thin disk that sits at the end of the barrel (the Teflon material is 0.30” thick). Both cosine
correctors have SMA 905 connectors for convenient coupling to optical fibers. The cosine correctors
screw on to the end of any SMA-termin ated opt ical fiber. When coupled to an S1024DW, these cosin e
corr ectors can be used to measure UV-A and UV-B sol ar rad iation, en vironment al light fields, lamp s and
other emi s sion sources .
CC-3-UV Cosine Corrector -- Function Test
CC-3 C
OSINE CORRECTED
Cosine Corrector Function Test
3500
3000
2500
2000
COUNT S
1500
1000
500
0
0 102030405060708090100
ANGL E
Teflon Disk .030"
Cosine Function
48
Page 52

Optical Fiber Assemblies
Ocean O pt ics offers an extensive l ine of optical fibers an d acces sories - - including p atch cords, bifurca ted
assemblies, bushings, and splitters -- for a variety of UV-VIS and VIS-NIR applications. All optical fibers
couple easily via SMA terminations to our miniature fiber optic spectrometers, lights sources and sampling
optics. Ocean Optics optical fibers offer great flexibility, both in the literal sense (by transporting light
around corners, for exampl e) and in the way fi ber-based systems are constru cted (by lin king light sou rces
and sampling optics, for example, to create an optical interface to the spectrometer). Optical fibers allow
the user to easily con vert the opt ical inter face from on e set-up to an other -- absorba nce, refl ectance and
emission are the th ree basic options -- t o create an almost endless variety of optical-sensing systems.
These silica-core and silica-clad optical fibers are optimized for the UV-VIS (200-750 nm) or VIS-NIR
(450-1000 nm). Standard assemblies are 2 meters in length, and are available in sizes ranging from 8
1000
µ
m in diamet er. Custom op tions incl u de optical fi bers with solarization-res istance pr op er ties (for
applications <260 nm), and in lengths other than 2 meters.
Caution!
When fibers br eak, th e y stop transm itting light. Inspect fibers by e ye to det ermine if l i ght is being
""""
transmitted. Be su re to use a visi bl e light source when in s p ecting fibers.
Do not coil the fiber too tightly. The maximum sustained bend radius of a 400 µm fiber is 10 cm.
""""
Bending the fiber wi ll cause attenuation. To minimize this effe ct, add ex tra strain r elief to both ends of
the fiber.
Do not ex ceed the temp erature sp ecifications for th e materials involved: 2 0 00C for the fiber, 10 00C for
""""
PVC cabling, 1 00
Do not allow the fiber to be bent at a sh a rp ang le. A bendin g radius of les s than one inch is da ngerous.
""""
Keep conn e c tors a nd pr obe tips c ove red when the fibers are not being used.
""""
Clean the ends of the fibers with lens paper and di stilled wa ter, alcohol, or acet one. Avoid scr atching
""""
the sur face.
Do not imm erse fiber en ds in caustic materials or other s ol u tions th at can damag e qu ar tz or aluminum.
""""
0
C for stand ard epoxy.
µ
m to
Operation
Patch Cords
Patch cords are sing le strand s of optical fiber. The active part con s ists of a silica core, surrounded by a
silica cladding material. The fiber is very fragile, and if not protected by a suitable buffer material, would
be near ly useless for most appli cations. The buffer materials are polymer coa tings tha t provide mechanical
strength, either polyimide or Teflon. Cabling further protects the buffer-coated fiber. Our standard
laboratory cabling is blue PVC. Other cabling that is available includes stainless steel monocoil. The ends
of th e fibers are cleaved, epoxied into the connect ors, and poli s hed.
Bifurcated Assemblies and Splitters
Bifurcated assemblies and splitters allow you to route light from 1 location to 2 locations, or to collect light
from 2 loca tions an d com bi ne the outp u t into 1 location. The assemblies are shaped li k e a “Y ” with a stainless
steel breakout located midway from the ends of the fibers. The common end of bifurcated assemblies has 2
fibers positioned side by side. The spatial difference between the two fibers may be important in your
application. If this difference matters, then a splitter is required. The common end of a bifurcated fiber can be
coupled to a larg er dia meter sing le fiber with a splice bush ing to create a function al splitter.
49
Page 53

Splice Bushings, Bulkhead Fittings
Spli ce bus hings are used to couple two SMA-terminat ed fibers together. Si mply screw each fiber in to the
spl ice bushin g fi nger-tight. Bulkhead fit tings are us e d to fixtur e a fiber onto a pa nel. Install the bulkh ead by
drilling a hole in the wall where you wish to mount the fiber. Fasten with the lock washer and nut provided.
Optica l Fiber Color Codes
All Ocean O p tics optical fibers are color-cod ed f or simple identi fi cation. Th er e are two color ba n ds on one
end of the fiber. The color band nearest the termination identifies the fiber type (i.e., its wavelength
optimization), and is either white (UV/VIS) or black (VIS/NIR). The second color band identifies the
diameter of the fi ber, and is one of several di fferent col ors. Use the table below as a h an dy referen ce.
Band Color
Purple 8 (VIS/NIR only) White UV/VIS
Blue 50 Black VIS/NIR
Green 100
Yellow 200
Gray 300
Red 400
Brown 600
Clear 1000
Cor e Diameter (
m)
µµµµ
Specifications
•
Acrylate (te mperature range -40 to 100° C), for 50 µm fibers
Jacket:
Sheathing/cabling:
Connector/termination: SMA 905
Fiber core: pure fused silica
Cladding: doped fused silica
Fiber pr ofil e: step- index m ulti - mode*
Operating wavelengths:
Numerical aperture: 0.22
Recommended minimum
bend radius:
•
Nylon (temperature range -40 to 100° C), for 100 µm, 200 µm,
400 µm, 600 µm and 1000 µm fibers
•
PVC (standard)
•
PVC Monocoil (optional)
•
B X flexible metal s leeve (option al)
•
UV-VIS (200-750 nm)
•
VIS-NIR (450-1000 nm)
•
mom entary = 200x the fiber radius
•
long term = 400x the fiber radius
Band Color Fi ber Type
* The only exception is the VIS-NIR 8 µm diam et er pat ch cor d, whi ch is single-mod e (above 850 nm)
optical fiber.
50
Page 54

Experiment Tutorial
Before you begin your experiment, double-check that you have correctly set up your SAD500, installed the
operating software, and set up your light source and other sampling optics. Next:
1. Open OOIBase32. Double-check t h a t
Spectrometer | Configure
2. Now check your spectrometer setup configurations in OOIBase32. A Wavelength Calibration Data
Sheet is shipped with each spectrometer channel. You will need the numbers on this sheet. Select
Spectrometer | Configure
spectrometer channel in your system, enable th e ch annel and enter the Fir s t C oef fi cient, Second
Coefficient an d Intercept. (Recent ly, we began calculating third coe f ficients for all sp ectrometer
systems; however, existing cust om er s will have to enter a zero as th eir third coeffi cient.)
from the menu.
from the menu and choose the
A/D Interface
settings correspond to your setup by choosing
Wavelength Calibration
page. For each
3. Adjust your acquisition par ameters using the
Data Acquisition
4. Acquiring spectral data from your spectrometer is quite simple. Assuming that you have followed the
previ ous s t eps and started OOIBa s e3 2, your spectrometer is already acq u iring data. Even with no light
in the spec trometer , you should se e a fluctuating tra c e on the bottom of the graph. If you put ligh t int o
the spectromet er, you shoul d s ee the graph trace rise with increasin g light intensity. If this occurs, you
have correctly installed your hardware and software.
5. Onc e you in stall e d and configured you r hardware a nd softwar e , a nd have s e t up your system, you are
ready to take your measurements. There are four basic optical measurements from which to choose:
absorba nce, transmissi on , reflecti on, and relative irradiance measuremen ts. The type of measurements
you wish to make determines the configuration of the sampling optics for your system. The choice of
refer ence and data analysis determin es h ow th e an s wer is presen ted. For each measuremen t , a
reference and dark spectrum must first be made. After taking a reference and a dark spectrum, you may
take as many absorbance, tran sm ission, reflection, or relat ive irradiance measurement scans as you
want. However, if at any time any sampling variable changes (integration time, averaging, smoothing,
angl e, temperat ure, fiber size, etc.) you must store a new dark and refer ence spectr u m.
dialog box.
Acquisition Parameters
dialog bar or the
Configure
Applic at ion Tips
If th e sign al you collect is satura ting the spectrometer (peaks are off the scale), you can decrease the light
level on sc ale in s c ope mode by:
• Decrea s ing the int egration time
• Attenuating the light going into the spectrometer
• Switch ing to a small er diameter fi ber
• Using a neutral density filter with the correct optical density
If the signal you collect has too little light, you can increase the light level on scale in scope mode by:
• Increasing the integration time
• Switch ing to a larg er diameter fi ber
• Avoiding the use of any optical filters
51
Page 55

Absorbance Experiments
Absorba nce spectr a are a measur e of how much ligh t is absorbed by a sa mple. Absor ba nce spectr a are
formed by radiation that has interacted with a medium. For most samples, absorbance is linearly related to
the con centrati on of the substance. The soft ware calculates a bsorbance (
-
S
D
λ
Aλ = - log
where S is the sample intensity at wavelength λ, D is the dark intensity at wavelength λ, R is the
reference intensity at wavelength λ.
Absorba nce can also be express ed as proport ional to the concentration of th e su bstance interactin g wi th the
light (known as Beer ’ s Law). Common ap p lication s include the quantification of ch emical con cen tration s
in aqueous or gaseous sam p l es. T o tak e an absorbance measurement:
10
(
R
λ
)
-
D
λ
λ
) using the following equation:
A
λ
1. Make sure you are in scop e mode, by either cli cking the
Spectrum | Scope Mode
reference signal should be about 3500 counts. Take a reference spectrum by first making sure nothing
is blocking the light path going to your sample. The analyte you want to measure must be absent while
takin g a reference sp ectrum. Take the refer ence read ing by clicking the
icon on the toolba r or se lecting
2. While s till in
your sample. If possible, do not turn off the light source. Take the dark reading by clicking the
dark spectrum
3. Begin an absorbance measurem ent by first mak ing sure the s am ple is in place and nothing is blockin g
the l ight going to your s a mple. Then choose the
Spectrum | Absorbance Mode
toolbar or sel e c t
""""
scope mode
icon on the toolba r or se lecting
File | Save | Pr oc essed
If at any time any sampling variable changes -- including integration time, averaging,
boxc ar sm oothi ng, di stance from light s ource to sample, etc. -- you must store a new
reference and dark spectrum.
from the menu. Make sure the signal is on scale. The peak intensity of the
Spectrum | Store Reference
, take a dark spectrum by first completely blocking the light path going to
Spectrum | Store Dark
absorbance mode
from the men u. To save th e s p ectrum, click the
from the menu.
scope mode
from the men u.
icon on the t oolbar, or s e lecting
Store Reference Spectrum
fr om the menu.
icon on the toolba r or select
save
icon o n t he
store
A typical configuration for an absorbance experiment.
52
Page 56

Transmission Experiments
Transmission is the percentage of ener gy passing through a system r elative to the amount that passes
through the reference. Transmission Mode is also used to show the portion of light reflected from a sample.
Transmission and reflection measurements require the same mathematical calculations. The transmission is
expressed as a percentage (
(or
) by the following equation:
%R
λ
-
S
D
λ
%Tλ =
-
D
R
λ
where S is the sample intensity at wavelength λ, D is the dark intensity at wavelength λ, R is the
reference intensity at wavelength λ.
Common applications include measurement of transmission of light through solutions, optical filters,
optica l coating s, and other optical elements such as lenses an d fi bers. To take a transmis sion measurement:
1. Make sure you are in scop e mode, by either cli cking the
Spectrum | Scope Mode
reference signal should be about 3500 counts. Take a reference spectrum by first making sure nothing
is blocking the light path going to your sample. The analyte you want to measure must be absent while
takin g a reference sp ectrum. Take the refer ence read ing by clicking the
on the toolbar or selec ting
2. While s till in
your sample. If possible, do not turn off the light source. Take the dark reading by clicking the
dark spectrum
3. Begin a tr ansmission measurement by first making sure the sample is in place an d nothing i s blocking
the l ight going to your s a mple. Then choose the
Spectrum | Transmission Mode
toolbar or sel e c t
scope mode
icon on the toolba r or se lecting
File | Save | Pr oc essed
) relative to a stan dard substance (such a s air ). The software calcu lates %T
%T
λ
λ
x 100%
λ
scope mod
e icon on the toolbar, or sel e c ting
from the menu. Make sure the signal is on scale. The peak intensity of the
store reference spectrum
Spectrum | Store Reference
fr om th e menu.
, take a dark spectrum by first completely blocking the light path going to
Spectrum | Store Dark
transmission mode
from the men u . To save the sp ectrum, click the
fr om the menu.
icon on the toolba r or se lect
save
icon o n t he
from the menu.
icon
store
""""
If at any time any sampling variable changes -- including integration time, averaging,
boxc ar sm oothi ng, di stance from light s ource to sample, etc. -- you must store a new
reference and dark spectrum.
A typical configuration for a transmission experiment.
53
Page 57

Refl ection Experi ments
Reflection is the return of radiation by a surface, without a change in wavelength. The reflection may be:
• Specular, in which the angl e of incidence is equal to the angle of refl ect ion.
• Diffuse, in which the angle of incidence i s n ot equal to the angle of reflection.
Every surface returns both specular and diffuse reflections. Some surfaces may return mostly specular
reflect ion, others more di ffuse reflection. The glossier the surfa ce, the more specular th e r eflection .
Reflection is expressed as a percentage (
our WS-1 white reference for a diffuse reflection measurement):
-
S
D
λ
λ
%Rλ =
R
λ
where S is the sample intensity at wavelength λ, D is the dark intensity at wavelength λ, R is the
reference intensity at wavelength λ.
-
x 100%
D
λ
Common applicat ions incl ud e m easuring the reflecti on properties of mirrors, anti- reflecti on coa tings, an d
mea s uring the vi s ual properties of the c olor in paints, graphic arts, plastics, and food p rodu c ts. To t ake a
reflection measu re ment:
1. Make sure you are in scop e mode, by either cli cking the
Spectrum | Scope Mode
from the menu. Make sure the signal is on scale. The peak intensity of the
reference signal should be about 3500 counts. Take a reference spectrum by first making sure nothing
is blocking the light path going to your sample. The analyte you want to measure must be absent while
takin g a reference sp ectrum. Take the refer ence read ing by clicking the
on the toolbar or selec ting
2. While s till in
scope mode
Spectrum | Store Reference
, take a dark spectrum by first completely blocking the light path going to
your sample. If possible, do not turn off the light source. Take the dark reading by clicking the
dark spectrum
icon on the toolba r or se lecting
3. Begin a reflection measurement by first making sure the sample is in place and nothing is blocking the
light going to your sample. Then choose the
Spectrum | Transmission Mode
measurements ar e id en tical to those necessa ry to compute a transmission spectrum. To save the
spectrum, cli ck th e
save
icon on the t oolbar or select
) relative to the reflection from a standard substance (such as
%R
λ
scope mode
icon on the t oolbar, or s e lecting
store reference spectrum
fr om th e menu.
store
Spectrum | Store Dark
transmission mode
icon on the toolba r or se lect
fr om the menu .
from the menu. The mathematics required to calculate reflection
File | Save | Processed
from the men u.
icon
""""
If at any time any sampling variable changes -- including integration time, averaging,
boxc ar sm oothi ng, di stance from light s ource to sample, etc. -- you must store a new
reference and dark spectrum.
A typical configuration for a reflection experiment.
54
Page 58

Relative Irradiance Experiments
Irradiance is the amount of energy at each wavelength from a radiant sample. In relative terms, it is the
fract ion of ener g y from the sample com pared to the energy colle cted from a lamp with a bla ckbody
energy distribution, normalized to 1 at the energy maximum. Relative irradiance is calculated by the
following equation:
-
S
D
λ
Iλ =
B
λ
(
B
where
sample intensity at wavelength λ, D is the dark intensity at wavelength λ, R is the reference intensity at
wavelength λ.
Common applicat ions include characterizin g the light output of LEDs, in candescent lamps and other
radiant energ y sources such as s unlight. Also included in irradiance measurements is fluorescence, in which
case the spectrometer measures the energy given off by materials that have been excited by light at a
shorter wavelength . To tak e a relative ir radia nce measure ment :
1. Make sure you are in scop e mode, by either cli cking the
Spectrum | Scope Mode
reference signal should be about 3500 counts. The light source must be a blackbody of known color
temper ature. Take the refer ence reading by clicking the
or selecting
2. While s till in
reading by clicking the
from the menu.
3. Take a relative irradiance measurement by first positioning the fiber at the light source you wish to
measure. Then ch oose t he
Irradiance Mod e
source’s color temperature in Kelvin and click OK. To save the spectrum, click the
toolbar or sel e c t
λ
is relative energy o f the r eferen ce calcul ated f r om the c olor temp eratu re in Kelvin, S is the
Spectrum | Store Reference
scope mode
from the menu. In the
File | Save | Pr oc essed
λ
-
R
λ
)
D
λ
scope mode
from the menu. Make sure the signal is on scale. The peak intensity of the
store reference spectru m
from the men u.
, take a dark spectrum by completely blocking the light path. Take the dark
store dark spectrum
irradi a n ce mode
icon on the tool bar or s e lecting
icon on the t oolbar or select
Reference Color Temperature
from the menu.
icon on the t oolbar, or s e lecting
icon on the tool bar
Spectrum | Store Dark
Spectrum | Relative
dial og box, enter the light
save
icon on the
""""
If at any time any sampling variable changes -- including integration time, averaging,
boxc ar sm oothi ng, di stance from light s ource to sample, etc. -- you must store a new
reference and dark spectrum.
A typical configuration for an irradiance experiment.
55
Page 59

Time Acqui sition Experiments
Time a cq u isition ex periment s tr ack processes, perfor m kinetic an alyses, an d monitor spectral events as a
function of time. (See the
collect as a function of time spectral data from up to 6 single wavelengths (designated as Channels A
through F) and up to two mathematical combinations of these wavelengths (designated as Combinations 1
and 2). You can acquire data in any mode. To perform a time series experiment, follow these steps:
1. While in s cop e m od e, store r eference and dark spectr a, if desir ed, and choose a vi ew mode, such as
absorbance.
2. Access the Time Acquisition Channel
Configuration dialog box by selecting
Acquisition | Configure | Configure Time
Channels
• Select
• Enable
• Select a
• In the
• Select a multiplicative
from the menu.
Enabled
calculation for the wavelength. Without
selecting Enabled, the time acquisition
process will not calculate data.
Plotted
the acqu ired data in a s pectr a l wind ow.
Spectrometer Channel
time acquisition process.
Wavelength (nm)
analysis wa vel en gth . In the
(pixels)
averaged around the analys is wave length.
constant or
stored . The equat ion for the Factor and Offset fu nctions is: Results = (Fact or x Data) + Offset.
box, speci f y the number of pi xels
OOIBase32 Spectrometer Operating Software Manual
Time
to set the time acquisition
to see a real time graph of
for you r
box, specify the
Bandwidth
Factor
to apply to the data before it is plotted or stored. Select an additive
Offset
to apply to the data after the factor is applied and before the data is plotted or
for details.)You can
3. If desired, configure a time acquisition process for the second single wavelength by selecting the
Channel B
wavelengths, select the
set the necessary parameters.
4. If desired, configure a time acquisition process for a combination of two time channels by selecting
Combination 1
• Select
• Enable
• Specify T ime Channel A through F for the
• Select t he mathematical
• Specify T ime Channel A through F for the
• Select a multiplicative
5. If desired, confi g ure a time acq u isition process for the
the Combination 1 page except that you have the option of choosing Combination 1 for your
Channel
6. Click the OK button for the Time Acquisition Channel Configuration dialog box.
page. To configure a time acquisition process for the third, fourth, fifth, and sixth single
Channel C, Channel D, Channel E
.
Enabled
Plotted
constant or
stored . The equat ion for the Factor and Offset fu nctions is: Results = (Fact or x Data) + Offset.
Second Channel
or
to set the time acquisition calculation for the wavelength.
to see a real- time graph of the acquired data in a spectral wind ow.
First Channel
Operation
Factor
Offset
to apply to the data after the factor is applied and before the data is plotted or
.
to produce the data for Combination 1.
Second Channel
to apply to the data before it is plotted or stored. Select an additive
Combination 2
, and
.
Channel F
.
pages, r es p ectively, and
page. It is almost identical to
First
56
Page 60

7. Access the Time Acquisition Configuration dialog box by selecting
Configure Acquisition
• Enable
Stream Data to Disk
from the men u.
to
save time acquisition data.
• Enter a value in the
Write Data
to Disk Every X Acquisitions
box to set the frequency for
saving data. The smaller this
number, the more frequently
data is sav ed. The larger this
number, the less frequently
data is saved; but entering a
large number enhances the
performance of the time
acquisition process .
""""
At specified time intervals, data
from OOIBase32 is stored into
time acquisition channels or
combination channels. This data can be simply plotted in a spectral window, or streamed to disk, or
both. Up to 2048 acquisitions can be displayed in a spectral window. If more than 2048 acquisitions
are gathered, only the last 2048 of them will be displayed. To store more than 2048 acquisitions,
you m ust stream t he data to dis k . Writ ing data to the dis k is a slow pro cess (r elative to the speed of
some spectral acquisitions) and causes a decrease in system performance. However, writing data
to disk more frequently gives a larger margin of safety.
Time Acquisition | Configure |
• Enable
Show Values in Status Bar
to see the time acquisition values in the status bar. These
values replace the cursor va lues.
• Name the
Stream Filename
for the time acquisition process. Clicking on the ellipsis to the right
of this box opens a file save dialog box all owing you to navigate to a designated folder.
• Enable
Save Every Acquisition
to store data for every spectral acquisition during the time
acquisition process .
""""
There are options to either store data for each acquisition, or to collect data only after a specified
delay. Several factors affect the minimum time acquisition frequency, including integration time,
number of spectrometer channels, samples averaged, and computer speed. If you specify you want
data to be stored every 100 milliseconds, the delay will be
much longer depending on your experimental configuration. OOIBase32 spends a large amount of
time calculating, rendering and displaying the spectra in a spectral window. You have the option to
suspend graph display, which greatly improves performance.
• Enable
pr oc ess by cl icki ng on the stop icon or selec ting
• Enter an
Continue Until Manually Stopped
Initial Delay
to set the delay before the time acquisition process begins. However, the
to store data unt il you ma nually stop the a cquis i tion
Time Acquisition | Stop
at least
100 milliseconds, but could be
.
delay countdown cannot begin until you initiate the time acquisition process by clicking on the
start icon or selecting
Seconds
Milliseconds
or
• Enter a value to set the
Time Acquisition | Start
from the menu. Be sure to select
immediately to the right of the initial delay entry.
Frequency
of the data collected in a time acquisition process. Data from a
Hours, Minutes
time acquisition is stamped with a time that is accurate to 1 millisecond. Be sure to select
Minutes, Seconds
• Enter a value to set the
Minutes, Seconds
Milliseconds
or
Duration
Milliseconds
or
immediately to th e r ight of the frequency entry.
for the entire time acquisition process. Be sure to select
to the ri gh t of the duration entry.
Hours
Hours
,
,
,
8. Click the OK button for the Time Acquisition Configuration dialog box.
9. Initiate the Time Acquisition mode by either clicking on the alarm clock icon in the Time Acquisition
toolbar or sel e c ting
can then start a time acquisition process by selecting the start icon or by selecting
Start
fr om th e menu.
Time Acquisition | Activate Time Acquisition
57
from the OOIBase32 menu. You
Time Acquisition |
Page 61

Appendix A: Adjusting the Focus of a
Collimating Lens
In order to obtain accurate data, the light entering and exiting a sample by means of a fiber/collimating lens
assembly must be well collimated. The following is a description of how to adjust the focus of light so that
accurate data is collected by the spectrometer. (All collimating lenses are already adjusted at the time of
manufacture such that light emerging from a 200
Adjust the focus of the collimating lens on your light source.
1. Connect the fiber that you ar e going to use as the illumin ation fiber in your setup to the light sou rce.
Ensure the connection is tight. The male SMA connector of the fiber must be screwed all the way into
the female connector of the lamp.
2. Turn on the lamp and inspect th e light beam em itted from the other end of the fiber by pointing th e
fiber at a light-col ored object su ch as a whit e pi ece o f p aper. The distance is n ot too critica l but should
be at least 3 inches from the sur face. Loosen th e s et screw on th e fiber barr el of t he light s ource with an
Allen wrench.
3. After the set screw has been loosened, slide the inner barrel of the collimating lens on the light source
until you see an e ven intensity across the beam s pot. The spot of li ght should be u nifor m; th ere shou ld
be no fluctuations in intensity and color. There should not be any dimmer rings of light surrounding the
center s p ot.
4. Once the inner barrel is positioned so that a well-focused, uniform spot of light is obtained, tighten the
set scr ew with the All en wrench. Do not put down the fiber an d then tight en the set screw. Try to
continue to hol d the fiber 3 inches from the surface whi le you tight en s o that if the inner barr el of the
collimating lens slips and distorts the spot of light, you will be able to readjust the focus. Now the
collimating lens on the light source is correctly coupled to the fiber.
µ
m fiber/collimating lens assembly is collimated.)
Adjust the focus of the next collimating lens in your setup.
5. For this part of the procedure, the illumination fiber is still connected to the lamp and its collimating
lens and the lamp is still on. Now take the second collimating lens in your setup (removed from the
illumination side of a cuvette holder, for example) and screw it onto the other end of the illumination
fiber . M ake sure the fiber and th e second collimating l ens are compl etely connected. Poin t th is end of
the fiber at least 2 meters away from a wall. If the beam spot on the wall is too faint, you may need to
dim the room lights.
6. Loosen the set screw that holds the barrel of this second collimating lens in place and slide the barrel
until the spot of light focused on the wall has crisp edges. Y ou are lookin g for the sharp est and clean est
image possible. Tighten th e s et screw. Do n ot pu t the fiber down and then tighten the set s crew. Tr y to
continue to hold the fiber with the spot of light focused on the wall while you tighten the set screw so
that if the inner barrel of the collimating lens slips and distorts the image while tightening, you will be
able to readjust th e focus . Now that the second collimating lens has been refocused, remove it from the
end of th e fiber and in s tall it back into your setu p (back int o a cu vet te holder, for exam pl e) .
Continue to adjust the focus of the other collimating lenses in your setup.
7. You have completed adjusting the focus of the collimating lenses in the illumination part of your setup.
Continue to adjust the focus of the other collimating lenses in your setup. If the read fiber is the same
diameter size a s the illumin ation fiber , repeat step 6 with each col limating lens in your setup. If the
read fi ber is a differ ent diamet er s ize than that of t he illumination fi ber, you need to remove th e
illumination fiber from the light source, connect the read fiber to the light source, and repeat step 6 for
every collimating lens on the read part of your setup.
58
Page 62

Appendix B: S1024DW Pin-outs and Jumpers
It is not n eces s ary for the average user to worry about the inter connect scheme, as th e cables suppl i ed with all
of the units need only be plugged into the matching connectors on the hardware. However, if the need arises
to design and fabricate your own cabling system, the following table supplies the necessary information.
J1 (D-25) C onnectors
Pin Function A/D Pin Connection
1 Analog Channel 0 37
2 Analog Channel 1 36
3 Analog Channel 2 35
4 Analog Channel 3 34
5 Analog Ground 19
6 Reserved
7N/C
8N/C
9 Digital Ground 7
10 A/D Trigger Out 25
11 Master Clock In 20
12 Digital Ground Not in Cable
13 +5VDC 1
14 Analog Channel 4 33
15 Analog Channel 5 32
16 Analog Channel 6 31
17 Analog Channel 7 30
18 Analog Ground Not in Cable
19 N/C
20 Continuous Strobe In 8 (or use internal jumpers)
21 External Software Trigger Out (D3) 5
22 Spect rom eter Mode Input S1 4
23 Integration Time Clock In 2
24 Strobe Enable, Spectrometer Mode Input S0 23
25 Enable Read In 3
J2 (D-SUB-15) Connectors
Pin Function
1 Strobe Single Fire
2 Strobe Multiple Fire
3+5VDC
4 External Hardware Trigger
5 External Synchronization Trigger
6 Analog Channel 7 Input
7 Analog Channel 6 Input
8 Externa l Sof tware Trig ger (D3)
9 Analog Channel 1
10 Ground
11 Analog Channel 4
12 Analog Channel 5
13 Digital Out S0 (Strobe Enable or Lamp On/Off)
14 Analog Channel 3
15 Analog Channel 2
59
Page 63

H1 Header Pins (Analog)
1 Analog Channel 0
2 Analog Channel 1
3 Analog Channel 2
4 Analog Channel 3
5 Analog Channel 4
6 Ground
7 Reserved
8 Analog Channel 7
9 Analog Channel 6
10 Analog Channel 5
H2 Header Pins (Digital)
F Inverted Clock 2
E Inverted Clock 1
DN/C
C A/D Trigger
B Digital In 3 (D3)
AS1
1 Ground
2+5 VDC
3 Clock 1
4 Store Clock
5 Clock 2
6 Temperature (optional)
7 Read Enable
8S0
9 Strobe Single flash
10 Strobe Multiple Flash
11 Integration Clock
12 Master Clock
J1 = 25-pin connector that connects the S1024DW master with the A/D board
J2 = 15-pin accessory connector
H1, H2 = header blocks that connect a master unit to one or more slave units
Continuous Strobe Rate
The continuous strobe rate is controlled by the A/D frequency input to the spectrometer and the position of
the jum per JP3. The ju mper selects a divider for the input clock. To change the jump er it is necessary to
remove the S1024DW from its housing.
Jumper Position Divisor
1 Buffered input from D25 pin 20
2210195 Hz
321248.8 Hz
421412.2 Hz
52163.1 Hz
60
S1024DW Flash Rate
(running @ 200 kHz)
Page 64

Appendix C: External Triggering
Our S2000 and S1024DW Spectrometers provide four
method s of a cq u iring data. In the Normal Mode, O cean
Opti cs s p ectromet er s ar e “free runnin g.” That is, the
spectrometer is continuously scanning, acquiring, and
tran s fer ring data to your comput er , according to
parameters set in the software. In this mode, however,
there is no way to synch ronize the scannin g, acquiring and
transferring of data with an external event.
To synchronize data acquisition with external events, three
other modes of acquiring data are available. Each mode
involves applying an extern al trigger to the spectrometer
before the software receives t he data. The length of the integration tim e an d the source for the integr ation
clock depend upon the mode chosen. All other acquisition parameters are set in the software.
For each external tr ig ger mode, Pin 3 of the J2 (D-SUB-
15) Accessory Connector su pplies volt age to the
spectrometer . To operate in the Software M ode, the
triggering d evi ce must be connected to Pin 8 of the J2
(D-SUB-1 5 ) A ccessory Con nector . To operate in th e
Synchronization Mode, the triggering device must be
conn ected to Pin 5 of the J2 (D-SUB-15) Accessory
Connector. And to operate in the Hardwar e Mod e, the
triggering d evi ce must be connected to Pin 4 of the J2
(D-SUB-1 5) Access ory Connector.
J2 (D-SUB-15) Accessory Connector (female)
External Software T rigger
In this le vel-triggered mode , the spectro meter is “fre e running ,” ju s t as it is in the Normal Mode. The
spectrometer is con tinuall y scan ning and collecting data. Wit h ea ch tr igger, the data collected up to th e
trigger event is transferred to the software. If you continuously apply triggers, such as by holding down the
button on an external switch, this mode is equivalent to operating in the Normal Mode.
In the Software Mode, you set the integration time in the software. (It is the only external triggering mode
where the integration time is set in the software.) All other acquisition parameters are set in the software as
well. The source for the integration cl ock com es from the A/D convert er .
Use the Software Mode if you:
• are using a continuous illumination source, and the light intensity is constant before, during and after
the trigger
• need to set the integration time in the software
To Use the Software Mode:
1. Supply a line from your triggering device to Pin 3 of the J2 Accessory Conn ector to pr ovi d e the
positive voltage +5VDC to the spectrometer. (See figure above for pin location.) We do not advise
using an outside source to supply the voltage, as it is based on a referenced ground and your reference
may be different from ours. Using Pin 3 to supply voltage ensures that the spectrometer will receive
the appropria te voltage for the trigger event.
61
Page 65

2. Supply a line from Pin 8 of the J2 Accessory Con nector to your trigg er ing device. (See figure on page
61 for pin location.)
3. Set your acquisition parameters in the software via the Acquisition Dialog Bar or the Configure Data
Acquisition dialog box. To access the dialog box, click the Data Acquisition icon or select
Configure Data Acquisition
4. Select
5. To save processed d ata with ea ch ex ternal tri g ger, enabl e the
6. Once you sel ect an external trigger mode, it will app ear on your computer that your spectrometer is
It is important to note that since this is a level-triggered mode, the amount of delay between the trigger
pulse and when a spectrum is acquired is indeterminate because the delay is dependent upon:
• how fast the software polls the Pin 8 line and recog nizes it is HIGH
• the amount of time until the start of the next integration period
Spectrum | Configure Data Acquisition
and select
box. If you enable this function, you will be presented with a file save dialog box with each trigger.
To avoid manually naming a file for each trigger, you can enable the
function by selecting
name and starting index for the autoincremented files.
unresponsive. Instead, it is waiting for the trigger. Activate your triggering device. The acquisition
parameters, the name of the window acquiring data and the trigger mode are all displayed in the
main status bar.
Software Trigger
File | Autoincrement Filenames | Enabled
from the menu.
.
from the menu. Choose the
Automatically save file on trigger
Autoincrement Filenames
from the men u. Choos e a base
External Trigger
Spectrum |
page
Externa l Synchronization Trigger
In this edge-triggered mode, the spectrometer is idle until you apply the initial trigger to the spectrometer.
With each trigger, the foll owing occur s:
1. the spectromet er stops taking its curr ent scan and da ta is transfer red to the s oft ware
2. the spectromet er begins a new scan
3. the spectrometer integrates until another trigger is applied
In the Synchronization Mode, the integration time is set by the frequency of triggers applied to the
spectrometer. The effective integration time is the time between rising edges of signals applied to Pin 5 of
the J2 A ccessory Connector. All other acqu isition parameters are set in the software. The source for the
integration clock is the external tr ig gering devi ce itself, such as a peri odic TTL signal.
Use the Synchronization Mode if you:
• must synchronize your scans to an external clock source
• are using a lock-in amplifier
• are using a chopper
To Use the Synchronization Mode:
1. Supply a line from your triggering device to Pin 3 of the J2 Accessory Conn ector to pr ovi d e the
positive voltage +5VDC to the spectrometer. (See figure on page 61 for pin location.) We do not
advise using an outside source to supply the voltage, as it is based on a referenced ground and your
refer ence may be different from ours. Using Pin 3 to sup pl y voltage en sures that th e s p ectromet er wi ll
receive the appropriate vol tage for the trigger event.
2. Supply a line from Pin 5 of the J2 Accessory Con nector to your trigg er ing device. (See figure on page
61 for pin location.)
3. Set other acquisition parameters in the softwar e via th e A c quisi t ion Di a log Bar or the Configur e Data
Acquisition dialog box. To access the dialog box, click the Data Acquisition icon or select
Configure Data Acquisition
4. Select
Spectrum | Configure Data Acquisition
and select
Synchronization
from the menu.
.
from the menu. Choose the
External Trigger
Spectrum |
page
62
Page 66

5. To save processed d ata with ea ch ex ternal tri g ger, enabl e the
Automatically save file on trigger
box. If you enable this function, you will be presented with a file save dialog box with each trigger.
To avoid manually naming a file for each trigger, you can enable the
function by selecting
File | Autoincrement Filenames | Enabled
Autoincrement Filenames
from the men u. Choos e a base
name and starting index for the autoincremented files.
6. Once you sel ect an external trigger mode, it will app ear on your computer that your spectrometer is
unresponsive. Instead, it is waiting for the trigger. Activate your triggering device. The acquisition
parameters, name of the window acquiring data and trigger mode are displayed in the main status bar.
External Hardwar e T r igge r
In this edge-triggered mode, the spectrometer is idle until you apply a trigger to the spectrometer. With
each trigger, the following occurs:
1. the spectromet er is cleared and then begins integra ting
2. the spectrometer integrates for a fixed period of time, determined by the jumpered pins on the
spectrometer’s circuit board
3. the data is transfer red to the software
4. the spectrometer then sits idle, waiting for the next trigger
In the Hardware Mode, you set the integration time by positioning jumpers over pins on the spectrometer’s
circuit board. All other acquisition parameters are set in the software. The source for the integration clock is
the ext ernal tri g gering device i tself. This mode is i d eal for use with laser and other short - p ulse events.
Use the Hardware Mode if you:
• are using a pulsed excitation or light source in your experiment
• are doing LIF (fluorescence with puls ed ex citati on ) or phosphorescence exp eriments
• are able to jumper the pins on Jum per Block 4 of th e spectrom eter’s electroni c board
• need t o syn ch roniz e an a cquisition with an external event
To Use the Hardware Mode:
1. Supply a line from your triggering device to Pin 3 of the J2 Accessory Conn ector to pr ovi d e the
positive voltage +5VDC to the spectrometer. (See figure on page 61 for pin location.) We do not
advise using an outside source to supply the voltage, as it is based on a referenced ground and your
refer ence may be different from ours. Using Pin 3 to sup pl y voltage en sures that th e s p ectromet er wi ll
receive the appropriate vol tage for the trigger event.
2. Supply a line from Pin 4 of the J2 Accessory Con nector to your trigg er ing device. (See figure on page
61 for pin location.)
3. To set the integration time, look at the charts below. After finding the A/D converter you are using,
choose your integration time. You have four choices.
Integr atio n Time
SAD500
Fm = the master clock frequency in Hz (i.e., 200 kHz for the SAD500); shorted = connected; open = disconnected
(1 MHz Master Clock Freq)
5 ms 10 00/ F
60 ms 12 000/F
300 ms 60000/ F
655 ms 131070/ F
Integr atio n Time
Equation
m
m
m
m
Jumper Bl ock 4 (JP4)
Pins 1-2 Pins 3-4
open open
open shorted
shorted open
shorted shorted
63
Page 67

4. Once you have selected the integration time, note the configuration of the pins in
the Jumper Block 4 colu mn of the chart.
5. Remove your spectrometer from its housing. Do not tamper with the optical
bench. (If you h ave mor e than one chan nel in your system, you may have to
discon nect the ch an nels from on e an ot her. The ma s ter spectr om eter is alwa ys on
the bott om of a multipl e ch an nel system. ) In the center of the green circuit
boar d, near the opti cal bench, find Jumper Bl ock 4 , labeled JP4. (See the fi gure
to the right.) Jumper Block 4 consists of the first four pins, which are numbered
1, 2, 3, and 4. Using jumpers, configure the pins to match the integration time
you select ed.
For exam ple:
•
You have an S1024DW and a SAD500 A/D converter
•
O ut of your fo u r c hoic es f or an integr a tion time, you select 60 milliseconds
•
Pins 1-2 must be open and Pins 3-4 must be shorted
•
Leave Pins 1-2 uncovered and place a jumper over Pins 3-4
6. Set other acquisition parameters such as ave raging and boxcar sm oothing in the software via the
Acquisition Dialog Bar or the Configure Data Acquisition dialog box. To access the dial og box, click
the Data Ac quisition icon or select
Spectrum | Configure Data Acquisition
from the menu.
7. Select
Spectrum | Configure Data Acquisition
and select
Hardware Trigger
.
from the menu. Choose the
8. To save processed d ata with ea ch ex ternal tri g ger, enabl e the
Automatically save file on trigger
External Trigger
page
box. If you enable this function, you will be presented with a file save dialog box with each trigger.
To avoid manually naming a file for each trigger, you can enable the
function by selecting
File | Autoincrement Filenames | Enabled
Autoincrement Filenames
from the men u. Choos e a base
name and starting index for the autoincremented files.
9. Once you sel ect an external trigger mode, it will app ear on your computer that your spectrometer is
unresponsive. Instead, it is waiting for the trigger. Activate your triggering device. The acquisition
parameters, name of the window acquiring data and trigger mode are displayed in the main status bar.
It is important to note that if you apply triggers faster than the fixed integration time, you will miss
acquisitions.
64
 Loading...