

Page 1

E-mail:
Info@OceanOptics.com
(General sales inquiries)
RaySphere Solar Analysis System (RaySphere and RaySphere 1700)
Installation and Operation Manual
Document Number RAYSPHERE-1700-02-201304
Offices: Ocean Optics, Inc. World Headquarters
830 Douglas Ave., Dunedin, FL, USA 34698
Phone 727.733.2447
Fax 727.733.3962
8 a.m.– 8 p.m. (Mon-Thu), 8 a.m.– 6 p.m. (Fri) EST
Orders@OceanOptics.com (Questions about orders)
TechSupport@OceanOptics.com (Technical support)
Page 2

Ocean Optics EMEA
Additional
Offices:
Ocean Optics Asia
137 Xianxia Road, Suite 1802, Changning District, Shanghai, PRC. 200051
Phone 86.21.5206.8686
Fax 86.21.5206.8686
E-Mail Sun.Ling@OceanOptics.com
Geograaf 24, 6921 EW DUIVEN, The Netherlands
Phone 31-(0)26-3190500
Fax 31-(0)26-3190505
E-Mail Info@OceanOptics.eu
Regional Headquarters
Maybachstrasse 11
73760 Ostfildern
Phone 49-711 34 16 96-0
Fax 49-711 34 16 96-85
E-Mail Sales@Mikropack.de
Copyright © 2012 Ocean Optics, Inc.
All rights reserved. No part of this publication may be reproduced, stored in a retriev al system, or tr ansmitted, by any means, elec tronic,
mechanical, photocopying, recording, or otherwise, without written permission from Ocean Optics, Inc.
This manual is sold a s part of an order and subject to th e cond ition that it shall not, by way of trade or otherwise, be lent, re-sold, hired out or
otherwise circula ted without the prior consen t of Ocean Optics, Inc. in any form of b inding or cover other than that in which it is published.
Trademarks
All products and services herein are the tradem arks, service marks, registered trademarks or registered service m arks of their respective owner s.
Limit of Liability
Ocean Optics has made every ef fort to mak e t his manual as complete and as accurate as p o ssible, but n o wa rranty or fitness is implied. The
information provided is on an “as is” basis. Ocean Optics, Inc. shall have neither liability nor responsibility to any person or entity with respect to
any loss or damages arising from the information contained in this manual.
Page 3

Important Safety Notices
1. Read the instructions first to avoid any damages.
2. Store your RaySphere system at above -10 °C and below 50 °C to avoid any damages.
3. This is a calibrated measurement device. Handle the system with care. The calibration precision may
be lost if any dust or other pollutant enters the integrating sphere. When the system is not in use, store
it with a dust protector. When removing the dust protector, be sure to keep pollutants from entering
the integrating sphere aperture.
4. Recalibration is recomm ended after one year of use or sooner is the measurements do not seem to be
accurate. More frequent recalibration may be needed of the RaySphere has suffered any heavy
shocks or is being used in a dusty environment.
5. The RaySphere is heavy. Take care to keep it from falling.
6. If the seal on the screws is broken, then the calibration is no longer valid.
7. To ship the RaySphere, pack it in the Pelican case, which is optimized for transport. Hand carrying if
the RaySphere is recommended for all traveling.
8. Contact your Ocean Optics regional headquarters for questions about RaySphere.
9. Be sure to follow all safety instructions for your solar simulator.
10. Do not cover vents.
11. Do not cover the holes at the top of the RaySphere main body.
RAYSPHERE-1700-02-201304 i
Page 4

Page 5

Table of Contents
About This Manual ......................................................................................................... v
Document Purpose and Intended Audience .............................................................................. v
Document Summary .................................................................................................................. v
Product-Related Documentation ............................................................................................... vi
Upgrades ....................................................................................................................... vi
Chapter 1: Introduction ..................................................................... 1
Description .................................................................................................................... 1
Photocurrent Recording ............................................................................................................. 2
Calibration.................................................................................................................................. 2
RaySphere Software ................................................................................................................. 2
Shipment Components .............................................................................................................. 2
Chapter 2: Installation and S e t-up .................................................... 5
Overview ....................................................................................................................... 5
RaySphere Components ............................................................................................... 5
Installing Software ......................................................................................................... 6
Assembling RaySphere ................................................................................................. 8
Chapter 3: Software Operation ......................................................... 9
Overview ....................................................................................................................... 9
Software Structure ......................................................................................................... 9
System Tab ............................................................................................................................... 10
Photo Current/Trigger Settings Tab .......................................................................................... 11
Spectrometer Tab ...................................................................................................................... 15
Classification Tab ...................................................................................................................... 18
Warni ngs and Status Inf ormation ................................................................................... 19
Chapter 4: File Types and Data Files ................................................ 21
Overview ....................................................................................................................... 21
Calibration Files ............................................................................................................. 21
Parameter File ............................................................................................................... 22
RAYSPHERE-1700-02-201304 i
Page 6

Table of Contents
Stray Light Correction Matrix ......................................................................................... 22
Saved File Types ........................................................................................................... 22
Chapter 5: Operation ......................................................................... 25
Overview ....................................................................................................................... 25
Triggering and Measurement Modes ............................................................................. 25
Optical Triggering ...................................................................................................................... 25
External Triggering .................................................................................................................... 28
Manual Triggering ...................................................................................................................... 29
Signal Path of Trigger .................................................................................................... 31
Timing and Delays ......................................................................................................... 32
Chapter 6: Using Preconfigured Configuration Files ...................... 35
Overview ....................................................................................................................... 35
How to Use Configuration Files ..................................................................................... 35
Contents of a Configuration File .................................................................................... 36
How to Create a Configuration File ................................................................................ 37
Chapter 7: Classifying the S olar Simulator and Displaying the Results
............................................................................................................ 39
Overview ....................................................................................................................... 39
Saving Results .............................................................................................................. 40
Validating a Solar Simulator .......................................................................................... 40
Using RaySphere with a Flash Solar Simulator ........................................................................ 40
Using RaySphere with a Continuous Solar Simulator ............................................................... 41
Validating the Test Results ........................................................................................................ 42
Chapter 8: Test Report ...................................................................... 43
Overview ....................................................................................................................... 43
Chapter 9: Nonlinearity Correction and Calibration ........................ 45
Overview ....................................................................................................................... 45
Nonlinearity Correction .............................................................................................................. 45
Wavelength Calibration ............................................................................................................. 45
Absolute Irradiance Calibration ................................................................................................. 45
Uncertainties Calculation ............................................................................................... 45
ii RAYSPHERE-1700-02-201304
Page 7

Table of Contents
Uncertainty for Spectral Match Test .......................................................................................... 49
Uncertainty of Repeated Measurements ................................................................................... 52
Quantitative Uncertainties ......................................................................................................... 52
How to Estimate the Uncertainties for the Spectral Match Test ............................................... 53
Appendix A: Components Technical Notes ..................................... 55
Overview ....................................................................................................................... 55
QE65000 Spectrometer ................................................................................................. 55
NIRQuest Spectrometer ................................................................................................ 55
Trigger Electronics ......................................................................................................... 55
USB-Hub ....................................................................................................................... 56
Appendix B: Specifications and Mechanical Diagram .................... 57
Mounting Options for RaySphere Main Body ................................................................. 58
Index ................................................................................................... 61
RAYSPHERE-1700-02-201304 iii
Page 8

Table of Contents
iv RAYSPHERE-1700-02-201304
Page 9
About This Manual
Document Purpose and Intended Audience
This document provides you with a detailed description of the RaySphere and Ray Sphere 1700 systems,
including installation and operating instructions. Quick start instructions are available for users who are
just interested in testing a solar simulator with RaySphere. See Product-Related Documentation
What’s New in this Document
This version of the RaySphere Solar Analysis System Installation and Operation Manual updates
specification information.
Document Summary
.
Chapter Description
Chapter 1: Introduction
Chapter 2: Installation and Set-up
Chapter 3: Software Operation
Chapter 4: File Types and Data Files
Chapter 5: Operation
Chapter 6: Using Preconfigured
Configuration Files
Chapter 7: Classifying the Solar Simulator
and Displaying the Results
Chapter 8: Test Report
Contains a description of the RaySphere system.
Provides installation instructions for RaySphere hardware
and software.
Provides software operation instructions for RaySphere.
Provides information on the calibration files, the stray
light correction matrix and the saved file types.
Contains instructions for operating the RaySphere
system using triggering.
Provides information on using preconfigured
configuration files, including how to create them.
Provides procedures for using RaySphere with solar
simulators and how to validate your results.
Describes a typical test report.
Chapter 9: Nonlinearity Correction and
Calibration
Appendix A: Components Technical Notes
RAYSPHERE-1700-02-201304 v
Contains nonlinearity correction and calibration
information as they pertain to RaySphere.
Lists technical notes for the RaySphere components.
Page 10

About This Manual
Chapter Description
Appendix B: Specifications
Contains product specifications.
Product-Related Documentation
• RaySphere Quick Start Instructions
• NIRQuest Near Infrared Spectrometer Installation and Operation Manual
• QE65000 Scientific-grade Fiber Optic Spectrometer Installation and Operation Manual
• SpectraSuite Spectrometer Operating Software Installation and Operation Manual
• External Triggering Options for Firmware Versions 3.0 and Above
You can access documentation for Ocean Optics products by visiting our website at
http://www.oceanoptics.com. Select Technical → Operating Instructions, then choose the appropriate
document from the available drop-down lists. Or, use the Search by Model Number field at the bottom
of the web page.
You can also access operating instructions for Ocean Optics products on the Software and Technical
Resources CD included with the system.
Engineering-level documentation is located on our website at Technical → Engineering Docs.
Upgrades
Occasionally, you may find that you need Ocean Optics to make a change or an upgrade to your system.
To facilitate these changes, you must first contact Customer Support and obtain a Return Merchandise
Authorization (RMA) number. Please contact Ocean Optics for specific instructions when returning a
product.
vi RAYSPHERE-1700-02-201304
Page 11
Chapter 1
Introduction
Description
RaySphere is a calibrated high-performance measurement device. It is designed for testing the spectral
distribution of all types of Solar Simulators and for validating the Simulator for the spectral match test in
accordance with the international standard IEC 90604-9: Solar Simulator Performance Requirements.
The RaySphere series of products consists of RaySphere and RaySphere 1700. They provide the
following features:
• Intuitive graphical interface
• Graphical and table display of classification results by wavelength bin
2
• Output of actual spectra in mW/cm
/nm
• Output of actual measurement and triggering timing with +/-44 µs resolution
• Printable classification report
RAYSPHERE-1700-02-201304 1
Page 12

1: Introduction
RaySphere contains one QE65000 spectrometer, while RaySphere 1700 contains two spectrometers
(QE65000 and NirQ512) and a trigger unit to control the measurement procedure and a hub. The trigger
sources can be a flash from the solar simulator, an electrical trigger pulse (high level with +5 V or +24 V)
or a measurement can be generated manually at any time.
RaySphere software allows full control during the testing and generates a test report with the
classification of the simulator.
Photocurrent Recording
A unique innovation for test control is the function photocurrent recording. A photodiode detects the
integral light intensity of the environment. The sudden increase of intensity is interpreted by the
electronics as a measurement event and the complete flash signal is recorded up to 160 ms flash duration.
The time-dependent photocurrent is displayed and the time interval in which the spectrometer has
recorded light from the solar simulator is indicated. The user can adjust delays to make sure that the
recording time of the spectrometer was at the stable flash phase and maximum control for the testing
procedure is given to minimize any kind of mismeasurement.
Calibration
The calibration is tested by an independent certificated optical calibration laboratory. The inaccuracy for
the spectral match as described in IEC 90604-9 is typically on the order of 2 %. Uncertainty has been
minimized to achieve highest precision. A detailed description about calibration and uncertainty is given
in this document.
RaySphere Software
The RaySphere software allows intuitive operation of the system and automatically generates a test report
with classification of the simulator. The software was especially designed for the requirements of the
solar industry.
Shipment Components
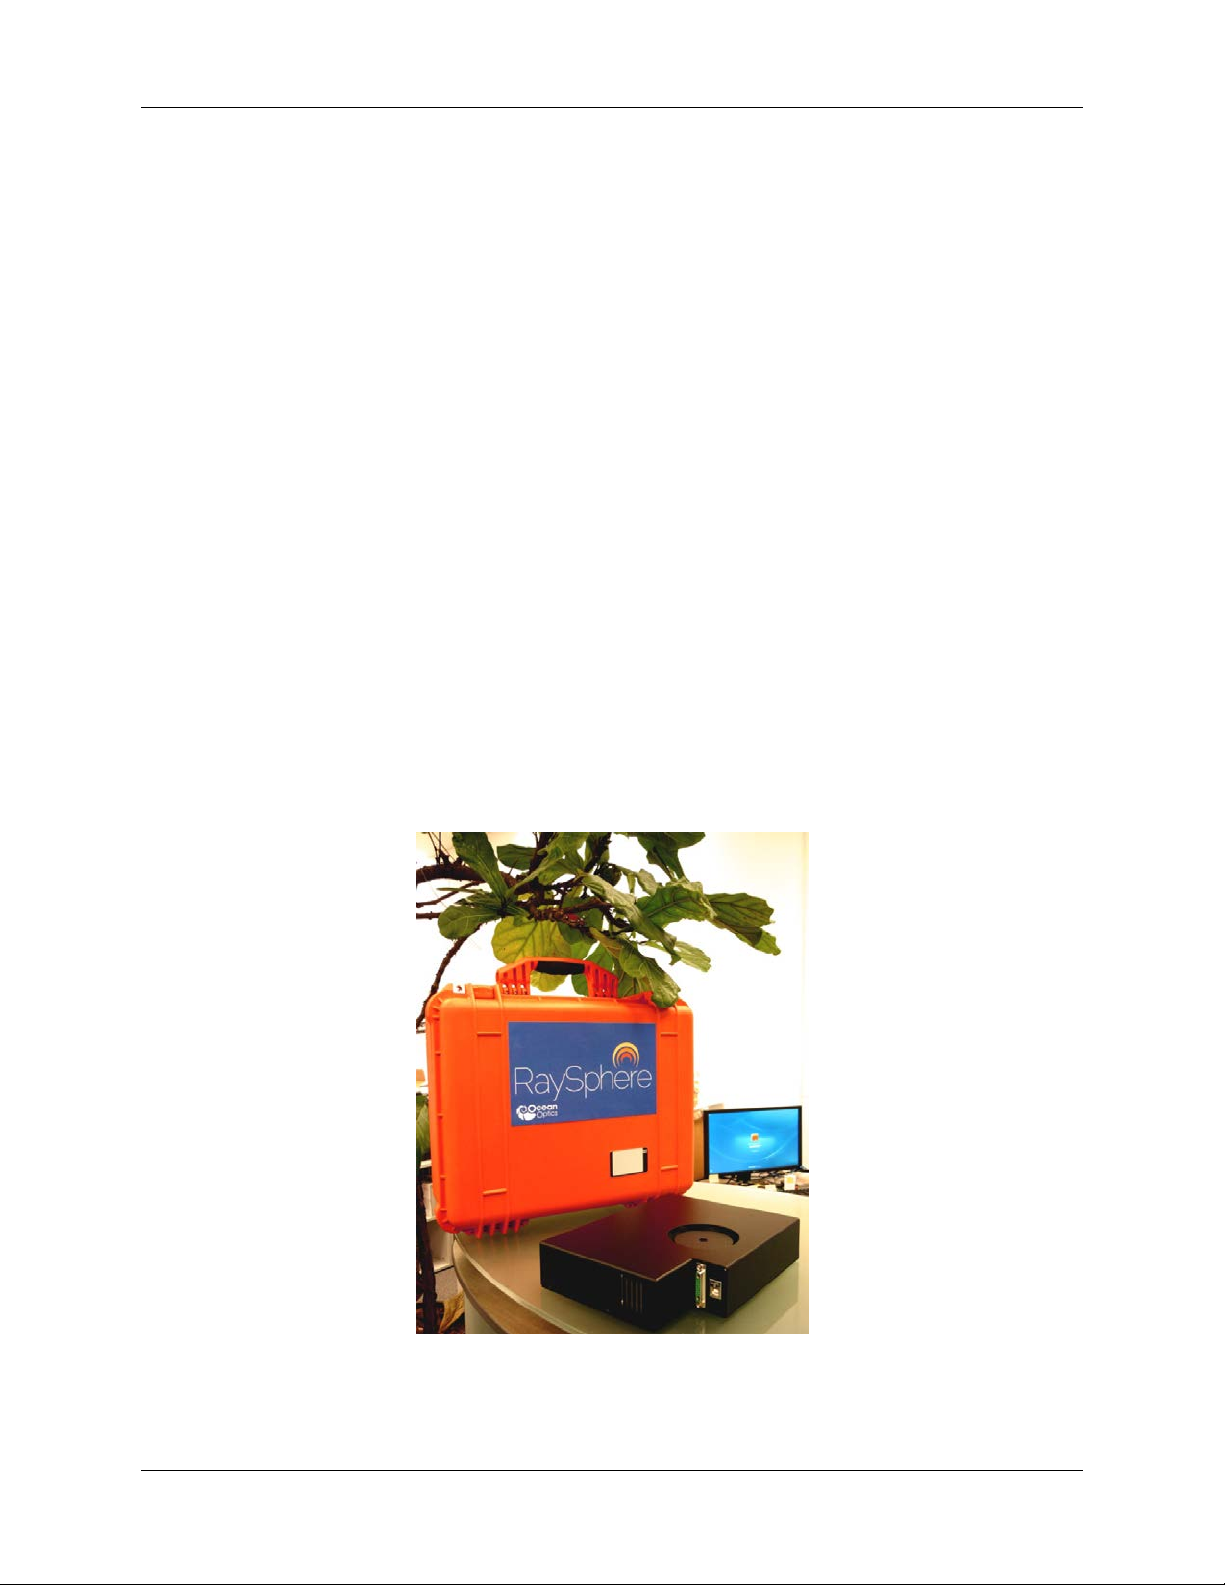
The RaySphere package consists of the following items:
• Pelican case: The transport box for the complete RaySphere System
• RaySphere main body
• Power Supply
• Four Power Cables, one each for USA, Europe, U K, and Australia
• Power Supply Connection Cable [SubD-type, 3 meters length]
• USB cable (USB-CBL-1): Connects RaySphere to a computer’s USB port, 3 meters length
• RaySphere CD: Contains RaySphere software and calibration files and manual
2 RAYSPHERE-1700-02-201304
Page 13

1: Introduction
• Software and Technical Resources CD: Contains software, operating instructions, and product
information for all Ocean Optics software, spectrometers, and spectroscopic accessories. You
need Adobe Acrobat Reader version 6.0 or higher to view these files (version 7.0 is included on
the CD). Documentation is also available on our website at
http://www.oceanoptics.com/technical/operatinginstructions.asp.
• Calibration documents
RAYSPHERE-1700-02-201304 3
Page 14

1: Introduction
4 RAYSPHERE-1700-02-201304
Page 15

Installation and Set-up
Overview
This chapter contains information for assembling your RaySphere unit.
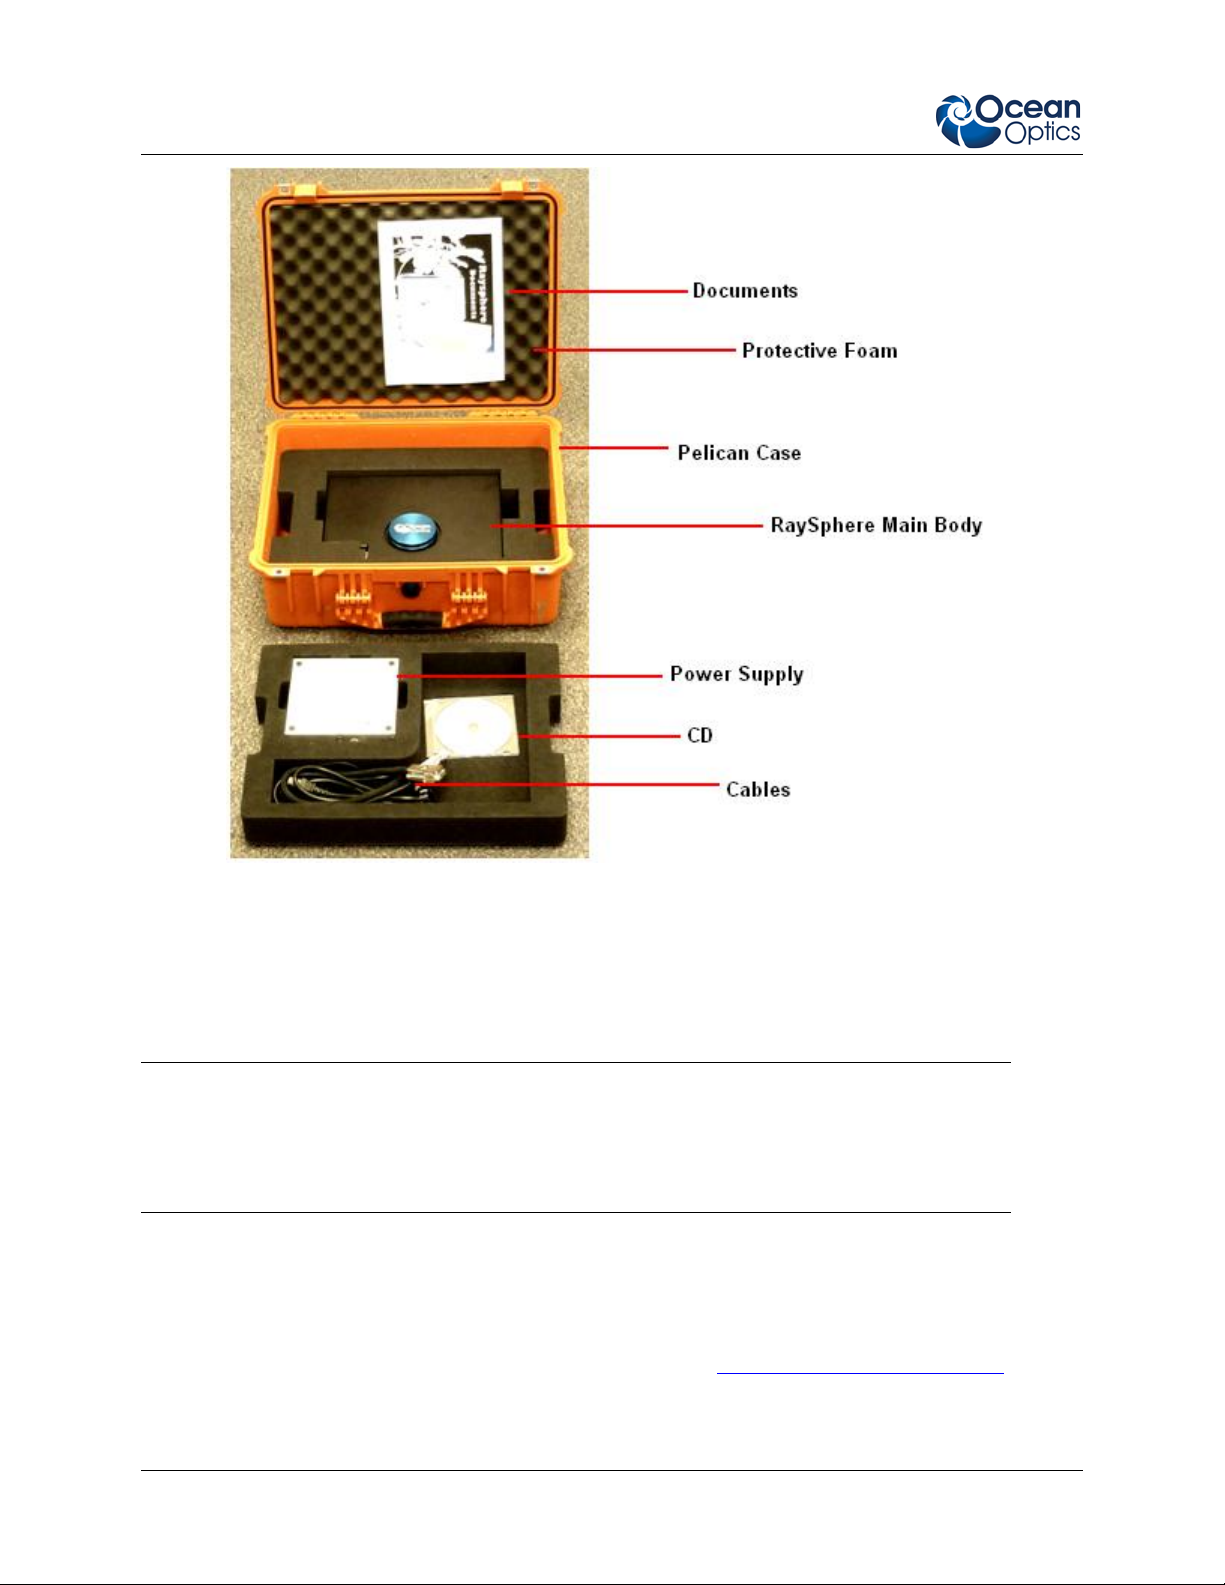
RaySphere Components
The following figures show the parts of the RaySphere main body.
Chapter 2
RaySphere Body
RAYSPHERE-1700-02-201304 5
Page 16
2: Installation and Setup
RaySphere Components
Installing Software
Caution
Install the software BEFORE connecting the spectrometer to your PC. The RaySphere
software installs the drivers requir ed for spe ctr ome ter ins tallat ion. I f you do not insta ll
RaySphere software first, the system will not properly recognize the spectrometer.
RaySphere includes special software for operating your RaySphere system. This software is located on
the Software & Technical Resources CD. The installation instructions are included below.
In addition, if you have purchased and are using SpectraSuite with the RaySphere for controlling the
spectrometers, follow the instructions in the SpectraSuite Spectrometer Operating Software Installation
and Operation Manual for software install at io n instruction s (see Product-Related Documentation
).
6 RAYSPHERE-1700-02-201304
Page 17

2: Installation and Setup
Caution
Do not run SpectraSuite and RaySphere software at the same time on the computer.
► Procedure
To install RaySphere software from the RaySphere CD,
1. Close all other applications running on the computer.
2. Load the RaySphere CD. The CD contains the calibration data, fundamental settings and the
software for operating the RaySphere on a 32-bit or 64-bit computer.
3. Select the Setup CD folder.
4. Select the installation file for either a 32- or 64-bit system. The setup process begins and the
following screen appears:
5. Click the Install button. Then follow the prompts in the installation wizard.
RAYSPHERE-1700-02-201304 7
Page 18
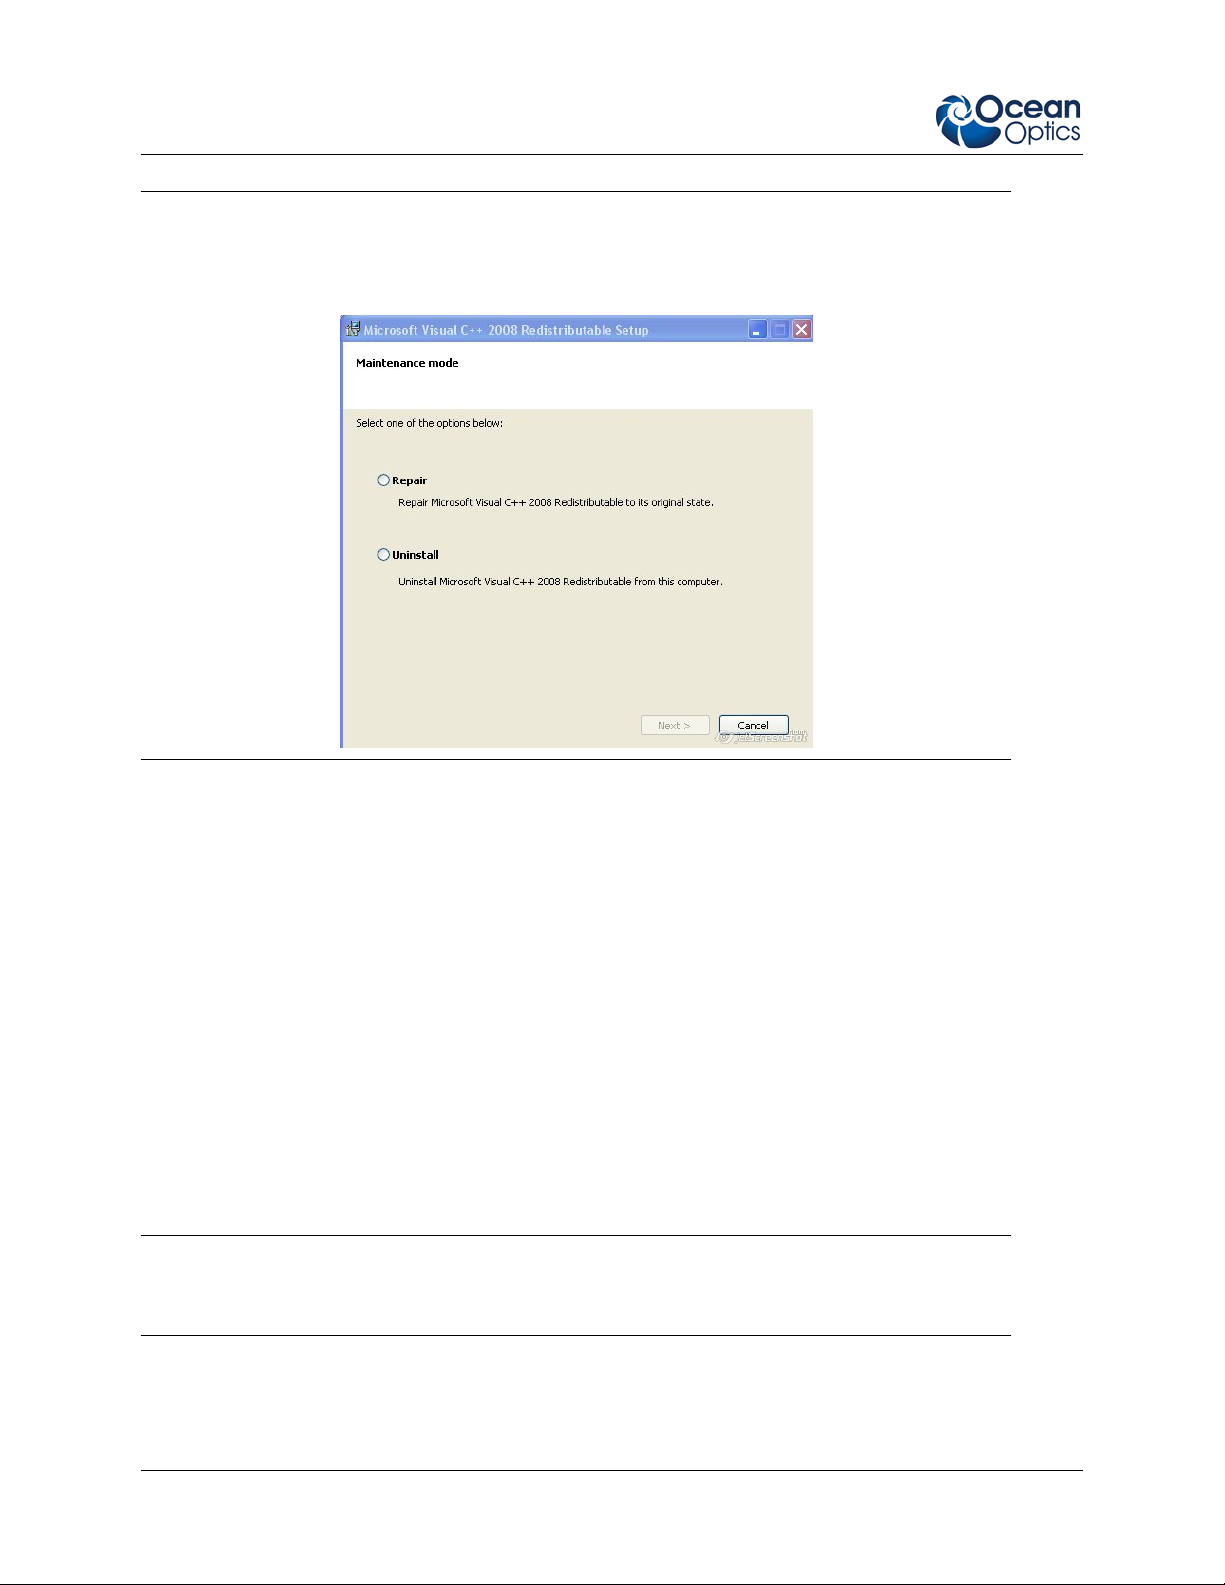
2: Installation and Setup
Note
If the following screen appears during the installation, select Repair:
6. Click Close when the installation is completed. It is not necessary to restart your computer.
Assembling RaySphere
Follow the steps below to set up your RaySphere for use.
► Procedure
1. Connect the power cable to the power supply.
2. Connect the RaySphere unit to the power supply with the SubD cable.
3. Switch on the power supply.
4. Connect the RaySphere to your computer using a USB cable.
Caution
Be sure to switch on the power supply before connecting the RaySphere to your computer.
Your RaySphere is now ready to use after 20 minutes of warm-up time.
8 RAYSPHERE-1700-02-201304
Page 19
Chapter 3
Software Operation
Overview
The RaySphere software is designed for requirem ents of the solar industry and related applications. The
operation and functions are as intuitive as possible and the functions are designed with the needs of the
user in mind.
Software Structure
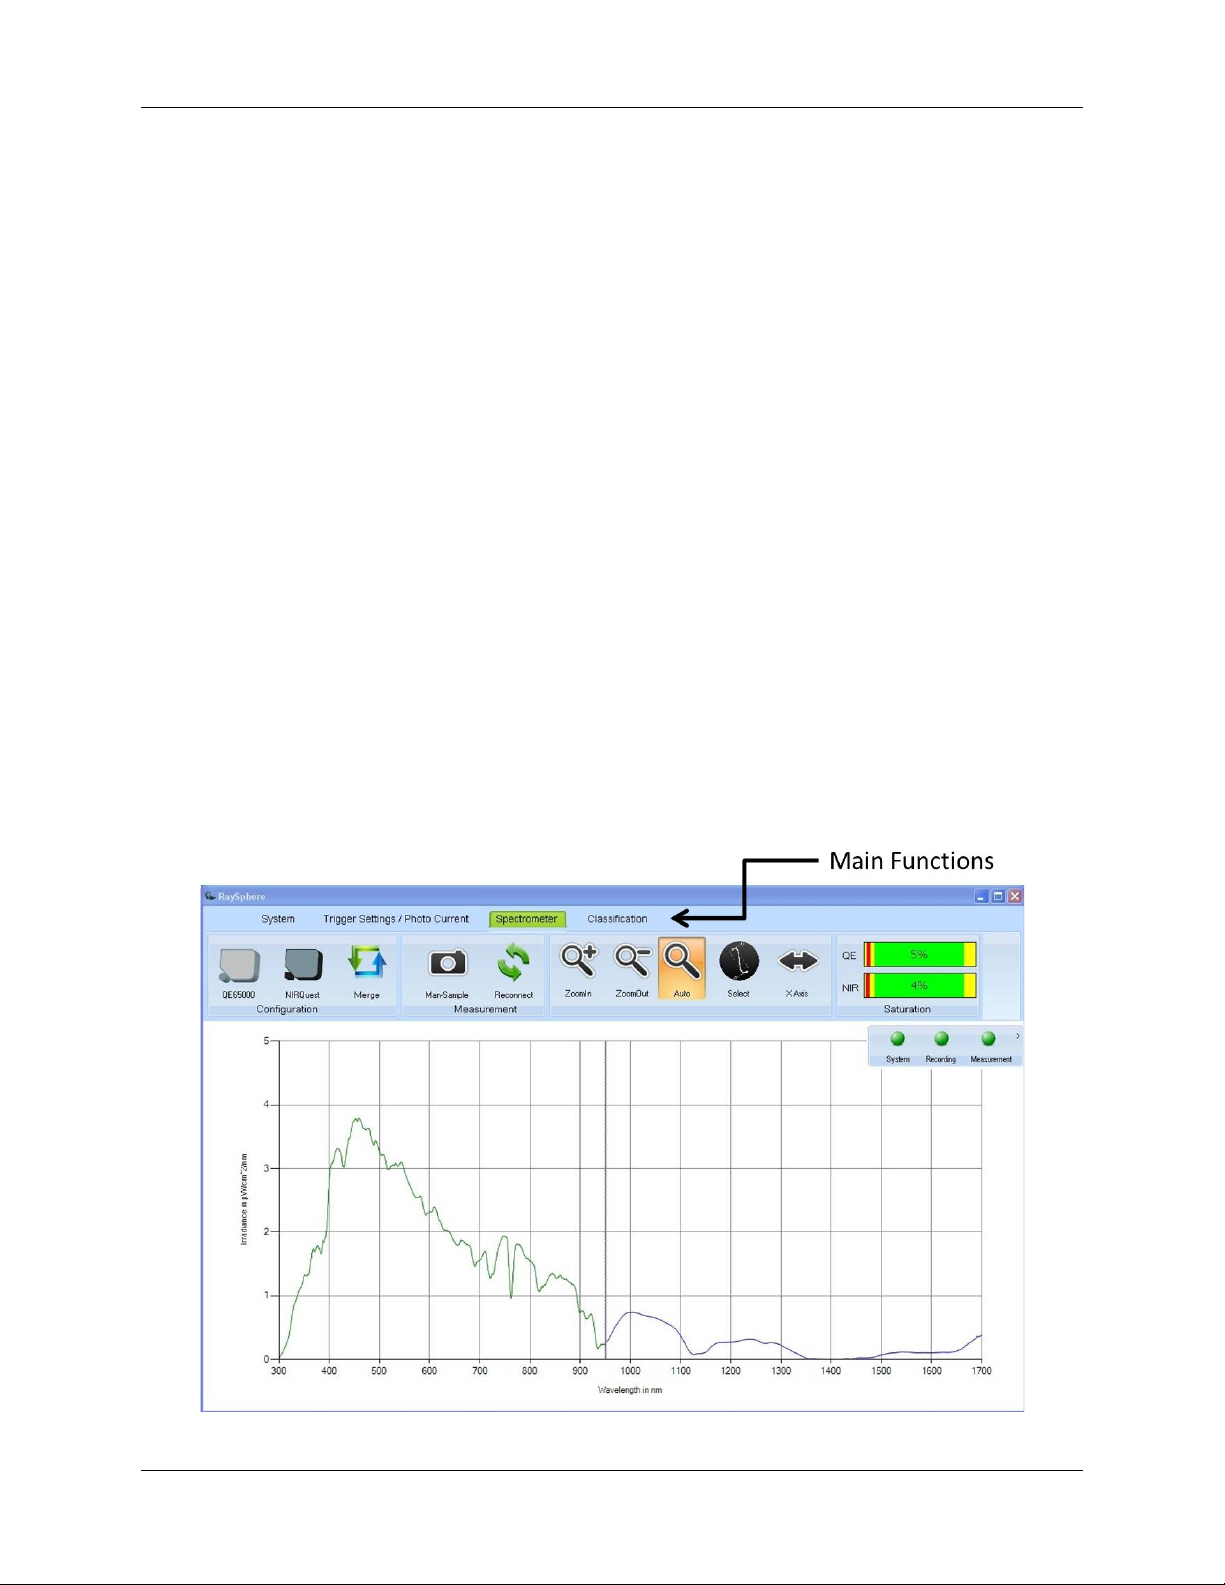
The software consists of four main functions tabs for controlling RaySphere settings and operation:
• System
• Photocurrent Trigger / Settings
• Spectrometer
• Classification
RAYSPHERE-1700-02-201304 9
Page 20
3: Software Operation
The four functions appear in the upper command line of the main screen. Pressing one of the controls
changes the background of the function name to green. The section becomes active and the page with the
function details appears.
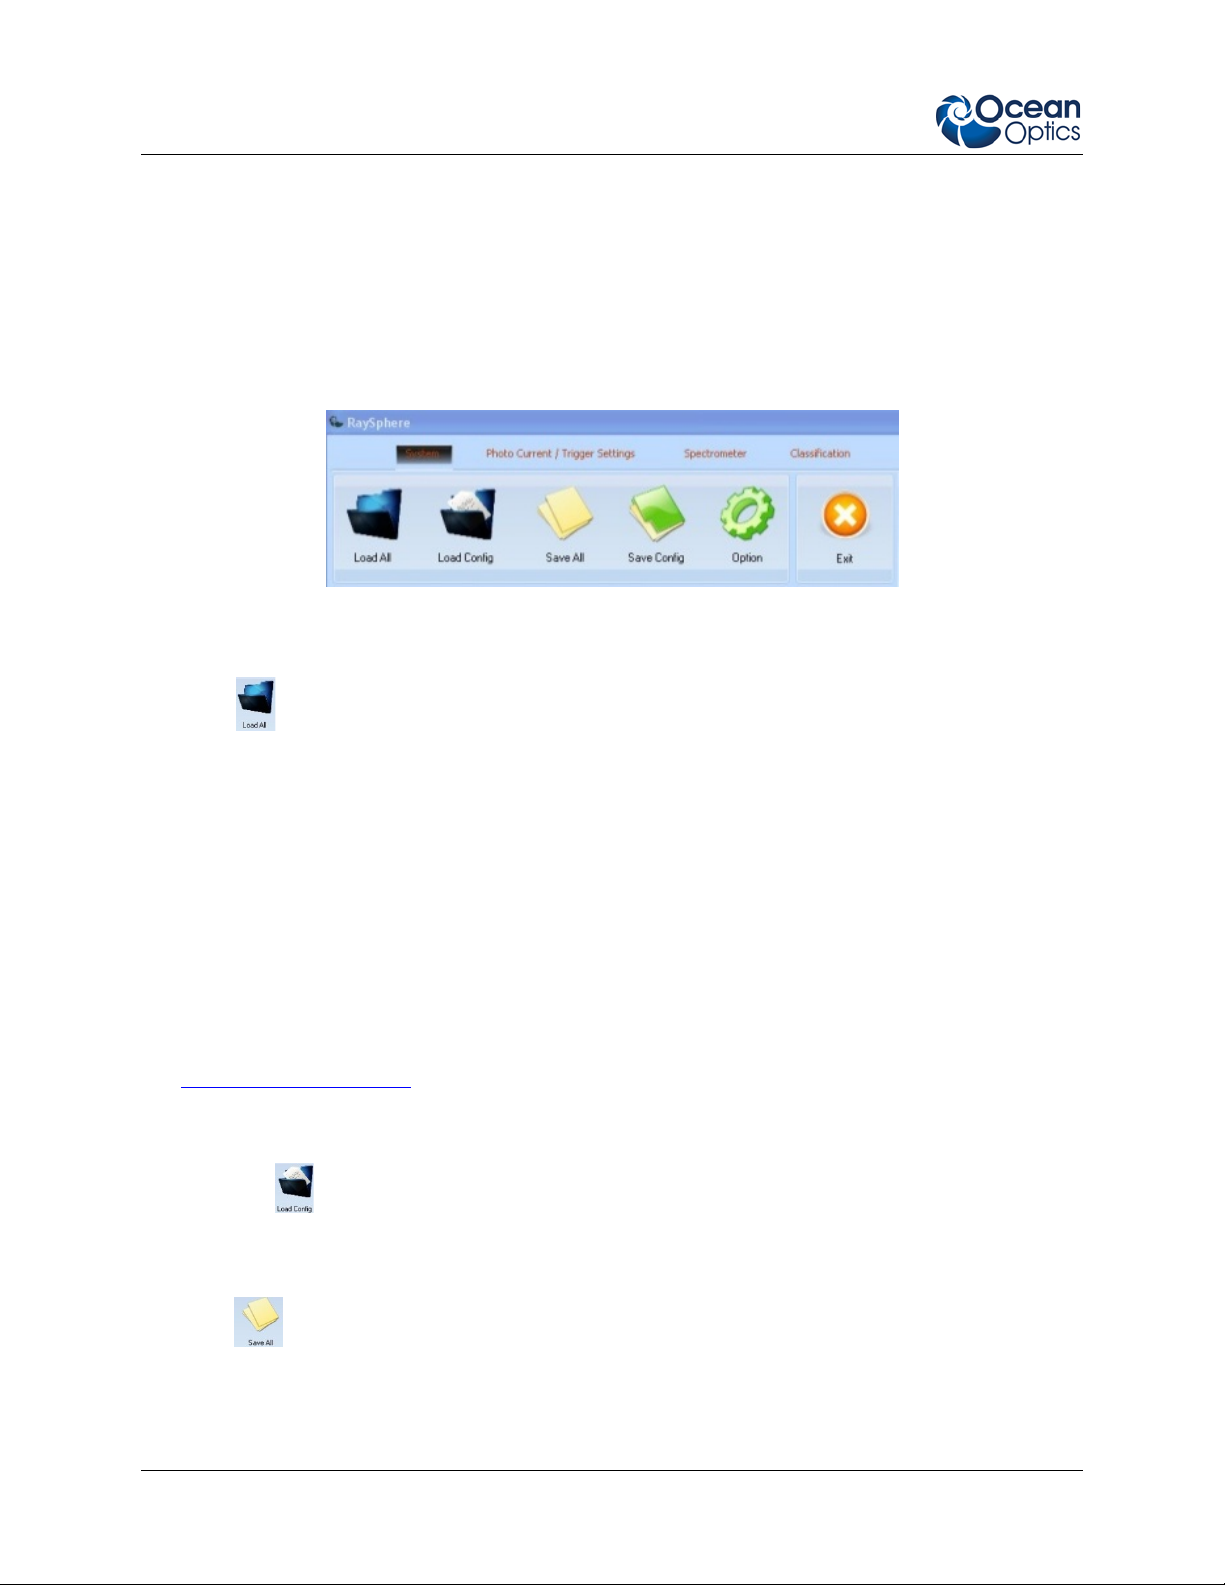
System Tab
The system tab allows you to load and save data.
Load All
Load All ( ) lo ads the fo llow ing file types with the na me you specify:
• Classification_Date_time_Name.txt
• Configuration_Date_Time_Name.cfg
• PDcurr_Date_Time_Name.cfg
• Report_Date_Time_Name.pdf
• Spec_merge_Date_Time_Name.txt
• Spec_NR_Date_Time_Name.txt
• Spec_QE_Date_Time_Name.txt
• Spectrum4000-1100_Date_Time_Name.txt
See File Types and Data Files
for more information.
Load Config
Load Config ( ) loads a configuration file to operate RaySphere under conditions defined in the file.
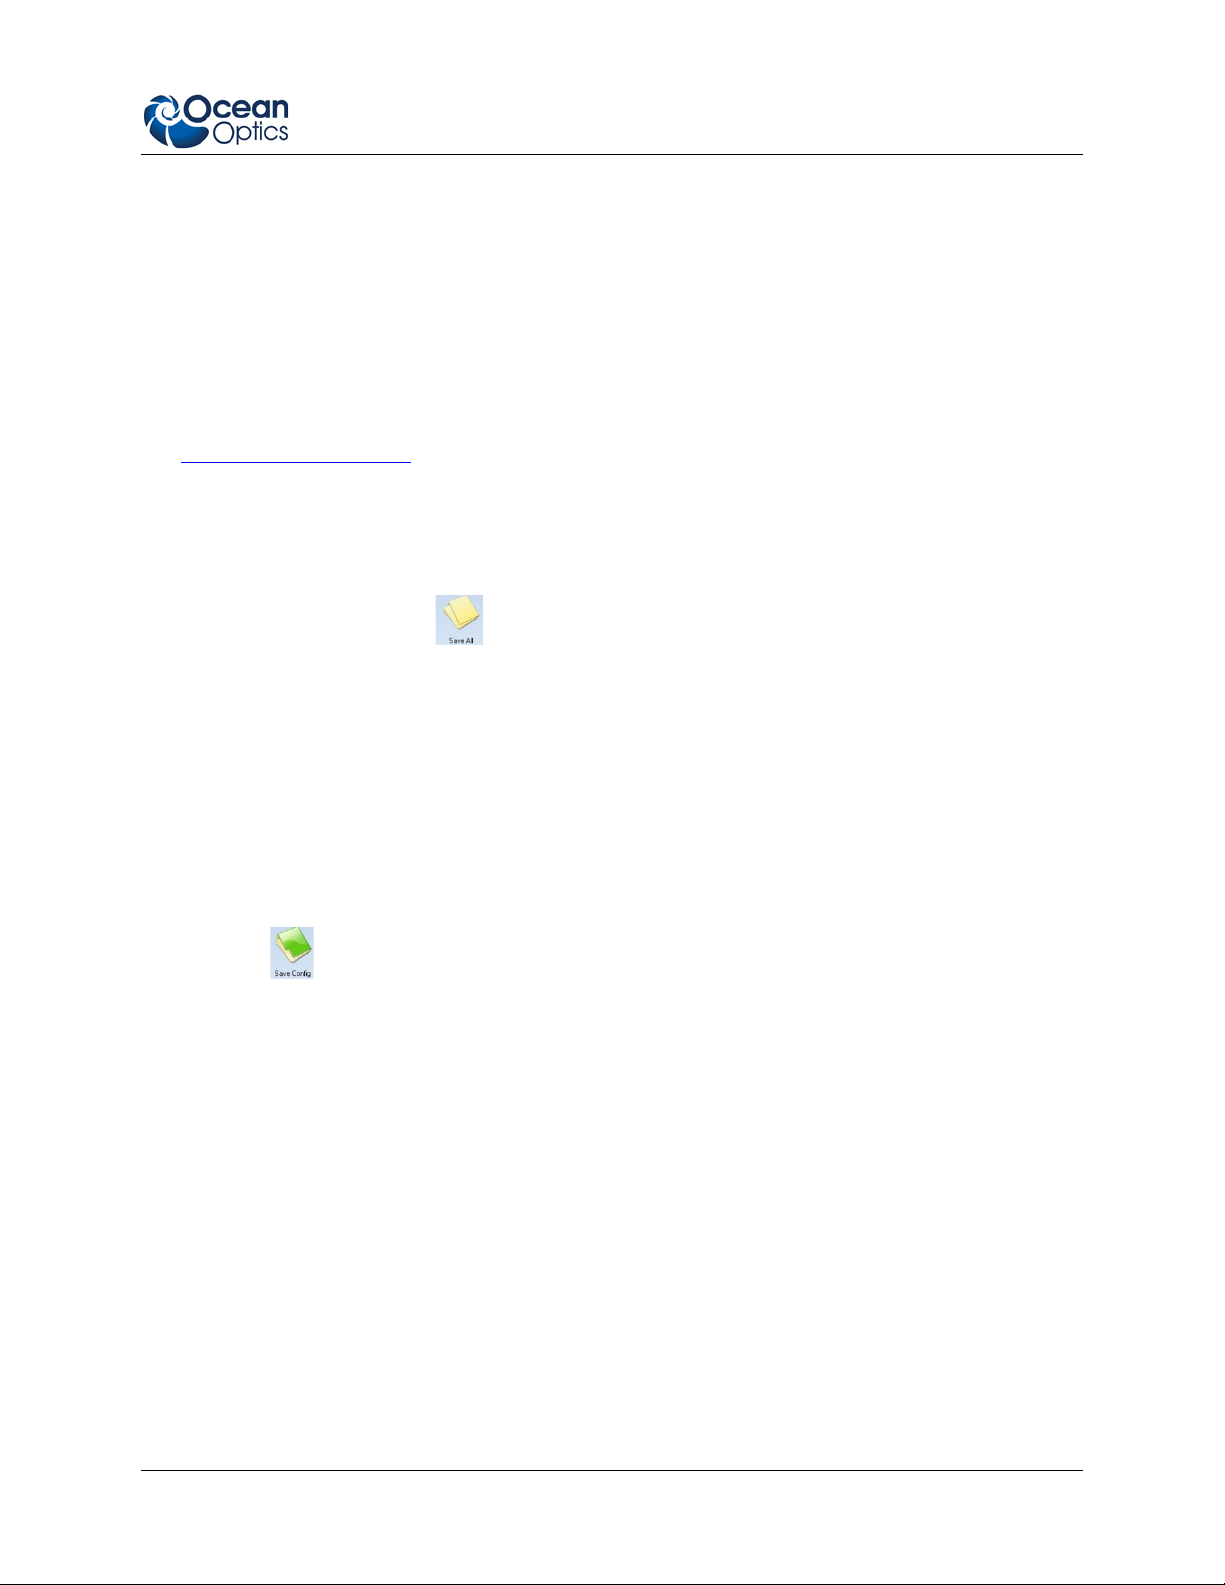
Save All
Save All ( ) saves all data as one of the following file types:
• Classification_Date_time_Name.txt
10 RAYSPHERE-1700-02-201304
Page 21
3: Software Operation
• Configuration_Date_Time_Name.cfg
• PDcurr_Date_Time_Name.cfg
• Report_Date_Time_Name.pdf
• Spec_merge_Date_Time_Name.txt
• Spec_NR_Date_Time_Name.txt
• Spec_QE_Date_Time_Name.txt
• Spectrum4000-1100_Date_Time_Name.txt
See File Types and Data Files
for more information.
► Procedure
To save data,
1. Click the Save All icon (
2. Select or create the folder where the data is to be saved.
3. Assign a name to the file. It is recommended to use the serial number of the solar simulator or
anything specific which clearly identifies the tested solar simulator.
4. The date and time is added from your computer settings. Ensure that your computer is using the
correct date and time.
). The Save Data dialog box opens.
Save Config
Save Config ( ) saves the actual RaySphere confguration in one file.
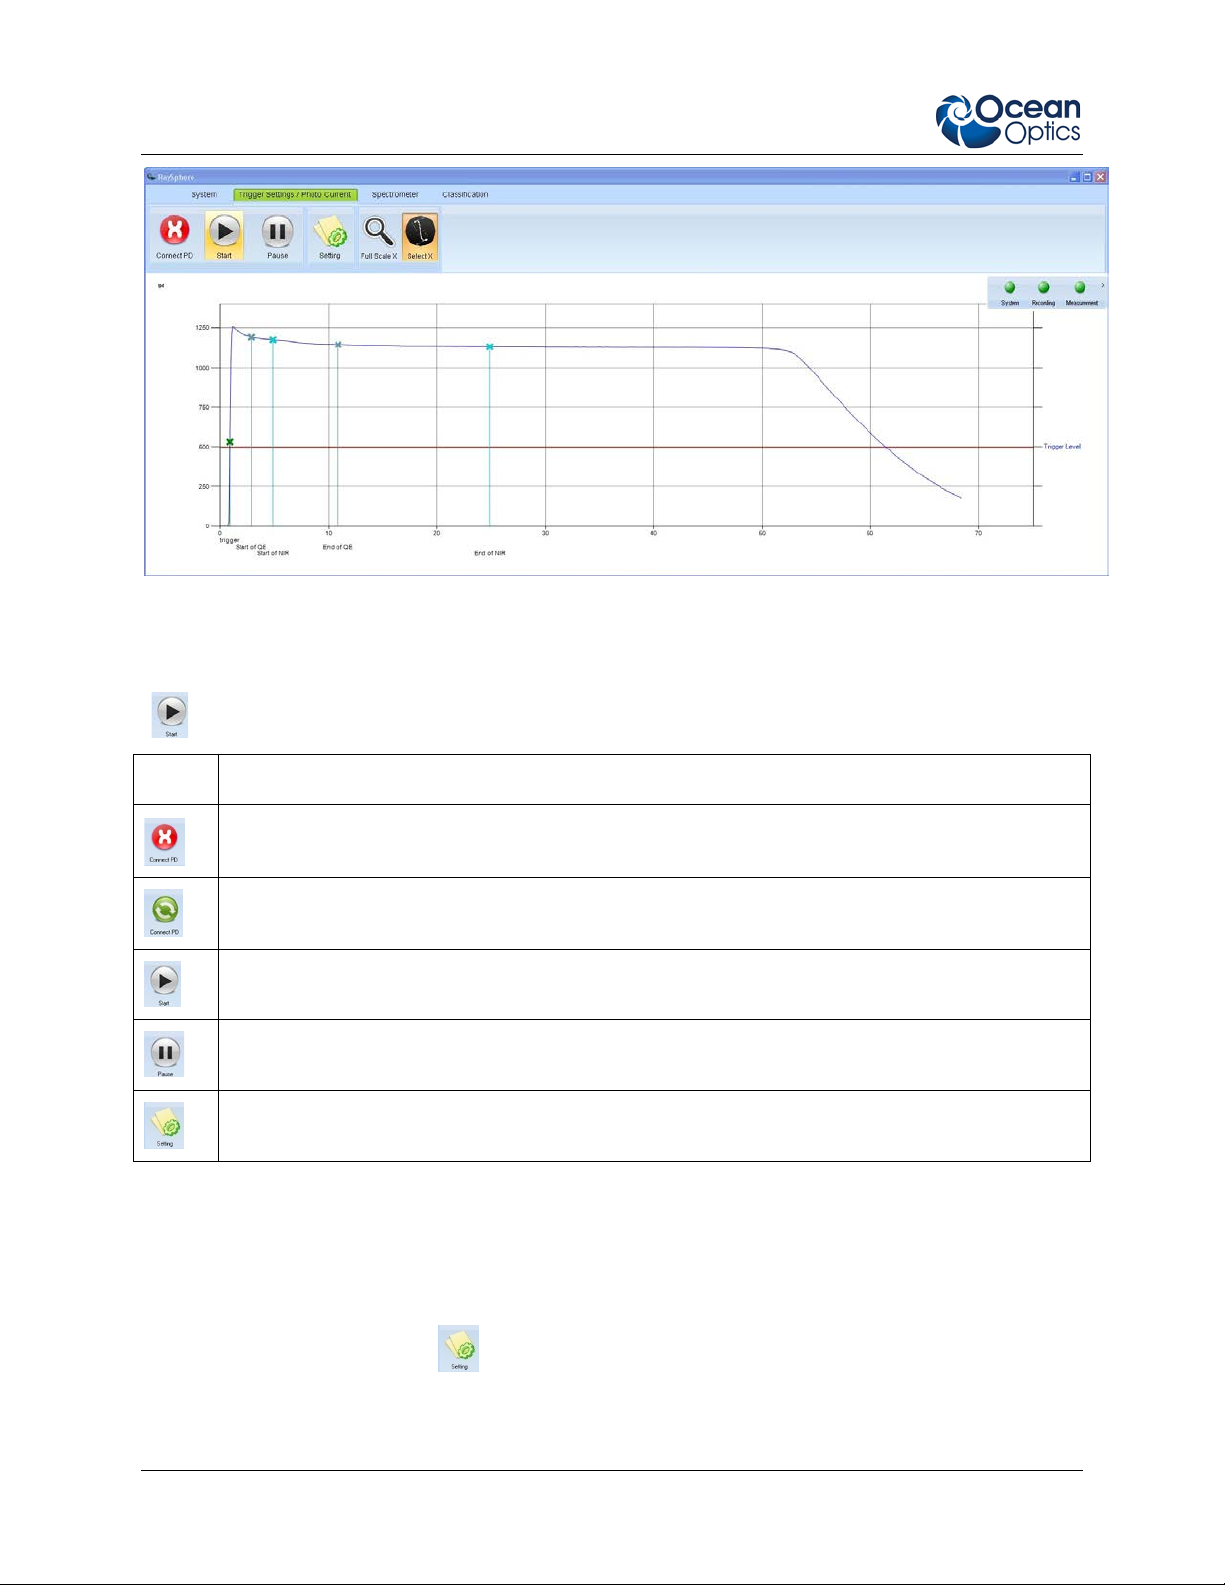
Photo Current/Trigger Settings Tab
The Photo Current/ Trigger Settings tab enables you to control the settings for photo current and
triggering of the RaySphere. The maximum sample time for the photocurrent is 160 ms.
RAYSPHERE-1700-02-201304 11
Page 22
3: Software Operation
Connect Pd
Connect Pd connects RaySphere photocurrent and trigger unit electronics to the computer when the Start
) button is pressed.
(
Icon Meaning
The computer has no connection to RaySphere’s photocurrent and trigger unit.
The computer is connected successfully to the RaySphere electronics.
Sets the system to ready status for taking a measurement.
Disables the ready status to allow changes to photocurrent and trigger settings. See Changing
Photocurrent and Trigger Settings.
Displays the Photocurrent/ Trigger Settings dialog box to allow changes to the photocurrent
and trigger settings.
Changing Photocurrent and Trigger Settings
► Procedure
To change photocurrent and trigger settings,
1. Click the Setting button (
12 RAYSPHERE-1700-02-201304
). The Photocurrent/Trigger Settings dialog box appears.
Page 23

3: Software Operation
Make the desired setting changes.
Setting Meaning
*Delay of QE/NQ Set the delay time for the QE65000 (QE) and/or NIRQuest (NQ) spectrometer in
the RaySphere. The available range is 0 – 160 ms.
Amplification Sets the amplification of the photocurrent in two steps:
• Gain 1, Gain 2, Gain 3: amplify by a factor of 1, 10, 100, respectively
• Fine amplific at ion by a factor of 1:10
The resulting overall amplification is: Amplification = GainX x fine amplification.
[GainX = {1; 2; 3}]
*Trigger Level Adjusts the trigger level values for the photocurrent from 500 to 4094.
Trigger Source Changes the trigger source:
• External – RaySphere reacts to an electrical trigger pulse which can be
applied on the power supply
• Flash – RaySphere triggers itself by flash if the trigger level is reached
• Manual – Spectrum recording is done manually. RaySphere measures
when the sample button on the Spectrometer page is pressed.
• Off – no triggering
RAYSPHERE-1700-02-201304 13
Page 24

3: Software Operation
Setting Meaning
Operation Mode Changes the mode of operation:
• Continuous/ValueFind – optimizes the values for trigger levels, delays and
integration times
• Autotest/SingleSpec – Used for single measurements of the solar simulator
* The values for trigger level and delays are stored in RaySphere’s electronics to ensure immediate
response and minimize jitter.
Photocurrent Graph
The photocurrent is recorded by a photodiode, digitalized, and displayed in the graph on the Trigger
Settings / Photo Current page as shown in the example below:
The time evolution of a flash from a solar simulator is displayed on the graph. This graph contains the
following components:
• X-axis – time in ms.
14 RAYSPHERE-1700-02-201304
Page 25

3: Software Operation
• Y-axis -- the amplified photocurrent in arbitrary units
• Trigger level -- Marks the position when the trigger level was reached by the increasing light intensity
All delays (set delay and spectrometer internal delay) are taken into account. This allows you to control
the timing of the recording of the flash. You can change the delay values to ensure that RaySphere
records the simulator’s spectrum while the flash time is stable.
The maximum sample time for the photocurrent is 160 ms.
The graph also shows the time that expired before the trigger level was reached.
Spectrometer Tab
The Spectrometer tab enables you to perform a variety of functions related to the spectrometers contained
by the RaySphere unit.
Functions
Control Function
Displays the Spectrum dialog box for changing the QE65000 settings.
QE65000
RAYSPHERE-1700-02-201304 15
Page 26

3: Software Operation
Current/Trigger Settings Tab dialog box.
Control Function
Displays the Spectrum dialog box for changing the NIRQuest512 settings (if the
NIR
Merge
Sample
NIRQuest512 is installed in your RaySphere).
Merges the spectral data from the QE65000 and NIRQuest512 spectrometers
(if your RaySphere contains both spectrometers). There is an overlap in the
spectral range from 950 nm to 1050 nm if both spectrometers are built into your
RaySphere. The merge interval is limited to 1 nm in width.
Records a spectrum the manual trigger mode is active. The exact function of
Sample depends on the selected Trigger Source setting in the
Photo
Reconnect
Zoom
In/Zoom Out
Select
x-Axis
Saturation
Spectrum Graph
When this button is pressed, the software tries to connect to the
spectrometer(s). If the spectrometer(s) are not connected after pressing the
button several times, restart the program and reapply power the RaySphere
system.
Changes the scaling in the graph with the absolute irradiance displayed.
Use this button in conjunction with the mouse to select and zoom in on a
specific area of the graph. The Select function does not affect the x-axis
scaling.
Changes the wavelength range on the graph’s x-axis.
Indicates the spectrometer saturation.
The Graph displays the last recorded spectrum. The absolute irrad ianc e data is represe nte d by the y-axis
in µW/cm^2/nm while the x-axis shows the wavelength in nm.
Spectrum Dialog Box
Press the or buttons to invoke the Spectrum dialog box.
16 RAYSPHERE-1700-02-201304
Page 27

3: Software Operation
Use this dialog box to set the following spectrometer functions:
Control Function
Integration Time Set the spectrometer’s integration time in ms starting from 8 ms. The preferred
Delimiter to separate the digits is the “.” Symbol.
Scans to average Set the number of spectral recordings to use to average for the spectrum. It is
recommended that a single spectrum be used. Use only one spectrum if a solar
simulator is being used.
Boxcar width Set the number of pixels to use for a moving average. The recommend setting is 5.
The bandwith of one pixel is ~ 0.7 nm for the QE65000 and ~ 1.6 nm for the
NirQuest512.
TEC set Set the detector temperature in °C. Use the specified temperature in the calibration
documents or see the calibration label below the RaySphere’s main body. The
calibration has an increased uncertainty if a different TEC is chosen. See
The function is disabled.
Nonlinearity Correction and Calibration for more detail.
Save TEC
settings
RAYSPHERE-1700-02-201304 17
Saves the temperature setting. After changing the temperature, it is recommended to
record a valid dark spectrum.
Page 28

3: Software Operation
Control Function
Current
temperature
Dark Spectrum Press this button to record a spectrum the the current settings and display its graph
Calibration File Press the button in the Calibration File field to load the calibration file. Follow the
Stray light
correction file
The actual TEC (sensor tempertaure) is read out from the device. The status will be
actualized every 5 seconds. The first value is dispalyed after 5 seconds.
in this dialog box. This spectrum is used as the dark and reference spectra. Be sure
to record the dark and reference spectra using the identical spectrometer function
settings. The dark spectrum has to be measured 20 minutes after switching on
the software and before the measurement of the solar simulator is performed.
wizard prompts. If the file being loaeded does not match the RaySphere’s serial
number, then a warning appears. A warning also appears in the calibration file date
is older than one year. The calibration files for the spectrometers are in the folder
calibrationdata on the RaySphere CD.
The calibration files for the QE65000 spectrometers start with QE. The files for the
NirQuest512 start with NQ. The file parameter.xmls contains fundamental settings
and default settings such as names of the calibration files and default settings for the
RaySphere software settings. The parameters (and the calibration files mentioned in
there) are loaded automatically to the software if the RaySphere software is started.
The settings in there can be changed by opening the parameter files as ASCII code.
Load the stray light correction file you received from Ocean Optics.
Apply Press this button to apply the current settings.
Cancel Any changes made since the last time the Apply button was pressed are no saved to
the device.
Classification Tab
The RaySphere software analyzes the spectral data and calculates the classification of the simulator. This
information is displayed in the Cl ass ification tab.
The simulator is classified in accordance with the internatio na l s tandard for solar s imulators IEC 60904-9:
Solar Simulator Performance Requirements. The test performed by RaySphere is the Spectral Match Test.
The Classification Tab displays the results of the solar simulator test in four parts (clockwise from upper
left corner):
• The spectrum in absolute irradiance over a wavelength range from 400 nm to 1100 nm. The physical
unit of the absolute irradiance is µW/cm^2/nm. The upper scale refers to the definition of spectral
bands as done in the international standard IEC 60904-9.
• The result from the spectral match test displayed in a diagram.
• The results from the spectral match test displayed in a table.
18 RAYSPHERE-1700-02-201304
Page 29

3: Software Operation
• The recorded Photocurrent diagram, which shows the time evolution of the flash. The marks indicate
at which times the spectrometer recording began and ended.
For more information, see Classifying the Solar Simulator and Displaying the Results
.
Warnings and Status Information
The RaySphere software controls several parameters which might affect the accuracy of the measurement.
The indicators
The indicator color changes from green to red if an important parameter is out of range or not acceptable.
Click on the red item to display the warning message. Possible warning messages are listed below:
Message Type Message Meaning
System No spectrometer is connecting No spectrometer is connected to the
Trigger is not connecting No trigger device is connected to the
The ID Query failed. Please try again or
unplug and replug the USB device and
Restart RaySphere please.
Failed to read data (error " + error type + ") Failure to read data from the trigger
– System, Recording and Measurement – monito r sev eral par a m eters.
RaySphere system
RaySphere system
Failure to connect to the trigger device
device
RAYSPHERE-1700-02-201304 19
Page 30

3: Software Operation
Message Type Message Meaning
Failed to write to device [error " + error type +
"Command:" + command content]
Recording The first [or second] spectrometer needs
Record.
Classification needs irradiance data Both of the spectrometers have no
Measurement [spectrometer name] needs calibration An absolute irradiance calibration has
[spectrometer name] the most recently
acquired spectrum was saturated
[spectrometer name] detector temperature is
[degree] Celsius degree
It will take [20 minutes minus the elapsed
time] more minutes to warm up done
Failure to write a command to the
trigger device
The spectrometer has no spectrum data
spectrum data
not been loaded
The spectrum data is saturated
The actual TEC degree is different from
the target degree
Warm-up time is not reached within 20
minutes
Note
You can perform tests and generate a certificate while a warning is present. However, the
warnings are listed in the certificate and inaccuracies might increase if a warning was present
during certification.
20 RAYSPHERE-1700-02-201304
Page 31

Chapter 4
File Types and Data Files
Overview
You must load the following types of files into RaySphere to be able to operate the system:
• Calibration files for absolute irradiance
• Stray light correction matrix.
The Ocean Optics CD that came with your system contains the calibration files and the stray light
correction matrix.
Calibration Files
The calibration files have a name structure similar to the follo wing:
Serialnumber_of_the_Spectrometer_Datei.irradcal
Serialnumber_of_the_Spectrometer_OOIIrrad.cal
Note
Both files load at the same time.
These files contain the calibration information for each individual RaySphere system. Never make any
changes in these files. The calibration files for the spectrometers are in the folder calibrationdata on the
delivered RaySphere CD.
RAYSPHERE-1700-02-201304 21
Page 32

3: Software Operation
Parameter File
The file parameter.xmls contains fundamental settings and default settings such as names of the
calibration files and default settings for the RaySphere software settings. The parameters (and the
calibration files mentioned in there) are loaded automatically to the software if the RaySphere
software is started.
The settings there can be changed by opening the parameter files as ASCII code.
Stray Light Correction Matrix
The stray light correction matrix is on the CD that comes with your RaySphere system. These files have a
name similar to the following:
Serialnumber_of_the_Spectrometer_Datei _EasyCorr.txt
Do not make any changes to this file.
Saved File Types
The RaySphere software creates several files when data is stored. The files are stored to guarante e the
traceability to the original measured data listed in the created test report and to save the configuration of
the measurement procedure.
The files that are saved are as follows:
• Classification_Date_time_Name.txt. Contains the classification of the solar simulator in a table. An
example is given below:
• Configuration_Date_Time_Name.cfg. Contains all relevant parameters of the measurem ent. A
detailed description is given in File Types and Data Files
.
22 RAYSPHERE-1700-02-201304
Page 33

4: File Types and Data Files
• PDcurr_Date_Time_Name.cfg. Contains the photocurrent data. The first column represents the
photocurrent intensity in arbitrary units. The following three columns have the values true and false
and represent the status information of the RaySphere System. The first value changes from false to
true if the intensity on the PD is higher than the set trigger level. The value true in the second and
third column indicates when a trigger pulse was sent out to the spectrometers. The second column is
for the QE and the third column is for the NirQuest512. The fourth column indicates that the trigger
electronics are working properly.
The data points have an intercept of 87 ms.
• Spec_merge_Date_Time_Name.txt
• Spec_NR_Date_Time_Name.txt and Spec_QE_Date_Time_Name.txt. Contains the raw data of the
spectrum in two columns. The first column represents the wavelength in nm and the second one is the
measured absolute intensity in µW/cm^2/nm.
• Spectrum4000-1100_Date_Time_Name.txt. contains the data point for the spectrum which was
used for solar simulator validation. The two columns represent wavelength in nm and absolute
intensity in µW/cm^2/nm.
• Report_Date_time_Name.pdf. Contains the PDF of the test report measurement data. A detailed
description of the report is in Test Report
.
The Name can be chosen by the user during the save procedure. The date and tim e are automatically
implemented in the name by the software. Be sure that the date and time in the user’s computer is correct.
All files are in ASCII format.
RAYSPHERE-1700-02-201304 23
Page 34

3: Software Operation
24 RAYSPHERE-1700-02-201304
Page 35

Chapter 5
Operation
Overview
The RaySphere software offers several operation modes. The simplest way to operate and validate a solar
simulator is to use the configuration files. The complete settings are written in the file and can be loaded
and used with minimum effort. This procedure ensures the best results. For details, see the section
Preconfigured Configuration Files in this manual or take a view in the RaySphere Quick Start
Instructions (see Product-Related Documentation).
Some other procedures for testing may be required for scientists or for members of a development
department. For those experts, a description for all measurement modes is provided in this chapter.
Using
Triggering and Measurement Modes
RaySphere offers three modes to trigger the system.
• Optical trigger signal from a flashing Solar Simulator. Include Timing Diagram
• External trigger electrical trigger signal with 5 V or 24 V high level. Includes Timing Diagram.
• Manual trigger from the computer. Includes Timing Diagram, if activated.
• Maximum trigger frequency is 5 Hz.
• Maximum speed for spectrum recording and processing is 1 Hz.
• It is recommended to perform 3 spectrum recordings (and to excite 3 flashes) within 5 minutes and to
use the data from the last flash for the validation and the certificate.
Optical Triggering
A photodiode records the incoming light passing through the small hole in the RaySphere’s main body.
The photocurrent amplification is set using the software (see Chapter 4: Software O peration,
Photocurrent and Trigger Settings.
The amplified photocurrent runs through a comparator, which is part of the electronics. The com parator
level can also be set using the software.
Changing
The comparator level and trigger level are identical. As soon as the level is reached by the photocurrent,
the electronics will interpret this as a triggering event and send out trigg er signals to the spectrometers.
The signal is delayed by the amount of time set for the delay. The timing is described in
Delays.
RAYSPHERE-1700-02-201304 25
Timing and
Page 36

5: Operation
The photocurrent, which is proportional to the incoming light, is being digitized in data points that are
separated into 44 µs intervals. Each data point represents the averaged value of light intensity for 44 µs.
Each data point gets a time mark to ensure correct timing. The data points are stored in the trigger
electronics until the software requests the data to trans mit.
► Procedure
To record a spectrum for a flash,
1. Click the Setting button (
). The Photocurrent/Trigger Settings dialog box appears.
2. Set the Trigger Source to Flash and click OK.
3. To run the system, press
button.
Adjusting the Photocurrent Amplification and Trigger Level
The photocurrent is amplified by an on board am plifier. Amplification is set in the Photocurrent / Trigger
Settings dialog box (see Chapter 4: Software Operation, Changing Photocurrent and Trigger Settings
26 RAYSPHERE-1700-02-201304
).
Page 37

5: Operation
► Procedure
To adjust the photocurrent amplification and trigger level,
1. Click the Setting button (
). The Photocurrent/Trigger Settings dialog box appears.
2. Choose the Operation Mode Continuous/ValueFind.
3. Click the OK and the buttons to activate the settings. The actual digitalized photocurrent is
continuously displayed in the graph.
4. Excite a flash and observe the photocurrent behavior on your computer screen. The flash appe ars
and disappears quickly. Nevertheless, you can determine i f the photocu rr ent is sat urat ed (meaning
the amplification is too high) or if the flash intensity is too low (meaning the Gain is too small).
5. The amplification works on a linear scale. Adjust the amplification until the flash intensity is
greater than 700 arbitrary units on the y-axis of the graph. Set the trigger level value between 500
and the maximum of intensity.
6. Change the Operation mode to Autotest/SingleSpec. The photocurrent is not displayed
continuously.
RAYSPHERE-1700-02-201304 27
Page 38

5: Operation
7. Press the button in the Spectrometer tab.
8. Excite a flash. RaySphere measures the flash and displays the tim e-resolved photocurrent of the
flash in a graph that resembles the following (ideal case):
The system measures the flash if the photocurrent is saturated as well. In this example, it is hard to
decide if the flash intensity was constant during the spectrometer’s exposure time. If you are using a
tested and verified configuration file for this type of flasher, then the measurement is still valid.
9.
Adjust the timing of RaySphere for your solar simulator in the next step. See the section Timing
and Delays.
External Triggering
You can excite the measurement of a spectrum by using an external trigger signal. Some flashers provide
a trigger output to control processes of external devices or a signal from a SPS is available. Check if the
properties of the output match with requirements for RaySphere external triggering and the trigger is of
level type and accepts levels from 5 V to 24 V. Do not apply higher voltages. The minimum high time is
500 ns.
The signal cable can be applied at the BNC-connector located on the power supply.
28 RAYSPHERE-1700-02-201304
Page 39

5: Operation
► Procedure
To record a spectrum from a triggered pulse,
1. Press the Setting button ( ). The Photocurrent/Trigger Settings dialog box appears.
2. Set the Trigger Source to External. See Changing Photocurrent and Trigger Settings for more
information. The chosen parameters for delay are still active. The Photocurrent data will also be
displayed.
3. Press the
is sent to RaySphere.
button in the Spectrometer tab. A spectrum will be recorded when a trigger pulse
Manual Triggeri ng
The software allows you to record a spectrum by pressing the button in the in the Spectrometer tab.
RAYSPHERE-1700-02-201304 29
Page 40

5: Operation
► Procedure
To record a spectrum from a manually triggered pulse,
1. Press the Setting button ( ). The Photocurrent/Trigger Settings dialog box appears.
2. Set the Trigger Source to Manual.
3. Press the
button in the Spectrometer tab. Each time you press the button, a spectrum
is recorded.
Notes
The Photocurrent data is also logged and displayed if the play( ) button on the Trigger
Settings tab has been pressed.
The message “Invalid Data” appears on the Classification tab and in the certificate if the
play(
30 RAYSPHERE-1700-02-201304
) button button has not been activated. This has no effect on spectral data.
Page 41

5: Operation
Signal Path of Trigger
The following schematic illustrates the signal path. Knowledge of the signal path of the trigger signal
provides a deeper knowledge of RaySphere’s functionality.
The External trigger signal is applied at the power supply. The signal travels from there to the trigger
electronics where the signal is being delayed and sent out to the trigger inputs of the spectrometer.
RAYSPHERE-1700-02-201304 31
Page 42

5: Operation
Timing and Delays
The timing is a key issue for getting reasonable results. A timing diagram for Flash mode and External
mode is given below to illustrate how they function in RaySphere.
32 RAYSPHERE-1700-02-201304
Page 43

5: Operation
The terms used in this diagram are defined below:
• Delay: The delay can be set in the software. Valid values are between 0 ms and 160 ms. The delay
values are stored in the trigger electronics to minimize jitter.
• Fixed delay: The spectrometers have an internal fixed delay of 768 µs for the QE65000 and 1034 µs
for the NIRQuest512. These are the minimum delays and are always present. The QE65000 has an
additional fixed delay of 266 µs. As a result, both spectrometers start integration at the same time for
identical user set delays.
All types of delay are taken into account for visualizing of the integration time interval of the
spectrometer in the photocurrent graph. The delays are active for the External, Flash and Manual
modes.
• Integration time: Time interval for spectrum recording. The output represents the average value of
intensity of the light during this time interval.
• Data transfer: It takes several ms to send the data to the computer. During this time the RaySphere
will not react to further trigger signals from the trigger electronics. The spectrometers do not react for
trigger signals until the dat a transfer is completed. To ensure correct timing, the maximum speed for
data recording is 1 Hz. If SpectraSuite is being used for data recording, use a maximum speed of 5
Hz.
RAYSPHERE-1700-02-201304 33
Page 44

5: Operation
34 RAYSPHERE-1700-02-201304
Page 45

Chapter 6
Using Preconfigured
Configuration Files
Overview
RaySphere is designed as a tool which should be usable for beginners in optical measurement. To do this,
preconfigured files, named config-files, have been created which contain all information needed for
setting the RaySphere. Loading these preconfigured files into the RaySphere software enables you to
perform measurements under previously defined conditions.
How to Use Configuration Fil es
► Procedure
1. Load the configuration file by pressing the button in the RaySphere software. All relevant
parameters are now set.
2. Measure a dark spectrum.
3. To start a measurement, press the
be recorded automatically when the next flash or trigger signal is detected
A complete procedure for validating a solar simulator using a preconfigured configuration file is provided
in Validating a Solar Simulator and in the RaySphere Quick Start Instructions (see
Documentation).
You are allowed to change settings in the RaySphere software after loading a con fig uration file.
button (to get the system into ready status. A spectrum will
.
Product-Related
Note
RAYSPHERE-1700-02-201304 35
Page 46

6: Using Preconfigured Configurat ion File s
2011.12.19 11:03
Contents of a Configuration File
The configuration files have a naming pattern such as “Configuration_Date_Time_name.cfg” and are
ASCII files. The numbers in the name represent the date and time when the file was saved. The name is
chosen by the user. An example of a configuration file is shown below:
The entries have the following meaning:
Amplifier grade: 2
Amplifier fine : 5
Trigger level : 551
Trigger mode : Manual
Operation mode : Auto
Infos of the QE : SN: QEB1351
Cal.file:
E:QEB1351_20111213_OOIIrrad.cal
Delay[ms]: 38.27
It: 10
TEC[°C]: -12
Scan2Avr: 1
Boxcar: 5
Infos of the NR : SN:
Cal.file:
Delay[ms]: 19.99
It: 71.94
TEC[°C]: -10
Scan2Avr: 1
Boxcar: 5
Straylight correction File:
E:QEB1351_EasyCorrM_.txt
Field Meaning
2011.12.19 11:03 Date and time clock
Amplifier grade: 2 Decade of amplification of photocurrent:
Amplifier: 5 Amplification value
Trigger level: 551 Trigger level for optical trigger
Trigger mode/Operation mode:
Manual mode =>
External triggering =>
36 RAYSPHERE-1700-02-201304
1 = gain1; 2 =gain2; 3 = gain3
Choose Flash the following parameters:
Manual/Manual
External/Manual
Page 47

6: Using Preconfigured Configuration Files
Field Meaning
Flash/continuous mode =>
Flash/Autotest =>
Operation mode: Auto Choose Continuous/Valuefind or Autotest/Singlespec
Infos of the QE:
SN: QEB1351
Cal.file:E:QEB1351_20111213_OOIIrrad.cal
Delay[ms]: 19.99
It: 10
TEC[°C]: -12
Scan2Avr: 1
Boxcar: 5
NOTE: Similar information is also displayed for the NIRQuest512 spectrometer for RaySphere Model 1700.
Straylight correction File:
E:QEB1351_EasyCorrM_.txt
Internal/Manual
Internal/Auto
Serial Number of the spectrometer. This number must be
correct.
Name of the calibration file and its location (information must
be correct).
Delay of the QE65000 spectrometer
Integration time of the QE65000 spectrometer in ms
(delimiter is “.”)
Detector temperature in °C
Scans to average to get one spectrum
Boxcar setting
The name of the stray light correction file and where it is
stored (both must be correct).
How to Create a Configuration File
► Procedure
1. Create a configuration file by pressing or in the System tab of the RaySphere software.
2. Follow the wizard to save data. All settings of the actual status are taken over into the
configuration file. A configuration file is in ASCII and can be edited manually.
RAYSPHERE-1700-02-201304 37
Page 48

6: Using Preconfigured Configurat ion File s
38 RAYSPHERE-1700-02-201304
Page 49

Chapter 7
Classifying the Solar Simulator
and Displaying the Results
Overview
RaySphere is designed for the spectral match test as described in detail in the international standard
IEC60904-9. For six wavelength intervals of interest, the percentage of total irradiance is specified in the
table shown below:
Interval Wavelength Range in nm Percentage of Total Irradiance in Wavelength Range 400 nm – 1100 nm
1 400 – 500 18.4%
2 500 – 600 19.9%
3 600 – 700 18.4%
4 700 – 800 14.9%
5 800 – 900 12.5%
6 900 – 1100 15.9%
The solar simulator requirements for classification for the spectral match test are as follows:
Classification Spectral match to all intervals specified in the table above
A 0.75 – 1.25
B 0.6 – 1.4
C 0.4 – 2.0
The RaySphere software displays the results from spectral match test, the spectrum in absolute irradiance
mode, and the timing diagram with photocurrent in the software section Classification tab as shown in
the example below. See Classification Tab
RAYSPHERE-1700-02-201304 39
for more information.
Page 50

7: Classifying the Solar Simulator and Displaying the Results
Saving Results
All measured results can be saved using the -save all function ( ) in the System tab of the software. A
Save wizard appears. It is recommended to enter the serial number of the tested solar simulator or
anything else to identify the solar simulator by another specific notable feature.
A test report is generated automatically from the data.
Validating a Solar Simulator
The following procedures enable you to validate a flashing or continuous light-emitting so lar simulator.
For best results, follow the applicable procedure and check the resulting test report (see
Solar Simulator).
Using RaySphere with a Flash Solar Simulator
► Procedure
Validating a
1. Place the assembled RaySphere main body close to the test plane so that its aperture is centered in
the middle of the test plane.
40 RAYSPHERE-1700-02-201304
Page 51

7: Classifying the Solar Simulator and Displaying the Results
2. If you are using an electrical trigger signal, select the correct input level for trigger signal at the
power supply and apply the signal cable to the BNC-connector on the power supply.
3. Make sure that the RaySphere software has been installed on the computer you intend to use.
4. Switch on the RaySphere power supply.
Caution
Always be sure to switch on the power supply before connecting the RaySphere to your
computer.
5. Connect RaySphere via USB cable with your computer.
6. Start the RaySphere software.
7. Press Load Config (
8. Wait 20 minutes for RaySphere to reach the thermal equilibrium and measure a dark spectrum
again.
9. Press QE65000 (
recording a dark spectrum measurement.
10. Press Start (
11. Generate 5 single flashes with a maximum speed of 1 Hz within 3 minutes. RaySphere records
the data.
12. Select Save All (
name of the file. The test report is generated automatically.
) in the software interface.
) on the System tab to load your solar simulator configuration file.
) and NIR ( ) in the Spectrometer tab. Use the opening dialog box for
). in the RaySphere software. Include the serial num ber of the flasher in the
Using RaySphere with a Continuous Solar Simulator
► Procedure
1. Switch on the solar simulator.
3. Make sure that the RaySphere software has been installed on the computer you intend to use.
4. Switch on the RaySphere power supply.
RAYSPHERE-1700-02-201304 41
Page 52

7: Classifying the Solar Simulator and Displaying the Results
Caution
Always be sure to switch on the power supply before connecting RaySphere to your
computer.
5. Connect RaySphere via USB cable with your computer.
6. Start the RaySphere software.
7. Wait 20 minutes for RaySphere to reach thermal equilibrium.
8. Press Load Config ( ) on the System tab to load your solar simulator configuration file.
9. Cover the RaySphere aperture (you can use the dust protector). Take a dark spectrum
measurement by pressing QE65000 (
) and NIR ( ) in the Spectrometer tab.
10. Uncover the RaySphere aperture.
11. Place the assembled RaySphere main body close to the test plane so that its aperture is centered in
the middle of the test plane.
12. Press Sample (
) in the RaySphere software interface 5 times each second. The RaySphere
records the data.
13. Select Save All (
) in the RaySphere software. Include the serial number of the flasher in the
name of the file. The test report is generated automatically.
Validating the Test Results
Check the following to be sure that you are collecting valid data:
The RaySphere was allowed to warm up for at least 20 minutes before starting the test.
No error or warning messages were received when the calibration file was loaded.
The spectra recording was during the stable flash time phase. Check that all marks for Start
and End of Recording in the Photocurrent graph are at a stable flash time.
42 RAYSPHERE-1700-02-201304
Page 53

Chapter 8
Test Report
Overview
When all data are saved then the certificate for the solar simulator is created automatically. An example
certificate is shown below.
RAYSPHERE-1700-02-201304 43
Page 54

8: Test Report
44 RAYSPHERE-1700-02-201304
Page 55

Chapter 9
Nonlinearity Correction and
Calibration
Overview
The signal from the spectrometer has to be processed for several corrections to get the highest possible
precision. The most important processes are described in the following paragraphs.
Nonlinearity Correction
The spectrometer’s signal is automatically corrected for nonlinearity by an internal algorithm. The
function cannot be disabled in the RaySphere software.
Wavelength Calibration
The wavelength (measured in nanometers) of the spectrometer(s) in your RaySphere unit has been
calibrated before leaving Ocean Optics. See the appropriate spectrom eter manu al (NIRQuest and/or
QE65000) for more information on spectrometer wavelength calibration in
Documentation.
Product-Related
Absolute Irradiance Calibration
Absolute irradiance calibration of the RaySphere system is done in the calibration laboratory of Ocean
Optics GmbH Germany. For recalibration, it is recommended that any recalibration, if necessary, be done
there as well.
The equipment used for calibration is listed on the Ocean Optics calibration certificate. Ocean Optics
calibration light sources are traceable to NIST standards and all other equipment used is ID-traceable to
NIST or German PTB standards.
The spectral data use physical units of µW/cm^2/nm and the wavelength is in nanometers.
Uncertainties Calculation
The calculation of uncertainty is done in accordance with the IEC Guide 115 Application of uncertainty of
measurement to conformity assessment activities in the electrotechnical sector.
RAYSPHERE-1700-02-201304 45
Page 56

9: Nonlinearity Correction, Stray Light Correction and Calibration
Sources of Uncertainty
The following parameters have influence on the uncertainty of calibration. Each parameter is taken into
account when calculating for uncertainty.
Quantity Source of Uncertainty
1. I_DC Uncertainty of DC current
2.1 T and F Influence of temperature [T] and humidity in air [F] for wavelength
range 300 nm to 1100 nm
2.2 T and F Influence of temperature [T] and humidity in air [F] for wavelength
range 1100 nm to 1700 nm
3.1 d Misalignment: Horizontal distance [d] from calibrated light source to
entrance plane of aperture
3.2 alpha Misalignment: Tilting of the RaySphere to the light source
4. Dark Noise of dark-level [dark]
5. T_TEC Influence of sensor temperature [T_TEC]
6. Irr_Kal Uncertainty of calibration lamp
7. D_Lambda Uncertainty of wavelength calibration
8. StrayL Influence of spectrometer’s internal stray light
Uncertainty of DC Current
The lamp manufacturer has defined the current for operating the calibration lamp. The current is
monitored during calibration of RaySphere with calibrated equipment. The measurement has an
uncertainty which is given the in the device’s calibration documents of the power supply.
Influence of Temperature and Humidity
The ambient temperature during the calibration procedure may influence the uncertainty of the
calibration. It is recommended by NIST to monitor temperature and humidity. The influence of humidity
can be neglected for a wavelength range of 300 to 1100 nm since the atmosphere components do not a
significant influence on the result. For a higher wavelength, there is a significant influence on the
accuracy since water in the air has several absorption bands. The correlation of humidity and absorbance
is not taken into account for calculations of uncertainty.
46 RAYSPHERE-1700-02-201304
Page 57

9: Nonlinearity Correction, Stray Light Correction and Calibration
Misalignments
The resulting uncertainties resulting from hardware m isalig nments are taken into account.
Noise of Dark Level
The dark level is the signal which is recorded if the spectrometer measures the intensity of light in an
absolutely dark room. The dark signal results from the sensor’s temperature and the noise of the signal
follows Poisson’s distribution.
Influence of Sensor Temperature
The sensitivity of each silicon-based sensor depends on its temperature and changes result in a significant
change in sensitivity in the IR range from 700 nm to 1150 nm.
The figure below illustrates the effect.
Ocean Optics spectrometers have always thermalized and temperature-controlled sen so rs to minimize the
effect of thermal instability. The confidence interval for temperature to control the detector temperature
[TEC] is +- 0.1K.
Uncertainty of Calibration Lam p
The uncertainty of the calibration lamp is given by the manufacturer’s calibration report for an interval of
confidential of k = 2. The traceability to NIST is reported as well.
Uncertainty of Wavelength Calibration
Each wavelength calibration has an uncertainty which is reported in the wavelength calibration
documents for spectrometers from Ocean Optics. The resulting uncertainty is estimated from statistical
analysis and from typical intensity distribution of the light source.
RAYSPHERE-1700-02-201304 47
Page 58

9: Nonlinearity Correction, Stray Light Correction and Calibration
The uncertainty resulting from stray light effects inside the RaySphere spectrometers cannot be neglected
for the wave length range of 300 nm to 350 nm.
Not listed values are below 0.1 % of standard uncertainty, not known [kn] or not taken
Values are round to two positions after decimal point.
Influence of Spectrometer’s Internal Stray Light
The spectrometer’s internal stray light is defined as irregularly reflected light inside the spectrometer,
resulting in a sensor signal. Most of the incoming light is reflected and diffracted to be measured at the
detector’s active surface. A small amount of light (typical 5 x 10^-5 per photon) is reflected irregularly by
scattering or reflections from order sorting filters and optical elements. This light is no t “wa v el e ngth
resolved” and causes in an increased signal at the detector.
Standard Uncertainties and Expanded Uncertainty for k = 2
The Expanded uncertainty for k = 2 is calculated from the above described factors and listed in the table
below.
Standard Uncertainties and Uncertainty Budgets
Wavelength[nm] 300 350 400 450 500 600 700 800 900 1000 1100
1. I_DC 1.45 1.20 0.95 0.80 0.65 0.60 0.60 0.55 0.55 0.55 0.50
2.,1 T and F Nk
3.,1 d
3.,2 alpha
4. Dark 0.20 0.05 0.10
5. T_TEC 0.02 0.06
6. Irr_Kal 1.50 1.40 1.30 1.20 1.20 1.05 1.00 1.00 1.00 1.00 1.00
7. d_Lambda 0.50 0.30 0.25 0.20 0.10 0.10 0.05
8. StrayL ntia
9. LinCorr 0.3 0.3 0.3 0.3 0.3 0.3 0.3 0.3 0.3 0.3 0.3
Standard
Uncertainty 2.18 1.89 1.66 1.49 1.40 1.25 1.21 1.18 1.18 1.18 1.16
Expanded
uncertainty for
k = 2 4.35 3.79 3.31 2.97 2.80 2.50 2.41 2.36 2.36 2.36 2.33
into account [ntia].
48 RAYSPHERE-1700-02-201304
Page 59

9: Nonlinearity Correction, Stray Light Correction and Calibration
Calculation of Uncertainty
Each wavelength calibration has an uncertainty which is reported in the wavelength calibration
documents for spectrometers from Ocean Optics. The resulting uncertainty is estimated from statistical
analysis and from typical intensity distribution of the light source.
Uncertainty for Spectral Match Test
It is difficult to extract the uncertainty for a spectral match test since no documents from national
metrology institutes or an international norm have defined how to perform this calculation for the special
case of a solar simulator.
Nevertheless, Ocean Optics provides a procedure to estimate the uncertainty of spectral match test.
Sources of Uncertainties
The following sources of uncertainty for the Spectral Match test were identified. They are explained in the
following sections.
Quantity Source of uncertainty
1. Spec_Distr Uncertainty of Spectral Distribution. Data from RaySphere Test.
2. Dark Noise of dark-level [dark]
3. T_TEC Influence of sensor temperature [T_TEC]
4. Rep Repeatability when measuring a solar simulator.
5. StrayL Influence of spectrometer’s internal stray light
Uncertainty of Spectral Distribution
The values for the uncertainty of spectral distribution are extracted from the data from the test of
calibration a t the in dependent optic a l te st la b at He r ae us Noblelight.
Each RaySphere system is tested with a 1000 W FEL light source calibrated by German PTB. The
optical output is well defined. The uncertainties for absolute irradiance for k = 2given by the PTB
(Kalibrierzeichen: 40096-10-PTB) are between 1.1 % at 400 nm and 1.3 % at 1100 nm. The spectrum of
the calibration lamp is shown in the following graphs. The blue curve represents the output power of the
used calibration lamp at Heraeus Noblelight in absolute irradiance.
In an ideal case no difference between output power from the calibration lamp and measured spectrum
from Raysphere is present. Nevertheless, deviations are present and can be verified. Typical data for data
from 400 nm to 1050 nm and 900 nm to 1700 nm are shown in the graphs. The red curve represents
deviation and belongs to the right axis. Note: The zero value for deviation is not at the wavelength axis.
RAYSPHERE-1700-02-201304 49
Page 60

9: Nonlinearity Correction, Stray Light Correction and Calibration
The Deviation in [%] is defined as:
Deviation[%]= (1 - SP_Cal/SP_Raysphere) x 100
Variables are defined as follows:
SP_CAL = Spectrum from calibrated light source from Heraeus (calibrated by German PTB)
SP_RaySphere = measured spectrum from RaySphere
The peaks in the infrared at ~1400 nm and ~1700 nm results from water adsorption of humidity in the air.
The humidity in the ai r a t the Ocean Optics calibration lab is different than the humidity at Heraeus
Noblelight during the calibration test.
Uncertainty in Absolute Irradiance and Uncertainty in Spectral Distribution
The spectral match test measures the spectral distribution of the solar simulator. The exact value of
absolute irradiance is not of importance in principle. Since standards are available only for absolute
irradiance and not for spectral distribution one has to quantify the uncertainty of spectral distribution from
the spectrum in absolute irradiance.
The deviation between RaySphere’s dat a and em ission spectrum from the calibration lamp at Heraeus test
lab is the basis for extracting the uncertainty for spectral match test. The deviation can be described as an
offset and a change in spectral distribution. The offset can be subtracted without changing the spectral
distribution. An example with generated data is shown in the graph below.
50 RAYSPHERE-1700-02-201304
Page 61

9: Nonlinearity Correction, Stray Light Correction and Calibration
The change in deviation (or slope of the curve) is taken into account for estimating the uncertainty in
spectral distribution. Arithmetic meanings of deviation are calculated in intervals which are defined for the
spectral match test. The following are the results:
Arithmetic average of deviation in
ΔI_B_rel 400 nm - 500 nm -1.81 -1.55
ΔI_B_rel 500 nm - 600 nm -1.34 -1.08
ΔI_B_rel 600 nm - 700 nm -1.01 -0.76
ΔI_B_rel 700 nm - 800 nm -0.82 -0.56
ΔI_B_rel 800 nm - 900 nm -0.59 -0.33
ΔI_B_rel 900 nm - 1100 nm
ΔI_G_rel 400 nm - 1100 nm -0.97 -0.71
The offset is chosen to minimize the interval of deviation.
Wavelength band
wavelength band [%]
-0.26 0.00
Arithmetic average minus offset in
wavelength band [%]
The percentage of total irradiance in a wavelength Band R_B for one wavelength band is defined as:
R_B=I_B/I_G
There are two measured values I_B and I_G with measurement uncertainties ΔI_B and ΔI_G. Using the
equations:
ΔI_B = I_B x ΔI_B_Rel and
ΔI_G=I_G x ΔI_G_Rel and the formula for the Gaussian error propagation
RAYSPHERE-1700-02-201304 51
Page 62

9: Nonlinearity Correction, Stray Light Correction and Calibration
Resulting in:
The root is defined as the uncertainty of spectral distribution Spec_Dist. The values are listed below.
Caption for nomenclature of variables:
Variables:
I: Absolute Irradiance [W/cm^2/nm]
R: Percentage of total irradiance in a waveleng th Band B
Suffixes:
_B: Wavelength band as defined for spectral match test
_G: Wavelength band of 400 nm to 1100 nm
_Rel: Relative value of variable
Prefix:
Δ: Uncertainty
NOTE: Values for uncertainties of stray light are not given. For Dark and TEC, see
Nonlinearity Correction and Calibration.
Uncertainty of Repeated Measurements
Ocean Optics has tested the uncertainty of repeated measurements together with several manufacturers of
Solar simulators. The uncertainty for spectral match test can be rated to be lower than 0.02 % for each
spectral band.
Quantitative Uncertainties
The following quantitative values for uncertainties can be found when the above described sources of
uncertainty are taken into account.
52 RAYSPHERE-1700-02-201304
Page 63

9: Nonlinearity Correction, Stray Light Correction and Calibration
400
nm –
Wavelength
range
1. Spec_Distr [%] 1.70 1.29 1.04 0.91 0.78 0.71
2.,1 Dark [%] 0.20 0.05 0.06
3.,1 T_TEC [%] 0.06
3.,2 StrayL [%] ntia
Standard
Uncertainty [%] 1.71 1.29 1.04 0.91 0.78 0.71
Expanded
Uncertainty [%]
for k = 2 3.42 2.58 2.08 1.82 1.56 1.42
A missing value indicates that the value is less than 0.1 % or not known.
500
nm
500
nm –
600
nm
600 nm –
700 nm
700 nm – 800
nm 800 nm – 900 nm
900 nm – 1100
nm
How to Estimate the Uncertainties for the Spectral Match
Test
An example illustrates the procedure for a measurement with a solar simulator. The following spectrum is
recorded.
RaySphere calculated the percentage of total irradiance in the wavelength range of 400 nm to1100 nm.
RAYSPHERE-1700-02-201304 53
Page 64

9: Nonlinearity Correction, Stray Light Correction and Calibration
Percentage of total irradiance
Wavelength range
[nm]
400 nm - 500 nm 15.7 15.7 +-0.27
500 nm - 600 nm 18.1 18.1+-0.23
600 nm - 700 nm 18.0 18.0+-0.19
700 nm - 800 nm 15.5 15.5+-0.14
800 nm - 900 nm 13.6 13.6+-0.11
900 nm - 1100 nm 19.1 19.1+-0.14
in the wavelength range of 400
- 1100 nm With uncertainty
The standard uncertainties for this test can be calculated using the formula:
ΔR_B = R_B x Standard uncertainty for k = 2.
54 RAYSPHERE-1700-02-201304
Page 65

Components Technical Notes
Overview
This appendix contains technical notes for the RaySphere components.
QE65000 Spectrometer
Appendix A
A QE65000 spectrometer is mounted inside the RaySphere main body. See the QE65000 documentation
for more information (see Product-Related Documentation
).
NIRQuest Spectrometer
The RaySphere1700 has a NirQuest512 spectrometer mounted inside the main body. See the NIRQuest
documentation for more information (see Product-Related Documentation
).
Trigger Electronics
The trigger electronics is a newly developed unit to fulfill the requirements for validating solar simulators.
The unit has a USB connection for communication. Other parts are the following:
• Photodiode
• Analog comparator for detecting flash events
• Cpld-Microprocessor for logical operations like delays and triggering
• Atmel-chip for PC communication
The trigger electronics is a standalone unit. All values for triggering are stored in the onboard FPGA. This
offers an extended range of use in combination with the SpectraSuite spectrometer operating software.
Trigger parameters can be set in the Photocurrent/Trigger Settings dialog box. See Changing
Photocurrent and Trigger Settings for more information. The parameters that need to be defined are:
• Delay for QE65000
• Delay for NirQ512
RAYSPHERE-1700-02-201304 55
Page 66

A: Algorithms Used
• Amplification. Settings for GainX and value of 1 to 10.
• Trigger source
When these parameters are set, the values are sav ed ins ide the elect roni cs until the electronics loses
electrical power. To preserve the parameters do not disconnect the USB connection or switch off the
electrical power.
Close the RaySphere software and start the SpectraSuite software. The spectrometers can be operated
now with SpectraSuite and all functions which are provided by SpectraSuite can be used. Set the
spectrometer into Hardware Trigger mode in SpectraSuite to use external triggering or triggering by flash.
See the SpectraSuite Spectrometer Operating Software Installation and Operation Manual for more
information on SpectraSuite (see Product-Related Documentation
).
USB-Hub
An internal USB hub inside the RaySphere main body controls the communication with trigger
electronics, QE65000 spectrometer and NirQuest512, and bundles the communication into one USB
output that is connected with your computer.
56 RAYSPHERE-1700-02-201304
Page 67

Specifications and Mechanical
Specification Value
Physical:
Dimensions (l x w x h) 30.7 cm x 23.5 cm x 6.6 cm
Appendix B
Diagram
Weight
RaySphere
RaySphere 1700
Slit size
QE65000
NIRQuest
Maximum Integration
Time with RaySphere
Software
Measurement Speed 1 set of spectra per second
Second Order Filters installed
Electrical:
Input voltages 90 – 164 VAC
Input frequency 47 – 63 Hz
Power 75 W
Overvoltage protection 110 – 130% of main output
4.2 kg (main body)
5.7 kg (main body)
25µm
200µm
170 ms
Fuse M1.6 A
Trigger connection BNC connector
Connector: SMA 905
RAYSPHERE-1700-02-201304 57
Page 68

B: Specifications and Mechanical Diagram
Specification Value
Optical:
Optical input power 150 W to 2000 W
Wavelength range*:
RaySphere
RaySphere 1700
Optical Trigger:
Trigger delay 0 – 160 ms
Time resolution 0.87 µs
Jitter 150 ns
Internal time resolution 2.54 µs
Maximum sample time 160 ms
Electrical Trigger:
Electrical trigger type Edge trigger
High lev el 5 V to 24 V
Minimum high time 100 ns
350 – 1100 nm
300 nm – 1700 nm
Mounting Options for RaySphere Main Body
The technical drawing shows the back side of the RaySphere main body. The system can be mounted at
the indicated M6 rods only.
WARNINGS
Do not bend the system for tight mounting!
Mounting on uneven surfaces may bend the RaySphere sy stem. Th is may ca u se increa sed
measurement uncertainties.
58 RAYSPHERE-1700-02-201304
Page 69

B: Specifications and Mechanical Diagram
RAYSPHERE-1700-02-201304 59
Page 70

B: Specifications and Mechanical Diagram
60 RAYSPHERE-1700-02-201304
Page 71

Index
A
absolute irradiance calibration, 45
assembly, 8
C
calculation of uncertainty, 47
calibration, 2, 45
absolute irradiance, 45
wavelength, 45
calibration files, 21
calibration lamp, 47
Classification tab, 18
components, 5
configuration files
contents, 36
creating, 37
preconfigured, 35
using preconfigured, 35
Connect Pd, 12
D
dark level, 47
data files, 21
document
audience, iv
purpose, iv
summary, iv
documentation, v
F
file types, 21
saved, 22
I
installation, 5
Introduction, 1
L
Load All, 10
Load Config, 10
M
misalignment, 47
mounting options, 58
N
noise, 47
dark level, 47
nonlinearity correction, 45
P
parameter file, 22
Photo Current/Trigger Settings tab, 11
photocurrent recording, 2
R
RaySphere software, 2
S
safety notices, i
Save All, 10
Save Config, 11
setup, 5
shipment components, 2
signal path of trigger, 31
software
installation, 6
RaySphere, 2
structure, 9
solar simulator
classifying, 39
continuous, 41
flash, 40
validating, 40
specifications, 57
spectral match test, 47
spectrometer stray light, 47
Spectrometer tab, 15
stray light correction matrix, 22
System tab, 10
RAYSPHERE-1700-02-201304 61
Page 72

Index
noise, 47
T
temperature sensor influence, 47
test report, 43
test results
validating, 42
triggering, 25
external, 28
manual, 29
optical, 25
timing and delays, 32
quantitative, 47
repeated measurments, 47
sources, 47
spectral distribution, 47
spectral match test, 47
spectrometer stray light, 47
standard and expanded, 47
temperature sensor influence, 47
wavelength calibration, 47
upgrades, v
USB hub, 56
U
uncertainites calculation, 45
uncertainty
absolute irradiance, 47
calculation, 47
calibration lamp, 47
dark level, 47
DC current, 46
estimating for spectral match test, 47
misalignment, 47
V
validating solar simulator, 40
validating test results, 42
W
Warnings and Status information, 19
wavelength calibration, 45, 47
what's new, iv
62 RAYSPHERE-1700-02-201304
 Loading...