

Page 1

User's Manual
Plasma Monitoring
&
Control System
PlasCalc-2000-UV-VIS-NIR
Ocean Optics Germany GmbH PlasCalc 2000 Thin Film Metrology 1
Page 2

© Copyright 2004-2011
Ocean Optics Germany GmbH
Thin Film Metrology
Maybachstrasse 11
D- 73760 Ostfildern / Germany
Tel.: +49 (0)711 34 16 96-0
Fax: +49 (0)711 34 16 96-85
E-Mail: thinfilm@oceanoptics.eu
www.oceanoptics.eu
Ocean Optics Germany GmbH PlasCalc 2000 Thin Film Metrology 2
Page 3

Contents
1
Safety Instructions ............................................................................................. 1
2
Unpacking Instructions ...................................................................................... 1
3
Introduction ........................................................................................................ 2
4
Installation .......................................................................................................... 3
4.1 Installation .................................................................................................... 3
4.2 Removing PlasCalc ...................................................................................... 3
4.3 System Requirements .................................................................................. 3
5
Description ......................................................................................................... 4
6
Functions of Panel controls ............................................................................... 5
6.1 Front Panel ................................................................................................... 5
6.2 Back Panel ................................................................................................... 6
7
Software ............................................................................................................. 7
7.1 Installation .................................................................................................... 7
7.2 Quickstart ..................................................................................................... 7
7.3 Application Windows .................................................................................... 8
Application Windows.............................................................................................. 8
Menu and Tool Bars .......................................................................................... 9
File List .............................................................................................................. 9
Record/Spectrum Window ................................................................................. 9
Monitor Window ................................................................................................. 9
7.4 Menu Commands ....................................................................................... 10
Menu Commands ................................................................................................ 10
File Menu ......................................................................................................... 10
Edit Menu ......................................................................................................... 11
Recording Menu .............................................................................................. 13
View Menu ....................................................................................................... 18
Window Menu .................................................................................................. 19
Help Menu ....................................................................................................... 19
7.5 Tool Bars .................................................................................................... 20
7.6 Dialogs ....................................................................................................... 23
8
Specifications ................................................................................................... 48
9
End User License Agreement for Software (EULA) ........................................ 49
10 Appendix A ...................................................................................................... 51
10.1
Endpoint detection with the PlasCalc system ......................................... 51
Ocean Optics Germany GmbH PlasCalc 2000 Thin Film Metrology 3
Page 4

1 Safety Instructions
Instructions: All the safety and operating instructions should be read before the unit is
operated. Before using the power supply for the first time check for transport damage.
Warning: All warnings on the unit and in the operating instructions should be
adhered to.
Use this instrument in a clean laboratory environment.
Moisture
The unit is designed for operation in dry rooms only.
Heat
The unit should be situated away from radiators, hot bodies, ovens or other heat
sources.
Power Sources
The unit should be connected to a power supply only of the type described in the
operating instructions or as marked on the unit.
Object and Liquid Entry
Care should be taken that objects do not fall, or liquids spilled into the enclosure
through openings.
2 Unpacking Instructions
Your package should contain:
1x PlasCalc-2000-UV-VIS-NIR
1x Power supply 12VDC
1x USB connection cable
1x Software CD
1x This manual
1 Unpack your PlasCalc-2000 carefully. Dropping this instrument can cause permanent
damage.
2 Inspect the outside of the instrument and make sure that there is no damage to your
unit. In case of damage contact the dealer immediately and DO NOT USE THE
INSTRUMENT!
Ocean Optics Germany GmbH PlasCalc 2000 Thin Film Metrology 1
Page 5

3 Introduction
Ocean Optics PlasCalc
Process control is essential in industrial plasma applications to ensure reliability and high quality of
the process. For this purpose optical emission spectroscopy (OES) is an excellent tool since this
technique does not affect the plasma and several plasma species can be monitored in real-time
and in-situ.
The Ocean Optics PlasCalc system is designed especially for industrial applications where a
robust set-up and an easy-to-use software are required. The Ocean Optics PlasCalc software is
an easy-to-use Windows® software which can be run interactively for research purposes as well as
stand-alone for process monitoring and controlling. The software can be configured for the use by
technical personal.
Enjoy working with this powerful OES system.
Ocean Optics Germany GmbH
Ocean Optics Germany GmbH PlasCalc 2000 Thin Film Metrology 2
Page 6

4 Installation
4.1 Installation
Do not connect the system to the PC before PlasCalc Software has been installed.
Insert the PlasCalc CD in your CD drive and launch the setup program. The setup
program will lead you through the installation process. Please follow the instructions
and fill in the necessary information.
All program files and the Java Runtime Engine will be copied on the hard disk of
your computer. Please make sure that enough free disk space (approx. 100 MByte)
is available.
4.2 Software Update
Disconnect the PlasCalc-2000 system from the PC before updating the software.
Once the system is disconnected install the new version like first time installation.
4.3 Removing PlasCalc
For a complete removal of PlasCalc from your computer please activate the icon
Software in the System Panel of Windows, select PlasCalc in the lower list box and
then press the button Add/Remove. All program files of PlasCalc will be removed
completely from your computer.
4.4 System Requirements
IBM compatible PC with Pentium processor or equivalent and CD drive
Operating system Windows 2000/XP/WIN7 (32bit)
Required free hard disk space:
approx. 100 MByte
Ocean Optics Germany GmbH PlasCalc 2000 Thin Film Metrology 3
Page 7

5 Description
With its high resolution miniature fiberoptic spectrometer equipped with a 2048 pixel
CCD and fast acquisition electronics, the PlasCalc acquires plasma light emission
from 200 to 1100 nm in 3 ms. The well engineered PlasCalc process control system
brings the benefits of sophisticated algorithms for data acquisition and signal
treatment. The analog-digital output and input capabilities gives together with full
PC connectivity all options to control the process.
System Setup:
Ocean Optics Germany GmbH PlasCalc 2000 Thin Film Metrology 4
Page 8

6 Functions of Panel controls
SMA
-
Connector
Power
6.1 Front Panel
For detection fiber
indicator
Ocean Optics Germany GmbH PlasCalc 2000 Thin Film Metrology 5
Page 9

6.2 Back Panel
12VDC Socket
USB
-
Socket
Inputs (4x)
Outputs
Analog outputs
Pinout
Serialnumber
Digital
Type &
Digital
Digital I/O
The digital inputs and outputs are differential I/Os. Therefore you need to connect a signal and a
ground wire to each input and each output.
Ocean Optics Germany GmbH PlasCalc 2000 Thin Film Metrology 6
Page 10

7 Software
7.1 Installation
Connect the system to the PC only after the software has been installed.
1. Close all applications running on the PC
2. Insert the software CD into the CD-ROM drive
3. Run the "setup" executable to start the installation process
• Click next on the welcome dialog
• Read the license agreement carefully and click next if you accept it
• Enter a user-name and your organization, choose who should be able to use the
software and click next
• Choose an installation path and click next
• If the settings shown are correct click install
• Click finish to exit the installation routine
• Reboot the PC sot hat the new settings can take effect
7.2 Quickstart
At the first start the following dialog will appear. To do the first measurements select "open default
recipe" and click OK. The application window (Spectrum and Monitor window) will be loaded.
To start Recording spectra goto menu: Recording | Start recording.
To start Monitoring and Recording goto menu: Monitoring | Start monitoring
Ocean Optics Germany GmbH PlasCalc 2000 Thin Film Metrology 7
Page 11

Menu Bar and Tool Bar
Record/Spectrum
File List
Monitor
7.3
Application Windows
The application window of Mikropack PlasCalc is divided in the following windows:
Menu and tool bars: main window with menu and tool bar commands
File list: listing of all open files and tracks
Record/Spectrum: window with currently recorded spectrum
Monitor: window with monitor tracks
Ocean Optics Germany GmbH PlasCalc 2000 Thin Film Metrology 8
Page 12

Menu and Tool Bars
This is the main window of the application which appears after starting the program. The menus
and toolbars contain all commands available as it is common in Windows® applications.
File List
The file list is a summary of all open files with a listing of the tracks for each file. The check box in
front of each track indicates whether a track is visible or hidden. The check box of the currently
selected track is displayed in red and the background color of the track name corresponds to the
system color for selections.
Pressing the right mouse button above a track or file name will open up a menu with commands
available for that track or file.
Record/Spectrum Window
While recording this window displays the currently acquired spectrum as well as the background
and reference spectrum. Lines and integrals are indicated and you may add, change or delete
those lines and integrals for monitoring or evaluation purposes.
When evaluating spectral data you may open and superpose as many spectra as you like in this
window.
Monitor Window
In the monitor window the time tracks of the intensities of selected lines and integrals are
displayed. Tracks can be added by selecting a line or integral in the Record/Spectrum window and
by carrying out the command Add line/integral as monitor track.
When evaluating monitor data a saved PlasCalc File (.pcf) is displayed in this window.
Ocean Optics Germany GmbH PlasCalc 2000 Thin Film Metrology 9
Page 13

7.4
Menu Commands
7.4.1
New ... <
Create one of the following configurations as new:
New record
New monitor
Open ...
Open a spectrum or an existing PlasCalc File (.pcf).
Save
Save the data of the active window in ASCII format. You will be asked which spectra or time tracks
you want to save.
Close
Close the active window with all spectra and/or PlasCalc Files.
File Menu
Print...
Print the active window. For the setting up the printer please refer to the options section in the
printer set-up.
Start options ...
Open the dialog for changing the start options.
Operation mode <<<<
Select the operation mode and configure the user mode
Administrator mode
User mode
User setting
Changing between administrator and user mode requires a password. The default password is
"admin".
If you don't remember your password copy the default administration file "admin" from the
installation CD in the program folder.
Exit
Close the application Ocean Optics PlasCalc stopping all recording processes.
Ocean Optics Germany GmbH PlasCalc 2000 Thin Film Metrology 10
Page 14
7.4.2
XY-Autoscale
Set the display ranges of the wavelength/time and of the signal to the minimum and maximum data
values of the selected file.
This will display all data of the selected file.
X-Autoscale
Set the display range of the wavelength/time to the minimum and maximum data values of the
selected file.
The display range of the signal remains unaffected.
Y-Autoscale
Set the display range of the signal to the minimum and maximum data values within the displayed
wavelength/time range of the selected file.
The display range of the wavelength/time remains unaffected.
XY-Autoscale single track
Set the display ranges of the wavelength/time and of the signal to the minimum and maximum data
values of the selected spectrum/track.
This will display all data of the selected track.
Edit Menu
X-Autoscale single track
Set the display range of the wavelength/time to the minimum and maximum data values of the
selected spectrum/track.
The display range of the signal remains unaffected.
Y-Autoscale single track
Set the display range of the signal to the minimum and maximum data values within the displayed
wavelength/time range of the selected spectrum/track.
The display range of the wavelength/time remains unaffected.
Add line
Add a line to the selected spectrum.
This line may be used for monitoring the time dependency of the intensity.
Add integral
Add a line integral to the selected spectrum.
This line integral may be used for monitoring the time dependency of the intensity.
Ocean Optics Germany GmbH PlasCalc 2000 Thin Film Metrology 11
Page 15

Delete line/integral
Delete selected line or line integral.
If this line or line integral was connected to a monitor track the corresponding monitor track will be
deleted as well.
Configure plot ...
Open the dialog for setting up or changing the plot options.
Ocean Optics Germany GmbH PlasCalc 2000 Thin Film Metrology 12
Page 16

7.4.3
Recording Menu
New record
Create a new record file.
Start recording
Start recording spectral data.
Stop recording
Stop recording spectral data.
Suspend record display
Suspend record display while recording data.
Since updating the display consumes a lot of CPU time this option may be helpful for
measurements in which time is critical.
Configure recording
Open the dialog for setting up and changing the recording options.
Save current spectrum
Save the current spectrum while recording.
This button is only available if the Save spectra on demand option is selected in the Dialog Record
Options. The file name for saving must also be specified in that dialog or in the dialog Monitor
Options.
Recording mode | Spectrum mode
Switch to Spectrum mode. In this mode unprocessed spectra are shown
Recording mode | Transmission mode
Switch to transmission mode. In this mode transmission spectra are shown. Transmission is
calculated using the actual spectrum and a reference and dark spectrum which have to be defined
before.
Recording mode | Reflection mode
Switch to reflection mode. In this mode reflection spectra are shown. Reflection is calculated using
the actual spectrum and a reference and dark spectrum which have to be defined before.
Recording mode | Absorption mode
Switch to absorption mode. In this mode absorption spectra re shown. Reflection is calculated
using the actual spectrum and a reference and dark spectrum which have to be defined before.
Switching between the recording modes is only possible while recording and monitoring are
stopped.
Ocean Optics Germany GmbH PlasCalc 2000 Thin Film Metrology 13
Page 17

Reference spectrum | Subtract reference spectrum
Switch on/off automatic subtraction of reference spectrum while recording.
Reference spectrum | Take current spectrum as reference spectrum
Set current spectrum as reference spectrum.
Reference spectrum | Open reference spectrum from file
Load a reference spectrum from hard disk.
Reference spectrum | Save reference spectrum to file
If the saving option is selected in the dialog Record Options and default file name for the
reference spectrum is specified, the current spectrum will also be saved to hard disk using the
default file name.
Reference spectrum | Clear reference spectrum
Clear the reference spectrum. All signal values are set to zero.
Intensity calibration | Apply intensity calibration
Activate / deactivate intensity calibration
Intensity calibration | Take current spectrum as calibration spectrum
Set current spectrum as calibration spectrum.
Intensity calibration | Open calibration spectrum from file
Load an existing calibration spectrum from disk
Intensity calibration | Save calibration spectrum to file
Save the calibration spectrum do disk
Intensity calibration | Clear calibration spectrum
Clear the calibration spectrum. All values are set to zero.
Dark spectrum | Subtract dark spectrum
Switch on/off automatic subtraction of background spectrum while recording.
Dark spectrum | Take current spectrum as dark spectrum
Set current spectrum as background spectrum.
If the saving option is selected in the dialog Record Options and default file name for the
background spectrum is specified, the current spectrum will also be saved to hard disk using the
default file name.
Ocean Optics Germany GmbH PlasCalc 2000 Thin Film Metrology 14
Page 18

Dark spectrum | Open dark spectrum from file
Load existing dark spectrum from disk
Dark spectrum | Save dark spectrum to file
Save the dark spectrum to disk.
Dark spectrum | Clear dark spectrum
Clear the background spectrum. All signal values are set to zero.
7.4.4 Monitoring Menu
New monitor
Create a new monitor file.
Start monitoring
Start monitoring.
If the option Synchronize recording with monitoring is selected in the dialog Monitor Options
recording spectra will start as well.
Pause monitoring
Pause monitoring.
While pausing monitoring recording spectra will continue. Monitoring time is suspended until
pausing is turned off.
Stop monitoring
Stop monitoring.
If the option Synchronize recording with monitoring is selected in the dialog Monitor Options
recording will stop as well.
Suspend monitor display
Suspend monitor display while recording data.
Since updating the display consumes a lot of CPU time this option may be helpful for
measurements in which time is critical.
Configure monitoring
Open the dialog for setting up and changing the recording options.
Fix plot at minimum x
Fixes the monitor plot at actual x value
Ocean Optics Germany GmbH PlasCalc 2000 Thin Film Metrology 15
Page 19

Auto pause monitor
Pause monitoring automatically if monitor tracks are below given setpoint
Add line/integral as monitor track
Add selected line or line integral as monitor track.
Add combined monitor track
Add monitor track as a combination of two already existing monitor tracks.
The tracks can be combined by basic arithmetical operations.
Load monitor recipe
Open and load recipe file with monitoring options from hard disk.
Save monitor recipe
Save current monitoring options to recipe file on hard disk.
Delete monitor track
Removes the selected monitor track
7.4.5 Controlling Menu
Controlling | Controlling on/off
Switching control on and off
Controlling | Configure controlling
Open the dialog for setting up and changing the control parameters
Ocean Optics Germany GmbH PlasCalc 2000 Thin Film Metrology 16
Page 20

7.4.6 Tools Menu
Spectrometer | Select spectrometer
Opens the dialog for selecting a spectrometer. In this dialog the Serialnumber of the PlasCalc system has to
be selected
Spectrometer | Configure spectrometer
Opens a dialog to view and change calibration parameters of the spectrometer.
Control devices | Select control device
Select if the PlasCalc-2000 control device or a demo driver is used
Multi channel systems | Configure monitor
Only for multi channel systems like the ProCess-2000
SpecLine | Open spectrum
Opens the specLine software and shows the selected spectrum
SpecLine | Configure
Set the installation path of the SpecLine software
All SpecLine related functions are only functional if SpecLine is installed on the PC.
Ocean Optics Germany GmbH PlasCalc 2000 Thin Film Metrology 17
Page 21

7.4.7
View Menu
View | Zoom
Switch on/off zooming.
View | Line cursor
Switch on/off line cursor.
View | Horizontal scrollbar
Switch on/off horizontal scroll bar.
View | Vertical scrollbar
Switch on/off vertical scroll bar.
View | File list
Display file list window.
View| Tool Bars <
Show/hide the following tool bars:
- File
- View
- Edit
- Recording
- Monitoring
Ocean Optics Germany GmbH PlasCalc 2000 Thin Film Metrology 18
Page 22

7.4.8
Window Menu
All windows are listed and can be selected.
7.4.9
Help Menu
Help | PlasCalc Help Index
The index of the help system of von Ocean Optics PlasCalc is displayed.
Help | Ocean Optics Homepage
Link to Ocean Optics Homepage. Please check for news and latest updates.
Help | About
Information about Ocean Optics PlasCalc is displayed.
Ocean Optics Germany GmbH PlasCalc 2000 Thin Film Metrology 19
Page 23

Button
Action
Button
Action
Button
Action
7.5 Tool Bars
In the tool bars the most important and often used menu commands are displayed
as buttons. By pressing a button the corresponding menu command is carried out.
7.5.1 File Tool Bar
Create a new record or monitor window
Open an existing spectrum or PlasCalc File (.pcf)
Save the data of the active window in ASCII format
Close the active window with all spectra and/or PCF files
Display the index of the help system
Print the active window
7.5.2 View Tool Bar
Switch on/off zooming
Switch on/off line cursor
Switch on/off horizontal scrollbar
Switch on/off vertical scrollbar
7.5.3 Edit Tool Bar
Open dialog for setting up and changing plot options
Autoscale display ranges for x and y of the selected file
Autoscale display range for x of the selected file
Autoscale display range for y of the selected file
Autoscale display ranges for x and y of the selected track
Autoscale display range for x of the selected track
Autoscale display range for y of the selected track
Add a line to the selected spectrum
Add a line integral to the selected spectrum
Delete selected line or line integral
Ocean Optics Germany GmbH PlasCalc 2000 Thin Film Metrology 20
Page 24
7.5.4 Tools Tool Bar
Button
Action
Button
Action
Open current spectrum in SpecLine (available only if SpecLine
is installed)
7.5.5 Recording Tool Bar
Create a new record file
Start recording spectral data
Stop recording spectral data
Suspend record display while recording data
Save the current spectrum while recording
Switch to spectrum mode
Switch to transmission mode
Switch to reflection mode
Switch to absorption mode
Switch on/off automatic subtraction of reference spectrum
Load a reference spectrum from hard disk
Set current spectrum as reference spectrum
Switch on/off automatic background subtraction
Close window with all files
Ocean Optics Germany GmbH PlasCalc 2000 Thin Film Metrology 21
Page 25
7.5.6 Monitoring Tool Bar
Button
Action
Button
Action
Create a new monitor file
Start monitoring
Pause monitoring
Stop monitoring
Open dialog for setting up and changing monitor options
Switch on/off the fixing of monitor time scale at currently
displayed minimum time
Switch on/off automatic pausing of monitoring for low light
intensity. The intensity threshold must be set in the dialog
Monitor Options
Suspend monitor display while recording data
Add selected line or line integral as monitor track
Add monitor track as a combination of two already existing
monitor tracks
Delete selected monitor track
7.5.7 Controlling Tool Bar
Switch on/off controlling
Open dialog for setting up and changing control parameters
Ocean Optics Germany GmbH PlasCalc 2000 Thin Film Metrology 22
Page 26

7.6 Dialogs
7.6.1 Start Options
Start Options
Dialog for setting and changing the start options:
Open nothing Start main program only
Open default recipe file Start and open default recipe file
Open existing recipe file Start and ask for existing recipe file
Open this recipe file Start and open given recipe file
Configuration type Choose type of configuration: Record or
Show dialog at start Show Start Options dialog at start of program
Advanced start options:
Monitor
In the advanced start options you can select which options are started automatically
when the software is started
Ocean Optics Germany GmbH PlasCalc 2000 Thin Film Metrology 23
Page 27

Recording interval
Interval between consecutive exposures
Integration time
Integration time of single exposure
Average exposures
Average over the given number of
Average pixels
Average over the given number of pixel
Su
btraction of electrical
Automatic correction of electrical dark of
Allow real
-
time
Automatic autoscaling of the y
-
values
7.6.2 Record Options
Dialog for setting and changing options for recording spectra with the following tab
sheets:
Recording
exposures
(spectral mean average value, box car
width)
dark current
autoscaling for y-values
the diode array
while monitoring. The autoscaling can be
switched on and off with the commands
Y-Autoscale and Y-Autoscale single track
Ocean Optics Germany GmbH PlasCalc 2000 Thin Film Metrology 24
Page 28
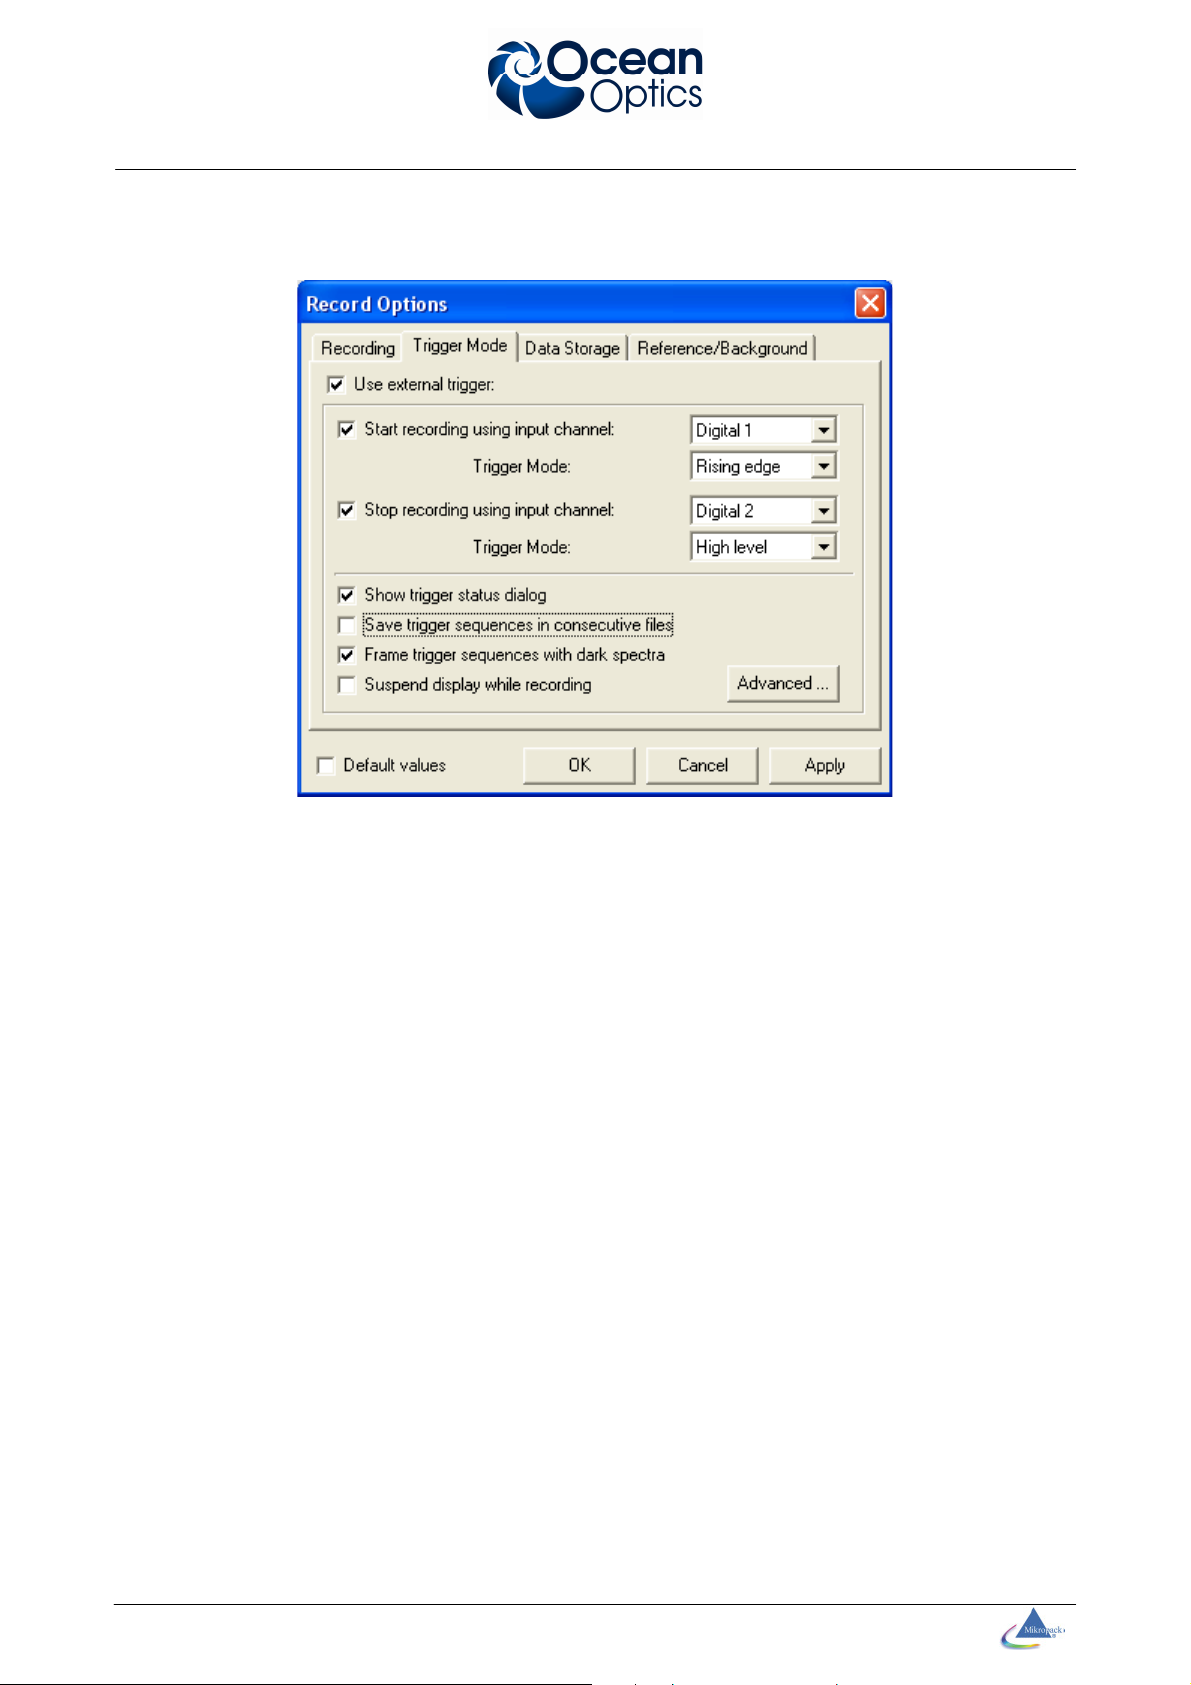
Trigger Mode
Use external trigger
External trigger mode. Make sure that you
Trigger delay
Delay time after providing trigger signal
Number of exposures
After each trigger signal the given number of
Recording time after
Recording time after each trigger signal
Show trigger status
Display trigger status di
alog while recording
Save trigger
The data of each trigger sequence is stored
Frame trigger
Each trigger sequence i
s displayed and
Suspend display
While recording the display is suspended.
can provide a TTL signal at the spectrometer
after trigger
trigger
exposures is recorded
according to the recording interval and
numbers of exposures
dialog
sequences in
consecutive files
sequences with dark
spectra
in external trigger mode
in consecutive numbered files instead of a
single file
stored with zero data at the beginning and
end of sequence
while recording
The data is displayed after each trigger
sequence. Since updating the display
consumes a lot of CPU time this option may
be helpful for measurements in which time is
critical
Ocean Optics Germany GmbH PlasCalc 2000 Thin Film Metrology 25
Page 29

Data Storage
Save spectra
Save spectra to consecutive files on hard
Save data sequences
Each reco
rded process data is stored in
Prompt when overriding
Prompt when overriding files at the
disk according to given settings. The file
name will be extended by ongoing
numbers!
consecutive files or consecutive folders
with ongoing numbers
file...
beginning of each recording sequence
Ocean Optics Germany GmbH PlasCalc 2000 Thin Film Metrology 26
Page 30

Reference Background
Save reference
Save r
eference spectrum by default in
Save background
Save background spectrum by default in
General:
spectra
spectra
Default values
specified file on hard disk
specified file on hard disk
The current options are saved as default
values
Ocean Optics Germany GmbH PlasCalc 2000 Thin Film Metrology 27
Page 31

Initial display values
Initial display interval of time and
Display unit
Unit of time scale
Storage interval
Time interval for which recorded data
Normalize monitor tracks
All monitor signals are scaled to the
Average over ... data points
Average over the given number of data
7.6.3 Monitor Options
Dialog for setting and changing options for monitoring with the following tab sheets:
Monitoring
intensity
is stored in RAM memory. Please be
aware of available memory!
maximum intensity value
points while monitoring
Ocean Optics Germany GmbH PlasCalc 2000 Thin Film Metrology 28
Page 32

Tracks (single track)
Monitor tracks
Selection list of monitor tracks
Name
Description of monitor track
Line intensity
Evaluate line intensity at given
Integral intensity
Evaluate intensity of line integral
Backgroun
d subtraction
Subtract background using intensity
Multiplier
Multiply recorded intensity with the
wavelength value
between given wavelength values
value at given wavelength
given value
Ocean Optics Germany GmbH PlasCalc 2000 Thin Film Metrology 29
Page 33

Tracks (combined track)
Monitor tracks
Selection list of monitor tracks
Name
Description of monitor track
Mo
nitor track
Selection list of first monitor track to be
Operation
Selection list of basic arithmetical operations
Monitor track
Selection list of second monitor track to be
Multiplier
Multiply recorded intensity with the given value
combined
combined
Ocean Optics Germany GmbH PlasCalc 2000 Thin Film Metrology 30
Page 34

Setpoints
Upper set
-
point at
Upper set
-
point at given intensity value
Lower set
-
point at
Lower set
-
point at given intensity value
Recording of set
-
point crossing:
Highlight in monitor
A blinking symbol is shown on the
Show message in
Show the below given text on the screen
Acoustic signal
Play the below given acoustic signal
track
display at the specified track when a setpoint is crossed
dialog box
when a set-point of the track is crossed
when a set-point of the track is crossed
Ocean Optics Germany GmbH PlasCalc 2000 Thin Film Metrology 31
Page 35

Data storage
Save data
Save monitor data to file on hard disk
Save spectra
Save spectra to file on hard disk
Count data files
Each recorded process data is
stored in
Prompt when overriding
Prompt when overriding files at the
These entries correspond to the setting in the dialog Record
according to given settings
according to given settings. The file name
will be extended by ongoing numbers!
consecutive files with ongoing numbers
file...
beginning of each recording sequence.
Options.
Ocean Optics Germany GmbH PlasCalc 2000 Thin Film Metrology 32
Page 36

Options
Allow real-time autoscaling
for y-values
Automatic autoscaling of the y-values while
monitoring. The autoscaling can be
switched on and off with the commands YAutoscale and Y-Autoscale single track.
Synchronize recording with
monitoring
Pause monitoring while
average signal...
Synchronize Start/Stop of recording spectra
with Start/Stop of monitoring
Automatic pausing while monitoring for
overall light signals less than the given
value
Display data values Display current intensity value while
monitoring
Reporting of set-point
crossing
General:
Default values:
Action when falling below or exceeding setpoint
The current options are saved as default
values
Ocean Optics Germany GmbH PlasCalc 2000 Thin Film Metrology 33
Page 37

7.6.4 Control Options
Actuator (analog output)
Output channels Selection list of available output channels
Monitor track Selection list of monitor tracks to be assigned to
selected output channel
Signal Signal values
Voltage Voltage values to be assigned to signal values.
The output voltage will be interpolated according
to the given values
Enable voltage output
of channel
Switch on/off voltage output for selected output
channel
Ocean Optics Germany GmbH PlasCalc 2000 Thin Film Metrology 34
Page 38

Actuator (digital output)
ck to be assigned to
Activate controlling Switch on/off controlling
Output channels Selection list of available output channels
Monitor track Selection list of monitor tra
selected output channel
Active set-points List of active set-points with set-point values
TTL levels:
low.../high:
high.../low:
Enable voltage output of
channel
normal TTL signaling
inverse TTL signaling
Switch on/off voltage output for selected
output channel
Ocean Optics Germany GmbH PlasCalc 2000 Thin Film Metrology 35
Page 39

Control
Output channels Selection list of available output channels
Monitor track Selection list of monitor track to be assigned
to selected output channel
Active control loop Switch on/off controlling for selected channel
Set-point / Voltage /
Percentage
Set-point value for controlling given signal
counts / output voltage / percent of maximum
signal
Closed loop control (PID) Switch on/off PID control
Enable voltage output of
channel
Switch on/off voltage output for selected
output channel
Ocean Optics Germany GmbH PlasCalc 2000 Thin Film Metrology 36
Page 40
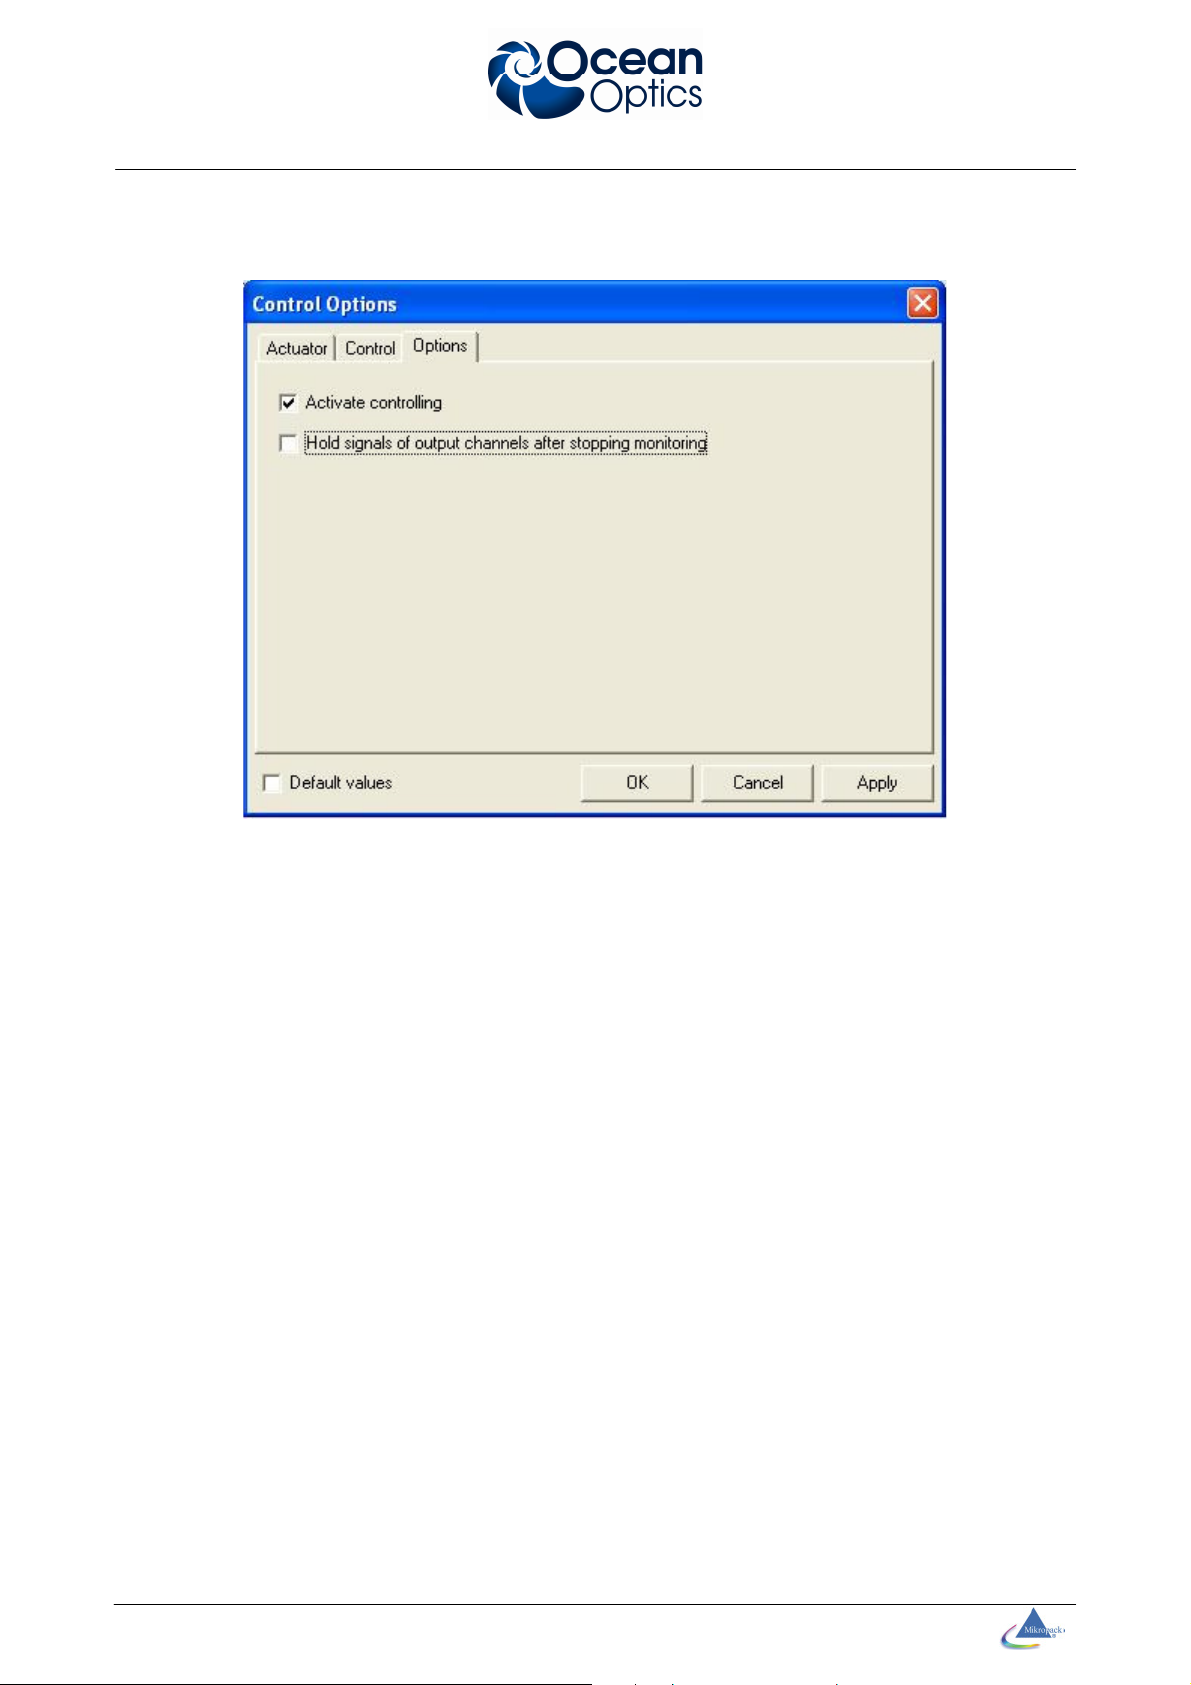
Options
Activate controlling Switch on/off general controlling
Hold signals of output
channels after ...
The voltage of the analog outputs and the TTL
levels of the digital outputs is hold or set to zero
when the monitoring is stopped
General:
Standard values
The current options are saved as default values
Ocean Optics Germany GmbH PlasCalc 2000 Thin Film Metrology 37
Page 41

PID Control Options
Proportional term Kp parameter
Integral term Ki and Ti parameter
Derivative term Kd and Td parameter
Ocean Optics Germany GmbH PlasCalc 2000 Thin Film Metrology 38
Page 42

7.6.5 Plot Options
Dialog for setting and changing plot options with the following tab sheets:
General:
File list Selection list of files and tracks
Axis
Minimum Smallest display value
Maximum Largest display value
Unit Unit of axis
Scaling Scaling method of display
Increment Reserved
Ocean Optics Germany GmbH PlasCalc 2000 Thin Film Metrology 39
Page 43

Tracks
Display track Display track in diagram
Line Line options of selected track: color, width
same attributes for all lines Line options are applied to all tracks
and style
Ocean Optics Germany GmbH PlasCalc 2000 Thin Film Metrology 40
Page 44

Diagram
Background Background color
Axis Line options of axis: color, width and style
Grid Line options of grid: color, width and style
Horizontal grid lines Display horizontal grid lines
Vertical grid lines Display vertical grid lines
Tics Position and Length of unit tics
Borders Border width of diagram
Ocean Optics Germany GmbH PlasCalc 2000 Thin Film Metrology 41
Page 45

Labels
Title Title of diagram
x-Axis Label of x-axis
y-Axis Label of y-axis
Ocean Optics Germany GmbH PlasCalc 2000 Thin Film Metrology 42
Page 46

Fonts
Font General font
Individual fonts Individual fonts
Diagram labels font of diagram labels
Numbers font of numbers
Legend font of legend
Ocean Optics Germany GmbH PlasCalc 2000 Thin Film Metrology 43
Page 47

Options
Display of spectra Display open files as
single spectrum single
overlay spectra superposed
tile spectra tiled horizontally
Display line cursor value Display line cursor
no no display
in legend value is displayed in legend
at line cursor value is displayed at line cursor
General:
Standard values: The current options are saved as default values
Ocean Optics Germany GmbH PlasCalc 2000 Thin Film Metrology 44
Page 48

7.6.6 User Setting
Dialog for the configuration of the user mode setting.
All menu commands are listed as in the menus. The selected commands are
enabled in user mode, all others are disabled.
Notice:
Changing between administrator and user mode requires a password. The default
password is "admin".
If you don't remember your password copy the default administration file "admin"
from the installation CD in the program folder.
Ocean Optics Germany GmbH PlasCalc 2000 Thin Film Metrology 45
Page 49

7.6.7 Spectrometer Configuration
Dialog for changing the spectrometer configuration.
Serial number Serial number of the connected spectrometer
Wavelength calibration:
Intercept Intercept wavelength of regression fit
First coefficient First coefficient of regression fit
Second coefficient Second coefficient of regression fit
Third coefficient Third coefficient of regression fit
Warning: These settings should only be changed by experienced users
Ocean Optics Germany GmbH PlasCalc 2000 Thin Film Metrology 46
Page 50

7.6.8 Configure SpecLine Tool
Dialog for configuring the optional software-tool SpecLine
Program location Directory and file name of executable file
of SpecLine
Open files in single window In SpecLine the spectra are opened in a
single (Overlay mode) or in seperate
windows
Ocean Optics Germany GmbH PlasCalc 2000 Thin Film Metrology 47
Page 51

8 Specifications
Technical Data PlasCalc-2000-UV/VIS/NIR
Spectral range 200-1100 nm
Optical resolution 1 nm FWHM (full width half
Fiber-input-connector SMA905
D/A-converter 14 bit
Analog output /voltage sign. 4 x [0-10V]
Digital input/output 4 x TTL / 4 x TTL
Interface USB V1.1
Power supply 12VDC 1,25A
maximum)
Operating temp. / humidity 5-35°C / 5-95% without
condensation
Dimensions 257 x 152 x 263 mm
Weight 3,9 kg
Ocean Optics Germany GmbH PlasCalc 2000 Thin Film Metrology 48
Page 52

9 End User License Agreement for Software (EULA)
This End User License Agreement ("EULA") is a legal agreement between you
(either an individual or a single entity) and Ocean Optis Germany GmbH ("Ocean
Optics") for the Ocean Optics PlasCalc software, which includes computer software
and may include associated media, printed materials, and "online" or electronic
documentation ("SOFTWARE"). By installing, copying, or otherwise using the
SOFTWARE, you agree to be bound by the terms of this EULA. If you do not agree
to the terms of this EULA, do not install, copy or use the SOFTWARE.
The SOFTWARE is protected by copyright laws and international copyright treaties,
as well as other intellectual property laws and treaties. The SOFTWARE is
licensed, not sold.
1. License to Use
Ocean Optics Germany grants you a non-exclusive and non-transferable license for
the internal use only of the SOFTWARE and any error corrections provided by
Ocean Optics, with one (1) computer at a time and you must ensure that only one
copy is in use at any given time.
2. Restrictions
SOFTWARE is confidential and copyrighted. Title to SOFTWARE and all
associated intellectual property rights is retained by Ocean Optics and/or its
licensors. You may not make copies of SOFTWARE, other than a single copy of
SOFTWARE for archival purposes. Unless enforcement is prohibited by applicable
law, you may not modify, decompile, or reverse engineer SOFTWARE. No right,
title or interest in or to any trademark, service mark, logo or trade name of Ocean
Optics or its licensors is granted under this EULA.
3. Limited Warranty
Ocean Optics warrants to you that for a period of six (6) months from the date of
purchase, as evidenced by a copy of the receipt, the media on which SOFTWARE
is furnished (if any) will be free of defects in materials and workmanship under
normal use. Except for the foregoing, SOFTWARE is provided "AS IS". Your
exclusive remedy and Ocean Optics entire liability under this limited warranty will
be at Ocean Optics option to replace SOFTWARE media or refund the fee paid for
SOFTWARE
4. Disclaimer of Warranty
Unless specified in this EULA, all express or implied conditions, representations
and warranties, including any implied warranty of merchantability, fitness for a
particular purpose or non-infringement are disclaimed, except to the extent that
these disclaimer are held to be legally invalid.
Ocean Optics Germany GmbH PlasCalc 2000 Thin Film Metrology 49
Page 53

5. Limitation of Liability
To the extent not prohibited by law, in no event will Ocean Optics or its licensors be
liable for any lost revenue, profit or data, or for special, indirect, consequential,
incidental or punitive damages, however caused regardless of the theory of liability,
arising out of or related to the use of or inability to use SOFTWARE, even if Ocean
Optics has been advised of the possibility of such damages. In no event will Ocean
Optics liability to you, whether in contract, tort (including negligence), or otherwise,
exceed the amount paid by you for Software under this EULA. The foregoing
limitations will apply even if the above stated warranty fails of its essential purpose.
Ocean Optics Germany GmbH PlasCalc 2000 Thin Film Metrology 50
Page 54

10 Appendix A
10.1 Endpoint detection with the PlasCalc system
General remarks
In the following a step-by-step instruction is presented for setting up an endpoint detection
recipe for the OCEAN OPTICS PlasCalc system. In the following it is assumed that you
are familiar with the basic functions of the OCEAN OPTICS PlasCalc system.
A. First time data acquisition
While a typical process cycle is running, acquire spectra from the plasma. Save all
recorded spectra on your PC (hard disk) by selecting this option either in the Record
Option dialog
or in the Monitor Option dialog:
Important: During the process cycle please write down the number of the spectra which
are recorded before and after the endpoint.
B. Identification of process relevant plasma particles
Ocean Optics Germany GmbH PlasCalc 2000 Thin Film Metrology 51
Page 55

From the recorded data select at least two spectra one before and one after the endpoint
was reached. Carry out an identification of process relevant plasma particles using e.g.
SpecLine software. Search especially for atomic lines and molecular bands of the process
gas, of the layer material and of the substrate material.
Compare the two spectra and look for new or vanished lines and difference in line
intensities.
C. Setting up and recording monitor tracks
From the evaluated spectra write down the wavelength of the lines, which have changed
while crossing the endpoint. Create monitor tracks for these lines and name the tracks
according to the name of the identified plasma particle. Save your settings in a monitor
recipe file using the menu command: Monitoring | Save monitor recipe!
Run the plasma process again and this time, also save the monitor data by selecting the
option in the Monitor Option dialog:
When crossing the endpoint you should notice a change in the monitor tracks. This may be
an increase or decrease of signal of the monitor tracks.
Hint: Identifying the correct spectral lines and monitor tracks for endpoint detection is the
most important and crucial task in this procedure. Please take your time and if you don’t
see immediately a correlation between the selected monitor tracks and the endpoint,
create different monitor tracks from other lines of the recorded spectra and try again as
suggested below.
Ocean Optics Germany GmbH PlasCalc 2000 Thin Film Metrology 52
Page 56

If a correlation of the monitor signals and the endpoint is not directly seen, you may
improve your monitor recipe by following one or more of the steps given below:
1. Create monitor tracks which are related (divided) to the monitor signal of the
background gas (preferable a noble gas) using the menu command Monitoring |
Add combined monitor track:
2.
3. Create a monitor tracks which is Combining (dividing) monitor signals with different
dependencies across the endpoint to improve the signal/noise ratio.
4. Create a monitor track with the derivative of a monitor signal if the temporal
evolution is changing across the endpoint:
Important: After you have successfully determined appropriate monitor signals for
detecting the endpoint, make sure that you save your settings in a monitor recipe using the
menu command Monitoring | Save monitor recipe!
Ocean Optics Germany GmbH PlasCalc 2000 Thin Film Metrology 53
Page 57

If it is not possible to run the process easily several times you may use the recorded
spectra of the first run for defining the monitor tracks: When starting the PlasCalc software
choose the option Open recorded sequence of spectra in the Start Options dialog:
In the Open File dialog specify the first recorded spectra. The recorded sequence of
spectra acts like a movie and will be played in the Record Window in an endless loop. You
can use all functions of the PlasCalc software as if you were doing a real-time recording.
Proceed with the evaluation of monitor tracks as described above.
Ocean Optics Germany GmbH PlasCalc 2000 Thin Film Metrology 54
Page 58

D. Defining set-points
Once you have set-up your monitor tracks and you can see a increase or decrease in the
signal while crossing the endpoint you may define set-points for automatic signaling if the
endpoint is reached. In the Monitor Option dialog activate lower and/or upper set-point for
the monitor tracks of interest:
Specify how the crossing of a set-point is displayed on the screen and/or signaled by an
acoustic sound.
Ocean Optics Germany GmbH PlasCalc 2000 Thin Film Metrology 55
Page 59
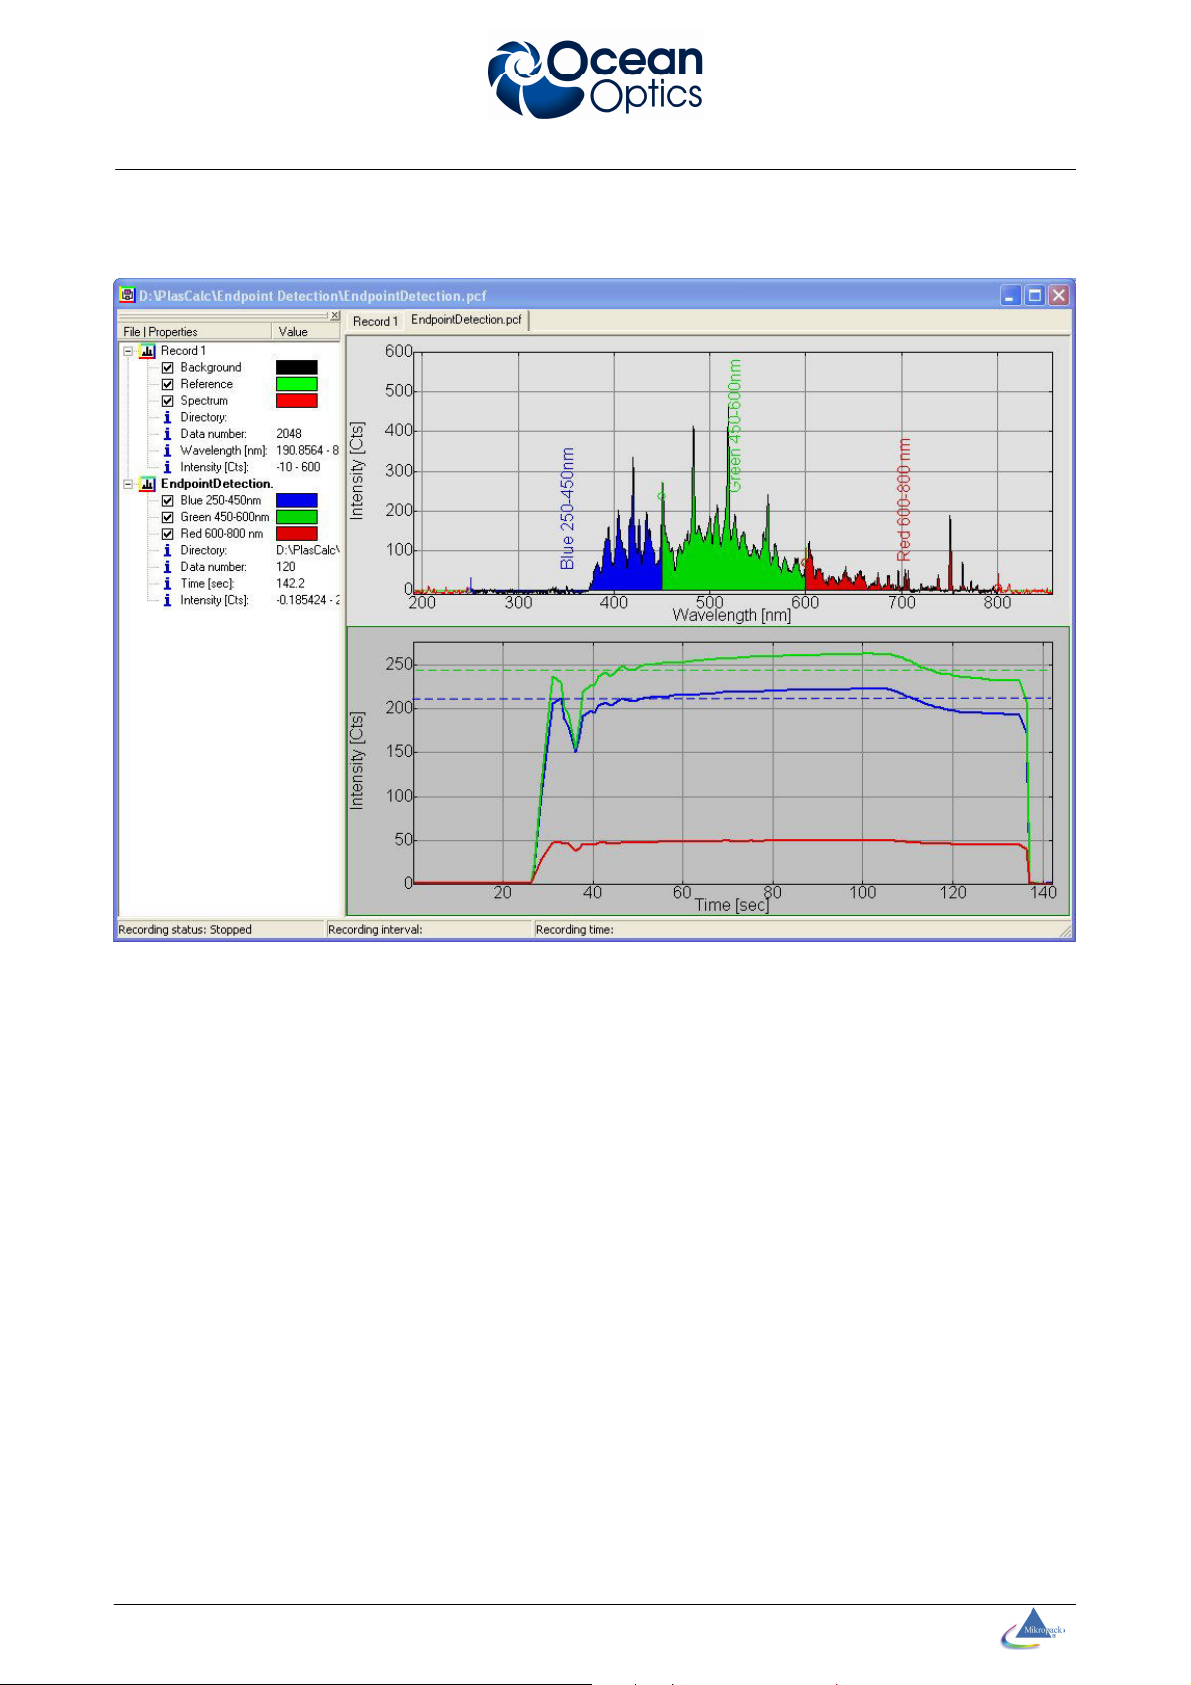
The set-points are displayed in monitor window as dashed lines which can be moved using
the mouse pointer.
Ocean Optics Germany GmbH PlasCalc 2000 Thin Film Metrology 56
 Loading...