

Page 1

►
OOISensors
Fiber Optic Sensors System
Installation and Operation Manual
Document Number FOXY-AL300-000-02-0207
Offices: Ocean Optics, Inc. World Headquarters
830 Douglas Ave., Dunedin, FL, USA 34698
Phone 727.733.2447
Fax 727.733.3962
8 a.m.– 8 p.m. (Mon-Thu), 8 a.m.– 6 p.m. (Fri) EST
E-mail: Info@OceanOptics.com (General sales inquiries)
Orders@OceanOptics.com (Questions about orders)
TechSupport@OceanOptics.com (Technical support)
Page 2

Additional
Offices:
Ocean Optics Asia
137 Xianxia Road, Suite 1802, Changning District, Shanghai, PRC. 200051
Phone 86.21.5206.8686
Fax 86.21.5206.8686
E-Mail Sun.Ling@OceanOptics.com
Ocean Optics B.V. (Europe)
Geograaf 24, 6921 EW DUIVEN, The Netherlands
Phone 31-(0)26-3190500
Fax 31-(0)26-3190505
E -Mail Info@OceanOpticsBV.com
Copyright © 2001-2007 Ocean Optics, Inc.
All rights reserved. No part of this publication may be reproduced, stored in a retrieval system, or transmitted, by any means, electronic,
mechanical, photocopying, recording, or otherwise, without written permission from Ocean Optics, Inc.
This manual is sold as part of an order and subject to the condition that it shall not, by way of trade or otherwise, be lent, re-sold, hired out or
otherwise circulated without the prior consent of Ocean Optics, Inc. in any form of binding or cover other than that in which it is published.
Trademarks
All products and services herein are the trademarks, service marks, registered trademarks or registered service marks of their respective owners.
Limit of Liability
Ocean Optics has made every effort to make this manual as complete and as accurate as possible, but no warranty or fitness is implied. The
information provided is on an “as is” basis. Ocean Optics, Inc. shall have neither liability nor responsibility to any person or entity with respect to
any loss or damages arising from the information contained in this manual.
Page 3

Table of Contents
About This Manual .......................................................................................................... 7
Document Purpose and Intended Audience.............................................................................. 7
What’s New in this Document ................................................................................................... 7
Document Summary.................................................................................................................. 7
Product-Related Documentation ............................................................................................... 8
Upgrades......................................................................................................................... 8
Chapter 1: Sensors System Overview ..............................................1
Overview ......................................................................................................................... 1
Oxygen Sensors System Overview ................................................................................. 1
pH Sensors System Overview......................................................................................... 1
FOXY Probes ............................................................................................................................ 2
FOSPOR Probes ....................................................................................................................... 2
HIOXY Probes ........................................................................................................................... 2
MultiFrequency Phase Fluorometer (MFPF) ................................................................... 2
Hardware......................................................................................................................... 3
Included Hardware (Oxygen Sensor System)........................................................................... 3
Included Hardware (pH Sensor System)................................................................................... 3
Software .......................................................................................................................... 3
Documentation ................................................................................................................ 4
Packing List ............................................................................................................................... 4
Wavelength Calibration Data.....................................................................................................4
Software and Technical Resources CD .................................................................................... 4
Temperature Calibration Diskette (if requested) .......................................................................4
Chapter 2: OOISensors Software.......................................................5
OOISensors Overview..................................................................................................... 5
Installing OOISensors ..................................................................................................... 6
Configuring OOISensors Software .................................................................................. 8
Configure Menu Functions .............................................................................................. 8
Configure Hardware ..................................................................................................................9
Software..................................................................................................................................... 10
FOXY-AL300-000-02-0207 i
Page 4

Table of Contents
Sensors Tab for Spectrometer Systems ................................................................................... 11
pH .............................................................................................................................................. 16
Timing Tab................................................................................................................................. 18
Display Tab................................................................................................................................ 20
Log Tab...................................................................................................................................... 21
Display Functions ............................................................................................................ 22
Scan Control.............................................................................................................................. 22
Store Dark ................................................................................................................................. 23
Subtract Dark............................................................................................................................. 23
Data Acquisition Parameters.....................................................................................................24
Cursor Functions ....................................................................................................................... 25
Cursor Bar ................................................................................................................................. 26
Data Values ...............................................................................................................................27
Spectral Graph .......................................................................................................................... 27
Temperature Chart .................................................................................................................... 28
Log On/Off Switch .....................................................................................................................30
File Menu Functions ........................................................................................................ 30
Save Spectrum .......................................................................................................................... 30
Save Time Chart........................................................................................................................ 31
Open Spectrum ......................................................................................................................... 31
Open Time Chart ....................................................................................................................... 31
Page Setup................................................................................................................................ 31
Print Spectrum and Time Chart................................................................................................. 31
Exit............................................................................................................................................. 31
Graph&Chart Menu Functions......................................................................................... 31
Clear Spectrum Graph............................................................................................................... 32
Clear Time Chart ....................................................................................................................... 32
Enable Grid................................................................................................................................ 32
Autoscale Horizontal (Spectral Graph)...................................................................................... 32
Autoscale Vertical (Spectral Graph) .......................................................................................... 32
Autoscale Vertical (Time Chart) ................................................................................................ 32
View Temperature Chart ...........................................................................................................32
Spectrometer Menu Functions ........................................................................................ 32
Scan........................................................................................................................................... 33
Insert Event in Log File.............................................................................................................. 33
Calculate Sensor Values with Scan .......................................................................................... 33
Pulse LED.................................................................................................................................. 33
Calibrate Menu Functions ............................................................................................... 34
Configuring a Spectrometer in OOISensors.................................................................... 34
ii FOXY-AL300-000-02-0207
Page 5

Table of Contents
Chapter 3: Oxygen Sensors ...............................................................37
How the Oxygen Sensors Work ...................................................................................... 37
Fluorescence Quenching ................................................................................................ 38
Connecting the Fiber Optic Sensors System................................................................... 38
Calibration Requirements for Oxygen Sensors ............................................................... 39
Linear (Stern-Volmer) Algorithm................................................................................................ 39
Second Order Polynomial Algorithm ......................................................................................... 40
Theory - Henry’s Law ................................................................................................................41
Temperature.................................................................................................................... 42
Scattering Media ............................................................................................................. 43
Samples to Use ............................................................................................................... 43
Calibrating Oxygen Sensors............................................................................................ 44
Calibrating Oxygen Sensors without Temperature Compensation ...........................................44
Calibrating Oxygen Sensors with Temperature Compensation ................................................ 47
About Factory Calibration.......................................................................................................... 47
Calibrating With Factory Calibration.......................................................................................... 47
Calibrating Without Factory Calibration..................................................................................... 50
Calibration Data............................................................................................................... 55
Recalibration ...................................................................................................................56
Chapter 4: pH Sensors........................................................................57
Overview ......................................................................................................................... 57
pH Films .......................................................................................................................... 57
Probe Options............................................................................................................................ 57
More Information ............................................................................................................. 58
Start Up ........................................................................................................................... 58
pH Sensor Set Up...................................................................................................................... 58
Calibration ....................................................................................................................... 61
pH Sensor Calibration ............................................................................................................... 61
Chapter 5: Compatible Products and Accessories ..........................65
Overview ......................................................................................................................... 65
Probes ............................................................................................................................. 65
Factory Calibration Service ............................................................................................. 67
Overcoats ........................................................................................................................ 67
Temperature Compensating Components ...................................................................... 68
FOXY-AL300-000-02-0207 iii
Page 6

Table of Contents
Sol-Gel Coated Membranes, Microscope Coverslips, and Slides ................................... 68
Spectrometers ................................................................................................................. 69
Light Sources .................................................................................................................. 69
Bifurcated Optical Fiber Assemblies and Splice Bushing................................................ 70
Chapter 6: Hardware Datasheets and Instructions..........................71
Overview ......................................................................................................................... 71
Oxygen Sensing Probes – General Information.............................................................. 71
Probe Construction.................................................................................................................... 72
Accuracy.................................................................................................................................... 72
Measurement Range................................................................................................................. 72
Sampling Chambers.................................................................................................................. 73
Response Time ......................................................................................................................... 73
Environmental Conditions.......................................................................................................... 73
Chemical Compatibility.............................................................................................................. 73
Temperature and the Oxygen Probe......................................................................................... 74
Photodegradation ...................................................................................................................... 74
Ambient Light............................................................................................................................. 74
Lifetime ......................................................................................................................................74
Cleaning Oxygen Probes........................................................................................................... 74
Use Warnings ............................................................................................................................75
Oxygen Probe Specifications ....................................................................................................75
Sterilization Methods Tested on Oxygen Probes ......................................................................75
FOXY-R Stainless-steel 1/16" OD Fiber Optic Probe...................................................... 76
FOXY-R Specifications.................................................................................................... 77
FOXY-AL300 Aluminum-jacketed Fiber Optic Probe ...................................................... 78
FOXY-AL300 Specifications............................................................................................ 78
FOXY-PI600 Polyimide coated Fiber Optic Probe........................................................... 79
FOXY-PI600 Specifications............................................................................................. 80
FOXY-18G/21G Needle-tipped 18/21-gauge Fiber Optic Probes ................................... 80
FOXY-18G/21G Specifications........................................................................................ 81
FOXY-OR125 and FOXY-OR125G O-ring Fiber Optic Probes ....................................... 82
FOXY-OR125 and FOXY-OR125G Specifications.......................................................... 82
FOXY-T1000 Stainless-steel Fiber Optic Probe with Light Shield................................... 83
FOXY-T1000 Specifications ............................................................................................ 84
FOXY-T1000-RTD Stainless-steel Fiber Optic Probe with Light Shield.......................... 84
FOXY-T1000-RTD Specifications.................................................................................... 85
FOXY-RESP Respiration Probe...................................................................................... 86
iv FOXY-AL300-000-02-0207
Page 7

Table of Contents
FOXY-RESP Specifications ............................................................................................ 86
Factory Calibration Services............................................................................................ 87
FOXY-RECOV Probe Reconditioning ............................................................................. 87
FOXY-AF and FOXY-AF-MG Silicone Overcoats ........................................................... 88
Cleaning..................................................................................................................................... 88
Sterilizing ...................................................................................................................................89
Overcoat Specifications............................................................................................................. 89
Oxygen Probe Temperature Control Accessories........................................................... 90
FOXY-TS1 Omega Thermistor.................................................................................................. 90
FOXY-TK1 K-type Omega Thermocouple................................................................................. 91
FOXY-TK1-W K-type Omega Thermocouple............................................................................ 93
USB-LS-450-TP Temperature Probe ........................................................................................ 93
Light Sources .................................................................................................................. 94
LS-450 Blue LED Pulsed Light Source ..................................................................................... 94
R-LS-450 Rack-mount Blue LED Pulsed Light Source ............................................................. 96
OOISensors Flash Delay........................................................................................................... 100
Setting the Integration Time ...................................................................................................... 100
USB-LS-450 .............................................................................................................................. 101
Bifurcated Optical Fiber Assemblies................................................................................ 102
Use Notes.................................................................................................................................. 103
Bifurcated Fiber Assembly Specifications ................................................................................. 103
FOXY/HOXY/FOSPOR General Specifications .............................................................. 104
FOSPOR Specifications .................................................................................................. 105
FOXY/MFPF Specifications............................................................................................. 106
HIOXY/MFPF Specifications ........................................................................................... 107
Chapter 7: Troubleshooting ...............................................................109
Overview ......................................................................................................................... 109
General Troubleshooting Procedures ............................................................................. 109
Troubleshooting Device Installation ................................................................................ 111
Remove the Unknown Device from Windows Device Manager................................................ 112
Remove Improperly Installed Files ............................................................................................ 112
Appendix A: External Triggering .......................................................115
FOXY-AL300-000-02-0207 v
Page 8

Table of Contents
Appendix B: Chemical Effects on Oxygen Probes ..........................117
Summary of Chemical Effects on Oxygen Probes .......................................................... 117
Appendix C: pH Sensor Theory of Operation and Calculations.....119
Overview ......................................................................................................................... 119
Theory of Operation and Calculations............................................................................. 119
Model # 1................................................................................................................................... 120
Model # 2................................................................................................................................... 120
Model # 3................................................................................................................................... 120
Model # 4................................................................................................................................... 122
Revised Model #4...................................................................................................................... 123
Index.....................................................................................................125
vi FOXY-AL300-000-02-0207
Page 9
About This Manual
Document Purpose and Intended Audience
This document provides you with an installation and configuration instructions to get your system up and
running. In addition, user interface for SpectraSuite is provided.
What’s New in this Document
This version updates the installation information.
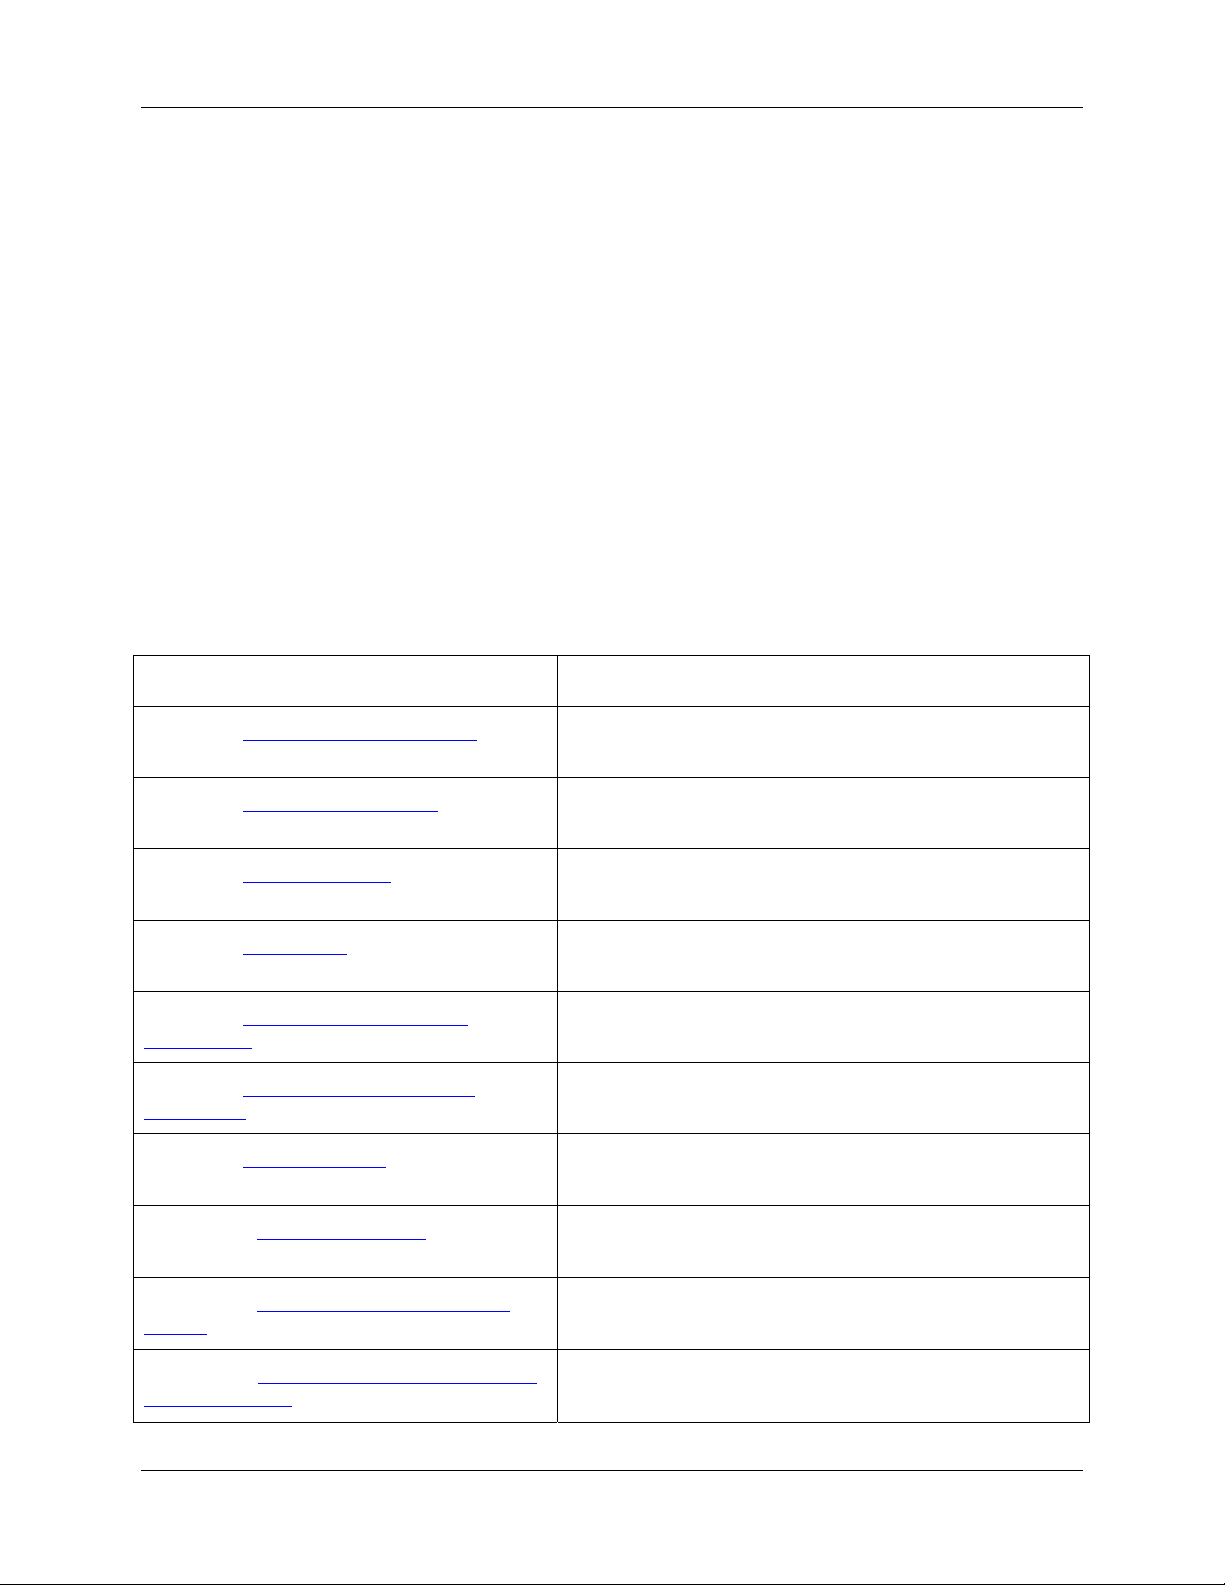
Document Summary
Chapter Description
Chapter 1: Sensors System Overview Contains descriptions of what is included in a sensor
system.
Chapter 2: OOISensors Software Contains instructions for installing and configuring the
OOISensors software when used with a spectrometer.
Chapter 3: Oxygen Sensors Provides information on how the sensors work, as well as
instructions for installing and calibrating the sensors.
Chapter 4: pH Sensors Provides a description of the pH sensors and a procedure
for calibration.
Chapter 5: Compatible Products and
Accessories
Chapter 6: Hardware Datasheets and
Instructions
Chapter 7: Troubleshooting Contains a table of troubleshooting suggestions and
Appendix A: External Triggering Provides information on external triggering as it relates to
Contains descriptions of compatible accessories and their
specifications.
Contains descriptions of the functions on the
Spectrometer Menu.
sensors.
Appendix B: Chemical Effects on Oxygen
Probes
Appendix C: pH Sensor Theory of Operation
and Calculations
FOXY-AL300-000-02-0207 7
Lists chemicals known to be harmful and chemicals that
have no effect on oxygen probes.
Contains equations that express the theory of pH sensor
operation and calculations.
Page 10

Table of Contents
Product-Related Documentation
• MultiFrequency Phase Fluorometer Installation and Operation Manuall
• Various USB spectrometer documents such as the
Operation Manual.
• SpectraSuite Spectrometer Operating Software Installation and Operation Manual
OOIBase32 Spectrometer Operating Software Installation and Operation Manual
•
You can access documentation for Ocean Optics products by visiting our website at
http://www.oceanoptics.com. Select Technical → Operating Instructions, then choose the appropriate
document from the available drop-down lists. Or, use the Search by Model Number field at the bottom
of the web page.
You can also access operating instructions for Ocean Optics products on the Software and Technical
Resources CD included with the system.
Engineering-level documentation is located on our website at Technical → Engineering Docs.
USB4000 Spectrometer Installation and
Upgrades
Occasionally, you may find that you need Ocean Optics to make a change or an upgrade to your system.
To facilitate these changes, you must first contact Customer Support and obtain a Return Merchandise
Authorization (RMA) number. Please contact Ocean Optics for specific instructions when returning a
product.
8 FOXY-AL300-000-02-0207
Page 11

Chapter 1
Sensors System Overview
Overview
The following sections provide a general overview of the Oxygen Sensors System and the pH Sensors
System.
Oxygen Sensors System Overview
Fiber Optic Oxygen Sensors are spectrometer and/or phase fluorometer-coupled chemical sensors for
monitoring oxygen partial pressure in gases and liquids. A fluorescence method measures the partial
pressure of dissolved or gaseous oxygen. Optical fiber carries excitation light produced by the blue LED
to the thin-film coating at the probe tip. The probe collects fluorescence generated at the tip and carries it
via the optical fiber to the high-sensitivity spectrometer. When oxygen in the gas or liquid sample diffuses
into the thin film coating, it quenches the fluorescence. The degree of quenching correlates to the level of
oxygen pressure.
Fiber Optic Oxygen Sensors are low-power, portable devices that offer high sensitivity, reversibility, and
stability. Their small size is useful for remote monitoring. What's more, the thin film used in the probe
tips consumes no oxygen, allowing for continuous contact with the sample. FOXY Sensors offer other
key advantages: They're ideal for viscous samples and are immune to interference caused by pH change
or from changes in ionic strength, salinity, and biofouling.
pH Sensors System Overview
Fiber optic probes for pH monitoring couple to Ocean Optics spectrometers to measure pH by monitoring
color changes in indicator dyes. These dyes are immobilized in polymer films. You then place the films in
the optical path of a transflection dip probe and exposed to the sample solution. These pH probe sensors
are especially useful for monitoring low conductivity samples such as boiler water, where potentiometric
devices fail; or for turbid, fouling environments, where particulate matter, slurries, and other media can
coat or destroy electrodes.
Ocean Optics' fully integrated pH systems provide full spectral analysis to help eliminate errors from dye
leaching or from changes in turbidity, temperature, and ionic strength. Inherent calibration based on the
physical properties of the immobilized indicator dye eliminates the need for frequent calibration.
FOXY-AL300-000-02-0207 1
Page 12

1: Sensors System Overview
FOXY Probes
FOXY oxygen sensors are designed for monitoring oxygen partial pressure in gas and aqueous solutions.
Standard FOXY comes with different probe sizes and configurations depending on the application.
FOSPOR Probes
FOSPOR is a new generation of highly sensitive probes for monitoring traces if oxygen in gas and
liquids. This sensor is capable of monitoring low ppm levels of oxygen in gas and ppb levels of dissolved
oxygen in liquids. This sensor can be used in environments where oxygen traces need to be monitored.
Some applications include vacuum systems, and food and pharmaceutical packaging. The sensor material
consists of a sol gel thin film immobilized with Pt-porphyrin.
HIOXY Probes
HIOXY (FOXY-hydrocarbon) is designed for monitoring oxygen partial pressure in nonaqueous vapors
and solutions. The sensor coating chemistry is designed for compatibility with oils, alcohols and
hydrocarbon-based vapors and liquids. HIOXY has been tested successfully in commercial and military
aviation fuels, gasoline, diesel, some alcohols, glycol, military hydraulic fluids, and wine.
MultiFrequency Phase Fluorometer (MFPF)
The MultiFrequency Phase Fluorometer (MFPF) is a flexible platform for measuring luminescence
lifetime, phase and intensity. The MFPF is a compact, self-contained, frequency-domain luminescence
monitor that is invariant to fiber bending and stray light, and has a wide dynamic range of optical
intensity as well as low optical and electronic crosstalk, and low drift and phase noise. Therefore, the
MFPF is especially useful for oxygen sensing applications where sensitivity to drift is important and
where sample set-ups must be left undisturbed for long periods of time. There are two MFPF models:
• MFPF100-1 – 1-channel unit includes one thermistor
• MFPF100-2 -- 2-channel unit includes two thermistors
The MFPF is available for use with FOXY, HIOXY, and FOSPOR custom probes. See the
MultiFrequency Phase Fluorometer Installation and Operation Manual for more information on the
MFPF.
The MFPF software works in conjunction with OOISensors software to manage the MFPF unit. If your
system uses a spectrometer instead, you will not install or use the MFPF software. See
OOISensors
The application for measuring oxygen concentrations is essentially the same for spectrometers and MFPF.
The main difference is that the spectrometers’ application is with raw data of spectrum intensity of
fluorescence at a particular wavelength, while the MFPF’s application raw data is Tau, which is an
indication of the decay of fluorescence over time as the result of a light pulse on sensor material.
for more information on installing software.
Installing
2 FOXY-AL300-000-02-0207
Page 13

1: Sensors System Overview
Hardware
The following hardware is included with the Fiber Optic Sensors System or is compatible with the Fiber
Optic Sensors System.
Included Hardware (Oxygen Sensor System)
Fiber optic fluorescence probe with proprietary oxygen-sensing thin-film coating on the tip
Miniature fiber optic spectrometer
LS-450 Blue LED Light Source
Bifurcated optical fiber assembly with splice bushing that connects the fluorescence probe to the
spectrometer and the LED
A/D Converter (if needed)
Included Hardware (pH Sensor System)
pH probe & film
Light Source (such as LS-1 or Mini-D2T)
Miniature fiber optic spectrometer (see Spectrometers for options)
A/D Converter (if needed)
Compatible Products and Accessories for information on these and other Ocean Optics products
See
designed for use with the Fiber Optic Sensor System.
Caution
Do not connect the spectrometer included with the Fiber Optics Sensors System to the PC
prior to installing the OOISensors software. Connecting this equipment prior to software
installation will result in incorrect driver configuration and may require Technical Support
to correct. See
Troubleshooting for more information.
Software
OOISensors software is Ocean Optics’ next generation of software for use with the Fiber Optics Sensor
System. OOISensors is an advanced data acquisition and display program that provides a real-time
interface to a variety of signal processing functions for users of Windows 95/98/ME/NT/2000/XP.
MFPF software is used with OOISensors when you have an MFPF unit. See
Fluorometer (MFPF)
for more information on the MFPF.
MultiFrequency Phase
FOXY-AL300-000-02-0207 3
Page 14

1: Sensors System Overview
Documentation
The Fiber Optic Sensors System contains various documentation components on paper, floppy diskette
and CD. These components include the following:
Packing List
Wavelength Calibration Data
Software and Technical Resources CD
Temperature Calibration Diskette (if requested)
Packing List
The packing list is located inside a plastic bag attached to the outside of the shipment box (the invoice is
mailed separately). The items listed on the packing slip include all of the components in the order,
including customized items installed in the spectrometer, such as the grating, detector collection lens, and
slit. The packing list also includes important information, such as the shipping and billing addresses, as
well as components on back order.
Wavelength Calibration Data
The spectrometer included with the Fiber Optic Sensors System is shipped in a silver-gray anti-static bag.
This bag also contains wavelength calibration information that is unique to your individual spectrometer.
Our spectrometer operating software simply reads these values from the spectrometer; however, this
information is provided in case, for some reason, you need to manually enter these values into the
software.
Software and Technical Resources CD
Each spectrometer order comes with Ocean Optics’ Software and Technical Resources CD. This disc
contains all Ocean Optics software and manuals for software operation, spectrometers, and spectroscopic
accessories. Documentation is provided in Portable Document Format (PDF). You need Adobe Acrobat
Reader version 6.0 or higher to view these files. Adobe Acrobat Reader is included on the CD.
With the exception of OOIBase32 Spectrometer Operating Software, all Ocean Optics software is
password protected. OOISensors Software must be purchased with your Fiber Optic Sensors System, and
the installation program is password protected. The password for the software can be found on the back of
the Software and Technical Resources CD package.
Temperature Calibration Diskette (if requested)
The Temperature Calibration Diskette can be used during temperature calibration setup. Insert the diskette
in the disk drive, and then load the data via the Multiple Temperature Calibration Screen.
4 FOXY-AL300-000-02-0207
Page 15

Chapter 2
OOISensors Software
OOISensors Overview
OOISensors Software is Ocean Optics’ next generation of operating software for the Fiber Optic Sensors
System. OOISensors is an advanced acquisition and display program that provides a real-time interface to
a variety of signal-processing functions for all Windows platforms. With OOISensors, you have the
ability to obtain oxygen partial pressure and concentration values, control all system parameters, collect
data from up to 8 spectrometer channels simultaneously and display the results in a single spectral
window, perform time acquisition experiments, and display and correct for temperature and/or ambient
pressure fluctuations in the sample.
OOISensors allows you to use the Second Order Polynomial algorithm in the calibration procedure. This
algorithm often provides more accurate data than the linear Stern-Volmer algorithm. Furthermore, you
can now monitor temperature with the OOISensors application. OOISensors corrects the data for any
fluctuations in temperature.
OOISensors can also display up to eight spectrometer channels in one spectral window, while providing
unique data acquisition parameters to each spectrometer channel.
Additionally, the Time Chart feature in OOISensors can display O
all active channels at a specific wavelength over a period. During a timed data acquisition procedure, you
can enter text for an event into the log file. Both the Time Chart and Data Logging features are enabled by
a simple switch next to the graph.
OOISensors can support up to four MFPF units; up to eight channels can be supported when OOISensors
is used with MFPF100-2 (two-channel) units.
values, pH values, and the data from
2
FOXY-AL300-000-02-0207 5
Page 16
2: OOISensors Software
Installing OOISensors
Before installing OOISensors Software, make sure that no other applications are running.
► Procedure
Perform the steps below to install the OOISensors software on your PC:
1. Close all other applications running on the PC.
2. Start the software installation process.
Installing from CD:
a. Insert the CD containing the OOISensors and software.
b. Select the drive on your computer with the software CD.
c. Double-click on the Setup.exe. The installation wizard appears.
Installing from the Web:
a. Go to
b. Right-click on OOISensors Oxygen Measurement Software and select Save
http://www.oceanoptics.com/technical/softwaredownloads.asp.
Target As… to download the executable to your machine.
c. Click Save. The installation begins.
d. Click Run. The Installation Wizard appears.
6 FOXY-AL300-000-02-0207
Page 17
2: OOISensors Software
3. Click Next at the Welcome screen. The Choose Destination Location screen appears.
4. Accept the default or select another location for your software files. Click Next. The Backup
Replaced Files screen appears.
5. Select Yes or No, depending on whether you want to create backup replacement files. If you
select Yes, choose a location for these files. Then click Next. The Select Program Manager
Group screen appears.
6. Select the name of the Program Manager group to which you want to add the OOISensor icons.
Then click Next. The Start Installation dialog box appears.
7. Click Next. The Password dialog box appears. Type the password for your OOISensors software
and click OK. Passwords are located on the back of the software CD jacket. The software begins
installing.
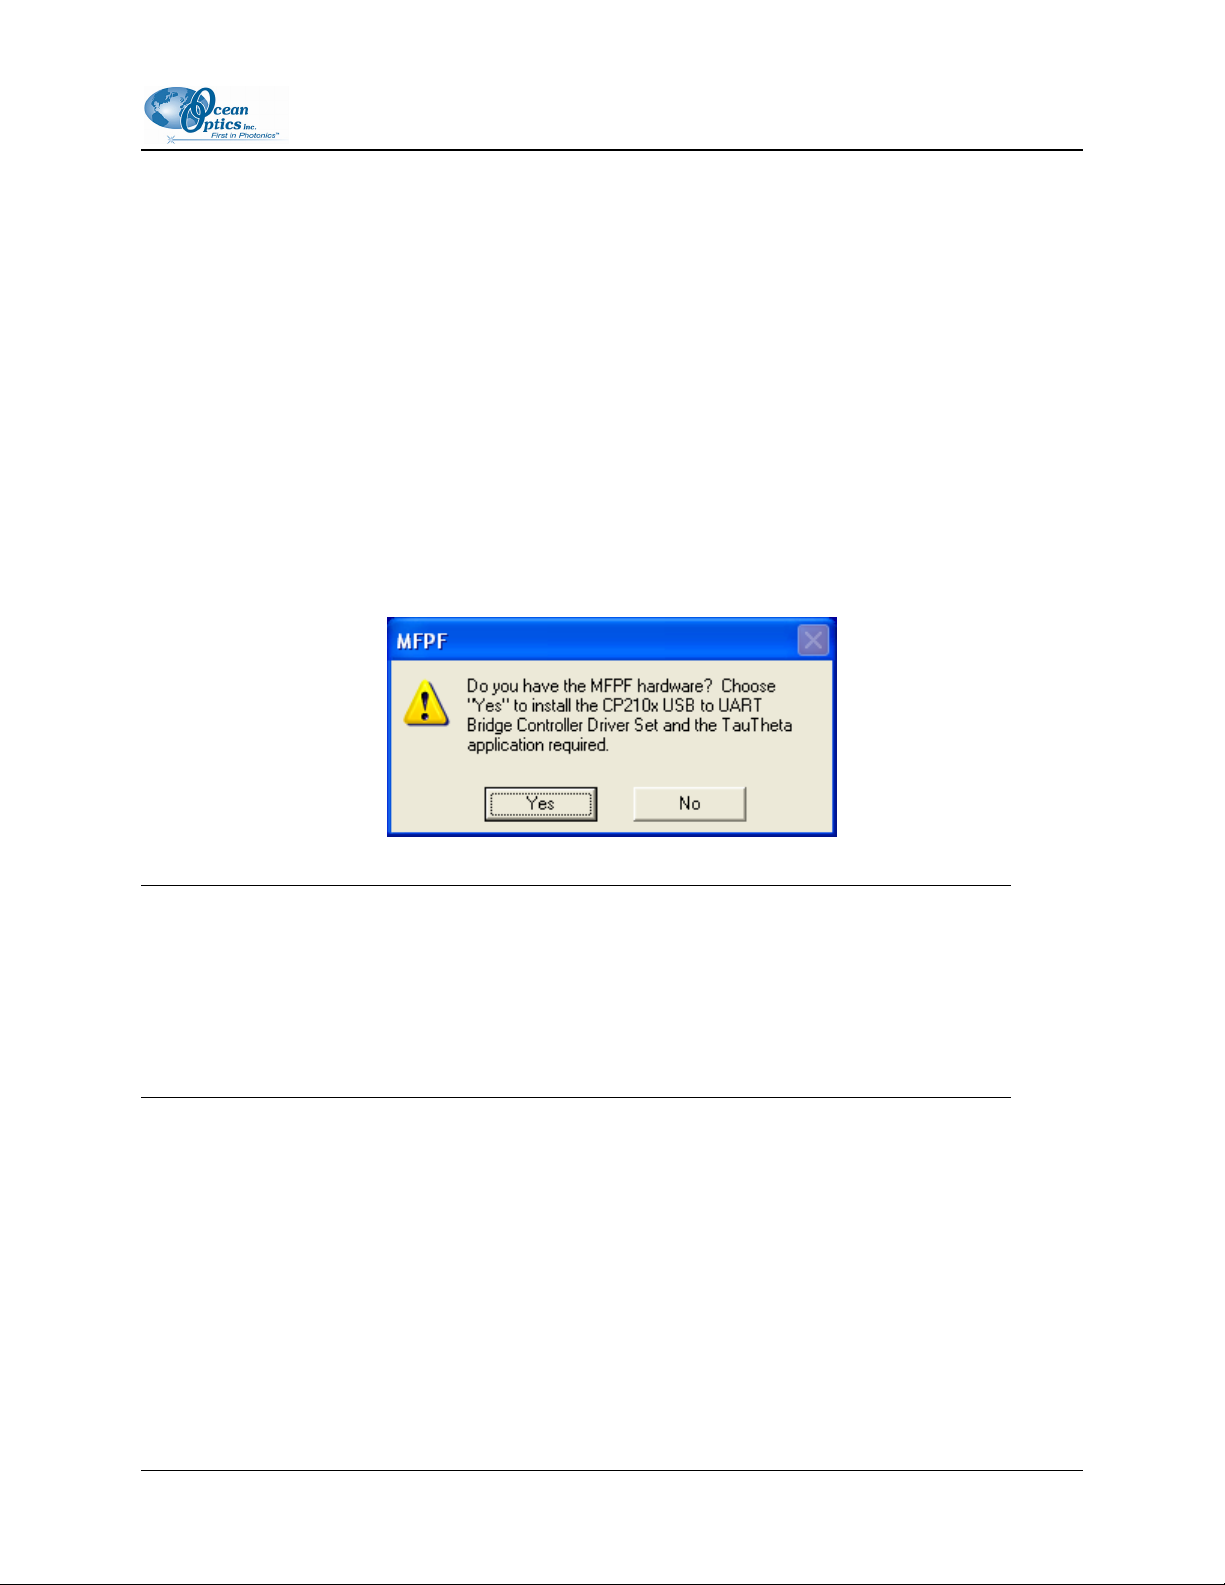
• The MFPF dialog box appears asking you if you have MFPF hardware.
Notes
If you have an MFPF unit, refer to the MultiFrequency Phase Fluorometer Installation and
Operation Manual for more information. These instructions assume that you are installing
OOISensors to use with a spectrometer.
You can reinstall the application again later to add support for the MFPF.
9. Click No. The installation begins. A message then appears informing you that your installation is
complete.
10. Click OK, then click Finish. You have now installed OOISensors software. You must restart
your computer to use the software.
FOXY-AL300-000-02-0207 7
Page 18

2: OOISensors Software
Configuring OOISensors Software
Once OOISensors is installed and the system has been rebooted, connect the spectrometer to the PC and
start the OOISensors program. Run OOISensors. If this is the first time you have opened the software, or
if the software is not configured yet, the Configure Hardware screen appears. You can also access this
screen manually by selecting Configure | Hardware from the OOISensors menu bar. See
Hardware
The first time that you run OOISensors, you will be prompted to configure the software for use with your
hardware.
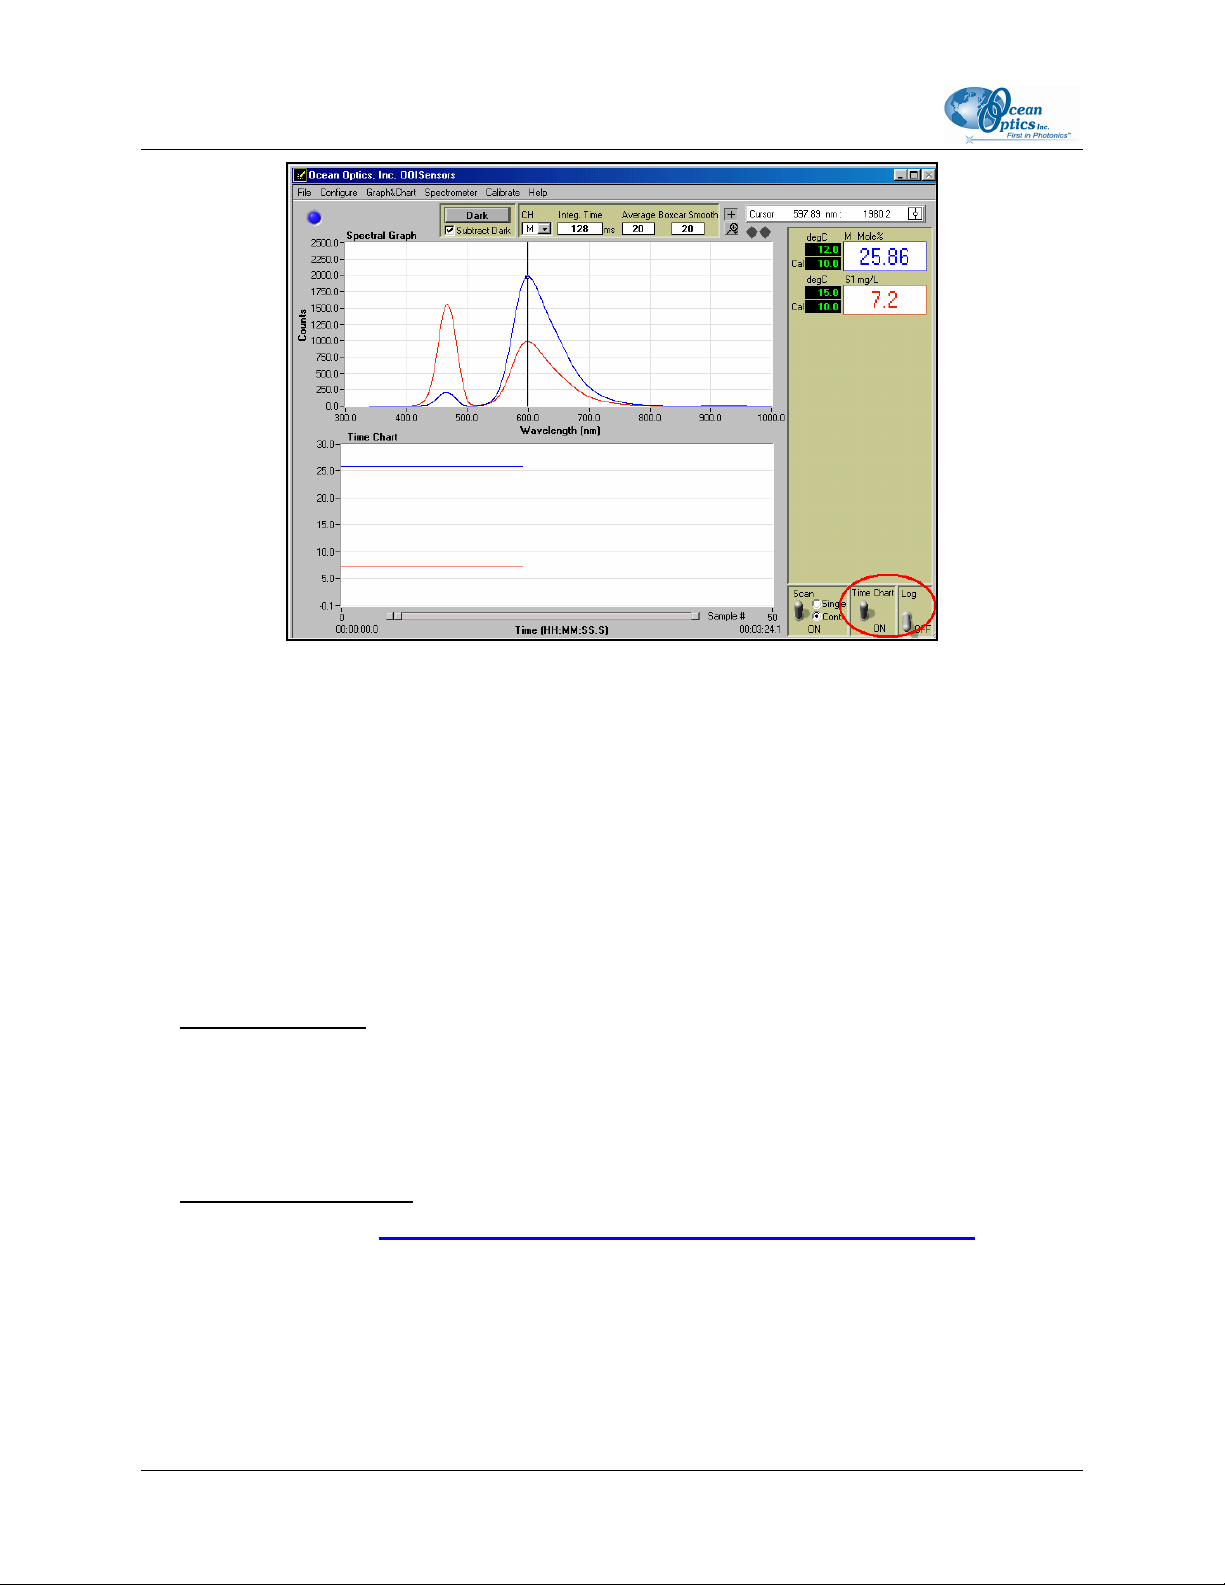
The main OOISensors screen is shown below (the following example is for the spectrometer
configuration).
for more information.
Configure
Configure Menu Functions
Select Configure from the menu bar to configure the hardware and software parameters for your system.
8 FOXY-AL300-000-02-0207
Page 19
2: OOISensors Software
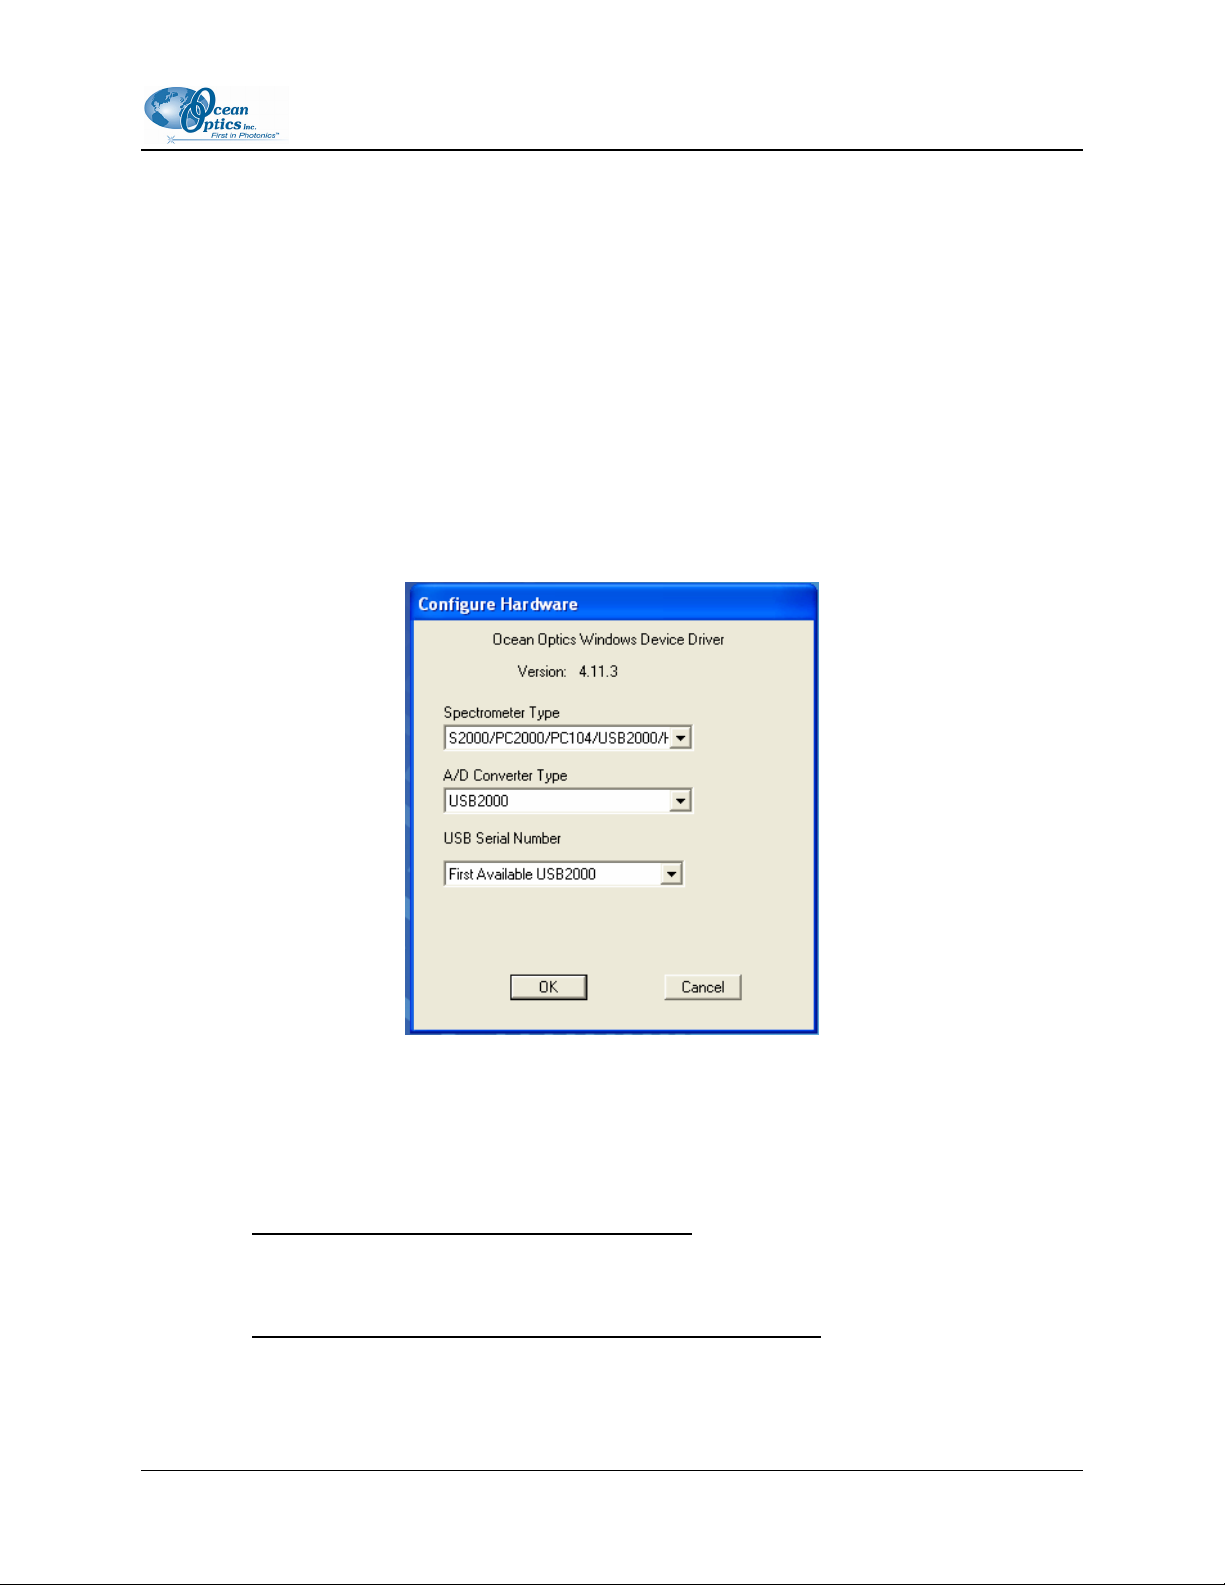
Configure Hardware
The Configure | Hardware dialog box allows you to specify the hardware parameters for the
spectrometer. Typically, you set these parameters only once, when you first install OOISensors. Upon
running OOISensors for the first time after installation, you will need to specify hardware settings in the
Configure Hardware dialog box. However, you can reconfigure these settings at any time by selecting
Configure | Hardware from the menu bar.
► Procedure
Follow the steps below to reconfigure hardware parameters:
1. Select Configure | Hardware from the OOISensors menu bar. The Configure Hardware screen
appears.
2. Specify a spectrometer type in the Spectrometer Type drop-down menu (the S2000-FL, SF2000
and USB series are S2000-series spectrometers).
3. Specify the A/D converter you are using to interface your spectrometer to your computer in the
A/D Converter Type drop-down menu.
If you choose the USB2000 A/D Converter:
Select the USB2000 A/D Converter from the drop-down menu. Then, specify the serial
number of the USB2000 in the Serial Number drop-down menu. Consult the USB2000
Operating Instructions for more information.
If you choose the ADC1000 or DAQ700 A/D Converter:
Select an available Base Address (or I/O Range) and IRQ (Interrupt Request) from the drop
down menus. Consult the operating instructions for the specific A/D converter more
information.
FOXY-AL300-000-02-0207 9
Page 20

2: OOISensors Software
If you choose the ADC1000-USB A/D Converter:
Specify the serial number of the ADC1000-USB, or select the First Available ADC1000-USB
option. Consult your A/D Converter documentation for more information.
If you choose the SAD500 or Serial USB2000 Spectrometer:
4. Specify the PC Serial Port (or COM Port) number to which the device is connected.
5. Select the Baud Rate at which the device will operate.
6. Enter a SAD500 Pixel Resolution, which specifies that the spectrometer transmit every nth pixel
from the SAD500 to the PC. Valid pixel resolutions are 1-500, and resolution requirements vary
by experiment.
Note
Lower pixel resolutions result in increased speed. The transfer of one complete spectra requires
~0.4 seconds when communicating at 115,200 baud rate. If you need your information in <0.4
seconds, increase the resolution or enable data compression. (This option does not appear for
Serial USB2000 users.)
7. Enable the Compress Data function to minimize the amount of data transferred over the RS-232
connection. Transmission of spectral data over the serial port is a relatively slow process.
Enabling this function insures that every scan transmitted will be compressed, which greatly
increases the data transfer speed.
8. Select the USB2000 Serial Number for the USB2000 you wish to use (Serial USB2000 users
only).
Software
Select Configure | Software to specify the spectrometer parameters in the OOISensors software.
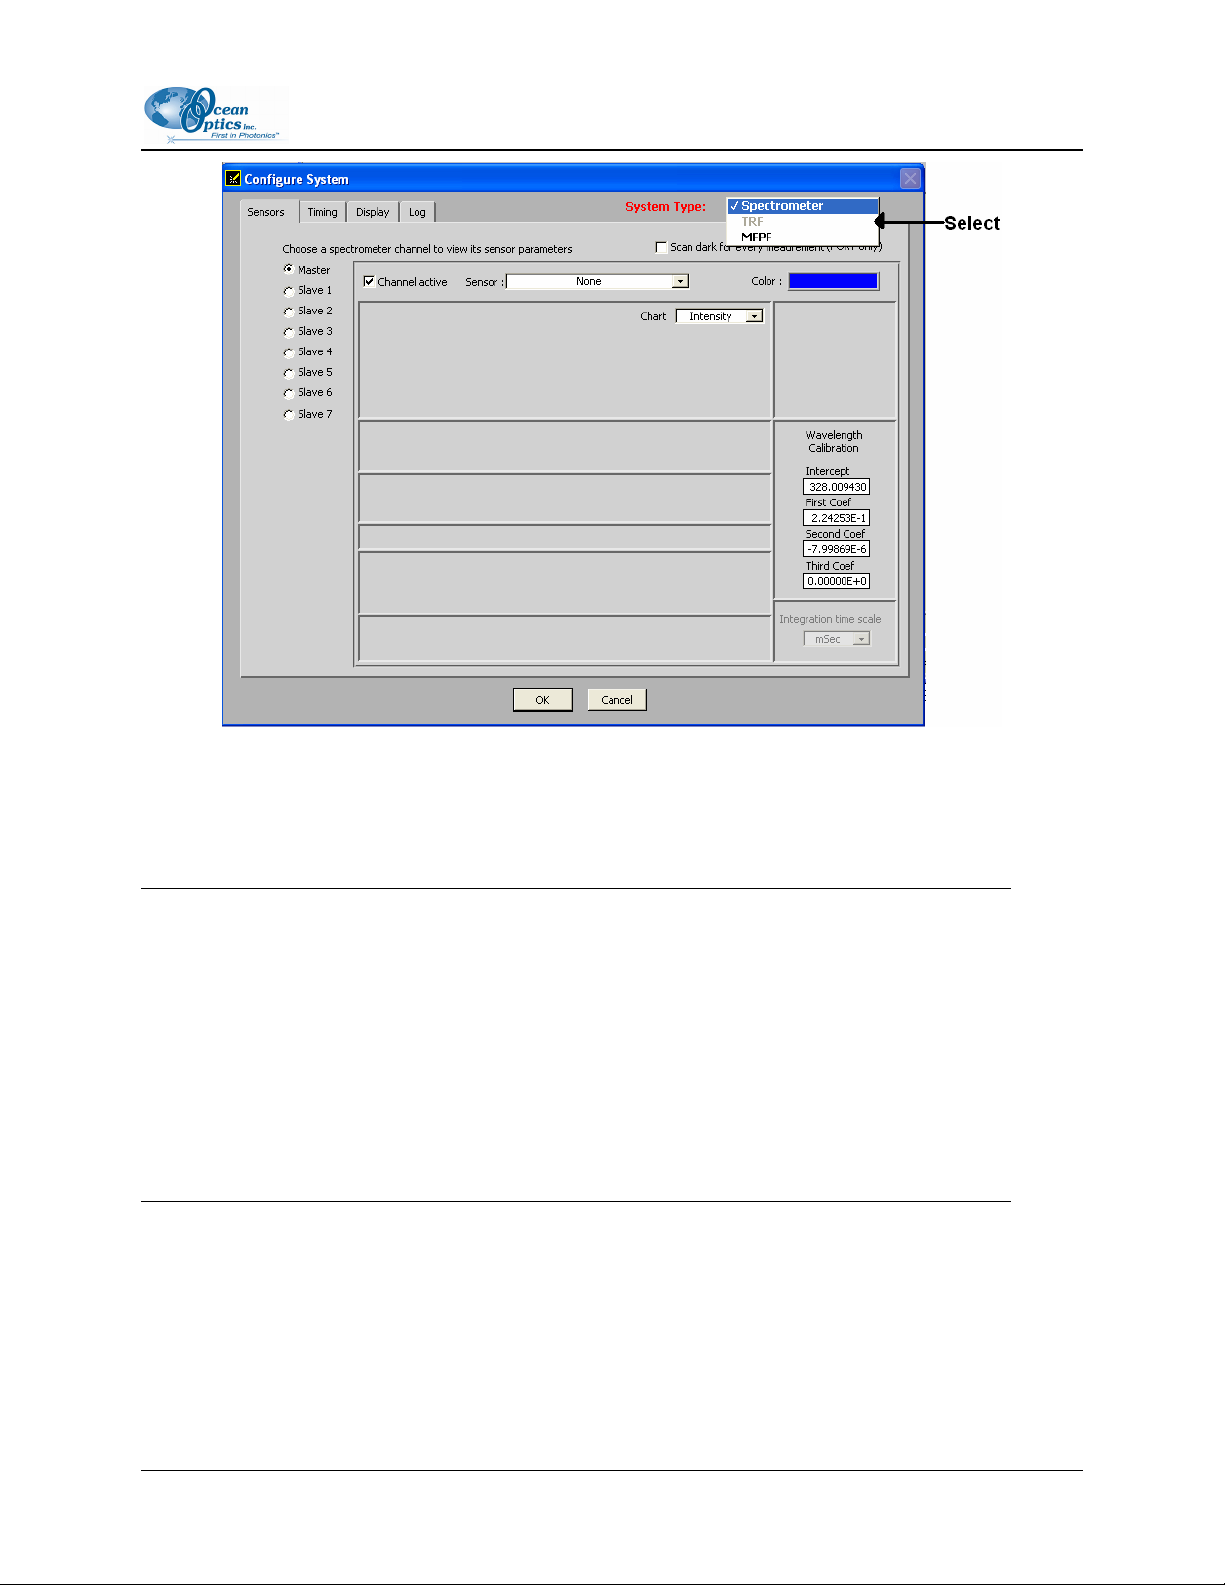
To access the Configure System screen, choose Configure | Software from the OOISensors menu bar.
The Configure System screen contains tabs for specifying Sensor, Timing, Display, and Log options.
10 FOXY-AL300-000-02-0207
Page 21
2: OOISensors Software
The System Type field in the upper, right corner allows you to select either Spectrometer or MFPF for
the attached hardware. The differences between the two system types when using OOISensors are noted
where applicable throughout this manual. Depending on this selection, some tabs and other user interface
objects will be visible (or not) in main application window and in this configuration window.
Notes
If you have an MFPF unit, refer to the MultiFrequency Phase Fluorometer Installation and
Operation Manual for more information. These instructions assume that you are installing
OOISensors to use with a spectrometer. If you switch between Spectrometer and MFPF System
Type, most parameter settings will be retained as they are hardware-specific, but some parameters
are common to all hardware types.
If you switch from MFPF to Spectrometer System Type, the spectral graph will not be visible.
You must select the Display tab on the Configure System screen, and then change the Graph
and Chart Display Mode to display the spectral graph.
FOXY-AL300-000-02-0207 11
Page 22
2: OOISensors Software
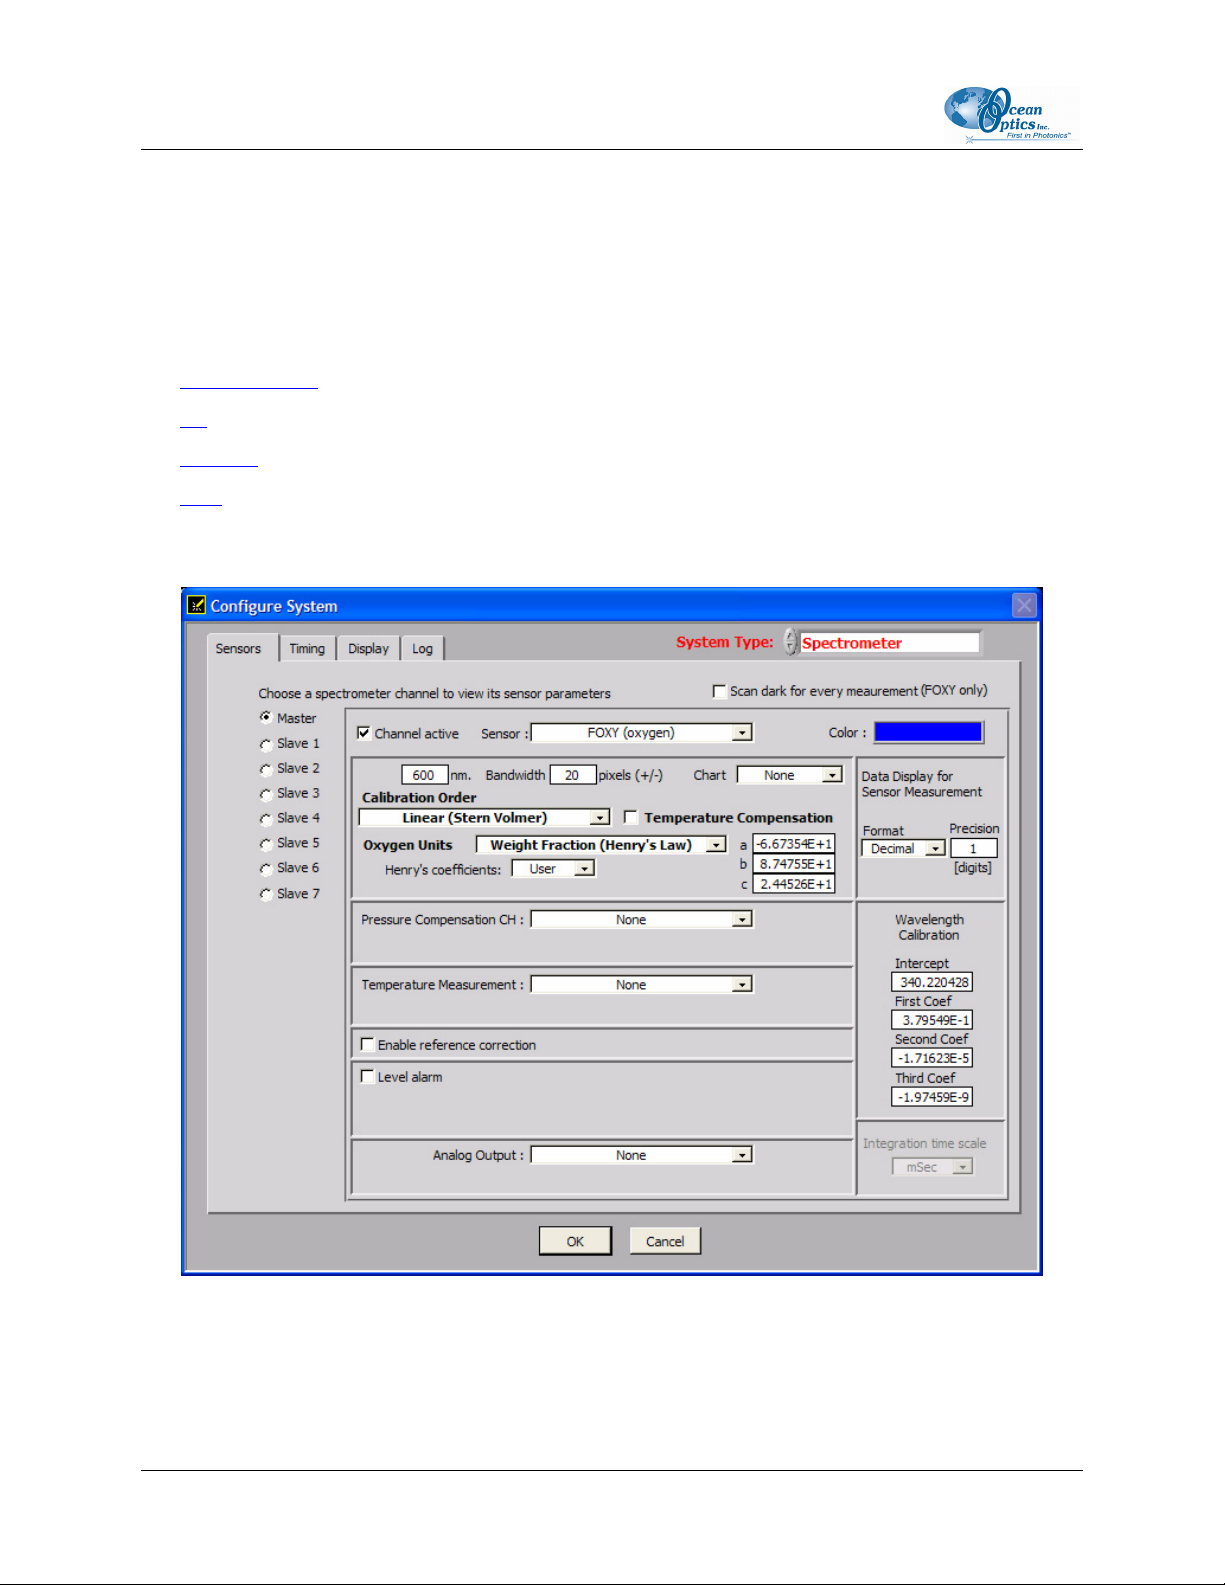
Sensors Tab for Spectrometer Systems
Click on the Sensors tab in the Configure System screen to access Sensor controls. The Sensors tab
contains the following options:
• None
• FOXY (oxygen)
• pH
• Pressure
• CO2
•
FOXY (oxygen)
12 FOXY-AL300-000-02-0207
Page 23

2: OOISensors Software
Option Name Description
Choose a spectrometer
channel to view its sensor
parameters
Scan dark for every
measurement (oxygen
sensor only)
Selects the spectrometer channel for which all sensor options will be
applied. Each spectrometer channel has its own parameters.
Automatically stores a dark spectrum each time a simple scan is taken.
Only for use with the SF2000 in pulsed mode, and the USB-LS-450 light
source.
Activates the currently selected spectrometer channel (see above). For
Channel active
some multichannel systems such as the ADC1000-USB, the software
sets the active channels according to what is stored in hardware and will
not allow you to activate or deactivate channels.
Sensor Selects the type of sensor used for each spectrometer channel.
Color
Changes the color of the spectral trace in the display graph. Click directly
on the color box to customize the color.
Enter the analysis wavelength. This number should be close to 600 nm,
Analysis Wavelength
since the ruthenium complex at the tip of the oxygen probe emits energy
at ~600 nm when it fluoresces.
Enter the number of pixels to average on either side of the analysis
Bandwidth Pixels
wavelength, typically 25. This value is in addition to the boxcar smoothing
on the main window. For best results, keep the boxcar value low.
Chart Specifies the type of information charted in the spectral graph.
Specify the data display format and precision of the data. Select Decimal
Data Display for Sensor
Measurement
or Scientific from the Format drop-down menu, and select a value (max.
5) to specify the precision of the oxygen data displayed on the screen and
saved in log files.
Calibration Order Select Linear (Stern Volmer) or Second Order Polynomial.
Temperature Compensation Select this checkbox to enable temperature compensation.
Oxygen Units
Henry’s coefficients
Select to use % oxygen (based on factory calibration for oxygen in air), or
Weight Fraction (Henry’s Law) for water
Enter Henry’s coefficients if you are using a liquid other than water (water
is the default).
Compare these values with the Wavelength Calibration Data Sheet that
Wavelength Calibration
Coefficients
accompanied your system to ensure that the values are identical. If
necessary, enter the correct values for each channel. Software retrieves
coefficients from hardware when possible.
FOXY-AL300-000-02-0207 13
Page 24
2: OOISensors Software
Option Name Description
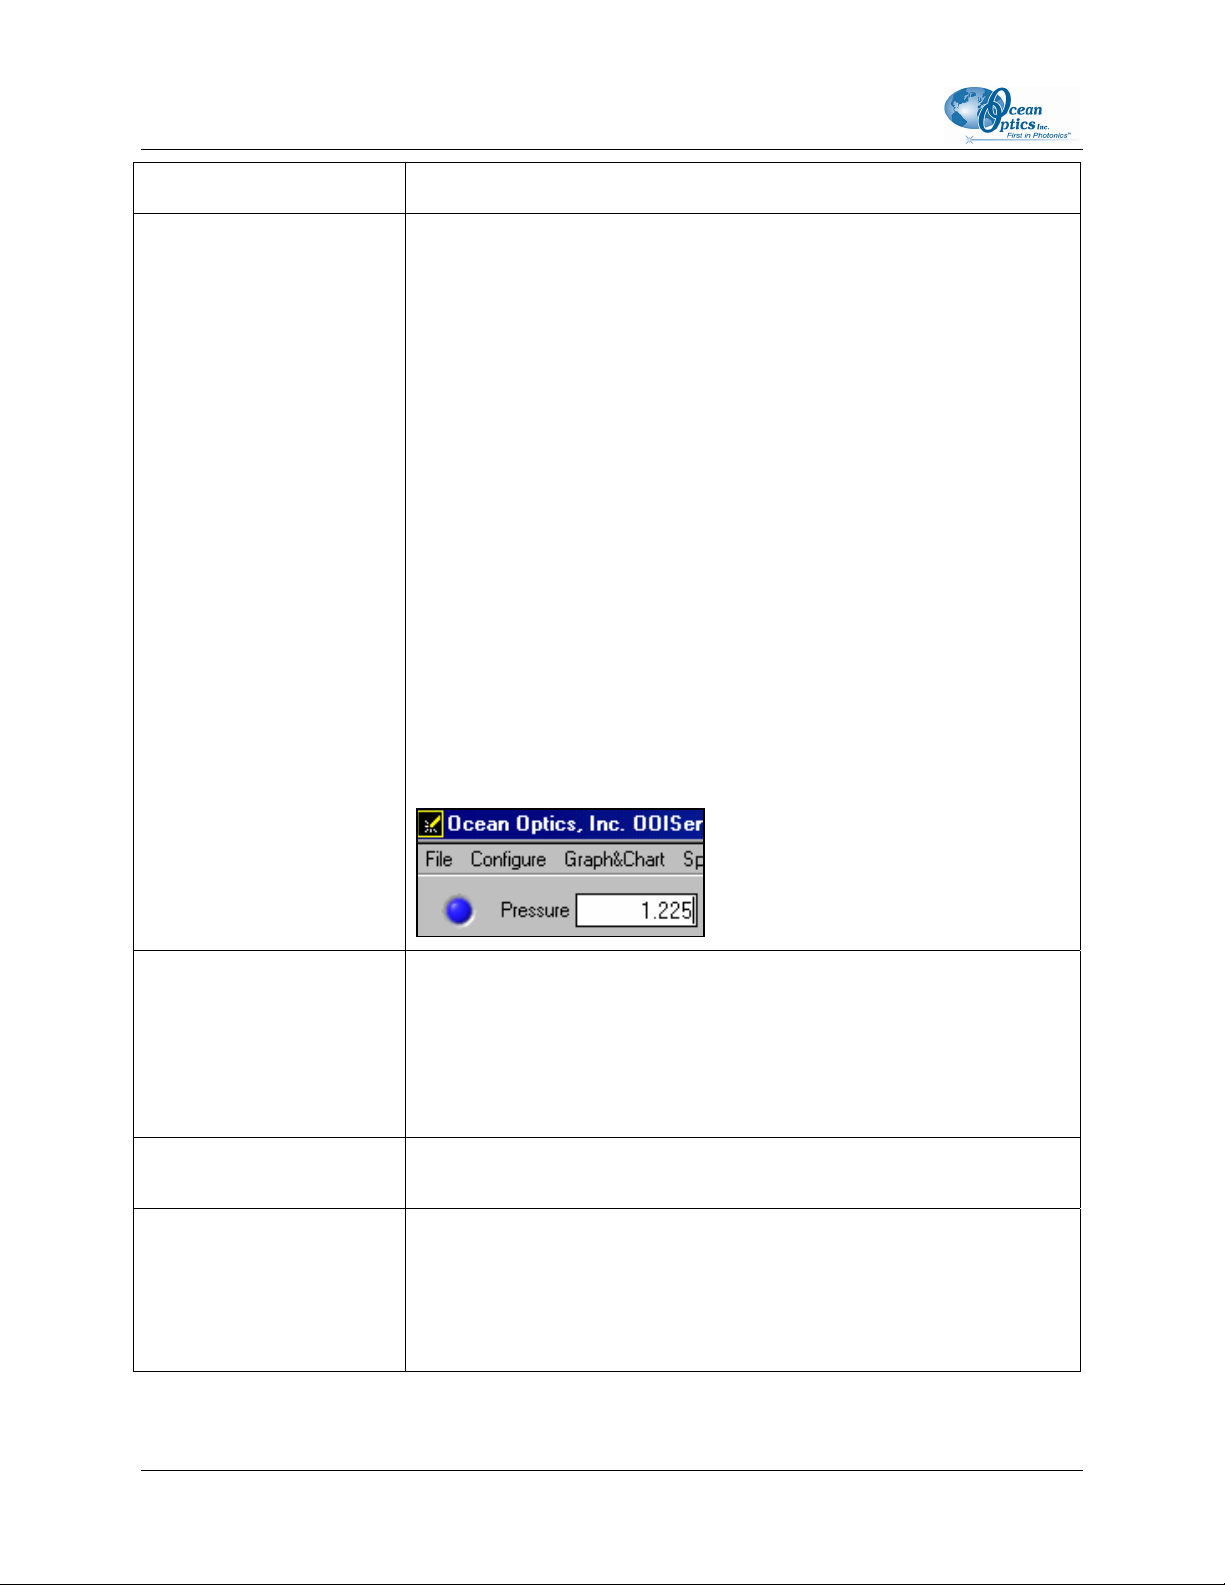
Monitors and corrects for pressure fluctuations in the sample (if you have
your own pressure transducer). You can use the pressure transducer
separately, or interface it with the sensor system.
If interfacing to the sensor system, you must have an available
spectrometer channel that is NOT connected to an oxygen sensor or
have the OMEGA D5251 4-20mA general purpose module. Specify the
pressure-monitoring method with the drop-down menu.
If an unused spectrometer channel is used as an analog-to-digital
converter (A/D) for your pressure transducer, typically Slave1 to Slave7,
activate it and assign that spectrometer channel as a pressure channel
and enter its calibration coefficients there. If a D5251 module is used,
select the serial COM port used and enter its calibration coefficients.
Pressure Compensation CH
Enable reference correction
CAUTION: This option is
not recommended. Speak
to an Ocean Optics
Application Scientist
before setting.
Bandwidth Pixels
Additionally, you can enter the pressure manually.
The Pressure applies to all channels which activated manual pressure
compensation and is displayed in the upper left corner of the OOISensors
screen as follows:
Monitors and corrects for any drift or change in the LS-450 Blue LED light
source. Click to enable this function, and then enter the reference
wavelength in the nm box.
To use this option correctly, be sure the peak at 470 nm is not saturated.
Only available if “Enable reference correction” is enabled. Specifies the
number of pixels around the reference wavelength to average.
Configures alarm properties. Click this box to enable the alarm feature,
and then enter alarm-monitoring parameters. When the value is within the
Level alarm
specified value range, the alarm indicator is green. If the value falls below
the specified alarm parameters, the on-screen indicator will turn red. If the
value rises above the specified alarm parameters, the indicator turns
yellow.
14 FOXY-AL300-000-02-0207
Page 25

2: OOISensors Software
Option Name Description
Specifies the method used to monitor and correct for temperature
fluctuations, if desired:
None: No monitoring
Manual: Temperature is monitored, but OOISensors will not read and
display temperature values. You must manually enter temperature values
in the display window.
Select Omega D5xx1 RS232 monitor temperature and have OOISensors
automatically read and display temperature values from thermistor or
thermocouple.
Ocean Optics offers the Omega Thermistor and the Omega
Thermocouple for monitoring temperature. The thermistor and
thermocouple should already be connected to your PC via an RS-232
module. Select the COM Port number (next to Serial Port) on your PC to
Temperature Measurement
which the thermistor or thermocouple is connected. Because the RS-232
module can support up to four thermistors or thermocouples, there are
four labeled ports. Next to D5xx1 CH, select the port to which the
thermistor or thermocouple connects to the RS-232 module. (If you only
have one thermistor or thermocouple, select 0.)
Select USB2000 LS-450 to instruct the USB-LS-450 to monitor and
correct for temperature fluctuations. The A/D converter in the USB-LS-
450 front end is configured for a 100 ohm platinum RTD (resistance
temperature device).
A similar method is used with the OMEGA D5251 general purpose 4-
20mA module, which requires your own temperature sensor with current
output. You must calibrate the input and create its calibration coefficients.
Enable the Compensate function if you want the software to correct for
temperature fluctuations. Enabling the Chart function allows you to view
a chart of the temperature values.
FOXY-AL300-000-02-0207 15
Page 26
2: OOISensors Software
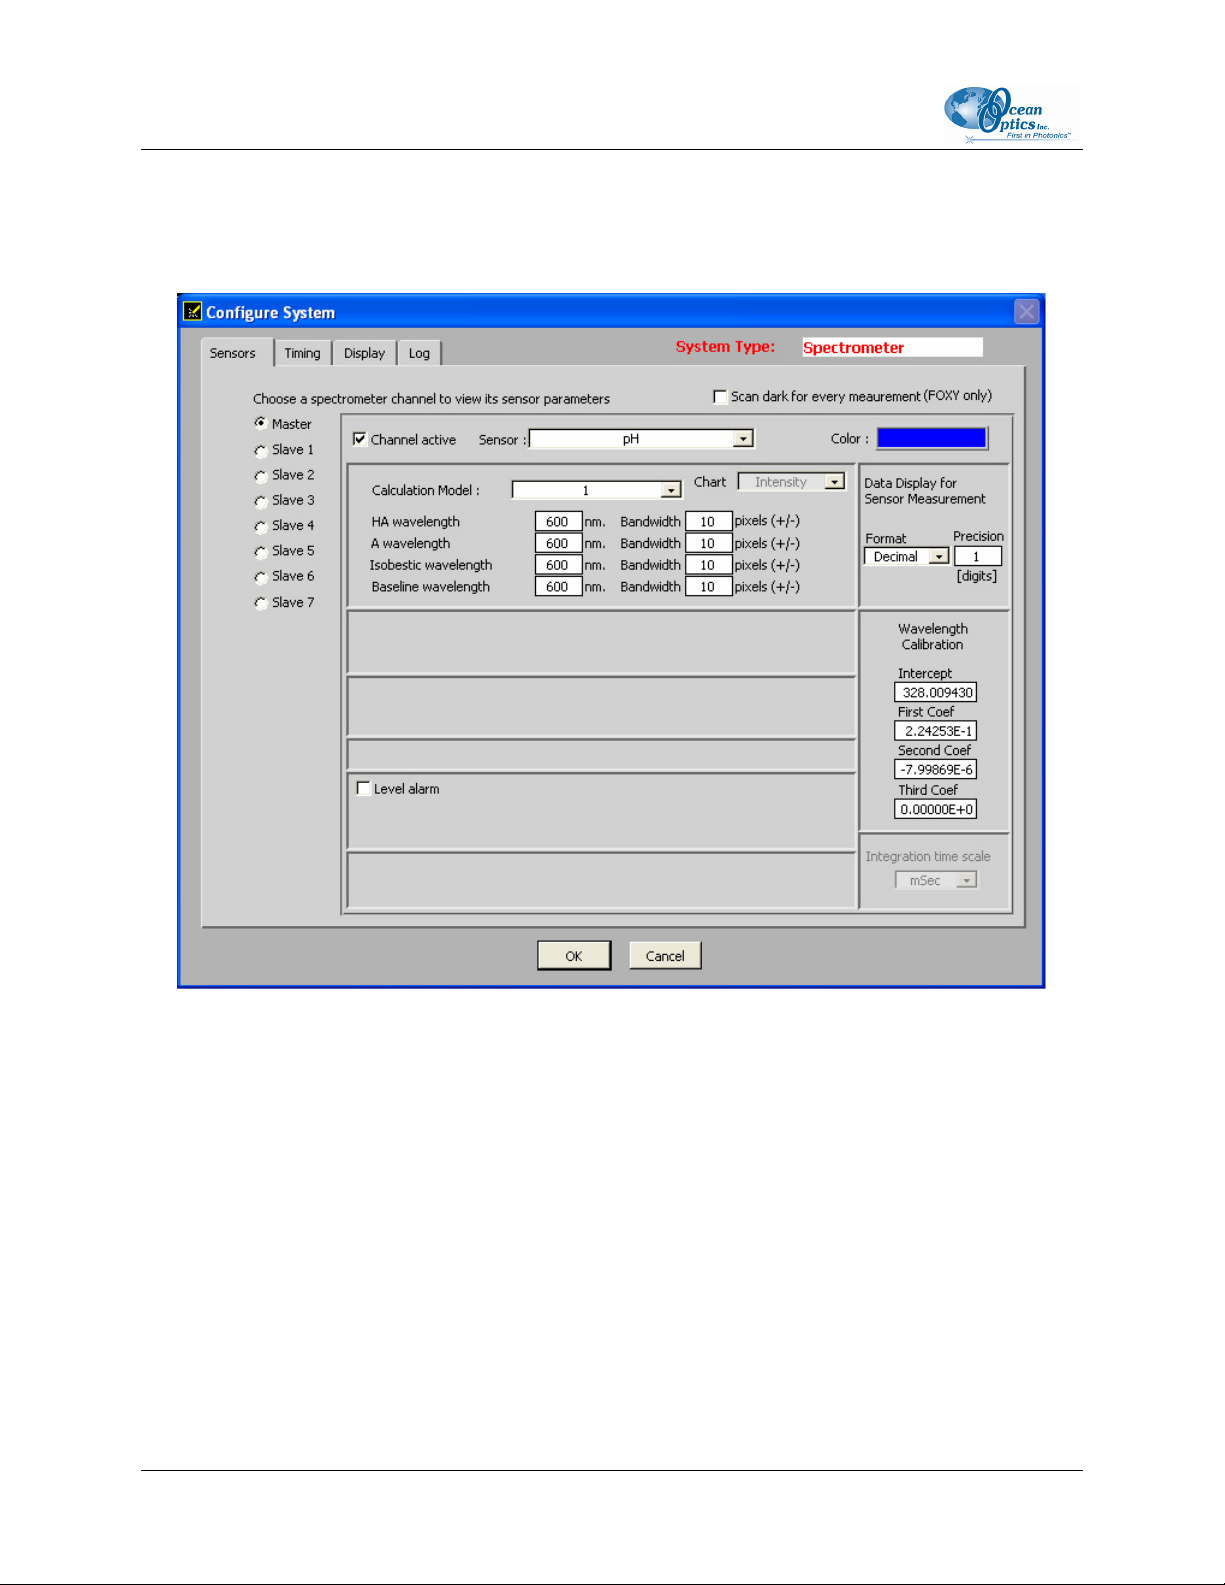
pH
Use this screen to set parameters for a pH sensor.
16 FOXY-AL300-000-02-0207
Page 27
2: OOISensors Software
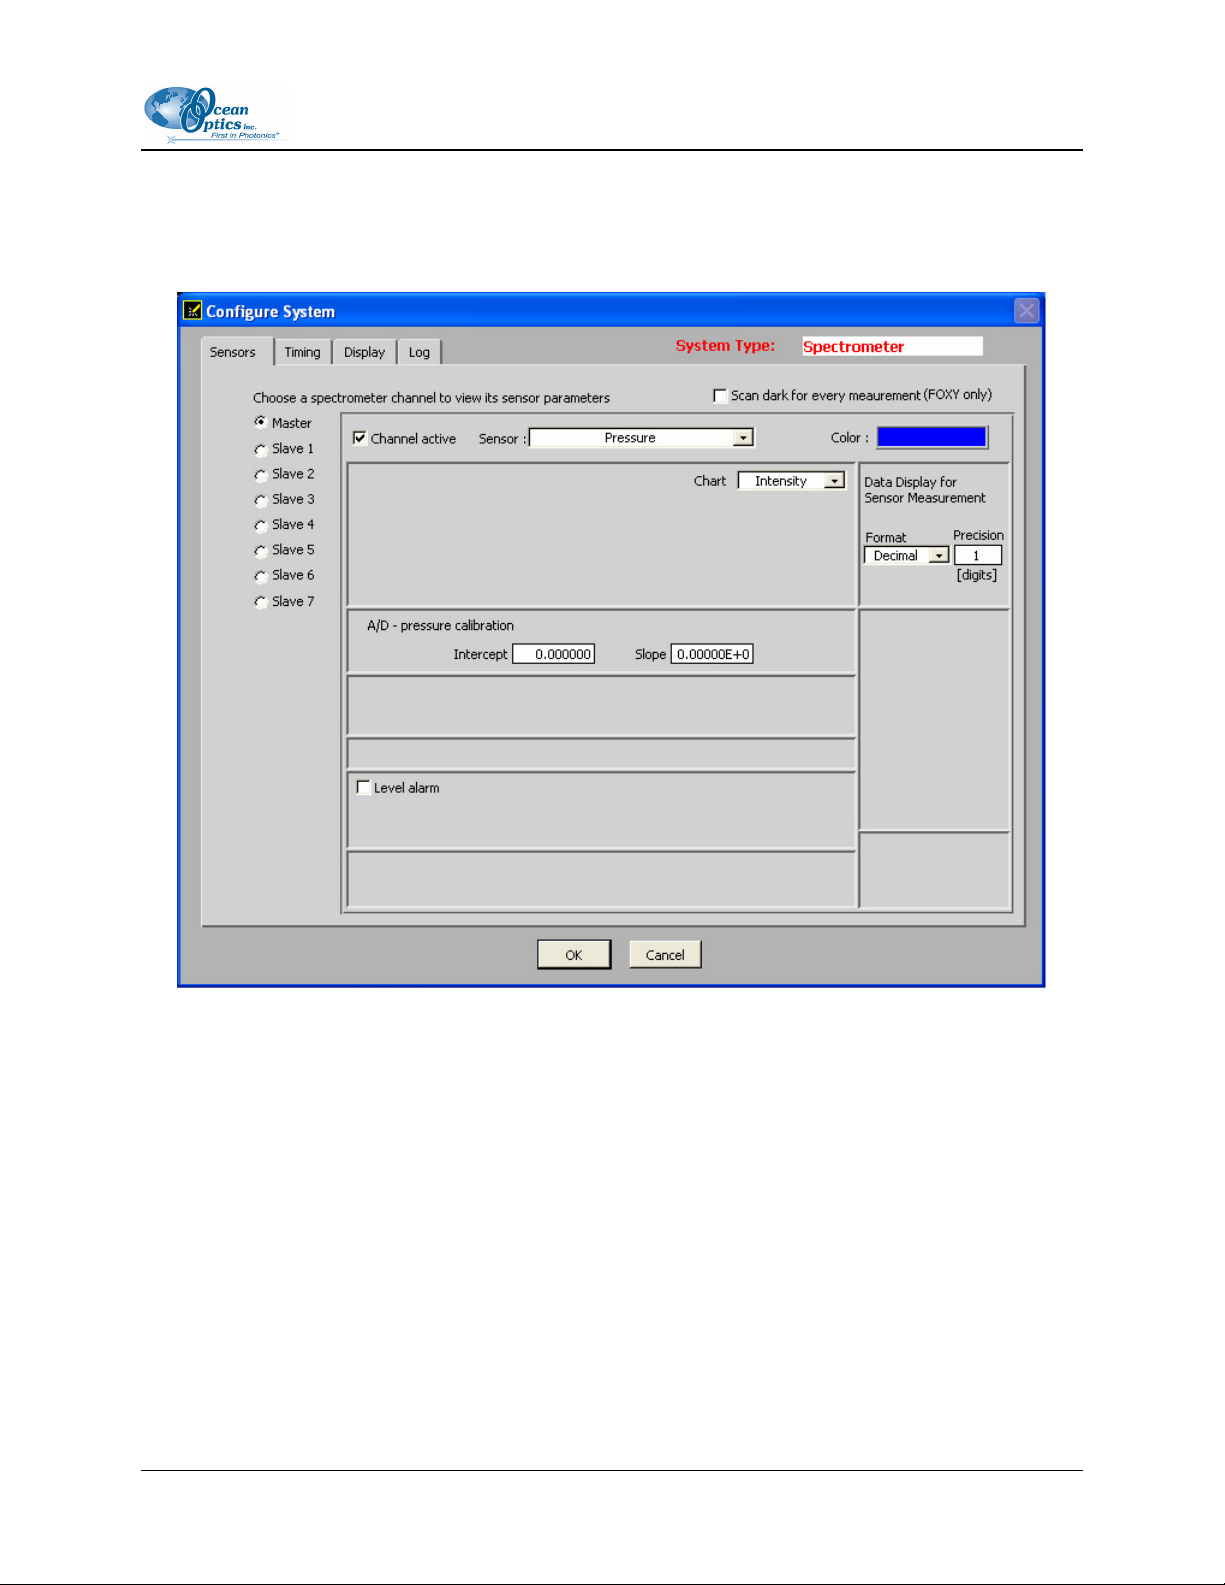
Pressure
Use this screen to set parameters for a pressure sensor.
FOXY-AL300-000-02-0207 17
Page 28
2: OOISensors Software
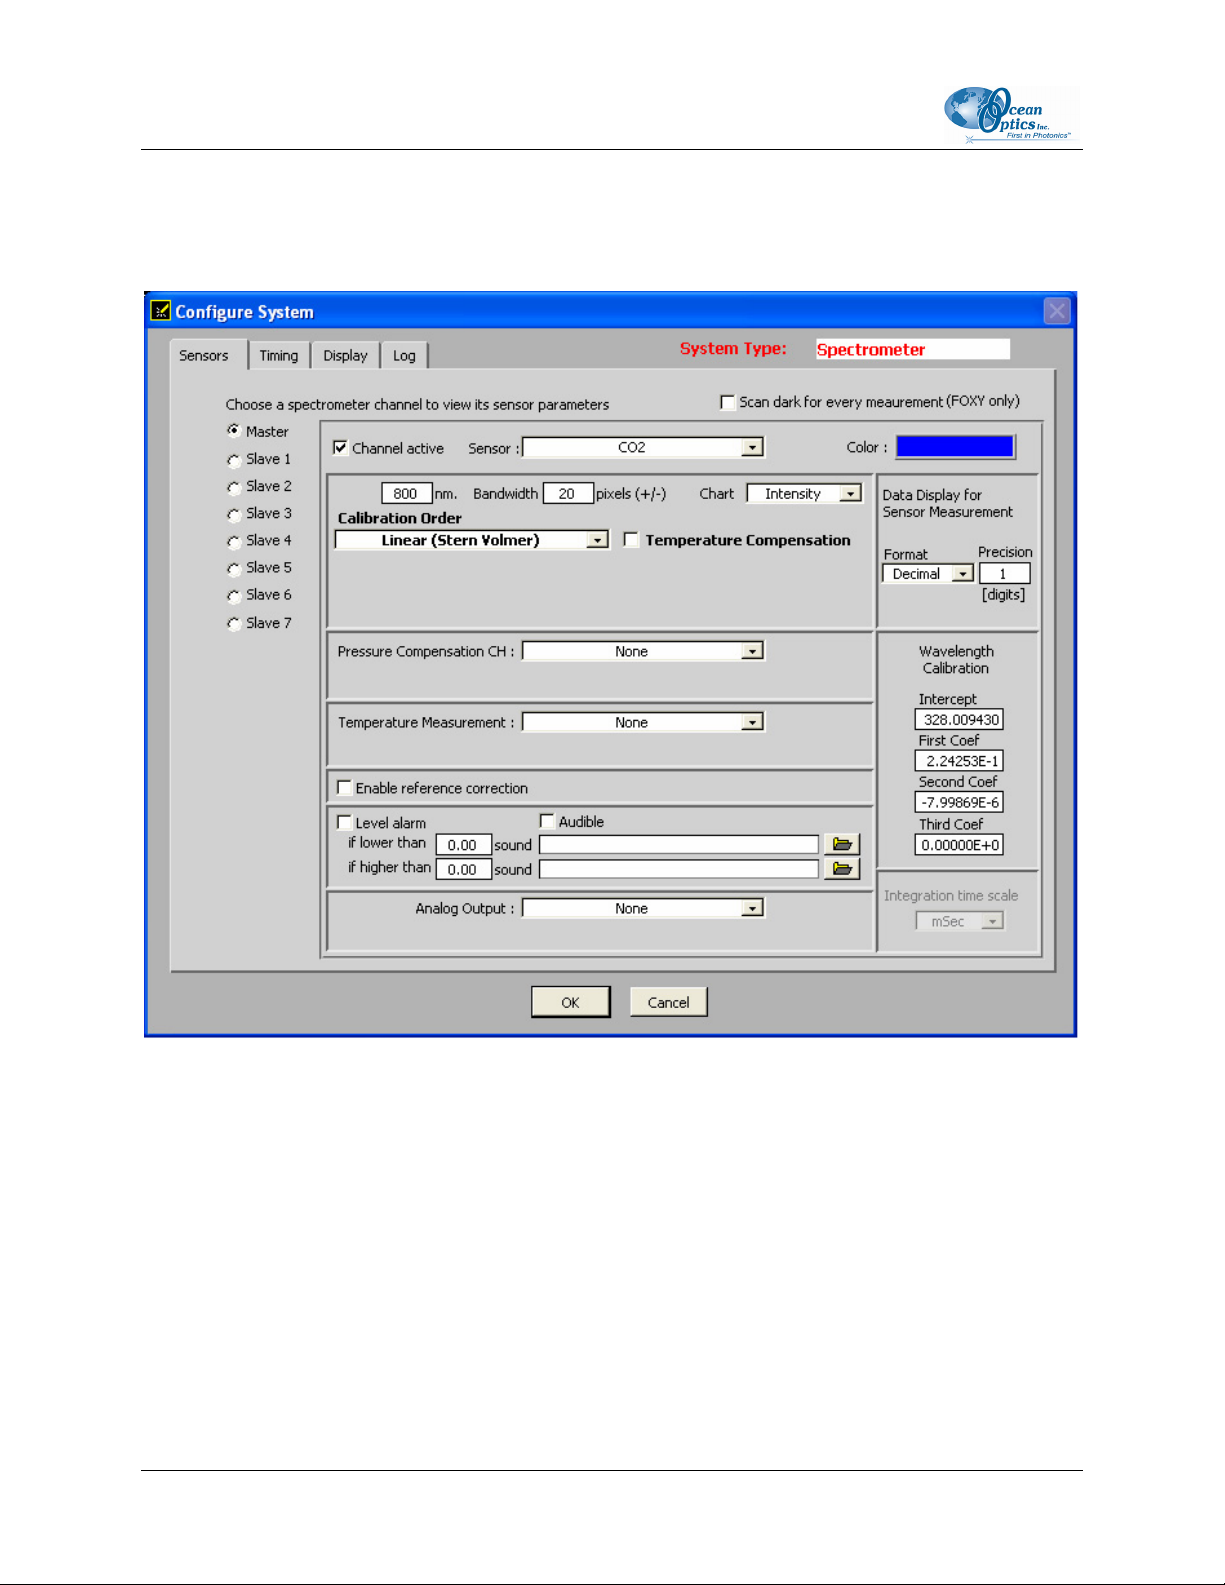
CO2
Use this screen to enter parameters for a CO2 sensor.
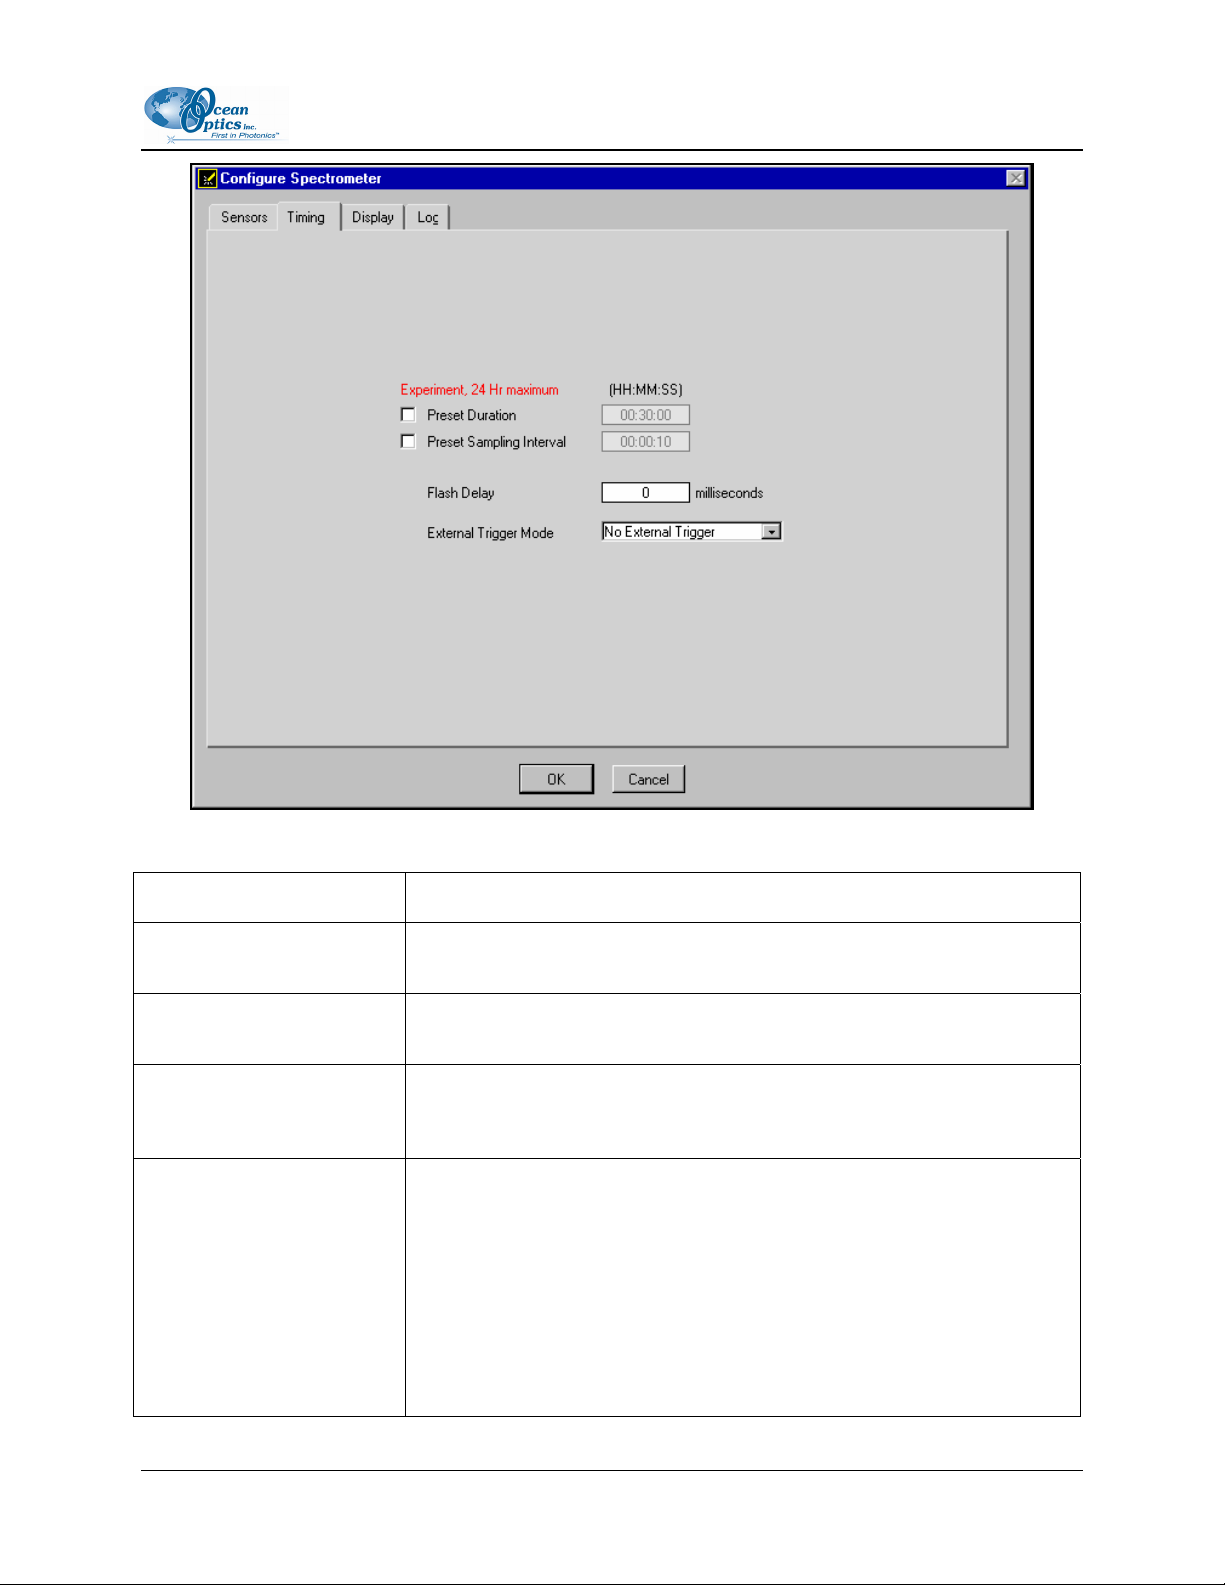
Timing Tab
Click on the Timing tab in the Configure System screen to access Timing controls. This screen allows
you to configure timed data acquisition parameters.
18 FOXY-AL300-000-02-0207
Page 29
2: OOISensors Software
The Timing tab contains the following options:
Option Name Description
Preset Duration
Preset Sampling Interval
Flash Delay
(For spectrometer systems
only)
External Trigger Mode
(For spectrometer systems
only)
Specifies the length of the entire timed data acquisition process. Enter the
duration in HH:MM:SS format.
Specifies the frequency of the data collected in the timed acquisition.
Enter the frequency interval in HH:MM:SS format.
Controls the flash delay time of the lamp, in milliseconds. This feature is
only applicable when using an ADC1000-PCI or ADC2000-PCI A/D
Converter and the LS-450 or R-LS-450 light sources.
Specifies the external trigger mode used when acquiring data:
No External Trigger: The spectrometer continuously scans, acquires,
and transmits data to the PC according to previously configured
acquisition parameters. This mode offers no way to synchronize data
acquisition with an external event.
FOXY-AL300-000-02-0207 19
Page 30
2: OOISensors Software
Option Name Description
External Software Trigger: This mode allows data acquisition to be
synchronized with external events. In this level-triggered mode, the
spectrometer is free running, only while level is high, just as in normal
mode. However, upon each trigger, the data collected up to the trigger
event is transferred to the software. For more information, consult the
External Triggering document on the Ocean Optics web site at:
http://www.oceanoptics.com/technical/externaltriggering.pdf
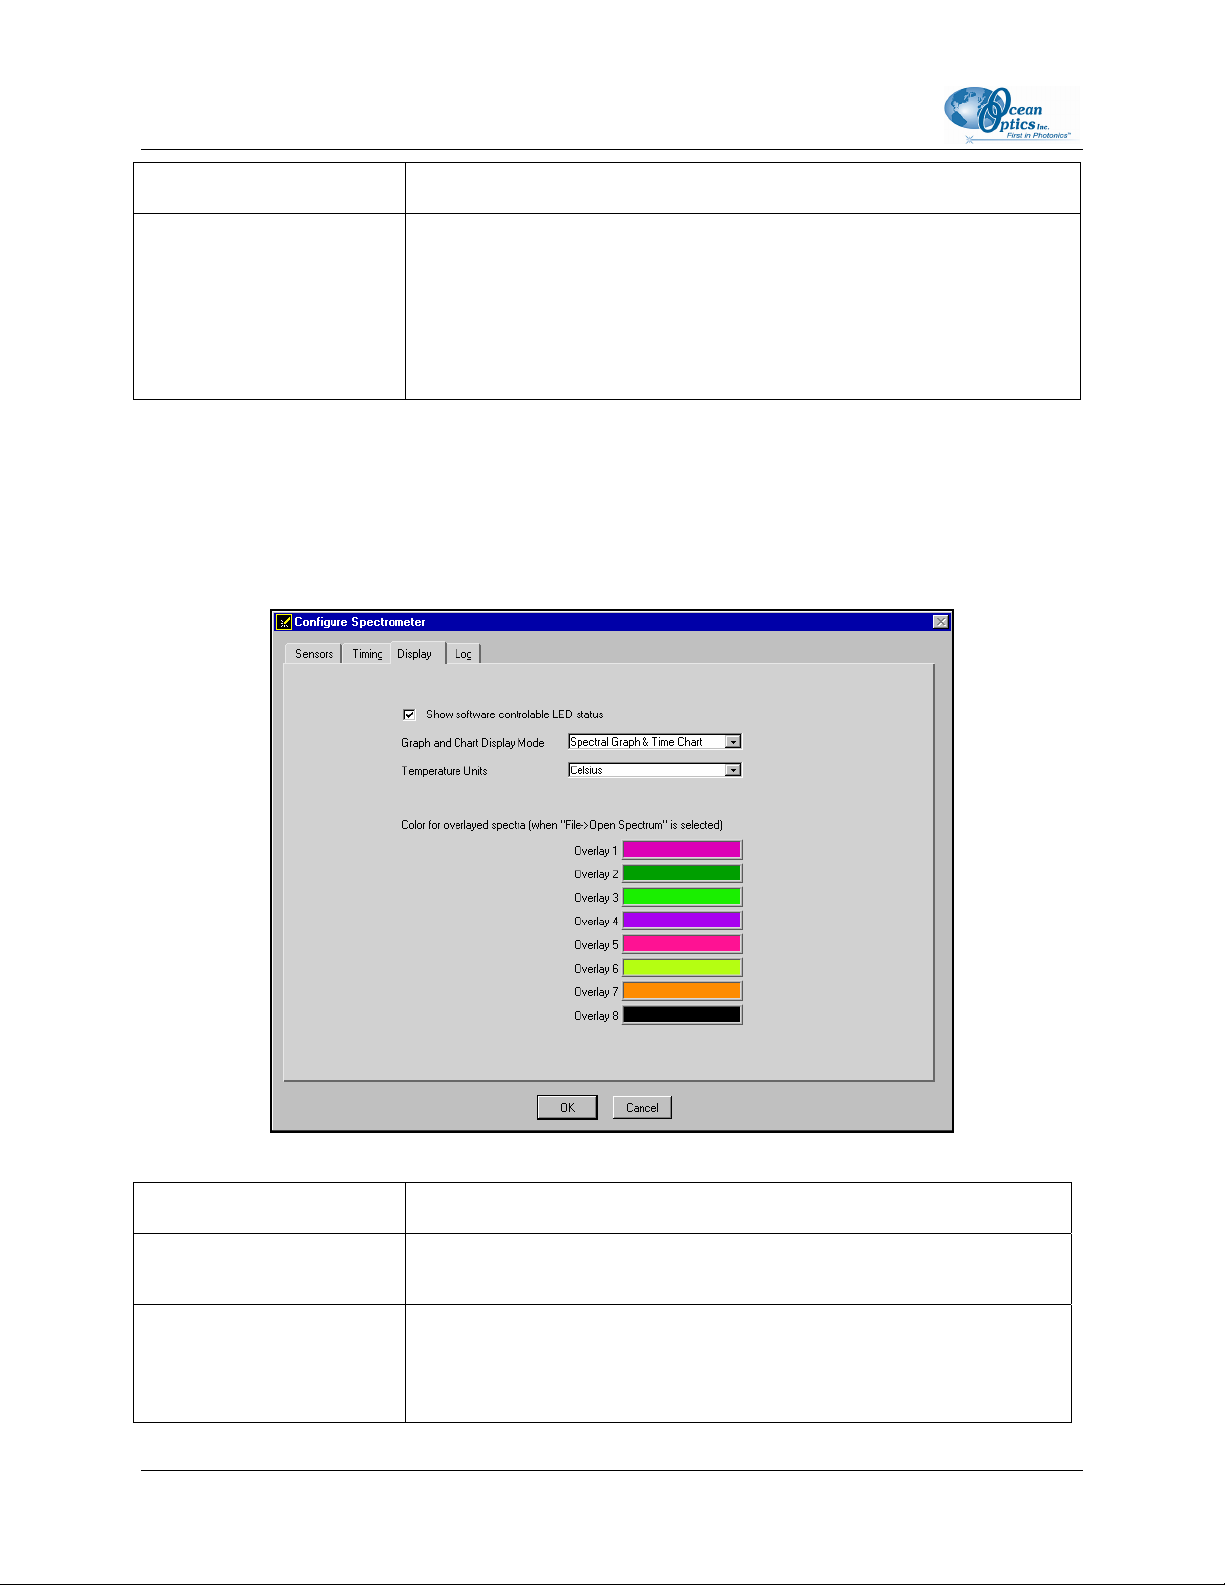
Display Tab
Click on the Display Tab in the Configure Spectrometer screen to access Display controls. This screen
allows you to configure display parameters for spectrometers in OOISensors. This tab does not exist for
systems with MFPF units.
The Display Tab contains the following options:
Option Name Description
Show software controllable
LED status
Graph and Chart Display
Mode
20 FOXY-AL300-000-02-0207
Displays the status of the LS-450’s blue LED.
Specifies the information that appears in the display window.
Spectral Graph Only: The Spectral Graph appears in the display
window.
Page 31

2: OOISensors Software
Option Name Description
Spectral Graph & Time Chart: The Spectral Graph appears in the top
of the display window and the Time Chart appears in the bottom of the
display window.
To view a Temperature Chart, select Graph&Chart | View Temperature
Chart from the menu bar. The Temperature Chart will replace the
Spectral Graph until View Temperature Chart is unchecked.
Specifies the format for temperature display. Select Celsius or
Fahrenheit from the drop-down menu.
Temperature Units
Note: OOISensors measures all temperatures in Kelvin and converts to
Celsius or Fahrenheit.
Specifies colors for static spectra opened with the File | Open
Color for overlaid spectra
Spectrum command from the menu bar. Stored static spectra are
displayed as overlays, and you should distinguish overlays from real-
time spectra by modifying the color of the traces.
Log Tab
Click on the Log Tab in the Configure Spectrometer screen to access data logging controls. These
controls allow you to configure the data logging parameters available in OOISensors.
FOXY-AL300-000-02-0207 21
Page 32

2: OOISensors Software
The Log tab contains the following options:
Option Name Description
Specifies the number of scans stored in RAM before the data is
Store to disk every X
acquisitions
saved to a log file. Smaller numbers cause saves that are more
frequent. Larger numbers cause saves that are less frequent, but
increase application performance by reducing save time.
Specifies the log file name for the timed data acquisition. Click on
the folder icon to browse to a specific folder.
Filename and Path
Insert Event in Log File
MS time stamp Stamps the data in the log file with the system time.
Note: The Insert Event in Log File option enables you to enter text
in the log file. Select Spectrometer | Insert Event in Log File
from the menu bar. A dialog box will prompt you to enter text,
which will be displayed in the log file next to the data that was
acquired at the time of text entry.
Enables you to enter text in the log file. Select Spectrometer |
Insert Event in Log File from the menu bar. A dialog box will
prompt you to enter text, which will be displayed in the log file next
to the data that was acquired at the time of text entry.
Display Functions
The following sections provide information on controls that are available directly from the OOISensors
main display panel. From the display window, you can choose a mode to acquire data, take scans of your
sample, store a dark spectrum, configure the cursor, configure the graph, enter data acquisition parameters
and analyze data.
Scan Control
This switch controls the mode of the OOISensors scan function. The Single mode option instructs the
Scan function to take one scan. The Cont. (continuous) mode option instructs the Scan function to take
continuous scans until scans are manually stopped.
22 FOXY-AL300-000-02-0207
Page 33

2: OOISensors Software
► Procedure
1. Select the Single or Cont. button from the Scan section of the OOISensors screen in the lower
right hand corner.
2. Click on the switch graphic to turn the Scan function on and acquire data. In Single mode, the
switch will automatically revert to the off position after one scan is completed. In the Cont.
mode, the switch will remain on and OOISensors will perform multiple scans.
3. Click on the switch graphic to turn the Scan function off and cease data acquisition (if in Cont.
mode).
Store Dark
This function stores the current spectrum as the dark spectrum for all active channels. You should store
the dark after you set the data acquisition parameters in OOISensors.
The dark spectrum is a sample spectrum taken with the light path to the sample blocked. Storing a dark
spectrum is required before the computer can make accurate measurements. This button stores the dark
values at the fluorescence and reference wavelengths.
If you are using an O
before storing a dark spectrum. Ambient light can interfere with dark spectrum measurements on probes
with no overcoat.
You should see a flat line in the display screen prior to storing a dark spectrum.
sensor without an overcoat, you must physically place the sensor in a dark location
2
Note
This selection is not recommended for the USB-LS-450 light source.
If you have configured the spectrometer to control the LS-450, the software can take automatic
dark scans if you select
Scan Dark for every measurement. When this function is enabled, the LS-450 automatically turns
off, and a dark scan is stored, each time you take a sample scan.
Configure | Software from the menu, click on the Sensors tab, and select
Subtract Dark
This feature affects only the display of data on the screen.
Selecting this box under the Store Dark button subtracts the current dark spectrum from the spectra
displayed in OOISensors. This command is useful if you are trying to eliminate fixed pattern noise
(caused by a very long integration time) from the spectra.
FOXY-AL300-000-02-0207 23
Page 34

2: OOISensors Software
OOISensors always subtracts the dark measurement from the sample measurement in the OOISensors
algorithm.
Data Acquisition Parameters
This control, located at the top of the OOISensors screen, allows you to specify the integration time,
averaging and boxcar smoothing values. This control provides you with immediate access to the data
acquisition settings.
Channel [CH]
To set the data acquisition parameters (such as integration time, averaging and boxcar smoothing) for a
specific spectrometer channel, first select the spectrometer channel from the CH pull down menu.
Note
This pull down menu is not for selecting the spectrometer channels that are active in the display
graph. It is only used to specify the data acquisition parameter for a specific channel.
To activate and display specific spectrometer channels, select Configure | Spectrometer from
the menu bar and click on the Sensors tab. Then, enable each spectrometer in the system.
Integration Time
This parameter specifies the length of the spectral acquisition in milliseconds for the specified
spectrometer channel (in the CH pull down menu). The integration time of the spectrometer is analogous
to the shutter speed of a camera. The higher the value specified for the integration time, the longer the
detector "looks" at the incoming photons.
For Oxygen Sensors:
If your signal intensity is too low, increase this value. If the signal intensity is too high, decrease the
value. Adjust the integration time until the fluorescence peak (~600 nm) is about 2000 counts in air or
saturated water. The fluorescence peak should not exceed 3500 counts. The intensity of the LED peak
(~475 nm) does not affect your measurements. You only need to adjust the integration time if the
fluorescence peak is saturating the detector.
Note
If you are using any light source and the SF2000 with the switch on Pulse, only set the
integration time to powers of two (2, 4, 8, 16, 32, 64… etc.). This ensures a constant number of
LED pulses during each spectral acquisition.
24 FOXY-AL300-000-02-0207
Page 35

2: OOISensors Software
Average
This parameter specifies the number of spectra to average for the specified spectrometer channel. A
higher value for this parameter provides a better signal-to-noise (S:N) ratio.
Note
The S:N improves by the square root of the number of scans averaged.
Boxcar Smooth
This parameter specifies the number of pixels on either side of a particular pixel to average across an
entire spectral acquisition. This method averages a group of adjacent detector elements. A value of five,
for example, averages each data point with 5 points (or bins) to its left and 5 points to its right.
The greater this value, the smoother the data and the higher the signal-to-noise ratio. However, if the
value entered is too high, a loss in spectral resolution results.
Note
The S:N improves by the square root of the number of pixels averaged.
For best performance when using oxygen sensors, set the boxcar smoothing value to no more than
25 pixels.
Cursor Functions
The cursor functions section of the OOISensors screen allows you to configure specific cursor
parameters. You can label the cursor, monitor cursor X and Y values, magnify the cursor, and move the
cursor in small increments. Additionally, there is a cursor selection button (located to the right of the XY
values) used for choosing cursor and pointer style.
+ Button
When the + button is depressed, the pointer becomes a crosshair symbol, enabling you to drag the cursor
around the graph.
FOXY-AL300-000-02-0207 25
Page 36

2: OOISensors Software
Magnification Options
There are several magnification options from which to choose. The function chosen remains in use until
another magnification icon or the crosshair symbol is selected. Clockwise, beginning with the top left
symbol, the magnify icons perform the following functions:
1. Magnifies a specific area by clicking and dragging a box around the area
2. Zooms in on the horizontal scale, but the vertical scale remains the same
3. Zooms in on the vertical scale, but the horizontal scale remains the same
4. Reverts to the last zoom function
5. Zooms out approximately one point vertical and horizontal, click once or press continuously
6. Zooms in approximately one point vertical and horizontal, click once or press continuously
Cursor Diamonds
To move the cursor left or right in small increments in the graph area, click on the left and right cursor
diamonds.
Cursor Bar
The functions listed in the following sections are located in the Cursor Taskbar, inside the Cursor
Function section of OOISensors.
To move the cursor with the mouse, click directly on the cursor in the display panel and drag.
Cursor Label
The first box in the configure cursor taskbar allows you to label the cursor.
26 FOXY-AL300-000-02-0207
Page 37

2: OOISensors Software
X and Y Values
The cursor taskbar displays the X value and Y value of the cursor point.
Cursor Properties
To the right of the X and Y values of the cursor is a cursor properties button that allows you to utilize
many cursor features such as choosing a cursor style, selecting a point style and finding a color for the
cursor trace.
Data Values
The data displayed to the right of the graphs and chart areas provides you with the oxygen or pH values
for each spectrometer channel and probe combination. If you are monitoring and correcting for
temperature, these values appear in this area as well.
The upper temperature represents the current temperature reading. Additionally, this is where you would
manually enter the temperature, depending on your configuration.
The lower temperature represents the single point calibration temperature.
Spectral Graph
The Spectral Graph section is located in the upper half of the OOISensors main screen.
The Spectral Graph area of the display window provides you with real-time spectral scans of your sample.
You can change the vertical and/or horizontal scales of the graph by clicking on an X and Y endpoint and
manually typing in a value. The graph will then resize itself.
FOXY-AL300-000-02-0207 27
Page 38

2: OOISensors Software
Temperature Chart
The Temperature Chart, when enabled, displays in the upper half of the OOISensors main screen. When
this option is enabled, the Spectral Graph screen is replaced by the Temperature Chart.
Display the Temperature Chart
► Procedure
Perform the steps below to display the Temperature Chart:
1. Select Graph & Chart from the OOISensors menu bar.
2. Select the View Temperature Chart option from the pop up menu.
The Temperature Chart then takes the place of the Spectral Graph.
Save and Display the Temperature Chart
► Procedure
Perform the steps below to save the Temperature Chart and display it on the screen:
1. Select File from the OOISensors menu bar.
2. Select Save Time Chart from the pop up menu.
3. Specify the save information in the Save prompt that appears.
Note
The saved file is in ASCII format. The first column is the Time column, the second column is the
sensor time chart values, and the third column is the temperature readings.
4. Select Graph & Chart | View Temperature Chart again to de-select the View Temperature
Chart option. Once this option is disabled, the Spectral Graph reappears.
Save the Temperarure Without Displaying It
You can also save Temperature Chart data without displaying the chart.
28 FOXY-AL300-000-02-0207
Page 39

2: OOISensors Software
► Procedure
To save the Temperature Chart without displaying the chart:
1. Select Configure from the OOISensors menu bar.
2. Select Spectrometer from the pop-up menu.
3. Click on the Sensors tab and enable the Chart function, located under the Temperature
Measurement option. Temperature data will be collected, whether or not the Temperature Chart is
displayed.
4. Save the chart using the Save function.
Time Chart
The time chart displays the data from all active channels at a specific wavelength over time.
► Procedure
Perform the following steps to view the Time Chart:
1. Select Configure | Spectrometer from the menu bar.
2. Click on the Display tab.
3. Ensure that Spectral Graph & Time is selected next to Graph and Chart Display mode.
To configure a timed data acquisition procedure, select Configure | Spectrometer from the menu bar and
click on the Timing tab.
Time Chart Switch
The Time Chart switch allows you to start and stop data acquisition. Click on the switch to enable or
disable data acquisition.
► Procedure
To set timed data acquisition parameters:
1. Select Configure | Spectrometer from the menu bar.
2. Click on the Timing tab.
3. Enter the data acquisition parameters.
FOXY-AL300-000-02-0207 29
Page 40

2: OOISensors Software
Log On/Off Switch
You can enable or disable the saving of data to a log file with the Log switch. Click on the switch to
enable or disable data logging. Only the last 10,000 scans of a timed data acquisition can be saved in the
log file.
► Procedure
To set data logging parameters for timed data acquisition:
1. Select Configure | Spectrometer from the menu bar.
2. Click on the Log tab.
3. Specify the frequency in between data saves.
4. Specify a file name for the saved log.
File Menu Functions
The following sections detail commands available from the OOISensors File menu.
Save Spectrum
This menu option saves the current spectrum as a tab-delimited ASCII file. You can then open these files
as overlays in the spectral graph or import them into other software programs, such as Microsoft Excel.
30 FOXY-AL300-000-02-0207
Page 41

2: OOISensors Software
Save Time Chart
This menu option saves the current time chart as a tab-delimited ASCII file. You can then open these files
as a static chart or import them into other software programs, such as Microsoft Excel.
Open Spectrum
This menu option opens a dialog box that allows you to open a previously saved spectrum and to open it
as an overlay (a static spectrum) while still acquiring live data.
Open Time Chart
This menu option opens a dialog box that allows you to choose a previously saved time chart and open it
as a static chart.
Page Setup
This menu option allows you to select printing parameters.
Print Spectrum and Time Chart
This menu option allows you to print the current display in the Spectral Graph, or select File | Print Time
Chart from the menu to print the time chart.
Exit
This menu option closes the OOISensors software. You will be prompted to confirm before OOISensors
closes.
Graph&Chart Menu Functions
The following section provides information on options available from the Graph&Chart menu.
FOXY-AL300-000-02-0207 31
Page 42

2: OOISensors Software
Clear Spectrum Graph
This option removes static spectra overlays from the graph.
Clear Time Chart
This option clears the time chart traces. A message box confirms this action.
Enable Grid
This option generates a grid in the spectral graph. If you also have the time chart displayed, this function
generates a grid in the time chart as well. De-select Enable Grid from the menu to turn this option off.
Autoscale Horizontal (Spectral Graph)
This option automatically adjusts the horizontal scale of a current graph so the entire horizontal spectrum
fills the display area.
Autoscale Vertical (Spectral Graph)
This option automatically adjusts the vertical scale of a current graph so the entire vertical spectrum fills
the display area.
Autoscale Vertical (Time Chart)
This option automatically adjusts the vertical scale of a current time chart so the entire vertical chart fills
the display area. You can also adjust the vertical scale of a temperature time chart (if you first select the
View Temperature Chart option).
View Temperature Chart
This option displays temperature data. The temperature chart replaces the spectral chart. To view the
spectral graph again, select Graph&Chart | View Temperature Chart from the menu.
Spectrometer Menu Functions
The following section provides information on options available from the Spectrometer menu.
32 FOXY-AL300-000-02-0207
Page 43

2: OOISensors Software
Scan
This option takes a scan of your sample.
When in Single mode, this function acts as a snapshot. When the button is depressed, the Stop function
replaces the Scan function. The Scan switch enables and the scan begins. The switch remains on until the
scan completes (according to configured integration time).
When in Continuous mode, this function continuously takes multiple scans of the sample. After each
integration cycle, another scan begins immediately. The Scan switch enables and the system begins data
acquisition. Select Spectrometer | Scan from the menu bar or click on the Scan switch again to halt the
scanning process and discontinue acquiring data.
Insert Event in Log File
This option allows you to enter text into the log file during a logged, timed data acquisition.
When this option is selected, a dialog box appears prompting you to enter text. In the log file, this text
appears next to the data that was acquired at the time of text entry.
To use this feature, both the Time Chart and Log switches in the display window should be in the On
position.
Calculate Sensor Values with Scan
The values displayed in the Data Values boxes to the right of the Spectral Graph will appear illogical the
first time you run OOISensors. System calibration will correct this condition. However, if you don't want
to see these illogical values displayed, deselect Spectrometer | Calculate Sensor Values with Scan.
Once the system is calibrated, this function should always be selected to display sensor values.
Pulse LED
When the LED is computer-controlled, you have the option of pulsing the LED. This cuts the exposure
time in half, thus decreasing the photodegradation of the probe.
This option is not recommended for use with the USB-LS-450.
FOXY-AL300-000-02-0207 33
Page 44

2: OOISensors Software
Calibrate Menu Functions
The following section provides information on options available from the Spectrometer menu.
Option Name Description
Oxygen, Single Temperature
Oxygen, Multiple Temperature Allows for oxygen probe calibration at multiple temperatures.
pH Allows for pH probe calibration.
Pressure Allows for pressure probe calibration.
Allows for oxygen probe calibration at a single temperature. Used
most frequently.
Configuring a Spectrometer in OOISensors
Once you install OOISensors, you will need to configure the spectrometer in OOISensors using the
Wavelength Calibration data included with the spectrometer shipment.
► Procedure
Perform the steps below to configure the spectrometer in OOISensors:
1. Select Configure | Spectrometer from the menu bar. The Configure Spectrometer screen
appears.
2. Click on the Sensors tab, if necessary.
3. Ensure that the values in the Wavelength Calibration Coefficients section of this screen are the
same as the values on the Wavelength Calibration Data you received with the spectrometer.
4. Repeat Step 3 for each channel in the spectrometer. In the left pane of the screen, select the slave
channel number, then verify and/or enter the values in the Wavelength Calibration Coefficients
section of the screen.
34 FOXY-AL300-000-02-0207
Page 45

2: OOISensors Software
Notes
Be sure to retain the Wavelength Calibration Data. You will need this information if you reinstall
OOISensors.
If you have a USB-series spectrometer, you do not need to manually enter the Wavelength
Calibration Coefficients. The software retrieves these values directly from a memory chip on the
spectrometer.
This option does not work with the ADC1000-USB A/D Converter.
FOXY-AL300-000-02-0207 35
Page 46

2: OOISensors Software
36 FOXY-AL300-000-02-0207
Page 47

Chapter 3
Oxygen Sensors
The following section provides information on operation of the oxygen sensors, as well as the theory
behind sensor operation.
How the Oxygen Sensors Work
Oxygen sensors use the fluorescence of a ruthenium complex in a sol-gel to measure the partial pressure
of oxygen.
► Procedure
This measurement is taken as follows:
1. An LED sends excitation light to one leg of a bifurcated optical fiber assembly.
2. The optical fiber carries the light to the oxygen probe, which is polished to a 45° angle. The distal
end of the probe tip consists of a thin layer of sensor formulation trapped in a sol-gel matrix,
immobilized and protected from the sample. FOXY and HIOXY sensors use a ruthenium
formulation, while FOSPOR sensors use a Pt-porphyrin formulation.
3. The light from the LED excites the ruthenium or porphyrin complex at the probe tip.
4. The excited complex fluoresces, emitting energy at ~600 nm (ruthenium) or 650 nm (pophyrin).
5. If the excited ruthenium complex encounters an oxygen molecule, the excess energy is transferred
to the oxygen molecule in a non-radiative transfer, decreasing or quenching the fluorescence
signal. The degree of quenching correlates to the partial pressure of oxygen in the sol-gel, which
is in dynamic equilibrium with oxygen in the sample (see Fluorescence Quenching
6. The fluorescence is collected by the probe and carried to the spectrometer or MFPF unit via a
second leg of the bifurcated fiber assembly. The fluorescence intensity (for spectrometer) or
phase (for MFPF unit) is measured and related to the partial pressure of oxygen through the
Stern-Volmer equation.
).
FOXY-AL300-000-02-0207 37
Page 48

3: Oxygen Sensors
Fluorescence Quenching
The following paragraph explains the principle of fluorescence quenching as it relates to oxygen sensors.
Oxygen, as a triplet molecule, is able to quench efficiently the fluorescence and phosphorescence of
certain luminophores. This effect (first described by Kautsky in 1939) is called "dynamic fluorescence
quenching." Collision of an oxygen molecule with a fluorophore (in the case of oxygen sensors, a
ruthenium complex) in its excited state leads to a non-radiative transfer of energy. The degree of
fluorescence quenching relates to the frequency of collisions, and therefore to the concentration, pressure
and temperature of the oxygen-containing media.
Connecting the Fiber Optic Sensors System
Once you have configured system hardware and installed OOISensors, you will need to connect the
sampling optics (probes, optical fiber assemblies) to the Fiber Optic Sensors System.
► Procedure
Follow the steps below to properly connect the sampling optics:
1. Connect the probe to the bifurcated optical fiber assembly that came with the Fiber Optic Sensors
System. To obtain operating instructions for specific probes, consult the Ocean Optics website or
the documentation that accompanied the probe.
2. Locate the 21-02 SMA Splice Bushing that came with the system. This item is a 0.75" screw with
two female ends.
3. Screw one end of the splice bushing into the SMA 905 connector on the proximal end of the
probe.
4. Locate the bifurcated fiber that came with the system. This optical fiber assembly has a “Y”
shaped design.
5. Connect the common end of the bifurcated fiber to the splice bushing/probe.
6. Connect one arm of the bifurcated fiber to the SMA connector on the spectrometer, and then
connect the other arm to the SMA connector on the LS-450 Blue LED light source.
Note
It does not matter which arm of the fiber is connected to the light source or spectrometer.
38 FOXY-AL300-000-02-0207
Page 49

3: Oxygen Sensors
Calibration Requirements for Oxygen Sensors
The following section explains the principles of calibration for oxygen sensors, as well as the algorithms
required in the calibration procedures.
For accurate oxygen measurements of a sample, you must first calibrate the oxygen system. There are two
major considerations when calibrating the Fiber Optic Sensors System:
• Temperature: Determine if you need to compensate for changes in temperature in the sample. If so,
you must calibrate the Fiber Optic Sensors System accordingly. (Sample Temperature Duration <± 3
ºC)
• Algorithm: Determine which algorithm you will use for the calibration. The Linear (Stern-Volmer)
algorithm requires at least two standards of known oxygen concentration while the Second Order
Polynomial algorithm requires at least three standard of known oxygen concentration.
Calibration curves are generated from your standards and the algorithms to calculate concentration values
for unknown samples. The Second Order Polynomial algorithm provides a better curve fit. Thus, this
algorithm returns accurate data during oxygen measurements, particularly when working in a broad
oxygen concentration range.
Note
A linear calibration is good from 0 to 30% O2. Higher values of O2 require a second order fit.
Linear (Stern-Volmer) Algorithm
The Stern-Volmer algorithm requires at least two standards of known oxygen concentration. The first
standard must have 0% oxygen concentration and the last standard must have a concentration in the high
end of the concentration range in which you will be working. The fluorescence intensity can be expressed
in terms of the Stern-Volmer equation where the fluorescence is related quantitatively to the partial
pressure of oxygen:
For a given media, and at a constant total pressure and temperature, the partial pressure of oxygen is
proportional to oxygen mole fraction.
FOXY-AL300-000-02-0207 39
Page 50

3: Oxygen Sensors
The Stern-Volmer constant (k) is primarily dependent on the chemical composition of the ruthenium
complex. Ocean Optics probes have shown excellent stability over time, and this value should be largely
independent of the other parts of the measurement system. However, the Stern-Volmer constant (k) does
vary among probes, and it is temperature dependent. All measurements should be made at the same
temperature as the calibration experiments. If this is not possible, temperature-monitoring devices should
be used.
Compensating for Temperature with the Linear (Stern-Volmer) Algorithm
If you decide to compensate for temperature, the relationship between the Stern-Volmer values and
temperature are defined as:
I0 = a0 + b0 * T + c0 * T
k = a + b * T + c * T
2
2
The intensity of fluorescence at zero pressure of oxygen (I0) depends on various factors in the optical
setup: the power of the LED, the quality and type of optical fibers, light loss at the probe due to fiber
coupling, and backscattering from the sample. To account for these inconsistencies, you must measure the
intensity of fluorescence at zero pressure of oxygen (I
) for each experimental setup.
0
It is evident from the equation that the sensor will be most sensitive to low levels of oxygen. Deviations
from the Stern-Volmer relationship occur primarily at higher oxygen concentration levels. To correct
these deviations, use the Second Order Polynomial algorithm.
Second Order Polynomial Algorithm
The Second Order Polynomial algorithm requires at least three standards of known oxygen concentration.
The first standard must have 0% oxygen concentration and the last standard must have a concentration in
the high end of the concentration range in which you will be working. The Second Order Polynomial
algorithm is considered to provide more accurate data because it requires at least three known
concentration standards while the Linear (Stern-Volmer) algorithm requires a minimum of two known
concentration standards. The Second Order Polynomial algorithm is defined as:
40 FOXY-AL300-000-02-0207
Page 51

3: Oxygen Sensors
Compensating for Temperature with the Second Order Polynomial Algorithm
If you decide to compensate for temperature, the relationship between the Second Order Polynomial
algorithm and temperature are defined as:
I0 = a0 + b0 * T + c0 * T
K1 = a1 + b1 * T + c1 * T
K2 = a2 + b2 * T + c2 * T
2
2
2
Theory - Henry’s Law
It is possible to calibrate the Fiber Optic Sensors System in gas and then use the system in liquid or vice
versa. In theory, the Fiber Optic Sensors System detects the partial pressure of oxygen. In order to convert
partial pressure to concentration, you can use Henry’s Law. When the temperature is constant, the weight
of a gas that dissolves in a liquid is proportional to the pressure exerted by the gas on the liquid.
Therefore, the pressure of the gas above a solution is proportional to the concentration of the gas in the
solution. The concentration (mole %) can be calculated if the absolute pressure is known:
Oxygen mole fraction = oxygen partial pressure / absolute pressure
Since the Fiber Optic Sensors System detects partial pressure of oxygen, the response in a gas
environment is similar to a liquid environment in equilibrium with gas. Therefore, it is possible to
calibrate the Fiber Optic Sensors System in gas and then use the system with liquid samples and vice
versa if you utilize Henry's Law.
However, Henry's Law does not apply to gases that are extremely soluble in water. The solubility of
oxygen in water at different temperatures is shown below:
Oxygen Solubility in Water at Differing Temperatures
FOXY-AL300-000-02-0207 41
Page 52

3: Oxygen Sensors
T (ºC)
T*
(T/100K)
Mole Fraction of oxygen in
water at 1 atmosphere pO2
Weight Fraction (ppm) at
1 atmosphere pO2 (pure O2)
Weight Fraction (ppm) at 0.209476
atmospheres pO2 (Air)
5 2.7815 3.46024E-05 61.46203583 12.87482142
10 2.8315 3.06991E-05 54.52891411 11.42249881
15 2.8815 2.75552E-05 48.94460474 10.25272002
20 2.9315 2.50049E-05 44.41468119 9.303809756
25 2.9815 2.29245E-05 40.71933198 8.529722785
30 3.0315 2.12205E-05 37.69265242 7.895706058
35 3.0815 1.98218E-05 35.20817214 7.375267068
40 3.1315 1.86735E-05 33.16861329 6.948028438
Temperature
Temperature affects the fluorescence decay time, the fluorescence intensity, and the collisional frequency
of the oxygen molecules with the fluorophore. This, therefore, affects the diffusion coefficient of oxygen.
Temperature also affects the solubility of oxygen in samples. The net effect of temperature fluctuations is
seen as a change in the calibration slope:
Fiber optical oxygen probe temperature
test
(const ant O2 ratio, varied temp.)
y0 = 1.3522x + 1.0049
3
y
= 1.5471x + 1.0084
10
2.8
y20 = 1.7818x + 1.0134
2.6
= 2.0768x + 1.0206
y
30
2.4
y
= 2.4684x + 1.0301
40
2.2
/V
0
2
V
1.8
1.6
1.4
1.2
1
0 0.2 0.4 0.6 0.8 1
O2/(O2+N2)
Decreasing
temperature
0
10
20
30
40
Linear (0)
Linear (10)
Linear (40)
Linear (30)
Linear (20)
Calibration Slope with Temperature Fluctuations
42 FOXY-AL300-000-02-0207
Page 53

3: Oxygen Sensors
Samples should be maintained at a constant (+/-3° C*) temperature. If this is not practical, calibrate the
Fiber Optic Sensors System by using the temperature compensation features and measuring temperature
and oxygen concurrently. To monitor the temperature of the sensing environment and compensate for
temperature fluctuations, temperature electrodes can now be used in conjunction with the oxygen probe.
(Optional thermistor and K-type thermocouple accessories are available.) OOISensors Software corrects
for changes in data due to temperature fluctuations.
Note
Although Ocean Optics’ miniature spectrometers are extremely sensitive, the spectrometer cannot
detect temperature fluctuations +/-3° C.
Scattering Media
Note
This section is relevant only if there is no overcoat applied to the oxygen probe.
Florescence emissions from the ruthenium complex propagate in all directions. In clear media, only those
emissions propagating toward the fiber within the acceptance angle of the probe are detected. If the probe
tip is held near a reflecting surface, or immersed in a highly scattering media, the fluorescence signal will
increase. The increase will be proportional for both the intensity of the fluorescence at a pressure of
oxygen and the intensity of fluorescence at zero pressure of oxygen, but will not affect the Stern-Volmer
constant. For this reason, it is necessary to measure the intensity of fluorescence at zero pressure of
oxygen in the sample. Furthermore, if you are measuring oxygen in highly scattering media, then the
standards you use for your calibration procedure should be in the same media as your sample for the most
accurate results.
Samples to Use
If you are using the probe in gases, N2 can be used for the low value (0%) and either air (20.9%) or O2
(100%) can be used for the high value.
If you are using the probe in liquid media, it may be difficult to prepare standards. Sodium hydrosulfite
dissolved in aqueous media consumes O
saturated values for various solvents and salt solutions can be found in textbooks.
rapidly. You can use this to prepare a 0% concentration. Air-
2
Note
Bubbling standardized gasses through the sample is an option but, depending on your setup, may
take more than 24 hours to reach equilibrium
FOXY-AL300-000-02-0207 43
Page 54

3: Oxygen Sensors
Calibrating Oxygen Sensors
The following sections provide instructions on calibrating your oxygen sensors both with and without
temperature compensation.
Calibrating Oxygen Sensors without Temperature Compensation
Perform the steps below to calibrate your oxygen sensors without using temperature compensation:
Preparing for Calibration
► Procedure
1. Set the data acquisition parameters for the calibration procedure (integration time, averaging, and
boxcar smoothing).
2. Set the integration time for the entire calibration procedure when the probe is measuring the
standard with zero concentration. The fluorescence peak (~600 nm) will be at its maximum at
zero concentration.
3. Adjust the integration time so that the fluorescence peak does not exceed 3500 counts.
Note
If you are using the LS-450 in Pulse mode, set the integration time to powers of 2 (2, 4, 8, 16, 32,
64 etc.) to ensure a constant number of LED pulses during the integration time.
• The intensity of the LED peak (~475 nm) does not affect your measurements.
4. Take a Dark measurement.
5. Select Calibrate | Oxygen, Single Temperature from the menu bar. The Single Temperature
Calibration screen appears.
6. Enter the serial number of the probe in the S/N box. The Date box should display the current
date. The file name and path will appear under Calibration File Path once you select File | Save
Calibration Chart and save the chart. At the bottom of the screen is a box to assign a text label
to the Oxygen Concentration Units.
7. Select Multi Point from the drop-down menu located next to Calibration Type.
8. Locate the Channel section and select the spectrometer channel associated with the sensor you
are calibrating.
44 FOXY-AL300-000-02-0207
Page 55

3: Oxygen Sensors
9. Select the algorithm type from the Curve Fitting drop-down menu. This algorithm will be used
to calibrate your sensor system. See the Calibration Requirements for Oxygen Sensors
section for
more information on algorithms
You have configured the system for calibration. Proceed to the next section to calibrate your standards.
Calibrating Standards
► Procedure
1. Enter information for the first standard in the Calibration Table. The first standard should have
0% oxygen concentration, such as in a nitrogen flow or in a solution of sodium hydrosulfite.
Enter 0 in the Concentration column of the Calibration Table.
2. Leave the oxygen probe in the standard for at least 5 minutes. This guarantees equilibrium.
3. Move your cursor to the Intensity column.
4. Click the green Scan Standard button or select Spectrometer | Scan Standard from the menu.
Note
Enabling the optional Continuous function, located to the right of the Scan Standard button,
will allow you to receive continuous intensity values of a standard. To use this function, check the
Continuous box.
FOXY-AL300-000-02-0207 45
Page 56

3: Oxygen Sensors
5. Once you click the green Scan Standard button, a red Scanning button appears. Watch the
values in the Intensity column. When there appears to be no changes in this value, select the red
Scanning button to accept the intensity value.
Note
If the probe has an overcoat, then the standards used in the calibration can be of a state of matter
different from the sample that you are using. You could switch between gas and liquid and your
calibration data will be valid. If the probe does not have an overcoat, standards used in the
calibration not only must be of the same state of matter as your sample, but also must have the
same refractive index as your sample.
6. Enter the known oxygen concentration of the standard in the Concentration column and leave
the oxygen probe in the standard for 5 minutes.
7. Move the cursor to the Intensity column.
8. Click the green Scan Standard button or select Spectrometer | Scan Standard from the menu
bar. The intensity of the standard should then appear in the Intensity column.
9. Repeat the steps above for each standard you wish to measure.
You have now calibrated all standards. Proceed to Finalizing Calibration
.
Finalizing Calibration
► Procedure
1. Click the green Curve Fit button. A graph displaying the results of your calibration procedure
appears in the bottom of the screen. Verify the results of the calibration, and then proceed to Step
2.
2. Click the green Update Channel Calibration button to save information from this calibration
procedure for the specified spectrometer channel into data files.
3. Save the Calibration Table for future use. Select File | Save Calibration Table from the menu
bar.
4. To print the entire screen, select File | Print from the menu bar.
5. Select File | Close from the menu bar to return to the main display window.
46 FOXY-AL300-000-02-0207
Page 57

3: Oxygen Sensors
Calibrating Oxygen Sensors with Temperature Compensation
Perform the steps below to calibrate your oxygen sensors using temperature compensation.
About Factory Calibration
If you want to compensate for temperature changes, you can purchase a Factory Calibration to be
performed at Ocean Optics prior to shipping the Fiber Optic Sensors System. Consult an Ocean Optics
catalog, contact an Ocean Optics Applications Scientist, or visit our website at
for a price for this service.
Note
Factory Calibration can only be performed if you specify the oxygen concentration range and
temperature in which you will be working when you purchase the Fiber Optic Sensors System.
www.oceanoptics.com
Calibrating With Factory Calibration
Perform the steps below to calibrate the oxygen sensors for temperature compensation using the factory
calibration.
Note
If you are not using (or do not have) a factory calibration file, proceed to Calibrating Without
Factory Calibration
Preparing for Calibration Using the Factory Calibration
If you ordered the Factory Calibration, you are provided with an additional file that includes data for the
Calibration Table. You will need this file in Step 5.
► Procedure
1. Set the data acquisition parameters for the calibration procedure (integration time, averaging, and
boxcar smoothing).
2. Set the integration time for the entire calibration procedure when the probe is measuring the
standard with zero concentration at the lowest sample temperature you will be using. The
fluorescence peak (~600 nm) will be at its maximum at zero concentration.
later in this chapter.
FOXY-AL300-000-02-0207 47
Page 58

3: Oxygen Sensors
3. Adjust the integration time so that the fluorescence peak does not exceed 3500 counts. Set the
integration time to powers of two (2, 4, 8, 16, 32, 64 etc.) to ensure a constant number of LED
pulses during the integration time. (The intensity of the LED peak [~475 nm] does not affect your
measurements.)
4. Select Calibrate | Oxygen, Multiple Temperature from the menu bar. The Multiple
Temperature Calibration screen appears.
5. Select File | Open Calibration Table from the menu bar. The name of the file corresponds to the
serial number of the probe that you are calibrating. Once this file is opened, the Calibration Table
should be populated with oxygen concentration amounts and temperatures.
Note
The serial number is etched on the SMA connector, located at the top of the probe.
6. Select the green Curve Fit button. Graphs displaying the curves appear in the bottom of the
dialog box. Verify that the graphs are satisfactory, and then proceed to Step 7.
7. Click the green Update Channel Calibration button to save information from this calibration
procedure.
8. Select File | Close from the menu bar to return to the main display window.
You have now configured the system for calibration using the factory calibration file. Proceed to the next
section to calibrate your standards.
Note
Second order is strongly recommended for all temperature compensation.
Calibrating Standards Using Factory Calibration
► Procedure
1. Select Calibrate | Oxygen, Single Temperature from the OOISensors menu bar.
2. Click on the Calibration Type drop-down menu and select Single Point.
3. Click on the Curve Fitting drop-down menu and select Second Order Polynomial.
4. Enter the known oxygen concentration of your standard under Concentration.
5. Change the switch in the Temp Compensation section of the Single Temperature Calibration
screen to Yes.
48 FOXY-AL300-000-02-0207
Page 59

3: Oxygen Sensors
6. Get the proper temperature reading. Either:
• Select Spectrometer | Sample Temperature from the menu bar in the Single Temperature
Calibration screen, or
• Enter the temperature manually.
7. Leave the oxygen probe in the standard for at least 5 minutes. This guarantees equilibrium.
8. Place the cursor in the Intensity box.
9. Click the green Scan Standard button or select Spectrometer | Scan Standard from the menu
bar.
Note
Enabling the optional Continuous function, located to the right of the Scan Standard button,
will allow you to receive continuous intensity values of a standard. To use this function, check the
Continuous box.
• Once you click the green Scan Standard button, a red Scanning button appears. Watch the
values in the Intensity column (If this value is < 1.0, then the Enable reference correction
option is checked on the Configure Software screen.). When there appears to be no changes
in this value, select the red Scanning button to accept the intensity value.
FOXY-AL300-000-02-0207 49
Page 60

3: Oxygen Sensors
Note
If the probe has an overcoat, then the standards used in the calibration can be of a state of matter
different from the sample that you are using. You could switch between gas and liquid and your
calibration data will be valid. If the probe does not have an overcoat, standards used in the
calibration not only must be of the same state of matter as your sample, but also must have the
same refractive index as your sample.
Finalizing Calibration Using Factory Calibration
► Procedure
1. Click the green Curve Fit button. A graph displaying the results of your calibration procedure
appears in the bottom of the screen. Verify the results of the calibration, and then proceed to Step
2.
2. Click the green Update Channel Calibration button to save information from this calibration
procedure for the specified spectrometer channel into data files.
3. Save the calibration table for future use. Select File | Save Calibration Table from the menu bar.
• To print the entire screen, select File | Print from the menu bar.
4. Select File | Close from the menu bar to return to the main display window.
Calibrating Without Factory Calibration
Perform the steps below to calibrate the oxygen sensors for temperature compensation without using the
factory calibration.
Note
If you are using a factory calibration file, refer to Calibrating With Factory Calibration.
When calibrating for temperature compensation without using factory calibration, calibration becomes a
two-part task.
Preparing for Calibration without Using Factory Calibration – Part 1
► Procedure
1. Set the data acquisition parameters for the calibration procedure (integration time, averaging, and
boxcar smoothing).
50 FOXY-AL300-000-02-0207
Page 61

3: Oxygen Sensors
2. Set the integration time for the entire calibration procedure when the probe is measuring the
standard with zero concentration at the lowest sample temperature you will be using. The
fluorescence peak (~600 nm) will be at its maximum at zero concentration.
3. Adjust the integration time so that the fluorescence peak does not exceed 3500 counts. Set the
integration time to powers of two (2, 4, 8, 16, 32, 64 etc.) to ensure a constant number of LED
pulses during the integration time. (The intensity of the LED peak [~475 nm] does not affect your
measurements.)
4. Click on the Dark Measurement icon to take a Dark measurement.
5. Select Calibrate | Oxygen, Multiple Temperature from the menu bar. The Multiple
Temperature Calibration screen appears.
6. Enter the serial number of the probe in the S/N box. The Date box should display the current
date. The file name and path will appear under Calibration File Path once you select File | Save
Calibration Chart and save the chart. At the bottom of the screen is a box to assign a text label
to the Oxygen Concentration Units.
Calibrating Standards without Using Factory Calibration – Part 1
► Procedure
1. Enter the concentration values for each standard with known oxygen concentrations in the top
row of the table. The first standard should have 0% oxygen concentration, such as in a nitrogen
flow or in a solution of sodium hydrosulfite
2. Leave the oxygen probe in the standard for at least 5 minutes. This guarantees equilibrium.
3. Manually enter the temperature of this standard in the second cell of the left column or select
Spectrometer | Sample Temperature from the menu.
FOXY-AL300-000-02-0207 51
Page 62

3: Oxygen Sensors
4. Place your cursor under the oxygen concentration of the first standard.
5. Click the green Scan Standard button or select Spectrometer | Scan Standard from the menu
bar.
Note
Enabling the optional Continuous function, located to the right of the Scan Standard button,
will allow you to receive continuous intensity values of a standard. To use this function, check the
Continuous box.
• Once you click the green Scan Standard button, a red Scanning button appears. Watch the
values in the Intensity column. When there appears to be no changes in this value, select the
red Scanning button to accept the intensity value.
Note
If the probe has an overcoat, then the standards used in the calibration can be of a state of matter
different from the sample that you are using. You could switch between gas and liquid and your
calibration data will be valid. If the probe does not have an overcoat, standards used in the
calibration not only must be of the same state of matter as your sample, but also must have the
same refractive index as your sample.
6. Repeat steps 1 through 5 in this section until you have a minimum 3 X 3 grid of calibration data.
52 FOXY-AL300-000-02-0207
Page 63

3: Oxygen Sensors
Finalizing Calibration without Using Factory Calibration – Part 1
► Procedure
1. Click the green Curve Fit button. A graph displaying the results of your calibration procedure
appears in the bottom of the screen. Verify the results of the calibration, and then proceed to Step
2.
2. Click the green Update Channel Calibration button to save information from this calibration
procedure for the specified spectrometer channel into data files.
3. Save the Calibration Table for future use. Select File | Save Calibration Table from the menu
bar.
To print the entire screen, select File | Print from the menu bar.
4. Select File | Close from the menu bar to return to the main display window.
Preparing for Calibration without Using Factory Calibration – Part 2
► Procedure
1. Select Calibrate | Oxygen, Single Temperature from the menu bar. The Single Temperature
Calibration screen appears.
2. Enter the serial number of the probe in the S/N box. The Date box should display the current
date. The file name and path will appear under Calibration File Path once you select File | Save
Calibration Chart and save the chart. At the bottom of the screen is a box to assign a text label
to the Oxygen Concentration Units.
3. Select Single Point from the drop-down menu located next to Calibration Type.
Note
Single Point calibration is based on the procedure you just completed in the Oxygen, Multiple
Temperature dialog box. Because you are using the data from the Oxygen, Multiple Temperature
dialog box, you only need one standard of known oxygen concentration to complete your
calibration.
4. Locate the Channel section and select the spectrometer channel associated with the sensor you
are calibrating.
5. Select the algorithm type from the Curve Fitting drop-down menu. This algorithm will be used
to calibrate your sensor system. See Calibration Requirements for Oxygen Sensors
information on algorithms.
FOXY-AL300-000-02-0207 53
for more
Page 64

3: Oxygen Sensors
Note
In order to use the Second Order Polynomial algorithm, you must have had at least three
standards of known oxygen concentration when scanning standards in the Oxygen, Multiple
Temperature dialog box, discussed in Part 1.
Calibrating Standards without Using Factory Calibration – Part 2
► Procedure
1. Enter the known oxygen concentration of your standard under Concentration.
2. Change the switch in the Temp Compensation section of the Single Temperature Calibration
screen to Yes.
3. Get the proper temperature reading. Either:
• Select Spectrometer | Sample Temperature from the menu bar in the Single Temperature
Calibration screen, or
• Enter the temperature manually.
4. Leave the oxygen probe in the standard for at least 5 minutes. This guarantees equilibrium.
5. Place the cursor in the Intensity box.
54 FOXY-AL300-000-02-0207
Page 65

3: Oxygen Sensors
6. Click the green Scan Standard button or select Spectrometer | Scan Standard from the menu
bar.
Note
Enabling the optional Continuous function, located to the right of the Scan Standard button,
will allow you to receive continuous intensity values of a standard. To use this function, check the
Continuous box.
• Once you click the green Scan Standard button, a red Scanning button appears. Watch the
values in the Intensity column. When there appears to be no changes in this value, select the red
Scanning button to accept the intensity value.
Note
If the probe has an overcoat, then the standards used in the calibration can be of a state of matter
different from the sample that you are using. You could switch between gas and liquid and your
calibration data will be valid. If the probe does not have an overcoat, standards used in the
calibration not only must be of the same state of matter as your sample, but also must have the
same refractive index as your sample.
Finalizing Calibration without Using Factory Calibration – Part 2
► Procedure
1. Click the green Curve Fit button. A graph displaying the results of your calibration procedure
appears in the bottom of the screen. Verify the results of the calibration, and then proceed to
Step 2.
2. Click the green Update Channel Calibration button to save information from this calibration
procedure for the specified spectrometer channel into data files.
3. Save the calibration table for future use. Select File | Save Calibration Table from the menu bar.
• To print the entire screen, select File | Print from the menu bar.
4. Select File | Close from the menu bar to return to the main display window.
Calibration Data
Once you have calibrated your sensor system, the calibration data is stored in two files:
• OOISensors.cfg
FOXY-AL300-000-02-0207 55
Page 66

3: Oxygen Sensors
• chXFoxy.cal
The OOISensors.cfg file is the application configuration file. Calibration data is called from this binary
file each time you use the sensor system and software.
The chXFoxy.cal file is an ASCII (text) data file that can be read and is portable to Microsoft Word or
Excel. In this file name, X represents the spectrometer channel (0 for master, 1 for channel 1, etc.). This
file is not used by the OOISensors application. It is strictly for analyzing calibration data. If you have
temperature data in this file, the temperature will be displayed in Kelvin.
If you ordered the Factory Calibration, you are provided with an additional file that includes data for the
Calibration Table in the Multiple Temperature Calibration dialog box. The name of this file
corresponds to the serial number of the probe.
Recalibration
Oxygen probes need recalibration from time to time. You may need to recalibrate the oxygen probe if any
of the following conditions occur:
• You use a oxygen probe in a harsh environment that degrades the probe coating.
• You expose a oxygen probe to the LED source for long periods, causing faster photobleaching of the
ruthenium compound.
• You recondition the oxygen probe.
• You sterilize the oxygen probe with processes such as autoclave or gamma radiation.
Note
After calibrating or recalibrating the probe, shut down OOISensors and restart the software. This
procedure saves all new information to the default files, which load upon startup.
56 FOXY-AL300-000-02-0207
Page 67

Chapter 4
pH Sensors
Overview
The Fiber Optic pH Sensor system consists of a fiber optic probe designed to hold immobilized indicator
dye materials, a light source, a spectrometer, and OOISensors software. Calibration requires recording
spectra in high and low pH samples, as well as in at least one pH standard solution (such as a NISTtraceable buffer).
pH Films
The Fiber Optic pH Sensor System uses two different types of films: Transmissive and Reflective.
Transmissive indicator dye films are used for clean, transparent samples. Reflective indicator dye films
are used for turbid or absorbing media.
Each type of film consists of a cellulose mechanical matrix surrounded by a hydrophilic polymer that
entraps the indicator molecule. The films are stable when stored dry, and are suitable for nearly any
aqueous sample environment.
When immersed in water, the film dyes may leach very slowly over time and will have to be replaced.
The film response rate is slow (on the order of minutes), being limited by diffusion of ions into the
material. Increasing stirring speed, ionic strength, and temperature all tend to increase the response rate.
Probe Options
The following sections detail options available for the Fiber Optic pH Sensor probes.
TP300-UV-VIS Probe
The TP300-UV-VIS probe is a chemically inert PEEK polymer transflection probe that can be equipped
with a special tip (RT-PH) for mounting transmissive films in the optical path. Light is directed via one
fiber through the mounted film to a mirror. The light is then redirected back through the film to a receive
fiber that returns the light to the spectrometer. The sample is free to flow over the sides of the film.
FOXY-AL300-000-02-0207 57
Page 68

4: pH Sensors
Note
You can also use an RT-2-10 or RT-10-20 transflection tip, which enables the TP300-UV-VIS to
be used for routine transmission measurements.
RFP200-UV-VIS Reflective Film Probe
The RFP200-UV-VIS Reflective Film probe consists of a 6-around-1-fiber bundle in a chemically inert
6.35 mm OD Torlon body. The open tip of the probe screws onto the body to hold 3.17 mm to 4.76 mm
discs of reflective indicator material. The 6-fiber leg attaches to the light source, while the central fiber
leg connects to the spectrometer. The sample has access to the sensing material from one side only.
More Information
For more information on the Fiber Optic pH Sensor system, visit the following page:
http://www.oceanoptics.com/products/phsensor.asp.
Start Up
The following sections provide information on starting all components of the Fiber Optic pH Sensor
system.
pH Sensor Set Up
► Procedure
Perform the steps below to set up the pH Sensor:
1. Open OOISensors and go to Configure > Spectrometer.
58 FOXY-AL300-000-02-0207
Page 69

4: pH Sensors
2. Activate channels with pH sensors and enter their analysis wavelengths (table on next page):
• HA (acid peak)
• A (base peak)
• Baseline
• The isobestic point is not currently used in the OOISensors pH module.
Note
If you aren’t sure what these wavelengths are, measure the absorbance in OOIBase32 or
SpectraSuite to determine the peaks and where an appropriate baseline is. The baseline should be
beyond the last peak (no absorbance should be present). These wavelength values are used in all
of the computations and must be entered correctly. See the table on the following page for more
information.
3. Click the OK button to close the configuration panel.
4. Unscrew the tip of the probe (both the transmission and reflection probe have a screw tip) and
place a single piece of the film inside the probe.
5. Screw the tip back onto the probe.
FOXY-AL300-000-02-0207 59
Page 70

4: pH Sensors
Note
Be careful not to over-tighten the tip. Over-tightening the tip can break the mirror in the
transmission probe or break the film in the reflection probe.
6. Place the probe in the first pH sample, ensuring that there are no bubbles in the light path of the
probe (only applicable to transflectance probes).
pH Sensors Analysis Wavelengths
Indicator Film
Phenol Red 6.5 – 8.5 470 435 575 750
Cresol Red 8.0 – 10.0 490 424 587 750
m-Cresol Purple 8.5 – 10.5 487 435 593 800
Thymol Blue 9.0 – 12.0 495 440 605 800
Brilliant Yellow 7.0 – 9.0 465 412 523 700
Valid pH
Range
Isobestic
Wavelength
(nm)
HA Peak
Wavelength
(nm)
A Peak
Wavelength
(nm)
Baseline
Wavelength (nm)
60 FOXY-AL300-000-02-0207
Page 71

4: pH Sensors
Calibration
The following sections contain information on calibrating your Fiber Optic pH Sensor system. Calibration
requires recording spectra in high and low pH samples, as well as in at least one pH standard solution
(such as a NIST-traceable buffer).
pH Sensor Calibration
► Procedure
Perform the steps below to calibrate the pH sensor:
1. Click on the Calibrate option in the menu and select the pH option from the drop down menu.
The pH Calibration screen appears.
2. Click on the Channel list-box in the upper left corner of the screen and select a spectrometer
channel to calibrate.
3. Enter values for pH for Low Buffer, pH for High Buffer, and Nominal pK. Set the Slope value
to 1.
• The pH for the low buffer and high buffer should be within the linear range of the indicator
being used. For example, for phenol red the low and high buffer should be pH 6.5 and 8.5 or
pH 7 and 8. These numbers are used in the calculations and should be entered correctly. Each
indicator has a different linear range. Ensure that you use the correct indicator in the
appropriate range for measurements.
FOXY-AL300-000-02-0207 61
Page 72

4: pH Sensors
• Integration Period, Average, and Boxcar Smoothing are displayed for the active channel.
These values can be modified and will be used in the rest of the application if accepted.
Tip
Click on the scan button and optimize the integration period based on the spectra on the right side
of the screen. Monitor the spectra and adjust the maximum to peak to ~ 2500 counts. Average
should definitely be greater than 20; Boxcar should be around 10 to 20.
4. Block the light path and click the Dark button. OOISensors stores intensity (counts) values for all
wavelengths of interest.
5. Place the optrode in a low pH sample and allow the optrode to equilibrate for 10 minutes. Then,
click on the Low pH button to take its measurement.
• The Low pH measurement is the reference point for your absorbance measurements and
should be less than the lowest value in the linear range of the indicator. For example, for
phenol red a good reference pH would be 5. OOISensors stores intensity (counts) values for
all wavelengths of interest. These values serve as the reference values in the absorbance
calculations.
6. Place the optrode in a high pH sample and allow the optrode to equilibrate for 10 minutes. Then,
click on the High pH button to take its measurement.
• The High pH value should also be outside the linear range of the indicator. For phenol red,
pH 10 would be appropriate. An absorbance (AU) curve will be stored in the graph (red line).
OOISensors also stores values for all wavelengths of interest.
7. Place the optrode in a Low Buffer sample and allow the optrode to equilibrate for
10 minutes. The low buffer should be the same number entered earlier. Then, click on the Low
Buffer button to take its measurement.
An absorbance (AU) curve will be stored in the graph (blue line). OOISensors also stores values
for all wavelengths of interest.
8. Place the optrode in a High Buffer sample and allow the optrode to equilibrate for
10 minutes. Then, click on the High Buffer button to take its measurement.
• An absorbance (AU) curve will be stored in the graph (green line). OOISensors also stores
values for all wavelengths of interest.
Tip
The absorbance graphs for each measurement appear in the graph on the left side of the pH
Calibration screen. The intensity measurements appear in the graph on the right side. Pay
attention to the intensity measurements. A sudden overall drop in intensity may be attributed to a
bubble, particularly when using the transmission probe. If an increase is noticed where there is a
saturation of the detector, you must drop the integration time and restart the calibration from Step
4.
62 FOXY-AL300-000-02-0207
Page 73

4: pH Sensors
9. Click on the Update Channel Calibration button.
• From this point on, when you click the Scan button, OOISensors displays intensity and
absorbance curves for the samples (black line) along with the values for wavelengths of
interest. All pH values (for the different models) will be calculated and displayed in the lower
right-hand corner. The Pk Low, Pk High, Model Amax, and Model HAmax values in the
upper right corner are also calculated by the software and displayed.
10. Click on the Model list-box in the upper left corner of the screen and choose a calculation model
from the drop down menu. This model will be displayed on the main OOISensors screen. See
Appendix 3: pH Sensor Theory of Operation and Calculations for an explanation of models.
Tip
Models 2 and 3 normally work best for all of the indicators.
11. Close the calibration screen.
12. Go to Configure >Spectrometer and select the spectrometer model that you want to display in
the upper right-hand corner on the main screen (the same model you chose at the pH Calibration
screen). Then, click the OK button.
13. Click on the Scan On switch in the lower right corner of the screen. The pH value of your sample
will be reported in the upper left corner of the screen. The absorbance curve will appear in the
upper graph. Be sure to rescale to see the spectra fully.
Note
Shut down the software correctly when finished. In the event of improper software shutdown or
system crash, OOISensors will not retain the calibration values, forcing you to recalibrate the
optrode. Shutting down the software ensures that the calibration values are properly stored.
FOXY-AL300-000-02-0207 63
Page 74

4: pH Sensors
64 FOXY-AL300-000-02-0207
Page 75

Chapter 5
Compatible Products and
Accessories
Overview
The following sections provide ordering information for products and accessories compatible with
OOISensors and the Fiber Optic Sensors System.
For each category of accessory, you can visit the associated link for specific information on each product,
including specifications and pricing.
Probes
http://www.oceanoptics.com/products/foxyprobes.asp
Part Number Description
1000-µm core diameter stainless steel optical fiber, 1/16" outer diameter
FOXY-R
FOXY-AL300
FOXY-PI600
FOXY-OR125
stainless steel tube beveled at 45°, approximately 6" in length, designed
to couple to a 600 µm bifurcated fiber and splice bushing.
300-µm aluminum jacketed fiber optic probe, 1 m in length, designed to
couple to a 200 µm bifurcated fiber and splice bushing.
600-µm polyimide coated fiber optic probe, 2 m in length, designed to
couple to a 400 µm bifurcated fiber and splice bushing
1000-µm core diameter stainless steel fiber optic probe, 1/8" outer
diameter, 2.5" in length, designed to couple to a 600-µm bifurcated fiber
and splice bushing (direct replacement for 1/8" diameter oxygen
electrodes)
1000-µm core diameter stainless steel fiber optic probe, 1/8" outer
FOXY-OR125G
FOXY-AL300-000-02-0207 65
diameter, O-ring groove at tip, 2.5" in length, designed to couple to a
600-µm bifurcated fiber and splice bushing (direct replacement for 1/8"
diameter oxygen electrodes)
Page 76

5: Compatible Products and Accessories
Part Number Description
1000-µm core diameter titanium fiber optic probe, 1/8" outer diameter, O-
FOXY-OR125-GT
FOXY-T1000
FOXY-T1000-RTD
FOXY-18G
FOXY-21G
ring groove at tip, 2.5" in length, designed to couple to a 600-µm
bifurcated fiber and splice bushing (direct replacement for 1/8" diameter
oxygen electrodes)
1000-µm core diameter stainless steel fiber optic probe with screw-on
light shield, ¼" outer diameter, approximately 7" in length, designed to
couple to a 600-µm bifurcated fiber and splice bushing
1000-µm core diameter stainless steel fiber optic probe with screw-on
light shield, ¼” outer diameter with an imbedded platinum RTD; Only for
use with the USB-LS-450 light source; Temperature range of –60 ºC to
600 ºC
300-µm aluminum jacketed fiber optic probe with 18-gauge needle tip for
penetrating vial septa, designed to couple to a 200-µm bifurcated fiber
and splice bushing
300-µm aluminum jacketed fiber optic probe with 21-gauge needle tip for
penetrating vial septa, designed to couple to a 200-µm bifurcated fiber
and splice bushing
FOXY-RESP
200-µm optical fiber housed in a 1 mm OD plastic ferrule for applications
that require fast response times.
FOSPOR-18G 300-µm fiber probe with 18-gauge needle tip
FOSPOR-21G 300-µm fiber probe with 21-gauge needle tip
FOSPOR-AL300 300-µm fiber probe in aluminum jacketing, 1m
FOSPOR-OR125 1000-µm fiber probe housed in a 1/8th” OD stainless steel ferrule
th
” OD stainless steel grooved
FOSPOR-OR125-G
1000-µm fiber probe housed in a 1/8
ferrule
FOSPOR-OR125-GT 1000-µm fiber probe housed in a 1/8th” OD titanium O-ring
FOSPOR-R 1000-µm fiber probe in 1/16th OD stainless steel ferrule
FOSPOR-R-FLAT 1000-µm fiber probe in 1/16th OD, flat polish
FOSPOR-T1000 1000-µm fiber probe in ¼” OD stainless steel ferrule
FOSPOR-T1000-RT 1000-µm fiber probe in ¼” ferrule with RTD
HIOXY-18G 300-µm fiber probe in 18-gauge needle tip
HIOXY-21G 300-µm fiber probe in 21-gauge needle tip
66 FOXY-AL300-000-02-0207
Page 77

5: Compatible Products and Accessories
Part Number Description
HIOXY-AL300 300-µm fiber probe in aluminum jacketing, 1m
HIOXY-OR125 1000-µm fiber probe in 1/8th” OD stainless steel ferrule
HIOXY-OR125-G 1000-µm fiber probe in 1/8th” OD stainless steel grooved ferrule
HIOXY-OR125-GT 1000-µm fiber probe in 1/8th” OD titanium O-ring
HIOXY-R 1000-µm fiber probe in 1/16th”OD stainless steel ferrule
HIOXY-T1000 1000-µm fiber probe in ¼” OD stainless steel ferrule
HIOXY-T1000-RTD 1000-µm fiber probe in ¼” ferrule with RTD
Factory Calibration Service
http://www.oceanoptics.com/products/foxyprobes.asp
Part Number Description
FOXY-CAL
FOXY-CAL-EXT
FOSPOR-CAL In-house calibration for Fiber Optic Sensors Systems
FOSPOR-CAL-EXT In-house calibration for Fiber Optic Sensors Systems, extended range
HIOXY-CAL In-house calibration for HIOXY systems
HIOXY-CAL-EXT In-house calibration for HIOXY systems, extended range
Factory calibration service for FOXY probes, effective in the 0 °C to 80
°C temperature range, 0% to 100% oxygen range
Factory calibration service for FOXY probes, effective in the -20 °C to 80
°C temperature range, 0% to 100% oxygen range
Overcoats
http://www.oceanoptics.com/products/foxysystem.asp
The following silicone overcoats exclude ambient light, improve chemical resistance, and eliminate
refractive index effects. A silicone overcoat is required for applications involving liquids or gas-to-liquid
activity.
FOXY-AL300-000-02-0207 67
Page 78

5: Compatible Products and Accessories
Part Number Description
FOXY-AF RTV healthcare-grade silicone overcoat for oxygen probes
FOXY-AF-MG
FOSPOR-AF Overcoat for FOSPOR probes, RTV silicone
FOSPOR-AF-MG Overcoat for FOSPOR probes, medical-grade RTV silicone
FOSPOR-RECOV Oxygen sensor reconditioning/recoating service
HIOXY-RECOV Oxygen sensor reconditioning/recoating service
RTV high-strength medical implant-grade silicone overcoat for oxygen
probes (provides a thicker and stronger coating than the FOXY-AF)
Temperature Compensating Components
http://www.oceanoptics.com/products/foxytempcomp.asp
Since oxygen probes are temperature dependent, temperature electrodes can be used in conjunction with
oxygen probes to compensate for temperature effects. The following table details the temperature probes
offered by Ocean Optics:
Part Number Description
Omega K-type Thermocouple has 1/8" outer diameter, temperature range of
FOXY-TK1
-150° C to 220° C with accuracy of 2.2° C or 0.75% of reading with
precision of 1° C (requires FOXY-T-MOD-K module for data acquisition and
10-foot wire)
20-gauge K-type Wire Thermocouple with exposed end has temperature
FOXY-TK-1-W
USB-LS-450-TP
range of -58°F to +392°F (requires FOXY-T-MOD-K module for data
acquisition)
16-gauge needle type RTD only for use with the USB-LS-450; Temperature
range of -60 ºC to 600 ºC
Sol-Gel Coated Membranes, Microscope Coverslips, and Slides
Ocean Optics’ sol-gel oxygen-sensitive film can be applied to any glass substrate, including membranes,
microscope coverslips, and microscope slides. Ocean Optics can also apply the oxygen-sensitive film to
other products, such as cuvettes and micro-well plates. The table below contains a list of off the shelf
products coated with the sol-gel:
68 FOXY-AL300-000-02-0207
Page 79

5: Compatible Products and Accessories
Part Number Description
FOXY-GF
FOXY-SGS
FOXY-SGS-M
Sol-gel coated glass fiber membranes (pack of 5) for testing viability of
reactive material; useful in evaluating membrane-holding probes
1" x 1" sol-gel coated, microscope glass coverslips (pack of 5) for qualitative
feasibility testing
1" x 3" sol-gel coated microscope slide for testing viability of reactive
material when used with microscopes
Spectrometers
http://www.oceanoptics.com/products/spectrometers.asp
Spectrometers and fluorometers for use with the Fiber Optic Sensors System are optimized for low light
level applications. The following spectrometers are optimized for use with the Fiber Optic Sensors
System:
Part Number Description
MFPF100-1 Multifrequency Phase Fluorometer, single channel
MFPF100-2 Multifrequency Phase Fluorometer, dual channel
USB4000-FL USB4000 spectrometer preconfigured for fluorescence without light source
USB4000-FL-395
USB4000-FL-450
USB4000 spectrometer preconfigured for fluorescence with USB-LS-395
light source
USB4000 spectrometer preconfigured for fluorescence with USB-LS-450
light source
Light Sources
http://www.oceanoptics.com/products/ls450.asp
The LS-450 Blue LED Light Sources are compact, low-cost light-emitting diodes that produce either
pulsed or continuous spectral output at 470 nm – the blue region – for fluorescence measurements. The
LS-395 is a pulsed blue LED excitation source with a 395 nm center wavelength. These light sources are
specially designed for use with the Fiber Optic Sensor System:
Part Number Description
LS-450
LS-395 Blue LED Pulsed Excitation Source, 395 nm center wavelength
Blue LED Pulsed Light Source with cable for external connection to
spectrometer
FOXY-AL300-000-02-0207 69
Page 80

5: Compatible Products and Accessories
Bifurcated Optical Fiber Assemblies and Splice Bushing
http://www.oceanoptics.com/products/premgradebif.asp
Ocean Optics’ bifurcated fiber optic assemblies connect easily to sensors, light sources, and miniature
fiber optic spectrometers via SMA terminations and an additional splice bushing. These single-strand
optical fibers are silica-core and silica-clad. Standard assemblies are two meters in length.
Part Number Description
QBIF200-VIS/NIR
QBIF400-VIS/NIR 400-µm bifurcated optical fiber assembly (for use with FOXY-PI600 probe)
FOXY600-VIS/NIR
21-02
200-µm bifurcated optical fiber assembly (for use with FOXY-AL300 and
FOXY-24G probes)
600-µm bifurcated optical fiber assembly (for use with the FOXY-R, FOXYOR125, FOXY-OR125G and the FOXY-T1000 probes)
SMA splice bushing for connecting an oxygen probe to a bifurcated optical
fiber assembly
70 FOXY-AL300-000-02-0207
Page 81

Chapter 6
Hardware Datasheets and
Instructions
The following section contains product data and operating instructions for hardware that is specific to
Ocean Optics’ Fiber Optic Sensor System.
Overview
The following products are detailed in this chapter:
• Fiber Optic Sensing Probes – General Information
• FOXY-R Stainless-steel 1/16" OD Fiber Optic Probe
• FOXY-AL300 Aluminum-jacketed Fiber Optic Probe
• FOXY-PI600 Polyimide coated Fiber Optic Probe
• FOXY-18G/21G Needle-tipped 18/21-gauge Fiber Optic Probes
• FOXY-OR125 and FOXY-OR125G O-ring Fiber Optic Probes
• FOXY-T1000 Stainless-steel Fiber Optic Probe with Light Shield
• FOXY-T1000-RTD Stainless-steel Fiber Optic Probe with Light Shield
• FOXY-RESP Respiration Probe
Oxygen Sensing Probes – General Information
The following general information applies to all of oxygen probes detailed in the following sections.
FOXY-AL300-000-02-0207 71
Page 82

6: Hardware Data Sheets and Instructions
FOXY Probes
Probe Construction
The standard oxygen probe has its distal tip polished and coated with the oxygen-sensing material. The
active material used for the oxygen probe coating is a sub-micron thin-glass film with an immobilized
ruthenium organic complex. The material is applied as a thin film to glass substrates such as optical
fibers. The proximal end of the oxygen probe has an SMA 905 termination for coupling to a bifurcated
fiber optic assembly.
Accuracy
The accuracy of the probe is based on the algorithm used during the calibration process and the
range in which you are working:
• 1.0% of full range for 0-20% when calibrating with the Linear (Stern-Volmer) algorithm
• 0.1% of full range for 0-20% when calibrating with the Second Order Polynomial algorithm
• 1.0% of full range for 0-100% when calibrating with the Second Order Polynomial algorithm
Measurement Range
Each oxygen probe will respond to gaseous samples from 0-100% at 1 atmosphere pressure. In water, the
probe will respond from 0-40.7 ppm, which is the saturation level for oxygen in water. In other liquids,
the probe responds from 0 to the saturation level for oxygen in that particular liquid.
72 FOXY-AL300-000-02-0207
Page 83

6: Hardware Data Sheets and Instructions
Sampling Chambers
The oxygen probe should be installed in a suitable sampling compartment. If you are not using an
overcoat on the probe, it is critical that ambient light be excluded from the field of view of the probe tip.
For gases, a flow chamber with connections to N
can be used with glass frits (airstones) and a stirrer to bring the liquid into equilibrium with the calibration
gas. As an option, sodium hydrosulfite can be used to strip O
standards with known oxygen concentration levels are available for use.
Ocean Optics has both clear and black/opaque sampling chambers available for sale in various sizes.
Consult an Applications Scientist for more information.
, dry air, and/or O2 is suggested. For fluids, these gases
2
from aqueous solutions. It is critical that
2
Response Time
The response time of a oxygen probe is limited by the speed of diffusion of oxygen into the sensor. Our
standard thin films are very fast (<1 second) in gases and liquids. In viscous samples, the diffusion
through the sample will determine the response rate. The probe will respond quickly in samples such as
water, and more slowly in viscous samples such as oils, emulsions, and creams. Unlike an electrode, the
optical sensor will not consume oxygen. This means that stirring the sample will increase the response
rate, but will not affect the final equilibrium reading. Also, optional probe overcoats, applied to exclude
ambient light and improve chemical resistance, will slow response time from 20 seconds to as long as 90
seconds, depending on the overcoat.
Environmental Conditions
Environmental changes, such as changes in pH, salinity, and ionic strength, do not affect oxygen probes.
Chemical Compatibility
Oxygen probes are not affected by pH change or salinity. They can be used safely with 50% methanol,
acids, sodium sulfite, NF
using the probes with strong bases (pH>10), styrene, ethanol, liquid acetone, acetonitrile, and HF and
BTEX solvents.
For a complete list of disruptive and benign chemicals for use with oxygen probes, see Chemical Effects
on Oxygen Probes
.
, hexane, CH4, acetone vapor, moisture, CO2 and CO. We recommended not
3
FOXY-AL300-000-02-0207 73
Page 84

6: Hardware Data Sheets and Instructions
Temperature and the Oxygen Probe
Temperature affects the fluorescence decay time, the fluorescence intensity and the collisional frequency
of the oxygen molecules within the fluorophore – and therefore, the diffusion coefficient of oxygen.
Temperature also affects the solubility of oxygen in samples. The net effect of temperature fluctuations is
seen as a change in the calibration slope. It is best to maintain the sample at a constant (+/-3° C)
temperature. If this is not practical, then you should calibrate your Fiber Optic Sensors System by using
the temperature compensation features and measuring temperature and oxygen concurrently. To monitor
the temperature of the sensing environment and compensate for temperature fluctuations, temperature
electrodes can now be used in conjunction with the oxygen probe. OOISensors Software corrects for
changes in data due to temperature fluctuations.
Photodegradation
Because the ruthenium may be subject to photodegradation, the total exposure to the excitation source
should be minimized. OOISensors Software can control the strobe of the LED so that it illuminates the
probe only during a measurement cycle, as long as the measurement cycle is greater than three minutes.
Ambient Light
Our miniature fiber optic spectrometers are very sensitive, and the oxygen probe will readily detect
ambient light. The probe must be shielded from ambient light to obtain reliable data. Install it in a closed
vessel, or shield the probe with a dark housing. An overcoat of silicone can be applied to the probe (at no
charge) to help reduce ambient light effects. However, the overcoat can slow the response time of the
probe from 20 to 90 seconds.
You can determine if ambient light is entering the probe by turning off the LED. The spectra in
OOISensors should appear flat, near the bottom of the scale.
Lifetime
Each oxygen probe is warranted for 1 year. Probes used in benign environments may last for a very long
time. However, severe biofouling, physical abrasion, and chemical etching of the glass may erode the
probes' sensing surface. Cleaning the probe and protecting it from damaging environments will extend its
life. After 1 year (or, if necessary, before 1 year), you can send your oxygen probe back to Ocean Optics
for re-conditioning and re-coating services (item code FOXY-RECOV or FOXY-RECOV-N for needle
probes).
Cleaning Oxygen Probes
You can use detergents to clean the probe. Using detergents to clean the probe does not necessitate
calibration.
Avoid cleaning oxygen probes with ketones (acetone and alcohols included) or organic solvents.
74 FOXY-AL300-000-02-0207
Page 85

6: Hardware Data Sheets and Instructions
Use Warnings
• Handle with care. Dropping the probe may cause permanent damage.
• Gently remove the plastic cover from the SMA connector before use.
• Pulling the SMA connector away from the probe when removing the plastic cover could damage the
probe.
Oxygen Probe Specifications
The following specifications pertain to all oxygen probes:
Specification Dissolved Oxygen in H
Dynamic range
Response time (without
overcoat)
Response time (with
overcoat)
Resolution
Stability Drift <0.02 ppm per day Drift <0.05% per day
Minimum Detection Limit 0.01 ppm 0.025%
0-40.7 ppm
0-760 mm Hg partial pressure
< 1 second < 1 second
30-50 seconds 20-30 seconds
0.003 ppm at 0 ppm O2
0.02 ppm at 8.5 ppm O2
0.2 ppm at 40 ppm O2
0 Oxygen Gas (at 1 atmosphere)
2
0-100% (mole percent)
0-760 mm Hg partial pressure
0.01% at 0% O2
0.04% at 20.9% O2
0.40% at 100% O2
Sterilization Methods Tested on Oxygen Probes
The following sterilization methods have been tested for use with oxygen probes. The results of each
sterilization method are listed to in the right column of the table:
Method Results
Autoclaving (steam sterilization 30 minutes or
more at 121 °C)
Gamma Radiation No effect.
FOXY-AL300-000-02-0207 75
Each cycle decreases signal by more than 50%.
Recalibration is necessary; lifetime of probe is 6- 8
cycles.
Page 86

6: Hardware Data Sheets and Instructions
Method Results
ETO (at room temperature) Unknown.
ETO (at temperatures above 100 °C) Unknown.
Hydrogen Peroxide
Hydrogen Peroxide Plasma (Plazlyte)
Methanol and Ethanol Wash
Ozone
Sodium Hypochlorite (bleach or Clorox) No effect.
UV Unknown.
Destroys probe signal with extended exposure,
even with overcoat applied to probe.
Degrades probe signal with each cycle. Each cycle
degrades probe by ~ 15%.
Destroys probe signal with extended exposure,
even with overcoat applied to probe.
Preliminary results indicate ozone may not be a
viable method for sterilization.
FOXY-R Stainless-steel 1/16" OD Fiber Optic Probe
The FOXY-R is a 1000-µm silica-core, silica-clad fiber encased in a stainless-steel ferrule. The 7" long
semi-rugged probe has an outer diameter of 1/16". The FOXY-R was the first probe designed for the
Fiber Optic Sensors System. The hypodermic needle-sized probe is designed for use with 600-µm
bifurcated optical fiber. It has an SMA 905 connector at the proximal end for easy coupling to the
bifurcated fiber. The gap between the stainless steel and the silica cladding is filled with epoxy.
See Oxygen Sensing Probes – General Information
cleaning and sterilizing oxygen probes.
76 FOXY-AL300-000-02-0207
at the beginning of this chapter for information on
Page 87

6: Hardware Data Sheets and Instructions
FOXY-R Probe
FOXY-R Specifications
Specification Value
Fiber core
Fiber cladding Silica
Fiber jacketing Stainless steel
Outer diameter 1/16"
Length 7"
Maximum applied pressure 300 psi
Probe temperature range
Connector SMA 905
Response time (without overcoat) <1 second
Compensation Temperature compensation only
Probe reconditioning Yes (FOXY-RECOV @ $100)
Re-calibration Required when probe is replaced or sterilized by autoclave
1000 µm core silica
-80° C to 80° C (reflects range of ruthenium complex in the solgel matrix)
Probe lifetime 1 year
FOXY-AL300-000-02-0207 77
Page 88

6: Hardware Data Sheets and Instructions
FOXY-AL300 Aluminum-jacketed Fiber Optic Probe
The FOXY-AL300 is a 300-µm aluminum jacketed fiber optic probe. The aluminum jacketing, which is
FDA approved, is designed for applications where extraordinary environmental performance is required.
Aluminum jacketed fibers do not weaken under stress (as ordinary fibers do) and have an extremely high
break strength. This extremely flexible and thin probe is 1 meter in length and is designed for use with the
BIF200-VIS/NIR 200-µm bifurcated optical fiber assembly.
See Oxygen Sensing Probes – General Information
cleaning and sterilizing oxygen probes.
FOXY-AL300 Aluminum-Jacketed Fiber Optic Probe
FOXY-AL300 Specifications
at the beginning of this chapter for information on
Specification Value
Fiber core
Fiber cladding Silica
Fiber jacketing Aluminum
Outer diameter
Length 1 meter
Bending radius 2 cm
78 FOXY-AL300-000-02-0207
300 µm silica
410 to 420 µm
Page 89

6: Hardware Data Sheets and Instructions
Specification Value
Maximum applied pressure 300 psi
Probe temperature range
Connector SMA 905
Response time (without overcoat) <1 second
Compensation Temperature compensation only
Probe reconditioning Yes (FOXY-RECOV @ $100)
Re-calibration Required when probe is replaced or cleaned by autoclave
Probe lifetime 1 year
-80° C to 80° C (reflects range of ruthenium complex in the solgel matrix)
FOXY-PI600 Polyimide coated Fiber Optic Probe
The FOXY-PI600 is a 600-µm polyimide-coated fiber optic probe. The polyimide is a coating designed to
operate at temperatures up to 300°C. The polyimide coating allows the sensor to operate in many harsh
chemicals and solvents. The FOXY-PI600 is 2 meters in length and is designed for use with the BIF400VIS/NIR 400-µm bifurcated optical fiber assembly.
See Oxygen Sensing Probes – General Information
cleaning and sterilizing oxygen probes.
at the beginning of this chapter for information on
FOXY-PI600 Polyimide Coated Fiber Optic Probe
FOXY-AL300-000-02-0207 79
Page 90

6: Hardware Data Sheets and Instructions
FOXY-PI600 Specifications
Specification Value
Fiber core
Fiber coating
Outer diameter ~1 mm
Length 2 meters
Amount of pressure that can be
applied
Probe temperature range
Connector SMA 905
Response time (without overcoat) <1 second
Compensation For temperature only
Probe reconditioning Yes (FOXY-RECOV @ $100)
Re-calibration Required when probe is replaced or cleaned by autoclave
Probe lifetime 1 year
600 µm silica
25 µm polyimide
300 psi
-80° C to 80° C (reflects range of ruthenium complex in the solgel matrix)
FOXY-18G/21G Needle-tipped 18/21-gauge Fiber Optic Probes
The FOXY-18G/21G are silica-core, aluminum-jacketed, 1-meter probes with 18/21-gauge needle tip at
the ends for penetrating vial septa. The length of the needle tip is 4", while the entire length of the probe
is 1 meter. The FOXY-18G/21G is designed for use with the BIF200-VIS/NIR 200-µm bifurcated optical
fiber assembly.
See Oxygen Sensing Probes – General Information
cleaning and sterilizing oxygen probes.
80 FOXY-AL300-000-02-0207
at the beginning of this chapter for information on
Page 91

6: Hardware Data Sheets and Instructions
Foxy 21G (left) and 18G (right) Fiber Optic Probe
FOXY-18G/21G Specifications
Specification Value
Fiber core
Fiber jacketing Aluminum
Needle tip 18 or 21-gauge, 0.022" stainless steel wire
Length 4" for needle tip, 1 meter for entire probe
Amount of pressure that can be applied 300 psi
Probe temperature range
Connector SMA 905
Response time (without overcoat) <1 second
Compensation Temperature compensation only
Probe reconditioning Yes (FOXY-RECOV-N @ $125)
300 µm silica
-80° C to 80° C (reflects range of ruthenium complex in the
sol-gel matrix)
Re-calibration Required when probe is replaced or cleaned by autoclave
Probe lifetime 1 year
FOXY-AL300-000-02-0207 81
Page 92

6: Hardware Data Sheets and Instructions
FOXY-OR125 and FOXY-OR125G O-ring Fiber Optic Probes
The FOXY-OR125 is a silica-core, 1000-µm stainless steel fiber optic probe with a 1/8" outer diameter
and an O-ring seal. The FOXY-OR125G is a silica-core, 1000-µm stainless steel fiber optic probe with a
1/8" outer diameter and an O-ring groove at the tip. Both probes are 2.5" in length and are designed for
use with a 600-µm bifurcated optical fiber assembly.
See Oxygen Sensing Probes – General Information
cleaning and sterilizing oxygen probes.
FOXY-OR125 (left) and FOXY-OR125G (right) O-ring Probe
at the beginning of this chapter for information on
FOXY-OR125 and FOXY-OR125G Specifications
Specification Value
Fiber core
Fiber cladding Silica
Fiber jacketing Stainless steel
Outer diameter 1/8"
Length 2.5"
Amount of pressure that can be applied 300 psi
82 FOXY-AL300-000-02-0207
1000 µm silica
Page 93

6: Hardware Data Sheets and Instructions
Specification Value
Probe temperature range
Connector SMA 905
Response time (without overcoat) <1 second
Compensation Temperature compensation only
Probe reconditioning Yes (FOXY-RECOV @ $100)
Re-calibration Required when probe is replaced or cleaned by autoclave
Probe lifetime 1 year
-80° C to 80° C (reflects range of ruthenium complex in
the sol-gel matrix)
FOXY-T1000 Stainless-steel Fiber Optic Probe
with Light Shield
The FOXY-T1000 is a 1000-µm silica core, silica-clad fiber encased in a stainless-steel ferrule with a
screw-on tip. The 7" long probe has an outer diameter of 1/4" and is extremely rugged. The probe can
withstand pressure up to 3000 psi and temperature up to 80° C. It is designed for use with the 600-µm
bifurcated optical fiber assembly.
See Oxygen Sensing Probes – General Information
cleaning and sterilizing oxygen probes.
FOXY-T1000 Stainless Steel Probe with Light Shield
at the beginning of this chapter for information on
FOXY-AL300-000-02-0207 83
Page 94

6: Hardware Data Sheets and Instructions
FOXY-T1000 Specifications
Specification Value
Fiber core
Fiber cladding Silica
Fiber jacketing Stainless steel
Outer diameter 1/4"
Length 7"
Amount of pressure that can be
applied
Probe temperature range
Connector SMA 905
Response time (without overcoat) <1 second
Compensation Temperature compensation only
Probe reconditioning Yes (FOXY-RECOV @ $100)
Re-calibration Required when probe is replaced or cleaned by autoclave
1000 µm silica
3000 psi
-80° C to 80° C (reflects range of ruthenium complex in the solgel matrix)
Probe lifetime 1 year
FOXY-T1000-RTD Stainless-steel Fiber Optic
Probe with Light Shield
The FOXY-T1000-RTD is a 1000-µm silica core, silica-clad fiber encased in a stainless-steel ferrule with
a screw-on light shield. The light shield prevents ambient light from entering the probe. The 7" long probe
has an outer diameter of 1/4" and is extremely rugged. The probe can withstand pressure up to 3000 psi
and temperature up to 80° C. It is designed for use with the 600-µm bifurcated optical fiber assembly.
See Oxygen Sensing Probes – General Information
cleaning and sterilizing oxygen probes.
84 FOXY-AL300-000-02-0207
at the beginning of this chapter for information on
Page 95

6: Hardware Data Sheets and Instructions
FOXY-T1000-RTD Stainless Steel Probe with Light Shield
FOXY-T1000-RTD Specifications
Specification Value
Fiber core
Fiber cladding Silica
Fiber jacketing Stainless steel
Outer diameter ¼ “
Length 7 “
Amount of pressure that can be
applied
Probe temperature range -80 ºC to 80 ºC
Connector SMA 905
Response time (without overcoat) < 1 second
Compensation Temperature compensation only
Probe reconditioning Yes (FOXY-RECOV @ $100)
1000 µm silica
3000 PSI
Recalibration Required when probe is replaced or cleaned by autoclave
Probe lifetime 1 year
FOXY-AL300-000-02-0207 85
Page 96

6: Hardware Data Sheets and Instructions
FOXY-RESP Respiration Probe
The FOXY-RESP Respiration Probe is typically used for measuring oxygen tension in respiratory gasses.
It is composed of a 2-meter cluster of seven 200-µm fibers in a Torlon jacket. The probe can withstand
pressure up to 300 psi and temperature up to 80° C.
See Oxygen Sensing Probes – General Information
cleaning and sterilizing oxygen probes.
FOXY Respiration Probe
at the beginning of this chapter for information on
FOXY-RESP Specifications
Specification Value
Fiber bundle (7) 200 µm core diameter fibers (6 illumination, 1 read)
Fiber assembly length 2 meters
Fiber jacketing Torlon
Outer diameter ¼”
Amount of pressure that can be
applied
Probe temperature range -80 ºC to 80 ºC
Connector SMA 905
Response time (without overcoat) < 50 msec (no overcoat)
86 FOXY-AL300-000-02-0207
300 PSI
Page 97

6: Hardware Data Sheets and Instructions
Specification Value
Compensation Temperature
Probe reconditioning N/A – disposable sensor films
Re-calibration Required with each new film
Probe lifetime >1 year
Factory Calibration Services
When measuring oxygen, you normally must keep the sample at a constant temperature. However, if you
cannot maintain the sample at a constant temperature (+/-3 °C), you can perform a temperature calibration
using the calibration function in the OOISensors Software.
Ocean Optics can also perform the temperature calibration for your. The FOXY-CAL is an in-house
factory-calibration service for environments from 0 °C to 80 °C. The FOXY-CAL-EXT is a factorycalibration service for extended temperature ranges below 0 °C or above 80 °C. You'll need to determine
the temperature and the oxygen concentration range of your sample before ordering an in-house
calibration service.
Calibration Option Temperature Range O2 % Range Price
FOXY-CAL 0 ºC to 80 ºC 0 to 100% $199.00
FOXY-CAL-EXT -20 ºC to 80 ºC 0 to 100% $299.00
FOXY-RECOV Probe Reconditioning
Occasionally, your probe overcoats may become compromised and require reconditioning. Ocean Optics
offers the FOXY-RECOV and FOXY-RECOV-N (for needle probes) probe reconditioning services.
When a probe overcoat becomes compromised, you will observe spectra similar to what is displayed
below:
FOXY-AL300-000-02-0207 87
Page 98

6: Hardware Data Sheets and Instructions
Sample spectra indicative of a compromised probe overcoat
FOXY-AF and FOXY-AF-MG Silicone Overcoats
The FOXY-AF Silicone Overcoat and the FOXY-AF-MG Silicone Medical-grade Overcoat are room
temperature vulcanized (RTV) silicone adhesives used as additional coatings for the oxygen probes.
Overcoats protect the oxygen probes from ambient light, improve chemical resistance, and eliminate
refractive index effects of the sensing environment. A silicone overcoat is required for applications
involving liquids or gas-to-liquid activity.
FOXY-AF is a multi-surface healthcare-grade silicone while the FOXY-AF-MG is a high-strength
acetoxy, implant-grade silicone. The FOXY-AF-MG provides a thicker and stronger coating than the
FOXY-AF. Both overcoats increase the response time of the sensor.
The overcoats are made from a silicone adhesive designed for use in fabricating elastic bonds to silicone,
polyester, and other substrates. Following cure, the overcoat is of the same chemical composition as other
implant-grade silicone elastomers and it contains no solvents or plasticizers. Both overcoats are designed
and tested to meet ISO 10993 biocompatibility test requirements.
Cleaning
Use a 10% hypochlorite detergent solution to clean probes with an overcoat. Using detergents to clean the
probe does not necessitate calibration.
88 FOXY-AL300-000-02-0207
Page 99

6: Hardware Data Sheets and Instructions
Sterilizing
See the Sterilization table in the Oxygen Sensing Probes – General Information section of this chapter for
information on sterilizing probes with overcoats. It is the user's responsibility to validate any sterilization
method chosen.
Overcoat Specifications
Specification FOXY-AF Overcoat FOXY-AF-MG Overcoat
Response time in oxygen gas (at 1 atmosphere) 20 to 30 seconds 20 to 45 seconds
Response time in dissolved oxygen in H20 30 to 50 seconds 60 to 90 seconds
Coating stability Poor in long term Very good
Resistance to chemicals (organic solvents) Very good Excellent
Coating hardness Soft-hard Hard
Tensile strength 780
Tear strength 70 ppi
Cohesive/adhesive strength 18 ppi
Cytotoxicity Non-toxic
FOXY-AL300-000-02-0207 89
Page 100

6: Hardware Data Sheets and Instructions
Oxygen Probe Temperature Control Accessories
Temperature affects the fluorescence decay time, the fluorescence intensity and the collisional frequency
of the oxygen molecules with the fluorophore -- and therefore, the diffusion coefficient of oxygen.
Temperature also affects the solubility of oxygen in samples. The net effect of temperature fluctuations is
seen as a change in the calibration slope. If you cannot maintain the sample at a constant (+/-3° C)
temperature, then you should calibrate your Fiber Optic Sensors System by using the temperature
compensation features and measuring temperature and oxygen concurrently. The FOXY-TS1 Thermistor
and the FOXY-TK1 Thermocouple monitor the temperature of the sensing environment and OOISensors
Software corrects for changes in data due to temperature fluctuations.
FOXY-TS1 Omega Thermistor
A thermistor, a type of temperature-to-resistance transducer, is able to transduce temperature into a
continuous electrical signal. A circuit measures the resistance of the thermistor and provides an output
voltage proportional to the temperature. The FOXY-TS1 Thermistor from Omega is a stainless-steel
tubular electrode probe most often used for liquid immersion. The FOXY-TS1 can monitor temperatures
from 0° C to 100° C. It connects to the FOXY-T-MOD-1, an RS-232 module that interfaces the
thermistor to your PC.
Application Tips
• Immerse the FOXY-TS1 to its cap.
• Use detergents to clean the FOXY-TS1 after use.
Operation
► Procedure
1. Connect the FOXY-TS1 to the FOXY-T-MOD-1 RS-232 module. (Rack-mounted systems have
the modules installed into the rack box.)
2. Connect the FOXY-T-MOD-1 RS-232 module to the PC. You must have an available serial port
on your PC. Note the serial port number (also called COM Port) on the PC to which you are
interfacing.
3. Plug the +12VDC wall transformer into an outlet and connect it to the FOXY-TS1.
4. Open OOISensors software and select Configure | Spectrometer from the menu. Select the
Sensors tab. Next to the Temperature Measurement option, select Omega D5xx1 RS232 for
automatic temperature monitoring. Finally, enable the Compensate function.
5. Select the COM Port number (next to Serial Port) on your PC to which the thermistor is
connected.
90 FOXY-AL300-000-02-0207
 Loading...