

Page 1
SERVICE
MANUAL
PULSE
Caution:
NELLCOR®
OXIMETER
Federal
to
sale
by
MODEL
law
or
on
the
ULTRA
AND
N-6000
(U.S.)
order
CAP™
CAPNOGRAPH,
restricts
of a physician.
this
device
©
1993
Nellcor
Incorporated
Nellcor
25495
Hayward,
Incorporated
Whitesell
California
510
887-5858
1-800-NELLCOR
.
Street
94545
U.S.A.
028065A-0193
Page 2

Corporate
Headquarters
European
Office
Asia/Pacific
Headquarters
Nellcor
25495
Hayward,
Whitesell
USA
Tel
510-887-5858
Incorporated
Street
California
94545
Nelleor
Hambakenwetering
5231
The
Tel.
European
Northwest
Nellcor
Hambakenwetering
5231
The
Tel.
Middle
Nelleor
Black-&-Decker-Strasse
W-6270
Germany
|
Tel.
Southern
Nellcor
3,
78353
France
Tel.
BV
DD
’s-Hertogenbosch
Netherlands
+31.73.426565
Regional
Europe
Europe
DD
‘s-Hertogenbosch
Netherlands
+31.73.426565
and
GmbH
Idstein
+49
6126.5930
Sarl
rue
du
Petit
Jouy-en-Josas
+33.1.39.46.96.58
BV
Central
Europe
Robinson
1
Offices
1
Europe
.
28
Cedex
Nellcor
Suite
Admiralty
18
Hong Kong
Tel.
Limited
1204C
Harcourt
+852.529.0363
Centre,
Road
Tower
1
European
Nellcor
University
Science
Coventry
United
Tel.
Nelleor
Interleuvenlann
B-3001
Belgium
Tel.
Local
(UK)
Limited
of
Park
CV4
7EZ
Kingdom
+44.203.690220
(Belgium)
Leuven
+32.16.400467
Offices
Warwick
NV/SA
62/8
.
ii
Page 3
TABLE
OF
CONTENTS
11
12
13
2.1
2.2
2.3
2.4
2.5
3.1
3.2
3.3
3.4
Symbols
We
Introduction...
Introduction.........................
Warnings,
Description..................,..,............,...
1.8.1
13.2
13.3
13.4
1.3.5
1.3.6
1.3.7
18.8
1.3.9
1.3.10
1.3.11
13.12
Principles
Overview.........................
PulseOximetrySubsystem.......................
2.2.1
2.2.2
2.2.8
2.2.4 - Measured
Capnography
N20/02
24.1
2.4.2
2.4.3.
2.4.4
2.4.5
2.4.6
2.4.7
.
Factory
Circuit
Introduction.................
CO2
3.2.1
3.2.2
3.2.3
8.2.4
3.2.5
3.2.6
3.2.7
8.2.8
3.2.9
3.2.10
Oximetry
©
8.8.1
Detailed
3.4.1
AAA
Cautions,
Visible
Audible
Visible
StatusMessages..............................
Automatic
On-Screen
N-6000
Trend
Automatic
Battery
Noninvasive
C-LOCK™
C-LOCK
Automatic
Functional
Standard
Pressure
N20
O2
Water
BTPS/ATPS
Summary:
Calibrated
Analysis
Module
Sensor
CO2
Default
Memory......:...,...............,,,,,......
of
Subsystem
Compensation
Collision
Collision
Circuit
Module
bDigital.....................
Motor
Signal
Heater
Source....
Barometer...
StatusLEDs....................
Status
OximetryModule........................
Oximetry
Control........
Module
Oximetry
and Notes
and
Audible
Indicator.......................
and
Operation
Broadening
Vapor
Operation.........
22220
Audible
Self-Test
Menus..................,...,,,.......
and
Calibration..…..............,........,.,.......ss
..................
Oximetry
ECG
Synchronization
Operation.
ECG
Calibration..................
versus
versus
Gas
Reported
Amplifier..
LED
Module
Calculated
............................
............
Conditions
Broadening...........
Broadening.........................,.,...........ss
Effect...
Compensation.
Sensor
Details.
Hardware
Summary............
Block
Diagram
Module
...
Indicators.
Alarms.
and
Warm-Up
Custom
Synchronization
Fractional
CO2
μμ
Default
Sensors.........................
Saturation
Compensation...
Values...
ΕΟΟ
....
Analysis
Circuit
Analysis
Time..
Set-Up
for
Pulse
Saturation...
...
…
.
.
Oximetry..
....
...
...
レレ
くく
レト
issues
ニュ
レッ
くく
トー トト ャ ッッ て と
と ャ
て て と て て
ss
ρου
sense
とく
나
…
…
..
„12
..
..
…
....
ここ
..
‚...
„21
„22
ーー
.
..
..
.
..
..
..
..
..
..
…
..
..
…
...
…
...
ας
.
.
1-1
1-1
1-2
1-2
12
1-2
1-3
13
13
13
13
13
1-4
2-1
21
2-1
2-3
2-5
25
2-5
2-6
2-6
2-6
2-6
2-6
2-7
3-1
3-2
3-2
3-2
3-2
3-3
3-8
3-8
3-3
3-3
BA
3-4
3-4
3-6
3-6
Page 4
TABLE
OF
CONTENTS
(continued)
3.5
3.6
4.1
4.2
4.3
4.4
5.1
5.2
5.3
6.1
6.2
”Disassempbly
7.1
7.2
7.3
8.1
8.2
8.3
9.1
Main
8.5.1
8.5.2
3.5.3
3.5.4
8.5.5
8.5.6
3.5.7
8.5.8
8.5.9
3.5.10
3.5.11
3.5.12
3.5.13
Power
3.6.1
3.6.2
3.6.3
3.6.4
Routine
Introduction............
Cleaning
Changing
Replacing
Packing
Överview...........................
Repacking
Repacking
Disassembly
Introduction............
6.2.1
6.2.2
6.2.3
6.2.4
6.2.5
6.2.6
6.2.7
6.2.8
6.2.9
Testing
Description.....................
COs
7.2.1
7.2.2
Calibration
Troubleshooting........................
Introduction.......
Advisory
Status
Spare
In
Processor
Microprocessor
Power.
Reset
Battery
Internal
Graphical
BEPROM..............
FLASH
Real
Time
Audio
Charging
Patient
Front
Supply-Charger
Power
AC
Rectifier
+5
Volt
C-LOCK
Maintenance
Instructions............
Mains
or
Changing
and
PCB
Control.........
and
Watehdog......................
Backup
and
Display
Memory.
Clock....
Generation
Indicator................
Isolation
Panel
Supply
and
Logic
QRS
Voltage
Shipping......
Circuit
Section.......,...............,....,......,
and
Memory
External
..................,....,,.....,..,.
....
Power
Display
and
Sync
Controller..
PCB
Charger
+12
volt
Display
Input
......................
Input
the
Fuse...
Details.
Retention............
Serial
Supply...
Communications..
Circuit
Theory
Battery
Power
Circuit...
....
In
Original
In
New
Guide........
Procedure
RemovinginstrumentCover...........................
Removing
Removing
Removing
Removing
Removing
Removing
Removing
Removing
and
Calibration
Carton..
Carton
Front Panel
Power
Transformer..........
.......
了
attery.
Oximetry
Main
Pull-Out
Speaker............................
............
and
C02
Processor
Assembly
Card
Supply-Charger
Display
ConventionS
Service
Breath
and
Screen
Detection
Accuracy
and
Display
and
Check
Conventions...................
Display
of
Messages.
Messages.....
Parts........
го
ас
6101...
sise
ーー
...
essences
Details.........
of
Charger...........
Supply
Subassembly..
PCB...........................
.............................,................,.....
Tray...
Assembly.
0
End-Tidal
Operation..
....
…
<
scccrcre*
CO2
ui
iii
Values..
…
ees
enten
ennen
eker
0040000400000
000000e0
..
nernnse
„
en
…
..
.
.
..
..
..
72
7-6
8-1
8-1
8-6
8-7
9-1
9-1
iv
Page 5
TABLE
OF
CONTENTS
(continued)
10
10.1
1
11.1
11.2
113
114
185
11.6.
11.7.
¡ACA
Overview.........
Specifications.............
Physical/Environmental.........
Components
Controls
Connectors................
Performance.
Calibration.....
Airway
and
Adapter
11.8 再 jectrical.
2
12.1
2-1
2-2
3-1
3-2
3-3
3-4
3-5
8-6
8-7
4-1
4-2
6-1
7-1
Schematic
Introduction...................,......,.................
Oxyhemoglobin
Nondispersive
Overall
Oximetry
LRD
Input
Input
A:D
Support
North
European
Disassembly
Failed
Block
Module
Driver
Signal
Amplifier,
Conversion
American
LED
essences
and
User
Interface..
Indicators...........
EP O KO KO R O R K
0
0000
Koh
OK S KO
RS O O
Diagrams..
see
LIST
OF
FIGURES
Dissociation
Infrared
Diagram..........................
Overall
Cireuit に し に
Processing.
Synchronous
Circuits.......................,.......,,,...........
Circuits...................
Fuse
Аттапветейв.............
Fuse
Diagram..............
Атгапретейф...............
Digits
Curve..........................................
CO2
Block
に に に レート
Analyzer..
Diagram...
ーーー・
Detector,
and
Filter/Amplifier
линии
нии
ини
тни
KOK
KK P KKK
низине
ss
KK O RR
oP P een
K R
0.0000
öseeeeeea
PK O v
нение
наити
ek
6
εως
Kone
..
.
7-1
8-1
The
United
OXISENSOR;;
The
4,770,179;
Service
Troubleshooting
following
States
N-6000
Screen
are
trademarks
and
other
and
is
covered
4,802,486;
IndicatiomS
Guide
countries;
ULTRA
by
4,869,254; 4,928,692;
the
following
CAP,
of
Nellcor
C-LOCK,
which
レレ
ーー
patents:
トレ
ーー
トト
ーー
Incorporated:
which
is a
commercial
U.S.
4,934,372;
NELLCOR,
is
registered
Patent
and
スー
スト
ドー
くに
トー
which
in
the
trademark.
No.
4,621,643;
corresponding
トト
トト
トス
is
United
4,653,498;
patents
スレ
(レレ に レレ に トス
registered
States;
4,700,708;
in
other
countries,
レト
in
ストー
the
て
Page 6
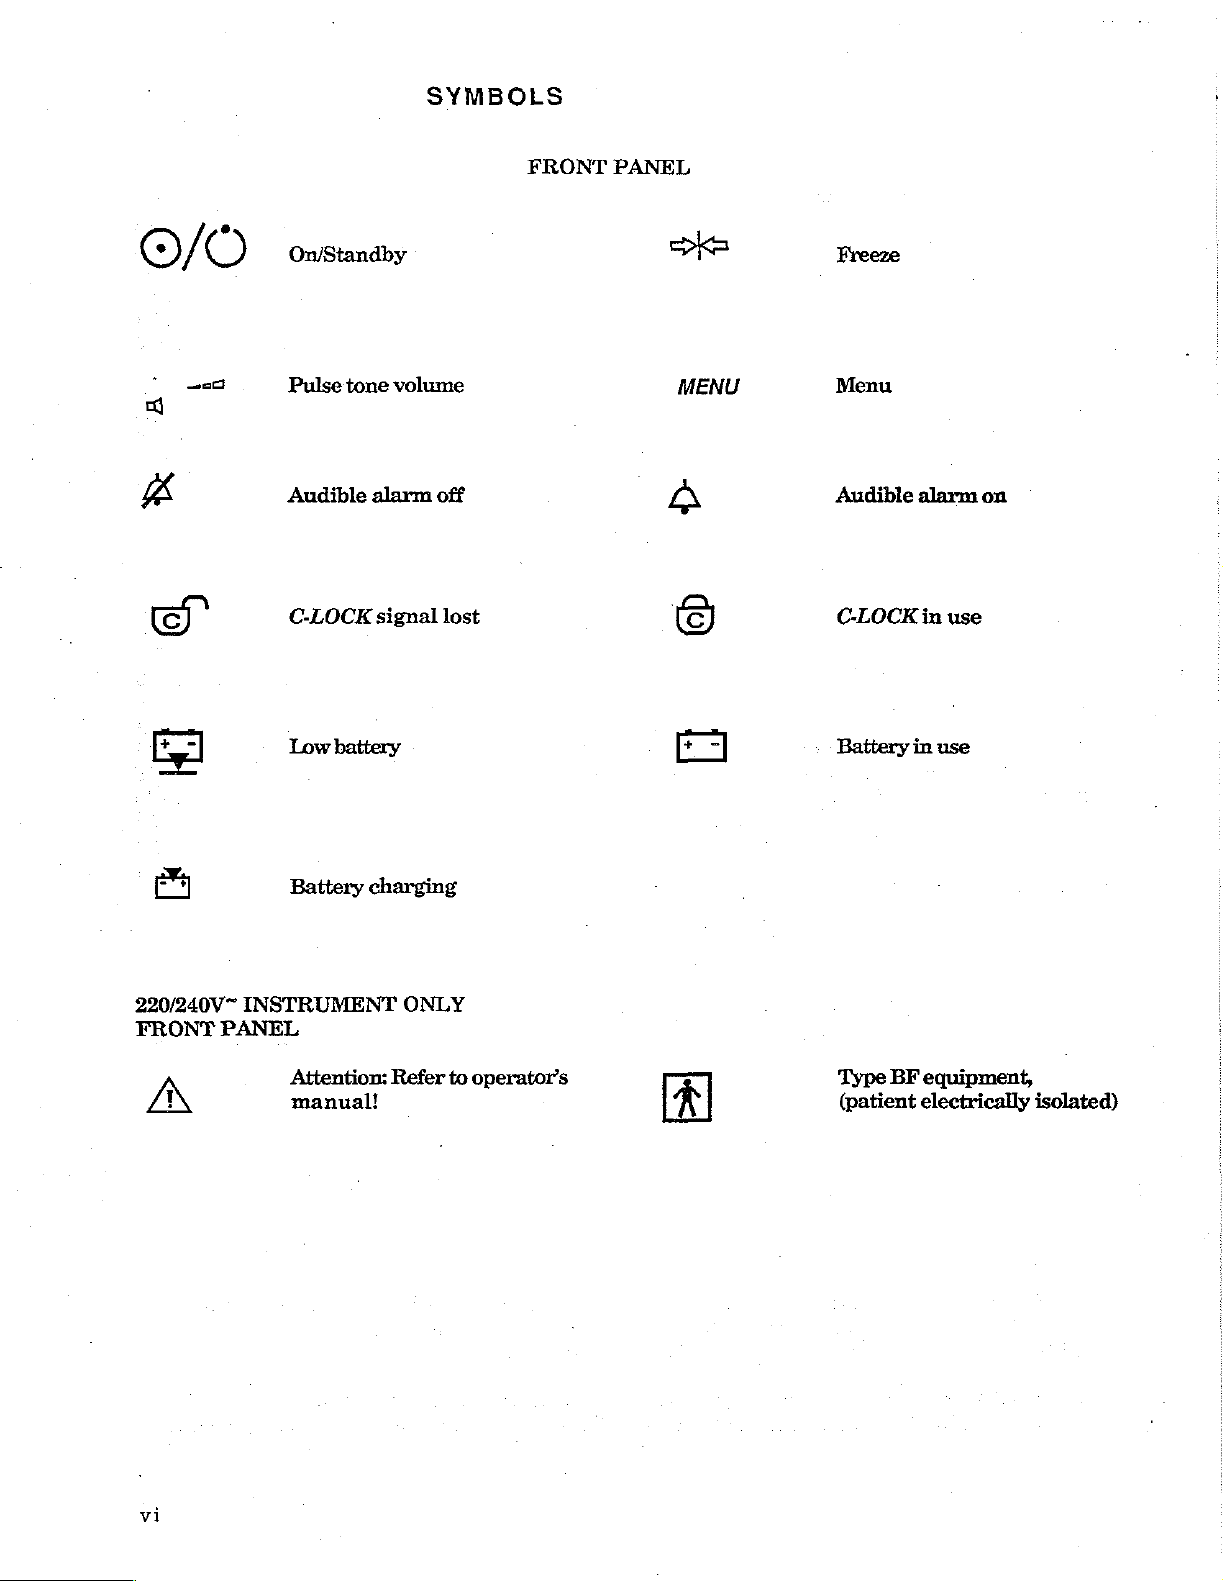
SYMBOLS
O/O
Sc
nx
el
On/Standby
Pulse
tone
volume
Audible
C-LOCK
Low
alarm
signal
battery
off
lost
FRONT
PANEL
eke
MENU
A
+
ni
Freeze
Menu
Audible
C-LOCK
Battery
alarm
in
in
use
on
use
κ
220/240V~
FRONT
PANEL
A
Battery
INSTRUMENT
Attention:
manual!
charging
ONLY
Refer
to
operator’s
Type
BF
equipment,
(patient
electrically
isolated)
vi
Page 7
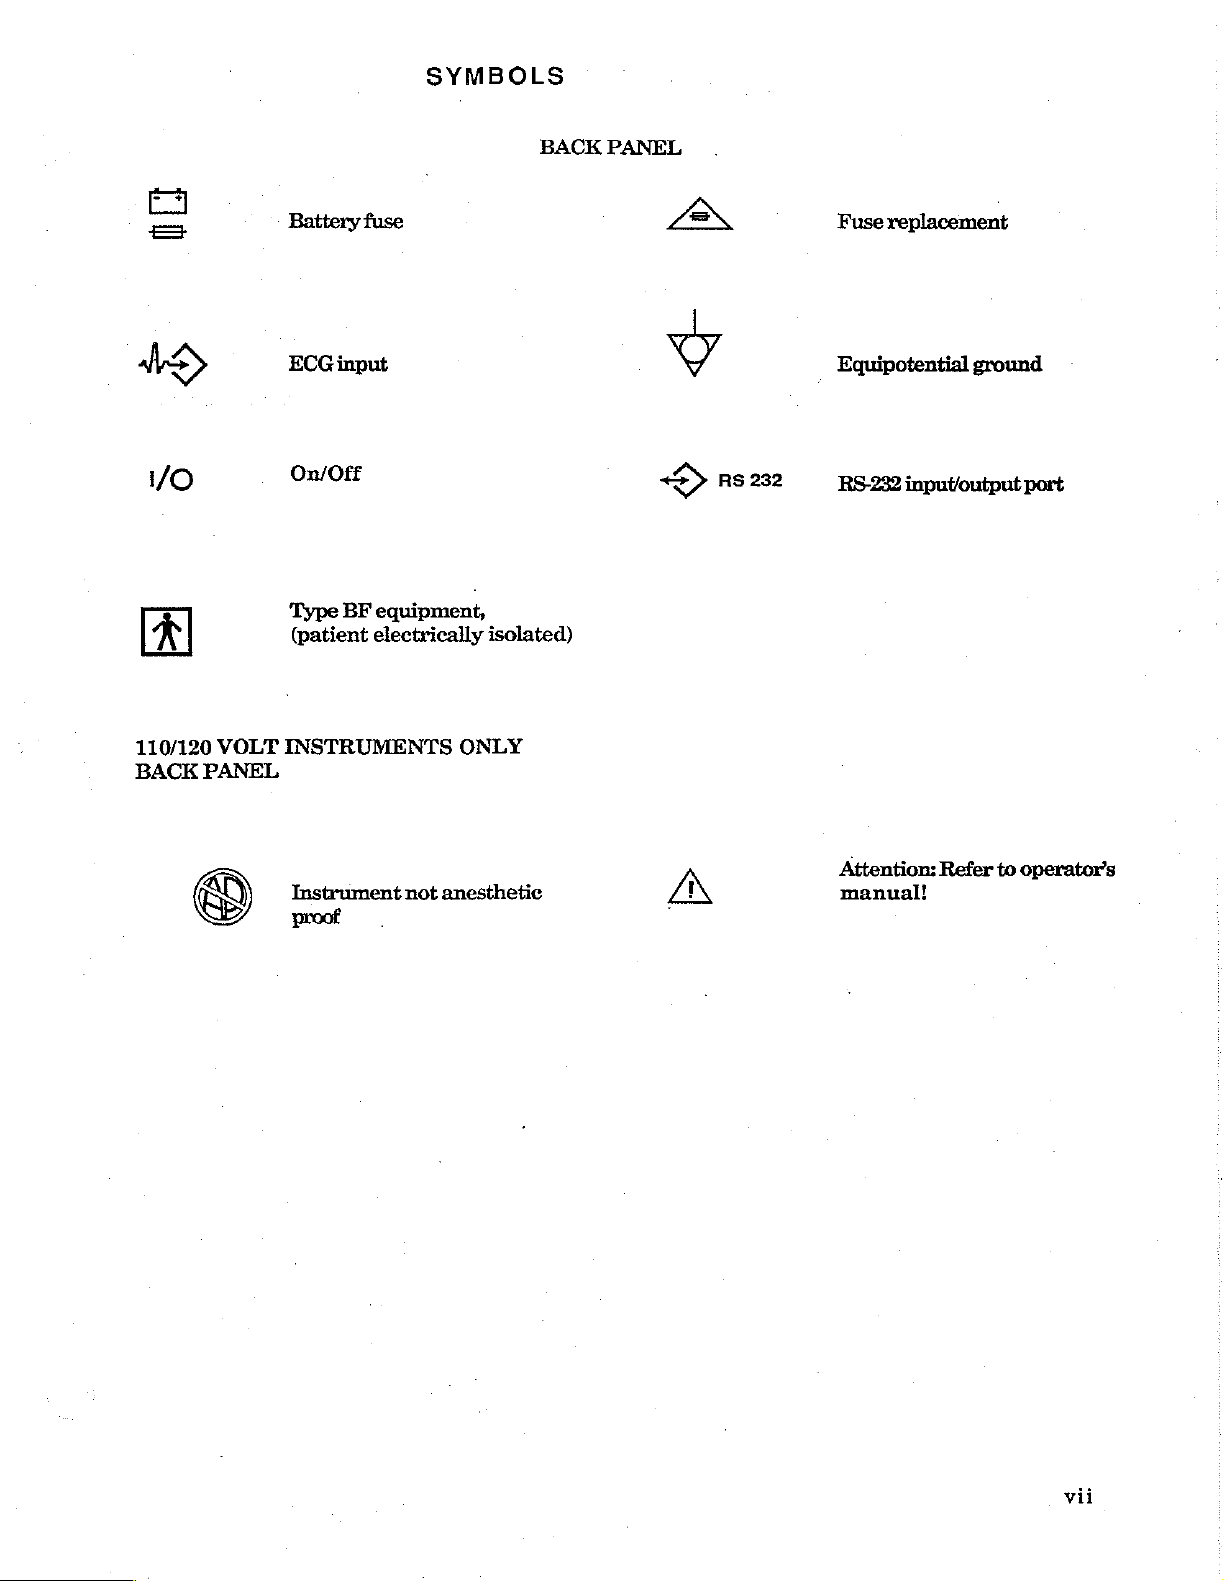
SYMBOLS
AS
=
MO
À
Battery
ECG
fuse
input
On/Off
BF
Type
(patient
equipment,
electrically
isolated)
BACK
PANEL
O
<>
RS232
Fuse
replacement
Eguipotential
RS232inputoutput
ground
port
110/120
BACK
VOLT
PANEL
INSTRUMENTS
Instrument
proof.
ONLY
not
anesthetic
VAN
Attention:
Refer
manual!
to
operator’s
vii
Page 8
WARNINGS
The
N-6000 contains
service
.
[For
The
from
connection,
must
be
protection
N-6000
is a patient-connected
potentially
the
no
performed
against
fire
dangerous
procedures
user-serviceable
by
qualified
hazard,
personnel.
replace
medical
electrical
and
potentials
part
specifications
parts.
fuses
device.
For
protection
only
Isolated
or
ground
contained
with
against
the
same
patient
paths.
in
this
electrical
type
and
connectors
To
protect
manual
rating.
protect
the
integrity
must
hazard,
the
be
adhered
all
patient
of
this
to.
viii
Page 9
1.1
INTRODUCTION
This
manual
and
capnograph,
personnel,
Note:
service
language
screen,
and
then
who
This
screens.
option
press
press
“LANGUAGE”
from
the
left.
or
“ENGLISCH.”
ㆍ
The
N-6000
time
monitoring
carbon
.
SpO2
SpO2
numerically,
shows
contains
information
model
have a technical
manual
the
If
to
Freeze
the
the
is
written
unit
English.
second
(LANGUE
Press
this
is a compact,
of
dioxide
is
noninvasively
sensors
(ETCO2),
which
while
the
patient’s
N-6000.
for
is
configured
To
reach
button
key
and
in
to
on
fourth
French
gain
oxygen
and
and
are
available
the
plethysmograph
relative
SECTION
I
Introduction
for
servicing
Service
of
this
background
an
N-6000
for
the
language
the
front
soft
keys
and
SPRACHE
access
microprocessor-controlled
saturation
respiratory
continuously
for a variety
pulse
strength
the
product
in
analog
configured
French
panel
from
to
the
language
(SpO2),
rate
measured
is
displayed
as
NELLCOR®
must
and
for
or
German,
selection
while
the
the
left
in
German)
pulse
(RR).
of
patient
measured
ULTRA
be
done
digital
by
electronics.
CAP™
qualified
English-language
the
technician
menu
main
at
selection
instrument
rate
using
from
monitoring
the
same
appears
(PR),
Nellcor's
sites.
the
time.
above
menu
and
used
for
inspired
reusable
SpO2
values
main
screen
The
CO2
as a waveform, A bar
by
the
pulse
oximetry
pulse
service
displays
must
and
change
monitoring
is
displayed,
legend
the
fourth
select
“ANGLAIS”
continuous
(ins.),
or
adhesive
are
displayed
graph
circuits.
oximeter
the
soft
key
real-
end-tidal
indicator
ㆍ
ETCOs
intubated
exhalation
This
manual
digital
N-6000
maintenance
12
Before
These
proper
WARNING:
service
Caution:
always
patient
operator’s
WARNINGS,
you
terms
operation
technician.
Cautions
in
boldface
Note: A note
is
determined
patient’s
is
is
intended
monitoring
or
repair.
read
the
identify
A
warning
gives
by
positioning
airway
displayed
for
(15
mm
numerically,
use
by
equipment.
manual
CAUTIONS,
N-6000
of
this
and
be
AND
service
information
instrument.
familiar
manual,
that
describes a condition
WARNINGS
are
describes a condition
type.
information
that
an
diameter).
while
authorized
Service
with
NOTES
it
pertains
that
always
warrants
that
in
may
infrared
The
CO2
is
service
personnel
instrument
is
important
to
technician
may
result
boldface
result
special
attention.
mainstream
amount
of
displayed
personnel,
must
have
operation
to
understand
and
in
injury
type
and boxed.
in
damage
CO2
sensor
CO2
present
as a waveform.
trained
read
patient
to
in
ahd
before
the
safety,
to the
the
instrument.
servicing
understood
attempting
following
patient,
across
at
the
and
an
end
of
analog
the
terms.
indicates
operator
Cautions
and
or
are
1-1
Page 10
1.3
DESCRIPTION
The
following
1.3.1
Visible
The
N-6000
.
C02
*
provides a qualitative
9
Trends
paragraphs
and
features
and
plethysmographic
are
displayed:
respiratory
ㆍ
When
the
switch, a battery
1.3.2
Audible
Indicator
describe
Audible
Indicators
numeric
displays
indication
acquired
SpO2
rate
for
trend
alone;
trends;
all
SpOz,
operator connects
charging
the
N-6000
of
SpO2,
waveform
of
pulse
parameters,
CO2
trend
CO2,
pulse
the
monitor
indicator
lights.
and
list
PR,
RR,
displays:
strength
and
the
alone;
rate,
to
AC
SpO2
and
power
important
and
ETCO2:
and a pulse
at
the
oximetry
following
and
CO2
respiratory
and turns
features.
amplitude
five
trend
trends;
rate
on
the
bar
sensor.
screens
pulse
trends.
rear-panel
graph,
can
rate
and
which
be
on/off
Pulse
pitch
decreases.
can
1.3.3
The
moves
apnea,
priority
the
button
ALARM
function
Note:
Note:
rate
of
this
watch
Visible
monitor
outside
or
of
alarm
alerts
SILENCE
disabled.
are
always
The
When
audible
1.3.4
A
Status
status
alarm
message
identified
and
tone
This. early
the
patient
and
has
when a sensor
the
alarm
temporarily. A flashing
the
operational.
SpO2
the
Messages
by a module
troubleshooting
oxygen
changes
warning
and
Audible
both
visible
an
adjustable
state.
operator
indicator
Visible
and
ETCO2
French
function
is
displayed
the
problem.
saturation
with
listen
are
indicated
variation
system
for
encourages
SpO2
in
changes
Alarms
and
limit
gets
disconnected.
Pressing
that
the
warns
alarms
numeric
language
audible
(operator-defined),
the
ALARM
alarm
that
appear
is
chosen
alarms.
The
ALARM
SILENCE
tone
one
on
indicators
and
disabled, a single tone
in
case
an
error
identifier
and
(See
an
error
section
VIII
audibly
SpO2,
tone
SILENCE
has
or
more
the
monitor
change
one
occurs
condition
code
for
with a tone
rising
prompt
as
saturation
corrective
simultaneously.
These
when
and
alarms
the
monitor
pattern
button
indicator
been
silenced
parameters
temporarily. A steady
sereen,
from
green
or
more
of
the
every
three
occurs.
number
more
that
information.)
that
increases
action
are
activated
detects
of
the
audible
turns
adjacent
have
had
and
unlike
to
red
parameters
minutes.
An
error
assists
signals
since
off
the
to
the
their
audible
when
condition
service
each
and
the
pulse.
falling
The
as
clinician
when a variable
loss
of
pulse
or
alarm
audible
ALARM
audible
depend
portion
SILENCE
ON
of
alarm
on
the
alarms,
an
alarm
have
had
personnel
the
will
occurs.
error
be
in
it
the
of
they
Page 11
1.3.5
Automatic
The
monitor
test
takes
that
the
allowing
45
seconds.
approximately
program
the
Self-Test
automatically
mainstream
If
an
error
“Troubleshooting,”
1.8.6
On-Screen
The
on-screen
at
the
bottom
function
MENU
1.8.7
The
Once
1.3.8
The
button
N-6000
N-6000
configured,
Trend
N-6000
memory
the
memory
memory
continues
key
can
can
while
Menus
menu
of
the
is
pressed,
to
display
Default
power-on
Memory
stores
be
viewed
is
full,
be
viewed
the
memory,
is
for
more
guides
screen
and
default
the
custom
up
to
in
the
oldest
on
trend
and
Warm-Up
performs a series
15
seconds
data
COz
after
memory,
sensor
to
detected, a status
information.)
the
operator
just
above
the
the
screen
the
top level
Custom
24
hours
30-minute,
the
data
displays a new
Default
settings
alarm
data
of
trend
are
limits
sereen
are
being
menu,
can
2-hour, 4-hour,
automatically
and
Time
of
the
operator
and
internal
warm.
The
message
—
through
four
function keys
or
to
Set-Up
be
customized
will
always
data
for
can
be
printed.
diagnostic
turns
circuitry
CO2
sensor
appears.
all
system
menu
return
with
to
according
be
CO2,
SpO2,
8-hour,
erased
printed
with a printer.
tests
when
on
the
are
warm-up
(Refer
functions.
that
are
additional
the
main
in
place,
pulse
12-hour,
as
new
turned
monitor.
These
functioning
time
to
Section
Menu
used
to
select
functions.
monitoring
to
institutional
even
after
rate,
and
or
24-hour
data
are
Patient
on.
The
system
tests
properly,
is
approximately
8,
items
an
are
item.
Press
screen.
requirements,
power-down.
respiratory
segments.
stored.
Data
monitoring
self-
confirm
while
displayed
When
the
rate.
Trend
When
stored
a
in
1.3.9
Automatic
The
SpO2
subsystem
the
system
is
turned
whenever a new
calibrated.
1.3.10
Battery
If
external
90
minutes
minutes
ㆍ
by
By
choosing
power
on
using
(including
w/BATTERY
displays
.
battery
When
AC
the
the
life.
the
MAINS
MENU
operator
Calibration
of
on
oximetry
Operation
is
lost
its
rechargeable
the
GRAPHICS
GRAPHICS
all
waveforms,
OFF,
only
the
numerical
GRAPHICS
power,
button
reapplies
the
N-6000
and
periodically
sensor
or
transportable
is
internal
w/BATTERY
messages,
the
display
values
w/BATTERY
the
display
to
turn
the
AC power
is
fully
thereafter.
connected.
operation
battery.
w/BATTERY
remains
of
option
will
only
GRAPHIC
to
the
self-calibrating.
It
Additionally,
The
capnography
is
necessary,
This
operating
power
ON
etc.)
will
blank
SpO2
is
blank
w/BATTERY
in
the
continue
during
and
ETCO2,
selected
when
saver
SYSTEM
battery
to
the
option
monitor.
is
calibrated
it
subsystem
the
N-6000
time
option.
menu,
to
operate.
This
allows
be
OFF
unit
transfers
ON.
automatically
is
recalibrated
of
can
can
be
extended
the
display
By
choosing
operation.
up
to
and
the
to
The
display
automatically
the
N-6000
operate
up
graphics
The
N-6000
180
minutes
unit
is
battery
returns
whenever
is
factory
up
to
to
180
GRAPHICS
of
operating
power.
Press
when
on
Page 12
1.3.11
Noninvasive
Oximetry
Sensors
Noninvasive
two
light-emitting
differences
infants,
1.3.12
children,
C-LOCK™
If a patient
quality
separate
signal
for
signals
from
synchronize
When
If
SIGNAL
N-6000
the
C-LOCK
ECG
LOST
is
not
NELLCOR
diodes
in
tissue
is
moving
thickness
and
adults.
ECG
Synchronization
or
measurements
that
reflect
the
ECG.
The
the
SpOz
measurements.
ECG
synchronization
signal
is
lost
symbol
being
used.
oximetry
(LEDs)
or
Refer
has
poor
of
oxygen
cardiac
N-6000
or
deteriorates
appears
on
sensors
as
light
sources.
skin
pigmentation.
to
specific
for
perfusion,
saturation.
activity:
uses
the
ECG
is
used,
to
the
the
display.
obtain
sensor
Pulse
C-LOCK
When
an
QRS
the
point
No
measurements
The
N-6000
Specific
directions
Oximetry
ECG
this
feature
optical
signal
complex
C-LOCK
that
symbol
it
IN
can
is
:
by
optical
adjusts
sensors
automatically
are
for
use
for
synchronization
is
used,
the
from
the
sensor
to
help
identify
USE
symbol
no
longer
displayed
be
if
used,
the
means
available
complete
can
enhance
N-6000
and
the
pulse
appears
the
C-LOCK
C-LOCK
alone,
using
for
for
neonates,
information.
signal
receives
an
electrical
and
on
the
display.
feature
of
two
the
Page 13
2.1
OVERVIEW
This
section
2.2
PULSE
The
N-6000
plethysmography.
sensor
photodetector.
920
nm).
The
photodetector
absorption.
With
each
hemoglobin
The
N-6000
hemoglobin
In
principle, a pulse
Absorption
both
wavelengths
describes,
OXIMETRY
oximetry
has two
When
low-voltage
One
the light
heartbeat, a pulse
differs
measures
that
is
also
in
subsystem
It
includes
LED
measures
from
red
is
saturated
oximeter
measured
results
general
SUBSYSTEM
light-emitting
emits
from
deoxygenated
and
in a value
terms,
is
based
an
‘electro-optical
red
light
the
LEDs
the
light
of
oxygenated
infrared
with
oxygen.
measures
when
pulsatile
SECTION
Principles
operating
on
the
diodes
(nominal
passes
that
hemoglobin
absorption
for
the
through
passes
arterial.blood
the
light
arterial
arterial
II
of
Operation
principles
principles
sensor
(LEDs)
through,
absorption
and a microprocessor-based
as
660
nm)
the
flows
in
its
to
determine
blood
oxygen
for
the
N-6000.
of
spectrophotometry
light
sources,
and
the
other
sensor
which
relative
is
saturation
to
by
tissues
in
the
the
site,
part
indicates
the
sensor
red
and
percentage
and
tissue.
(SpO2).
and
and
one
photodiode
emits
infrared
of
the
light
red
and
infrared
site.
Oxygenated
infrared
of
functional
nonpulsatile
The
ratio
module. The
as
(nominal
is
absorbed.
absorption.
blood.
of
absorption
a
at
2.2.1
C-LOCK
Through
identifying
during
When
an
complex
with
length
relationship
random
If
an
optical
C-LOCK
C-LOCK
patient
provided
optical
is
the
patient’s
of
the
motion.
ECG
pulse
ECG
signal
detected,
signal
ECG
Synchronization
ECG
the
pulse
and
movement
with
an
from
the
an
physiology
delay
is
relatively
is
used
to
identify
is
not
provided,
alone
is
used
synchronization
synchronization,
synchronizing
and
when
the
ECG
signal,
sensor
optical
and
to
determine
pulse
the
and
an
is
with
the
stable.
“good”
or
if
that
resumes
detected
Through
pulses
the
N-6000
SpO2
measurements.
patient’s
N-6000
electrical
at
location
and
signal
the
pulse
when
an
uses
an
perfusion
receives
signal
the
of
the
C-LOCK
reject
deteriorates
rate
adequate
is
two
from
sensor
sensor.
ECG
nonsynchronized
and
to
ECG
signal
This
poor.
signals
the
site.
The
However,
synchronization,
so
that
initiate
ECG
signal
as a reference
enhances
that
ECG. A short
length
it
can
saturation
is
signal
reflect
for a given
artifacts
no
cardiac
time
of
this
that
such
longer
measurements.
available.
point
quality
activity:
after a QRS
delay
varies
patient,
time
as
be
used,
for
the
-
the
2-1
Page 14
2.2.2
Automatic
The
oximetry
calibrated
connected.
differences
Each
sensor
determined
calibration
obtained
2.2.3
by
Functional
Calibration
subsystem
each time
Also,
the
in
tissue
is
calibrated
and
encoded
resistor
that
sensor.
versus
incorporates
it
is
turned
intensity
of
thickness
when
into a calibration
to
determine
Fractional
automatic
on,
at
periodic
the
sensors
and
pigmentation.
manufactured:
resistor.
the
appropriate
Saturation
calibration
intervals
LEDs
is
the
effective
calibration
thereafter,
adjusted
The
instrument’s
mechanisms.
and
automatically
mean
wavelength
coefficients
It
is
automatically
whenever a new
to
compensate
of
the
software
for
reads
the
measurements
red
this
sensor
for
LED
is
is
Because
those
expressed
N-6000
functional
the
N-6000
of
instruments
as a percentage
uses
two
SaO2.
carboxyhemoglobin
In
contrast,
Oximeter
measured
Measured
Consequently,
other
measurements
some
report
hemoglobin,
dysfunctional
to
instrument
can
functional
2.2.4
Measured
When
oxygen
saturation
(PaO2),
because
the
relationship
carbon
dioxide
the
versus
the
calculated
between
(PaCO2),
measures
that
measure
of
wavelengths,
It
does
not
or
methemoglobin.
laboratory
fractional
SaQ2-—~oxygenated
whether
hemoglobins
directly
must
measure
be
converted
compare
saturation
Calculated
is
calculated
calculated
saturation
PO2
the
functional
the
hemoglobin
it
measures
detect
instruments
or
not
N-6000
functional
using
=
100 — (%carboxyhemoglobin + %methemogiobin
SaO2,
fractional
SaO2.
that
oxygenated
significant
such
that
hemoglobin
are
included.
measurements
SaO2.
the
following
it
may
produce
Functional
is
capable
and
amounts
as
the
of
Instrumentation
hemoglobin
is
If
it
measures
equation:
fractional
measurements
SaQ2
of
transporting
deoxygenated.
dysfunctional
expressed
available
with
those
fractional
saturation
Saturation
from a blood
value
may
may
and
saturation
concentrations
not
gas
measurement
differ
from
have
been corrected
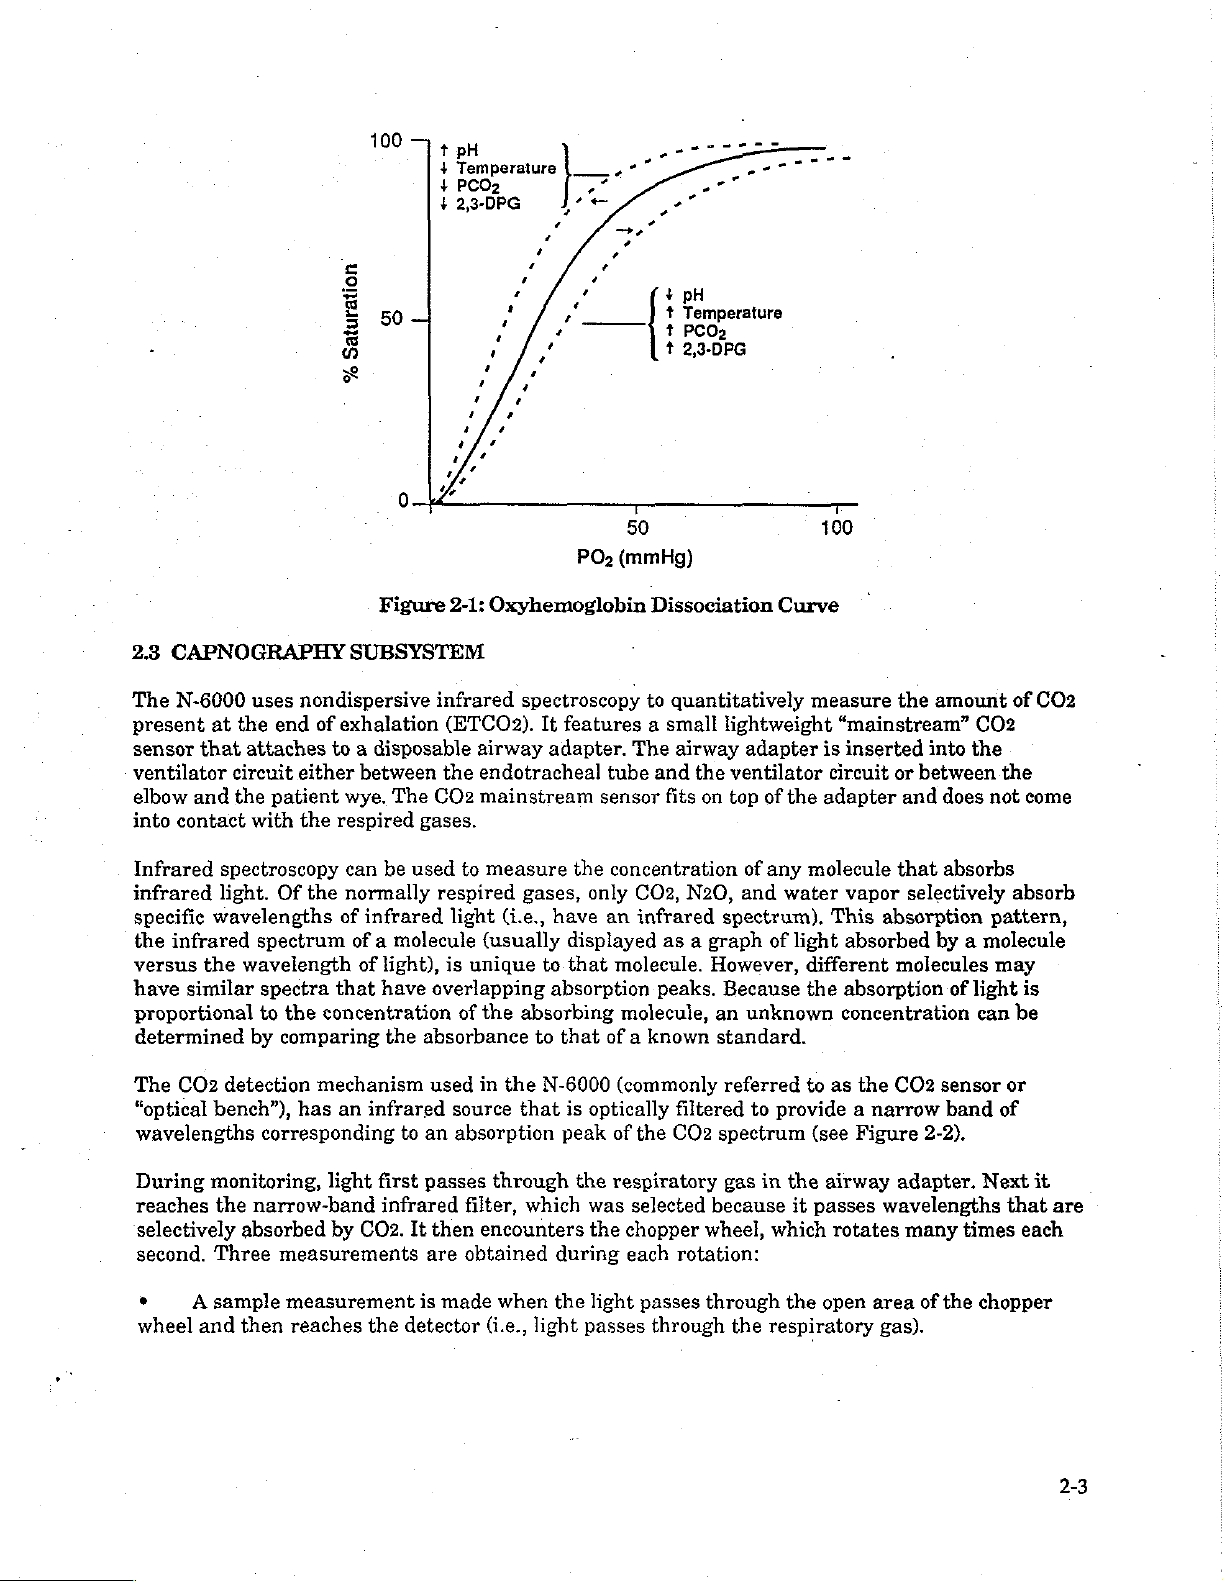
(Figure
of
2,3-DPG
the
N-6000
2-1):
temperature,
and
of
the
SpO2
for
fetal
is
oxygenated
oxygen.
hemoglobin,
hemoglobin,
Laboratory
as a percentage
for
oxygen
of
another
Sa02,
~
partial
pressure
measurement.
the
effects
pH,
of
the
hemoglobin.
that
differ
hemoglobin
Because
yielding
such
282
CO-
of
all
transport.
instrument,
those
x
of
arterial
This
variables
partial
that
pressure
from
the
as
that
is
shift
of
2-2
Page 15
100
—
pH
t
Temperature
+
PCO2
+
+
2,3-DPG
=
ο
я
504
5
©
.
の
a
+
VA
0
ifs
4
+
+
nf.
+
7
の
;
+
4
e
+
+
“e
¿e
΄
+
7
+
.
e
+
e
è
>
e
.”
>.
+
„==
„>“
ㆍ
+
+
+
+
|
est
n°
pH
Temperature
PCO2
2,3-DPG
50
PO:
(mmHg)
=.
100
2.3
CAPNOGRAPHY
The
N-6000
present
sensor
ventilator
elbow
into
Infrared
infrared
specific
the
versus
have
at
the
that
circuit
and
the
contact
spectroscopy
light.
wavelengths
infrared
the
similar
proportional
determined
The
CO2
detection
“optical
bench”),
wavelengths
During
reaches
selectively
second.
monitoring,
the
absorbed
Three
uses
nondispersive
end
of
exhalation
attaches
to a disposable
either
patient
with
Of
the
respired
the
wye.
can
normally
of
spectrum
wavelength
spectra
to
by
that
the
concentration
comparing
mechanism
has
an
corresponding
light
narrow-band
by
measurements
Figure
2-1:
SUBSYSTEM
infrared
(ETCO2).
between
infrared
of a molecule
of
have
infrared
first
infrared
0602.
the
The
CO2
gases.
be
used
respired
light),
is
overlapping
the
absorbance
used
to
an
passes
It
then
are
to
light
of
source
absorption
Oxyhemoglobin
spectroscopy
It
features a small
airway
adapter.
endotracheal
mainstream
measure
gases,
(i.e.,
have
(usually
unique
to.
absorption
the
absorbing
to
that
in
the
N-6000
that
peak
through
filter,
which
encounters
obtained
during
Dissociation
to
The
tube
sensor
the
concentration
only
CO2,
an
infrared
displayed
that
molecule.
molecule,
of a known
(commonly
is
optically
of
the
the
respiratory
was
selected
the
chopper
each
quantitatively
lightweight
airway
and
fits
as a graph
peaks.
filtered
CO2
rotation:
the
ventilator
on
top
N20,
and
spectrum).
However,
Because
an
standard.
referred
spectrum
gas
because
wheel,
adapter
of
of
any
of
unknown
to
in
Curve
measure
the
“mainstream”
is
inserted
circuit
the
adapter
molecule
water vapor
This
light
different
the
to
as
provide a narrow
(see
the
airway
it
passes
which
rotates
or
and
that
selectively
absorption
absorbed
molecules
absorption
concentration
the
CO2
Figure
adapter.
wavelengths
many
amount
of
CO2
into
the
between
by a molecule
sensor
2-2).
does
not
absorbs
pattern,
may
of
light
can
band
Next
times
the
absorb
be
or
of
that
CO2
come
is
it
are
each
ο
wheel
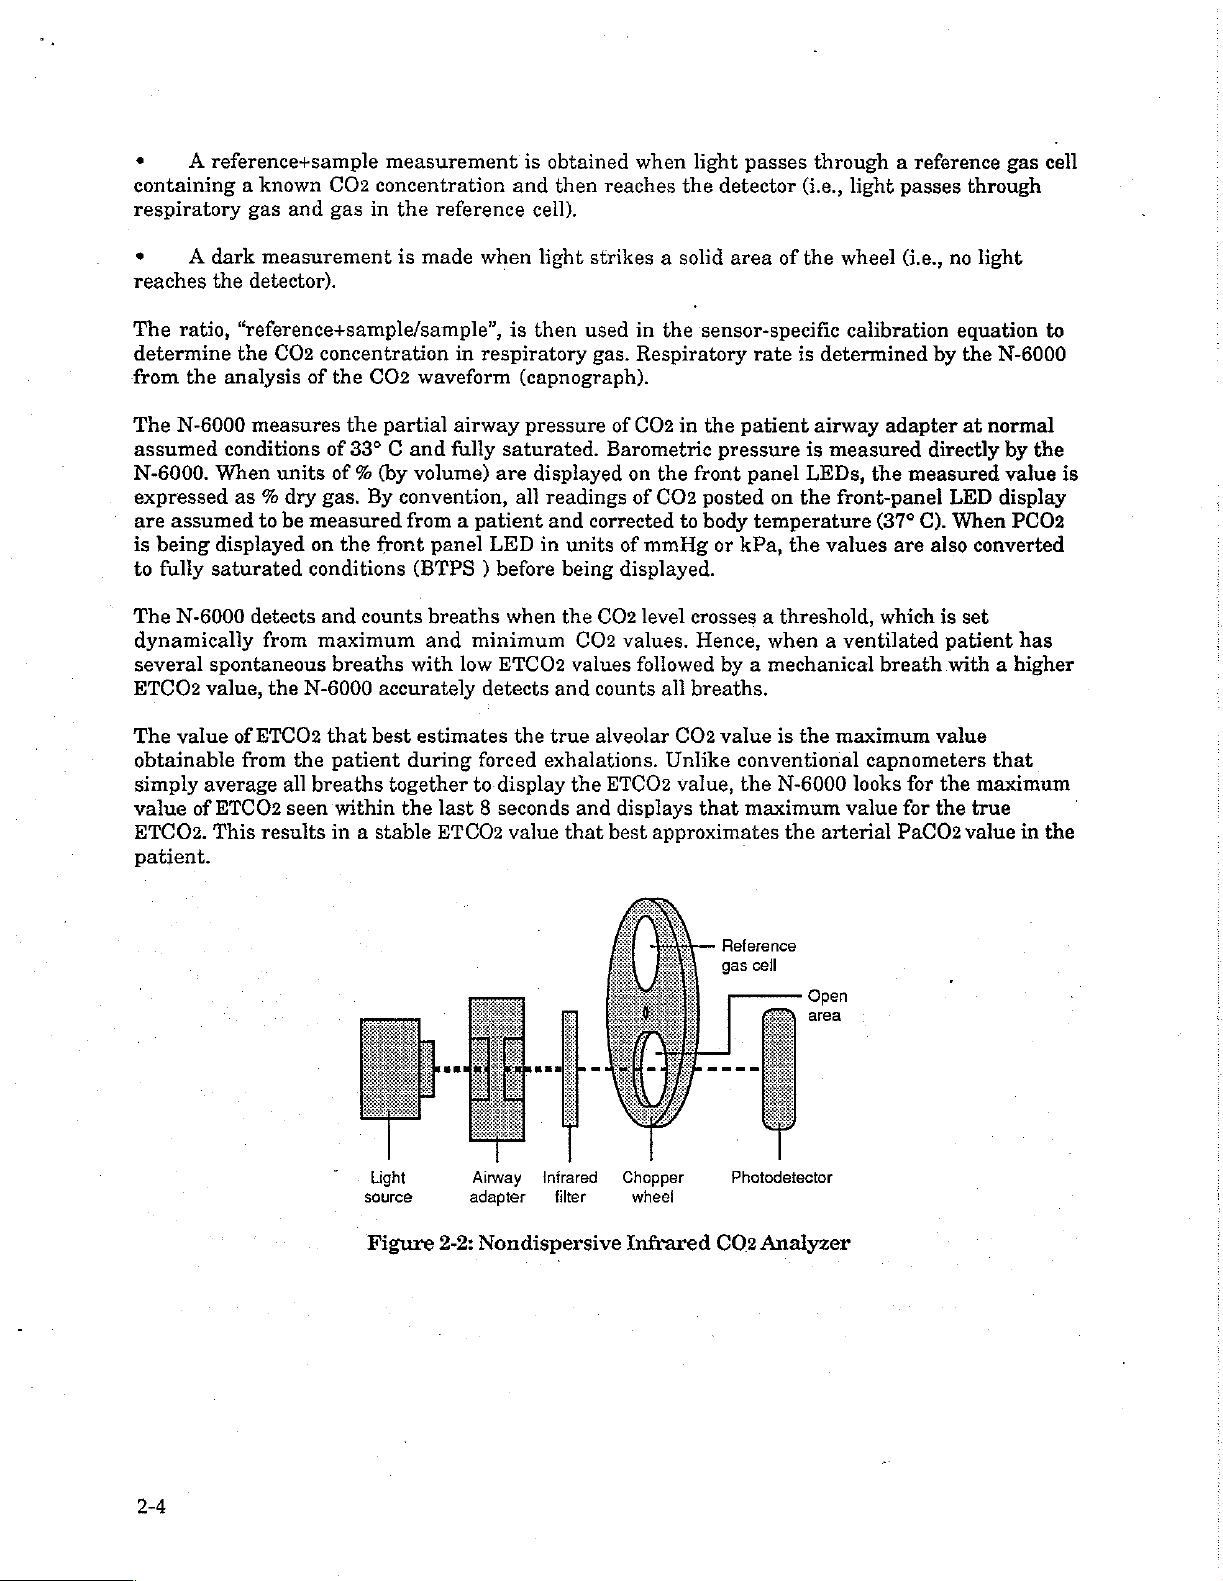
A
sample
and
measurement
then
reaches
the
is
made when
detector
(i.e.,
light
the
light
passes
passes
through
through
the
the
open
respiratory
area
gas).
of
the
chopper
Page 16
.
A
reference+sample
containing a known
respiratory
ㆍ
A
reaches
The
ratio,
determine
from
the
The
N-6000
assumed
N-6000.
expressed
are
assumed
is
being
to
fully
The
N-6000
dynamically
several
ETCO?
The
value
obtainable
simply
value
ETCO2.
patient.
gas
and
dark
measurement
the
detector).
“reference+sample/sample”,
the
CO2
analysis
measures
conditions
When
displayed
saturated
spontaneous
value,
average
of
ETCO2
This
units
as % dry
to
be
detects
from
the
of
ETCO2
from
the
all
seen
results
measurement
CO2
concentration
gas
in
the
is
concentration
of
the
CO2
the
partial
of
33° C and
of % (by
gas.
By
convention,
measured
on
the
conditions
and
maximum
breaths
N-6000
that best
patient
breaths
within
in a stable
from a patient
front
counts
with
accurately
during
together
the
is
obtained
and
reference
made when
in
waveform
airway
fully
volume)
panel
(BTPS ) before
breaths
and
minimum
low
estimates
last 8 seconds
ETCO2
cell).
light
is
then
respiratory
(capnograph).
pressure
saturated.
are
displayed
all
readings
and
LED
in
when
ETCO2
detects
the
forced
to-display
exhalations.
value
when
then
reaches
strikes a solid
used
in
gas.
Respiratory
of
CO2
Barometric
on
of
corrected
units
of
being
displayed.
the
COz2
level
CO2
values.
values
and
true
the
and
that
followed
counts
alveolar
ETCO2
displays
best
light
passes
the
detector
area
the
sensor-specific
rate
in
the
patient
pressure
the
front
panel
CO2
posted
to
body
mmHg
crosses a threshold,
Hence,
all
breaths.
CO2
Unlike
value,
that
approximates
on
temperature
or
kPa,
when a ventilated
by a mechanical
value
conventional
the
maximum
through a reference
(i.e.,
light
passes
of
the
is
determined
airway
is
measured
LEDs,
the
the
values
is
the
N-6000
the
arterial
wheel
front-panel
maximum
(1.9.,
calibration
adapter
the
measured
(37°
C).
are
which
breath
capnometers
looks
for
value
for
PaCO
gas
through
no
light
equation
by
the
N-6000
at
normal
directly
also
is
value
the
the
by
value
LED
display
When
patient
with a higher
PCO2
converted
set
has
that
maximum
true
value
in
cell
to
the
is
the
2-4
Light
source
Figure
2-2:
!
Airway
adapter
Nondispersive
Infrared
filter
Chopper
wheel
Infrared
Reference
gas
cell
Open
area
Photodetector
CO2
Analyzer
Page 17
24
N20/O2
COMPENSATION
Unless
affect
To
oxide
screen
The
oxide
in
20%
for
The
provides
there
The
provides
there
Finally,
barometric
changes.
compensated
the
ensure
with
menu
N-6000
and
O2
beyond
of
increase
every
first
is
zero
second
is
zero
barometric
the
the
for,
measurement
accurate
oxygen; and
measurements,
selections.
is
calibrated
20%
oxygen.
the
reference
in
O2.
20%
increase
compensation
necessary
error
under
compensation
correction
error
under
pressure
pressure
require
elevated
of
the
concentration
(2)
high
for
low O2
This
is
the
state
An
increase
in
N20.
level
assumes
correction
these
level
factor
for
these
changes
no
levels
the
N-6000
oxygen.
compensation,
default
decreases
in
N20
50%
factor
assumed
assumes
high
levels
assumed
also
user
intervention;
of
oxygen
of
Compensation
mode
the
increases
nitrous
for
high
conditions,
0%
nitrous
conditions.
affect
(O2)
CO2
by a collision
provides
which
where
displayed
oxide
levels
of
O2.
Once
measured
the
and
nitrous
two
levels
levels
COMP. = OFF.
the
of
oxide
N-6000
are
assumes
CO2
value
displayed
and
50%
N20.
and
60%
again,
CO2
automatically
oxide
(N20)
broadening
of
compensation:
user
selectable
the
reference
In
the
by
1.5%
of
CO2
value
oxygen.
When
oxygen. Selecting
when
values.
Selecting
this
correction
this
correction
However,
adjusts
in
the
effect.
via
state
N-6000,
reading
by
1.6%
changes
airway
(1)
nitrous
display
of
0%
nitrous
an
increase
for
every
of
reading
COMP. = N20
is
applied,
COMP. = O2
is
applied,
in
for
these
The
following
conditions,
2.4.1
Standard
The
accuracy
CO2
in
balance
38
mmHg),
errors
2.4.2
Ambient
energy
barometric
CO2
additional
from
mmHg
are
Pressure
barometric
exchanged
values
the
standard
for
paragraphs
as
pertains
Gas
specifications
air
and a barometric
required
Broadening
pressure
reported
residual
every
to
Conditions
(21%
O2),
for
barometric
pressure
in
molecular
is
automatically
on
both
errors
reference
5000-foot
contain
N-6000
for
Compensation
may
change
further
operation.
the
N-6000
at
airway
pressure
pressure
affects
collisions
the
main
be
observed
state
of
in
in-depth
refer
conditions
of
760
(altitude),
measured
alters
measured
monitoring
when
760
mmHg
altitude.
discussion
to
the
following
of
33
°C,
fully
mmHg.
CO2
the
Additional
N20,
02,
by a “pressure
absorption
and a compensation
screen
testing
(sea
level).
spectrum
and
the
reference
These
of
compensation
standard
saturated
corrections
and
broadening”
service screen.
gases
amount
conditions:
(water
water
vapor.
of
is
automatically
at
to
and
standard
test
vapor
and/or
CO2.
pressures
approximately
residual
effect,
In
the
applied
However,
gas
is
pressure
in
which
N-6000,
to
different
+0.5
of
2-5
Page 18
2.4.3
N20
Collision
Broadening
Nitrous
“collision
absorption
eliminate
causes
standard
correct
both
mixture
2.4.4
Oxygen
exchanged
causes a decrease
Oxide
an
(N2O)
broadening”
spectrum
any
direct
increase
in
can
affect
effect
in
of
CO2.
The
absorption
measured
conditions. A software-selected
for
high
N20,
assuming a gas
the
N-6000
if
O2
Collision
(02)
the
02
can
in
molecular
main
monitoring
compensation
Broadening
affect
the
CO2
collisions
in
measured
conditions. A software-selected
high
O2,
assuming a gas
main
monitoring
compensation
2.4.5
Water
Water
vapor
respiratory
water
N-6000
are
to
vapor
is
calibrated
automatically
verify
calibration,
sereen
option
Vapor
also
has
gas
is
(with a vapor
composition
and
the
is
selected.
Effect
an
effect
at
standard
pressure
to
include
compensated,
CO2
values
airway
the
CO2
measurement
which
of
CO2
energy
infrared
infrared
of
approximately
exchanged
narrow
energy
(user-selectable)
composition
screen
option
measurement
alters
CO2
and
on
is
selected.
the
absorption
of
approximately
by a “collision
(user-selectable)
of
60%
O2
(0%
service
on
CO2
sereen
measurements.
conditions
of
38
mmHg)
this
effect,
while those
reported
and
on
CO2
on
the
by
bandpass
by
of
50%
the
service
-0.75%
02
compensation
N20).
are
compensated
of
33°C,
causes
values
the
service
service
both
in
filter
N20.
+0.8%
N20
N20
screen
spectrum
CO2
In
normal
fully
an
increase
reported
screen
screen
direct
absorption
molecular
used
in
However,
per
10%
increase
compensation
and
50%
are
compensated
broadening”
of
CO2.
per
10%
increase
option
values
for
use,
this
reported
it is
saturated.
in
on
the
are
not.
should
be
of
collisions
the
N-6000
N20
collision
in
option
O2.
CO2
values
effect
O2
collision
in
is
provided
on
gas
mixture
assumed
Under
measured
main
If
applying a dry
used
for
infrared
alters
is
chosen
the
broadening
N20
from
is
provided
reported
for
this
in
which
broadening
O2
from
to
correct
both
the
if
the
that
these
conditions,
CO2
of
6%.
monitoring
comparison.
and
by
to
on
gas
energy
standard
for
N-6000
O2
The
screen
test
gas
a
to
2.4.6
BTPS/ATPS
The
N-6000
temperature
adapter
barometric
conversion
fully
is
measured
pressure.
to
saturated
screen values
2.4.7
Summary:
CO2
water
a
dry
also
CO2
water
values
test
applied
values
reported
vapor
gas
reported
vapor,
Compensation
assumes
and
deep
that
measured
pressure
fully
at
33
°C,
By
convention,
lung conditions
with a water vapor
do
not
have
these
Reported
correction).
is
present
to
the
service
and,
if
CO2
on
the
That
in
the
screen
on
the
selected,
saturated
fully
saturated
of
pressure
corrections
Values
service
is,
CO2
airway
values.
main
monitoring
N20
and
respiratory
(ATPS).
with a water
CO2
values
body
temperature
of
47
applied.
on
the
Main
screen
are
values
adapter
reported
(at
screen
O2.
gases
are
That
is,
vapor
are
reported
and
mmHg,
at
Monitoring
uncorrected
on
the
25
°C).
Corrections
have
at
standard
it
is
assumed
pressure
on
the
pressure
ambient
and
for
BTPS/ATPS
service
all
corrections
airway
that
of
38
main
monitoring
fully
saturated
barometric
Service
screen
for
Screens
are
N20
applied:
conditions
the
gas
in
mmHg,
at
(BTPS):
pressure.
conditions
accurate
and
Oz,
if
BTPS/ATPS,
of
airway
the
airway
ambient
screen
after
37
Service
(including
assuming
selected,
°C,
are
Page 19

2.5
FACTORY
Each
CO2
sensor
temperatures.
components
calibrated
automatically
and
over
CALIBRATED
is
individually
The
N-6000
electronics
multiple
compensated
temperatures,
SENSOR
factory-calibrated
sensor
is
at a known
by
temperature
over
temperature-regulated
constant
so
that
temperature.
any
deviation
calibration
coefficients
multiple
to
42
°C,
Additionally,
from
gas
concentrations
which
the
42
°C
stored
keeps
the
the
sensor
set-point
with each
and
sensor
is
is
sensor
multiple
optical
factory-
unit.
Page 20

Page 21
3.1
INTRODUCTION
This
section
provides
details
of
circuit
SECTION
Circuit
operation.
Analysis
Refer
HI
to
Figure
3-1,
the
overall
bleck
diagram.
i
Oximetry
Sensor
Heater/Motor/IR
CO,
Sensor
LED
Drive
Output
Sensor
Output
Drive
Source | Module
Sensor
Analog
Oximetr
>
>
Mo.
tule.
CO»
Optical
Isolators
»
Serial
Data
isolated
DC
T
i
・
Serial
|
1
|
Power
1
1
I
.
Data
>
Charger
Power
Transformer
Main
Processor
Battery
and
Supply
Å
AC
Isolated
Audio
isolated
Power
Signals
Keyboard
y
Display
—|
Battery
>
>
speaker
|
Serial
Loud-
Port
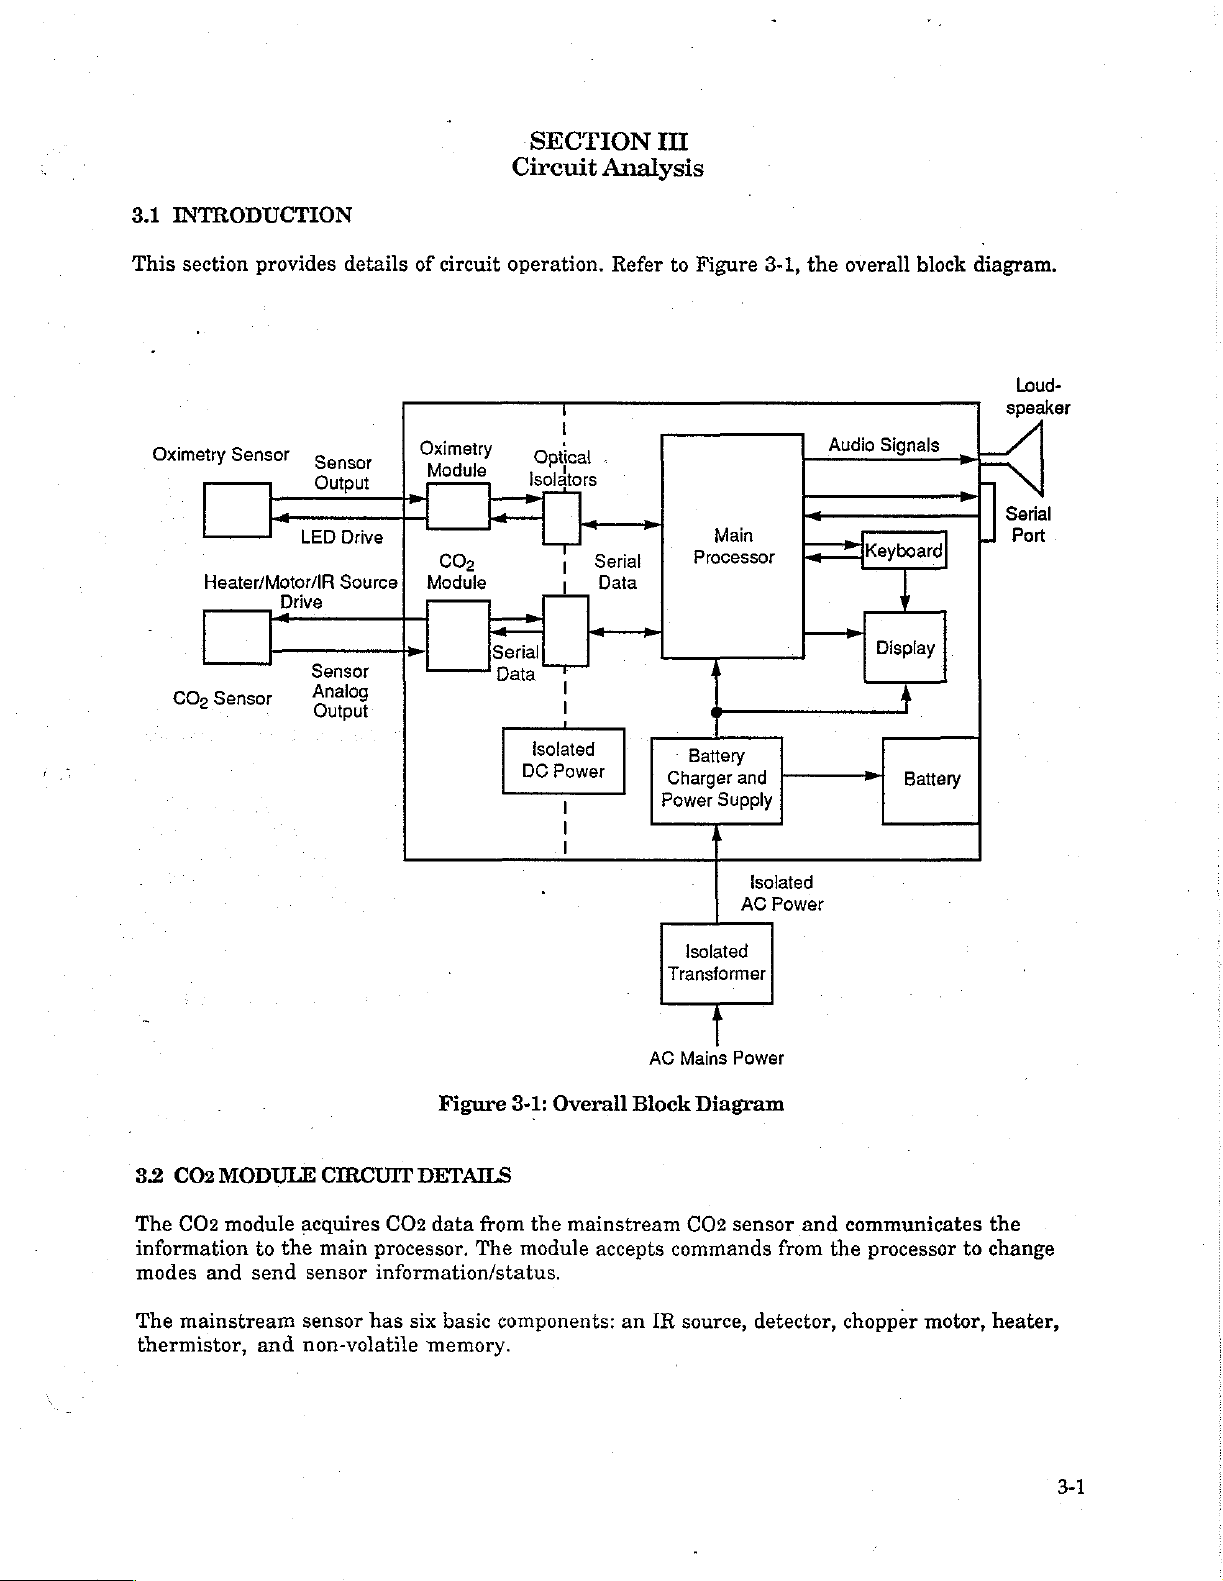
3.2
CO2
MODULE
The
CO2
module
information
modes
The
thermistor,
and
mainstream
acquires
to
the
send
sensor
sensor
and
non-volatile
Figure
CIRCUIT
main
DETAILS
CO2
data
processor,
information/status.
has
six
basic
memory.
3-1:
Overall
from
the
The
module
components:
AC
Block
mainstream
accepts
an
IR
Mains
Power
Diagram
CO2
sensor
commands
source,
and
from
the
detector,
communicates
processor
chopper
motor,
the
to
change
heater,
Page 22
3.2.1
Sensor
Operation
The
IR
source
based
on
components: a filter,
The
filter
frequency,
other
molecules
The
airway
tube
and
within
The
path
The
energy
The
can
third
The
the
chopper
as
second
to
detector
be
determined
(dark)
CO2
condensation
because
the
allows
the
gas
the
sensor's
wheel
the
wheel
phase
pass
phase
sensor
the
sensor’s
amount
emits
energy
of
the
only
attenuation
normally
sample
ventilator
light
is
rotates.
is
an
to
the
detector.
output
is
by
provides a zero
temperature
from
forming
output
that
is
energy
energy
it
receives.
airway
gas
of a wavelength
effects
present
is a disposable
circuit.
The
path.
split
into
three
The
first
opening
sampled
comparing
during
is
elevated
on
the
is
affected
providing
the
directed
sample,
due
to
the
in
respired
airway
sensor
sections
phase
each
change
reference
to
airway
by
toward
In
the
the
light
path
and a chopper
within
presence
the
of
gas.
adapter
clips
or
to
phases
the
that
airway
has a reference
no
attenuation.
phase.
in
42°
windows,
temperature.
The
detector
for
recalibrating
C.
There
and
detector.
The
between
the
wheel.
CO2
absorption
CO2
molecules
is
inserted
adapter,
that
are
presented
cell
filled
The
third
amount
output
are
of
CO2
from
the
detector.
two
reasons
to
maintain a stable
detector
are
generates a voltage
source
band
and
to
much
between
putting
the
sequentially
with a known
phase
phase
is
present
one
for
doing
dark,
in
to
detector
detector
pass.
At
greater
the
endotracheal
respired
to
amount
allowing
the
gas
phase
this:
two.
to
temperature
are
this
than
for
gas
the
light
of
CO2.
no
sample
The
keep
three
The
sensor
maximum
sensor
requires
As
the
3.2.2
The
CO2
and
barometric
3.2.3
The
module
stored
with
EEPROM
waveform.
its
internal
power-up
available
reaches
some
motor
CO2
Module
module
Digital
in
U600.
the
main
U608,
EEPROM
A/D
determination
sequence
heater
temperature,
current;
reaches
speed,
Hardware
has
six
pressure
is
controlled
The
microprocessor
processor.
and
the
U603
converter
in
other
is
optimized
output
by
disabling
main
the
heater
the
heater
sections:
can
the
be
is
heater,
is
digital,
transducer/amplifier.
by
U602,
an
80C552
uses
The
microprocessor
sensor
sections
EEPROM.
stores
to
determine
of
calibration
sensor
the
hardware.
to
keep
power
varied
in
software
temporarily
the
demands
re-enabled,
motor
microprocessor,
its
on-board
communicates
The
external
constants
temperature,
©
supply
to
disabled,
followed
control,
serial
port
A/D
for
the
loading
match
on
by
the
and
the
the
power
activation
signal
amplifier,
running
te
communicate
serially
to
converter
module.
barometric
to a minimum.
power
motor
is
supply
of
the
available.
started.
IR
heater,
at
11
MHz.
A/D
converter
is
used
to
digitize
The
microprocessor
pressure, and
The
As
the
This
are
minimized.
source.
source
The
program
asynchronously
U605,
the
sensor
uses
fault
is
3-2
Page 23
3.2.4
Motor
The
sensor’s
The
sense
signal.
motor.
signal
processor
3.2.5
Signal
The
“bench”
output
A/D
converter. A positive
microprocessor
to
the
3.2.6
Heater
The
heater
The
FET
the
sensor
temperature
regulate
inhibited
active
processor’s
Control
chopper
coil
is
This
signal
The
motor
to
regulate
via
the
Amplifier
hybrid
and
bias
to
sensor
which
output
signal
is
converted
by
it
to
42°
by a comparator
as
the
sensor
internal
motor
amplified
is
control
the
MTRGATE
circuit
the
detector
used
hybrid
speed
consists
to
generate a synchronized
by
to
U607
properly,
bias
set
the
operating
servos
consists
is
filtered by
the
of a PWM
L600
to a proportional
the
microprocessor. The
C.
As a safety
circuit
temperature
A/D
converter
of
two
the
processor
controls
the
equivalent
signal.
contains
so
that
voltage
is
point
sensor
signal
signal
and
C614
software
precaution,
monitoring
reaches
for
fault
fixed
coils
for
synchronizing
the
amplitude
of a 30
the
necessary
its
output
applied
of
to
the
photodetector. A negative
to
be
from
before
voltage
by the
regulates
the
PWM
the
48°
C.
The
determination.
on
the
stator
drive
voltage,
of
the
ms
period.
circuitry
is
zero-referenced
the
sensor
referenced
the
processor
being
to
applied
bench
the
output
feeding
temperature
heater output
and
three
magnets
and
to
processor
drive
The
to
activity
signal
motor
amplify
derived
can
the
and
using a filtered
bias
zero
volts.
switching a FET
to
the
heater.
hybrid.
power
voltage,
This
applied
the
heater
this
voltage
voltage
override
is
available
on
the
rotor.
generate a motor
to
the
chopper
from
the
sense
be
disabled
sensor
in
the
PWM
voltage
power
The
is
to
the
output
by
the
detector
range
for
the
output
is
from
also
applied
transistor.
temperature
translated
sensor
can
will
to
to
be
become
the
clock
the
in
to
a
3.2.7
Source
A
current
located
source
regulator
in
the
voltage
determination.
3.2.8
Barometer
The
barometer
achieved
The
the
3.2.9
On
reset
turns
by
sensing
transducers
processor's
Status
LEDs
power-up,
and
the
on,
indicating a sensor
temperature,
LED
is
turned
Ifthe
CO2
module
exists,
the
RED
formed
sensor.
is
brought
circuit
by
The
source
back
generates a voltage
voltage
differential
internal
the
initialization
allowing
off,
LED
green
and
is
not
will
A/D
LED
sequence
the
sensor
the
green
receiving
flash
U615
and
is
controlled
to
the
microprocessor's
variations
voltage
is
converter
flashes
five
is
warm-up
to
start
LED
is
commands
at a rate
R645
provides constant
by the
proportional
at
the
pressure
amplified
for
translation
times
momentarily,
taking
place.
condition.
measuring.
turned
on.
from
of 2 Hz.
microprocessor
internal
to
the
transducer
and
zero-referenced
to a barometric
After
the
The
light
remains
When
the
main
the
processor,
current
A/D
of
via
Q608
converter
atmospheric
with a constant
before
pressure
indicating
green
sensor
LED
on
is
that
until
or a sensor
83.3
mA
and
for
pressure.
being
reading.
the
flashes,
the
ready
to
to
the
IR
Q606.
The
fault
This
is
current
presented
processor
the
red
sensor
reaches
measure,
fault
condition
source
applied.
to
has
LED
the
red
Page 24

Ifthe
COz
Ifthe
COz
LED
flashes
3.2.10
LED
module
module
at 2 Hz.
Status
has
no
finds
an
Summary
sensor
internal
connected
fault
to
it,
during
the red
LED
flashes
initialization,
the
at 1 Hz.
green
LED
is
on,
and
the red
Green
Réd
Green
Red
Red
Red
3.3
The
LED
flash
LED
on
LED
on
LED
flash 1 Hz
LED
flash 2 Hz
LED
flash,
OXIMETRY
following
Green
MODULE
discussion
blocks. A detailed
3.3.1
Oximetry
The
module
signal,
and
circuits
The
referred
pulse
in
following
blocks. A more
circuits
of
Module
drives
rate
values
the
host
discussion
detailed
the
module
to
on
BLOCK
is
an
discussion
the
oxygen
as
the
“SAT“
presented
system
for
is
given
discussion
can
be
Reset,
Sensor
Sensor
Sensor
No
System
DIAGRAM
overview
of
major
transducer
signal,
on
the
display
divided
as
of
and
an
each
into
Initialization
Warming
Active
Disconnect,
Communications
Fault
ANALYSIS
of
the
oximetry
functional
and
is
conditioned
monitor.
for
overview
circuit
the
circuit
conditions
This
external
of
block
following
Condition
(Measuring
Condition
or
Condition
module
blocks
the
signal
and
used
information
output
the
module
is
given
major
CO2)
Sensor
and
is
given
Fault
identifies
in
derived
to
derive
is
saturation
serially
conditioning.
and
identifies
in
the
following
functional
blocks:
Condition
major
paragraph
from
the
percentage
coupled
to
major
paragraphs . The
circuit
3.4.
patient.
processing
circuit
This
ο
0ο
0ο 96
9 9
4
LED
Driver
Sensor
Input
Source
Input
A:D
Amplifier
Filters
Conversion
Support
Assembly
Selection
and
Cireuits
|
Synchronous
Detector
Page 25

Refer
these
to
Figure
circuit
3-2,
blocks.
“Oximetry
Module
Overall
Block
Diagram,”
for
the
logical
relationship
of
Functional
absent
personnel
similar
when
from
in
necessary.
・
En
Power
Option
Selector
Host
Power
Communications
Configuration
Jumpers
circuit
the
quick
layout
JP4
JP5
and
102
block
diagrams
circuit
understanding
to
the
Host
、
Power
`
or
grouped
schematic
κ
Support
Circuits
»
Comm
|:
Converter
Red_ADC
IR_ADC
Figure
3-2:
may
into
of
overall
diagrams
Lines
A:D
Filters
Oximetry
employ a technigue
functional
circuit
ーー
Red
IR
sub
operation.
to
facilitate
Data
and
blocks.
tracing
Control
Module
Overall
Circuit
where
|
id
Saturation
some
components
This
is
intended
These
simplified
signals
LED
Driver
Input
Amplifier
and
Synchronous
Detector
Signal
Input
Source
Selection
Block
Diagram
to
to
diagrams
the
component
==
give
_
are
either
service
are
level
External
Pre-amp
Connector
JP3
JP1
Se
Connector
3.3.1.1
Circuits
necessary
3.3.1.2
Refer
operation.
Oxygen
transducer
red
physiologically
into
Sensors
available
configured
LED
in
Sensor
to
Section
saturation
light
pulses
the
module
are
Driver
this
LED
at
the
not
NELLCOR
to
accommodate
block
develop
sequences
Assembly
2,
“Principles
data
selected
at
the
measurement
modulated
via
the
provided
oxygen
LED
to
develop
of
Operation,”
signals
monitor’s
with
are
patient
emergent
the
transducers.
oxygen
drive
signals
an
oxygen
developed
site.
Sensor
site. A photodiode
light
front-panel
module.
transducers
as
saturation
for
additional
using a NELLCOR
LEDs
energy
sensor
The
module
Preamplifier
well
as
generate
in
the
at
the
site.
connector.
is
circuits
directly.
control
signal
details
alternate
transducer
The
designed
current
at
about
oxygen
photodiode
to
serving
switching
the
measurement
NELLCOR
transducer
infrared
responds
operate
connector
SAT
with
to
sensor
~
energy
to
the
signal
all
currently
JP1
ensure
site.
oxygen
pulses
is
coupled
are
the
and
Page 26

3.3.1.3
The
signal
Input
SAT
gain
artifacts,
signal
is
accomplished
Amplifier
signal
and
ambient
and
is
conditioned
reduce
or
light,
by
Synchronous
by
eliminate
and
spurious
circuits
the
in
input
the
the
Detector
amplifier
effects
of
electrical
filter
block.
and
ambient
noise).
the
synchronous
interference
Final
analog
detector
(such
things
conditioning
to
provide
as
of
the
motion
SAT
3.3.1.4
The
filter/amplifier
the
circuit
8.3.1.5
The
measurement
in
8.3.1.6
Module
software.
3.4
This
provide
operation
order
circuits
they
Filters/Amplifiers
module
includes
circuits
multiplexed
block.
A:D
Conversion
A:D
conversion
site
the
saturation
Support
Circuits
operations
The
software
DETAILED
section
discusses
qualified
sufficiently
of
logical
and
components
apply
as
support
two
separate
and
associated
SAT
signal.
block
with
calculation
are
OXIMETRY
service
The
digitizes
IR
and
algorithms.
controlled
also
provides
MODULE
the
major
personnel
to
locate
troubleshooting
such
as
functions.
active
gating
next
step
the
two
red
light.
by
an
80C552
diagnostics
CIRCUIT
functional
with
and
repair
methods
the
microprocessor
filter
channels,
circuits
is
to
digitize
pulse
waveforms
Sensor
calibration
microprocessor
to
assist
ANALYSIS
circuit
the
blocks
necessary
malfunctions.
using
signal
IR
and
recover
these
the
pulse
obtained
information
with
in
determining
of
the
information
The discussions
flow
analysis
and
power
red.
These
patient’s
waveforms
from
supporting
module
to
understand
where
circuits
low-pass
pulse
examining
is
also
module
in
detail.
address
possible.
are
addressed
waveform
in
the
A:D
digitized
hardware
status.
The
module
circuits
Support
converter
the
for
and
purpose
in
last,
or
from
use
is
the
as
to
8.4.1
Oximetry
The
module
resulting
measured
SAT
data.
transmitted
The
following
ο ο
99ο
.
6
9
Refer
to
the
these
blocks.
3-6
Module
is a self-contained
signal,
to
the
list
LED
Input
Input
and
The
saturation
host
assists
Driver
Signal
Amplifier
calculates
system
in
locating a specific
Processing
and
Filters/Amplifiers
Control
A:D
Support
oximetry
Signals
Conversion
Circuits
module
assembly
the
percentage,
for
display,
Synchronous
schematic
that
provides
patient’s
pulse
alarm,
area
Detector
diagram
oxygen
oxygen
rate,
and
saturation
and
interface
of
interest.
(sheet 1 of
transducer
other
pertinent
processing.
7)
for
and
details
power,
pulse
rate
information
on
the
relationship
conditions
from
the
is
the
of
Page 27

3.4.1.1
Refer
detail
SAT
wavelengths.
integral
under
The
via the
coincident
switches
samples
The
When
frequency
though
This
is
present
boundary
LED
to
Figure
during
signal
part
control
LED
DACBUS
of
frequency
both
voltage
negative
being
selected
in
drive
with
U4A/U4B
the
DAC
of
U3A.
at 0 V.
Driver
3-3
“LED
the
following
development
The
NELLCOR
of
each
NELLCOR
of
the
system’s
voltages
to
develop
the
time
via
DAC
outputs
of
each
outputs
2710.6
Hz
divider
voltage
by
either
Typically,
ensures
Driver
discussion.
requires
system
microprocessor.
are
developed
approximately
period
control
control
is
R2,
lines
being
signal
are
multiplexed
created.
R3,
that
control
the
Circuit,”
the
oxygen
each
LED
IRLED/
ORed
(IRLED/
The
and
R4.
LED
line.
LED
drive
and
the
measurement
uses
two
light
transducer.
The
by
dual-DAC
0.5
VDC
is
selected.
(U4
or
multiplexed
and
at
U4
(pins 3 and
LED
drive
This
results
driver
This
U3A's
is
necessary
signal
schematic
site
sources,
The
LED
U1.
on
their
The
pin
16)
REDLED/
signal
in
output
has a peak-to-peak
diagram
to
be
illuminated
IR
and
LEDs
are
control
Initially,
and
at
U4
is
the
to
circuit
both
respective
microprocessor
REDLED/
pins 2 and
is
1355.3
15) a four-phase
sammed
LED
drive
is
zero
counter
(sheet 2 of
red.
These
alternately
is
discussed
DACs
outputs
alternately
(U4
15.
Hz,
with a negative 5 V.
having a negative
during
any
normal
value
of
7)
with
specific
LED
pulsed
in
U1
are
(pins 4 and
pin
1).
This
with a 25%
LED
drive
the
times
offsets
0.5 V with
for
sources
below.
closes
signal
when
additional
light
are
on
and
off
instructed
18)
FET
results
duty
coupled
voltage.
that
the
cycle.
with
no
LED
may
lower
in
an
a
be
Initially,
each
of
High
background
neonates)
As
mentioned
of
182
us.
Phase
Phase
Phase
Phase
LED.
REDLED.
red
without
*
LEDs
1
2
3
4
drive
(R)
and
indicate
both
LED
the
individual
may
cause a reduction
previously,
IR
Both
_
Red
Both
current
Figure
the
3-2
IR
(©)
LEDs
interconnection
pin
drive
levels
LED
ambient
the
LED
on
LEDs
LED
LEDs
switching
illustrates
in
numbers
are
maximum
intensities
light/energy
in
overall
LEDs
operate
off
on
off
is
accomplished
the
relationship
the
sensor
diagram).
in
the
(the
sensor
(0.5
V),
to
compensate
and/or
The
translucent
LED
intensity.
in a four-phase
by
Qi
through
of
these
LEDs
are
shown
numbers 2 and 3 on
connector.
but
may
for
measurement
measurement
sequence.
components
as
be
Q6
they
reduced
and
control
and
appear
either
as
site
lighting
sites
Each
phase
lines
their
electrically
side
of
the
processor
variables.
(such
has a time
IRLED
association
the
back-to-back
found
and
in
the
adjusts
in
period
with
the
circuit
3-7
Page 28

REDLED
>
IRLED
Bus
o
OV—
IC
V-
U1
0.5V-
IL
ПГ
Dual
ova!
ov
LED
Drive
IRIR
LIM
DY
Constant
Feedback
4
3
+
2
USA
Current
IR
14
X
is)
3 2
1
9
3
Les
o
>
U4A
RED
15
σα
R2
777
να
Voltage
Pocket
Attached
R6
osv
.
ον
with
TP2
Tester
LED
with
Tester
RIR
Pocket
Attached
The
four-phase
equally
REDLED
all
via
biased
The
respond
ground
REDLED/
turned
to-back
LED
than
purpose
This
driver
intensity
to
bridge
R5
and
by
IR
LED
through
on.
LED
intensity
blood
is
accomplished
U3A.
LED
both
sides
are
pulsed
transducers
R6.
G3
the
control
(I)
lights
to
the
drive
Ri,
is
pulsed
The
resulting
configuration
is
oxygen
is
to
keep
This
changes.
drive
of
the
low
to
are
and
A4
lines.
when
level
from
Q3,
IR
low.
Q6
current
critical.
levels
the
circuit
Intensity
can
voltage
by
using
has a very
Figure
signal
bridge
cause
turned
are
LED,
ensures
is
presented
circuit
their
off.
reverse-biased
control
turns
distort
at
U3A,
flow
TP2
the
Q2,
off,
voltage
signal
that
variations
high
3-3:
via
R31
respective
Q1
and
IRLED/
and
Q2
and
to
allowing
is
from
the
the
SAT
exactly
developed
rejection
LED
to.
U3A.
to
Q2
are
by
conduction
is
turned
Vec.
The
Q4
ground
proper
during
signal.
the
same
Driver
Q4
LEDs
is
to
LED
of
Circuit
The
resulting
and
R36
to
light.
reverse-biased
pulsed
on.
The
red
LED
respond
through
lights.
LED
on
The
LED
as
the
input
across
power
R1
supply
drive
to
Q3.
Control
When
directly
of
Q5
and
low.
Q5
turns
resulting
(R)
lights
to
the
drive
RI, Q4, red
time
caused
driver
as a constant
is a
voltage
changes
potential
both
Q6,
which
off,
current
when
level
LED,
by
current
to
lines
that
is
inputs
by
the circuit
current
IRLED
are
at a logic
the
control
are
forward-
allowing
flow
control
from
U3A,
Q1
Vce.
any
source
regulator.
feedback
could
is
coupled
and
inputs
Q3
to
from
signal
and Q6
The
other
(U3A,
cause
high,
back-
Its
pin
3).
to
is
3-8
Page 29

3.4.1.2
Refer
discussion.
Input
to
Figure
SAT
to
一
gs7v-LRIR
・
0V 一 一
=15V
LEMO
+15V
VCALIN2
——
Signal
3-4
Signal
Inamp
一
一 一
一
4
Processing
and
the
oximetry
16
HA,
一
isl
o—o
6
e
8 | |
11
9
|
|
Ref
2.5V
As
U21B
6
module
o
3 6
schematic
diagram(sheet 3 of
=
7
50
R16
7)
«2
us
OXZ
-
las
R44
язв [ [8-57
while
JP1
+
4
reading
Sensor
r
1
T
fui
this
Sensor
me
7
ㅣ
l
|
I
|
The
SAT
signal
red
and
IR
light
phase
the
The
(pins 1 and
the
results
energy
presence
An
controlled
sensor
time-multiplexed,
photodiode
undistorted
amplitudes
wave
with a frequency
steady-state
dependent
artifact
site.
4)
to
in
the
output
on
the
photodiode.
of
light
may
peak-to-peak
background
on
the
energy.
is
developed
at
the
measurement
LED
cycling,
intensity-modulated
the
high-impedance
current.
saturation
vary
The
of
U8
or
energy
between
amplitude
above DC.
measurement
Figure
by
the
the
patient's
noninverting
having
This
from
signal
The
light
an
bias
any
at
the
IR
is
proportional
DC
or
energy.
site
3-4:
Input
photodiode
site.
The
input
input
8.57 V maximum
prevents a no-light
source
the
input
and
red
offset
(negative
Peak-to-peak
oxygen
Signal
in
the
oximetry
emergent
oxygen
photodiode
of
causes
saturation,
saturation,
U8,
which
of
U8
is
U8's
amplifier
phases)
to
LED
emergent
from
Processing
sensor,
light
intensity
and
the
current
performs
biased
positive
condition
output
is
with a frequency
amplitude
pulse
is
coupled
current-to-voltage
to
8.57 V by
offset
in
from
to
move
essentially a square
light
intensity,
the
+8.57 V bias
changes
amplitude,
responding
is a
direct
pulse
into
R38
the
clamping
in a negative
of
2710.6
point)
and
result
changes
the
and
absence
U8
wave
Hz.
plus
is
in
the
non-steady-state
to
the
emergent
of
occurring
module
R44.
dependent
signal
via
conversion
This
of
any
at
+15
direction.
(the
actual
The
square
any
artifact
are
the
four-
JP1
light
V.
The
on
at
for
or
Page 30

The
remainder
(pocket
tester)
of
this
is
connected
establishes a consistent
LED
drive
voltage
saturation
that
NELLCOR
The
circuits
percentage
pocket
tester
pulse
simulated
via
the
current-to-voltage
DC
offset:
and
pulse
oximeter
SAT
signal
sensor
converter
of
Frequency:
Modulation:
discussion
set
simulates
81%
rate
assumes
to
the
of
values
the
+1
digit
is
dependent
module
models.
from
the
input
to
JP1
U8,
the
approximately
2710.6.
maximum
frequency,
Hz
peak-to-peak
0.666 Hz
that a NELLCOR
input
for
discussion
sensor
(80%
pocket
(pins 1 and
signal
on
+8.5
photodiode
to
82%)
LED
tester
has
V
(40
in
place
of a normal
and
comparison.
output
and a pulse
switching
is
coupled
4)
on
the
the
following
amplitude,
rate
to
circuit
approximately
cycles/minute)
PT-2500
pulse
patient
The
PT-2500
for
an
average
rate
of
40
+1
bpm
and
will
be
different
the
monitor
board.
SAT
After
characteristics:
0.02
oximeter
sensor.
module
This
conditions
adult
with
(39
to
41
on
conditioning
conditioning
V
an
oxygen
bpm).
other
by
tester
the
Note
Simply
2710.6
stated, a SAT
Hz,
modulated
approximately
The
remaining
number
_is
part
in
buffer
Returning
signal
is
derived
connected
of a voltage
the
module.
U21B.
to
is
coupled
detector.
3.4.1.3
Refer
schematic
The
Input
to
SAT
Figure
diagram
signal
intensities
overloading
to
ensure
optimal
accomplished
coupled.
20
mV.
oxygen
from
to
the
monitor,
divider
This
the
analysis
through
Amplifier
3-5,
must
or
the
combination
the
photodiode
signal-to-noise
by
U7
signal
produced
by
an
extremely
saturation
the
RCAL
the
with
R16
input
resistor
RCAL
on
the
calibration voltage
of
the
module
U10A
and
“Input
(sheet 4 of
be
monitored
to
the
Synchronous
Amplifier,
7)
for
continuously
of
LED
in
the
sensor.
figures.
and
associated
components,
by
the
PT-2500
low-amplitude
requirement
value
resistor
PCB.
connects
Power
(VCALIN2)
where
next
U8
conditioning
Detector
Synchronous
additional
detail
intensity
However,
The
task
is a low-amplitude,
0.666
Hz
is
the
wavelength
located
in
the
between
for
this
divider
is
communicated
is
used
as
the
stage,
Detector,
and Filter/Amplifiers,” and
during
and
controlled
and/or
which
background
LED
intensity
of
compensating
monitor
multiplexed
square
sensor
JP1
wave,
of
the
or
PT-2500.
pin 6 and
is a 2.5 V reference
to
the
preamplifier,
input
amplifier,
the
following
to
prevent
light/energy
must
be
kept
for
excessive
the
SAT
signal
carrier
changing
red
LED.
amplitude
This
When a sensor
ground
to
become
developed
microprocessor
note
that
the
and
synchronous
discussion.
excessively
high
from
as
high
as
light
is
while
it
is
at
via
SAT
the
LED
possible
still
DC-
Initially
the
enough
range.
monitor
LED
LED
to
To
the
3-10
intensity
energy
drive
prevent
negative
and/or
the
SAT
the
is
set
at
external
signal
amplitude
excursion
maximum
light
energy
amplitude
from
exceeding
of
the
SAT
safe
level
is
excessive,
envelope
U8’s
signal.
(50
mA)
the
into
the
negative
upon
monitor
DC
offset
negative
supply
power-up.
at
the
region
of
voltage,
output
U8’s
U7
is
If
the
total
of
U8
could
operating
employed
of
be
to
Page 31

一
Compare
SAT
志
8s.57V-
”
ον
一
1
:
Signal
一
[UALED|
Control
|
Bandpass
200
css
Hz
‘
上
DATABUS
Filter
OV
yemem.
260
7.
(0..7)
kHz
y
19]
Programmable
Gain
0.004
to
bac
Us
Gain
1
in
Stage
255
2
Steps
ン
VIA
10Hz
1
U14B
Full
Gain
6
COMPARE
.
A
2
U78
Ba
SON
GATE
BED
—
IRGATE
U7A
js a negative
excursion
Gndicating
negative
(COMPARE!)
microprocessor
The
signal,
supply
result
during
of
that
of
Amp
Zİ
Gain
Us
Figure
peak
the
SAT
the
voltage
initiates
may
the
this
the
oy
-ARA
Ll
-
RSI
IN
>
v
3-5:
signal
patient
reduce
microprocessor
time
as
H"
U10B
Input Amplifier,
detector
pulses.
module
of
-15
action
to
current
periods
Re
|
SP
一
一
ZX,
È
U14A
sync
Nm
Det.
is
Synchronous
that
produces a DC
If
negative
current-to-voltage
V),
the
microprocessor
reduce
of
the
through
action
the
offending
bř
Y
sl
excursions
output
only
is
that
REDGATE
ο
5 ^ 0-16.
dar
IRGATE
16
IN
>
Lol
U15A
Detector,
output
converter
that
of
the
dual
one
of
the
the
pulse
LED,
will
gem
|
,
OV
1
VEEE)
β
and
proportional
of
the
saturation
stage
is
monitoring
DAC
that
LEDs
amplitude
be
if
reduced.
[|
usec
U23A
|
2
RED
Filter
]
yes,
15]
288
IR
Filter
RED
and
shown
above
normai
Filter/Amplifiers
to
the
output
the
output
controls
necessary.
of
the
e
Gain 8 OV.
10
Gain4
IR
ADC
are typical
human
waveforms
maximum
signal
is
approaching
of
LED
2710.6
“eo
Hz
wavelorms
exceed
UTA
intensity.
Hz
LADE
va
IRADO
V.
0
of
negative.
—10
its
saturation
V
The
After
the
LED
coupling
coupled
frequency
noise
The
operational
DAC
gain
The
is
used
U7B
U7B
amplified
(indicating
(COMPAREZ)
microprocessor
removes
to
U13B, a bandpass
roll-off
on
either
signal
is
signal
is
amplifier
impedance
1/255
is
by
the
is
employed
is a positive
SAT
excessive
intensity
the
at
side
then
over
or
0.004.
then
microprocessor
to
peak
signal
initiates
may
control
offset effect
260
kHz.
of
the
introduced
U13A.
255
coupled
monitor
detector
pulses.
amplifier
artinn
reduce
requirements
of
DC
filter
with a gain
The
filter
SAT
signal
to a programmable
Amplifier
discrete
to
the
gain
steps.
full-gain
as
the
sense
amplified
that
produces a DC
If
the
positive
gain),
ta
reduce
of
only
amplifier
the
are
met,
or
steady-state
of
one,
passes
frequency.
gain
The
is
maximum
point
SAT
the
gain
controlled
U14B,
to
signal
output
excursions
microprocessor,
the
programmable
one
of
the
the
SAT
ambient
low-frequency
SAT
signal
circuit,
by
microprocessor
gain
of
which
determine
at
channels.
has a gain
the
output
proportional
of
the
which
stage’s
signal
(2710.6
which
input
energy
roll-off
the
circuit
channel
of
is
coupled
artifact.
Hz)
consists
of
the
to
the
saturation
is
monitoring
gain.
The
at
200
and
effectively
of
8-bit
adjustment
is
1.
The
51.
The
gain
input
amplifier.
positive
signal
If
exceed
the
necessary,
through
Hz,
output
requirements.
C55.
signal
and
high-
removes
DAC
U9
of
minimum
of
excursion
+10
output
of
the
is
the
U14B
V
This
then
and
of
the
U7B
3-11
Page 32

The
SAT
signal
multiplexed
alternate
voltage
Amplitude
pulse
activity
is
format
excursions
changes
at
the
then
coupled
and
is
essentially a square
or
modulation
measurement
to
the
represents
of
this
site.
synchronous
wave
the
emergent
signal
represent
detector.
at
2710.6
light
from
the effect
The
Hz.
signal
The
one
of
of
is
still
in
peak-to-peak
the
LEDs
the
patient’s
its
original
amplitude
(IR
or
red).
saturation
of
and
Synchronous
reclaim
U14A,
and
amplifier
voltage
amplifier
with a gain
The
microprocessor
of
the
four-phase
represented
represented
original
effect
on
detection
the
patient's
associated
configured
follower.
with a gain
of
1.
by
the
by
the
voltage
the
signal.
filter/amplifier
3.4.1.4
There
а.
Filters/Amplifiers
are
three
a.
Gating
b.
IR
Filter/amplifier
e.
Red
Gating
conditions
pulse
waveform
When
resistors
so
that
the
of
1.
comprise
it
can
positive
When
©
controls
clock
IR
and
LED
level
and
The
channels.
circuits
Filter/amplifier
U10B
mentioned
red
LED
off
times
polarity. A comparison
output
in
of
the
demodulation
the
SAT
signal
component
the
operate
input
this
input
of
as
U14A
is
i
via
the
SATIN
in
the
LED
on
times
(phases 2 and
the
synchronous
in a manner
relatively
synchronous
two
different
is
grounded
not
grounded,
line,
and
drive
discussion.
are
inverted
4)
are
permitted
of
Figures
detector
(filtering)
such
free
detector.
circuits:
by
the
closes
The
by
the
to
8-8
is
applied
block:
that
of
artifact
The
detector
an
inverting
U10B,
device
the
the
becomes a voltage
switch
result
detector.
pass
through
and
8-9
to
the
subsequent
and
interference.
is
an
amplifier,
device
is
during
is
that
the
The
voltage
the
detector
illustrates
inputs
of
filtering
can
U10B,
operational
and
an
inverting
follower
phases 1 and
voltage
values
values
at
their
the
resulting
the
IR
and
red
a
3
Refer
to
Figure
this
discussion.
FET
switches
information.
and
red
off
3-5
and
U15A/B
Phases 1 and 3 constitute
time
segments.
processor-controlled
switch
circuit
pairs
when
in
each
switches
3-12
the
are
and
gate
to
schematic
employed
The
operate
operate
the
signal
diagram
to
separate
the
gate
control
in
time
sequence
exclusively
input
bus
(sheets 4 and
the
IR
and
red
inputs.
so
that
are
open.
5.of
IR
information
on
time
IRGATE
with
the
and
the
four-phase
filter/amplifier
7) for
in
the
segments,
REDGATE)
additional
SAT
signal
and
phases 2 and
to
LED
drive
input
does
details
from
U15A/B
control.
not
see
during
the
red
4,
the
are
The
an
open
IR
Page 33

During
follow
after
70
after
70
During
the
phase 3 and
level
of
signal
The
possible
time.
is
excludes
b.
Refer
discussion.
The
10
respond
the
Converter.
the
time
one
another
the
beginning
us
of
IR
ON
the
beginning
us
of
IR
the
time
microprocessor
into
the
phase 4 and
level
reason
artifacts
Photodiodes
experienced.
this
IR
Filter/Amplifier
to
Figure
IR
filter/amplifier
Hz and a
to
the
filter/amplifier
period
on
the
of
phase 1 and
signal
OFF
continues
red
continues
into
for
gating
Using
potential
total
low-frequency
level
of
phase 2 and
signal
that
phases 3 and 4 of
strobes
for
filter/amplifier.
the red
only
occurring
exhibit
only
3-5
and
'
gain
of
output.
that
phases 1 and 2 of
bus,
the
processor
continues
into
the
IR
continues
level
into
the
U15B
70
for
filter/amplifier.
an
the
error
the
circuit
4.
twice.
us,
or
to
The
70
1s
or
the
last
70
during
schematic
The
The
the
exponential
last
70
from
the
is
an
active
filter
patient
IR
filter/amplifier
the
to
us
pulse
the.
2710.6
strobes
for
filter/amplifier.
for
IR
filter/amplifier.
the
2710.6
The
first
end
second
the
end
us
of
each
first
112
change
of
the
measurement.
diagram
low-pass
cannot
modulation,
U15A
70
lis,
70
us,
Hz
saturation
strobe
of
phase
3.
gate
control
of
phase
phase
us
of
the
when
photodiode
(sheet 5 of
type
track
the
pulse
or
or
Hz
saturation
twice.
The
first
to
the
end
of
The
next
gate
to
the
end
of
signal
pulse
comes
This
gates
pulse
4.
This
into
the
phase
the
energy
output,
7)
for
with a 3
high-frequency
reproducing
waveform
112
the
comes
gates
the
filter/amplifier
due
to
from a sudden
after
additional
dB
the
output
signal
strobe
phase
phase
1.
strobe
sensor
roll-off
pulse
2.
follow
us
after
last
70 us
112
us
last
70
photadiade
the
diode
details
LED
pulse
patient's
is
coupled
(IR
ON
pulse
This
This
one
another
the
of
after
us
is
has
point
and
IR
comes
gates
the
comes
of
to
LED
input,
pulse
112-us
gates
the
on
beginning
RED
ON
the
beginning
RED
OFF
eliminate
settling
state
settled,
during
at
this
approximately
but
waveform
to
the
OFF)
112
last
last
the
bus,
of
signal
change
does
A:D
us
at
The
input
signal
112
us
space
(phases 1 and
in
the
same
manner.
filter/amplifier.
measurement
patient
These
gain
offset
intensity
result
saturation
The
positive
ensure
+2.5
pulse
pulse
of
approximately
of
the
of
the
patient’s
voltage
that
mV
input,
The
site.
modulation
pairs
resulting
at
the
measurement
factors
(density,
pulse
the
waveform
which
level,
to
the
IR
filter/amplifier,
2).
The
This
leaves a 476
overall
The
are
expressed
dimension,
waveform
pulse
individual
and
artifacts
coupled
2.
low-frequency
because
guarantees a minimum
The
does
to
signal
site.
in
at
the
not
next
two
us
amplitudes
pulse
at
the
first
is
then
patient
The
peak-to-peak
the
Beers-Lambert
and
color).
the
IR
filter/amplifier
next
step
move
as
explained
phases
period
pair
the
of
two
coupled
pulse
is
to a negative
(3
until
are
proportional
amplitudes
measurement
identical
to
waveform
Law,
to
digitize
positive
above,
and
the
the
amplitude
output,
level,
offset
is
two
4)
are
gated
next
pair
to
are a function
site.
filter/amplifier
last
stage,
is
proportional
of
which
the
is
labeled
waveform
the
final
of
0.05
70
of
IR
the
emergent
which
the
used
amplifier
V.
at
us
pulses
into
the
red
pulses
of
the
stages,
has a gain
due
patient’s
to
calculate
IR,
must
in
the
A:D
the
output.
separated
filter/amplifier
is
gated
light
at
low-frequency
each
to
the
pulse
oxygen
always
circuits.
stage
input
by
into
the
the
having
of
1.
The
average
waveform
be
at
To
has
a
a
a
IR
DC
LED
is
a
a
3-13
Page 34

с.
Red
Filter/Amplifier
Refer
to
Figure
discussion.
The
red
filter/amplifier
approximately
input,
pulse
coupled
The
by a 112
filter/amplifier
pulses
emergent
low-frequency
but
waveform
to
input
ps
are
does
the
A:D
signal
space
gated
light
patient
10
respond
in
at
3-5
and
the
circuit
Hz
and a total
to
the
at
the
filter/amplifier
Converter.
to
the red
(phases 3 and
the
same
into
the
red
the
measurement
pulse
schematic
is
low
filter/amplifier,
4).
manner.
filter/amplifier.
modulation
diagram
an
active
gain
of
frequency
output.
The
next
This
site.
low-pass
8.
The
patient
as
two
leaves a 476
The
and
(sheet 5 of
type
filter
cannot
pulse
The
red
explained
phases
The
overall
individual
artifact
at
7)
for
additional
with a 3
modulation,
filter/amplifier
previously,
(1
and
us
time
pulse
pulse
the
measurement
dB
track
the
2)
are
space
amplitudes
pair
amplitudes
roll-off
high-frequency
reproducing
pulse
is
gated
until
two
into the
site.
details
70
the
are
during
point
at
the
waveform
us
pulses
IR
next
proportional
are a function
this
LED
patient’s
output
separated
pair
of
pulse
is
red
to
the
of
the
These
gain
offset
intensity
result
saturation.
The
level,
the
+2.5
3.4.1.5
Refer
during
The
various
C-LOCK
host
module
a
pulse
of
approximately
of
the
at
of
the
pulse
waveform
because
waveform
mV
input,
Control
to
Figures
the
SpO2
control
instrument,
to
timing
reference.
pairs
are
coupled
2.
resulting
the
factors
the
does
which
following
measurement
Is a hard-wired
satisfy
low
measurement
expressed
at
the
next
step
not
move
guarantees a minimum
Signals
3-3, 3-4,
discussion.
signals
from
the
are
an
software
to
the
The
signal
frequency
site.
in
the
red
filter/amplifier
is
to
digitize
into a negative
3-5,
and
the
process
external
is
listed
timing
requirements
first
of
two
is
then
coupled
patient
The
Beers-Lambert
controlled
and
pulse
ECG
pulse
peak-to-peak
the
waveform
voltage
schematic
defined
(active
monitor.
identical
to
waveform
amplitude
Law
output,
region,
positive
by
below:
necessary
offset
diagram
several
high)
transmitted
The
rising
filter/amplifier
the
last
stage
is
proportional
of
the
and
is
used
labeled
in
RED,
the
measurement
the
final
of
0.50 V at
(sheets 4 and 7 of
logic
lines
to
edge
of
to
perform
pulse
stages,
having a gain
due
to
patient’s
to
caleulate
must
amplifier
the
from
the
saturation
this
pulse
recognition
pulse
・
be
at a positive
system.
stage
output.
7)
for
microcontroller
is
each
having
of
2.
The
the
LED
waveform
oxygen
voltage
To
ensure
input
additional
module,
used
by
the
using
a
DC
that
has
details
U5.
The
via
ECG
is
a
the
as
a
The
time
(fast
regarding
for
two
seconds
IRGATE/
controls
3-14
the
oceurrence
data)
the
source
Isa
of
message
of
after a real-time
result
transmission
an
ECG
timing
input
over
ECG
synchronization,
message
of
microcontroller
of
the
IR
pulse
the
bi-directional
input
output
on
and
off
can
also be
the
module
is
received.
PWM1/
levels
transmitted
communication
will
not
ANDed
into
the
IR
to
the
module
link.
To
prevent
accept
with
hard-wired
output
CMT1.
filter/amplifier.
using
the
confusion
logic
IRGATE/
real-
inputs
Page 35

IRLED/
level
at
U4B
From
microcontroller
and
the
direction
output
of
current
CMSR4.
applied
IRLED/
to
the
controls
sensor
the
LEDs.
selection
of
the
LED
drive
REDGATE/
REDGATE/
REDLED/
level
at
SATIN
through
3.4.1.6
Refer
additional
A:D
conversion
“output.
filter/amplifier
waveform
configuration
RESISTORS.
U20's
the
channel
microcontroller
circuits.
controls
From
U4A
and
From
U10B.
A:D
Conversion
to
Figure
details
Channel 1 accommodates
from
of
output
bit
present
Is a result
the
microcontroller
the
current
microcontroller
3-6,
“A:D
during
is
accomplished
channel.
the
IR
quad
stream
on
U5
for
of
transmission
Conversion
this
Channel 2 accommodates
filter/amplifier
FET
switch
multiplexing
the
ADCDATA
conditioning
microcontroller
of
the
output
direction
output
discussion.
by a dual-channel
either
CMSR5.
applied
CMSR3.
Circuits,”
VCAL1
channel.
U24A,
is
determined
line.
prior
B,
to
output
red
to
C, D.
The
transmission
PWM1/
on
and
REDLED/controls
the
sensor
SATIN
and
the
schematic
device
voltage
These
ADCDATA
either
selections
FET
switching
by
or
logic
ANDed
off
levels
LEDs.
controls
(U20)
the
analog
VCAL2
signal
line
to
the
with
output
into
the red
the
selection
synchronous
diagram
that
produces a multiplexed
pulse
voltage
are
is
is
coupled
host
or
determined
controlled
ADCCHN,
system’s
CMTO.
filter/amplifier.
of
detector
(sheet 6 of
waveform
the
analog
by
by
logic
which
directly
display
the
LED
action
7)
for
from
the
pulse
the
signal
determines
to
processing
drive
serial
red
ον
VA
V
RESISTORS
VCAL1
RED_ADC
:
IR_ADC
VCAL
2
> 8
U7A
)
REF2.5
1
p
U19
2.5V
Ref
TT
2
3
24A
X
11,
14
9248
N°
16|
U24C
11
<
9|
ae
8,
6
Figure
o
|
,
О
3-6:
2
5
10
7
A:D
Conversion
Circuits
20
19
24
13
15
.
Channel
U20
Dual
Seal
Output
ADCDATA
ADCCHN
3-15
Page 36

3.4.1.7
Support
Circuits
Support
a.
b.
a.
Communications
Refer
to
details
In
signals
CTS
to
RESET
RXD
TXD
The
checked
No
during
addition
present
suspend
communication
transmission
circuits
Figure
for
include
Communications
Processor
3-7,
the
to
the
supply
at
the
clear
to
data
transmission
is
an
input
is
the
receive
is
the
transmitted
errors
and
retry
the
Circuits
“Support
following
voltages
module
send
is a logic
(active
data
data
link
the
presence
capability
following:
Circuits,”
discussion.
provided
connection
from
low)
line
data
is
and
the
schematic
to
the
module
to
the
instrument.
signal
to
is
(active
the
module.
from
the
the
saturation
line
from
bi-directional-asynchronous
of
an
included.
low)
processor
the
saturation
error
is
considered
diagram
from
the
These
transmitted
to
effect a reset
module.
module.
to
(sheet 7 of
power
signals
to
the
in
serial.
be
evidence
7)
for
additional
supply,
module
the
Transmissions
there
are
as
follows:
by
the
saturation
of a hardware
are
four
instrument
module.
are
problem.
data
я
2
1
+—
ューーー
——
の
*ーー-|
—İ
+——
テー
"z
COMPARE
COMPARE2
ns)
RESISTORS
SATIN
İRLED
REDLED
Rese
Chip
Voltage
Data
Analog
Function
CF
05
Clock
and
oe
Timing
Reference
and
Supply
Inputs
VO
P5
(0..7)
and
Signal
Test
Inputs
VOP5(0.7)
Control
Lines
Reset
Circuit
U110,U17D,E,F
Figure
800552
O
Po
Address
Data
VO
PI
Function
Control
VO
PS
Memory
Address
YO
P3
Host
Communications
Control
|「
3-7:
Support
(0..7)
and
Lines
(0..7)
Lines
(0..7)
Lines
(0..7)
Circuits
|
Seria/Paratlal|
*
OCTAI
Latch
>RxD
=
E
|
=
le
|
υ16
m-
U2
ТХО
DAC
v6
“rom
ES
=
E
U12
E
—
Е
RAM
三
a
ADO
BUS
=
E
=
=
E
=
RESET
3-16
Page 37

b.
Processor
Circuits
Refer
Module
by
to
octal
Figure
support
latch
DACBUS.
The
system
reset
3.5
MAIN
Refer
section.
8.5.1
Microprocessor
Microprocessor
reprogrammable
stored
while
A16
and
all
peripherals.
8.5.2
Power
operates
and
buffer
PROCESSOR
to
the
in
U204,
the
unit
the
block
lower 8 address
Control
3-7
for
additional
circuits
UZ.
functions
consist
U16, a serial-to-parallel
using
an
for
PCB
diagram
(Figure
details
of
80C552
11
MHz
the
communication
CIRCUIT
Section
U200
is
an
80C188.
memory)
which
is
off.
U205
is a
U201
and
128K x 8
and
U210B
lines.
U206
during
microcontroller
shift
the
register,
erystal-controlled
DETAILS
3-1)
and
schematic
The
main
program
U203.
S-RAM.
latch
Temporary
U204
remains
the
multiplexed
acts
as a buffer/driver
following
converts
link.
diagrams
is
discussion.
US,
ROM
U6,
serial
oscillator.
stored
and
powered
Sections
in
Section
in
FLASH
semi-nonvolatile
from
address/data
for
the
and
data
the
bus
data
RAM
U12,
to
parallel
U11
and
12
while
(electrically
information
system
from
bus
storage
U200
between
all
served
data
U17
perform
reading
battery
and
U200
for
the
this
is
create
and
Pressing
RY1
to
pull
mains
U208A,
applied
and
Power
switch.
to
for
Power
power
R200,
to
R203,
may
This
decrease
U207A,
may
condition
The
battery
power
is
display
The
third
drops
below
When
R226
goes
the
presents
low,
volts.
the
front-panel
in.
RY1
to
be
and
U207A’s
Q200
is
be
removed
causes
the
voltage
causing
also
be
occurs.
U200
voltage
divided
down
controller
way
to
power-down
9.5
volts.
battery
U220
and
via
D211
power
enables
applied
C202
preset
forward-biased,
C208
it
to
removed
is
via
power
to
secondary
form a Power-On
pin
to
from
the
to
be
discharged
on
C203
be
reset.
from
may
remove
also
monitored
by
R275
and
P205.
the
Pin 2 of
voltage
U220
drops
pin 3 with
clears
U207A.
switch
from
biases
either
regulators
Reset
guarantee
providing
unit
in
that
three
through
below
the
input
the
unit
if
power
R276
monitor
is
to
approximately
by
set
by
the
and
is
through
to
approximately
The
software
A301
into
conduction
the
internal
U302
and
(POR)
this
hold-in
ways.
threshold
the
microprocessor
taking
system
limited
pulse
flip-flop
bias
First,
R201
and
on
PCSOFF
via
an
by
D215
U220.
approximately
9.5
volts,
3.9V.
Once
the
cutout
via
R314
storage
battery
or
U303.
of
approximately
will
be
set
on
power-up.
to
Q301
to
maintain
the
user
may
press
D203.
If
the
button
U208C, a clock
requests
it
when a low
low;this-clears-U207A
A/D
converter
on
to a 0-5 V signal that
This
3.9
the
battery
set
point
device
volts
voltage
from
is
is
10
low
detects
voltage
divider
enough,
volts,
and
the
600
system
the
is
pulse
U102.
if
formed
plus
D203,
rectified
ms,
causing
AC
This
Through
power.
front-panel
held long
will
be
generated
battery
through-D211.
Switched
is
routed
the
battery
reference
by
R225
pin 6 of
or
minus
pulse
D204 _ |
power
enough
system
to
the
voltage
U221.
and
U220
0.5
is
3-17
Page 38

Resetting
U200,
low.
informing
At
this
discharges
3.5.3
Reset
On
power-up,
by
holding
by
U208F
charges
RESET
neither
U209
action
dog
some
C209,
low.
of
approximately 1 second
again
timers
intervention
U207A
point,
through
and
Watchdog
C209
RES
and
is
after
With
the
watchdog
causes
again.
causes
it
C204
low.
used
that
power-down
is
R203
is
initially
U200
to
reset
U207A
and
approximately
RESET
systems
RESET
With
this
this
cycle
the
only
R204,
discharged
takes
both
low,
C207
later,
to
go
done,
will
pin 6 to
is
remaining
removing
RESET
watchdog
100
and
is
satisfied
RES
low
and
C209
repeat
go
high,
imminent.
base
bias
by
D210,
high
while
circuits
ms
RES
is
C208
are
before
is
driven
discharge
is
once
again
continuously.
initiating
Resetting
drive
for
from
Q200
which
high
free
either
low
its
via
enough
to
via
C207
free
initially
RES
D205
start
C207
D206,
and C208,
to
an
NMI
U207A
Q200.
causing
input
and
to
charging
or
charge
(nonmaskable
also
causes
After
about 1 second,
the
puts
U200
is
LOW.
D208.
After
satisfy
U200.
through
C208
reach
which
discharges
effectively
through
U207A
relay
to
into a reset
This
signal
power-up
This
R206
the
threshold
resetting
R207.
interrupt)
pin 5 to
C204
drop
out.
condition
is
inverted
R207
in
turn
takes
and
R209.
value
C209.
This
the
Unless
there
to
go
If
of
watch
is
Watchdog
generated
approximately
first
U212B
FAILED
divide-by-two
This
trips
for
reset
pulse
ever
reaches
signal
FAILTONE
the
600
divider.
microprocessor
The
two
independent
C206.
The
first
The
second
and
key
communicate
If
P209
timer
timer
3.5.4
Battery
The
battery
battery
Power
If
system
draw
PCB.
is
will
to
allow
backup
to
U204
its
power
watchdog
U200
properly
shorted,
be
disabled.
testing
Backup
voltage
power
forward-biases,
are
counted
power
ms.
is
not
the
goes high,
signal
has
encountered a system
by
U212B.
control section
Since
the
counted
This
eighth
this
device,
is
routed
by
count,
removes
watchdog
watchdog
the
voltage
(S-RAM)
is
applied,
from
providing
timer
and
to
first
If
the
and
is
applied
for
the
timer
is
connected
U102
are
U102,
watchdog
P211
is
watchdog
Memory
to
U204
is
supplied
D213
+5 volt
backup
is
This
device
reset,
pulse
U212B.
U210A
when
to
the
described
Each
the
allowed
main
above.
to
the
microprocessor
reset
is
clocked,
clear
condition
to
speaker
failure.
timers
or
are
connected
to
in
constant
should
U102
timer
shorted,
satisfied
to
U200
U102,
communications,
fail,
will
be
disabled.
this
will
pulse counter.
Retention
U222, a micro-power
and
U219
(Real-Time
via
D213
and
D214,
is
forward-biased
supply.
power
As
from
the
system
the
is
reset
on
During
transition
latching
from
run,
divides a 3,906
amplifier
by
positive-going
via
U207B,
which
the
controls
system
If
keep
pulses
shunt
regulator,
Clock)
which
and
D214
power
storage
battery.
power-up
power-up,
is
only
after
power-up
the
FAILED
U212A,
and
informs
edges
which
the
front-panel
and should
will
be
P210
is
shorted,
from
satisfying
to 3 volts
are
low-voltage
is
reverse
falls
off,
D213
via.
the
POR
signal
POR
is
held
active
about
100
ms
wide,
is
counted,
signal.
which
Hz
clock
the
applied
forms a single-bit
When
is
configured
down
user
that
to
C205
to
output
numeric
U200
fail
to
reset.
the
second
the
first
watchdog
via
R228.
U222
regulates
as set
by
R229
and
drop
Schottky
biased,
causing
U204
reverse-biases
for
the
and
if
the
as
a
1953
Hz.
the
and
port.
displays
watchdog
a
R230.
diodes.
to
and
D214
With
system
On
power-down
causes
low.
3-18
the
power
Q204
voltage
applied,
loses
on
Q204’s
Q204
is
drive
when
collector
forward-biased
the 5 volt
to
fall
off
sharply
supply
by
U221,
has
and takes
which
dropped
the
is
set
to
approximately
to
approximately
PFAIL
input
to
4.5
U219
3.9
volts.
volts.
(RTC)
This
Page 39

PFAIL
to
off
during
8.5.5
U213
is
the
RAM,
state,
system
Internal
is a guad
also
maintaining
keeping
communications
CO2
And
SpO2
U217.
RS-232
C215.
needed
U217
generates + and —10
port
from
The
remainder
to
meet
connected
PFAIL
reset
conditions.
and
External
UART
between
circuit
the
PCBs,
system
of
RS-232
to
U204’s
data
low
CE2
integrity.
until
the
Serial
(Universal
U200
Asynchronous
and
and
the
Volt
+5
volt
U217
provides
input/output
line;
when
During
reset
reset,
cycle
Communications
the
front-panel
rear
panel
RS-232
supplies
supply
via
the
necessary
needed
an
infernal
specifications.
this
line
Q205
is
complete.
Receiver
numeric
connector.
to
generate
level
goes
low,
further
conducts
This
to
further
Transmitter).
display
and
The
the
bipolar
charge
pump
translations
accesses
effectively
enhances
It
provides
key
PCB
RS-232
port
signals
that
uses
and
current
are
hold
9204
data
processor,
is
buffered
needed
C212,
C213,
limiting
inhibited
in
the
integrity
the
by
by
the
and
Serial
PCBs,
lights
which
circuit
saturated,
pulled
communications
is
accomplished
when
the
applies
of
the
optocoupler
the
low.
Communications
and
U208E.
The
quad
UART
power
(EEPROM).
3.5.6
The
buffers.
during
enables
accessed
Power
NTKEPWR
apply 5 volts
control,
Each
Graphical
front-panel
This
is
battery
U216’s
by
PCSDISP
is
applied
line
to
input
data
drive
current
data
output
with
the
also.
provides
FLASH
of
these
Display
graphic
needed
operation.
outputs
to
the
low.
This
the
graphic
to
the
CO2
and
through
line
to
four
is
the
low.
identical
buffer
provides a faster
line,
which
numeric
display
additional
memory
display
because
and
going
graphic
program
circuits
connects
the
The
buffers
allows
low.
display
is
power
U232B
activates a FET
display.
SpO2
PCBs,
optocoupler
This
in
turn
transistor.
turn
is
normally
and
VO
capability
voltage
discussed
to
the
to
the
are
enabled
to
control
by
driving
switch
which
causes
The
off
response,
held
high
key
PCB
enable,
below.
system’s
graphic
by
taking
the
Q202
located
are
patient-connected
circuits.
the
optocoupler's
68-ohm
When
through
processor
for
such
power
bus
via
display
U232A’s
enable
into
line
saturation,
on
the
The
LED
pull-down
the
buffer
the
is
buffered
.
things
source
U215
may
sensing,
and
be
input
of
U215 when
Power
isolated
in
the
optocoupler
transistor
resistor
in
to
the
transistor
4.7K
pull-up
with
as
the
U216,
removed
high;
which
pulls
resistor,
U216B,
graphic
and
control
which
to
conserve
this
in
the
display
the
Supply-Charger
circuit
turn
on,
emitter
is
is
U208D,
display
of
U214
are
tri-state
power
turn
is
PCB
to
3.5.7
.
U214
device
serial
EEPROM
is
an
is
accessed
number
electrically
serially
(if
original
erasable
from
board),
programmable
port
pins
on
and
total
ROM
U213
hours
that stores
and
stores
in
operation.
such
the
data
user's
as
default
user
default
settings.
settings,
The
3-19
Page 40

3.5.8
FLASH
The
firmware
that
do
not
need
to
be
performed,
responsible
programming,
power
turn
3.5.9
from
driven
Real-Time
Memory
is
stored
to
be
removed
which
for
accepting
U218
supplies
unregulated
from
U213.
Clock
in
U201
and
U203.
from
the
enables a small
completely
the
supply
12
VSW
new
volts
via
These
circuit
portion
software
needed
Q203,
devices
to
accept a new
of
software
via
the
for
reprogramming.
which
is
are
electrically
program.
to
remain
rear
driven
panel
into
saturation
reprogrammable
U201
allows a partial
resident.
RS-232
U218
This
connector.
receives
via
software
During
its
primary
Q201,
which
devices
erase
is
is
System
primary
U222,
then
time
storage
which
internally
XTAL202,
C218
while
3.5.10
Audio
Timer 1 of
output
goes
converter
voltage
This
C271.
a
3.5.11
The
turned
mains
3.5.12
enable
low.
output
signal
The
bridge
Charging
front
on.
transformer.
Patient
The
for
amplifier
is
provided
battery.
also
switches
which
observing
Generation
U200
is
input.
outputs
the
value
from
is
then
low
pass
Indicator
panel
Q300
charging
detects
Isolation
by
The
regulates
power
over
is a 32.768
the
buffered
used
to
generate a selected
U230
is a tri-state
of
U230
latched
the
ladder
AC-coupled
filter
serves
that
drives
LED
whether
This
signal
Power
U219.
battery
to
the
kHz
are
into
network
via
the
is
Supply
When
is
regulated
to
the
system
crystal.
32.768
8-bit
connected
U230.
C225
only
to
rear-panel
driven
mains
is
also
available
the
unit
system
+5
The
kHz
SRAM
volt
crystal
signal
frequency
latch
to
an
As
the
varies
slow
to
between
U231
the
mounted
by
Q212, which
power
is
is
powered-down,
down
to 3 volts
for
backup.
supply.
may
at
U219
be
TP1.
trimmed
square
that
holds a value written
R-2R
square
ladder
wave
zero
network
from
volts
via a low-pass
square
wave’s
speaker
receives
applied
to
U200
to
the
via
unit
U213
U219
receives
by
the
micropower
When
derives
the
its
for
wave
that
that
U200
gates
and
the
filter
formed
leading and
directly.
base
drive
by
looking
and
D201.
its
power
is
timebase
timing
is
provided
by
serves
accuracy
U200 when
as a D/A
U230,
programmed
by
R263,
trailing
via
D201
for
AC
power
shunt
from
regulator
applied,
from
to
U230's
PCSVOL
the
resultant
D/A
R264
edges.
when
from
the
the
U219
via
value.
and
U231
Q300
is
is
Isolated
cireuit
flyback
signal
secondary
set
by
C228
62.5K
U213.
Secondary
regulated
:
unregulated
—
—42
power
PCB.
configuration.
back
+8
the
operating
coupling a divided
for
U233.
Hz
signal.
regulation
down
volt
supply.
volt
supply
3-20
U233
to
U233,
volt
is
supplied
is a current
which
supply
voltage
system
This
reset
The
isolated
from
the +8 volt
U236
and
for
the
to
the
CO2
mode
Transistor
is
of
Q211
sets
the
accomplished
the
secondary
clock
synchronization
power
is
supplied
by
supply
U237
provide + and —15
CO2
PCB
is
and
SpO2
switched
is a sense-FET
current
by
+8
supplied
pulse
supply
conventional
via
U235,
filtered
by
subsystems
power
supply
switching
current
volt
by
modulating
supply.
U211
resets
may
be
disabled
linear
The
volt
C243.
via a power
controller
that
point
of
The
via
C230
the
R-C
regulators.
—5
volt
supplies
supply
that
provides a mirrored
T200.
Voltage
optocoupler
switching
to
R-C
timer
by
saturating
frequency
timing
and
The
supply
for
is
the
SpO2
regulated
located
drives
regulation
U239.
components
forces
Q210,
+5
volt
PCB.
T200
current
R291
is
set
it
to
lock
which
logic
by
U238
An
unregulated
on
the
via
Q211
output
of
the
is
at
R277
to
is
supply
from
main
ina
used
to
62.5
kHz
and
the
driven
is
the
by
Page 41

8.5.18
Front
Panel
Display
Controller
U102
is a programmable
the
front-panel
provided
segment
decode
low,
selected
When a key
which
As
used
used
briefly,
by
As a participant
watchdog
computer
watchdog
an
D100
by
is
driven
which
which
in
display
senses
mentioned
to
read
to
detect
all
LED
U102
to
determine
control
for
trip.
orderly
provides
U103
display
turn
is
the
previously,
the
an
fashion.
power-down.
dual-color
which
by
Q112.
should
drives
to
the
+5
pressed
key
and
switch
battery
if
any
of
current
if
in
the
watchdog
system.
extended
The
system
isolation
single-chip
LED
displays and
is a seven
Segment
be
selected
one
of
volt
supply.
the
associated
depress
U102
voltage
the
display
returns
the
segment
If
U102
period
reset
of
the
power
microprocessor
section
open
current
during
the
transistors
The
display
display
and
informs
also
contains
via a voltage
segments
through R102
lit.
system
should
of
signal
time
is
switch
U102
ever
it
will
routed
signal
programmed
to
scan
the
key
collector
limiting
the
multiplex
Q100-Q109
drive
is
the
an
on
divider
fail
to
Darlington
is
provided
into
signals
selected, a common
main
microprocessor
PCB
8-bit
on
the
light.
On
causing a slight
provides a watchdog
fail,
or
should
shut
down
and
to
U102
so
that
so
that
it
can
to
PCB
for
by
R115-R122.
cycle
and
saturation.
also
A/D
converter.
main
circuit
power-up
voltage
healthy
it
fail
to
cause
the
the
entire
be
monitored
provide
key
the
presses.
transistor
drive
the
This
connect
line
of
the
is
the
This
PCB.
each
segment
drop.
This
signal
communicate
system
system
by
multiplexing
Segment
array.
U100
The
and
drive
eighth
U101
appropriate
connects
key
driven
the
switches.
back
to
event.
converter
Additionally,
is
illuminated
voltage
to
to
reset
resets
U102
with
the
main
the
via
together
to
detect
is
a
for
is
output
U102
is
it
is
read
main
in
for
3.6
POWER
3.6.1
Power
The
Power
battery
SUPPLY-CHARGER
Supply-Charger
Supply-Charger
charger,
synchronization
Supply-Charger
3.6.2
AC
Rectifier
The
power
bridge
output
driver
frequency
reverse
labeled
The
output
battery
pin
1,
through
transformer's
rectifier
is
fed
directly
and
is
configured
is
set
blocking
VBAT
current
via
R326,
which
connects
blocking
+5
volt
input
circuitry.
schematic
and
+12
D303,
and
to
at
66 k HZ
diode
D307
on
schematics.
is
limited
(0.2
O,
the
diode
Theory
PCB
logic
and
diagram.
volt
Battery
AC
secondary
6800
battery
as a buck
(nominal)
(and + term
at a nominal
1%, 3 W),
2.5A
rear-panel
D308
to
PCB
of
Operation
contains
display
The
schematics
Charger
LF
filter
charging
converter
via
current
the
common
CIRCUIT
these three
power
voltage
(20
capacitor
switching
with a 330
C305.
The
of
the
battery)
500
mA
limit
fuse
to
of
power
DETAILS
basic
circuit
supply,
of
these
VAC)
C303.
and
the
circuits
is
input
The
regulator
pH
(L300)
output
to
set
is
set.
via
potentiometer
control
resistor.
the + terminal
switching
blocks:
analog
are
via
nominal
U301.
output
at
+14.25
maximum
VBAT
of
the
relay
portion
shown
P303
+25
This
charge
is
fed
battery.
RY1.
AC
rectifier
of
C-LOCK
on
the
to
.8
ampere
volts
DC unregulated
device
has a built-in
inductor.
volts
at
the
R312.
This
current
from
the
It
is
and
27048,
full-wave
The
cathode
voltage
to
PCB
via
also
connected
+12
volt
ECG
Power
NPN
switching
of
is
the
P304
3-21
Page 42

Unregulated
switched
Supply
through
Base
LOW
NPN
secondary
and
3.6.3
voltage
charger
PNP
current,
by
MAIN
transistor
voltage
coupled
+5
Volt
DC,
during
VSW
PCB
switching
for
Q301
PCB
Q300.
is
to
base
Logic
and
AC
(either
and
via
transistor
turn-on,
control
Q300
present.
of
Q300.
Display
operation
VBAT
P300
or
to
Q301.
is
provided
pin
P300
is
turned
That
AC
Power
is
also
diode
unregulated
the
Main
through
pin
9.
AC
on,
pulling
is
rectified
Supply
coupled
DC)
Processor
R314
on/off
power
AC
P300
via
D304
to
to
the
PCB.
.
when
recognition
pin 7 low
and
RY1
rest
RY1’s
PWRON
D305,
common
of
the
coil
when
filtered
°
via
power
is
energized
control
is
provided
D309.
circuits
line
RY1
from
is
by
AC transformer
by
RC
R308
supplies
on
Power
VBAT
switched
turning
and
C304,
on
Energizing
as
the
maximum
limit
The operating
is
fixed
FET
Q303,
its
gate
Processor
of
+10 V (derived
The turn-on
the
heavy
than
display
3.6.4
Power
regulator.
to
divider
gain
buffer
diodes
RY1
battery
charger.
output
value
is
about
frequency
by
divider
fed
by
voltage
PCB
control),
time
load
demanded
the
+5.0 V supply’s
power-up
C-LOCK
for
QRS
quad
U302's
R301.
and
D300
and
applies
current
R318
the
is
low
from
of
cycle.
Sync
operational
input
The
U300B
D301.
for A and B sections
point
so
that a negative
of
U300B,
peak
positive-going
value.
to
CINT
D302,
the
R304,
next.
pulse,
is
connected
This
input
voltage
The
differences
is
much
4.5
amperes,
is.set
by
and
R319.
+5.0 V supply.
and
the
FET
Q302
is
turned
VSW).
approximately
by
the
display
current
Input
limit
Circuit
amplifier
voltage
input
peak
comes
is
then
follower.
The + inputs
and
R325,
R310
voltage
C301,
sets
CINT,
R305,
the
threshold
when
to
the
supply
Main
to
the
+5
volt
are:
the
operating
higher,
C311
Vacuum
is
90
and
A303
off.
off
ms
value,
U300
at
2.5
current
fluorescent
gate
voltage
When
and
gate
is
determined
during
This
is
developed
amperes
limit by
NTKE
its
turn-on
heavy
from P302, a rear-panel
AC-coupled
The
of
U300A,
for
for
and
U300C)
the
input
Processor
through
divided
B,
section
U300
for
comparator
signal
input
and D are
D.
These
is
not
stores
exceeds
PCB,
switcher
frequency
continuous,
R316
display
is
controlled
PWR,
voltage
by
is
R327
to
load
.
by
U302, a three-terminal
C300
to
is
clamped
biased
dividers
needed. The
the
peak
U300D.
the
via
P300
circuit.
(0.25
power
by
P300
pin
allowed
and
less
than
lasts
for
miniature
two
parallel
to 4 volts
to
set
peak
value
of
The
comparator’s
threshold
pin
8,
The
basic
is
higher,
and
the
O,
1%, 3 W).
is
switched
NPN
Q302,
10,
is
to
rise
C314.
This
4.0
amperes,
about
20
phone
circuits,
+4.0 V by
the
amplifiers’
follower
the
C-LOCK
set
by
for
further
circuit
at
95 k Hz,
nominal
Output
by
When
brought
to
D313's
timing
which
to
30
ms
+8.0
jack,
U300A
by
back-to-back
dividers
circuit
input
output
the
previous
processing.
is
the
same
current
'
voltage
N-channel
Q302
is
low
(via
Main
zener
value
acts
to
is
less
during
volt
through
R300
unity
zener
R302,
R303
operating
(composed
from
one
produces
peak
on,
keep
the
a
3-22
Page 43

4.1
INTRODUCTION
The
N-6000
institution.
8,
“Troubleshooting,”
resolving
4.2
CLEANING
reguires
Nellcor,
them.
no
routine
however,
discusses
INSTRUCTIONS
Routine
service
recommends
potential
other
SECTION
IV
Maintenance
than
that
which
replacing
difficulties, their
the
monitor's
is
mandated
possible
by
battery
causes,
the
operator's
every 2 years.
and
suggestions
Section
for
Caution:
To
clean
the
top,
bottom,
its
accessories.
chassis.
4.3
CHANGING
The
N-6000
indicated
voltage
1.
2.
8.
4.
5.
setting:
Turn
Open
blade
Set
housing.
Orient
Orient
Do
not
immerse
the
N-6000’s
and
Do
MAINS
operating
by a white
the
Mains
the
power
screwdriver
aside
the
the
selector
the
indicator
the
surfaces,
front
surfaces
not
allow
VOLTAGE
voltage
marker
AC
ON/OFF
entry
or
similar
cover/fuse
card
pin
N-6000
any
must
located
module
block
so
so
in
dampen a cloth
lightly.
liquid
INPUT
match
near
switch
cover
tool.
assembly
that
the
that
it
points
liquid
Do
not
to
penetrate
the
the
to
the
(located
and
desired
or
use
caustic
with a commercial,
spray
switches,
local
mains
AC
mains
OFF
position
next
pull
the
voltage
up
when
or
pour
AC
power
to
the
voltage
is
readable
the
desired
or
abrasive
nonabrasive
any
liquid
connectors,
power
and
power
ratings.
cord
receptacle.
then
cord
selector
at
voltage
disconnect
the
cleaners.
cleaner
directly
or
connector)
card
bottom.
is
on
openings
The
voltage
To
change
the
straight
readable
and wipe
the
N-6000
in
the
setting
the
power
using a small
at
out
the
cord.
of
the
bottom.
or
is
6.
7.
8.
Insert
the
Verify
Changing
Replace
voltage.
the
power
that
voltage
cord
the
the
the
power
selector card
connector,
proper
Fuse,”
fuse
in
entry
and
is
installed.
this
section.
module
back
the
edge
cover,
into
the
containing
If
the
then
housing,
fuse
needs
verify
that
printed
the
desired voltage
to
be
replaced,
the
indicator
side
of
pin
the
card
first.
refer
shows
facing
to
“Replacing
the
desired
toward
or
4-1
Page 44

4A
REPLACING
To
replace
or
OR
change
CHANGING
the
fuse
THE
FUSE
arrangement
from
North
American
to
European
Fusing:
1.
2.
Disconnect
Open
the
Loosen
Remove
Change
the
the
the
European
operating
Insert
Tighten
fuse
screw
the
power
screw
fuse
fuse
fuses
on
220
block
and replace
AC
entry
by
block
or
are
V~.
and
power
cord.
module
two
turns
by
sliding
fuse
arrangement
required.
slide
Fuse
cover
by
using a small
counterclockwise.
up,
then
as
Replace
back
the
block
cover.
onto
Jumper
the
screw
bar
away
shown
“dummy”
and
blade
screw
from screw and
in
Figures
fuse
4-1
in
the
pedestal.
lifting
and
4-2.
neutral
driver
up
Note
(lower)
or
any similar
from
the
that
two
holder
tool.
pedestal.
when
Cover
Figure
4-2;
Jumper
European
bar
Fuse
Fuse
Arrangement
Page 45

5.1
OVERVIEW
This
section
instrument
in
loss
or
damage
contains
should
not
be
available, a suitable
through
To
must
Department
the
5.2
If
available,
1.
2.
Nellcor’s
facilitate
be
issued
RGA
number.
REPACKING
Place
monitor
with
packaging
Label
carton
the
before
for
use
Technical
repair
an
RGA
IN
the
in
with
Packing
instructions
packed
covered
carton
or
the
ORIGINAL
original
tape.
carefully;
by
should
Services
replacement
instrument
number.
carton
original
shipping
plastic
SECTION
and
Shipping
for
returning
failure
the
Nellcor
be
used.
Additional
Department.
process, a returned
is
returned.
Be
sure
to
mark
CARTON
and
packing
foam
and
return
the
N-6000
to
follow
warranty.
Contact
the
materials.
packaging
addresses
V
Instructions
for
repair
the
instructions
If
the
original
packing
shipping
and
and
materials
goods
authorization
Nelicor's
carton
Pack
the
place
in
RGA
number.
or
replacement.
in
this
shipping
may
Technical
and
any
monitor
shipping
The
section
carton
be
(RGA)
is
purchased
number
Services
shipping
as
follows:
carton.
Seal
may
not
forms
carton
result
with
5.8
REPACKING
If
the
original
1.
Place
the
2.
Locate a corrugated
3.
Fill
the
4.
Place
the
5.
Seal
the
6.
Label
carton
IN
carton
monitor
bottom
unit
carton
NEW
CARTON
is
not
available,
and accessories
cardboard
of
the
carton
on
the
layer
with
packing
with
shipping
shipping
with
of
packing
tape.
and
use
the
following
in
plastic
carton
at
least 2 inches
material
return
addresses
bags.
with
and
procedure:
at
least
of
packing
fill
the
box
and
RGA
200
psi
material.
completely.
number.
bursting
strength.
5-1
Page 46

Page 47

6.1
INTRODUCTION
This
section
troubleshooting.
6.2
DISASSEMBLY
includes
procedures
Refer
to
PROCEDURE
Figure
Disassembly
for
disassembling
6-1
when
SECTION
reading
VI
Guide
the
N-6000
this
procedure.
when
required
for
testing
or
Tools
Note:
without
next,
accessible.
way
replaced
6.2.1
1.
2.
3.
4.
Required:
This
removing
and
to
remove
first
Removing
Disconnect
Place
Remove
Turn
rear.
procedure
then
the
The
AC
the
when
Instrument
power
instrument
screws
instrument
Small
Medium
Small
1/4-inch
5/16-inch
5/16
open
is
listed
the
assembly
Oximetry
power
Power
input
Supply-Charger
reassembling
cord,
upside
from
instrument
over,
cross-head
cross-head
flat-blade
nut
driver
nut
driver
end
wrench
in
order
listed
in
and
CO2
assembly
the
Cover
sensors,
down
on
pull
handle
screwdriver
screwdriver
screwdriver
of
disassembly,
the
prior
step.
subassembly.
must
be
removed
PCB.
The
instrument.
and
other
external
bench
cover.
side
top.
of
cover
with
magnetic
with
magnetic
but
some
The
cover
Other
assemblies
from
transformer
connections
away
from
tip
tip
assemblies
must
be
may
the
rear
panel
must
be
from
chassis,
may
removed
then
be
and
removed
instrument,
and
slide
be
removed
first,
removed
lifted
last
cover
the
out
and
off
battery
if
of
the
to
the
6.2.2
Removing
Note:
Removing
the
real-time
replacing
WARNING:
Dangerous
1.
Release
2.
Disconnect
3.
Pull
Battery
clock.
the
battery.
Use
voltages
tie-wraps
battery
the
battery
To
prevent
extreme
are
battery
straight
causes
caution
present
holding
leads.
up
and
all
data
loss,
when
inside
battery
out
trend
operate
removing
the
cabinet
to
chassis.
of
chassis.
information
the
N-6000
or
replacing
in
this
and
custom
on
AC
the
operating
defaults
power
battery
condition.
to
while
with
be
lost
removing
AC
power
and
resets
and
applied.
Page 48

6.2.3
Removing
1.
Disconnect
2.
Remove
8.
Pull
assembly
4.
Pull
subassembly
5.
Disconnect
6.
Pull
the
Note:
When
replacing
subassembly’s
horizontal
6.2.4
1.
2.
tabs
Removing
Disconnect
Remove
PCB.
Oximetry
ribbon
screw
from
out
cables
of
away
cable
from
subassembly
subassembly,
enclosure.
in
place.
Secure
Main
Processor
all
cable
screws
from
and
CO2
from
right
chassis
slots on
from
front-panel
up
and
Snap
the
the
PCB
connectors
four
corners
Subassembly
Main
Processor
side.
side
panel.
chassis
oximetry
out
of
the
be
sure
vertical
tab
assembly
from
of
Main
side.
chassis
to
place
in
the
with
Main
Processor
PCB.
input
connector.
the
flexible
side
panel
the
screw.
Processor
PCB
first,
PCB.
and
plastic
and
two
insulation
then
snap
screws
from
inside
the
two
center
the
of
3.
6.2.5
1.
2.
3.
4.
6.2.6
Note:
1.
2.
3.
6.2.7
1.
Lift
Main
Processor
Removing
Remove
Pull
Disconnect
Pull
Removing
The
Turn
Remove
Pull tray
Removing
Front-Panel
screws
panel
away
the
panel
away
Pull-Out
front
panel
instrument
screws
away
Speaker
holding
three
Using a 5/16-inch
PCB
from
the
ribbon
and
out
Card
must
be
upside
holding
from
chassis.
nut
up
and
Assembly
the
front
chassis
cable
of
the
Tray
moved
down.
tray
to
driver,
away
panel
about
connectors.
chassis.
away
chassis
remove
from
to
the
an
inch.
from
bottom.
nuts
holding
chassis.
chassis
chassis
at
the top
before
speaker
and
on the
removing
to
rear
bottom.
tray.
panel.
2.
6-2
Pull
speaker
away
from
panel.
Page 49

6.2.8
Removing
Power
Supply-Charger
PCB
Using a 1/4-inch
1.
Pull
2.
3.
4.
5.
6.2.9
1.
2.
assembly
Disconnect
Remove
Lift
Power
Removing
Using a 5/16-inch
chassis
Pull
transformer
nut
away
cable
connector
screws
bottom.
holding
Supply-Charger
Transformer
nut
and
driver,
from
rear
Power
driver
AC
input
remove
from
PCB
and
nuts
panel
Supply-Charger
and
fuse
holder
up
and
5/16
assembly
holding
clear
out
open
up
of
and
PCB
of
chassis.
end
wrench,
and
AC
input
the
Power
battery
to
chassis
out
of
chassis.
power
leads.
remove
assembly
Supply-Charger
bottom.
nuts
to
holding
rear
panel.
PCB.
transformer
to
6-3
Page 50

Page 51

6-1
Diagram
Figure
Disassembly.
N-6000
Page 52

Page 53

7.1
DESCRIPTION
This
section
troubleshooting
“Disassembly
describes
Guide,”
and
testing
repair
for
and
are
found
cover
Testing
calibration
in
Section
removal
SECTION
and
Calibration
procedures
8,
“Troubleshooting.”
instructions.
VII
for
the
N-6000.
Also
Instructions
refer
to
Section
for
6,
Table
Freeze
pressing
Note
7.2
7.2.1
The
assumed
7-1
describes
button,
the
that
the
COz2
DISPLAY
Service
N-6000
patient
water
CO2
corrected
numeric
conditions
of % (by
dry
body.
For
temperature
display
These
conditions
vapor,
expressed
to
display
volume)
gas.
Thus,
service
always
conventions,
service
then
pressing
SERVICE
service
CONVENTIONS
Screen
measures
conditions
The
N-6000
on
the
37° C body
in
units
(Body
Temperature,
are
the
front-panel
screen
described,
is
being
refers
displays,
although
screens,
the
soft
key.
screens
and
the
front-panel
displayed
applied
to
may
are
Display
partial
of
37° C
measures
temperature
of
mmHg
however,
to
laboratory
correct
cause
reached
second
To
return
not
available
Conventions
pressure
body
barometric
numeric
and
or
kPa,
Pressure,
on
the
front-panel
numeric
the
the
N-6000.
test
and
confusion.
from
the
and
fourth
to
the
main
until
of
CO2
(PCO2)
temperature
pressure
display
ambient
Saturated,
display
assumption
conditions.
appropriate
the
values
always
No
correction
pressure.
display,
main
soft
keys
monitoring
the
COz
and
are
assumed
are
or
refers
is
for
monitoring
(counting
sensor
in
the
patient
exhaled
directly.
When
also
converted
BTPS)
always
the
before
the
measured
to
to
BTPS
different
screen
the
screen,
has
warmed
airway
breath
By
convention,
to
be
measured
PCO2
is
being
conditions
made
that
is
made.
monitoring
far
left
press
adapter
fully
being
to
fully
displayed.
value
within
dry gas
Thus,
by
pressing
key
the
MENU
up.
saturated
all
from a patient
displayed
saturated
is
expressed
the
at
the
and
the
as
first),
key.
at
normal
with
readings
on
breath
When
as
patient's
room
service
test
and
of
and
the
units
%
screen
For
example,
saturated
front-panel
by
barometric
approximately
gas
will
the
On
the
adapter
mmHg
mmHg
gas
display
is
being
read
be
approximately
service
screen
other
at
the
(5%
times
and
kPa,
if a patient
with a true
will
pressure
1% lower
at
conditions
8%
assumes
hand,
same
760),
and
if
dry
barometric
8%
at
sea
deep
read
minus
values
lower
dry
gas
and
5.1
higher
level
(barometric
lung
end-tidal
38
mmHg,
water vapor
for
mmHg
of
room
because
gas
input.
with
5.0%
pressure
kPa.
The
in % for
pressure
PCO2
5.1
kPa,
and
partial
and
kPa
temperature
the
gas
source
CO2
from a tank
of
760
mmHg,
front-panel
the
same
equal
of
38
mmHg
5.3 % (%
pressure).
due
to
the
and
is
dry.
(the
patient)
is
being
the
service
display
reasons.
to
760
into
the
equals
The
service
service
The
is
applied
screen
will
read
mmHg)
patient
the
screen
service
actually
to
approximately
airway
pressure
screen
assumption
screen
fully
the
patient
displays
is
exhaling
of
CO2
will
reading
saturated
will
fully
adapter,
divided
read
that
in
airway
be
5.0%,
1%
higher
the
the
%
but
38
in
Page 54

Although
patient
values
monitoring a patient,
front-panel
722
The
from
spontaneous
of
ETCO2,
The
obtainable
simply
value
ETCO2.
patient.
the
monitoring
are
Breath
N-6000
maximum
the
value
of
average
of
ETCO2
The
above
used
for
numeric
Detection
detects
and
breaths
N-6000
ETCO2
from
the
all
seen
result
and
breaths
is a stable
conventions
laboratory
patient
and
minimum
with
that best
patient
within
monitoring,
ignore
display.
detects
and
counts
low
together
the
Display
during
the
and
estimates
ETCO2
may
seem
testing. A good
and
service
breaths
values
ETCO2
counts
last 8 seconds
screen.
of
End-Tidal
when
of
values
all
the
forced
to
display
value
confusing,
rule
the
service
When
CO2
the
GO2
CO2.
When a patient
followed
breaths
true
alveolar
exhalation.
the
ETCO2
and
displays
that
best
they
allow
of
thumb
screen
testing
Values
level
by a mechanical
accurately.
CO2
Unlike
value,
approximates
is
is
dry
crosses a threshold
on a ventilator
value
conventional
the
that
maximum
accurate
that
the
used
for
gas
in a test
breath
is
the
N-6000
the
arterial
|
readings
front-panel
bench
maximum
testing.
setup,
set
dynamically
has
several
with a higher
capnometers
looks
for
value
for
PaCO2
during
display
When
ignore
value
that
the
maximum
the
true
value
.
both
the
value
in
the
Software
SERVICE
BOOT
EEPROM
C02
DISPLAY
SPO2
ROM
BOARD
BOARD
Parameter
Version
soft
BOARD
Screen
key)
ROM
ROM
ROM
Table
(press
7-1:
Service
Screen
Function
FLASH
bootstrap
FLASH
version:
operating
COz
EPROM
LED
controller
microcontroller
software
SpO2
EPROM
memory
loader
software
Main
software
subsystem
version
display/keyboard
version
subsystem
version
Indications
version
product
software
software
Normal
Range
and
Tolerance
CO
BOARD
Service
STATUS
Screens
(press
CO2
soft
CO2
key)
board
status
0300
with
normal
sensor
operation.
connected
and
Page 55

Table
7-1:
Service
(continued)
Screen
Indications
RAW
BENCH
BARO.
C02
IN
RATIO
TEMP
PRESSURE
(operator-selected
IN
MMHG
units)
Calculated
peaks
amount
Sensor
Current
pressure
Uncompensated
CO2
units
ratio
used
to
of
CO2
temperature
barometric
in
current
of
bench.
determine
present.
detected
display
Varies
0.5
characteristics and
This
42.0°
the
the
error
temperature
Otherwise,
39° C after 7 minutes
precaution.
Displays
pressure
correcting
for
Displays
selected
This
Body
Saturated
temperature
screen
from
the
sensor
to
0.9.
is
microprocessor-regulated
C.
bench
monitor
is
generated
calibration.
value
Temperature,
reading
the
monitor.
to
sensor;
Depends
This
is
up
detects a breath.
the
current
in
mmHg
percentage
CO2
units
is
and
ETCO2
on
should
to
temperature
once
exceeds
temperature
barometric
that
value
(mmHg,
not
compensated
assumes
is
25"
C,
may
value
typically
bench
reading.
not
vary
An
the
bench
46.0°
C.
drops
as a safety
is
used
readings
in
operator-
kPa,
or
Pressure,
that
the
The
service
be
different
displayed
to
once
and
to
for
and
%).
for
by
Press
CO2
VALUES
HIGH
PEAK
DETECTOR
HEATER
MOTOR
and
SPEED
then
MORE
CO2
Bench
A
bias
Heater
Bench
signal
voltage
voltage
motor
speed
One
of
two
Typically
and
will
Will
vary
„used
to
compensate
gains.
This
heater
with
ambient
This
bench
typically
typical
is
the
in
room
is
the
motor
bench
3.5 V with
vary
sensor
voltage applied
the
temperature;
it
is
period
30.0
waveform
no
with
temperature.
to
sensor and
for
readings
sensor
typically 2 V.
in
head.
of
rotation
milliseconds.
ms;
+5:
peaks.
CO2
present,
is
sensor
are 1 to 2 V.
to
the
It
varies
at
25°
C
of
the
It
ms.
is
7-3
Page 56

Table
7-1:
Service
(continued)
Sereen
Indications
BIAS
LOW
SOURCE
HEAT
MOTOR
Press
CO2
VALUES
SENSOR
PEAK
CONT.
POT
REV.
and
then
SENSOR
Bias
control
Bench
IR
Heater
Setting
potentiometer
control
Indicates
of
format
Signal
source
control
of
sensor
voltage
electronic
revision
EEPROM
number
term
for
motor
level
data
Used
to
set
the
desired
voltage.
One
of
two
bench
voltages.
varies
present
The
this
source
voltage-regulated. A typical
reading
Used
and
temperature.
Setting
definitive
Used
data
It
is
typically 2 V
with
the
amount
and
with
voltage
will
in
varies
to
in
applied
vary
slightly
is
current-regulated,
is
2.5
V.
regulating
based
will
vary
typical
determine
the
Sensor
detector
waveform
and
of
CO2
temperature.
to
the
source;
because
the
temperature
on
ambient
0-255;
there
setting.
how
to
interpret
Memory
bias
peak
-
the
not
is
no
screen.
SENSOR
SERIAL
LAST
Press
DISPLAY
SEGMENT
DISPLAY
NUMBER
CAL
TIME
DATE
FAIL
CURRENT
DATA
Sensor
Sensor
Last
Indicates
Relative
LED
run
serial
calibration
displays
time
number
failed
current
date
LED
draw
Indicates
run
Electronic
Used
sensor
Should
non-zero
LED
Figure
the
Used
of
draw
Number
currently
total
time;
units
sensor
as
an
indication
calibration.
normally
number
digit.
7-1
shows
failed
LED
to
indicate
for
each
varies
on
accumulated
are
in
hours.
serial
be
indicates a failed
how
all
to
of
zeros;
number.
last
~
determine
digit.
relative
LED
with
the
display.
current
display
what’s
sensor
date
any
digit.
of
Page 57

Press
SPO2
Table
7-1:
Service
(continued)
Screen
Indications
CALIB.
INAMP
RED
IR
LED
Press
BOARD
SERIAL
HOURS
LED
MORE
INDEX
GAIN
DRIVE
DRIVE
NUMBER
IN
OPERATION
and
then
MAIN
Sensor
Index
Input
Red
Infrared
N-6000
Amplifier
LED
N-6000
Calibration
Gain
Drive
LED
Drive
serial
run
number
time
Shows
resistor
Shows
input
Relative
applied
the
in
current
amplifier.
amount
to
255.
Relative
applied
is 0 to
Electronic
N-6000;
EEPROM
processor
Indicates
the
amount
to
255
this
main
value
the
SpO2
setting
the
red
the
infrared
serial
number
on
the
circuit
total
hours
board.
of
the
sensor.
of
Range
of
power
LED.
of
power
number
is
original
board.
in
calibration
the
SpO2
is 0 to
Range
LED.
stored
255.
being
is 0
being
Range
of
the
in
main
operation
an
to
of
Press
POWER
DC
BATTERY
AC
MAINS
SUPPLY
VOLTAGE
Unregulated
voltage
Battery
Shows
voltage
power
DC
supply
source
When
indicates
supplied
regulators.
Indicates
rechargeable
charged
over
about
power
Shows
running
unregulated
to
present
battery
13
V;
the
10 V.
is
off.
either
the
on
AC
mains,
voltage
various
battery. A freshly-
indicates a little
system
Present
ON
system
voltage
shuts
only
or
OFF.
of
down
when
°
at
AC
Page 58

0000000000000000000000
tin
in
gl
it
iti
5 6 7 8 9
7.
Middle
8.
Right
9.
Left
10.
Right
11.
Alarm
1.
2.
3.
4.
5.
6.
Left
1
2
SpOz,
Middle
Right
Left
COz,
Right
Left
SpOz,
8 4
SpOa,
SpOz,
red
COa,
red
red
red
red
green
it
CO,
ia
it
10
1
SpOz,
SpOz,
green
CO2,
green
silence
green
green
Service
Pairs
|
Failed
display
digits
screen
7.3
CALIBRATION
Check
VIII,
resolving
To
1.
2.
the
mainstream
“Troubleshooting,”
them.
check
the
Ina
well-ventilated
plug
the
Turn
the
monitoring
the
MENU
DSABLE
Note:
The
8.
Let
the
4. . Usingthe
MENU
Press
the
back
to
AND
CO2
mainstream
sensor
mainstream
button,
the
into the
monitor
screen
button,
ALL
function
DISABLE
MENU
the
CO2
UNITS
monitoring
ACCURACY
sensor
discusses
sensor,
room,
N-6000.
ON
and
is
displayed.
the
ALARMS
key.
key
CO2
button,
SYSTEM
function
screen.
Figure
Non-zero
of
the
potential
follow
connect
let
the
Use
Press
may
not
sensor
run
change
function
key
7-1:
numbers
CHECK
N-6000
difficulties,
these
the
mainstream
device
function
the
warm
the
MENU
the
MENU
be
available,
in
this
units
key,
until
the
Failed
indicate
at
least
steps:
up
key,
the
to
depending
condition
of
measurement
then
selector
LED
Digits
failure.
once a year
their
possible
CO2
sensor
(approximately
button
to
disable
DISABLE
return
to
the
upon
for 15
minutes.
of
the
SYSTEM
is
on
“%",
to
ensure
causes,
to
an
45
seconds)
all
function
monitoring
custom
CO2
to
“%
VARIABLES
then
press
its
accuracy.
and
airway
audible
key,
followed
screen.
default
CO2":
function
MENU
suggestions
adapter
until
the
alarms:
by
settings.
press
the
key.
button
Section
for
and
press
the
to
get
5.
6.
7-6
To
view
fourth
SERVICE
Wait
15
air.
Check
adapter
CO2
values,
soft
keys
simultaneously;
SCREEN
minutes,
the
sensor
or
simulate a few
enter
should
then
observe
temperature;
the
service
(2)
now
be
thereading
breaths
screen:
press
SERVICE;
displayed.
of
it
should
to
deactivate
(1)
CO2
be
press
IN
+42
the
FREEZE,
(3)
press
%.
CO2
+0.25°
sensor
then
CO2
should
C.
Breathe
cool-down
press
The
be
at
through
safety
CO2
0%
the
second
BOARD
ーー
to
0.3%
the
airway
feature.
and
with
room
Page 59

Introduce a 10%
NELLCOR
N-6000.
Note:
The
GSTK-6000
COz
temperature.
displayed.
In
room
air,
the
must
be
5.0
+0.3%.
the
reading
Tf
desired,
key.
If
Services
should
this
the
mainstream
Department
quantity
values
The
ETCO2
screen
displayed
ETCO2
With
be
10.0
can
for
of
CO2
of a known
calibration
on
value
is
compensated.
reading
10%
must
CO2
+0.4%.
be
printed
CO2
sensor
assistance.
gas
kit)
into
the
service
be
0.0%
introduced
by
pushing
is
not
within
concentration
the
airway
screen
to
under
The
0.3%.
the
are
user
With
the
same
FREEZE
not
must
specifications,
(preferably
adapter.
Note
compensated
identify
」
5%
CO2
introduced,
barometric
button,
call
then
the
from
the
for
the
proper
pressure
the
Nelleor
a
reading
water
the
PRINT
Technical
on
the
vapor
or
value
reading
conditions,
SCRN
There
1.
are
The
levels
The
label
additional
then
To
.
ㆍ
Note:
system
continuously,
The
seen a breath
should
three
factors
first
factor
(room
air
second
says
factor
5.0%
mainstream
the
gas
source's
avoid
these
Use
calibration
gravimetrics
Make
concentration.
sure
Gas-sampling
provides
third
factor
rise
to
that
occur
is
conducting
is
not
0%
is
use
of a source
but
contains
CO2
accuracy
difficulties,
gas
method.
all
connections
test
calibrated
at a low
is
by
42°
nominal
that
the
breathing
C.
Repeat
during
CO2.).
the
test
The
this
test
of
4.6%).
One
sensors.
is
suspect
the
following
from a known
are
secure.
kit
GSTK-6000
gases
CO2
through
for
flow
rate
sensor
the
tests.
test
that
in a room
room
CO2
that
way
to
If
they
all
and
another
precautions
source,
Leaks
is
available
use
in
verifying
of
35
is
not
operating
airway
can
result
containing
must
be
well-ventilated.
does
not
match
check
this
is
are
consistently
gas
source
must
be
preferably
of
NBS
room
from
calibration.
cc/minute.
at
42°
adapter a few
in
unfavorable
significant
its
label
to
sample
the
high
should
observed:
traceable
air
will
decrease
Nellcor.
This
Gases
C.
Ensure
times.
The
situations:
background
(example:
canister
or
consistently
be
tried.
and
assayed
measured
gas-sampling
are
sampled
that
the
sensor
sensor’s
CO2
gas
canister
with
low,
by
a
CO2
has
temperature
Page 60

Page 61

8.1
INTRODUCTION
This
section
them.
interference,
There
and
those
second
If
the
following
Section
can
7,
are
that
be
“Test
describes
two
kinds
cause
erratic
caused
such
as
table
does
and
Calibration,”
potential
of
malfunctions:
behavior.
by
external
that
from
not
Troubleshooting
trouble
The
factors
an
electrosurgical
describe
the
for
additional
SECTION
symptoms,
those
first
kind
such
as
problem,
VIII
probable
that
cause
the
is a result
improper
unit.
refer
indications.
sensor
to
the
causes,
instrument
of
internal
use
service
and
suggestions
component
or
external
screens
not
to
operate
electrical
description
for
resolving
at
all,
failures;
in
the
Symptom
Instrument
Instrument
the
battery.
SpO2
pulse
tracking
the
cannot
operates
amplitude
pulse:
be
no
turned
on
AC
power
indicator
values
Table
on,
but
is
not
are
displayed,
8-1:
Troubleshooting
not
on
*
9
Connect
front-panel
on.
persists,
not
Technical
*
The
*
The
.
The
Check
*
Guide
Probable
to
If
the
indicator
check
resolve
battery
of
12
hours
the
battery.
battery
battery
defective.
Services
the
Sensor
plugged
Department.
sensor
or
in.
Cause
AC
power
battery
the
the
problem,
Services
may
is
required
fuse
may
or
the
Contact
and
sensor
sensor
extension
Check
and
verify
that
charging
is
off
AC
fuse(s).
Department.
be
discharged. A minimum
to
be
battery
Nellcor’s
them.
indicator
and
the
problem
If
this
contact
completely
open.
charger
extension
Nellcor's
Check
Technical
cable
may
cable:
may
the
is
does
recharge
it.
be
not
be
9
The
sensor
damaged.
or
extension
Replace
them.
cable
may
be
Page 62

SpO2
pulse
amplitude
tracking
the
(continued).
SpO2
pulse
amplitude
tracking
saturation
the
and
pulse:
pulse:
pulse
indicator
no
values
indicator
zero
display
rate.
Table
is
not
are
displayed
is
not
for
8-1:
oxygen
Troubleshooting
(continued)
Check
+
SpO2
'
Connect a NELLCOR
the
Sp02
should
should
9
Connect a NELLCOR
sensor
optical
other.
.
Connect
on
the
pulses
If
they
defective;
.
The
sensor
.
patient.
*
The
patient’s
instrument
Check
C-LOCK
instrument
try
another
OXISENSOR
Guide
module
sensor
be
40+1
be
81+1,
input
connector.
sensor
LED
intensity
an
oscilloscope
Main
Processor
should
do
not,
replace
máy
Check
perfusion
to
the
condition
ECG
on
sensor
operation:
PT-2500
input
connector.
and
the
saturation
sensor
to
Move
away
from
and
appear
the
oximetry
it.
be
improperly
should
on
change.
probe
to
PCB.
5V
the
oscilloscope
module
application.
may
be
detect
an
acceptable
of
the
patient;
synchronization;
yourself
R-15.
or
site; or
on
try
another
the
pocket
tester
Pulse
reading
the
SpO2
the
LEDs
toward
pin 1 of
logic-level
is
probably
applied
too
poor
pulse.
use
test
the
to
rate
and
each
U229
trace.
to
the
for
the
patient;
8-2
9
Check
SpO2
module
operation
as
listed
above.
Page 63

Pulse
there
amplitude
is
no
oxygen
indicator
saturation
Table
8-1:
tracks a pulse,
or
pulse
rate.
Troubleshooting
(continued)
but
©
The
allow
and
the
patient;
test
OXISENSOR
Guide
patient's
the
instrument
pulse
rate
pulse
bar).
use
the
instrument
perfusion
(fewer
Check
C-LOCK
on
R-15.
may
to
measure
than
two
the
condition
ECG
someone
be
too
low
to
saturation
to
three
bars
on
of
the
synchronization;
else;
or
try
the
SpO2
and/or
pulse
rapidly; pulse
Displayed
that
of
ECG
pulse
monitor.
rate
amplitude
rate
does
display
indicator
not
correlate
changes
erratic.
with
*
+
Excessive
impossible
pattern.
check
properly
use
sensor
tolerates
If
whether
applied,
C-LOCK
to a new
more
averaging
Excessive
impossible
pattern.
check
properly
use
sensor
tolerates
If
whether
applied,
C-LOCK
to a new
more
averaging
Excessive
impossible
pattern.
check
properly
use
sensor
tolerates
If
whether
applied,
C-LOCK
to a new
more
averaging
patient
for
motion
the
instrument
possible,
the
and replace
ECG
site;
motion;
mode
to
patient
for
motion
the
instrument
possible,
the
and
ECG
site;
motion;
mode
to
patient
for
motion
the
instrument
possible,
the
and
ECG
site;
motion;
mode
to
may
be
making
to
find
keep
the
patient
sensor
is
securely
it if
necessary;
synchronization;
use a sensor
or
set
10-15
keep
sensor
seconds
may
the
is
replace
synchronization;
use a sensor
or
set
10-15
seconds
may
keep
the
sensor
is
replace
that
the
SpO2
(Mode
be
making
to
find
patient
securely
it
if
necessary;
that
the
SpO2
(Mode
be
making
to
find
patient
securely
it
if
necessary;
synchronization;
use a sensor
or
set
10~15
seconds
the
that
SpOz
(Mode
the
pulse
still;
and
move
3).
the
pulse
still;
and
move
3)
the
pulse
still;
and
move
3).
it
the
it
the
it
the
The
patient
notch,
which
measurement
site.
If
C-LOCK
artifact
on
improve
manual
the
or
poor
ECG
quality
for
may
have a pronounced
causes
ECG
monitor.
that
the
to
double.
synchronization
quality
signal
Adjust
of
ECG
monitor.
pulse
rate
Try
another
ECG
signal.
may
Refer
dicrotic
sensor
is
in
use,
be
present
leads
to
an
to
the
8-3
Page 64

SpO2
measurement
the
value
calculated
determination.
does
not
correlate
from a blood
Table
gas
8-1:
Troubleshooting
(continued)
with
.
Guide
The
calculation
adjusted
relevant
for
PaCO2,
hemoglobin.
have
been
relevant
variables.
saturation
CO-Oximeter
may
not
the effects
of
2,3-DPG,
Check
whether
appropriately
In
general,
values
are
not
measurements.
have
been
pH,
temperature-
or
fetal
calculations
corrected
calculated
as
reliable
correctly
-
for
as
direct
SpOz
does
Oximeter.
not
correlate
with
laboratory
CO-.
Accuracy
application
dysfunctional
dyes,
movement,
electrosurgical
of a sensor
pressure
intravascular
warnings,
operator’s
directions
Fractional
+
converted
the
comparison
well
functional
oximeters,
Laboratory
multi-wavelength
fractional
measurements
functional
The
equation
found
Section
requires
oximeter
simultaneously
supply.
can
be
or
use,
hemoglobins,
bright
light,
venous
interference,
on an
cuff,
arterial
line.
and
cautions
manual,
for
use.
measurements
to
functional
was
as
two-wavelength
saturation.
such
282
CO-Oximeter
saturation.
must
measurements
used
in
the
“Principles
II
of
this
that
the
measurement
affected
significant
excessive
pulsations,
extremity
catheter,
Observe
in
and
in
measurements
made.
Multi-wavelength
as
the
Instrumentation
oximeters,
Fractional
be
converted
to
make
manual.
blood
sampling
be
from
the
by
incorrect
levels
intravascular
patient
and
placement
that
has a blood
or
all
instructions,
this
manual,
the
SpO2
may
not
The N-6000,
oximeters,
and
measure
to
for
comparison.
this
conversion
of
Operation”
Close
correlation
and
obtained
same
arterial
sensor
of
the
sensor
have
been
before
as
measure
Corning
in
pulse
is
8-4
Page 65

Table
8-1:
Troubleshooting
(continued)
Guide
ETCO?2
value
obtained
ETCO2
waveform
does
from
display
or
value.
not
blood
window
match
gas
is
pC02
sample.
not
showing a C02
values
Ventilation/perfusion
clinically
physiologic
Check
circuit
N20
for
at
may
present;
situation.
leaks
in
the
airway
be
present;
consider
the
mode.
Elevated
compensation
The
the
Sensor
the
Monitor
the
N-6000
patient
levels
N-6000
display
may
system
for
be
GSTK-6000.
may
be
CO2/SpO2
may
not
airway;
of
O2
mode.
status
out
of
in
the
monitoring
be
connected
verify
connections,
mismatching
patient’s
patient
adapter.
use
N20
may
be
may
have
messages.
calibration;
SpO2
mode;
mode.
secure
may
ventilation
compensation
in
use;
use
an
error;
verify
change
correctly
and
proper
O2
check
with
to
the
be
to
CO2
module
check
the
Water
may
occlude
replace
may
have
display
for
condensation
sapphire
ADAP-UC,
an
status
or
patient
windows;
as
required.
internal
messages.
secretions
clean
error;
or
Page 66

82
ADVISORY
MESSAGES
Advisory
messages
the
message
AIRWAY
+.
CO2/Sp02
¢.
COz
+.
PULSE
*
messages
are
no
are
displayed
longer
displayed
on
exists.
ADAPTER
The
message
airway
indicates
adapter.
Other
electromechanical
SENSOR
If
the
sensor
physiological
sounds.
To
SENSOR
The
CO2
sensor
requires a short
SENSOR
WARMING
NOT
is
removed,
signal
clear
WARMING
may
time
SEARCH
Indicates
is
initially
displayed
lost,
ALARM
that
the
connected
without a tone.
an
alarming
SILENCE
by
the
display
OCCLUDED
that
causes
faults.
CONNECTED
has
this
alarm,
UP
be
at a temperature
period
UP
SpO2
sensor
to
the
pulse
search
button
the
the
the
system
screén
CO2
include
SENSOR
to
provide
and
will
bench
obstructions
NOT
been detected and
press
the
ALARM
that
to
warm
up
to
message
monitor
If a valid
is
displayed
is
connected
and
physiological
condition
not
is
twice.
information
disappear
signal
is
CONNECTED
the
sensor
SILENCE
is
below
the
desired
during
but
no
to
the
pulse
activated.
to
the
when
the
reduced
on
the
due
to
sapphire
message
is
removed,
button
the
specified
operating
pulse
this
is
temperature.
time
being
detected.
patient, a pulse
is
detected
To
clear
this
operator.
underlying
an
obstruction
windows
is
displayed.
an
audio
twice.
operating
period.
search
and
then
alarm,
Advisory
reason
or
for
of
the
internal
If
a
alarm
range
and
The
CO2
When a sensor
message
the
press
is
pulse
the
is
8-6
TREND
.
This
have
contact
any function
CUSTOM
.
This
factory
continue.
‘
representative
DATA
message
occurred
Nellcor’s
DEFAULTS
message
default
LOST,
is
if
key
is
settings
Contact
for
ERROR
displayed
the
battery was
Technical
to
clear
LOST,
displayed
ERROR
will
Nellcor's
further
125
at
power-up
disconnected.
Services
the
message
126
at
power-up
be
used.
Technical
information.
if
stored
If
Department
and
continue.
if
the
custom
Press any
Services
trend
data
the
battery
or
Nellcor’s
default
function
key
Department
have been
has
not
lost.
been
representative.
settings
to
or
have been
clear
the
Nellcor's
This
may
replaced,
Press
lost;
message
the
and
Page 67

8.3
STATUS
A
status
identified
troubleshooting
the
case
8.3.1
Main
MESSAGES
message
by a module
of a defective
System
is
the
Errors
problem.
displayed
identifier
Most
submodule,
when
and
the
an
an
error
submodule
error
condition
error
code
messages
number
can
will
occurs.
be
be
An
that
cleared
automatically
error
will
by
pressing
condition
assist
service
disabled.
any
will
be
personnel
function
in
key.
In
Exror
”
“104
122
125
126
8.3.2
Error
8.3.3
Error
Code
101
102
103
CO2
Code
201
202
205
206
210
C02
Code
Subsystem
CO2
C02
CO2
CO2
C02/host
Sensor
Errors
Meaning
Meaning
RAM
ROM
Noritake
TREND
LED
segment
EEPROM
Custom
Errors
nin
RAM
ROM
analog
general
error
error
out
RAM
error
error
data
error
defaults
error
error
error
communications
error
hardware
failure
error
R
Turn
ON/STANDBY
20
message
personnel
For
function
R
The
automatically
operational.
then
personnel
regarding
R
nded
the
N-6000
seconds,
error
then
persists,
or
conditions
key
nded
capnography
retry.
Contact
or
the
ded
C
off
by
button.
turn
contact
Nelicor’s
125
to
continue.
C
subsystem
halted and
Cycle
mains
qualified
Nelicor’s
capnography
C
ive
Acti
pressing
Wait
it
back
representative.
and
ive
is
power
representative
ive
the
at
least
on.
If
the
qualified
126,
press
Acti
is
not
on
service
subsystem.
Acti
service
any
and
off,
250
252
260
261
262
CO2
Sensor
CO2
Sensor
COz
Sensor
CO2
Sensor
This
message
monitoring
drops
below
more.
COz
Sensor
‘This
message
monitoring
rises
above
more.
General
EEPROM
Temperature
Temperature
if
36°
Temperature
if
46” C for
Failure.
appears
sensor
C for
appears
sensor
30
Error.
Failure.
Too
Low.
while
temperature
30
seconds
Too
High.
while
temperature
seconds
The
operational
CO2
CO2
the
airway
heat
or
an
external
service
representative
repaired.
Retry
or
error
Technical
capnography
because
sensor.
sensor.
or
sensor
continues
Disconnect,
Try
adapter.
cold
being
source.
personnel
to
(see
Services
subsystem
of a problem
another
Check
applied
Contact
or
Nellcor's
have
the
procedure
to
persist,
Department.
is
then
CO2
for
to
the
qualified
CO2
above).
contact
not
with
the
reconnect
sensor.
excessive
sensor
Clean
sensor
If
the
Nellcor’s
the
from
8-7
Page 68

8.3.3
CO2
Sensor
Errors
(continued)
Error
270
280
290
8.3.4
SpO2
Error
301
302
310
Code © Meaning
C02
Sensor
Range.
This
message
sensor
too
fast
C02
Sensor
Mismatch.
This
message
sensor
EEPROM
Nellcor
indication
sensor’s
Subsystem
Code
Sensor
‘Meaning
SpO2
SpO2
Sp02/host
low
Errors
RAM
ROM
Motor
Speed
appears
chopper
or
too
motor
slow.
Manufacturer
appears
ID
stored
does
ID.
It
in
not
also
match
may
of a fault
EEPROM.
signal
fault.
error
error
communications
Out
when
is
running
ID
when
the
monitor’s
be
in
the
of
the
the
the
an
error
Recommended
The
capnography
operational
CO2
sensor.
CO2
sensor.
the
airway
is
illuminated.
an
obstruction.
personnel
have
Retry
error
Technical
R
The
Contact
Nellcor's
oximetry
or
the
CO2
sensor
continues
nd
oximetry
qualified
representative
subsystem.
Corrective
subsystem
because
Disconnect,
Try
adapter.
Nellcor's
(see
Services
of a problem
another
Check
Check
Contact
sensor
procedure
to
persist,
AC
subsystem
service
Action
is
not
then
reconnect
CO2
sensor.
that
the
the
optical
qualified
representative
repaired.
above).
contact
Department.
내
A
*
is
not
operational.
personnel
regarding
with
the
Clean
IR
source
path
for
service
to
If
the
Nellcor’s
-
or
the
the
8-8
Page 69

9.1
INTRODUCTION
This
section
lists
N-6000
spare
parts,
SECTION
Spare
both
Parts
electrical
IX
and
mechanical.
Description
Main
Processor
Power
Display
CO2
Oximetry
Display...............
Battery.......................
Transformer
Bezel.
Speaker
Bezel
Upper
Lower
Chassis.................
Pull-OutCardTray........................
Supply-Charger
Controller
Module
Assembly......
Assembly
Keypad..............................
Bracket.......
RearPanellugwithhardware..........................
Rubber
Cover/Handle
Handle
Handle
Power
Sensor
Harness
Ribbon
Ribbon
Ribbon
Ribbon
RibbonCable,34-Conductor.........................................
A
Display
Fuse
Filter........................
Filter
TiltStandFoot..............................
Mounting
..............
Entry
Door..............
Cable,
Cable,
Cable,
Cable,
Shield....
holder.
Bezel
PCB.......................,,,...,,.,,.,,.,,
PCB
Lei
PGB.................................
..............
Module...
Assembly
.
N
...
... ...
..
Bracket.
Foot
Module..
Assembly......
IN
Assembly
Holder.........
Assembly..
Clips...
10-Conductor...
14-Conductor...............
26-Conductor,
26-Conductor,
ea
5-1/2
1-3/4
ーー
inch..
inch..
een
トー
Le
トト
erene
トト
eee
トー
44e
nk
トー
eee
ドー
ドー
トー
トト し し て いい
...
P O K Pe K R K Ren
トト
トット
oenesssse
ーー
...
て て
て
いて
て
Nellcor
ον
o
...
tee
...
て
...
…
...
...
...
ーー
...
ων
ας
て
Part
026414
026413
026419
026418
MP-203
026420
026417
026416
026415
026421
024612
024613
024614
024615
024616
024617
025409
024620
024622
024623
026422
024646
024630
024635
024636
024637
024638
024639
024640
,
024642
024626
024676
024677
025398
Number
9-1
Page 70

Page 71

10.1
This
OVERVIEW
section
contains
PCB
drawings,
SECTION
Component
showing
component
X
Location
location.
Drawing
Oximetry
CO2
Module
Main
Processor
Power
Supply-Charger
Module
Component
Component
PCB
Component
Location
Location
PCBComponentlocation.................................
...............
...........
Location..........
e
eee
Page
10-3
…
10-5
...
10-9
10-7
10-1
Page 72

Page 73

404
этрой
me
a
js
a:
a
NE
sa
и
sm
LE
mi:
ms
si
eğ
si
EE
м:
м
da
ds
e
Mn
E
am
η
NE
s
DT.
LIÉE]
"a
4
AAA
외르
티르
티토
e
MA
ви:
É
ms
ECS
dá
a?
do
i
dna
oi
μα
ad
ви:
do
вы:
CE
TE
an
Gea:
chao
ин
Алешико
+
m
LTE
È)
HIHI
OYUN
Cs
Sa
1
10101
mi
s
MEM
mag
Te
o
+
oni
o
Emi
1
ROOS-INIA
Page 74

ce
CR
CEE
O
Sel
ets
al
ce
le
E
Us
AI
209
этром
5-01
а9ч
Page 75

10-7
PCB
a
EI
ul
L
|
9221
8200.
oben
Om
SO
고
g
O
|
hm,
|
=-
3
803
C
ante
品
=e
Td
=
器
È
ck
Jas
em
=
トド
ÇI;
eC]
Las
y
E
gi
lea]
Has
62%
Ag+
|
대
μα
©
mm
do.
4
I
[on
Fo
a
[
т
Lda
网
ot
80
E
e
GQ
M
È
300
8
m
e
-Br
=
È
io
—=_
LO
m
LL
реж
O
"
a
8
a
ic
im
ο
ο
por
Ss
ob
SI
©
一
o
PE
DI
me
CRCI
oo
OII
80
IM
seu
aC}
¿ODO
=
DA
eo
a
Eee
E
마그
5
一
[EFD
Fa
©
z
¿O
¿E
회
CH
č
El)
8
¿CO
É
AP
o
ol
RÉ
С
of
ROD
SPEEDO
O
Di
让
Nad
二
30
¿O
ODO
C
CE
MS
IC]
807
OH
EO
E
O
—
yer
LE
og
TOT
때
Πιω
id
Processor
Main
>=
Page 76

Power
Supply-Charger PCB
 Loading...