

Page 1

Metrohm AG CH-9101 Herisau (Switzerland)
Metrodata
Vesuv 3.0 6.6008.XXX
Please use the on-line help (key <F1>) for more information.
8.110.8133
99.04 Ti
Page 2

Contents
1. Introduction.......................................................................................... 1
Purpose of program......................................................................... 1
System requirements ...................................................................... 2
Installation of the program............................................................... 3
2. Connecting devices ............................................................................. 5
Overview..........................................................................................5
Preparing the interfaces.................................................................. 6
Connecting devices.........................................................................8
Installing Vesuv..................................................................... 4
Uninstalling Vesuv................................................................ 4
USB Port Server...................................................................6
Moxa C218 Turbo ISA board................................................ 6
Softswitch 2000.................................................................... 7
Titrino.................................................................................... 8
726 Titroprocessor................................................................ 9
756 KF Coulometer ............................................................ 11
737 KF Coulometer ............................................................ 12
691 pH Meter...................................................................... 13
692, 713 pH Meter.............................................................. 14
712 Conductometer............................................................15
730 Sample Changer.......................................................... 16
707, 768 KF Oven .............................................................. 17
Balance............................................................................... 18
3. Tutorial................................................................................................ 19
General remarks............................................................................ 19
Working with the datalogger.......................................................... 20
Receive and view data........................................................ 21
Properties of the device window......................................... 21
Save/Restore device methods............................................ 22
Managing the determination results .............................................. 24
Determinations table...........................................................24
Reducing the number of data sets, filter............................. 25
Exporting data from Vesuv into Excel................................. 26
Curves ................................................................................ 27
Vesuv 3.0 Contents • i
Page 3

4. Password ............................................................................................29
Overview........................................................................................29
Management of access rights and users ............................30
Enter/modify password........................................................31
Login...................................................................................31
5. Datalogger...........................................................................................33
Overview........................................................................................33
Datalogger toolbar...............................................................34
How to start work with the Datalogger.................................35
Device manager.............................................................................36
Add new instrument ............................................................37
Port parameters..................................................................37
Softswitch ......................................................................................39
Device windows for analytical instruments.....................................40
Show received data.............................................................41
Communication test............................................................41
Device window properties..............................................................43
General properties ..............................................................43
Communication...................................................................43
Device monitoring ...............................................................44
Database selection .............................................................47
Reports ...............................................................................48
Options................................................................................49
Device methods.............................................................................51
Method backup ...................................................................51
Restore methods.................................................................52
Balance window.............................................................................54
Overview.............................................................................54
Balance log file....................................................................54
Options................................................................................55
Assign balance manually ....................................................56
Assign balance automatically..............................................57
Detach balance...................................................................58
Datalogger options.........................................................................59
General...............................................................................59
Default directories...............................................................59
Management of user names...............................................60
Communication...................................................................60
Configurations................................................................................61
ii • Contents Vesuv 3.0
Page 4

6. Database............................................................................................. 63
Overview........................................................................................63
Toolbar of the database...................................................... 64
Determinations table ..................................................................... 65
Representation of the determinations table........................ 66
More columns of the determinations table.......................... 68
Edit columns of determinations table..................................68
Data management......................................................................... 70
Sort.....................................................................................70
Filter.................................................................................... 70
Find..................................................................................... 72
Printing.......................................................................................... 74
Printing determinations table.............................................. 74
Printing Vesuv reports ........................................................ 74
Creating your own report templates.................................... 76
Printing raw reports............................................................. 77
Export data.................................................................................... 78
Export settings.................................................................... 79
Export formats.................................................................... 80
Curve............................................................................................. 82
Data for curve display......................................................... 82
Curve colors, fonts..............................................................84
Curve scaling...................................................................... 84
Curve grid........................................................................... 85
EP display in the curve....................................................... 85
Labels.................................................................................85
Curve options...................................................................... 86
Curve overlay...................................................................... 86
Navigator ............................................................................ 86
Re-evaluation, recalculation..........................................................87
Re-evaluation, recalculation ............................................... 87
Recalculate results ............................................................. 88
Show variables and formulas.............................................. 89
List of calculation variables for Titrinos and 756 KF
Coulometer.........................................................................89
List of calculation variables for 726 Titroprocessor............. 90
Reset original results.......................................................... 90
Statistics............................................................................. 91
More windows................................................................................ 92
Raw reports ........................................................................ 92
Endpoints............................................................................ 93
Options of the database................................................................94
General............................................................................... 94
Monitoring of database.......................................................94
Auxiliary functions ......................................................................... 96
Remark...............................................................................96
Refresh data.......................................................................96
Database template ............................................................. 96
Compress database ........................................................... 97
Repair database................................................................. 97
Vesuv 3.0 Contents • iii
Page 5

7. Troubleshooting .................................................................................99
General..........................................................................................99
Data transfer................................................................................100
Printing.........................................................................................103
Database .....................................................................................105
8. Appendix ...........................................................................................107
Software license ..........................................................................107
Scope of delivery and ordering designations...............................108
Index......................................................................................................110
iv • Contents Vesuv 3.0
Page 6

1. Introduction
This chapter describes the system requirements of your PC
and the installation of the program.
Purpose of program
The name Vesuv is an abbreviation of "Verification Support
for Validation". Vesuv serves to receive data from analytical
devices (determination data) and to store the data in a database. You may as well save determination methods from
your devices in the PC.
Vesuv supports the GLP guidelines and offers great working
comfort:
• Connection of balances to the PC and distribution
of balance data to the connected analytical devices. The balances can be assigned to the devices either manually or automatically, see pages
56 and 57.
• Vesuv works autonomously in the background
which doesn't force your lab personnel to learn a
lot about the program.
• Extensive password protection.
• Monitoring of time intervals for
. the calibration of the analytical devices
. the execution of GLP tests
. the maintenance of the devices
. backup and compressing the database
• Monitoring of the size of the database
Vesuv 3.0 1. Introduction • 1
Page 7

The program consists of 2 parts:
1. The Datalogger (see pages 33ff) receives the determination results of the connected devices. Depending on the
program version you may connect up to 2 or up to 64 devices. You can also connect balances and assign these
balances to your analytical devices.
Within the Datalogger you can also save the methods of
your devices and monitor a time interval for the calibration, GLP test and maintenance of your devices.
2. The Database (see pages 63ff) represents the determination results in a table which allows you to easily manage your data. Furthermore you have:
• Sort and search functions.
• Filters which display only those data sets which meet
your prescribed criteria.
• Export functions for other programs, e.g. Excel or
LIMS.
• The data can be validated and if necessary recalcu-
lated and/or re-evaluated.
• Very flexible curve representation.
• Several curves can be overlaid in order to compare
them.
• Reports are printed in the flexible HTML format.
System requirements
Computer recommended Pentium Processor 133
RAM min. 64 Mbytes
Operating system Windows 95, 98 or
Disk space recommended min. 250 Mbytes for pro-
ComPorts ≥ 1 ComPort, depending on the number
MHz or equal
Windows NT 4.0 (SR3)
gram and data
of connected devices
Graphics adapter recommended min. 256 colors, repre-
sentation 800x600 pixel
2 • 1. Introduction Vesuv 3.0
Page 8
Installation of the program
The installation program copies the files from the installation
CD to the drive and directory you specify and creates the
following sub-directories:
Vesuv
Includes all files needed for the program pack-
Bin
age.
Drivers
Databases
Contains the device drivers.
Default directory for Vesuv databases.
Includes templates:
Templates
. for Vesuv databases, e.g. for different devices
. for different report layouts
Exports
Default directory for data exported from the Vesuv database.
Methods
Default directory for device methods saved by
Vesuv.
Settings
Default directory for saved filters (*.flt) and export
settings (*.exp) of the database.
For printing you need the Internet Explorer 4.0 or higher. You
will find the Internet Explorer 4.0 on the installation CD together with Vesuv and you can install it.
The installation program automatically sets the receive buffers of PC COM's to low (setting in windows system: <Start>,
Settings, Control panel, System, Device manager, Ports, Advanced).
Some computers have a power save mode which switches
the CPU of the computer off after a certain time without key
stroke. This power save mode must be switched off.
For Windows NT
Log-in as user with administrator access to install the program.
Vesuv 3.0 1. Introduction • 3
Page 9

Installing Vesuv
Start Windows. Find a drive that has at least 100 Mbytes free
storage space.
Insert installation CD and open this drive. A start page with a
selection of programs appears. Select Vesuv 3.0.
During the installation, the following entries are requested:
• language of Vesuv. The program is available in English
and German.
• If you don't have an Internet Explorer 4.0 or higher on
your PC, you may install it in its standard version.
• path where Vesuv should be installed
The 6.2145.040 (for up to 64 devices) or 6.2145.050 (for up
to 2 devices) Dongle is part of the scope of delivery of the full
program version. Set this Dongle on LPT-Port 1 or 2. The
printer cable is set onto the Dongle. Starting Vesuv, the
Dongle will be checked.
Please send us your registration card as soon as possible so
that we can register you as an official user of Vesuv. Only
registered users will get updated program versions at a special price.
A demonstration version can be used for 100 days. After this
100 days you may continue to use the Vesuv database. The
datalogger is not accessible anymore, e.g. you can't receive
new data. You can upgrade your demonstration version at
any time if you set a 6.2145.040 or 6.2145.050 Dongle on the
LPT Port of your computer.
Uninstalling Vesuv
You can uninstall Vesuv at any time:
Windows <Start>-Button
Settings
Control panel
Software
Select the program folder (usually Vesuv)
Button <Add/Remove>
After uninstalling Vesuv you will get a dialog with the button
<Detail>. Here you will find a list of directories which could
not be deleted. All directories containing your own data will
not be deleted on uninstallation.
4 • 1. Introduction Vesuv 3.0
Page 10

2. Connecting devices
This chapter describes the connection of the devices to the
PC. You will also find information about how to multiply the
COM ports of your PC.
Overview
The following devices can work with Vesuv:
• 701, 702, 716, 718, 719, 720, 736, 751, 758, 784, 785
Titrinos, see page 8.
• 726 Titroprocessor, see page 9.
• 737, 756 KF Coulometers, see page 11f.
• 691, 692, 713 pH Meters, see page 13f.
• 712 Conductometer, see page 15.
• 730 Sample Changer (to save methods and the configu-
ration), see page 16.
• 707, 768 KF Ovens, see page 17.
• several balances, see page 18.
Vesuv 3.0 2. Connecting devices • 5
Page 11

Preparing the interfaces
You get additional serial ports (COM ports) with an extension
board or with a Softswitch.
The following boards have been tested and can be ordered
from Metrohm:
• USB Port Server
• Moxa C218 Turbo ISA
• Softswitch 2000
USB Port Server
Metrohm ordering number: 2.145.0310
With the USB Port Server you can get 4 additional 9pin
COM's. The board is connected to the USB port of your PC.
With an USB port switch on your PC you can connect several
USB Port Servers.
For details about the installation of this board see the manual
of the board.
The USB Port Server can be used with Windows 95 and 98.
Windows NT 4.0 is not (yet) supported.
Moxa C218 Turbo ISA board
Metrohm ordering number: 2.145.0240
The board opens 8 additional 25pin COM's. The board has to
be plugged into your PC.
For details about the installation of this board see the manual
of the board.
6 • 2. Connecting devices Vesuv 3.0
Page 12

Softswitch 2000
Metrohm ordering numbers:
Softswitch 2000 (for 4 devices) with power adapter 220 V 2.145.0014
Softswitch 2000 (for 4 devices) with power adapter 110 V 2.145.0015
Extension box (for 4 further devices) 2.145.0020
Cable Softswitch-PC, 25 pin 6.2125.020
Cable Softswitch-PC, 9 pin 6.2125.020+6.2125.010
The Softswitch 2000 has 4 x 25pin ports. In addition, the
Softswitch can be equipped with up to 3 extension boxes
(each for 4 devices) so that you can connect up to 16 devices
to one serial port of your computer.
The connected devices are operated automatically via the
Softswitch. Each configured and enabled device is serviced.
A red LED at the Softswitch indicates the active connection.
Important
• All devices which are connected to the Softswitch must
have the same RS parameters as the Softswitch and operate with a software handshake (SWchar).
• Balances and the 756 and 737 KF Coulometers can't be
connected to the Softswitch. They must be connected directly to a COM port.
• The Softswitch can't be connected to a COM of an extension board. Connect it directly to PC COM.
Vesuv 3.0 2. Connecting devices • 7
Page 13

Connecting devices
Titrino
Cables
Titrino 25pin, PC 25pin 6.2125.060
Titrino 25pin, PC 9pin 6.2125.110
Titrino 9pin, PC 25pin 6.2125.110
Titrino 9pin, PC 9pin 6.2134.040
If possible work with the following RS parameters: 9600
Baud, 8 Data Bit, 1 Stop Bit and no parity. The handshake
must be set as follows:
• HWs (if the Titrino is connected to a COM port)
• SWchar (if the Titrino is connected via a Softswitch)
The RS parameters can be set on the Titrino in key
<configuration>, >RS settings.
Notes
• At the end of the titration at least the following reports
should be transmitted:
Full;Calc;MpList (if present)
In the mode CAL: Calib.
Set on the Titrino under "<DEF>, >Report" (COM1).
You can also send additional reports which can be stored
in the database and/or printed out.
Important: Don't send any curves from the Titrino to Vesuv! The Vesuv curve is created from the measuring
point list which the Titrino transmits.
• If you are working with TIP and require a separate record
for TIP in the database, then at the end of the TIP sequence a pause should be made which is longer than the
"Timeout" of Vesuv.
• Titrinos with 2 RS interfaces
e.g. 751, 758, 784, 785 Titrinos: Connect the PC to COM
port 1 of the Titrino.
• 751, 758 Titrinos
If you use Italian for the instrument dialog then you require the program versions 5.751.0011 and 5.758.0011
or higher.
• 701 KF Titrino
Transmit the full report. Setting on the Titrino under
"<Parameters>, >preselections"
8 • 2. Connecting devices Vesuv 3.0
Page 14

726 Titroprocessor
Cables
PC 25pin 6.2125.060
PC 9pin 6.2125.110
If possible work with the following RS parameters: 9600
Baud, 8 Data Bit, 1 Stop Bit and no parity. The handshake
must be set as follows:
• HWs (if the Titroprocessor is connected to a COM port)
• SWchar (if the Titroprocessor is connected via a Soft-
switch)
The RS parameters can be set on the Titroprocessor in
"Config, Interfaces".
Notes
• For working with Vesuv you need program version
5.726.0012 or higher.
• Transmit at least the raw data report:
settings on 726 Titroprocessor under "Methods, *Report"
If you want to store reports, you should also transmit the
report "Methods, *Standard".
Important: Don't send any curves from the Titroprocessor to Vesuv! The Vesuv curve is created from the
measuring point list which the Titroprocessor transmits.
• The report must be transmitted and not printed out.
• Set data transfer to "LIMS":
settings under "Config, Interfaces"
• If you are working with a balance which is connected to
the PC then you must first select the balance type on the
726 Titroprocessor.
Setting under "Config, Interfaces "
• Only the first line of the report header can be read into
the database.
• If sample data (sample identifications, weight) are altered
during the determination then they may differ in the individual sub-determinations.
• Equations with special expressions (TST) cannot be recalculated in Vesuv.
Vesuv 3.0 2. Connecting devices • 9
Page 15

• The raw reports cannot be printed out on the PC printer
immediately after the determination. Use the internal
printer of the Titroprocessor for this.
10 • 2. Connecting devices Vesuv 3.0
Page 16

756 KF Coulometer
Cables
PC 25pin 6.2125.110
PC 9pin 6.2134.040
If possible work with the following RS parameters: 9600
Baud, 8 Data Bit, 1 Stop Bit, no parity, handshake "HWs".
The Coulometer cannot be connected via a Softswitch.
The RS parameters can be set on the Coulometer in key
<CONFIG>, >RS settings COM1.
Notes
• Connect the PC to COM port 1 of the Coulometer.
• The 756 KF Coulometer can't be connected to a Soft-
switch. Connect it directly to a PC port or to a port of an
extension board.
• At the end of the titrations transmit at least the following
reports:
Result;Calc;MpList
Settings on the Coulometer under "<DEF>, >Report,
COM1"
You can also send additional reports which can be stored
in the database and/or printed out.
Important: Don't send any curves from the Coulometer
to Vesuv! The Vesuv curve is created from the measuring
point list which the Coulometer transmits.
• If the Coulometer is operated by Vesuv then the report
identification, the date and method lines will be automatically switched on in the report. This ensures that the report is correctly recognized and read out.
Vesuv 3.0 2. Connecting devices • 11
Page 17

737 KF Coulometer
Cables
PC 25pin 6.2125.060
PC 9pin 6.2125.110
If possible work with the following RS parameters: 9600
Baud, 8 Data Bit, 1 Stop Bit, no parity, handshake "HWs".
The Coulometer cannot be connected via a Softswitch.
The RS parameters can be set on the Coulometer in key
<CONFIG>, >RS SETTINGS.
Notes
• The 737 KF Coulometer can't be connected to a Softswitch. Connect it directly to a PC port or to a port of an
extension board.
• If you want to show curves in the database then transmit
the measuring point list.
Settings under "<CONFIG>, AUXILIARIES"
MP.LIST: ON
TIME INTERV. 1 S (the time interval must be smaller
than the timeout in Vesuv)
12 • 2. Connecting devices Vesuv 3.0
Page 18

691 pH Meter
Cables
PC 25pin 6.2125.060
PC 9pin 6.2125.110
If possible work with the following RS parameters: 9600
Baud, 8 Data Bit, 1 Stop Bit and no parity. The handshake
must be set as follows:
• HWs (if the pH Meter is connected to a COM port)
• SWchar (if the pH Meter is connected via a Softswitch)
The RS parameters are set on the pH Meter as follows:
Switch pH Meter on + press "ref->M" key
SE 1 (switch on transmission)
Set baud rate and bit length correctly
HS 0 (handshake)
Exit settings with the "mode" key.
Drift-controlled transmission is triggered with the "->" key.
In the calibration report a line can be created in the database
for each buffer.
Vesuv 3.0 2. Connecting devices • 13
Page 19

692, 713 pH Meter
Cables
PC 25pin 6.2125.060
PC 9pin 6.2125.110
If possible work with the following RS parameters: 9600
Baud, 8 Data Bit, 1 Stop Bit and no parity. The handshake
must be set as follows:
• HWs (if the pH Meter is connected to a COM port)
• SWchar (if the pH Meter is connected via a Softswitch)
The RS parameters can be set on the pH Meter in key
<configuration>, >RS settings.
Settings on the pH Meter
• Always transmit the print header:
settings under "<config>, >printer"
• Switch off date/time transmission for each measurement:
settings under "<config>, >print meas.value"
• Do not switch off sample number:
settings under "<config>, >auxiliaries"
• Only transmit reports without embedded graphics, i.e.
short reports for calibrations, electrode test, ion measurements
14 • 2. Connecting devices Vesuv 3.0
Page 20

712 Conductometer
Cables
PC 25pin 6.2125.060
PC 9pin 6.2125.110
If possible work with the following RS parameters: 9600
Baud, 8 Data Bit, 1 Stop Bit and no parity. The handshake
must be set as follows:
• HWs (if the Conductometer is connected to a COM port)
• SWchar (if the Conductometer is connected via a Soft-
switch)
The RS parameters can be set on the Conductometer in key
<configuration>, >RS settings.
Settings on the Conductometer
• For proper functioning you need the Conductometer program version 712.0015 or higher.
• Always transmit the print header:
settings under "<config>, >printer"
• Switch off date/time transmission for each measurement:
settings under "<config>, >print meas.value"
• Do not switch off sample number:
settings under "<config>, >auxiliaries"
• Only transmit reports without embedded graphics, i.e.
short reports for cal T
Vesuv 3.0 2. Connecting devices • 15
Page 21

730 Sample Changer
Cables
PC 25pin 6.2125.060
PC 9pin 6.2125.110
If possible work with the following RS parameters: 9600
Baud, 8 Data Bit, 1 Stop Bit and no parity. The handshake
must be set as follows:
• HWs (if the Sample Changer is connected to a COM port)
• SWchar (if the Sample Changer is connected via a Soft-
switch)
The RS parameters can be set on the Sample Changer in
key <CONFIG>, >RS232 settings.
Notes
• With the Sample Changer methods and configurations
can be stored and reloaded.
• Reports from the Sample Changer can be stored in the
database and printed out on the PC printer.
16 • 2. Connecting devices Vesuv 3.0
Page 22

707, 768 KF Oven
Cables
PC 25pin 6.2125.060
PC 9pin 6.2125.110
If possible work with the following RS parameters: 9600
Baud, 8 Data Bit, 1 Stop Bit and no parity. The handshake
must be set as follows:
• HWs (if the Oven is connected to a COM port)
• SWchar (if the Oven is connected via a Softswitch)
The RS parameters can be set on the Oven in key
<CONFIG>, >RS232 settings.
Notes
• If the oven is connected to the PC, then transmit at least
the automatic report at the end of the titration. You can
also send additional reports which can be stored in the
database and/or printed out.
• If the oven is connected to an instrument via an RS cable
then do not send an oven report.
Vesuv 3.0 2. Connecting devices • 17
Page 23

Balance
Balances with serial interfaces can be connected as follows:
Balance Cable
Sartorius MP8, MC1 6.2125.070, PC: 25pin
6.2134.060, PC: 9pin
Mettler AM, PM, AT 6.2146.020, PC: 25pin
6.2146.020 + 6.2125.010, PC: 9pin
AE (Opt. 011) 6.2125.020, PC: 25pin
6.2125.020 + 6.2125.010, PC: 9pin
PG 6.2125.130, PC: 25pin
6.2134.110, PC: 9pin
AB, AG, PR Mettler interface LC-RS25, PC:25pin
Mettler interface LC-RS9, PC:9pin
AND with RS232 (OP-03) 6.2125.020, PC: 25pin
6.2125.020 + 6.2125.010, PC: 9pin
Precisa with RS232-interface 6.2125.080, PC: 25pin
6.2125.080 + 6.2125.010, PC: 9pin
Notes
• Connect the balance directly to a PC port or the port of
an extension board (not to Softswitch).
• Transmit weights with their units.
• Do not operate balance in "Continuous transmission"
mode
18 • 2. Connecting devices Vesuv 3.0
Page 24

3. Tutorial
This chapter will introduce you into the operation of Vesuv.
You will get an idea of the its possibilities.
General remarks
Vesuv consists of 2 program parts: The datalogger and the
database.
After installing the program you will find this two icons of Vesuv on your desktop:
Icon of the datalogger.
The datalogger receives the analytical results and stores
them in the Vesuv database. You can also store analytical
device methods on your PC.
The Vesuv database shows and manages your analytical results. You may also recalculate these results.
On-line Help
Key <F1> provides help for the current topic.
Green texts You can click them and jump to a different help
topic.
Magenta texts They identify a dialog in the corresponding
window. In some cases, the color is also used
to highlight important information.
Backup
You should backup your data at regular intervals. You may
also monitor the interval for data backup, see page 94.
Vesuv 3.0 3. Tutorial • 19
Page 25
Working with the datalogger
Open the datalogger. You may have to login with your password if a login window appears.
The datalogger work bench appears. Each configured and
enabled device has its own device window:
If you don't see device windows on your datalogger work
bench because you don't have any configured devices, see
pages 8 and 35.
2 devices are enabled:
756 KF Coulometer and
702 Titrino.
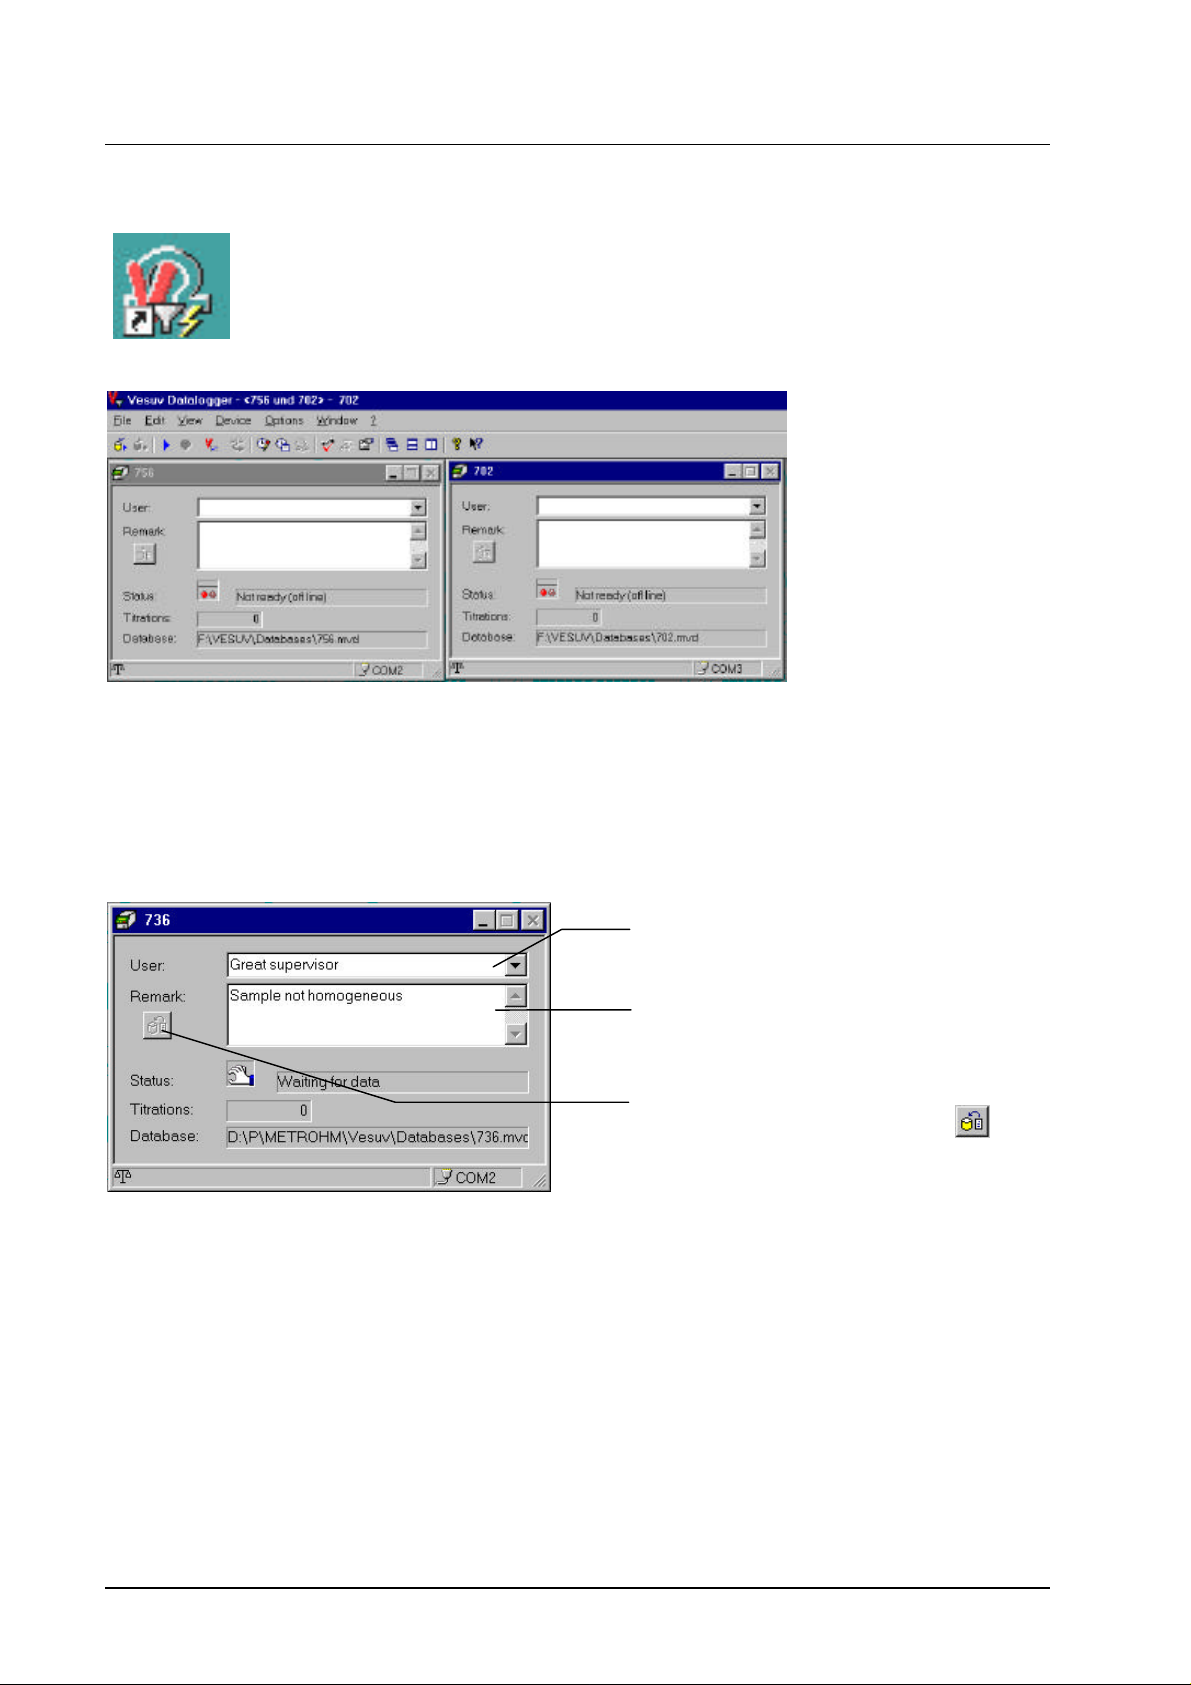
In the device window you can enter data for your daily analytical work and it provides some information as well:
You may enter or select (see page 60) your
name.
You may add a remark which will be stored
in the database together with your result.
This remark can also be assigned to the last
determination if you press the button .
In the lower part of the window you see the status of the device, the number of determinations since Vesuv was started
(or since you opened this configuration) and the name of the
database where the results are stored.
In the status bar of the device window you can see if a balance is assigned to this window and the COM of the PC
where the device is connected.
For data reception, the status of the device window has to be
"Waiting for data" (as in the figure above).
20 • 3. Tutorial Vesuv 3.0
Page 26

Receive and view data
Send a report from your analytical device to Vesuv. Watch
the status display changing from "Receiving data" to
"Sending to database".
"Evaluating data" means that Vesuv recognizes e.g. results,
endpoints, sample data etc. from the reports and writes these
data to the corresponding fields in the database.
You can view the last received data with button .
Properties of the device window
You may
• enter the name of the database to store your results, see
page 47.
• monitor time intervals for calibration, GLP tests and
maintenance of your device, see page 44.
• define the device reports to be stored in the database,
see page 48.
• define the reports to be printed immediately after the determination, see page 48.
These settings are accessible if you select the corresponding
device window, click with the right mouse button, and select
"Properties", see page 43ff.
Vesuv 3.0 3. Tutorial • 21
Page 27
Save/Restore device methods
Methods from Titrinos and from the 756 KF Coulometer can
be stored in the PC. For the 730 Sample Changer, methods
and its configuration can be stored.
Save methods
1. Select the window of the device from which you wish to
save methods.
2. Click with the right mouse button in this device and select
"Stop". You stop data reception in Vesuv. Make sure,
there is no determination running on your device!
3. Click again with the right mouse button and select "Save
methods". The device will be stopped which means that
data from a running determination will be lost.
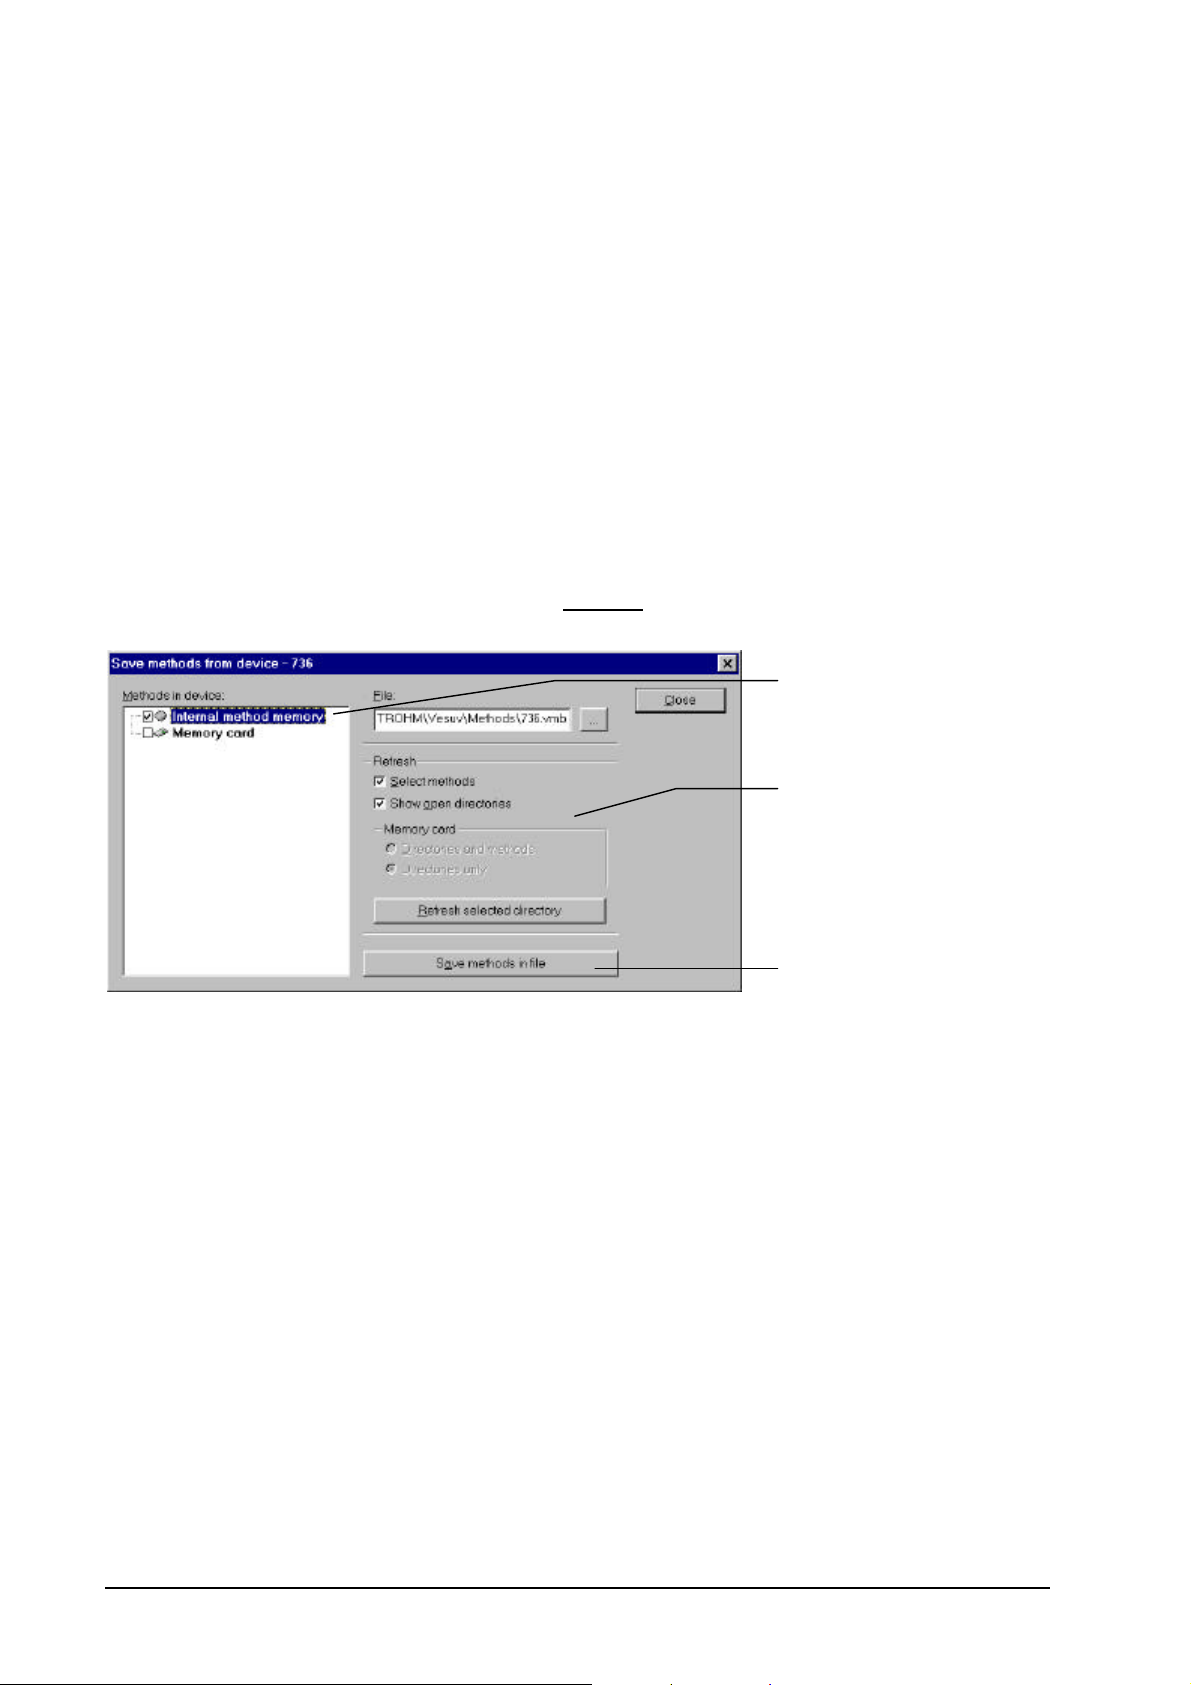
The following window appears:
Memory range of the device.
You need this options only if you
don't wish to store all the methods
of the selected memory range.
The methods will be saved in the
file selected above.
4. Select the memory range of the device (þ) for the methods to be stored in the PC.
If you wish to store only selected methods of the memory
range, see page 51.
5. Select a file and press the button <Save methods in file>.
The methods will be saved in the file.
6. Leave the window with <Close>.
22 • 3. Tutorial Vesuv 3.0
Page 28
Restore methods
1. Select the window of the device where you wish to restore methods.
2. Click with the right mouse button in this device and select
"Stop". Make sure, there is no determination running on
your device!
3. Click again with the right mouse button and select
"Restore methods".
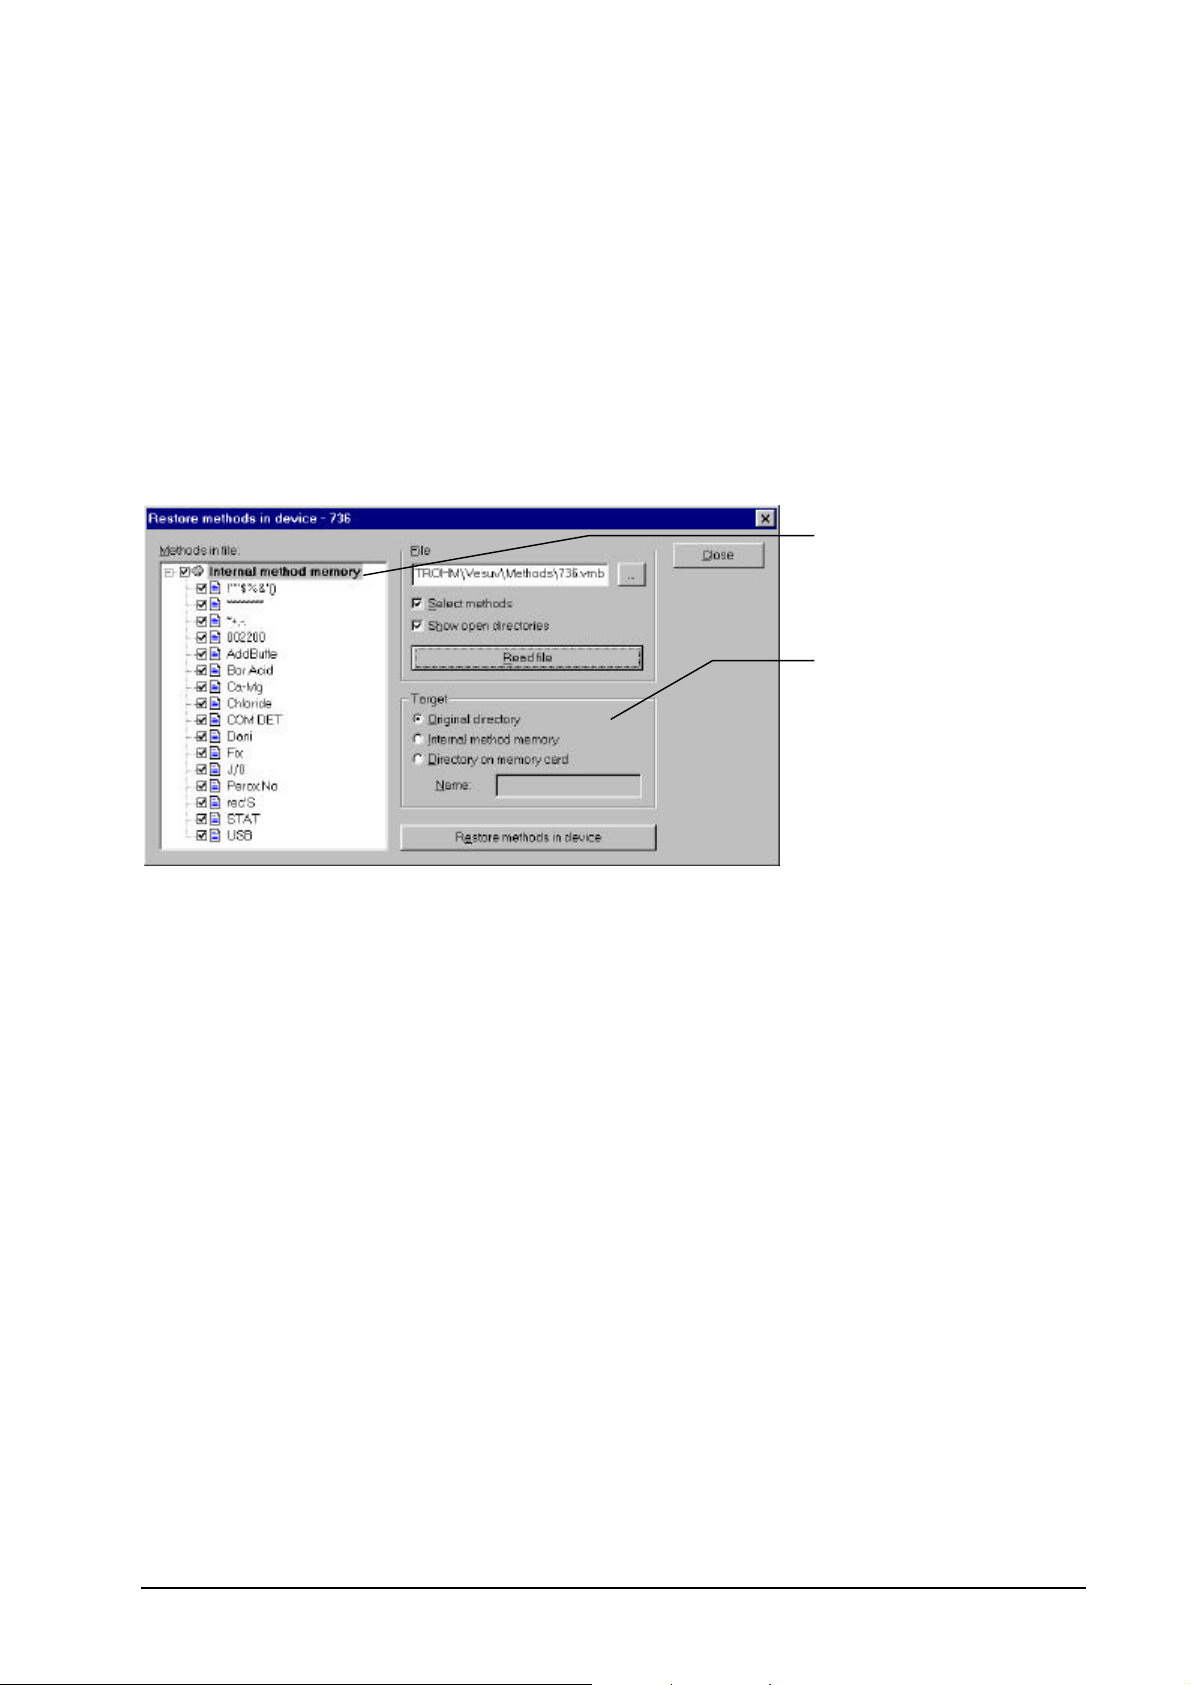
4. Select a file in the method window and press the button
<Read file>. The window may appear as follows ("Select
methods" and "Show open directories" are þ):
List of methods from the selected
file.
Enter the target for the methods to
be stored in the device.
Original directory means that the
methods will be stored in the same
memory range from where they
came originally.
5. Press the button <Restore methods in device>. The
methods will be stored in the device.
6. Leave the window with <Close>.
Vesuv 3.0 3. Tutorial • 23
Page 29
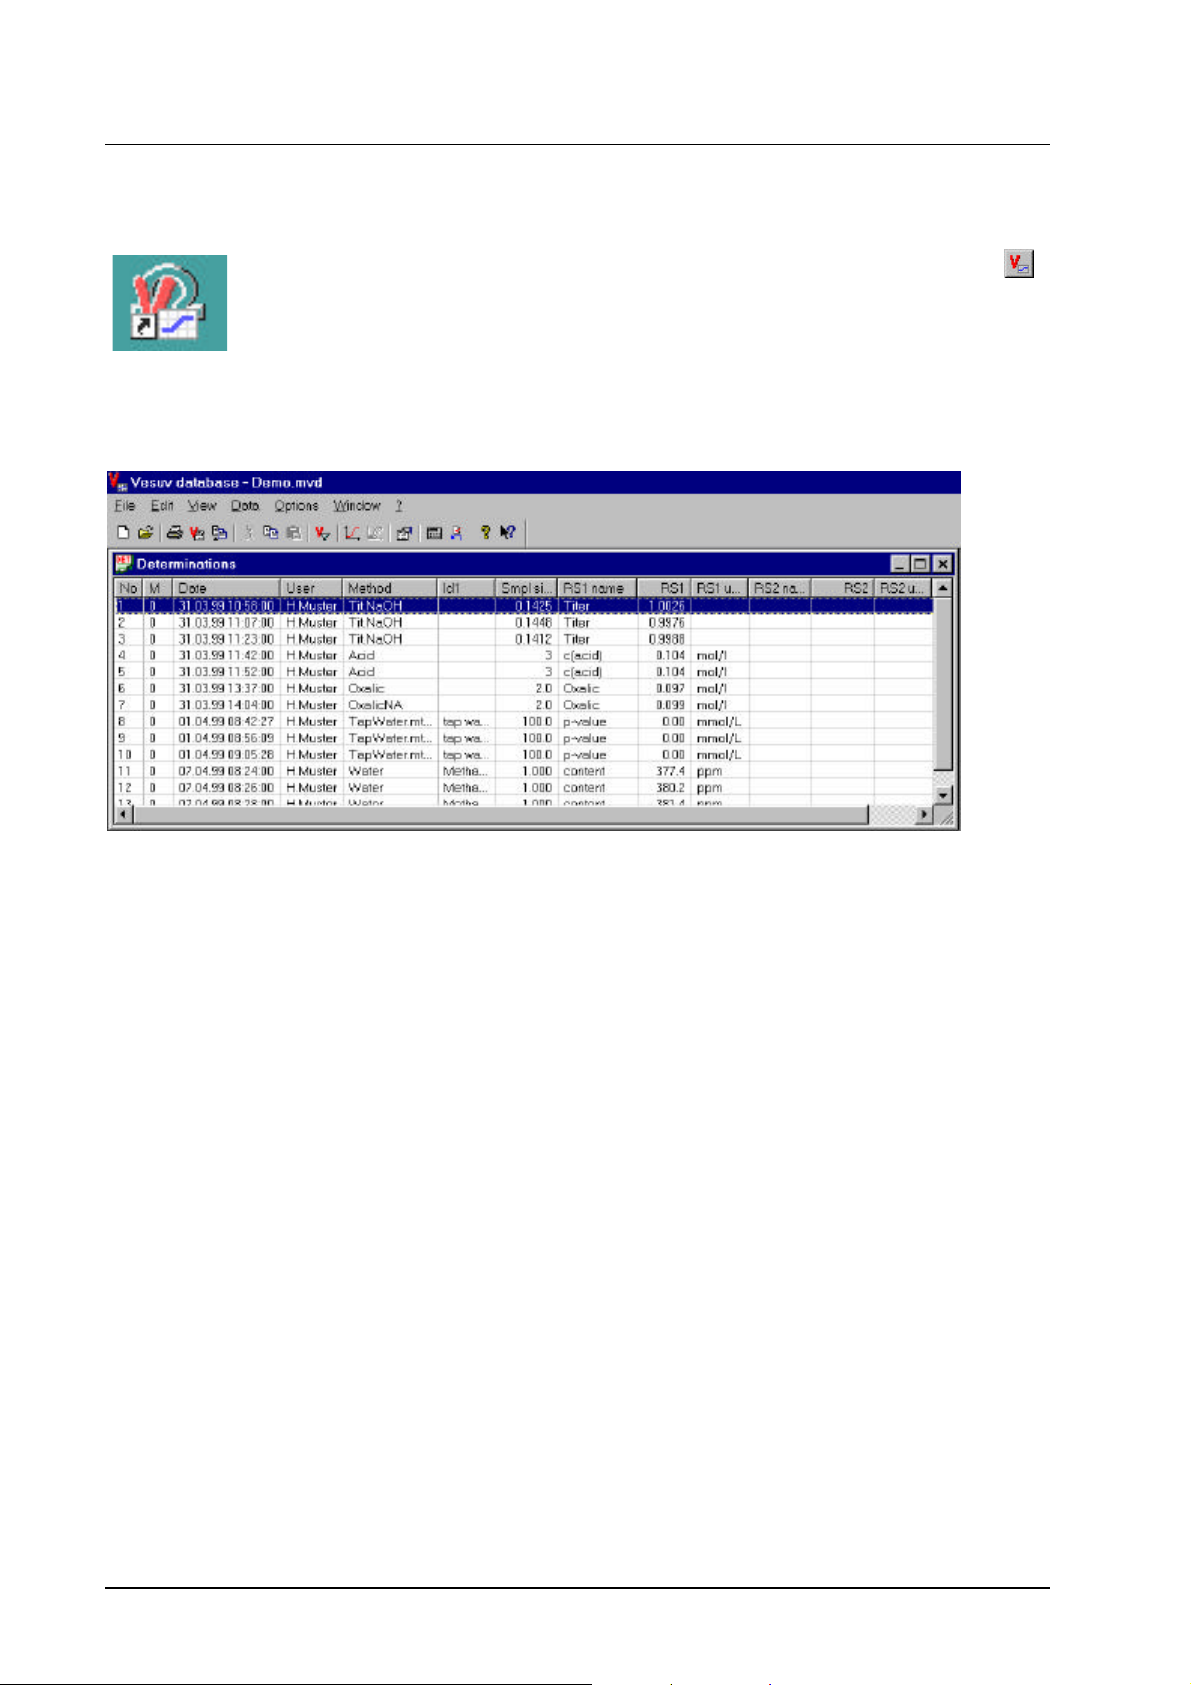
Managing the determination results
Open the program part "Database": Press e.g. the button
in the Datalogger (or with menu item "View, Show Vesuv database").
Open the database "Demo" (menu item "File, Open"). You
will at least see the determinations table of this database:
Determinations table
The determinations table contains a line for each determination (data set).
The columns of this table can be selected with menu item
"View, Properties":
• Have e.g. identification ID2 displayed in the determinations table (þ).
• Modify the column header of "RS1": Select the line
"RS1", click again and write e.g. "Result".
Leave the window "Properties" with <OK>.
Change the sequence of the columns: Click with the left
mouse button in the gray column header, keep the mouse
button pressed and drag the column to the correct place.
Sort the data sets according to their date/time: Click with the
left mouse button in the gray column header "Date": The data
sets will be sorted in ascending order.
24 • 3. Tutorial Vesuv 3.0
Page 30
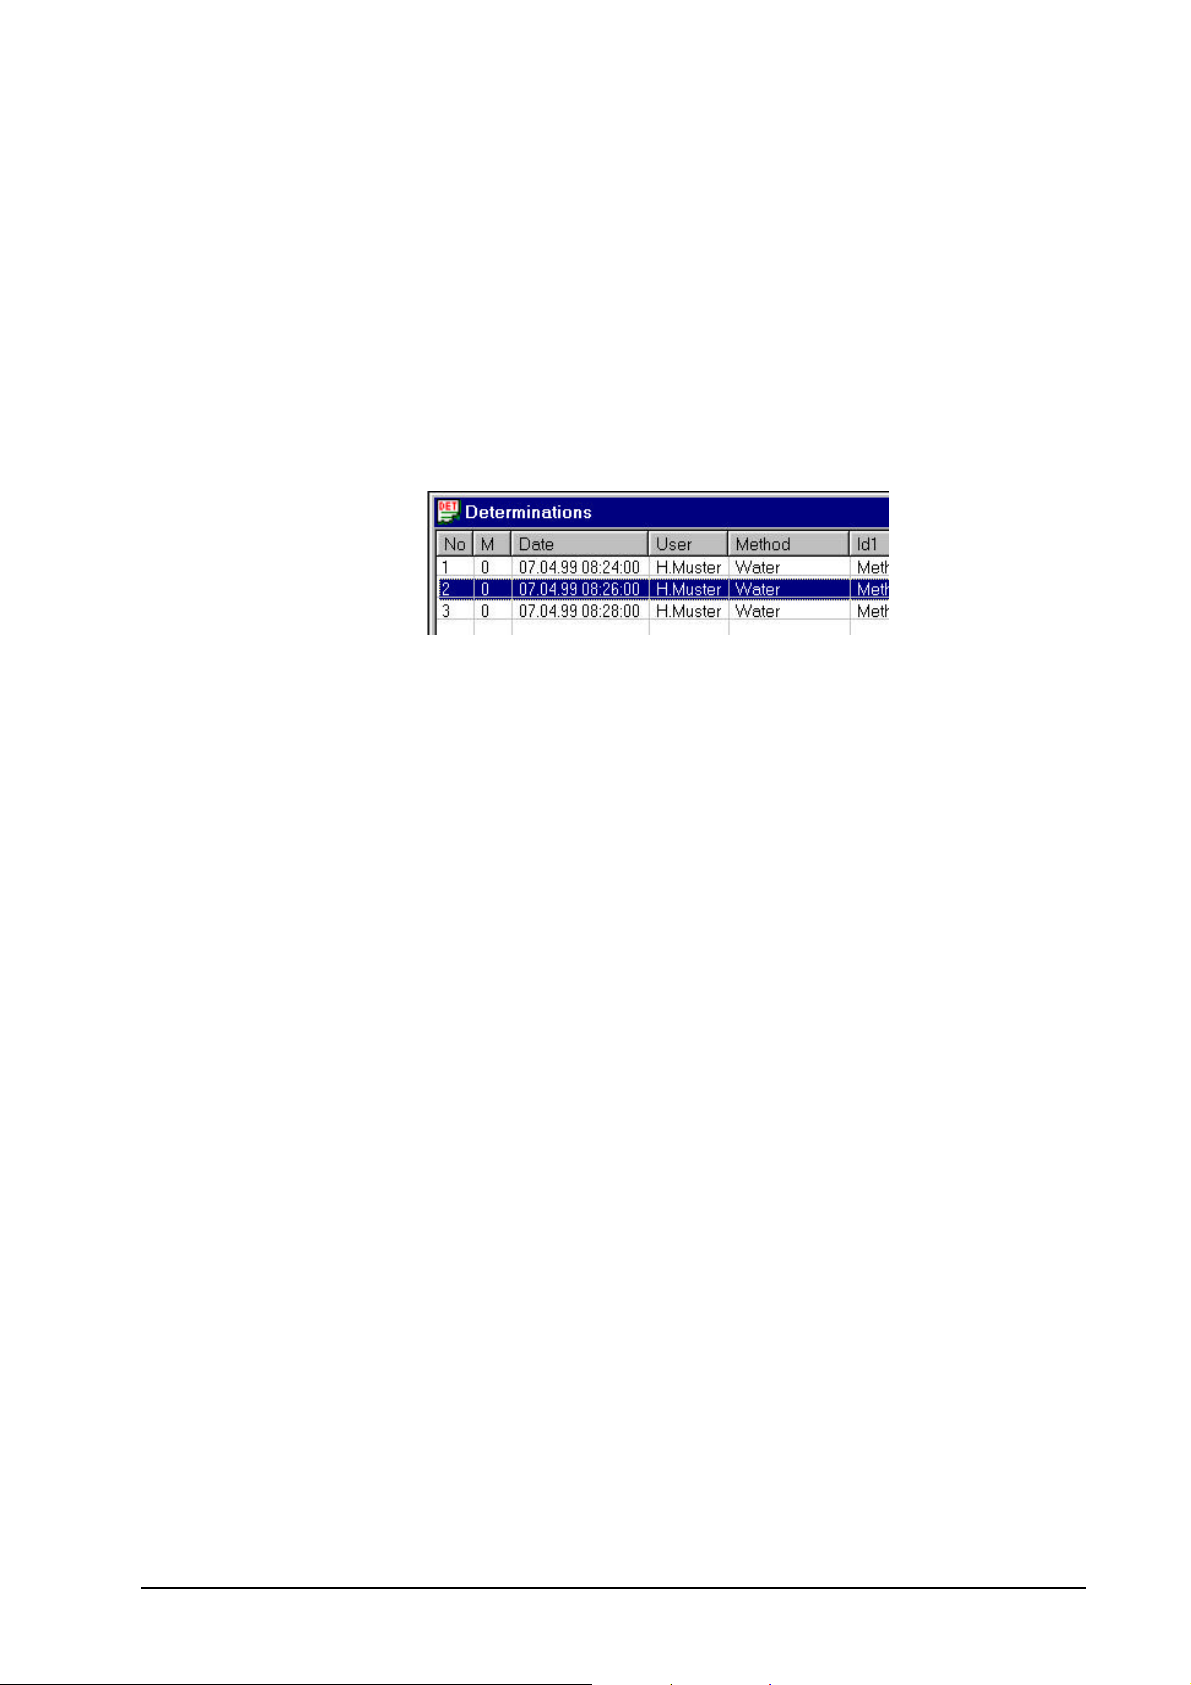
Reducing the number of data sets, filter
The number of data sets to be displayed in the determinations table can be reduced by means of filters.
Click with the right mouse button in the column "Method" in a
field which contains the value "Water" and select "Filter".
Only data sets which have been created with the method
"Water" will be displayed.
The following 3 data sets remain from the original table:
The status bar of the database (lower right) shows "FILTER"
to indicate that a filter is active.
Remove the filter with menu item "Data, Filter on".
For more possibilities with filters see menu item "Data, Filter"
and page 70.
Vesuv 3.0 3. Tutorial • 25
Page 31

Exporting data from Vesuv into Excel
The measuring point lists of some selected data sets will be
exported into an Excel table.
1. Select the data sets.
2. Select menu item "File, Export data"
Select CSV, the Excel format.
Press button <Settings> and select
"Measuring point lists".
Leave settings with <OK>.
3. Export the measuring point lists with button <Export>.
4. Open the file ...\Vesuv\Exports\a.csv in Excel.
The values will be filled directly into the Excel table and
can be treated there.
26 • 3. Tutorial Vesuv 3.0
Page 32

Curves
Open the curve window with the button of the toolbar (or
menu item "View, Show curve").
The curve window shows the curve of the selected data set.
The curve is displayed out of the measuring point list from
the analytical device.
You may modify the curve representation: Select the curve
window, click with the right mouse button and select
"Properties". You can now modify colors, symbols, fonts etc.
for curve representation, see page 82ff.
You can also overlay curves which have the same axis (e.g.
curves of pH vs. volume): Press button of the toolbar.
The title in the curve window shows now "multiple".
Select e.g. 2 data sets of method "Tit.NaOH". You will get the
following curves:
Leave the mode "Curve
overlay" pressing the button
again.
Vesuv 3.0 3. Tutorial • 27
Page 33

Page 34

4. Password
This chapter shows how to manage access rights for different
user groups.
Overview
Vesuv has a comprehensive protection by password. Each
menu item can be locked separately. Access rights are assigned to different groups. Users belong to such a group.
Access rights are defined separately for the datalogger and
the database .
Password protection is activated in menu item "Options, Settings, General". If the access rights are checked, the menu
items "Options, User permissions" and "File, New login" are
accessible.
If you start the datalogger or the database, the login window
appears, see page 31.
You always need an administrator. Only administrators can
modify rights.
Vesuv 3.0 4. Password • 29
Page 35

Management of access rights and users
Menu item "Options, User permissions"
Groups with different access rights can be defined. Users are
then assigned to these groups.
Step by step procedure
1. Activate password protection (menu item "Options, Settings, General").
2. Select menu item "Options, User permissions".
3. This window shows different groups, e.g. employees and
supervisors.
Select a group and click the right mouse button. You may
Add users
Add groups
Delete groups
Change properties, e.g. access rights.
4. Select "Properties". Open the menu items of the datalogger or the database with double click. You may enable/disable each menu item for each group.
Enabled menu items are checked .
5. Assign your users to the different groups.
Delete users
1. Activate password protection (menu item "Options, Settings, General").
2. Select menu item "Options, User permissions".
3. Select the user to be deleted, click with the right mouse
button and select "Delete user".
30 • 4. Password Vesuv 3.0
Page 36

Enter/modify password
Menu item "File, New login, Change password"
Enter your password for the first time or change it.
Entering your password for the first time
1. Select menu item "File, New login".
2. Select your user name.
3. Press button <Change password>.
4. Enter your password in "New password" and confirm it in
"Confirm new password".
"Old password" remains empty.
5. Enter your password once more in the "login" window.
6. You are now logged in with your access rights.
Login
Menu item "File, New login"
The login window appears on start of the program if password protection is active. You may also make a new login
while the program is running.
The status bar shows the currently logged in user:
Step by step procedure
1. Select a user.
2. Enter the correct password.
3. The program will then run with the access rights of the
logged in user.
Vesuv 3.0 4. Password • 31
Page 37

Page 38

5. Datalogger
This chapter gives a detailed description of the datalogger.
Overview
The Datalogger communicates with the connected instruments:
• Determination data are received from the connected instruments and transferred to the database
• Reports can be printed out on the PC printer
• Instrument methods can be stored in the PC and re-
loaded into the instrument
• Calibration intervals, intervals for GLP tests and instrument service intervals can be monitored
• Keys and functions of the instruments can be locked
• Weighing data can be transferred to the instruments
Each connected instrument has its own device window, see
page 40. This window contains all important information
about the device window.
The most important commands can be found on the toolbar,
see page 34.
What do you want to do?
Connect instruments, see page 35.
Receive data, see page 35.
Print reports, see page 48.
Save or restore methods, see page 51.
Activate monitoring functions, see pages 44 and 47.
Lock instrument keys and functions, see page 49.
Transmit weighing data to the instruments, see page 54.
Vesuv 3.0 5. Datalogger • 33
Page 39

Datalogger toolbar
The buttons have the following meanings:
Starts the selected device window. The device window
is ready to receive data.
Stops the selected device window. It is set to off-line.
Data can no longer be received in Vesuv, but weighing
data are still transferred to the instrument.
The device window must be stopped for:
. saving or restoring methods,
. changing the database where the data are stored,
. changing the RS port to which the instrument is connected.
Starts all device windows, i.e. the device windows are
ready to receive data from the connected instruments.
Stops all device windows. The device windows are set
off-line. Data can no longer be received.
Before configuring device windows with the menu item
"Device, Device manager" all device windows must be
stopped.
Displays (opens) the database.
Assigns the balance to the selected instrument, see
page 54.
Confirms the monitoring functions, see page 46.
Views the log file of the monitoring functions, see page
46.
Views the balance log file, see page 54.
Tests the communication between instrument and PC.
Reports can also be received and printed here without
having to store them in the database.
Show data: the received data can be viewed here.
Opens the dialog "Properties" of the selected device
window.
Arranges overlapping device windows.
Arranges the device windows under each other.
Arranges the device windows beside each other.
Shows information about this program.
Provides help for the dialog elements and screen areas.
34 • 5. Datalogger Vesuv 3.0
Page 40

How to start work with the Datalogger
If you cannot see any device windows on the Datalogger
work bench (e.g. you don't have any configured and enabled
device) then proceed as follows:
Step by step procedure
1. Open a (new) configuration: Menu item "File, Configuration, Open".
2. Enter a name for the configuration or select a name.
3. Define the instrument: Menu item "Device, Device manager", see page 36.
4. Set the connected devices correctly, see pages 8ff.
5. Carry out a test run.
Test run
1. Transmit a report from your instrument to Vesuv.
2. Does Vesuv receive data from your instrument? If it is receiving data then the device window shows the status
with .
If no data are received:
. check whether your device transmits reports;
. check whether the RS parameters on your device have
the same setting as in Vesuv;
. check whether the cables have been plugged in correctly.
3. Are the received data OK? You can view the data with
.
If the data are garbled:
. send the report again;
. check whether the RS parameters have been set correctly, including the handshake.
4. Open the database and check whether all the data which
you require are present.
Is a curve displayed? If not, transmit the measuring point
list of the device.
Are the raw reports stored? If you want to store raw reports then select those reports which you want to save,
see page 48.
5. If you do not want to store the record created above in
your database then delete it: Mark the data set and press
<Del>.
Vesuv 3.0 5. Datalogger • 35
Page 41

Device manager
Menu item "Device, Device manager".
This menu item is only active when all device windows are
stopped (button ).
Configure instrument
If you are connecting devices for the first time:
1. See pages 8ff for cable connections and extended PC
If you already have connected instruments:
1. Stop all device windows (button ).
Further:
interfaces.
Open a configuration: Menu item "File, Configuration,
Open" and give your configuration a name.
2. Select the menu item "Device, Device manager".
3. Add a new instrument with the button .
A balance is selected with the button .
4. A list of device types appears. Give the device a name
and select the device type from the list.
5. The dialog for properties of the device window appears.
From the sheet "Communication" select the port to which
your instrument is connected.
A balance must be connected directly to a COM port or
via an extension board (not via the Softswitch).
6. Select the database in which the determinations with this
device are to be stored, sheet "Database".
Also check the database template.
The database is created when the window "Device manager" is closed.
7. Exit from the dialog and test the connection to your instrument: press the button and carry out the <Auto
test>.
If the button <Auto test> is inactive transmit a report from
your instrument to Vesuv.
8. Make the necessary settings on the device, see pages
8ff.
36 • 5. Datalogger Vesuv 3.0
Page 42

Delete/disable device window
Selected device windows can be deleted with the button ,
balances can be deleted with the button . This also de-
letes all device window settings.
If you want to retain the device window properties you can
disable the device window by clicking . The device is then
marked by ¨.
Add new instrument
Menu item "Device, Device manager, button or button
".
This menu item is only active when all device windows are
stopped (button ).
Name Name of the device window. This name ap-
pears in the title bar of the individual device
window.
Device Select your device type.
In this way you select the device driver.
Data of device driver This field describes the data of the de-
vice driver used. The field will be filled in as
soon as a device type has been selected.
Port parameters
Menu items:
"Device, Properties, Communication" and
"Options, Softswitch"
Setting the port parameters for the COM ports. If you are
working with the Softswitch then the parameters must only be
set once for the Softswitch.
The port parameters can only be altered when the device
window has been stopped (button ).
Vesuv 3.0 5. Datalogger • 37
Page 43

Recommended port parameter settings
• If possible use the standard values: 9600, 8, N, 1, HW.
• Handshake: hardware handshake.
• Those devices which are connected to the Softswitch
must work with the software handshake (SWChar).
38 • 5. Datalogger Vesuv 3.0
Page 44

Softswitch
Menu item "Options, Softswitch".
You only need this menu item when your devices are connected to the PC via a Softswitch.
Important:
• Devices which are connected to the Softswitch must
have their handshake set to SWChar.
• Balances and 756 and 737 KF Coulometers cannot be
connected via a Softswitch.
• The Softswitch must be connected directly to a port of
the computer (not via the port of an extension board, e.g.
a Moxa board).
SOFT1 Softswitch which is connected to COM1 of the
PC. Activate the Softswitch with .
The Softswitch is supplied with the following parameters as standard:
9600 baud
8 data bits
Parity: none
1 stop bit
If you use other parameters then these must be
set with the <Parameter> button.
The instruments which are connected to this
Softswitch are given the port names SOFT 1.1,
Soft 1.2, SOFT 1.3, etc.
They must work with the software handshake
(SWChar).
SOFT2 Softswitch which is connected to COM2 of the
PC.
The instruments which are connected to this
Softswitch are given the port names SOFT 2.1,
Soft 2.2, SOFT 2.3, etc.
SOFT3, SOFT4 Similar to above
Vesuv 3.0 5. Datalogger • 39
Page 45

Device windows for analytical instruments
Each analytical device which is connected
has its own device window. This window
shows the most important information about
the device. When the window has been selected the device window functions can be
operated with the right mouse button.
The name of the device window is shown in the
title bar.
User An operator name can be selected or entered
here. In order for a name to be selected it must
have been entered under the menu item
"Options, Settings", see page 60.
Remark You can enter a comment which will be stored
in the database together with the determination
data.
The comment can be altered after the determination and can be appended to the last data set
in the database with the button (or menu
item "Device, Append comment"). Any comment which may already exist will be overwrit-
ten.
Status Shows the current device window status.
Titrations Shows the number of determinations which
have been received since the last time the de-
vice window was started in Vesuv.
Database Shows the name and path of the database in
which the determination data of the device win-
dow are stored.
At the bottom of the device window you can see
whether the instrument has been assigned a
balance and the name of the balance which has
been allocated. See page 54.
If the balance has been assigned automatically
then "Automatic" appears beside the balance
symbol.
At the bottom of the device window you can see
to which port the instrument is connected.
40 • 5. Datalogger Vesuv 3.0
Page 46

Show received data
Menu item: "Device, Show data"
Toolbar:
Keys: Ctrl+D
Mouse: right mouse button in device window
The last data received in the device window will be displayed.
The data can be printed out on the Windows standard
printer.
You can also mark parts of the received data and copy them
into other programs via the clipboard.
In the lower part of the window you will find information about
the cursor position, length of the selection, number of selected characters and the statistics of the received data.
Communication test
Menu item: "Device, Communication test"
Toolbar:
Keys: Ctrl+T
Mouse: right mouse button in device window
Tests the instrument - PC connection. Click the <Auto test>
button. The query sent to the instrument and the answer from
the instrument appear in the window.
If the <Auto test> button is gray, send a report from your device to Vesuv.
<Print> You can also use this window for receiving data
from the instrument which is not to be stored in
the database. This data can be printed out.
<Delete> Deletes the contents of the window (buffer).
The position of the cursor or the selection is shown in the
lowest line of the window.
Vesuv 3.0 5. Datalogger • 41
Page 47

Extended communication test
Menu item "Options, Extended communication test" or Ctrl +
Shift + T
Additional possibilities
Wait for line end in auto test
If your device does not send the line end auto-
matically (the device-specific line end is defined
in the device driver files) you can switch off
waiting for a line end.
Command You can send any command to the device. The
list of commands can be found on the green
pages of the corresponding Metrohm
“Instructions for use“ of the analytical devices.
Enter the command and press the <Send>
button.
Timeout Timeout for waiting for an answer from the in-
strument.
Add line end character to command
The PC automatically appends the character
sequence for the line end to the transmitted
data when the query is activated.
42 • 5. Datalogger Vesuv 3.0
Page 48

Device window properties
General properties
Menu item: "Device, Properties, General"
Toolbar:
Mouse: right mouse button in device window
Keyboard: Alt + Enter
Device name The device name is shown in the device win-
dow title line.
Device driver The device driver data are shown in the lower
part of the window. The device driver can only
be selected on adding a new device.
Communication
Menu item: "Device, Properties, Communication"
Toolbar:
Mouse: right mouse button in device window
Keyboard: Alt + Enter
Port Port to which the instrument is connected.
The <Parameters> button can be used to alter
the communication parameters if the instrument
is connected to a COM.
To change the port the device window must first
be stopped.
Parameters Description of the port parameters for instru-
ments which are connected to a PC port or to
an extension board.
Timeout... Time in ms allowed to elapse after the Datalog-
ger has received the last character before data
evaluation begins.
If possible use the standard values for timeout.
Vesuv can send data to device
If this query is active ( ) then at the start the
Datalogger will send some commands to the instrument.
This query should only be deactivated when the
device cannot receive any data, e.g. when the
PC and balance are connected to the same RS
interface via distribution plugs on the device.
Vesuv 3.0 5. Datalogger • 43
Page 49

When you make new settings for the COM port or change it
you should check the communication, see page 41.
Device monitoring
Menu item: "Device, Properties, Monitoring"
Toolbar:
Mouse: right mouse button in device window
Keyboard: Alt + Enter
The times for three different device conditions can be monitored: Calibration, GLP test and service interval. When the
monitoring interval has elapsed a message is produced by
the PC. The corresponding test is activated by .
When the monitoring function responds a message is produced in the lower left part of the window. This message can
be edited with the <Message text> button.
<Edit dates> You can set the time interval or date to be
monitored, see below.
<Confirm test> When you have carried out the test you can
confirm it. Confirmation resets the time counter
to zero or produces a query for the next moni-
toring date, see page 46.
<Show log file> You can view the device monitoring log file,
see page 46.
<Message text> You can enter a message. This message
appears on the PC when the monitoring interval
has expired, see page 47.
Monitoring, editing dates
Menu item "Device, Properties, Monitoring, <Edit dates>"
This is where the dates for the device monitoring functions
are edited. When the set date is reached a message is
shown on the PC.
Interval
Select "Interval" if the monitoring is to respond at fixed time
intervals, e.g. daily or weekly.
Interval Select:
. Hours
. Days
. Weeks
44 • 5. Datalogger Vesuv 3.0
Page 50

. Day of week, e.g. each Monday or each 2nd
Monday
. Day of month, e.g. every first day of the month
When you alter the time interval the time
counter is reset to zero.
Time of day Enter the time when the message is to appear.
The <now> button sets the current time.
Calculate first expiration date from
today: From the current date. If you select this
option the next date will be calculated immediately. This can be seen in the date list in the
lower part of the window.
last date: From the last date set. If the corre-
sponding test has never been monitored then
the date of the first start of the Vesuv Datalogger will be used.
last log file entry: From the deadline on which
the test was last carried out, i.e. the last date to
have been protocolled for this test. If the test log
file is still empty then the date of the first start of
the Vesuv Datalogger will be used.
Fixed date
Select "Fixed date" when the monitoring is to respond on a
particular day, e.g. on 1 May 1999.
Date Set the date. The <today> button sets the cur-
rent date.
Time of day Enter the time when the message should ap-
pear. The <now> button sets the current time.
Message repeating frequency
Repeat message each
Enter the frequency with which the message
should appear. The message will be repeated
until monitoring has been confirmed and/or a
new date has been set.
This setting applies to both incremental monitoring as well as monitoring to a fixed date.
Information about dates
Last log file entry of the currently activated test (calibration,
GLP test or service). If the test log file is still
empty then the date of the first start of the Vesuv Datalogger will be used.
Vesuv 3.0 5. Datalogger • 45
Page 51

Next expiration date The next date for the first appearance
of the message will be immediately calculated
when the dates are edited.
First repetition of message Deadline for the first repeat of
the message if the test is not carried out imme-
diately when the first message appears. This
deadline will be immediately calculated when
the dates are edited.
Monitoring, confirming and protocolling that test has
been carried out
Menu item: "Device, Monitoring, Confirm test"
Menu item: "Device, Properties, Monitoring, <Confirm test>"
confirm test has been carried out
view test protocol
Mouse: right mouse button in device window, monitoring
You can confirm that the test has been carried out with the
<Confirm test> button.
If a time interval has been entered for monitoring then confirmation will automatically reset the time counter to zero, i.e.
the next message will appear when the same time interval
has elapsed again.
If a fixed date has been entered for monitoring then you will
be led directly into the dialog for entering a new date.
When a test has been carried out this is entered into a log
file. This log file can be viewed and printed at any time:
Menu item "Device, Monitoring, Show test log file" or
Menu item "Device window, Properties, <Show log file>" or
The log file contains the last 1000 tests to have been carried
out for the corresponding device in the existing configuration.
All tests (calibrations, GLP tests and service) are listed in a
common log file.
The log file can be printed out on the Windows standard
printer.
46 • 5. Datalogger Vesuv 3.0
Page 52

Message for monitoring functions
Menu item: "Device, Properties, Monitoring, <Message
text>"
Menu item: "Device window, Properties, Database, <abc>"
You can enter your own message text. The message will be
shown on the PC when the corresponding monitoring function responds.
Database selection
Menu item: "Device, Properties, Database"
Toolbar:
Mouse: right mouse button in device window
Keyboard: Alt + Enter
Name Path and name of the database in which the
determination data are to be stored. With the
button you can search through the directo-
ries.
In order to change a database the device window must first be stopped.
Template Path and name of the template for the database
if a new database has to be created.
For this entry the device window must first be
stopped.
The standard directory for databases is set under the menu
item "Options, Settings, Default Directories".
Monitoring of database size
Message if size... Monitoring the database size in which the
determination data are stored. Set the size according to the amount of free space available
on the hard disk of your PC.
With the <abc> button you can enter a text
which is to appear when the preset size has
been reached.
Vesuv 3.0 5. Datalogger • 47
Page 53

Reports
Menu item: "Device, Properties, Reports"
Toolbar:
Mouse: right mouse button in device window
Keyboard: Alt + Enter
This is where you can define what is to happen with the reports sent from the devices to Vesuv. The functions are only
active if the device window has already been activated once.
If the selection fields are empty then exit the dialog "Device,
Device manager" and open the window "Device, Properties,
Reports" again.
Save, Raw reports: The marked raw reports are stored in
the database and can be viewed there and
printed out, provided that the corresponding raw
reports have been transmitted by the analytical
instrument.
The <All> button marks all reports; the <None>
button deactivates them all.
Print immediately: The marked raw reports are printed on
the PC printer immediately after the determina-
tion, provided that the corresponding raw re-
ports have been transmitted by the analytical
instrument.
The <All> button marks all reports; the <None>
button deactivates them all.
With the 726 Titroprocessor the raw reports
cannot be printed out directly after the determi-
nation. However, it is possible to print the raw
reports from the database.
Vesuv-Report:
The Vesuv report (including curve) is printed out
on the PC printer immediately after the determi-
nation.
48 • 5. Datalogger Vesuv 3.0
Page 54

Options
Menu item: "Device, Properties, Options"
Toolbar:
Mouse: right mouse button in device window
Keyboard: Alt + Enter
General
Start device automatically upon opening
The device window automatically enters the receiving mode when you open the Datalogger or
when you load a new configuration.
User name from device
This option can be used to force instruments
which transmit a user name, e.g. 726 Titroprocessor, to ensure that the user name must come
from the device. A user name which is entered
in the device window of the PC will be ignored.
If the option is not active then the user name
will always come from the PC.
The following functions are only active when the device window has already been activated once. If the selection fields
are empty then exit the dialog "Device, Device manager" and
open the window "Device, Properties, Options" again.
With the 726 Titroprocessor the following functions cannot be
used.
Lock on device: The selected keys and device functions are
locked on the connected device. <All> activates
them all, <None> deactivates them all.
The function "Vesuv can send data to device"
under the sheet "Communication" must be activated. The commands are sent when the Datalogger is started, when a new configuration is
opened and when the options in the dialog window "Properties" are accepted, if settings for
locking and transmission functions have been
altered.
If no locking functions are active then the corresponding functions are made accessible again
here.
Send to device: You can transmit free commands to the
connected device here. The list of commands
for your device can be found in the green section of the "Instructions for use" of the corresponding device.
Example: Writing text in the 1st display line of
the device.
Vesuv 3.0 5. Datalogger • 49
Page 55

1. Mark the empty box and press the button
.
2. Give the command a name, e.g. "Hello in
1st line".
3. Enter the command which is to be trans-
mitted to the instrument, e.g.
&I.A.D.L1"Hallo".
When the command is to be transmitted, if
the box is , enter the command in the input line "Command for checked". If it is entered in the input line "...not checked" then
the command will be transmitted to the device when the box is not active.
The function "Vesuv can send data to device" under "Communication" must be activated. The commands are sent when the
Datalogger is started, when a new configuration is opened and when the options in
the dialog window "Properties" are accepted, if settings for locking and transmission functions have been altered.
The entries can be deleted with a doubleclick on the corresponding instrument line or
processed with the button and deleted
with .
50 • 5. Datalogger Vesuv 3.0
Page 56

Device methods
Method backup
Menu item: "Device, Save methods"
Mouse: right mouse in device window
The methods of the connected devices can be stored in the
PC. Methods from Titrinos, the 756 KF Coulometer and the
730 Sample Changer can be stored. For Sample Changers
the methods and the configuration (with the position tables of
the special racks) are stored.
If the menu item is gray, the instrument must first be stopped
( or no methods from the instrument can be stored.
Before you backup the methods, make sure that
• the device is in its inactive basic state
• no data transfer is taking place
• the instrument has no RS error (e.g. error 42)
• the device window is stopped (i.e. "Not ready, off line:
button )
• the option "Vesuv can send data to device" has been activated under "Properties, Communication"
Note: before the methods are stored, Vesuv will stop the
analytical device. Any waiting reports will be lost!
Step by step procedure
1. Select the memory area (internal method memory and/or
memory card) of the device you want to back up. Make
sure that the selection is provided with and highlighted.
2. Read in the names of the methods and/or directories:
<Refresh selected directory> button.
When the memory card is read out you can select
whether only the directories are to be read out or the directories with your methods.
3. Select the methods which you want to backup.
You can open the directories with a double-click. When
you mark a directory then all the methods it contains are
also marked automatically.
4. Enter a file name.
Vesuv 3.0 5. Datalogger • 51
Page 57

5. Use the <Save methods in file> button to store the methods in the file.
This procedure may take some time.
The standard directory for the methods is set under the menu
item "Options, Settings, Default directories".
Presentation options
Select methods After they have been read in all the meth-
ods are marked automatically. This option is
used for e.g. method backup.
Show open directories
After they have been read in all the directories
are shown open, so that the individual methods
can be directly marked for storing.
Restore methods
Menu item: "Device, Restore methods"
Mouse: right mouse in device
Methods which are stored in a PC can be copied into a connected device. Methods from Titrinos, the 756 KF Coulometer and 730 Sample Changer can be restored. For Sample
Changers the methods and the configuration (with the position tables of the special racks) are restored.
If the menu item is gray the instrument must first be stopped
( or no methods from the instrument can be restored.
Before you restore the methods, make sure that
• the device is in its inactive basic state
• no data transfer is taking place
• the instrument has no RS error (e.g. error 42)
• the device window is stopped (i.e. "Not ready, off line:
button )
• the option "Vesuv can send data to device" has been activated under "Properties, Communication"
Note: before the methods are restored Vesuv will stop the
analytical device. Any waiting reports will be lost!
52 • 5. Datalogger Vesuv 3.0
Page 58

Step by step procedure
1. Select the file which contains the methods.
2. Use the <Read file> button to read in the method and directory names of the file.
3. Select the methods you want to copy into the device.
4. Enter the target in the device for the methods:
Original directory: The methods will be copied into the
same memory area/directories where they were originally. This option is suitable for e.g. restoring backups.
Internal method memory: The methods will be copied into
the internal method memory of the device.
Directory on memory card: The methods will be copied
into a memory card directory. Enter the name of this directory.
5. Use the <Restore methods in device> button to copy the
methods into the device.
This procedure may take some time.
The standard directory for the methods is set under the menu
item "Options, Settings, Default directories.
Presentation options
Select methods After the file has been read in all the
methods are marked automatically. This option
is used for e.g. method backup.
Show open directories
After the file has been read in all the directories
are shown open, so that the individual methods
can be marked for copying into the device.
Vesuv 3.0 5. Datalogger • 53
Page 59

Balance window
Overview
Each connected balance receives its own balance window.
The window shows the most important information about the
balance. If the window has been selected the device window
functions can be operated with the right mouse button.
Data You can see the data which have been received
Status Shows the current device window status.
The name of the balance is given in the title bar.
from the balance here.
In the lower bar you can see to which device the
balance has been assigned. "Automatic" is
shown for balances which are assigned automatically.
For manual allocations the color of the lower
bar can be selected, see page 56. If a balance
has been assigned to a device this bar will have
the same color as the device.
In the bar at the bottom of the window you can
see to which port the balance is connected.
Balance log file
Menu item: "Balance window, Monitoring, Show balance log
file"
Toolbar:
Mouse: right mouse button in balance window,
monitoring, balance log file
If you transmit weighing data to a device then this will be entered in a log file. This log file can be viewed and printed out
at any time:
The required data lines must be marked for them to be
printed out.
The log file contains the last 1000 weighing data.
54 • 5. Datalogger Vesuv 3.0
Page 60

Options
Menu item: "Balance window, Properties, Options"
Toolbar:
Mouse: right mouse button in balance window
Keyboard: Alt + Enter
General
Start balance window automatically upon opening
The balance window is automatically ready to
receive data when the Datalogger is opened or
if a new configuration is loaded.
Assignment to device
Automatic assignment
The balance is automatically assigned to a device.
The possibility is open for Titrinos and KF Coulometers.
Manual assignment The balance can be manually assigned
to a device.
Precondition: The device can work together with
a balance.
Assignment color: Select the color for the lower
bar of the balance and the device it is allocated
to.
Further properties
General, see page 43.
Communication, see page 43.
Monitoring, see page 44.
Vesuv 3.0 5. Datalogger • 55
Page 61

Assign balance manually
Menu item: "Device, Balance, Assign balance manually"
Toolbar:
Mouse: Move the balance with the left mouse button to
the required device window.
Click inside the balance window and keep the
mouse button pressed down. As soon as you
are positioned above an device window which
can receive weighing data the cursor changes
to a symbol "Balance->to instrument". You can
release the mouse button: The balance is assigned to the device.
Use this command to assign the balance manually to an
analytical device. The balance is then permanently allocated
to this device.
The balance can be assigned to the following instruments:
Titrinos, KF Coulometer, 726 Titroprocessor. If the menu item
is gray then the corresponding instrument cannot be provided
with weighing data.
Make sure that the balance is assigned to a device when you
transmit weighing data!
In order for the device to be able to receive weighing data,
Vesuv must be able to transmit data to the device.
Step by step procedure:
1. Select the device window to which you want to assign the
balance.
2. Assign the balance (right mouse button, balance).
If more than one balance is connected then select one of
them.
3. In device window status bar you can see the balance assignment:
56 • 5. Datalogger Vesuv 3.0
Page 62

Assign balance automatically
Menu item "Device, Balance, Assign balance automatically"
Use this command to assign the balance automatically to an
analytical device. The balance will be assigned to that device
which, after the start of the determination, requires sample
data (sample identification, weight value or weight units) in a
request. In this way the balance can be used with several devices at the same time.
The balance can be automatically assigned to the following
devices: Titrinos, KF Coulometer. If the menu item is gray the
balance cannot be automatically assigned to the corresponding device.
In order for the device to be able to receive weighing data,
Vesuv must be able to transmit data to the instrument.
Step by step procedure:
1. Select the balance window.
Click the right mouse button.
2. Select the menu item "Properties, Options",
Assignment to device: Automatic assignment
3. Select the device window to which you want to automatically assign the balance, go to the menu item "Device,
Balance, Assign balance automatically".
In the status bar of this device "Automatic" can be seen
beside the balance symbol.
4. Modify the methods on your instrument so that the sample weight is requested after the start of the determination.
For back-weighing the request for the sample weight is
sufficient. For direct weighing the sample weight and the
units must be requested so that you can position the
sample at the titration place after weighing.
Rules
• Identifications cannot be transmitted from the balance to
the device.
• Sample weight: Only the numerical value with sign (no
units) will be transmitted to the device.
• The timeouts of the device and balance must be the
same length ("Properties of the device/balance window,
Communication").
Vesuv 3.0 5. Datalogger • 57
Page 63

• At the end of the titration wait at least until the timeout
has elapsed before you start up the device again, as otherwise the balance will not be assigned.
• Automatic assignment of the balance is not possible if
you want to fill a silo memory in the device. In such a
case the balance must be assigned manually.
• The assignment of several balances automatically is not
recommended.
In contrast, operation with one automatically assigned
balance which serves several devices and one balance
which is manually assigned can be a good idea.
Detach balance
Menu item: "Device, Balance, Detach balance"
Toolbar:
Use this command to detach a balance, i.e. so that it is not
assigned to any device window. This command is only active
when the balance has been manually assigned.
If you want to assign the balance to a different device window
you can do this directly with the command "Assign balance"
without needing to detach the balance first.
58 • 5. Datalogger Vesuv 3.0
Page 64

Datalogger options
General
Menu item "Options, Settings, General"
Device windows
Show device driver The file name of the device driver used
Animated status display
Vesuv Database
Start automatically upon start of datalogger
is shown in the title bar together with the device
name.
The status display is shown animated (i.e. mobile).
The database is also automatically started
when the Datalogger is started.
Refresh data on each entry
The database is automatically updated with
every new entry which the Datalogger makes.
This setting must be active if you want to automatically export from the database, see page
78.
Others
Save view on exit When the Datalogger is finished the po-
sitions of the device windows, their condition,
etc. is stored.
Check user permissions
The password protection is activated, see
pages 29ff.
Default directories
Menu item "Options, Settings, Default directories"
Select the standard directories for the databases and the
method backup files.
Vesuv 3.0 5. Datalogger • 59
Page 65

Management of user names
Menu item "Options, Settings, User names"
User names are used for:
• Users in the device window, see page 40.
• Users to confirm a device test has been carried out, see
page 46.
Communication
Menu item "Options, Settings, Communication"
Here you can set the maximum number of COM ports which
are available on your computer (e.g. 2 on the computer + 8
on a Moxa board = 10). The ports are available in the selection list for instrument connections.
Note: Softswitch connections are counted separately (SOFT
1.1, SOFT 1.2, etc.).
60 • 5. Datalogger Vesuv 3.0
Page 66

Configurations
Menu item "File, Configuration"
A configuration contains
• the properties of all device windows which are contained
in the list "Device, Device manager"
• the Softswitch data
• the position and size of the windows
• the status of the active device windows
Open When the configuration is opened the same
commands are sent to the device windows as
when the Datalogger is started.
Open is also used when a new configuration is
to be created.
Save as The configuration is stored in Vesuv under a
new name.
Rename The configuration is renamed in Vesuv.
Delete The configuration is deleted in Vesuv.
Save as file The configuration(s) are stored in a file.
This means you can make a backup copy.
When the configurations are transferred to a
different computer then it may be necessary to
adapt the paths for the databases, see page 47.
Restore from file Used to restore the configuration(s).
Vesuv 3.0 5. Datalogger • 61
Page 67

Page 68

6. Database
This chapter gives a detailed description of the Vesuv database.
Overview
The database shows your determinations. Several windows
display different aspects of your data sets:
Determinations The determinations table is the main win-
dow. It summarizes the most important data of
your determinations, see page 65.
If you close the determinations table, the data-
base will also be closed.
Curve The curve window displays the curve(s) of your
determination, see page 82.
Variables+formulas In the variables+formulas variables and
formulas are shown, see page 88. You need
this window if you wish to recalculate results:
You can edit variables and formulas.
Endpoints The endpoints window gives a list of endpoints
and other variables (such as fix EP's, pK/HNP,
rates etc.) which are evaluated by the analytical
device, see page 87.
Raw reports You may view raw reports in this window. Raw
reports are sent directly by your analytical de-
vices. In order to have raw reports saved in the
database, they have to be stored from the da-
talogger, see page 92.
What would you like to do?
Export data, see page 78.
Select data, see pages 65 and 70.
Print, see page 74.
Recalculate results, see page 87.
Vesuv 3.0 6. Database • 63
Page 69

Toolbar of the database
The buttons have the following meaning:
Opens a new database.
Opens an existing database.
Prints the selected window.
Prints the Vesuv report of the selected data sets. The
data sets are selected in the determinations table, see
page 74.
Exports the selected data sets, see page 78.
Cuts the selection and stores it in the clipboard.
Copies the selection into the clipboard.
Pastes the content of the clipboard.
Calls the datalogger. Opens the datalogger if it was not
already open.
Opens the curve window.
The curves of the selected data sets are overlaid. Quit
this representation by pressing this button again (on/off
button).
Shows the properties of the selected window:
. Table of determinations, see page 65.
. Raw reports, see page 92.
. Curve, see page 82.
The selected data sets are recalculated, see page 87.
The selected data sets are reset to their original values.
Gives information about this program.
Shows help for dialog items and screen sections.
64 • 6. Database Vesuv 3.0
Page 70

Determinations table
The determinations table gives an overview on your determinations. Each line of this table represents a data set. You
may modify the representation of this table, see pages 66ff.
The status bar shows the number of data sets as well as active filters.
Selecting data sets
1 data set Click in a field of this data set.
Data set from...to Press <Shift> and click the data sets
Several data sets Press <Ctrl> and click each data set.
Navigation
is done with the cursor or with menu item "Edit, Go to":
<Alt><End> To the last data set
from...to.
<Alt><Home> To the first data set
etc.
Sort, find, filter data sets
Sort Click in the gray column header. You sort the
data sets by the content of the selected column,
see page 70.
Menu item "Data, Sort" or right mouse button
Filter The table shows only data sets which meet the
conditions of the filter, e.g. data sets with a re-
sult greater than 4 and with a date before the
year 2000, see page 70.
Menu item "Data, Filter" or right mouse button
Find Searches for a string in the selected column,
see page 72.
Menu item "Data, Find" or right mouse button
Vesuv 3.0 6. Database • 65
Page 71

Printing, exporting, copying data
Printing determinations table
Print the determinations table directly with ( ).
You may also copy selected data sets into the
Clipboard and print them in another program
(e.g. Word or Excel).
Print Vesuv report Print Vesuv reports from selected data
sets with , see page 74.
Export data The selected data sets can be exported as text
files (*.txt), Excel files (*.csv) or as Vesuv databases, see page 78.
Menu item "File, Export data"
Copy data Copy data sets into the clipboard and paste
them into other programs.
Additional functions concerning several data sets
Overlay curves The curves of the selected data sets are
overlaid with , see page 86.
Statistics Calculation of mean and standard deviation of
the selected data sets, see page 91.
Recalculating results
Results can be recalculated ( ) and endpoints can be
graphically re-evaluated, see page 87.
Menu item "Data, Recalculate results" and "curve, right
mouse button".
Representation of the determinations table
The sequence of the columns, their width, header and property can be modified as well as their visibility.
Sequence and width of the columns
Sequence Click with the left mouse button in the gray col-
umn header, keep button pressed and drag column to the desired position.
Width Set the cursor in the gray column header onto a
grid line. The cursor becomes a double arrow.
In this state you can modify the width to the left
of the cursor.
66 • 6. Database Vesuv 3.0
Page 72

Visibility of columns and column header
Menu item "View, Properties", or right mouse button,
"Properties" with selected determinations table. A list of the
possible columns appears.
Visibility Columns with appear in the determinations
table.
Tip: The fewer columns the faster sort, select
etc.
Header Click with the left mouse button in the line
where you wish to edit the header. The line will
be selected. Click again in the same line to edit
the column header.
If the list doesn't contain the desired item, you
can open a further list of items, see page 68.
Make sure that you selected an item which you
don't need before pressing the button <More>.
The line in the first list will be overwritten by the
new selection.
If you don't find the desired item in either list,
you can edit the list, see page 68.
You also need this button if you want to change
the properties of a column, e.g. switching on/off
statistics calculations of the columns or repre-
sentation of a column as string/number..
Make sure that you selected an item which you
don't need before pressing the button <Edit>.
The line in the first list will be overwritten by the
new selection.
Special columns
M This column indicates modified data sets, see
page 87.
0 data set has not been modified in the data-
base.
1 data set has been modified in the database,
i.e. variables have been edited, endpoints
have been graphically re-evaluated and/or
recalculation of results has been carried out.
Original This column indicates whether the report from
the analytical device was an original or repro-
duced report.
0 Original report.
1 Reproduced report
Monitoring This column indicates whether a monitoring
function was active in the datalogger when this
data set was recorded, see page 44.
Vesuv 3.0 6. Database • 67
Page 73

c Calibration was due.
g GLP test was due.
s Service was due.
More columns of the determinations table
Menu item "View, Properties, More" with selected determinations table
If you don't find the selected item in the first list, a second list
appears.
Step by step procedure
1. Select the determinations table and menu item "View,
Properties".
2. Select an item you don't need from this first list. This item
will be overwritten by the new selection.
3. Press button <More>.
4. Select from this extended list the desired item. Return to
the initial window with <OK>.
5. Edit the column header if necessary: Select the new line
and click again. You can now edit the header.
6. Represent the column in the determinations table ( ).
7. Repeat steps 2-6 for each new column..
If you quit the window "Determinations, Properties" with
<OK>, the list will be sorted alphabetically
Edit columns of determinations table
Menu item "View, Properties, Edit" with selected determinations table
If you don't find the desired item neither in the first nor in the
extended list, you can add new items.
Here you may also modify the properties of the columns:
String/number, switching on/off statistics calculations of the
column.
68 • 6. Database Vesuv 3.0
Page 74

Step by step procedure
1. Select a data set, which contains the desired item, and
go to menu item "View, Properties".
2. Select an item you don't need from the list. This item will
be overwritten by the new selection.
3. Press button <Edit>. A window with the following table
appears:
Title Enter the column header.
Table Select the table of the database, which contains
the item.
The table "Vars" will usually contain the desired
item. Values which are evaluated by the analytical
device (such as EP, rates, PK/HNP etc.) are in the
table "PointRes".
The other table contain information about the device and the method.
Sub-determination Set 1.
For 726 Titroprocessor set the corresponding subdetermination (1...5).
If you need information about the device (Device
type etc.), set 0.
Name Select the name of the item.
The list contains all items, which are present in the
selected data set and in the table you selected
above. If you don't find the desired item, try to
change the table.
Property Select the property of the item.
Usually you have to select "Value" (also for
strings) or possibly "Mean" (if you wish to represent the mean which has been calculated by your
analytical device).
Type Select the data type (String/Number).
This selection may change the sort type.
Statistics If you selected type "Number", you may acti-
vate statistics calculation for this column ( ).
4. Quit the window with <OK> and represent the column
( ).
5. Repeat steps 2-4 for each new item.
If you quit the window "Determinations, Properties" with
<OK>, the list will be sorted alphabetically
Vesuv 3.0 6. Database • 69
Page 75

Data management
Sort
Menu item "Data, Sort" or right mouse button, "Sort" with selected determinations table
The data sets are sorted by date/time if you never sorted
otherwise.
Sort remains active on closing and opening a database.
The sort type depends on the data type in the corresponding
column:
• Strings are sorted alphabetically
• Numbers are sorted according to their sizes
You may change the data type "String/number", see page 68.
Quick sorting
• Click in the gray column header. The data sets will be
sorted ascending according to the content of this column.
• Click the right mouse button in a column. A window appears where you can select ascending/descending sorting.
Multiple sorting
You may sort the data sets according to several columns.
The list of sort criteria follows the sequence of the columns in
the determinations table. The sequence of activated sort criterias corresponds to the sequence in the list.
1. Select menu item "Data, Sort"
2. Double click on the column, which should be a sort criteria and select ascending/descending.
3. Double click on the next column etc.
Sort on/off
You may switch on/off sorting with menu item "Data, Sort
on".
70 • 6. Database Vesuv 3.0
Page 76

Filter
Menu item "Data, Filter" or right mouse button, "Filter" with
selected determinations table
The determinations table shows only those data sets which
meet the filter criteria. An active filter is indicated in the status
bar of the database.
Quick filter
1. Click with the right mouse button on a field, which contains the value for filtering.
2. Select "Filter".
3. Only those data sets will be displayed which contain this
value.
Examples:
Filter data sets with method name "Chloride".
Filter data sets of user "Boss".
Edit filter
1. Select menu item "Data, Filter" and press button "Edit".
2. The window "Edit filter" appears:
Column Select the column for filtering.
Filter Select the filter criteria. Filter criteria depend on
the data type of the selected column.
Special filters:
<>: unequal
empty: The field is empty
not empty: The field is not empty
Special filters for strings:
like: With this filter criteria you may use stand-in
characters in a string.
? any character (one)
* no or several characters
# any number (one)
[string list] one character out of the string list,
e.g. [A-Za-z] means all capitals and minuscules
[!string list] one character which is not given in
the string list
Special filters for data/time:
last X days: Filters data sets with dates between
the current date and the date which is X days
back.
Example: Data sets from the current date:
Vesuv 3.0 6. Database • 71
Page 77

Value = 0.
Time=, Time<...: Filter for time only without
date, e.g. Time<12:00:00 (data sets from
00:00:01 to 11:59:59)
Value Value for the filter criteria.
Link For multiple filtering:
And: Data sets which meet all filter criteria.
Or: Data sets which meet either one or the other
filter criteria.
Filters can be saved and loaded.
Filter on/off
Menu item "Data, Filter on".
An active filter is indicated in the status bar of the database.
Filters remain active on closing/opening the Vesuv database.
If you open a different database, filters will be switched off
automatically.
72 • 6. Database Vesuv 3.0
Page 78

Find
Menu item "Data, Find" or right mouse button, "Find" with
selected determinations table
Search for a string in the selected column.
Quick find
1. Click with the right mouse button in a field, which contains the string to find.
2. Select "Find".
3. The next data set which contains this value will be found.
4. Continue search with <F3>.
Edit find
1. Select menu item "Data, Find"
2. A window appears where you can edit search criteria.
Find Enter the string to be found. You may also use
stand-in characters:
? any character (one)
* no or several characters
# any number (one)
[string list] one character out of the string list,
e.g. [A-Za-z] means all capitals and minuscules
[!string list] one character which is not given in
the string list
Column Select the column to be searched.
DirectionSelect the direction for the search.
3. With <OK>, the next data set will be found which meets
the search criteria.
4. Continue search with <F3>.
Vesuv 3.0 6. Database • 73
Page 79

Printing
Printing determinations table
Menu item "File, Print" or with selected determinations
table
The whole determinations table is printed. In order to have
see the whole content of the columns on the printout, it may
be better (depending on the printer) to adjust a greater width
on the screen than seems necessary.
If you wish to print reports see pages 74 and 48.
Printing of selected data sets
1. Select the data sets to be printed.
2. Copy these data sets into the clipboard (<Ctrl>+<C> or
menu item "Edit, Copy").
3. Paste the content of the clipboard in another program.
Examples:
Word: You may use the Word function "Table, Convert
text to table".
Excel: The data are directly put into Excel tables.
Printing Vesuv reports
Menu item "File, Report", <Ctrl>+<R> or with selected
data sets in the determinations table
Prints the Vesuv report of the selected data sets. The report
template which is used can be set in menu item "Options,
Settings, General".
Vesuv reports are printed on the Windows standard printer.
Selecting a report template
Report templates are available in different languages and for
different applications (in the directory
..\Vesuv\Databases\Templates):
Report English report template, suitable for potenti-
ometric titrations.
Report_logo English report template with company logo,
see below. Suitable for potentiometric titrations.
74 • 6. Database Vesuv 3.0
Page 80

Report_header English report template with title, suitable for
potentiometric titrations.
You may change the title with a text editor
(e.g. Notepad).
Report_Crv_Txt English report template. The curve will be
printed before the endpoints. Suitable for potentiometric titrations.
Report_KF English report template suitable for KF deter-
minations.
Report_Meter English report template suitable for pH Meters
and Conductometers.
Report_f French report template, suitable for potenti-
ometric titrations.
Report_sp Spanish report template, suitable for potenti-
ometric titrations.
Report_d German report template, suitable for potenti-
ometric titrations.
You may also add your own report templates, see page 76.
1. Select menu item "Options, Settings, General, Report
template" and press button .
2. Select a report template.
Report template with company logo
1. Create a file "logo.gif", which contains your company
logo.
2. Overwrite the existing file in the directory
..Vesuv\Databases\Templates with your own "logo.gif"
file.
3. Select the report template Report_logo.htm (menu item
"Options, Settings, General").
4. If you company logo is distorted in the printout:
Open the file Report_logo.htm with a text editor (e.g.
Notepad) and change the size of the logo in line 4, IMG
USEMAP: "WIDTH" and "HEIGHT".
Vesuv 3.0 6. Database • 75
Page 81

Creating your own report templates
Report templates are *.htm files.
If you wish to create your own report templates, you best use
an existing template and open it with a text editor. Combine if
possible parts of already existing templates.
Modifying texts
1. Open an existing template with a text editor (e.g. Notepad).
2. Search the text to be replaced with the "Search/Find"
function of your text editor.
3. Modify the text.
4. Save the template with a new name (usually in the directory ..\Vesuv\Databases\Templates).
Enlarge/reduce curve size in report
1. Open an existing template with a text editor (e.g. Notepad).
2. Search the text "object classid" with the "Search/Find"
function of your text editor.
3. In this line you will se the entries "width=80%" and
"height 30=%". A smaller number means smaller width or
height, resp. of the curve.
4. Save the template with a new name (usually in the directory ..\Vesuv\Databases\Templates).
Delete report lines
1. Open an existing template with a text editor (e.g. Notepad).
2. Search the text of the line to be deleted with the
"Search/Find" function of your text editor.
3. Move from the position of this text up to the next <TR>
and down to the next </TR>.
4. Delete from <TR> to </TR>.
5. Save the template with a new name (usually in the directory ..\Vesuv\Databases\Templates).
76 • 6. Database Vesuv 3.0
Page 82

Adding new report lines
1. Open e.g. the template Report_KF.htm with a text editor
(e.g. Notepad).
2. Search the text "Titer".
3. Move from the position of the text "Titer" up the next
<TABLE.
4. Move from the position of the text "Titer" down the next
</TABLE>.
5. Copy the text from <TABLE to </TABLE>.
6. Open the template which is closest to your wishes and
search in this template for "Results:</b></caption>.
7. Move from this position down to the next </TABLE> and
paste the content of your clipboard after </TABLE>.
8. You have now added 4 new report lines: Titer, Blank,
Drift and Drift time. Each report line begins with <TR>
and ends with </TR>.
9. Edit report line 1: Titer. This report line consists of 4
items, each of them begins with <TD and ends with
</TD>.
The first item contains the variable name from the database. You see this name under "View, Properties, Edit".
Replace the first text "Titer" by this name.
The second text "Titer" stands for the text which is to appear in the printout. Replace this text by the text you wish
to have.
Replace the text "Titer" twice by the variable name in the
second and forth item.
10. Delete the report lines which are not needed from <TR>
to </TR>.
Printing raw reports
1. Open the window "Raw reports" (menu item "View, Show
raw reports").
2 Select the window "Raw reports".
3. Print the content of this window with .
Vesuv 3.0 6. Database • 77
Page 83

Export data
The selected data sets can be exported to other Vesuv databases, to other programs or to a LIMS.
Exporting data is triggered with the button <Export>. If you
wish to modify export settings without exporting data, press
<Save>, then <Cancel>.
Export settings are valid for all Vesuv databases.
Step by step procedure
1. Select the data sets to be exported in the determinations
table.
2. Check the export settings if necessary.
3. Trigger the export with .
Export settings
Menu item "File, Export data"
Type Export to a file of type
Vesuv file (*.mvd): Export into another Vesuv
database.
Text file (*.txt): Export as ASCII text with se-
lectable separator. For text files, you should
check the settings.
CSV file (*.csv): Export e.g. to Excel. You
should check the settings.
File Enter a directory and a filename. You may se-
lect the filename with .
Export to file or file&Port has to be selected.
Port Export directly to a ComPort. Enter the pa-
rameters of this port, button .
Export to Port or file&Port has to be selected.
Options
Append dataIf the selected export file already exists, the
data will be appended.
Delete data after export The exported data will be deleted in
the Vesuv database after the export.
Note: You shouldn't export data automatically
and delete them after exporting if you are printing reports immediately from the datalogger.
Automatic export The data will be exported automatically
as soon as they are entered into the Vesuv database.
78 • 6. Database Vesuv 3.0
Page 84

Prerequisites for automatic export:
• The database has to be open. If you have
several analytical devices connected to Vesuv and if you wish to export all data automatically, all devices must therefore write
into the same database.
• Activate refresh data in the datalogger,
see page 59.
No.of retries Enter the number of retries for exporting before
an error message appears. Set a higher number if the device for the export is not accessible
temporarily.
Export settings
Menu item "File, Export data, Settings"
Export settings are only necessary for text (*.txt) and CSV
files (*.csv). They include the selection of the items to be exported as well as data separators.
Export settings can be saved and loaded.
Export tables
Determinations Data of the determinations table.
If you selected the export of the determinations
table, you can additionally select each column
of the determinations table.
Sub-determinations Contains mode (DET, MET) and meas-
ured quantity.
Table of sub-determinations for 726 Titroproc-
essor.
Variables Tables of variables and formulas.
Endpoints Table of evaluated variables such as EP's, Fix
EP's, rates, pK/HNP etc.
Measuring point lists Measuring point lists.
Raw reports Raw reports of the analytical devices.
Include field names The field names (column headers) are
exported together with each data set.
Field separator Separator between data fields, for text files
only.
\t Tabulator
Vesuv 3.0 6. Database • 79
Page 85

Data set separator Separator between data sets, for text
files only.
\r CR
\n LF
Start block Introducing string. This string is exported once
at the beginning of each export package.
Example: $B\n (\n means LF, see above)
End block End string. This string is exported once at the
end of each export package.
Export formats
Date, time and numbers are exported according to the Regional setting of Windows (Control Panel).
The following field names of the database are used:
Sub-determinations (for 726 Titroprocessor)
Determ Internal identification of the data set.
Sub Number of sub-determination (1...5).
Name Name of sub-determination.
Mode Mode of the (sub)-determination, e.g. DET.
Quantity Measured quantity of the (sub)-determination,
e.g. pH.
Title Tittle of the sub-determination as used in the
Curve.
Variables
Determ Internal identification of the data set.
Sub Number of sub-determination (1...5).
Name1 Name of the variable, e.g. RS1 or C21. This
name is used for calculations in the formula.
Decimals Number of decimals, e.g. for results.
Formula Calculation formula.
Mean Mean, calculated by the analytical device.
MeanN Number of individual determinations for the
mean of the analytical device.
Name Name of the variable, e.g. Titer or pH(init)
RelStd Relative standard deviation as calculated by the
analytical device.
80 • 6. Database Vesuv 3.0
Page 86

Std Standard deviation as calculated by the analyti-
cal device.
Unit Unit of the variable, e.g. unit of the result.
Value Value of the variable, e.g. "5" or "stop volume
reached".
Endpoints
Determ Internal identification of the data set.
Sub Number of sub-determination (1...5).
Point Running number of evaluated point.
Name Name of the evaluated point, e.g. EP1 or C51.
This name is used for calculations in the for-
mula.
Label Label of this point in the curve.
Then the properties and units of this point follow, e.g. Meas
(measured quantity), Unit (unit of measured quantity); Volume, Unit (unit of volume) etc.
Raw reports
Determ Internal identification of the data set.
Sub Number of sub-determination (1...5).
Name Name of the report, e.g. Formula
Report Text of the raw report as sent by the analytical
device.
Vesuv 3.0 6. Database • 81
Page 87

Curve
Menu item "View, Show curve" or
Opens the curve window. The curve can be printed with .
Note: Curve can only be displayed if the analytical device
sends a measuring point list.
The following menu items are accessible with the right
mouse button:
ReevaluationThe curves can be evaluated graphically, see
page 87.
Navigator The navigator is only used when the determina-
tion contains several curves, e.g. determinations with the 726 Titroprocessor with subdeterminations.
You can browse through the sub-determination
curves with the navigator.
Undo zoom Used to switch off the zoom function.
Press the left mouse button and hold it down in
order to define that section of a curve which is
to be zoomed. When you release the left mouse
button the section will be zoomed.
Copy The curve is copied into the clipboard.
Properties With "Properties" it is possible to configure the
curve presentation, see page below.
Data for curve display
Right mouse button on the curve, Properties, Data
Selection of the data to be displayed. General settings for the
display.
The settings apply to all curves in the database with the
same mode, e.g. for all curves recorded in the DET mode.
X value Quantity to be shown on the horizontal axis (=X
axis).
The quantity shown can be renamed in the in-
put field. The axis of the curve will be labeled
with this name.
82 • 6. Database Vesuv 3.0
Page 88

Note: If you rename the axis label then the name
of the quantity shown will also be renamed.
1st Y value Quantity to be shown on the vertical axis (=Y
axis).
Renaming the quantity: see under "X axis".
2nd Y value 2nd quantity to be shown on the same X axis,
i.e. 2 superimposed curves will be shown.
With "None" only 1 curve will be shown.
Renaming the quantity: see under "X axis".
Main title Title which will be shown in the 1st line. The title
only applies to the currently selected curve.
Subtitle Title which will be shown in the 2nd line. The ti-
tle only applies to the currently selected curve.
If curves are overlaid the 2nd title appears as
the legend.
Show legend Displays the legend in which the curve colors
are assigned to the quantities shown.
Show subtitle Displays the subtitles.
Show measuring points Measuring points are marked on
the curve. This is only possible when curve
smoothing is switched off.
Smoothing Switches on curve smoothing. This can be ad-
vantageous for curve evaluation, etc.
Show original too Displays the unsmoothed original curve.
In this way you can see how well the smoothing
process reproduces your curve.
X, Y Smoothing factors.
Higher value means more smoothing.
X: Smoothing for X axis.
Y: Smoothing for Y axis
The smoothing factors may help for parallel
evaluations. If you find too many endpoints you
should smooth more. The smoothing factor of
the volume axis should remain small (0.01). For
the measuring axis, you may try to increase
smoothing from 0.01 to 0.1, 1, 10, 100, 1000.
If the original curve differs too much from the
smoothed curve, you should decrease smooth-
ing.
Vesuv 3.0 6. Database • 83
Page 89

Curve colors, fonts
Right mouse button on the curve, Properties, Curve
Settings for showing the curve of a single determination:
color, symbol for measuring point display.
The settings apply to all curves in the database with the
same mode, e.g. for all curves recorded in the DET mode.
"Automatic" sets the standard setting.
Manual
For "Overlay curves", the manual settings do not apply.
Curve Select the curve whose settings you want to al-
ter. Curve 1 shows the quantity Y1, curve 2 ap-
plies to Y2.
Color Color of this curve.
Symbol for measuring points Symbol with which the meas-
uring points on the curve are to be shown.
Curve scaling
Right mouse button on the curve, Properties, Scaling
Settings for scaling the curve.
The settings apply to all curves in the database with the
same mode, e.g. for all curves recorded in the DET mode.
X axis
Auto Scales the curve automatically.
Manual From...To: Scaling from ... to.
Major: Number of subdivisions on the axis.
Minor: Number of subdivisions within a main di-
vision.
1st Y axis Same as X axis
Show 2nd Y axis Shows a second scale on the right vertical
axis.
2nd Y axis Same as X axis
84 • 6. Database Vesuv 3.0
Page 90

Curve grid
Right mouse button on the curve, Properties, Grid
Settings for displaying the grid lines.
The settings apply to all curves in the database with the
same mode, e.g. for all curves recorded in the DET mode.
Show grid Displays the grid lines.
Grid type The grid can be shown only for the X or Y axis,
for both axes or not shown at all.
Grid style Type of grid line display.
Grid & scale color Color of grid lines shown.
EP display in the curve
Right mouse button on the curve, Properties, Endpoints
Display of endpoints in the curve.
The settings apply to all curves in the database with the
same mode, e.g. for all curves recorded in the DET mode.
Symbol Symbol for EPs to be graphically evaluated.
Color Color for all EPs.
Size Symbol size for all EPs.
Show evaluation lines The evaluation lines for the re-
evaluation are retained and are also printed out.
Labels
Right mouse button on the curve, Properties, Labeling
Selects the fonts, font sizes and font colors for titles and labels of the curve.
The settings apply to all curves in the database with the
same mode, e.g. for all curves recorded in the DET mode.
Vesuv 3.0 6. Database • 85
Page 91

Curve options
Right mouse button on the curve, Properties, Options
Selects the various colors for showing the curves.
The settings apply to all curves in the database with the
same mode, e.g. for all curves recorded in the DET mode.
Curve overlay
Menu item "View, Curve overlay" or
Step by step procedure
1. Open the curve window ( ).
2. Select the data sets for curve overlay in the determinations table.
3. Activate the mode "Curve overlay" ( ).
4. You may add more data sets for curve overlay (select
these data sets) or you may remove data sets from curve
overlay (unselect them).
5. Quit the mode "Curve overlay" by pressing again.
Navigator
Right mouse button on the curve, Navigator
With the Navigator you can select the number of the curve if
there are several sub-determinations within the data set. You
can leaf backwards and forwards through the curves.
You can also fix the Navigator on a curve of a subdetermination, i.e. if you select a new data set then the curve
of this sub-determination will be shown automatically.
In order to leaf through the curves "Fix" must be switched off.
86 • 6. Database Vesuv 3.0
Page 92

Re-evaluation, recalculation
Re-evaluation, recalculation
Right mouse button on the curve, Re-evaluation
The curves can be evaluated graphically.
Step by step procedure
1. Select the type of evaluation.
2. By using the keys <CTRL> (and <Shift>) and the left
mouse button you can move the selected line along the
curve with the cursor. The EP-coordinates are continuously displayed in the "Result" field.
Position the line(s).
3. Use the <Add EP> button to add the new EP. This
manually evaluated EP receives a different symbol. The
symbol can be specified under Properties, Endpoints.
4. The evaluation lines can be retained and printed out
("Properties, Endpoints, Show evaluation lines").
5. The original condition is returned to with the menu item
"Data, Original results" of the database.
Deleting an EP
1. Select the EP: Click onto the text "EPX". The current EP
is shown in the "Active endpoint" field.
2. Delete the EP with the <Delete EP> button.
Evaluation possibilities
Move the cursor on the curve with the <CTRL> key and
the left mouse button.
Evaluation with intersection lines. The tangents are applied to the curve. The EP is defined as the intersection
of the tangents. This evaluation is used, for example, in
conductometric and photometric titrations.
Move Tangent 1 along the curve with the <CTRL> key
and the left mouse button; move Tangent 2 with the
<Shift> key and the left mouse button.
The curve sections can be zoomed (mouse).
For fine positioning, curve smoothing can be switched
on under Properties.
Vesuv 3.0 6. Database • 87
Page 93

Evaluation according to the parallel tangents method.
Parallel tangents are applied to the curve. The EP is
defined as the median of the tangents. This evaluation
is used for potentiometric titrations. It is meaningful if
the curve is relatively symmetrical.
Move the parallel tangents along the curve with the
<CTRL> key and the left mouse button.
The curve sections can be zoomed (mouse).
For fine positioning curve smoothing can be switched
on under Properties.
Auxiliary lines can be placed anywhere in the curve
field.
Move the vertical line with the <CTRL> key and the left
mouse button; the horizontal line with <Shift> key and
the left mouse button.
The coordinates of the intersection point of the auxiliary
lines are shown under "Auxiliary lines".
Recalculate results
Menu item "Data, Recalculate results" or
Results can be recalculated with modified variables, formulas
and/or graphically re-evaluated Endpoints.
Recalculated results are labeled with "1" in column "M" of the
determinations table (original results with "0").
Recalculate results with modified variables
1. Select the data set in the determinations table to be recalculated.
2. Open the window "Variables+formulas", menu item
"View, Show variables + Formulas".
If you selected more than 1 data set, the variables of the
first selected data set appears.
3. Double click the variable or the formula to be modified
and edit the value. If you press <OK>, the data set(s)
is/are already labeled as modified.
The modified value will be entered for all selected data
sets.
4. Recalculate the result with .
Each data set will be calculated according to its entries in
the variables window, i.e. if the formula has not been
modified, each data set keeps its old formula. If the formula has been modified, each data set will be calculated
according to the new formula.
88 • 6. Database Vesuv 3.0
Page 94

Show variables and formulas
Menu item "View, Show variables+formulas"
The variables window will be displayed. You need this window for recalculation of results with modified variables or
formulas.
The column headers of this window mean the following:
No Running number.
Sub-determination Number of sub-determination, important
only for 726 Titroprocessor.
Name Name of variable.
In the formulas you may find variable names
which are different from these names for Titrinos and KF-Coulometer and for 726 Titroproc-
essor.
Property of the variable.
Value of the variable
E Indicates if this value can be edited.
0: Value cannot be edited.
1: Value can be edited.
M Indicates if this value has been modified.
0: Value has not been modified.
1: Value has been modified.
List of calculation variables for Titrinos and 756
KF Coulometer
The names of the variables in the "Variables + formulas" table is different from the symbols used in the formula for the
following variables:
Symbol in formula Name
C00 SmplSize
C21 Id1
C22 Id2
C23 Id3
Vesuv 3.0 6. Database • 89
Page 95

If such a variable is used in a formula for calculation, its value
will be read in the line which you find under "Name", e.g. the
value of "SmplSize" will be used in formulas which contain
C00.
List of calculation variables for 726 Titroprocessor
The names of the variables in the "Variables + formulas" table is different from the symbols used in the formula for the
following variables:
Symbol in formula Name
SS SmplSize
For the results you may either use the original name from the
726 Titroprocessor or RSX.
Formulas with the function "TST" (Test) of the 726 Titroprocessor cannot be recalculated by Vesuv.
If an endpoint is deleted or added in Vesuv, the endpoint
flags (EFX) will be actualized.
Reset original results
Menu item "Data, Original results" or
Recalculated data sets can also be reset to their original values. All variables and formulas are reset to their original values and endpoints are reset as they were evaluated by the
analytical device. The label in column "M" of the determinations table is reset from 1 to 0.
90 • 6. Database Vesuv 3.0
Page 96

Statistics
Menu item "Data, Statistics"
Mean, standard deviation and relative standard deviation are
calculated.
Step by step procedure
1. Select the data sets to be included in the statistics cal-
culation.
2. Open the statistics window (menu item "Data, Statistics").
3. Statistics calculations are carried out.
4. If you select more data sets, they will also be included in
the statistics calculation.
You can also select different data sets. Statistics calculation will be carried out as long as its window remains
open.
5. Close the statistics window if you are done with statistics.
If you keep the statistics window open, the database will
be slow because statistics calculations are always carried
out.
Copy statistics into other programs
1. Select the lines in the statistics window to be copied.
2. Copy these lines into the clipboard (<Ctrl>+<C>).
3. Paste the clipboard into another program (e.g. Excel,
Word).
Modify the values for statistics calculations
If you wish to have statistics calculation from other or more
variables (e.g. including endpoints), proceed as follows:
1. Select a data set in the determinations table which con-
tains this variable.
2. Click with the right mouse button and select "Properties".
3. Select the quantity for statistics from the list.
4. Double click on this quantity and activate "Statistics" ( ).
5. Make sure this quantity is visible in the determinations
table.
Statistics calculation is possible for every quantity if its property in the determinations table is "Number".
Vesuv 3.0 6. Database • 91
Page 97

More windows
Raw reports
Menu item "View, Show raw reports"
Raw reports are those reports which have been sent by the
analytical device. In order to have raw reports in the database, they have to be saved in the Datalogger, see page 48.
Raw reports can be displayed and printed.
Display only selected raw reports
1. Select the data set from which you wish to display raw
reports.
2. Open the window "Raw reports" (menu item "View, Show
raw reports").
3. Select the window "Raw reports", click with the right
mouse button and select "Properties"
4. Select the raw report(s) to be displayed.
Note: The selection is valid for all data sets and all Vesuv
databases.
Printing raw reports
1. Open the window "Raw reports" (menu item "View, Show
raw reports").
2 Select the window "Raw reports".
3. Print the content of this window with .
92 • 6. Database Vesuv 3.0
Page 98

Endpoints
Menu item "View, Show endpoints"
The table "Endpoints" contains all those values which have
been evaluated by the analytical device:
Endpoints, Fix EP's, pK/HNP, rates, fix times, fix V etc.
The table can be printed ( ), exported and copied via clipboard into any program.
The columns have the following meaning:
No Running number.
Sub-determination Number of sub-determination, important
only for 726 Titroprocessor.
Label Label of the point in the curve.
Value of the point.
Unit of the point.
Vesuv 3.0 6. Database • 93
Page 99

Options of the database
General
Menu item "Options, Settings, General"
Open last database on start
The last database will be opened automatically
when you start the Vesuv database.
Save view on exit On exiting the Vesuv database, the posi-
tions of the windows are saved.
Check user permissions
Password protection will be active.
Report template
Selection of the report template, see page 74.
Monitoring of database
Menu item "Options, Settings, Monitoring"
Time intervals for data backup and compressing of the database can be monitored. The size of the database is monitored from the datalogger (menu item "Device window, Properties, Database").
Step by step procedure
1. Activate monitoring ( ).
2. Edit the dates, button <Date>:
Next date You may set a date for the beginning of the
monitoring. The date will be reset if an action is
confirmed.
The next date for the action is displayed here.
Interval Enter the interval for this action.
Carried out last time Shows the last date when this ac-
tion has been confirmed.
Carried out by Shows the name of the user who con-
firmed this action the last time.
If no user of the Vesuv database is logged in and
no name was given for the Windows login,
"Administrator" is entered.
94 • 6. Database Vesuv 3.0
Page 100

3. Enter the message that should appear if the interval is
expired, button <Message>.
The interval test is carried out on opening of the database.
Monitoring interval is expired
Execute the required action.
If you want to carry out the required action, activate "Carried
out". If you are a logged in user, your name will be stored and
can be viewed in the monitoring function.
If you don't wish to execute the required action now, you can
also postpone it.
Vesuv 3.0 6. Database • 95
 Loading...