

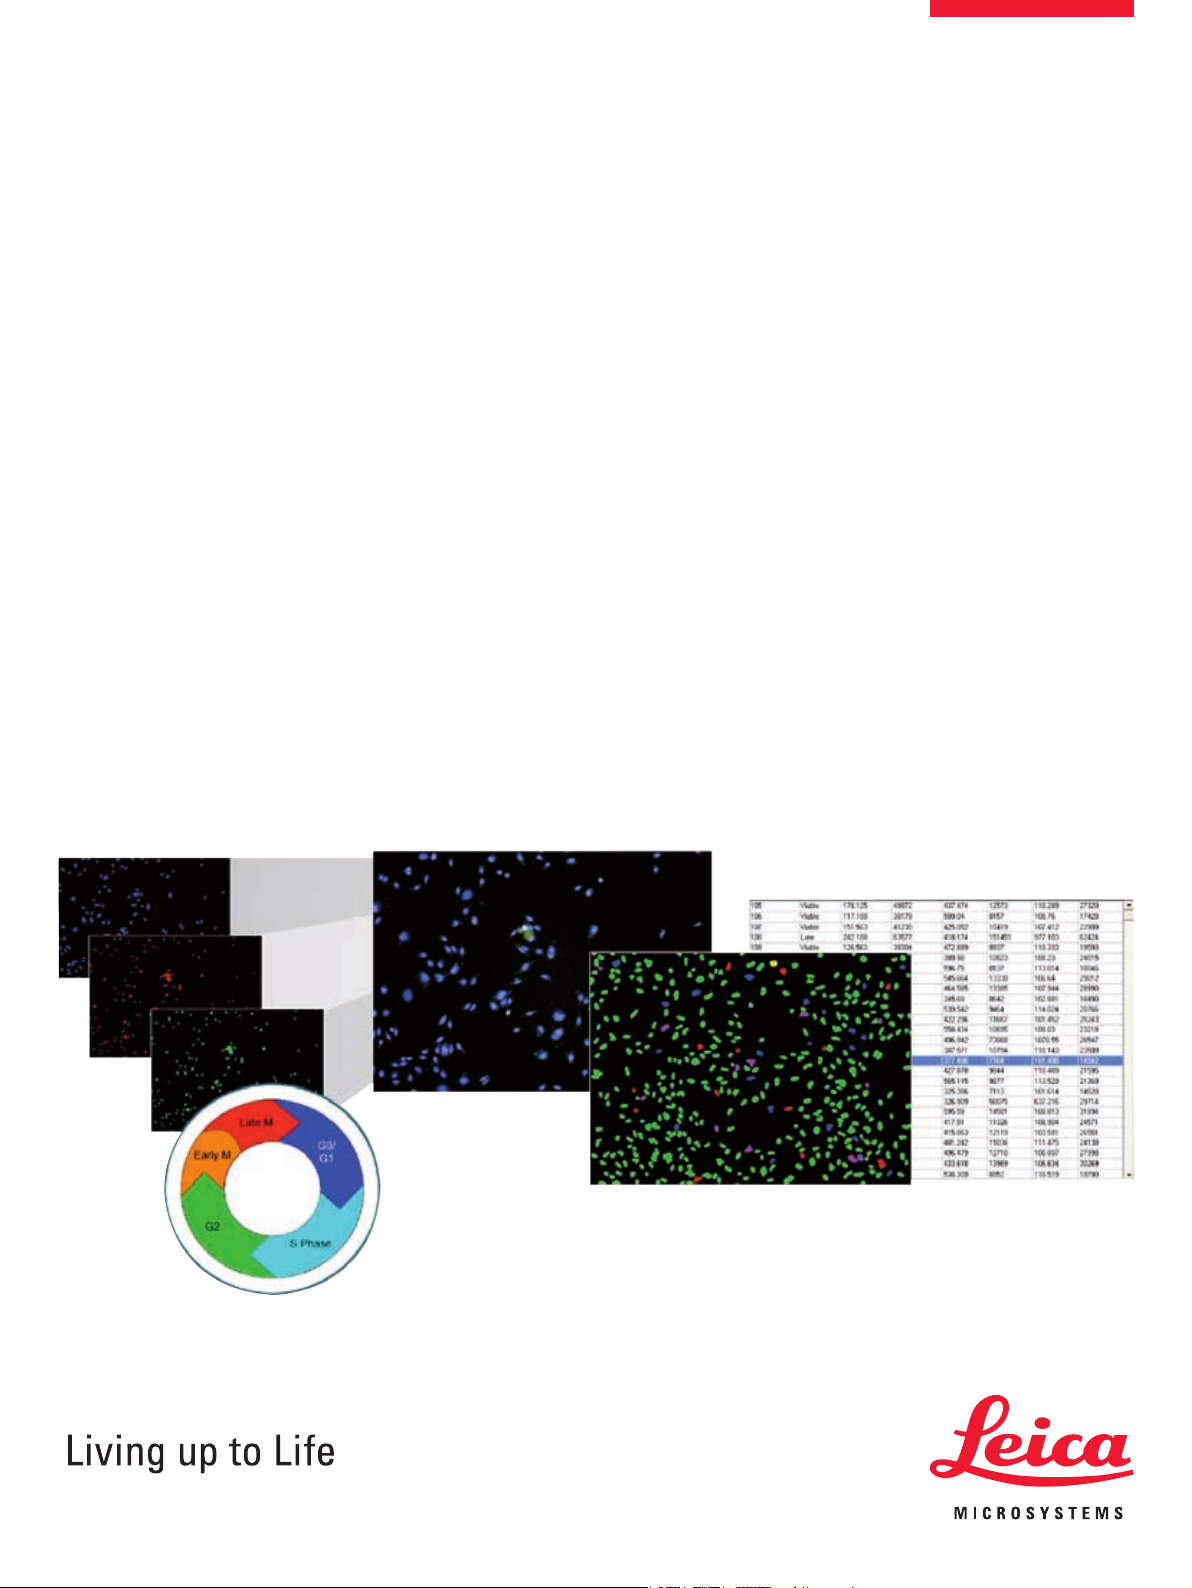
Leica MM Cell Cycle powered by MetaMorph
Analysis Software Drop-in for Leica MM AF
• Quantitation of cell cycle stages
• Adaptive Background Correction™ for improved segmentation
• Field and Cell-by-Cell data logging
®
Cells have multiple checkpoints that can impede progression past
the stages of G0/G1, G2 or the midpoint of M during the cell cycle.
When checkpoints are active and cells are challenged by DNA
damage, hypoxia, metabolic changes or spindle disruption, normal
cells will arrest. One common property of cancerous cells is the
loss of those checkpoints. When cells lose checkpoint control and
are challenged, they often undergo apoptosis.
The Leica MM Cell Cycle for Leica MM AF software from Leica
Microsystems is designed for the quantitation of cell cycle stage
for cells labeled with a DNA stain. Additionally, a mitosis-specic
probe may be used to better identify M-phase cells and an apoptosis-specic probe may be used to identify cells undergoing apoptosis.
Images can be acquired using one, two or three different wavelengths for the DNA stain, M-phase marker and apoptosis marker.
The module utilizes Adaptive Background Correction adapting the
cell detection algorithm to the local intensity ranges between and
within cells to provide the most robust segmentation available.
This technique enables probe detection even with highly variable
background uorescence within a single image.
A simple interface minimizes setup efforts and at the same time
enables users to customize the settings and measurements to obtain the best possible results specic to the type of cells used in
the experiments.
Multiple wavelength acquisition
The software acquires multiple wavelengths
and color combines the images during visualization (right).
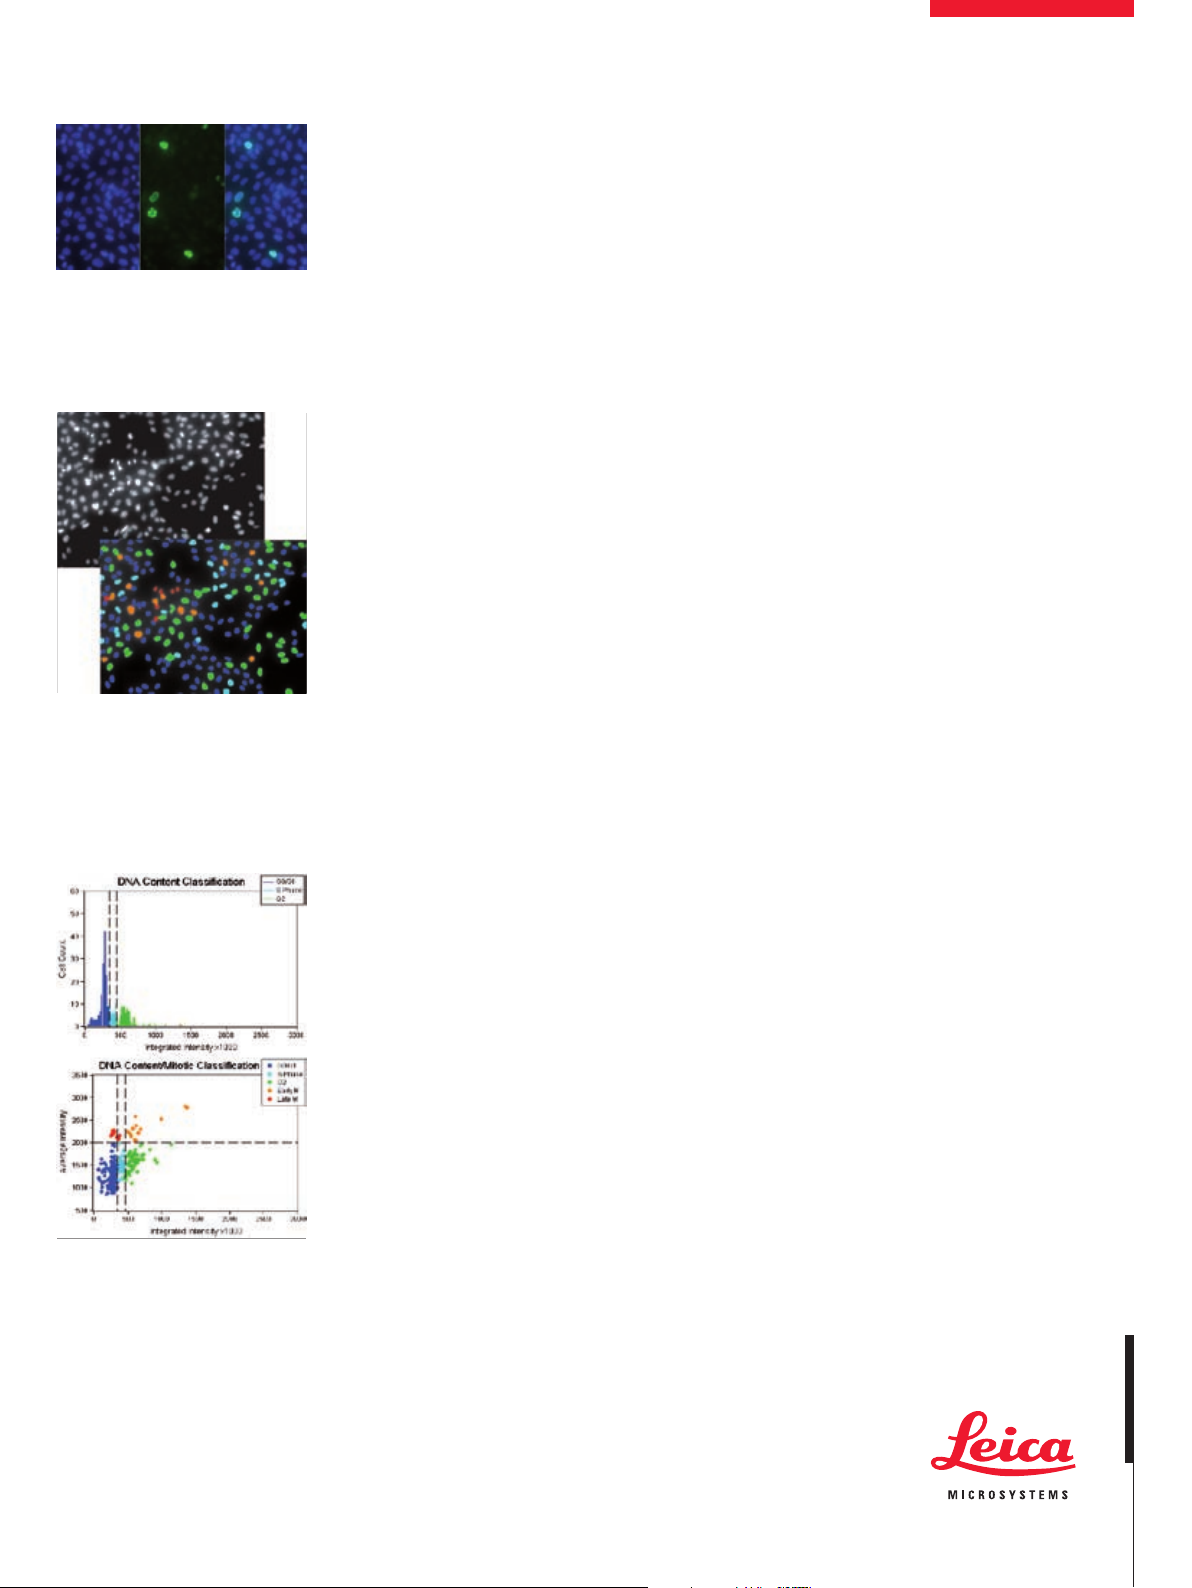
Robust analysis
Cell cycle classification can be performed with
a single or multi wavelength assay. Top: CHO-K1
cells stained with Hoechst 33342. Bottom: The
Cell Cycle module identifies cell cycle phases:
G0/G1 (dark blue), S (light blue), G2 (green),
Early M (orange) and Late M (red).
Configuration for analysis
Step 1. Select the DNA stain image.
Step 2. Specify the size range of cells and in-
tensity above local background.
Step 3. Set the classication criterion for mi-
tosis by specifying the intensity of the
DNA stain or an optional mitotic-specic stain.
Step 4. If using an apoptotic stain, select the
stain area, size range of cells and intensity above local background.
Step 5. Preview classication results and inter-
actively adjust cutoff values.
Step 6. Optionally set reporting parameters.
Interactive data display
Once the analysis is run, the Cellular Results table allows you to interactively view individual
cells’ data. Clicking one or multiple cells in the
image highlights the data for the selected cell(s)
in the table.
Customization through journaling
Multi-parameter analysis
The Application Module can generate a number
of eld or cell-by-cell parameters, including:
• Count and percentage of G0/G1, S, G2, early M,
late M and apoptotic cells
• DNA area, mitotic and apoptotic integrated and
average intensities
“MetaMorph® is a Registered Trademark of MDS
Analytical Technologies”
Interactive graphs
Cell classifications can be set by interactively
moving cutoff values directly on the graphs.
Journals are sophisticated and powerful macros
that record and perform a series of tasks without
the need for a programming language. The modules can be incorporated into a Leica MM AF
journal to increase the customization and automation of your analysis.
Powerful data export capabilities
All measurements can be directly exported to a
text le or Microsoft® Excel® for further analysis.
www.leica-microsystems.com
 Loading...