

Page 1

Model 2002
Multimeter
User’s Manual
Contains Operating and Servicing Information
Page 2

W ARRANTY
Keithley Instruments, Inc. warrants this product to be free from defects in material and workmanship for a period of 3 years from
date of shipment.
Keithley Instruments, Inc. warrants the following items for 90 days from the date of shipment: probes, cables, rechargeable batteries,
diskettes, and documentation.
During the warranty period, we will, at our option, either repair or replace any product that proves to be defective.
To exercise this warranty, write or call your local K eithley representative, or contact K eithley headquarters in Cleveland, Ohio. You
will be given prompt assistance and return instructions. Send the product, transportation prepaid, to the indicated service facility.
Repairs will be made and the product returned, transportation prepaid. Repaired or replaced products are warranted for the balance
of the original warranty period, or at least 90 days.
LIMIT A TION OF W ARRANTY
This warranty does not apply to defects resulting from product modification without Keithley’s express written consent, or misuse
of any product or part. This warranty also does not apply to fuses, software, non-rechargeable batteries, damage from battery leakage, or problems arising from normal wear or failure to follow instructions.
THIS WARRANTY IS IN LIEU OF ALL OTHER WARRANTIES, EXPRESSED OR IMPLIED, INCLUDING ANY IMPLIED
WARRANTY OF MERCHANTABILITY OR FITNESS FOR A PARTICULAR USE. THE REMEDIES PROVIDED HEREIN
ARE BUYER’S SOLE AND EXCLUSIVE REMEDIES.
NEITHER KEITHLEY INSTRUMENTS, INC. NOR ANY OF ITS EMPLOYEES SHALL BE LIABLE FOR ANY DIRECT,
INDIRECT, SPECIAL, INCIDENTAL OR CONSEQUENTIAL DAMAGES ARISING OUT OF THE USE OF ITS INSTRUMENTS AND SOFTWARE EVEN IF KEITHLEY INSTRUMENTS, INC., HAS BEEN ADVISED IN AD VANCE OF THE POSSIBILITY OF SUCH DAMAGES. SUCH EXCLUDED DAMAGES SHALL INCLUDE, BUT ARE NOT LIMITED TO: COSTS
OF REMOVAL AND INSTALLATION, LOSSES SUSTAINED AS THE RESULT OF INJURY TO ANY PERSON, OR DAMAGE TO PR OPERTY .
Keithley Instruments, Inc. • 28775 Aurora Road • Cleveland, OH 44139 • 440-248-0400 • Fax: 440-248-6168 • http://www.keithley.com
BELGIUM: Keithley Instruments B.V. Bergensesteenweg 709 • B-1600 Sint-Pieters-Leeuw • 02/363 00 40 • Fax: 02/363 00 64
CHINA: Keithley Instruments China Y uan Chen Xin Building, Room 705 • 12 Yumin Road, Dewai, Madian • Beijing 100029 • 8610-62022886 • F ax: 8610-62022892
FRANCE: Keithley Instruments Sarl B.P. 60 • 3, allée des Garays • 91122 Palaiseau Cédex • 01 64 53 20 20 • Fax: 01 60 11 77 26
GERMANY: Keithley Instruments GmbH Landsberger Strasse 65 • D-82110 Germering • 089/84 93 07-40 • Fax: 089/84 93 07-34
GREAT BRITAIN: Keithley Instruments Ltd The Minster • 58 Portman Road • Reading, Berkshire RG30 1EA • 0118-9 57 56 66 • Fax: 0118-9 59 64 69
INDIA: Keithley Instruments GmbH Flat 2B, WILOCRISSA • 14, Rest House Crescent • Bangalore 560 001 • 91-80-509-1320/21 • Fax: 91-80-509-1322
ITALY: Keithley Instruments s.r.l. Viale S. Gimignano, 38 • 20146 Milano • 02/48 30 30 08 • Fax: 02/48 30 22 74
NETHERLANDS: Keithley Instruments B.V. Postbus 559 • 4200 AN Gorinchem • 0183-635333 • Fax: 0183-630821
SWITZERLAND: Keithley Instruments SA
TAIWAN: Keithley Instruments Taiwan 1 Fl. 85 Po Ai Street • Hsinchu, Taiwan, R.O.C. • 886-3572-9077• Fax: 886-3572-9031
Kriesbachstrasse 4 • 8600 Dübendorf • 01-821 94 44 • Fax: 01-820 30 81
6/99
Page 3

Model 2002 Multimeter
User’s Manual
©1994, Keithley Instruments, Inc.
All rights reserved.
Cleveland, Ohio, U.S.A.
Fourth Printing, March 1999
Document Number: 2002-900-01 Rev. D
Page 4

Manual Print History
The print history shown below lists the printing dates of all Revisions and Addenda created for this manual. The Revision
Level letter increases alphabetically as the manual undergoes subsequent updates. Addenda, which are released between Revisions, contain important change information that the user should incorporate immediately into the manual. Addenda are numbered sequentially. When a new Revision is created, all Addenda associated with the previous Revision of the manual are
incorporated into the new Revision of the manual. Each new Revision includes a revised copy of this print history page.
Revision A (Document Number 2002-900-01).........................................................................................May 1994
Addendum A (Document Number 2002-900-02)..................................................................................... May 1995
Addendum A (Document Number 2002-900-03)................................................................................October 1995
Addendum A (Document Number 2002-900-04).................................................................................. March 1996
Revision B (Document Number 2002-900-01)............................................................................... September 1997
Revision C (Document Number 2002-900-01).........................................................................................June 1998
Revision D (Document Number 2002-900-01) .....................................................................................March 1999
All Keithley product names are trademarks or registered trademarks of Keithley Instruments, Inc.
Other brand and product names are trademarks or registered trademarks of their respective holders
Page 5

Safety Precautions
The following safety precautions should be observed before using
this product and any associated instrumentation. Although some instruments and accessories would normally be used with non-hazardous voltages, there are situations where hazardous conditions
may be present.
This product is intended for use by qualified personnel who recognize shock hazards and are familiar with the safety precautions required to avoid possible injury. Read the operating information
carefully before using the product.
The types of product users are:
Responsible body is the individual or group responsible for the use
and maintenance of equipment, for ensuring that the equipment is
operated within its specifications and operating limits, and for ensuring that operators are adequately trained.
Operators use the product for its intended function. They must be
trained in electrical safety procedures and proper use of the instrument. They must be protected from electric shock and contact with
hazardous live circuits.
Maintenance personnel perform routine procedures on the product
to keep it operating, for example, setting the line voltage or replacing consumable materials. Maintenance procedures are described in
the manual. The procedures explicitly state if the operator may perform them. Otherwise, they should be performed only by service
personnel.
Service personnel are trained to work on live circuits, and perform
safe installations and repairs of products. Only properly trained service personnel may perform installation and service procedures.
Users of this product must be protected from electric shock at all
times. The responsible body must ensure that users are prevented
access and/or insulated from every connection point. In some cases,
connections must be exposed to potential human contact. Product
users in these circumstances must be trained to protect themselves
from the risk of electric shock. If the circuit is capable of operating
at or above 1000 volts, no conductive part of the circuit may be
exposed.
As described in the International Electrotechnical Commission
(IEC) Standard IEC 664, digital multimeter measuring circuits
(e.g., Keithley Models 175A, 199, 2000, 2001, 2002, and 2010) are
Installation Category II. All other instruments’ signal terminals are
Installation Category I and must not be connected to mains.
Do not connect switching cards directly to unlimited power circuits.
They are intended to be used with impedance limited sources.
NEVER connect switching cards directly to AC mains. When connecting sources to switching cards, install protective devices to limit fault current and voltage to the card.
Before operating an instrument, make sure the line cord is connected to a properly grounded power receptacle. Inspect the connecting
cables, test leads, and jumpers for possible wear, cracks, or breaks
before each use.
For maximum safety, do not touch the product, test cables, or any
other instruments while power is applied to the circuit under test.
ALWAYS remove power from the entire test system and discharge
any capacitors before: connecting or disconnecting cables or jumpers, installing or removing switching cards, or making internal
changes, such as installing or removing jumpers.
Exercise extreme caution when a shock hazard is present. Lethal
voltage may be present on cable connector jacks or test fixtures. The
American National Standards Institute (ANSI) states that a shock
hazard exists when voltage levels greater than 30V RMS, 42.4V
peak, or 60VDC are present. A good safety practice is to expect
that hazardous voltage is present in any unknown circuit bef ore
measuring.
Do not touch any object that could provide a current path to the
common side of the circuit under test or power line (earth) ground.
Always make measurements with dry hands while standing on a
dry, insulated surface capable of withstanding the voltage being
measured.
Page 6

The instrument and accessories must be used in accordance with its
specifications and operating instructions or the safety of the equipment may be impaired.
Do not exceed the maximum signal levels of the instruments and accessories, as defined in the specifications and operating information, and as shown on the instrument or test fixture panels, or
switching card.
When fuses are used in a product, replace with same type and rating
for continued protection against fire hazard.
Chassis connections must only be used as shield connections for
measuring circuits, NOT as safety earth ground connections.
If you are using a test fixture, keep the lid closed while power is applied to the device under test. Safe operation requires the use of a
lid interlock.
If a screw is present, connect it to safety earth ground using the
wire recommended in the user documentation.
!
The symbol on an instrument indicates that the user should refer to the operating instructions located in the manual.
The symbol on an instrument shows that it can source or measure 1000 volts or more, including the combined effect of normal
and common mode voltages. Use standard safety precautions to
avoid personal contact with these voltages.
The WARNING heading in a manual explains dangers that might
result in personal injury or death. Alw ays read the associated infor mation very carefully before performing the indicated procedure.
The CAUTION heading in a manual explains hazards that could
damage the instrument. Such damage may invalidate the warranty.
Instrumentation and accessories shall not be connected to humans.
Before performing any maintenance, disconnect the line cord and
all test cables.
To maintain protection from electric shock and fire, replacement
components in mains circuits, including the power transformer, test
leads, and input jacks, must be purchased from Keithley Instruments. Standard fuses, with applicable national safety approvals,
may be used if the rating and type are the same. Other components
that are not safety related may be purchased from other suppliers as
long as they are equivalent to the original component. (Note that selected parts should be purchased only through Keithley Instruments
to maintain accuracy and functionality of the product.) If you are
unsure about the applicability of a replacement component, call a
Keithley Instruments office for information.
To clean an instrument, use a damp cloth or mild, water based
cleaner. Clean the exterior of the instrument only. Do not apply
cleaner directly to the instrument or allow liquids to enter or spill
on the instrument. Products that consist of a circuit board with no
case or chassis (e.g., data acquisition board for installation into a
computer) should never require cleaning if handled according to instructions. If the board becomes contaminated and operation is affected, the board should be returned to the factory for proper
cleaning/servicing.
Rev. 2/99
Page 7

Table of Contents
1 General Information
1.1 Introduction ........................................................................................................................................................ 1-1
1.2 Features .............................................................................................................................................................. 1-1
1.3 Warranty information ......................................................................................................................................... 1-2
1.4 Manual addenda ................................................................................................................................................. 1-2
1.5 Safety symbols and terms .................................................................................................................................. 1-2
1.6 Specifications ..................................................................................................................................................... 1-2
1.7 Inspection ........................................................................................................................................................... 1-2
1.8 Options and accessories ..................................................................................................................................... 1-2
2 Front Panel Operation
2.1 Introduction ........................................................................................................................................................ 2-1
2.2 Power-up ............................................................................................................................................................ 2-1
2.2.1 Line power connections ............................................................................................................................. 2-1
2.2.2 Line fuse replacement ................................................................................................................................ 2-2
2.2.3 Power-up sequence .................................................................................................................................... 2-2
2.2.4 High energy circuit safety precautions ....................................................................................................... 2-4
2.2.5 Power-on default conditions ...................................................................................................................... 2-4
2.2.6 Warm-up period ......................................................................................................................................... 2-4
2.2.7 IEEE-488 primary address ......................................................................................................................... 2-4
2.3 Display ............................................................................................................................................................... 2-4
2.3.1 Multiple displays ........................................................................................................................................ 2-4
2.3.2 Information messages ................................................................................................................................ 2-7
2.3.3 Status and error messages .......................................................................................................................... 2-7
2.3.4 Navigating menus ...................................................................................................................................... 2-9
2.4 Functions ............................................................................................................................................................ 2-9
2.4.1 DC and AC voltage .................................................................................................................................... 2-9
2.4.2 DC and AC current .................................................................................................................................. 2-23
2.4.3 Two and four-wire resistance ................................................................................................................... 2-28
2.4.4 Frequency ................................................................................................................................................. 2-32
2.4.5 Temperature ............................................................................................................................................. 2-33
2.5 Range ............................................................................................................................................................... 2-40
2.5.1 Display resolution .................................................................................................................................... 2-40
2.5.2 Maximum readings .................................................................................................................................. 2-40
2.5.3 Manual ranging ........................................................................................................................................ 2-40
2.5.4 Autoranging ............................................................................................................................................. 2-40
2.6 Relative ............................................................................................................................................................ 2-40
2.6.1 Configuring rel ......................................................................................................................................... 2-41
2.6.2 Enabling rel .............................................................................................................................................. 2-41
i
Page 8

2.6.3 Multiple display of rel .............................................................................................................................. 2-41
2.7 Triggers ............................................................................................................................................................. 2-41
2.7.1 Trigger model ........................................................................................................................................... 2-41
2.7.2 Configuring the measure layer ................................................................................................................. 2-46
2.7.3 Configuring the scan layer ........................................................................................................................ 2-48
2.7.4 Configuring the arm layer ........................................................................................................................ 2-49
2.7.5 Halting triggers ......................................................................................................................................... 2-50
2.7.6 External triggering .................................................................................................................................... 2-50
2.7.7 Trigger Link .............................................................................................................................................. 2-53
2.8 Buffer ................................................................................................................................................................ 2-64
2.8.1 Burst mode ................................................................................................................................................ 2-65
2.8.2 Configuring data storage .......................................................................................................................... 2-67
2.8.3 Storing and recalling readings .................................................................................................................. 2-69
2.8.4 Buffer multiple displays ........................................................................................................................... 2-70
2.9 Filter ................................................................................................................................................................. 2-71
2.9.1 Filter types ................................................................................................................................................ 2-71
2.9.2 Filter modes .............................................................................................................................................. 2-71
2.9.3 Response time ........................................................................................................................................... 2-73
2.9.4 Auto filtering ............................................................................................................................................ 2-73
2.9.5 Configuring the filters .............................................................................................................................. 2-74
2.10 Math .................................................................................................................................................................. 2-75
2.10.1 Polynomial ................................................................................................................................................ 2-75
2.10.2 Percent ...................................................................................................................................................... 2-76
2.10.3 Percent deviation ...................................................................................................................................... 2-76
2.10.4 Selecting and configuring math ................................................................................................................ 2-76
2.10.5 Calculate multiple display ........................................................................................................................ 2-77
2.11 Scanning ........................................................................................................................................................... 2-77
2.11.1 Scanning overview ................................................................................................................................... 2-77
2.11.2 Front panel scanner controls ..................................................................................................................... 2-77
2.11.3 Using CHAN key to close and open internal channels ............................................................................ 2-78
2.11.4 Using CONFIGURE CHAN to configure channels ................................................................................. 2-79
2.11.5 Using CONFIG-SCAN to configure scanning ......................................................................................... 2-80
2.11.6 Using SCAN to configure scan parameters .............................................................................................. 2-81
2.11.7 Starting and stopping scanning ................................................................................................................. 2-83
2.11.8 Scanner operation examples ..................................................................................................................... 2-83
2.12 Menu ................................................................................................................................................................. 2-87
2.12.1 SAVESETUP ........................................................................................................................................... 2-90
2.12.2 GPIB ......................................................................................................................................................... 2-96
2.12.3 CALIBRATION ....................................................................................................................................... 2-96
2.12.4 TEST ......................................................................................................................................................... 2-97
2.12.5 LIMITS ..................................................................................................................................................... 2-97
2.12.6 STATUS-MSG ......................................................................................................................................... 2-99
2.12.7 GENERAL ............................................................................................................................................... 2-99
3 IEEE-488 Reference
3.1 Introduction ........................................................................................................................................................ 3-1
3.2 IEEE-488 bus connections ................................................................................................................................. 3-1
3.3 Primary address selection ................................................................................................................................... 3-2
3.4 QuickBASIC 4.5 programming .......................................................................................................................... 3-3
3.5 General bus commands ....................................................................................................................................... 3-4
3.5.1 REN (remote enable) .................................................................................................................................. 3-4
3.5.2 IFC (interface clear) ................................................................................................................................... 3-4
ii
Page 9

3.5.3 LLO (local lockout) ................................................................................................................................... 3-4
3.5.4 GTL (go to local) ....................................................................................................................................... 3-5
3.5.5 DCL (device clear) ..................................................................................................................................... 3-5
3.5.6 SDC (selective device clear) ...................................................................................................................... 3-5
3.5.7 GET (group execute trigger) ...................................................................................................................... 3-5
3.5.8 SPE, SPD (serial polling) ........................................................................................................................... 3-5
3.6 Front panel aspects of IEEE-488 operation ....................................................................................................... 3-5
3.6.1 Error and status message ............................................................................................................................ 3-5
3.6.2 IEEE-488 status indicators ......................................................................................................................... 3-5
3.6.3 LOCAL key ................................................................................................................................................ 3-6
3.7 Status structure ................................................................................................................................................... 3-6
3.7.1 Condition registers ..................................................................................................................................... 3-8
3.7.2 Transition filters ......................................................................................................................................... 3-8
3.7.3 Event registers ............................................................................................................................................ 3-8
3.7.4 Enable registers .......................................................................................................................................... 3-8
3.7.5 Queues ...................................................................................................................................................... 3-16
3.7.6 Status byte and service request (SRQ) ..................................................................................................... 3-16
3.8 Trigger model (IEEE-488 operation) ............................................................................................................... 3-18
3.9 Programming syntax ........................................................................................................................................ 3-23
3.10 Common commands ........................................................................................................................................ 3-29
3.10.1 *CLS — clear status ................................................................................................................................ 3-29
3.10.2 *ESE <NRf> — event enable .................................................................................................................. 3-30
*ESE? — event enable query ................................................................................................................... 3-30
3.10.3 *ESR? — event status register query ....................................................................................................... 3-31
3.10.4 *IDN? — identification query ................................................................................................................. 3-32
3.10.5 *OPC — operation complete ................................................................................................................... 3-33
3.10.6 *OPC? — operation complete query ....................................................................................................... 3-34
3.10.7 *OPT? — option identification query ...................................................................................................... 3-35
3.10.8 *RCL — recall ......................................................................................................................................... 3-35
3.10.9 *RST — reset ........................................................................................................................................... 3-36
3.10.10 *SAV — save ........................................................................................................................................... 3-36
3.10.11 *SRE <NRf> — service request enable ................................................................................................... 3-36
*SRE? — service request enable query ................................................................................................... 3-36
3.10.12 *STB? — status byte query ..................................................................................................................... 3-38
3.10.13 *TRG — trigger ....................................................................................................................................... 3-39
3.10.14 *TST? — self-test query .......................................................................................................................... 3-39
3.10.15 *WAI — wait-to-continue ....................................................................................................................... 3-40
3.11 Signal oriented measurement commands ......................................................................................................... 3-41
3.12 Calculate subsystem ......................................................................................................................................... 3-67
3.12.1 :CALCulate[1] ......................................................................................................................................... 3-67
3.12.2 :CALCulate2 ............................................................................................................................................ 3-69
3.12.3 :CALCulate3 ............................................................................................................................................ 3-71
3.13 :DISPlay subsystem ......................................................................................................................................... 3-76
3.14 :FORMat subsystem ......................................................................................................................................... 3-79
3.15 :INPut subsystem ............................................................................................................................................. 3-84
3.16 :OUTPut subsystem ......................................................................................................................................... 3-85
3.17 :ROUTe subsystem .......................................................................................................................................... 3-86
3.17.1 :CLOSe <list> .......................................................................................................................................... 3-86
3.17.2 :OPEN <list> ............................................................................................................................................ 3-86
3.17.3 :OPEN:ALL ............................................................................................................................................. 3-87
3.17.4 :SCAN commands .................................................................................................................................... 3-87
3.18 Sense subsystems ............................................................................................................................................. 3-91
3.18.1 [:SENSe[1]] subsystem ............................................................................................................................ 3-91
3.18.2 :ALTernate[1] commands ........................................................................................................................ 3-91
iii
Page 10

3.18.3 :FUNCtion <name> .................................................................................................................................. 3-91
3.18.4 :DATA commands .................................................................................................................................... 3-92
3.18.5 :APERture <n> ......................................................................................................................................... 3-93
3.18.6 :NPLCycles <n> ....................................................................................................................................... 3-94
3.18.7 :COUPling AC|DC ................................................................................................................................... 3-96
3.18.8 RANGe commands ................................................................................................................................... 3-96
3.18.9 :REFerence <n> ........................................................................................................................................ 3-99
3.18.10 :DIGits <n> ............................................................................................................................................. 3-101
3.18.11 :AVERage commands ............................................................................................................................ 3-102
3.18.12 [:FUNCTION] <name> .......................................................................................................................... 3-105
3.18.13 :PWINdow <n> ...................................................................................................................................... 3-106
3.18.14 :METHod <name> ................................................................................................................................. 3-106
3.18.15 :SOURce <name> ................................................................................................................................... 3-106
3.18.16 THReshold commands ........................................................................................................................... 3-107
3.18.17 :TRANsducer <name> ........................................................................................................................... 3-108
3.18.18 :RTD commands ..................................................................................................................................... 3-109
3.18.19 :TCouple:TYPE <name> ........................................................................................................................ 3-111
3.18.20 :RJUNctionX commands ........................................................................................................................ 3-112
3.18.21 :OCOMpensated <b> ............................................................................................................................. 3-114
3.18.22 :DTCouple commands ............................................................................................................................ 3-114
3.18.23 :SENSe2 subsystem ................................................................................................................................ 3-115
3.19 :SOURce subsystem ....................................................................................................................................... 3-116
3.20 :STATus subsystem ........................................................................................................................................ 3-117
3.20.1 [:EVENt]? ............................................................................................................................................... 3-117
3.20.2 :ENABle <NRf> ..................................................................................................................................... 3-122
3.20.3 :PTRansition <NRf> ............................................................................................................................... 3-125
3.20.4 :NTRansition <NRf> .............................................................................................................................. 3-132
3.20.5 :CONDition? ........................................................................................................................................... 3-134
3.20.6 :PRESET ................................................................................................................................................. 3-134
3.20.7 :QUEue commands ................................................................................................................................. 3-135
3.21 :SYSTem subsystem ....................................................................................................................................... 3-137
3.21.1 :PRESet ................................................................................................................................................... 3-137
3.21.2 :POSetup <name> ................................................................................................................................... 3-137
3.21.3 :FRSWitch? ............................................................................................................................................ 3-137
3.21.4 :VERSion? .............................................................................................................................................. 3-138
3.21.5 :ERRor? .................................................................................................................................................. 3-138
3.21.6 :AZERo commands ................................................................................................................................ 3-138
3.21.7 :AMEThod <name> ............................................................................................................................... 3-139
3.21.8 :LSYNc:STATe <b> .............................................................................................................................. 3-143
3.21.9 :KEY <NRf> .......................................................................................................................................... 3-143
3.21.10 :CLEar .................................................................................................................................................... 3-145
3.21.11 :LFRequency .......................................................................................................................................... 3-145
3.21.12 :DATE <yr>, <mo>, <day> .................................................................................................................... 3-145
3.21.13 :TIME <hr>, <min>, <sec> .................................................................................................................... 3-145
3.21.14 :TSTamp commands ............................................................................................................................... 3-146
3.21.15 :RNUMber:RESet ................................................................................................................................... 3-146
3.22 :TRACe subsystem ......................................................................................................................................... 3-147
3.22.1 :CLEar .................................................................................................................................................... 3-147
3.22.2 :FREE? ................................................................................................................................................... 3-147
3.22.3 :EGRoup <name> ................................................................................................................................... 3-147
3.22.4 :POINts <n> ........................................................................................................................................... 3-148
3.22.5 :FEED <name> ....................................................................................................................................... 3-148
3.22.6 :DATA? .................................................................................................................................................. 3-151
3.22.7 :TSTamp:FORMat <name> ................................................................................................................... 3-151
iv
Page 11

3.23 Trigger subsystem .......................................................................................................................................... 3-152
3.23.1 :INITiate commands .............................................................................................................................. 3-152
3.23.2 :ABORt .................................................................................................................................................. 3-152
3.23.3 :IMMediate ............................................................................................................................................. 3-152
3.23.4 :COUNt <n> ........................................................................................................................................... 3-153
3.23.5 :DELay <n> ............................................................................................................................................ 3-153
3.23.6 :SOURce <name> .................................................................................................................................. 3-154
3.23.7 :TIMer <n> ............................................................................................................................................. 3-154
3.23.8 :SIGNal .................................................................................................................................................. 3-155
3.23.9 TCONfigure commands ......................................................................................................................... 3-155
3.23.10 RTCLock commands ............................................................................................................................. 3-157
3.24 :UNIT subsystem ........................................................................................................................................... 3-159
A Specifications
B Interface Function Codes
C ASCII Character Codes and IEEE-488 Multiline Interface Command Messages
D IEEE-488 Bus Overview
E IEEE-488 Conformance Information
F SCPI Conformance Information
G Example Programs
H HP3458A Emulation Mode
v
Page 12

List of Illustrations
2 Front Panel Operation
Figure 2-1 Bar graph (zero-at-left) multiple display .................................................................................................... 2-6
Figure 2-2 Zero-centered bar graph multiple display .................................................................................................. 2-6
Figure 2-3 Maximum and minimum multiple display ................................................................................................. 2-7
Figure 2-4 Positive and negative peak spikes ............................................................................................................ 2-15
Figure 2-5 DC voltage multifunction multiple displays ............................................................................................ 2-16
Figure 2-6 AC voltage multifunction multiple displays ............................................................................................ 2-20
Figure 2-7 DC in-circuit current measurements ........................................................................................................ 2-26
Figure 2-8 AC current multifunction multiple displays ............................................................................................. 2-28
Figure 2-9 3-wire RTD temperature measurements .................................................................................................. 2-34
Figure 2-10 2-wire RTD temperature measurements .................................................................................................. 2-35
Figure 2-11 Temperature equations ............................................................................................................................. 2-38
Figure 2-12 Trigger model (front panel operation) ...................................................................................................... 2-44
Figure 2-13 External triggering connectors (BNC) ..................................................................................................... 2-50
Figure 2-14 External triggering and asynchronous trigger link input pulse specifications ......................................... 2-50
Figure 2-15 Meter complete and asynchronous trigger link output pulse specifications ............................................ 2-51
Figure 2-16 DUT test system ....................................................................................................................................... 2-51
Figure 2-17 External trigger connectors ...................................................................................................................... 2-52
Figure 2-18 Trigger link connectors ............................................................................................................................ 2-53
Figure 2-19 DUT test system ....................................................................................................................................... 2-54
Figure 2-20 Trigger Link connections (asynchronous example #1) ............................................................................ 2-54
Figure 2-21 Operation model for asynchronous trigger link example #1 .................................................................... 2-56
Figure 2-22 Connections using Trigger Link adapter .................................................................................................. 2-57
Figure 2-23 DUT test system (asynchronous example #2) .......................................................................................... 2-57
Figure 2-24 Trigger Link connections (asynchronous example #2) ............................................................................ 2-58
Figure 2-25 Operation model for asynchronous Trigger Link example #2 ................................................................. 2-60
Figure 2-26 Semi-synchronous Trigger Link specifications ....................................................................................... 2-61
Figure 2-27 Typical semi-synchronous mode connections ......................................................................................... 2-61
Figure 2-28 Trigger Link connections (semi-synchronous example) .......................................................................... 2-62
Figure 2-29 Operation mode for semi-synchronous Trigger Link example ................................................................ 2-63
Figure 2-30 Averaging and advanced filter types ........................................................................................................ 2-72
Figure 2-31 Moving and repeating filter modes .......................................................................................................... 2-73
Figure 2-32 SCAN key menu structure ....................................................................................................................... 2-82
Figure 2-33 SCAN key menu structure for ratio and delta .......................................................................................... 2-83
Figure 2-34 Limits bar graph example ........................................................................................................................ 2-98
Figure 2-35 Using limit test to start 100 Ω resistor ...................................................................................................... 2-99
Figure 2-36 Digital I/O port ....................................................................................................................................... 2-100
Figure 2-37 Digital I/O port simplified schematic ..................................................................................................... 2-101
Figure 2-38 Sample externally powered relay sample ............................................................................................... 2-102
Figure 2-39 Line cycle synchronization .................................................................................................................... 2-104
vii
Page 13

3 IEEE-488 Reference
Figure 3-1 IEEE-488 connector ................................................................................................................................... 3-2
Figure 3-2 IEEE-488 connections ................................................................................................................................ 3-2
Figure 3-3 IEEE-488 connector location ..................................................................................................................... 3-2
Figure 3-4 Model 2002 status register structure ........................................................................................................... 3-7
Figure 3-5 Standard event status .................................................................................................................................. 3-9
Figure 3-6 Operation event status .............................................................................................................................. 3-10
Figure 3-7 Arm event status ....................................................................................................................................... 3-11
Figure 3-8 Sequence event status ............................................................................................................................... 3-12
Figure 3-9 Trigger event status .................................................................................................................................. 3-13
Figure 3-10 Measurement event status ......................................................................................................................... 3-14
Figure 3-11 Questionable event status ......................................................................................................................... 3-15
Figure 3-12 Status byte and service request (SRQ) ..................................................................................................... 3-17
Figure 3-13 Trigger Model (IEEE-488 bus operation) ................................................................................................ 3-19
Figure 3-14 Standard Event Enable Register ............................................................................................................... 3-31
Figure 3-15 Standard Event Status Register ................................................................................................................ 3-32
Figure 3-16 Service Request Enable Register .............................................................................................................. 3-37
Figure 3-17 Status Byte Register ................................................................................................................................. 3-39
Figure 3-18 ASCII data format .................................................................................................................................... 3-79
Figure 3-19 IEEE754 single precision data format (32 data bits) ................................................................................ 3-80
Figure 3-20 IEEE754 double precision data format (64 data bits) .............................................................................. 3-81
Figure 3-21 Measurement Event Register .................................................................................................................. 3-118
Figure 3-22 Questionable Event Register .................................................................................................................. 3-119
Figure 3-23 Operation Event Register ....................................................................................................................... 3-120
Figure 3-24 Trigger Event Register ........................................................................................................................... 3-120
Figure 3-25 Arm Event Register ................................................................................................................................ 3-121
Figure 3-26 Sequence Event Register ........................................................................................................................ 3-121
Figure 3-27 Measurement Event Enable Register ...................................................................................................... 3-123
Figure 3-28 Questionable Event Enable Register ...................................................................................................... 3-123
Figure 3-29 Operation Event Enable Register ........................................................................................................... 3-124
Figure 3-30 Trigger Event Enable Register ............................................................................................................... 3-124
Figure 3-31 Arm Event Enable Register .................................................................................................................... 3-124
Figure 3-32 Sequence Event Enable Register ............................................................................................................ 3-125
Figure 3-33 Measurement Transition Filter ............................................................................................................... 3-126
Figure 3-34 Questionable Transition Filter ................................................................................................................ 3-127
Figure 3-35 Operation Transition Filter ..................................................................................................................... 3-128
Figure 3-36 Trigger Transition Filter ......................................................................................................................... 3-129
Figure 3-37 Arm Transition Filter .............................................................................................................................. 3-130
Figure 3-38 Sequence Transition Filter ...................................................................................................................... 3-131
Figure 3-39 Key-press codes ...................................................................................................................................... 3-144
D IEEE-488 Bus Overview
Figure D-1 IEEE-488 bus configuration ...................................................................................................................... D-2
Figure D-2 IEEE-488 handshake sequence .................................................................................................................. D-3
Figure D-3 Command codes ........................................................................................................................................ D-6
viii
Page 14

Ω
Ω
Ω
List of Tables
2 Front Panel Operation
Table 2-1 Data checked on power-up ......................................................................................................................... 2-3
Table 2-2 Power-up error messages ........................................................................................................................... 2-3
Table 2-3 Multiple displays by function .................................................................................................................... 2-5
Table 2-4 Status and error messages .......................................................................................................................... 2-8
Table 2-5 EXIT key actions ....................................................................................................................................... 2-9
Table 2-6 CONFIGURE DCV menu structure ........................................................................................................ 2-10
Table 2-7 CONFIGURE ACV menu structure ........................................................................................................ 2-11
Table 2-8 DCV and ACV integration times set-by-resolution ................................................................................. 2-12
Table 2-9 DCV and ACV auto filter ........................................................................................................................ 2-13
Table 2-10 DCV and ACV auto resolution ................................................................................................................ 2-13
Table 2-11 CONFIGURE DCI menu structure .......................................................................................................... 2-24
Table 2-12 CONFIGURE ACI menu structure .......................................................................................................... 2-24
Table 2-13 DCI and ACI integration time set-by-resolution ...................................................................................... 2-25
Table 2-14 DCI and ACI auto filter ........................................................................................................................... 2-25
Table 2-15 DCI and ACI auto resolution ................................................................................................................... 2-26
Table 2-16 CONFIGURE OHMS-2W menu structure .............................................................................................. 2-29
Table 2-17 CONFIGURE OHMS-4W menu structure .............................................................................................. 2-29
Table 2-18
Table 2-19
Table 2-20
Table 2-21 Trigger level range and increments .......................................................................................................... 2-32
Table 2-22 CONFIGURE FREQUENCY menu structure ......................................................................................... 2-33
Table 2-23 CONFIG TEMPERATURE menu structure ............................................................................................ 2-36
Table 2-24 Temperature integration time set-by-resolution ....................................................................................... 2-39
Table 2-25 Temperature auto resolution .................................................................................................................... 2-39
Table 2-26 Allowable rel values ................................................................................................................................. 2-41
Table 2-27 CONFIGURE TRIGGER menu structure ................................................................................................ 2-42
Table 2-28 Reading storage options ........................................................................................................................... 2-64
Table 2-29 CONFIGURE DATA STORE menu structure ........................................................................................ 2-65
Table 2-30 Available functions in burst mode ........................................................................................................... 2-66
Table 2-31 Burst mode sequence ............................................................................................................................... 2-67
Table 2-32 Fill-and-stop sequence ............................................................................................................................. 2-69
Table 2-33 Continuous sequence ................................................................................................................................ 2-70
Table 2-34 Pretrigger sequence .................................................................................................................................. 2-70
Table 2-35 Auto filters ............................................................................................................................................... 2-74
Table 2-36 CONFIGURE FILTER menu structure ................................................................................................... 2-74
Table 2-37 CONFIGURE MATH menu structure ..................................................................................................... 2-76
Table 2-38 CHANNEL SELECTION menu structure ............................................................................................... 2-78
Table 2-39 CONFIGURE CHANNELS menu structure ............................................................................................ 2-79
Table 2-40 SCAN OPERATION menu structure ...................................................................................................... 2-81
Table 2-41 Main menu structure ................................................................................................................................ 2-88
Table 2-42 Factory default conditions ........................................................................................................................ 2-91
2 and Ω 4 integration time set-by-resolution ......................................................................................... 2-30
2 and Ω 4 auto filter ............................................................................................................................... 2-30
2 and Ω 4 auto resolution ....................................................................................................................... 2-31
ix
Page 15

3 IEEE-488 Reference
Table 3-1 General bus commands and associated statements .................................................................................... 3-4
Table 3-2 IEEE-488.2 common commands and queries .......................................................................................... 3-29
Table 3-3 Signal oriented measurement command summary ................................................................................... 3-41
Table 3-4 CALCulate command summary ............................................................................................................... 3-46
Table 3-5 DISPlay command summary .................................................................................................................... 3-48
Table 3-6 FORMat command summary ................................................................................................................... 3-48
Table 3-7 INPut command summary ........................................................................................................................ 3-49
Table 3-8 OUTput command summary .................................................................................................................... 3-49
Table 3-9 ROUTe command summary ..................................................................................................................... 3-50
Table 3-10 SENSe command summary ...................................................................................................................... 3-50
Table 3-11 SOURce command summary ................................................................................................................... 3-59
Table 3-12 STATus command summary .................................................................................................................... 3-60
Table 3-13 SYSTem command summary ................................................................................................................... 3-62
Table 3-14 TRACe command summary ..................................................................................................................... 3-63
Table 3-15 Trigger command summary ..................................................................................................................... 3-63
Table 3-16 UNIT command summary ........................................................................................................................ 3-65
Table 3-17 Minimum delay times for stream mode .................................................................................................. 3-142
B Interface Function Codes
Table B-1 Model 2002 interface function codes ........................................................................................................ B-1
D IEEE-488 Bus Overview
Table D-1 IEEE-488 bus command summary ............................................................................................................ D-4
Table D-2 Hexadecimal and decimal command codes ............................................................................................... D-7
Table D-3 Typical addressed command sequence ...................................................................................................... D-7
Table D-4 Typical common command sequence ....................................................................................................... D-7
Table D-5 IEEE command groups .............................................................................................................................. D-8
E IEEE-488 Conformance Information
Table E-1 IEEE-488 documentation requirements .................................................................................................... E-1
Table E-2 Coupled commands ................................................................................................................................... E-3
H HP3458A Emulation Mode
Table H-1 Commands not supported by HP3458A emulation mode ......................................................................... H-2
Table H-2 Supported HP3458A commands ............................................................................................................... H-3
x
Page 16

1
General Information
1.1 Introduction
This section contains general information about the Model
2002 Multimeter. It is arranged in the following manner:
1.2 Features
1.3 Warranty information
1.4 Manual addenda
1.5 Safety symbols and terms
1.6 Specifications
1.7 Inspection
1.8 Options and accessories
1.2 Features
Some important Model 2002 features include:
• Full range of functions Among other functions, the
multimeter can measure DC voltage (normal and peak
spikes), AC voltage (RMS, average, and peak), DC
current (normal and in-circuit), AC current (RMS and
average), two and four-wire resistance (normal and
offset-compensated), frequency (voltage and current),
and temperature (resistance temperature devices or
thermocouples).
• T wo-line display Readings and front panel messages
are shown on an alphanumeric display having a 20character top line and a 32-character bottom line.
• Multifunction measuring and display From the front
panel, you can configure the instrument to sequentially
measure and simultaneously display readings of multiple functions.
• Reading and setup storage Readings and setup data
can be stored and recalled from the front panel or over
the IEEE-488 bus. For example, the buffer can be programmed to store up to 850 readings at 4.5 digits, or up
to 250 time-stamped readings at 6.5 digits. The Model
2002 can be configured with memory options that
extend the storage capacity up to 30,000 readings and
ten setups.
• High-speed measurements The instrument is capable
of acquiring, for example, 2000 readings/second at 4.5
digits of resolution, and 215 readings/second at 6.5
digits.
• T alk-only mode From the front panel, you can set the
instrument to send readings to an IEEE-488 printer or,
with an optional adapter, to a Centronics printer.
• Digital calibration The instrument may be digitally
calibrated from either the front panel or over the bus.
• Standard IEEE-488 interface Bus operation conforms to the IEEE-488.2 and SCPI standards.
• Trigger link This is a new trigger concept that provides more versatile and precise external triggering. It
is in addition to the standard Trigger In/Measurement
Complete BNC external triggering techniques.
• Optional field-installable internal scanner This is a
10-channel scanner card, which includes eight channels
of 2-pole relay switching and two channels of 2-pole
solid-state switching. All channels can be configured
for 4-pole operation.
1-1
Page 17

General Information
1.3 W arranty information
Warranty information is located on the inside front cover of
this instruction manual. Should your Model 2002 require
warranty service, contact the Keithley representative or
authorized repair facility in your area for further information. When returning the instrument for repair, be sure to fill
out and include the service form at the back of this manual to
provide the repair facility with the necessary information.
1.4 Manual addenda
Any improvements or changes concerning the instrument or
manual will be explained in an addendum included with the
manual. Be sure to note these changes and incorporate them
into the manual.
1.5 Safety symbols and terms
The following symbols and terms may be found on an instrument or used in this manual.
!
The symbol on an instrument indicates that the user
should refer to the operating instructions located in the manual.
The symbol on an instrument shows that high voltage
may be present on the terminal(s). Use standard safety precautions to avoid personal contact with these voltages.
The WARNING heading used in this manual explains dangers that might result in personal injury or death. Always
read the associated information very carefully before performing the indicated procedure.
The CAUTION heading used in this manual explains hazards that could damage the instrument. Such damage may
invalidate the warranty.
1.6 Specifications
Full Model 2002 specifications are included in Appendix A.
1.7 Inspection
The Model 2002 was carefully inspected, both electrically
and mechanically before shipment. After unpacking all items
from the shipping carton, check for any obvious signs of
physical damage that may have occurred during transit.
(Note: There may be a protective film over the display lens,
which can be removed.) Report any damage to the shipping
agent immediately. Save the original packing carton for possible future reshipment. The following items are included
with every Model 2002 order:
• Model 2002 Multimeter (with MEM1 or MEM2 memory option, if ordered) with line cord.
• Model 8605 High Performance Modular Test Leads.
• Model 2002 User’s Manual and Model 2002 Calibration Manual.
• Accessories as ordered.
• Full calibration data (conforming to MIL-STD
45662A).
If an additional manual is required, order the appropriate
manual package:
• Keithley part number 2002-900-00 for the User’ s Manual.
• Keithley part number 2002-902-00 for the Repair Manual.
• Keithley part number 2002-903-00 for the Getting
Started Manual.
• Keithley part number 2002-905-00 for the Calibration
Manual.
The manual packages include a manual and any pertinent
addenda.
1.8 Options and accessories
The following options and accessories are available from
Keithley for use with the Model 2002.
Model 1050 Padded Carrying Case: A carrying case for a
Model 2002 or a Model 7001. Includes handles and shoulder
strap.
Models 2002/MEM1 and 2002/MEM2: These optional con-
figurations of the Model 2002 extend its storage capacity.
The MEM1 option has 32K-bytes for non-volatile storage of
five setups, and 7000 readings in compact format or 1400
readings in full format. The MEM2 option has 128K-bytes
for non-volatile storage of ten setups, and 30000 compact
readings or 6000 full readings.
Model 2001-SCAN: This is a 10-channel scanner card that
installs within the Model 2002. It has eight channels of 2pole relay switching and two channels of 2-pole solid-state
switching. All channels can be configured for 4-pole operation. Included are two pairs of leads for connection to Model
2002 rear panel inputs (Keithley part number CA-109).
1-2
Page 18

M
General Information
Model 2001-TCSCAN: This is a thermocouple/general pur-
pose scanner card that installs in the option slot of the Model
2002. The card has nine analog input channels that can be
used for high-accuracy , high-speed scanning. A built-in temperature reference allows multi-channel, cold-junction compensated temperature measurements using thermocouples.
Model 4288-1 Single Fixed Rack Mount Kit: Mounts a sin-
gle Model 2002 in a standard 19-inch rack.
Model 4288-2 Side-by-side Rack Mount Kit: Mounts two
instruments (Models 182, 428, 486, 487, 2001, 2002, 7001)
side-by-side in a standard 19-inch rack.
Model 4288-3 Side-by-side Rack Mount Kit: Mounts a
Model 2002 and a Model 199 side-by-side in a standard 19inch rack.
Model 4288-4 Side-by-side Rack Mount Kit: Mounts a
Model 2002 and a 5
220, 224, 230, 263, 595, 614, 617, 705, 740, 775, etc.) sideby-side in a standard 19-inch rack.
Models 7007-1 and 7007-2 Shielded IEEE-488 Cables:
Connect the Model 2002 to the IEEE-488 bus using shielded
cables and connectors to reduce electromagnetic interference
(EMI). The Model 7007-1 is one meter long; the Model
7007-2 is two meters long.
¼
-inch instrument (Models 195A, 196,
RMS, 42.4V peak; the test probes are rated at 1000V.) These
components are designed to be used with high performance
test leads terminated with banana plugs, such as the Model
8605 High Performance Modular Test Leads.
The following test leads and probes are rated at 30V RMS,
42.4V peak:
Models 5805 and 5805-12 Kelvin Probes: Consists of two
spring-loaded Kelvin test probes with banana plug termination. Designed to be used with instruments that measure 4terminal resistance. The Model 5805 is 0.9m long; the Model
5805-12 is 3.6m long.
Model 5806 Kelvin Clip Lead Set: Includes two Kelvin clip
test leads (0.9m) with banana plug termination. Designed for
instruments that measure 4-terminal resistance. A set of eight
replacement rubber bands for the Model 5806 is available as
Keithley P/N GA-22.
Model 8604 SMD Probe Set: Consists of two test leads (3ft),
each terminated with a surface mount device “grabber” clip
on one end and a banana plug with retractable sheath on the
other end.
Model 8610 Low Thermal Shorting Plug: Consists of four
banana plugs mounted to a 1-inch square circuit board, interconnected to provide a short circuit among all plugs.
Models 8501-1 and 8501-2 Trigger Link Cables: Connect
the Model 2002 to other instruments with Trigger Link connectors (e.g., Model 7001 Switch System). The Model
8501-1 is one meter long; the Model 8501-2 is two meters
long.
Model 8502 Trigger Link Adapter: Allows you to connect
the Trigger Link of the Model 2002 to instruments that use
the standard BNC (In/Out) external triggering technique.
Model 8530 IEEE-488 to Centronics Printer Adapter
Cable: Translates the IEEE-488 connector pinout and signal
level to a Centronics termination. This permits a standard
Centronics parallel printer to be connected to a Model 2002
in TALK-ONLY mode.
Model 8605 High Performance Modular T est Leads: Con-
sists of two high voltage (1000V) test probes and leads. The
test leads are terminated with a banana plug with retractable
sheath on each end. (Each Model 2002 is shipped with one
set of these test leads.)
Model 8606 High Performance Probe Tip Kit: Consists of
two spade lugs, two alligator clips, and two spring hook test
probes. (The spade lugs and alligator clips are rated at 30V
Model 8611 Low Thermal Patch Leads: Consists of two
test leads (3ft), each with a banana plug with a retractable
sheath at each end. These leads minimize the thermallyinduced offsets that can be created by test leads.
Model 8612 Low Thermal Spade Leads: Consists of two
test leads (3ft), each terminated with a spade lug on one end
and a banana plug with a retractable sheath on the other end.
These leads minimize the thermally-induced offsets that can
be created by test leads.
Model 8680 RTD Probe Adapter: This adapts RTDs with
terminated and unterminated cables to instruments with
banana jacks for measuring 4-terminal resistance. It has a 4pin “T”-style connector and a 4-pin screw terminal block.
Model 8681 Miniature RTD Surface Probe: This is a low
cost platinum 4-wire-RTD with unterminated wires. It is
designed to measure the temperature of flat surfaces or free
space.
odel 8693 General Purpose/Immersion RTD Probe:
This probe has a platinum RTD sensor. It is designed for
immersion in liquids as well as other general purpose
applications.
1-3
Page 19

General Information
Model 8695 Surface RTD Probe: This probe has a platinum
RTD sensor. It is designed to measure the temperature of flat
surfaces of solids.
Model 8696 Air/Gas RTD Probe: This probe has a platinum
RTD sensor. It has an exposed junction within a protective
shroud for measuring the temperature of air or gases.
1-4
Page 20

2
Front Panel Operation
2.1 Introduction
This section contains detailed reference information for front
panel operation of the Model 2002. It is organized as
follows:
2.2 Power-up: Covers information on connecting the
instrument to line power, w arm-up period, default conditions, and the power-up sequence.
2.3 Display: Covers display format and messages that
may appear while using the instrument.
2.4 Functions: Describes the measurement functions of
the instrument (DC and AC voltage, DC and AC
current, 2-wire and 4-wire resistance, frequency, and
temperature).
2.5 Range: Covers both manual and autoranging
operation.
2.6 Relative: Gives details on using the relative feature
that can be used to null offsets or subtract a baseline
value from present and future readings.
2.7 Triggering: Details types of trigger modes as well as
trigger sources that can be used.
2.8 Buffer: Covers use of the reading buf fer including pro-
gramming buffer size and recalling data, time stamp,
and statistics information.
2.9 Filter: Covers the use of the digital filter types that can
be used to reduce reading noise.
2.10 Math: Describes the calculations that can be per-
formed on readings in continuous operation.
2.11 Scanning: Discusses setting up internal and external
scans, along with ratio and delta calculations.
2.12 Menu: Covers selections controlled from the main
menu, such as saving instrument setups, GPIB (IEEE488 bus) configuration, calibration, self-tests, limits,
and the digital I/O port.
2.2 Power-up
2.2.1 Line power connections
Follow the procedure below to connect the Model 2002 to
line power and turn on the instrument.
1. The Model 2002 operates from a line voltage in the
range of 90-134V or 180-250V at a frequency of 50, 60,
or 400Hz. Check to see that the operating voltage in
your area is compatible.
CAUTION
Operating the instrument on an incorrect line voltage may cause damage to
the instrument, possibly voiding the
warranty.
2. Before plugging in the power cord, make sure the front
panel power switch is in the off (0) position.
3. Connect the female end of the supplied power cord to
the AC receptacle on the rear panel. Connect the other
end of the power cord to a grounded AC outlet.
2-1
Page 21

Front Panel Operation
WARNING
The power cord supplied with the Model
2002 contains a separate ground wire
for use with grounded outlets. When
proper connections are made, instrument chassis is connected to power line
ground through the ground wire in the
power cord. Failure to use a grounded
outlet may result in personal injury or
death due to electric shock.
2.2.2 Line fuse replacement
A rear panel fuse located below the AC receptacle protects
the power line input of the instrument. If the fuse needs to be
replaced, perform the following steps:
WARNING
Make sure the instrument is disconnected from the power line and other equipment before replacing the line fuse.
1. With the power off, place the end of a flat-blade screwdriver into the rear panel LINE FUSE holder. Push in
gently and rotate the fuse carrier one-quarter turn counterclockwise. Release pressure on the holder and its
internal spring will push the fuse carrier out of the
holder.
2. Remove the fuse and replace it with the same type
(0.5A, 250V, slow blow, 5 × 20mm). The Keithley part
number is FU-71.
CAUTION
Do not use a fuse with a higher current
rating than specified, or instrument
damage may occur. If the instrument
repeatedly blows fuses, locate and correct the cause of the trouble before
replacing the fuse. See the optional
Model 2002 Repair Manual for troubleshooting information.
2.2.3 Power-up sequence
On power-up, the Model 2002 performs self-tests on its
EPROM and RAM, and checksum tests on data stored in
non-volatile memory . (See Table 2-1.) If a failure is detected,
the instrument momentarily displays an error message and
the ERR annunciator turns on. (Messages are listed in Table
2-2.)
NOTE
If a problem develops while the
instrument is under warranty, return it to
Keithley Instruments, Inc. for repair.
If the instrument passes the self-tests, the firmware revision
levels, memory option (if installed), and presently selected
IEEE-488 primary address are displayed. An e xample of this
display is shown as follows:
Model 2002
Rev . A01 A01 MEM1 IEEE Addr=16
The firmware revision levels (left to right) are for the main
microcontroller and display microcontroller. The revision
level number may be different in your particular unit. If the
MEM1 or MEM2 memory options are not present, that portion of the bottom line is left blank. The IEEE-488 address is
its default value of 16.
Next, if the unit is configured to display the calibration due
date at power-up, the unit shows the following:
Model 2002
Calibration due: mmm/dd/yy
where “mmm” is the month abbreviation, “dd” is the day,
and “yy” is the year. If no calibration date is set, the display
shows that it is due now. (See the Model 2002 Calibration
Manual to set the calibration due date and paragraph 2.12.3
of this manual to set the display option.)
After the power-up sequence, the instrument begins its normal display, for example:
3. Install the new fuse and fuse carrier into the holder by
reversing the above procedure.
2-2
000.0000 mVDC
Power-up error messages
Error messages that may be displayed during power-up are
summarized in Table 2-2. These are shown when one of the
checksum tests of Table 2-1 fails.
Page 22

Table 2-1
Data checked on power-up
Data Type of storage Memory option
Front Panel Operation
IEEE-488 address
Power-on default
Calibration constants
Calibration dates
Instrument setups 1 in electrically-erasable PROM
Reading buffer (Volatile RAM)
Note: STD is standard memory, MEM1 is memory option #1, MEM2 is memory option #2.
Table 2-2
Power-up error messages
Message Action
Error +515,
Calibration dates lost
Error +514,
DC calibration data lost
The cal dates are set to factory default values, but they are not stored into EEPROM.
To do this, perform a comprehensive calibration.
DC cal constants are set to factory default values, but they are not stored into
EEPROM. To do this, perform a comprehensive calibration.
Electrically-erasable PROM
Electrically-erasable PROM
Electrically-erasable PROM
Electrically-erasable PROM
4 more in non-volatile RAM
9 more in non-volatile RAM
Non-volatile RAM
STD, MEM1, MEM2
STD, MEM1, MEM2
STD, MEM1, MEM2
STD, MEM1, MEM2
STD, MEM1, MEM2
MEM1
MEM2
STD
MEM1, MEM2
Error +513,
AC calibration data lost
Error +512,
AC cal constants are set to factory default values, but they are not stored into
EEPROM. To do this, perform a comprehensive calibration.
Power-on defaults are reset to factory defaults (bench) and stored into EEPROM.
Power-on state lost
Error +511,
GPIB address is reset to factory default (16) and stored into EEPROM.
GPIB address lost
Error +510,
Reading buffer data lost
Error -314,
The reading buffer controls are reset to factory defaults, but they are not stored into
NVRAM. To do this, store readings in the buffer.
Instrument setup is reset to bench defaults and stored into EEPROM.
Save/recall memory lost
Notes:
1. Any of these error conditions may occur the first time a unit is turned on or after replacing the firmware.
2. Error +510, Reading buffer data lost, applies to units with optional memory.
3. Error +512, Power-on state lost, may occur the first time the unit is powered-up after replacing the MEM2 memory option with MEM1.
2-3
Page 23

Front Panel Operation
2.2.4 High energy circuit safety precautions
To optimize safety when measuring voltage in high energy
distribution circuits, read and use the directions in the following warning.
WARNING
Dangerous arcs of an explosive nature
in a high energy circuit can cause severe
personal injury, or death. If the multimeter is connected to a high energy circuit when set to a current range, low
resistance range, or any other low
impedance range, the circuit is virtually
shorted. Dangerous arcing can result
even when the multimeter is set to a
voltage range if the minimum voltage
spacing is reduced.
When making measurements in high energy circuits, use test
leads that meet the following requirements:
• Test leads should be fully insulated.
• Only use test leads that can be connected to the circuit
(e.g., alligator clips, spade lugs, etc.) for hands-off measurements.
• Do not use test leads that decrease voltage spacing. This
diminishes arc protection and creates a hazardous
condition.
Use the following sequence when testing power circuits:
1. De-energize the circuit using the regular installed
connect-disconnect device, such as a circuit breaker,
main switch, etc.
2. Attach the test leads to the circuit under test. Use appropriate safety rated test leads for this application.
3. Set the multimeter to the proper function and range.
4. Energize the circuit using the installed connectdisconnect device and make measurements without
disconnecting the multimeter.
5. De-energize the circuit using the installed connectdisconnect device.
6. Disconnect the test leads from the circuit under test.
2.2.5 Power-on default conditions
Power-on default conditions are those conditions the instrument assumes when it is first turned on. You can change these
power-on default conditions (e xcept the primary address) by
using the save setup feature that is av ailable with the MENU
key, as described in paragraph 2.12.1. Depending on the
installed memory option, either one, five, or ten user-defined
setups can be stored, any one of which could be selected as
the power-on default.
Table 2-42 in paragraph 2.12.1 lists the default conditions
that are set at the factory to optimize bench and GPIB (IEEE-
488) operation.
2.2.6 Warm-up period
The Model 2002 can be used within one minute after it is
turned on. However, the instrument should be turned on and
allowed to warm up for at least four hours before use to
achieve rated accuracy.
2.2.7 IEEE-488 primary address
The IEEE-488 primary address of the instrument must be the
same as the primary address you specify in the controller’s
programming language. The default primary address of the
instrument is 16, but you can set the address to any value
from 0 to 30 by using the MENU key. Refer to paragraph
2.12.2 for step-by-step instructions on setting the primary
address. Section 4 contains details on using the Model 2002
over the IEEE-488 bus.
2.3 Display
The display of the Model 2002 is primarily used to display
readings along with the units and type of measurement.
When not displaying readings, it is used for informational
messages, such as menu headings and selections. At the top
of the display are annunciators to indicate various states of
operation. The Getting Started manual covers the display
basics.
2-4
WARNING
The maximum common-mode voltage
(voltage between INPUT LO and chassis ground) is 500V peak. Exceeding this
value may cause a breakdown in insulation, creating a shock hazard.
2.3.1 Multiple displays
Each measurement function has its own set of “multiple displays” shown on the bottom line of the front panel display.
The PREVious and NEXT DISPLAY keys scroll through the
selections for the present function.
Page 24

Front Panel Operation
Some of the multiple displays are for multiple functions,
where different functions are measured sequentially from the
same set of test leads. The readings are shown simultaneously, such as:
• T op line sho ws a DC v oltage measurement; bottom line
shows positive and negative peak spike measurements.
• Top line shows an AC RMS voltage reading; bottom
line shows an AC frequency measurement and a crest
factor calculation.
Also, the multiple displays can sho w a reading in a dif ferent
form, or give additional information about the reading, for
example:
• Top line shows a reading; bottom line shows a zerocentered bar graph with adjustable limits.
Table 2-3
Multiple displays by function
Function Next display Paragraph
All
Bar graph
Zero-centered bar graph
Maximum and minimum values
Relative and actual values
Calculated and actual values (see Note 1)
Limits bar graph (see Note 1)
Adjacent channel readings (see Note 2)
DC voltage
DC volts, AC ripple voltage and frequency
Positive peak spikes and highest value
Negative peak spikes and lowest value
Positive and negative peak spikes
AC voltage
AC RMS voltage, frequency, and crest factor
AC RMS, average, and peak voltages
DC current
AC current
(none specific to function)
AC RMS (or average) current and frequency
AC RMS and average current
2-wire resistance
Source current
Voltage drop across DUT
4-wire resistance
Source current
Voltage drop across DUT
Lead resistance
Frequency
Period calculation
Trigger level
Temperature
Celsius, Fahrenheit, and Kelvin units
RTD resistance (or thermocouple voltage)
Reference junction (thermocouples only)
Data storage buffer
Maximum and minimum values
Average and standard deviation
Notes:
1. Multiple displays for calculated values and limits bar graph are not available for the frequenc y function.
2. The multiple display for adjacent channel readings is not available for the DC and AC current functions.
• Top line shows a frequency measurement; bottom line
shows the adjustable trigger level.
To scroll through the multiple displays available for each
measurement function, repeatedly press and release the
NEXT DISPLAY key. The same action with the PREVious
DISPLAY key does a reverse scroll through the displays. To
return to the default reading display, just press and hold
either key.
Multiple displays that are specific to a particular function or
operation are discussed later in this section, such as the peak
spikes displays in DC voltage, and the calculations display in
math. (See T able 2-3 for paragraph references.) Displays that
are common to most of the measurement functions are discussed here.
2.3.1
2.3.1
2.3.1
2.6
2.10
2.12.5
2.11
2.4.1
2.4.1
2.4.2
2.4.2
2.4.3
2.4.3
2.4.4
2.4.5
2.8
2-5
Page 25

Front Panel Operation
Bar graph
The “normal” bar graph, with a zero at the left end, is a
graphical representation of a reading as a portion of a range.
(See Figure 2-1.) The vertical lines displayed along the bar
designate 0%, 25%, 50%, 75%, and 100% of full scale. Each
full segment of the bar represents approximately 4% of the
range limit.
-11.96859 VDC
0 -20V
Full
Range
25% of
full range
50% of
full range
75% of full range
Figure 2-1
Bar graph (zero-at-left) multiple display
For measurement functions with a range (voltage, current,
and resistance), the right endpoint of the bar graph is plus full
scale of the present range for positive readings, and minus
full scale for negative readings. When the 100% line changes
to an arrow, the reading exceeds the present range.
Note that the normal bar graph is not available when the
ACV units are dB or dBm.
For functions without a range (frequency and temperature),
the right endpoint of the bar graph is user-programmable by
pressing either CONFIG-NEXT DISPLAY or CONFIGPREV DISPLAY. Note that these configuration menus are
context-sensitive. If the unit is in any function except frequency or temperature, CONFIG-NEXT DISPLAY results
in the zero bar graph configuration display.
Perform the following to view or change the range of the bar
graph:
1. From the frequency or temperature function, press the
CONFIG key and then the NEXT or PREV DISPLAY
key. The following menu is displayed:
BARGRAPH TYPE
ZERO-AT-LEFT ZERO-CENTERED
2. Use the cursor keys ( and ) to place the cursor on
ZERO-AT -LEFT and press ENTER. You will access one
of the following menus:
For frequency:
FREQ BARGRAPH RANGE
2Hz 20Hz 200Hz 2kHz 20kHz
200kHz 2MHz 15MHz
For temperature:
BARGRAPH:0 to 0040°C
3. Change the frequency range by highlighting one of the
selections and pressing ENTER. For the temperature
range, use the cursor keys and the RANGE ▲ and ▼
keys to enter a numeric value (0 - 9999°C). Press ENTER when done.
Zero-centered bar graph
The zero-centered bar graph is a graphical representation of
a reading with plus and minus limits. (See Figure 2-2.) The
limits are expressed in a user-selectable percentage of range
for voltage, current, and resistance, and a user-selectable value for frequency and temperature.
-05.95770 VDC
-50% +50%
-50% of range
-25% of range
0%
+50% of range
25% of range
Figure 2-2
Zero-centered bar graph multiple display
The vertical lines displayed along the bar designate the plus
and minus limits, zero, and halfway to either limit. There are
ten full segments between zero and each end, so each full
segment represents 10% of the limit. When a line at the limit
changes to an arrow, the reading exceeds the programmed
range.
The plus and minus percentage of range that is programmed
(0.01 - 99.99%) applies to all voltage, current, and resistance
functions. Because of rounding, values greater than 99.5%
are shown as 100% and, likewise, values greater than 1%
(such as 1.67%) are shown rounded to the nearest integer
percent.
Note that the zero-centered bar graph is not available when
the ACV units are dB or dBm.
2-6
Page 26
Figure 2-3
Maximum and minimum multiple display
Minimum
value
-15.82867 VDC
Max = -05.74602 Min = -15.82867
Maximum
value
Front Panel Operation
Perform the following to view or change the plus and minus
percentage of range:
1. From a voltage, current, or resistance function, press
CONFIG and then NEXT or PREV DISPLAY. The following is displayed:
ZERO-BARGRAPH±50.00%
2. Change the percentage by using the cursor keys and the
RANGE ▲ and ▼ keys to enter a numeric value (0.01 -
99.99%). Press ENTER when done. The same percentage of range is used for voltage, current, and resistance
measurements.
Perform the following to view or change the plus and minus
value limit:
1. From the frequency or temperature function, press
CONFIG and then NEXT or PREV DISPLAY. The following menu is displayed:
BARGRAPH TYPE
ZERO-AT-LEFT ZERO-CENTERED
2. Use the cursor keys ( and ) to place the cursor on
ZERO-CENTERED and press ENTER. You will access
one of the following menus:
For frequency:
FREQ ZEROBARGRAPH(±)
1Hz 10Hz 100Hz 1kHz 10kHz
100kHz 1MHz 10MHz 15MHz
• Pressing the present function key.
• Leaving the display by changing function or entering a
menu.
The resolution, units, and prefix on the bottom line are the
same as shown for top line reading. If necessary, the bottom
line values automatically change to scientific notation,
rounded to 4.5 digits.
2.3.2 Information messages
Press the INFO key to view context-sensitive information
from most of the displays. An arrow ( or ) on the bottom line indicates that there is more information. Use the
cursor keys ( and ) to view the complete line. To exit
an INFO display, just press INFO, ENTER, EXIT, or a function key.
2.3.3 Status and error messages
For temperature:
ZERO-BARGRAPH±0002°C
3. Change the frequency limits by highlighting one of the
selections and pressing ENTER. For the temperature,
use the cursor keys and the RANGE ▲ and ▼ keys to
enter a numeric value (0 - 9999°C). Press ENTER when
done.
Maximum and minimum
The maximum and minimum multiple display shows the
maximum and minimum readings since the display was entered. (See Figure 2-3.) The maximum and minimum values
are reset by the following:
During Model 2002 operation and programming, you will
encounter a number of front panel messages. Typical
messages are either of status or error variety, as listed in
Table 2-4.
The most recent status or error messages can be momentarily
displayed. Just enter a configuration menu or the main menu,
and press the PREV key . (The display is blank if no message
is queued.)
2-7
Page 27

Front Panel Operation
Table 2-4
Status and error messages
Number Description Event
+900 “Internal System Error” EE
+611
+610
+519
+518
+517
+516
+515
+514
+513
+512
+511
+510
+444 to
+350
+312
+311
+310
+309
+308
+307
+306
+305
+304
+303
+302
+301
+174
+173
+172
+171
“Questionable T emperature”
“Questionable Calibration”
“Excessive temp drift during cal”
“Low level calibration data lost”
“Preamp calibration data lost”
“Install option id lost”
“Calibration dates lost”
“DC calibration data lost”
“AC calibration data lost”
“Power-on state lost”
“GPIB address lost”
“Reading buffer data lost”
Calibration Errors
(see Calibration Manual)
“Buffer pretriggered”
“Buffer lost”
“Buffer full”
“Buffer half full”
“Buffer A v ailable”
“Voltmeter complete”
“Reading A vailable”
“High limit 2 event”
“Low limit 2 event”
“High limit 1 event”
“Low limit 1 event”
“Reading overflow”
“Re-entering the idle layer”
“Waiting in arm layer 2”
“Waiting in arm layer 1”
“Waiting in trigger layer”
SE
SE
EE
EE
EE
EE
EE
EE
EE
EE
EE
EE
EE
SE
SE
SE
SE
SE
SE
SE
SE
SE
SE
SE
SE
SE
SE
SE
SE
+161 “Program running” SE
+126
+125
+124
+123
+122
+121
“Device calculating”
“Device measuring”
“Device sweeping”
“Device ranging”
“Device settling”
“Device calibrating”
SE
SE
SE
SE
SE
SE
+101 “Operation complete” SE
+000 “No error” SE
-100
-101
-102
-103
-104
-105
-108
-109
-110
-111
-112
“Command error”
“Invalid character”
“Syntax error”
“Invalid separator”
“Data type error”
“GET not allowed”
“Parameter not allowed”
“Missing parameter”
“Command header error”
“Header separator error”
“Program mnemonic too long”
EE
EE
EE
EE
EE
EE
EE
EE
EE
EE
EE
Table 2-4
Status and error messages (cont.)
Number Description Event
-113
-114
-120
-121
-123
-124
-128
-140
-141
-144
-148
-150
-151
-154
-158
-160
-161
-168
-170
-171
-178
-200
-201
-202
“Undefined header”
“Header suffix out of range”
“Numeric data error”
“Invalid character in number”
“Exponent too large”
“Too many digits”
“Numeric data not allowed”
“Character data error”
“Invalid character data”
“Character data too long”
“Character data not allowed”
“String data error”
“Invalid string data”
“String too long”
“String data not allowed”
“Block data error”
“Invalid block data”
“Block data not allowed”
“Expression error”
“Invalid expression”
“Expression data not allowed”
“Execution error”
“Invalid while in local”
“Settings lost due to rtl”
EE
EE
EE
EE
EE
EE
EE
EE
EE
EE
EE
EE
EE
EE
EE
EE
EE
EE
EE
EE
EE
EE
EE
EE
(return to local)
-210
-211
-212
-213
-214
-215
-220
-221
-222
-223
-224
-230
-241
-260
-281
-282
-314
-315
-330
-350
-410
-420
-430
-440
“Trigger error”
“Trigger ignored”
“Arm ignored”
“Init ignored”
“Trigger deadlock”
“Arm deadlock”
“Parameter Error”
“Settings conflict”
“Parameter data out of range”
“Too much data”
“Illegal parameter value”
“Data corrupt or stale”
“Hardware missing”
“Expression Error”
“Cannot create program”
“Illegal program name”
“Save/recall memory lost”
“Configuration memory lost”
“Self T est failed”
“Queue overflow”
“Query interrupted”
“Query unterminated”
“Query deadlocked”
“Query unterminated after indefi-
EE
EE
EE
EE
EE
EE
EE
EE
EE
EE
EE
EE
EE
EE
EE
EE
EE
EE
EE
EE
EE
EE
EE
EE
nite response”
SE = Status event
EE = Error event
2-8
Page 28

▼
Front Panel Operation
2.3.4 Navigating menus
There are basically two types of menu structures; the Main
Menu and the Configure menus. The Main Menu accesses
items for which there are no dedicated keys, and Configure
menus are used to configure measurement functions and other instrument operations.
Use the following rules to navigate through the menu structure:
1. The top level of the Main Menu is accessed by pressing
the MENU key. A Configuration menu is accessed by
pressing CONFIG and then the desired function (DCV,
ACV, etc.) or operation (TRIG, STORE, etc.).
2. A menu item is selected by placing the cursor on it and
pressing ENTER. Cursor position is denoted by the
blinking menu item or parameter. The cursor keys (
and ) control cursor position.
3. A displayed arrow ( and ) on the bottom line indicates that there are one or more additional items (messages) to select from. Use the appropriate cursor key to
display them.
4. A numeric parameter is keyed in by placing the cursor
on the digit to be changed and using the RANGE ▲ or
key to increment or decrement the digit.
5. A change is only executed when ENTER is pressed.
Entering an invalid parameter generates an error and the
entry is ignored.
6. The EXIT key is used to back out of the menu structure.
Any change that is not entered is cancelled when EXIT
is pressed. The EXIT key has additional actions and are
summarized in Table 2-5.
“remembers” its own unique setup configuration. Setup configuration parameters that are remembered include:
• Range
• Relative
• Integration time
• Filtering
• Display resolution
• Multiple displays
To access the configuration menus for the measurement
functions, press the CONFIG key and then a function key
(DCV, ACV, DCI, ACI, Ω 2, Ω 4, FREQ, TEMP). Rules for
navigating the menu structures are covered in paragraph
2.3.4.
2.4.1 DC and AC voltage
The Model 2002 can make DCV measurements from 1nV to
1100V and ACV measurements from 10nV to 775V. The
basic measurement procedures for DCV and ACV are contained in the Getting Started manual.
Voltage configuration
The following information explains the various configuration options for DC and AC voltage measurements. The configuration menus are summarized in Tables 2-6 and 2-7. The
menus are accessed by pressing CONFIG and then DCV or
ACV. Paragraph 2.3.5 summarizes the rules for navigating
through menus.
2.4 Functions
To minimize the need to reprogram setup conditions every
time you switch from one function to another, each function
Table 2-5
EXIT key actions
Condition EXIT key action
T emporary message displayed
(e.g., TRIGGERS HAL TED)
INFO message displayed
Reading display hold
Scanning
Data storage
Cancels display of temporary message.
Cancels INFO message, returns to menu or normal reading display.
Cancels reading display hold, resumes normal reading display.
Disables scanning. Also stops data storage if enabled.
Stops data storage. Temporary message STORAGE INTERRUPTED is displayed.
Note that a function does not have to be selected in order to
be configured. When the function is selected, it will assume
the programmed status.
2-9
Page 29

Front Panel Operation
Table 2-6
CONFIGURE DCV menu structure
Menu item Description
SPEED
NORMAL
FAST
MEDIUM
HIACCURACY
SET-SPEED-EXACTLY
SET-BY-RSLN
FILTER
AUTO
AVERAGING
ADVANCED
AVERAGING-MODE
RESOLUTION
AUTO
3.5d, 4.5d, 5.5d, 6.5d,
7.5d, 8.5d
Measurement speed (integration time) menu:
Select 1 PLC (power line cycle, 16.67msec for 60Hz, 20msec for 50Hz and 400Hz).
Select 0.01 PLC.
Select 0.1 PLC.
Select 10 PLC.
Set integration time in PLC (0.01-50).
Default to setting appropriate for resolution.
Digital filter menu:
Default to filter appropriate for integration time.
Program a simple average filter (1-100 readings).
Program a simple average filter (1-100 readings) with a noise tolerance window (0-
100% of range).
Select moving average or repeating average mode.
Display resolution menu:
Default to resolution appropriate for integration time.
Select a specific resolution.
2-10
Page 30

Table 2-7
CONFIGURE ACV menu structure
Menu item Description
Front Panel Operation
SPEED
NORMAL
FAST
MEDIUM
HIACCURACY
SET-SPEED-EXACTLY
SET-BY-RSLN
FILTER
AUTO
AVERAGING
ADVANCED
AVERAGING-MODE
RESOLUTION
AUTO
3.5d, 4.5d, 5.5d, 6.5d,
7.5d, 8.5d
UNITS
VOLTS
dB
dBm
COUPLING
AC
AC+DC
Measurement speed (integration time) menu:
Select 1 PLC (power line cycle, 16.67msec for 60Hz, 20msec for 50Hz and 400Hz).
Select 0.01 PLC.
Select 0.1 PLC.
Select 10 PLC.
Set integration time in PLC (0.01-50).
Default to setting appropriate for resolution.
Digital filter menu:
Default to filter appropriate for integration time.
Program a simple average filter (1-100 readings).
Program a simple average filter (1-100 readings) with a noise tolerance
window (0-100% of range).
Select moving average or repeating average mode.
Display resolution menu:
Default to resolution appropriate for integration time.
Select a specific resolution.
Display units menu:
Select volts.
Select dB and set voltage reference level.
Select dBm and set reference impedance.
Coupling menu:
Select AC coupled measurements.
Select DC coupled measurements.
AC-TYPE
RMS
AVERAGE
PEAK
LOW-FREQ-RMS
POSITIVE-PEAK
NEGATIVE-PEAK
Type of ACV measurement menu:
Select true RMS ACV.
Select average ACV.
Select peak ACV.
Select low frequency (typically <50Hz) true RMS ACV.
Select positive DCV peak spikes measurements.
Select negative DCV peak spikes measurements.
2-11
Page 31

Front Panel Operation
SPEED
The SPEED parameter sets the integration time of the A/D
converter, the period of time the input signal is measured
(also known as aperture). The integration time affects the
usable resolution, the amount of reading noise, as well as the
ultimate reading rate of the instrument. From the front panel,
the integration time is specified in parameters based on a
number of power line cycles (NPLC), where 1 PLC for 60Hz
is 16.67msec and 1 PLC for 50Hz and 400Hz is 20msec.
The SPEED parameters for all functions (except frequency)
are explained as follows:
FAST: Sets integration time to 0.01 PLC. Use F AST if speed
is of primary importance at the expense of increased reading
noise and less usable resolution.
MEDIUM: Sets integration time to 0.1PLC. Use MEDIUM
when a compromise between noise performance and speed is
acceptable.
NORMAL: Sets integration time to 1 PLC. A compromise
like MEDIUM, but NORMAL provides better noise performance at the expense of speed.
HIACCURACY: Sets integration time to 10 PLC. Use
HI-ACCURACY when high common-mode and normalmode rejection is required.
SET-SPEED-EXACTLY: When this parameter is selected,
the current PLC value is displayed. By using the cursor keys
( and ) and the RANGE ▲ and ▼ keys, you can enter
any PLC value from 0.01 to 50. Be sure to press ENTER
after keying in a new value. Note that an integer PLC value
will increase noise rejection.
SET-BY-RSLN: This parameter optimizes the integration
time for the present resolution setting. See Table 2-8 for the
default integration times of the DCV and ACV functions.
The default set-by-resolution integration times of other functions are listed in Tables 2-13, 2-18 and 2-24.
FILTER
FILTER lets you set the digital filter response. The filter
menu is available from the function configuration menus (i.e.
CONFIGURE DCV) or by pressing CONFIGURE FILTER
with the desired function already selected. All of the parameters (menu items) for FILTER are explained in paragraph
2.9. Since the AUTO parameter has specific effects on DCV
and ACV, it is covered here.
AUTO: This parameter for a digital filter optimizes its use
for the present measurement function. The defaults for automatic filtering of DCV and ACV are listed in Table 2-9.
Table 2-8
DCV and ACV integration times set-by-resolution
Measurement
function and type Resolution
DCV 3.5d, 4.5d
5.5d
6.5d
7.5d
8.5d
Integration
time
0.01 PLC
0.02 PLC
0.10 PLC
1.00 PLC
10.00 PLC
DCV peak spikes 3.5d (to 7.5d) Not used
RMS, average 3.5d, 4.5d
5.5d
6.5d, 7.5d, 8.5d
0.01 PLC
0.02 PLC
10.00 PLC
Low frequency RMS 3.5d to 8.5d Not used
ACV peak 4d (to 8d) Not used
Notes:
1. For DCV measurements, if the integration time is SET-BY-RSLN
and the resolution AUTO, the integration time will be 1.0 PLC and
the resolution 7.5 digits.
2. For RMS and average measurements, if the integration time is SET-
BY-RSLN and the resolution is AUTO, the integration will be 1.0
PLC and the resolution 5.5 digits.
3. For DCV peak spikes, low frequency RMS, and ACV peak measure-
ments, the integration time setting is ignored.
4. The resolution of DCV peak spikes can be from 3.5d to 8.5d, but the
accuracy is specified at 3.5d. The resolution of ACV peak can be
from 4d to 8d, but the accuracy is specified at 4d.
2-12
Page 32

Table 2-9
DCV and ACV auto filter
Front Panel Operation
Measurement function
and type Units State Type Readings
DCV - On Advanced 10 1.0% Moving
DCV peak spikes - On Advanced 10 5.0% Moving
RMS, average, low fre-
Any Off Advanced 10 5.0% Moving
quency RMS
ACV peak Volts
dB, dBm
On
On
RESOLUTION
Except for frequency , temperature, and some special cases of
AC voltage, all functions can operate with 3½ to 8½-digit
resolution, or they can default to a setting appropriate for the
selected integration time.
3.5d, 4.5d, 5.5d, 6.5d, 7.5d or 8.5d: Sets resolution to the
specified number of digits.
AUTO: optimizes the resolution for the present integration
time setting. See Table 2-10 for the default resolutions of the
DCV and ACV functions. The default resolutions of the
other functions are listed in Tables 2-15, 2-20 and 2-25.
UNITS
This parameter selects the displayed units for AC voltage
measurements.
VOLTS: With volts selected as the units, AC voltage measurements are expressed in volts.
dB: Expressing AC voltage in dB makes it possible to compress a large range of measurements into a much smaller
scope. The relationship between dB and voltage is defined by
the following equation:
V
IN
dB = 20 log
------------ V
REF
where: VIN is the AC input signal.
V
is the specified voltage reference level.
REF
Advanced
Averaging1010
Noise
tolerance
5.0%
–
Averaging
Mode
Moving
Moving
Table 2-10
DCV and ACV auto resolution
Measurement
function and type Integration time Resolution
DCV 0.01 to <0.02 PLC
0.02 to <0.10 PLC
0.10 to <1.00 PLC
1.00 to <10.00 PLC
10.00 to 50 PLC
4.5d
5.5d
6.5d
7.5d
8.5d
DCV peak spikes Not used 3.5d
RMS, average 0.01 to <0.02 PLC
0.02 to <10.00 PLC
10.00 to 50 PLC
4.5d
5.5d
6.5d
Low frequency RMS Not used 5.5d
ACV peak Not used 4d
Notes:
1. If the DCV resolution is AUTO and the integration time SET-BY-
RSLN, the resolution will be 7.5 digits and the integration time 1.0
PLC.
2. For DCV peak spikes, low frequency RMS, and ACV peak measure-
ments, the integration time setting is ignored.
3. For RMS and average measurements, if the resolution is A UT O and the
integration time is SET -BY-RSLN, the resolution will be 5.5 digits and
the integration time 1.0 PLC.
The instrument will read 0dB when the reference voltage
level is applied to the input. dB measurements are possible
on all ACV measurement types except positive peak spikes
and negative peak spikes, as these may be negative, and the
log of a negative number is not defined. Note that dB mea-
2-13
Page 33

Front Panel Operation
surements are specified only for the low frequency RMS
measurement type.
If a relative value is in effect when dB is selected, the value
is converted to dB. If a relative value is stored after dB units
are selected, the units of the relative value are dB.
After selecting dB, the present reference voltage level is displayed. To change the reference level, use the cursor keys
( and ) and the RANGE ▲ and ▼ keys. Be sure to
press ENTER after changing the reference level.
dBm: dBm is defined as decibels above or below a 1mW ref-
erence. W ith a user-programmable reference impedance, the
Model 2002 reads 0dBm when the voltage needed to dissipate 1mW through the reference impedance is applied. The
relationship between dBm, a reference impedance, and the
voltage is defined by the following equation:
2
V
/Z
()
IN
REF
---------------------------- 1mW
where: V
dBm = 10 log
is the AC input signal.
IN
Z
is the specified reference impedance.
REF
NOTE
Do not confuse reference impedance with
input impedance. The input impedance of
the instrument is not modified by the dBm
parameter.
If a relative value is in ef fect when dBm is selected, the v alue
is converted to dBm. If a relative value is stored after dBm
units are selected, the units of the relative value is dBm.
T o set the reference impedance, perform the follo wing steps:
4. When units are changed from volts to dB or dBm, all
values less than zero that depend on the new units are
made equal to zero. This includes, for example, relative
values and stored readings. This avoids the overflow
condition of a log of a negative number.
COUPLING
This parameter selects the input coupling for the ACV
function.
AC: With AC coupling selected, a DC blocking capacitor is
placed in series with the input. This removes the DC component from the RMS, average or peak ACV measurement.
AC+DC: When AC+DC coupling is selected, the blocking
capacitor is removed. Subsequent RMS, average or peak
ACV measurements reflect both the AC and DC components
of the signal.
While displaying readings, the present coupling setting is
shown on the bottom line, if not showing a multiple display.
Note that the coupling settings for A CV and A CI are discrete.
Thus, setting the coupling of ACV has no effect on the coupling of ACI.
AC-TYPE
This parameter selects the measurement type for the ACV
function. The Model 2002 directly measures RMS, average,
and peak AC voltages. For a 330V peak-to-peak sine wave,
which is line voltage in the U.S., the measurements would
be:
• RMS = 117V
• Average = 105V (full wave rectified)
• Peak AC = 165V
After selecting dBm, the present reference impedance is
displayed (1-9999 Ω ). To change the reference impedance,
use the cursor keys ( and ) and the RANGE ▲ and ▼
keys. Be sure to press ENTER after changing the reference
impedance.
dB/dBm notes:
1. dB and dBm units are not allowed with positive or negative peak spike measurements.
2. dB and dBm units are not allowed with an advanced
filter.
3. With dB or dBm units selected, there is no bar graph or
zero-centered bar graph multiple display.
2-14
The peak detector is also used to measure positive and negative peak spikes riding on a DC signal and they are, therefore,
also configured from the AC-TYPE menu.
RMS and LOW-FREQ-RMS: Selecting between normal
RMS mode and low frequency RMS mode depends on the
desired accuracy and speed. Low frequency RMS mode is
more accurate, but slower.
Both modes are specified between 20Hz and 2MHz, with
low frequency RMS specified additionally down to 1Hz.
Some guidelines for choosing between the two modes
follow:
• Below 50Hz, use low frequency RMS mode for its
greater accuracy.
Page 34

Front Panel Operation
• Between 50 and 100Hz, use either mode.
• Above 100Hz, use normal RMS mode for its greater
speed.
AVERAGE: When this item is selected, the signal path in
the instrument bypasses the RMS converter, and the average
ACV measurement is the filtered output of a full wave
rectifier.
PEAK: For AC peak measurements, the instrument displays
the largest peak (positive or ne gative) of the input signal. The
measurement window is fixed at 100msec.
Note that you can configure the resolution of A CV peak measurements from 4 digits (3.5d from SET ACV RESOLUTION menu) to 9 digits (8.5d), but the accuracy is specified
at 4 digits. In addition, the accuracy specifications for AC
peak measurements assume A C+DC coupling belo w 200Hz.
POSITIVE-PEAK and NEGATIVE-PEAK: Peak spike
measurements are available as an ACV primary display (top
line). They are also av ailable as a DCV multiple display (bottom line). The menu items POSITIVE-PEAK and NEGATIVE-PEAK enable the measurement as a primary display.
See Figure 2-4 for a description of the primary display.
Note that dB and dBm are not allowed as valid units for peak
spikes. Positive-going spikes on a negative DC level could
still read as a negative value, and the log of a negative number is not defined.
RANGE = Set by ACV range (auto or fixed).
REL = Operates normally.
SPEED = Set by peak window (0.1-9.9sec).
FILTER = Set by ACV filter (AUTO=ADV (10)).
RESOLUTION = Set by ACV resolution (AUTO = 3.5d).
UNITS = Fixed on volts.
COUPLING = Set by ACV coupling.
+000.0 mVAC +Pk
Coupling: AC+DC
NOTES:
1. Positive peak spikes and negative peak spikes are selected
in the CONFIGURE-ACV menu.
2. Peak spikes measurement is specified for volts at 3.5 digits.
3. “Peak window” is the time a signal is sampled before a
reading is displayed.
After selecting a positive or negative peak spikes measurement from the SET ACV MEASUREMENT menu, you are
asked to enter a value for the measurement window . A typical
message follows:
PEAK WINDOW = 0.1 s
This sets the time the signal is sampled before the display is
updated with a new reading. It can range from 0.1sec to
9.9sec.
As a primary display, the resolution of peak spik es can be set
from 3.5d to 8.5d, but the accuracy is specified at 3.5d. (As a
multiple display, the resolution is fixed at 3.5d.)
Figure 2-4
Positive and negative peak spikes
Multiple displays
The displays for DC and A C voltage that sho w multiple functions are shown in Figures 2-5 and 2-6. The multiple display
for crest factor, which is calculated from the peak and RMS
values, is described here.
2-15
Page 35

Front Panel Operation
DCV
RANGE = Set by DCV range (auto or fixed).
Autoranges independently of other functions.
REL = Operates normally.
SPEED = Set by DCV speed.
FILTER = Set by DCV filter.
RESOLUTION = Set by DCV resolution.
+000.0000 mVDC
+000.000 mVAC +000.00 Hz
ACV
RANGE = Set by ACV range (auto or fixed).
Autoranges independently of other functions.
REL = No effect.
SPEED = Set by ACV speed.
FILTER = Unaffected by DCV and ACV filters.
RESOLUTION = Set by ACV resolution.
UNITS = Fixed on volts.
COUPLING = Fixed on AC coupling.
AC-TYPE = Fixed on normal mode RMS.
A. DC voltage, AC voltage, and frequency functions
Figure 2-5
DC voltage multifunction multiple displays
FREQ
RANGE = Set by MAX-SIGNAL-LEVEL in CONFIGURE
FREQUENCY menu.
Autorange has no effect.
REL = No effect.
TRIGGER LEVEL = Set while in FREQ. Not available in
CONFIGURE FREQUENCY menu.
FILTER = Unaffected by DCV filter. FREQ has no filter.
RESOLUTION = Fixed at 5 digits.
COUPLING = Fixed on AC coupling.
INPUT TERMINALS = Fixed on VOLTAGE.
2-16
Page 36

DCV
RANGE = Set by DCV range (auto or fixed).
Autoranges independently of other functions.
REL = Operates normally.
SPEED = Set by DCV speed.
FILTER = Set by DCV filter.
RESOLUTION = Set by DCV resolution.
+000.0000 mVDC
Pos-Pk=+000.0mV Highest=+000.0mV
Front Panel Operation
Pos-Pk
RANGE = Follows the DCV range.
REL = No effect.
SPEED = Fixed at 100msec.
Peak window has no effect.
FILTER = Unaffected by DCV and ACV filters.
RESOLUTION = Fixed at 3.5 digits.
UNITS = Fixed on volts.
COUPLING = Fixed on AC+DC coupling.
NOTE: The peak detector captures the maximum
value of the input signal.
B. DC voltage and positive peak spikes functions
Figure 2-5
DC voltage multifunction multiple displays (cont.)
Highest
REL = No effect.
RESOLUTION = Fixed at 3.5 digits.
UNITS = Fixed on volts.
NOTE: The highest value is reset by pressing the
DCV key, or changing function (i.e., leaving this
display).
2-17
Page 37

Front Panel Operation
DCV
RANGE = Set by DCV range (auto or fixed).
Autoranges independently of other functions.
REL = Operates normally.
SPEED = Set by DCV speed.
FILTER = Set by DCV filter.
RESOLUTION = Set by DCV resolution.
+000.0000 mVDC
Neg-Pk=-000.0mV Lowest=-000.0mV
Neg-Pk
RANGE = Follows the DCV range.
REL = No effect.
SPEED = Fixed at 100msec.
Peak window has no effect.
FILTER = Unaffected by DCV and ACV filters.
RESOLUTION = Fixed at 3.5 digits.
UNITS = Fixed on volts.
COUPLING = Fixed on AC+DC coupling.
NOTE: The peak detector captures the minimum
value of the input signal.
C. DC voltage and negative peak spikes functions
Figure 2-5
DC voltage multifunction multiple displays (cont.)
Lowest
REL = No effect.
RESOLUTION = Fixed at 3.5 digits.
UNITS = Fixed on volts.
NOTE: The lowest value is reset by pressing the
DCV key, or changing function (i.e., leaving this
display).
2-18
Page 38
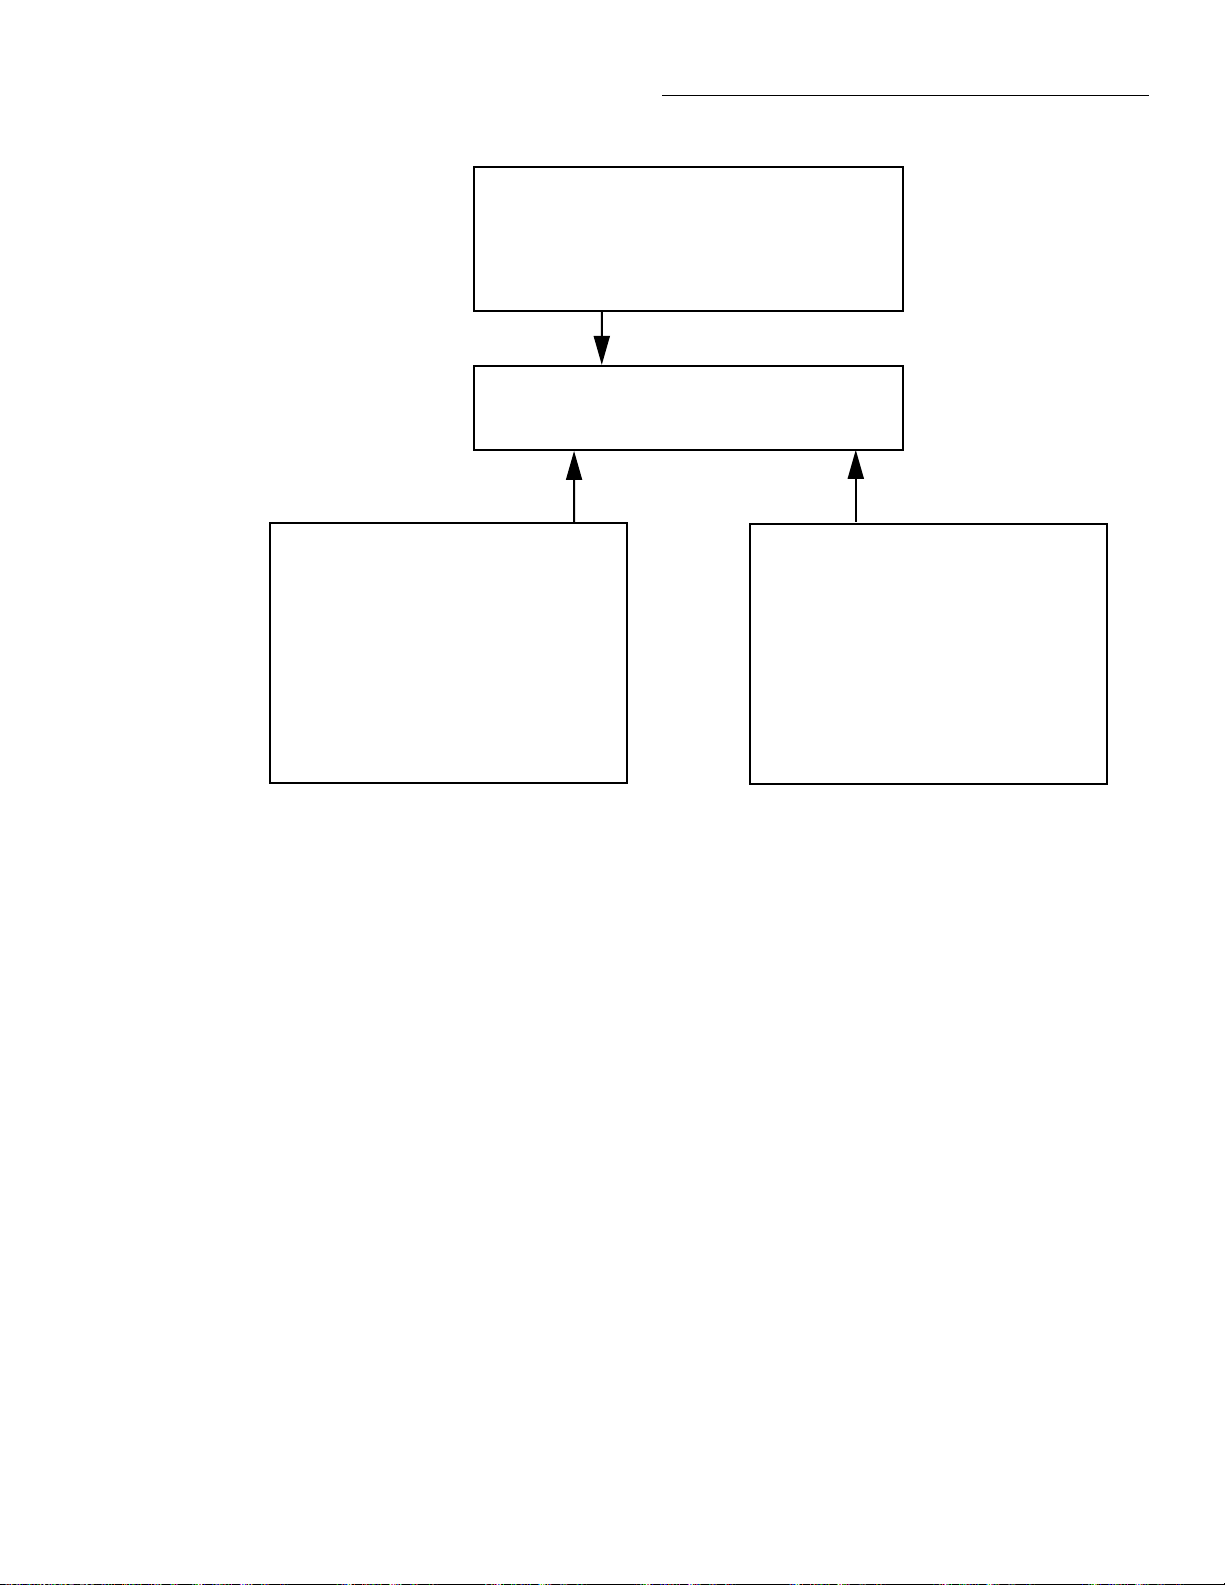
DCV
RANGE = Set by DCV range (auto or fixed).
Autoranges independently of other functions.
REL = Operates normally.
SPEED = Set by DCV speed.
FILTER = Set by DCV filter.
RESOLUTION = Set by DCV resolution.
+000.0000 mVDC
Pos-Pk=+000.0mV Neg-Pk=-000.0mV
Front Panel Operation
Pos-Pk
RANGE = Follows the DCV range.
REL = No effect.
SPEED = Fixed at 100msec.
Peak window has no effect.
FILTER = Unaffected by DCV and ACV filters.
RESOLUTION = Fixed at 3.5 digits.
UNITS = Fixed on volts.
COUPLING = Fixed on AC+DC coupling.
NOTE: The peak detector captures the maximum
value of the input signal.
D. DC voltage, positive and negative peak spikes functions
Figure 2-5
DC voltage multifunction multiple displays (cont.)
Neg-Pk
RANGE = Follows the DCV range.
REL = No effect.
SPEED = Fixed at 100msec.
Peak window has no effect.
FILTER = Unaffected by DCV and ACV filters.
RESOLUTION = Fixed at 3.5 digits.
UNITS = Fixed on volts.
COUPLING = Fixed on AC+DC coupling.
NOTE: The peak detector captures the minimum
value of the input signal.
2-19
Page 39

Front Panel Operation
RMS
RANGE = Set by ACV range (auto or fixed).
Autoranges independently of other functions.
REL = Operates normally.
SPEED = Set by ACV speed.
FILTER = Set by ACV filter.
RESOLUTION = Set by ACV resolution.
UNITS = Set by ACV units.
COUPLING = Set by ACV coupling.
AC-TYPE = Fixed on normal mode RMS.
+000.000 mVAC RMS
+000.00Hz Crest Factor=0.00
FREQ
RANGE = Set by MAX-SIGNAL-LEVEL in CONFIGURE
FREQUENCY menu.
Autorange has no effect.
REL = No effect.
TRIGGER LEVEL= Set while in FREQ. Not available in
CONFIGURE FREQUENCY menu.
FILTER = Unaffected by ACV filter. FREQ has no filter.
RESOLUTION = Fixed at 5 digits.
COUPLING = Set by ACV coupling.
INPUT TERMINALS = Fixed on VOLTAGE.
A. AC RMS voltage, frequency, and crest factor
Figure 2-6
AC voltage multifunction multiple displays
Crest Factor
RANGE = ACV peak measurement range set by ACV range
(auto or fixed). Peak measurement autoranges independently
of other functions.
REL = No effect.
SPEED = Fixed at 100msec. Peak window has no effect.
FILTER = If ACV filter is on, crest factor is effectively filtered as
well.
RESOLUTION = Fixed at 3 digits.
UNITS = None.
COUPLING = ACV peak measurement coupling set by ACV
coupling.
NOTE: Crest factor (up to 9.99) is calculated from an ACV peak
measurement divided by the raw (without rel) ACV RMS measurement.
2-20
Page 40

RMS
RANGE = Set by ACV range (auto or fixed).
Autoranges independently of other functions.
REL = Operates normally.
SPEED = Set by ACV speed.
FILTER = Set by ACV filter.
RESOLUTION = Set by ACV resolution.
UNITS = Set by ACV units.
COUPLING = Set by ACV coupling.
AC-TYPE = Fixed on normal mode RMS.
+000.000 mVAC RMS
AVG=000.000mV Peak=000.0mV
Front Panel Operation
AVG
RANGE = Set by ACV range (auto or fixed).
Autoranges independently of other functions.
REL = No effect.
SPEED= Set by ACV speed.
FILTER = Unaffected by ACV filter.
RESOLUTION = Fixed at 5.5 digits.
UNITS = Fixed on volts.
COUPLING = Set by ACV coupling.
B. AC RMS, average, and peak voltages
Figure 2-6
AC voltage multifunction multiple displays (cont.)
Peak
RANGE = Set by ACV range (auto or fixed).
Autoranges independently of other functions.
REL = No effect.
SPEED = Fixed at 100msec. Peak window has no
effect.
FILTER = Unaffected by ACV filter.
RESOLUTION = Fixed at 4 digits.
UNITS = Fixed on volts.
COUPLING = Set by ACV coupling.
2-21
Page 41

Front Panel Operation
Crest factor — The crest factor of a waveform is the ratio of
its peak value to its RMS value. Thus, the crest factor specifies the dynamic range of a true RMS instrument. For sinusoidal waveforms, the crest factor is 1.414. For a
symmetrical square wave, the crest factor is unity. The crest
factor of a rectangular pulse is related to its duty cycle; as the
duty cycle decreases, the crest factor increases.
For the Model 2002, the additional error term for RMS measurements caused by a high crest factor is specified up to a
value of five. The maximum displayable v alue is 9.99, else it
shows “over”.
Note that the crest factor is not calculated if dB or dBm is the
presently selected units.
Low level considerations
For sensitive measurements, external considerations besides
the Model 2002 affect the accuracy. Effects not noticeable
when working with higher voltages are significant in microvolt signals. The Model 2002 reads only the signal received
at its input; therefore, it is important that this signal be properly transmitted from the source. The following paragraphs
indicate factors that affect accuracy, including thermal offsets and stray pick-up.
• The reading is sensitive to (and responds to)
temperature changes. This effect can be demonstrated
by touching the circuit, by placing a heat source near
the circuit, or by a regular pattern of instability
(corresponding to heating and air conditioning systems,
or changes in sunlight).
To minimize the drift caused by thermal emfs, use copper
leads to connect the circuit to the Model 2002. A banana plug
generates a few microvolts. A clean copper conductor such
as #10 bus wire is ideal for this application. The leads to the
input may be shielded or unshielded, as necessary. Refer to
Shielding.
Widely varying temperatures within the circuit can also create thermal emfs. Therefore, maintain constant offset temperatures to minimize these thermal emfs. A cardboard box
around the circuit under test also helps by minimizing air
currents.
The REL control can be used to null out constant offset
voltages.
Note that additional thermals may be generated by the
optional Model 2002-SCAN scanner card.
Shielding — AC voltages that are e xtremely large compared
with the DC signal to be measured may produce an erroneous output. Therefore, to minimize AC interference, the circuit should be shielded with the shield connected to the
Model 2002 INPUT LO (particularly for low-level sources).
Improper shielding can cause the Model 2002 to behave in
one or more of the following ways:
• Unexpected offset voltages.
• Inconsistent readings between ranges.
• Sudden shifts in reading.
T o minimize pick-up, keep the v oltage source and the Model
2002 away from strong AC magnetic sources. The voltage induced due to magnetic flux is proportional to the area of the
loop formed by the input leads. Therefore, minimize the loop
area of the input leads and connect each signal at only one
point.
Thermal EMFs — Thermal emfs (thermoelectric potentials)
are generated by thermal differences between the junctions
of dissimilar metals. These can be large compared to the signal that the Model 2002 can measure. Thermal emfs can
cause the following conditions:
• Instability or zero offset is much higher than expected.
AC voltage offset — The Model 2002, at 5
½
d resolution,
will typically display 150 counts of offset on AC volts with
the input shorted. This offset is caused by the offset of the
TRMS converter. This offset will not affect reading accuracy
and should not be zeroed out using the rel feature. The following equation expresses how this offset (V
to the signal input (V
Displayed reading V
):
IN
=
2
()
IN
+V
()
OFFSET
OFFSET
) is added
2
Example: Range = 2VAC
Offset = 150 counts (1.5mV)
Input = 200mV RMS
Display reading 200mV
()
=
= 0.04V 2.25 10-6V×()+
= .200005V
2
+ 1.5mV
()
2
The offset is seen as the last digit which is not displayed.
Therefore, the offset is negligible. If the rel feature were used
to zero the display, the 150 counts of offset would be subtracted from V
resulting in an error of 150 counts in the dis-
IN
played reading.
2-22
Page 42

Front Panel Operation
2.4.2 DC and AC current
The Model 2002 can make normal DCI measurements from
10pA and 2.1A and A CI measurements from 100pA to 2.1A.
The basic measurement procedures for DCI and A CI are contained in the Getting Started manual.
AMPS fuse replacement
There are two protection fuses for the current ranges, one for
the front terminals, another for the rear. This procedure
describes how to change an AMPS fuse.
WARNING
Make sure the instrument is disconnected from the power line and other equipment before replacing an AMPS fuse.
1. Turn off the power and disconnect the power line and
test leads.
2. Perform one of the following steps:
A. For the front panel AMPS fuse, gently push in the
AMPS jack with your thumb and rotate the fuse carrier one-quarter turn counter-clockwise. Release
pressure on the jack and its internal spring will push
the jack out of the socket.
B. For the rear panel AMPS fuse, place the end of a
flat-blade screwdriver into the rear panel AMPS
holder. Push in gently and rotate the fuse carrier
one-quarter turn counter-clockwise. Release pressure on the holder and its internal spring will push
the fuse carrier out of the holder.
3. Remove the fuse and replace it with the same type (2A,
250V, fast blow, 5 × 20mm). The Keithley part number
is FU-48.
CAUTION
Do not use a fuse with a higher current
rating than specified, or instrument
damage may occur. If the instrument
repeatedly blows fuses, locate and correct the cause of the trouble before
replacing the fuse. See the optional
Model 2002 Repair Manual for troubleshooting information.
4. Install the new fuse by reversing the above procedure.
Current configuration
The following information explains the various configuration options for DC and AC current measurements. The configuration menus are summarized in Tables 2-11 and 2-12.
The menus are accessed by pressing CONFIG and then DCI
or ACI. Paragraph 2.3.5 summarizes the rules for navigating
through the menus.
Note that a function does not have to be selected in order to
be configured. When the function is selected, it will assume
the programmed status.
2-23
Page 43

Front Panel Operation
Table 2-11
CONFIGURE DCI menu structure
Menu item Description
SPEED
NORMAL
FAST
MEDIUM
HIACCURACY
SET-SPEED-EXACTLY
SET-BY-RSLN
FILTER
AUTO
AVERAGING
ADVANCED
AVERAGING-MODE
RESOLUTION
AUTO
3.5d, 4.5d, 5.5d, 6.5d,
7.5d, 8.5d
MEASUREMENT-MODE
NORMAL
IN-CIRCUIT
Table 2-12
CONFIGURE ACI menu structure
Menu item Description
Measurement speed (integration time) menu:
Select 1 PLC (power line cycle, 16.67msec for 60Hz, 20msec for 50Hz and 400Hz).
Select 0.01 PLC.
Select 0.1 PLC.
Select 10 PLC.
Set integration time in PLC (0.01-50).
Default to setting appropriate for resolution.
Digital filter menu:
Default to filter appropriate for integration time.
Program a simple average filter (1-100 readings).
Program a simple average filter (1-100 readings) with a noise tolerance window (0-
100% of range).
Select moving average or repeating average mode.
Display resolution menu:
Default to resolution appropriate for integration time.
Select a specific resolution.
Measurement mode menu:
Select normal current measurement (use AMPS terminals).
Select in-circuit current measurement (use INPUT and SENSE terminals).
SPEED
NORMAL
FAST
MEDIUM
HIACCURACY
SET-SPEED-EXACTLY
SET-BY-RSLN
FILTER
AUTO
AVERAGING
ADVANCED
AVERAGING-MODE
RESOLUTION
AUTO
3.5d, 4.5d, 5.5d, 6.5d, 7.5d, 8.5d
COUPLING
AC
AC+DC
AC-TYPE
RMS
AVERAGE
Measurement speed (integration time) menu:
Select 1 PLC (power line cycle, 16.67msec for 60Hz, 20msec for 50Hz and
400Hz).
Select 0.01 PLC.
Select 0.1 PLC.
Select 10 PLC.
Set integration time in PLC (0.01-50).
Default to setting appropriate for resolution.
Digital filter menu:
Default to filter appropriate for integration time.
Program a simple average filter (1-100 readings).
Program a simple average filter (1-100 readings) with a noise tolerance window
(0-100% of range).
Select moving average or repeating average mode.
Display resolution menu:
Default to resolution appropriate for integration time.
Select a specific resolution.
Coupling menu:
Select AC coupled measurements.
Select DC coupled measurements.
Type of ACI measurement menu:
Select true RMS ACI.
Select average ACI.
2-24
Page 44

Front Panel Operation
SPEED
The SPEED parameter sets the integration time of the A/D
converter, the period of time the input signal is measured
(also known as aperture). It is discussed in paragraph 2.4.1,
DC and A C voltage. Only the dif ferences for DC and A C current are noted here.
SET-BY-RSLN: This parameter optimizes the integration
time for the present resolution setting. The defaults for setby-resolution integration times of DCI and ACI are listed in
Table 2-13.
Table 2-13
DCI and ACI integration time set-by-resolution
Measurement
function and type Resolution
DC current 3.5d, 4.5d
5.5d
6.5d
7.5d, 8.5d
Integration
time
0.01 PLC
0.02 PLC
0.20 PLC
2.00 PLC
DC in-circuit current 3.5d to 7.5d Not used
RMS, average 3.5d, 4.5d
5.5d
6.5d, 7.5d, 8.5d
Notes:
1. For normal DC current, if the integration time is SET-BY-RSLN and
the resolution is A UT O, the inte gration time will be 1.0 PLC and the
resolution 6.5 digits.
2. For DC in-circuit current, the integration time setting is ignored.
3. For AC current, if the integration time is SET-BY-RSLN and the res-
olution is AUTO, the integration time will be 1.0 PLC and the resolution 5.5 digits.
0.01 PLC
0.02 PLC
10.00 PLC
FILTER
FILTER lets you set the digital filter response. The filter
menu is available from the function configuration menus (i.e.
CONFIGURE DCI) or by pressing CONFIGURE FILTER
with the desired function already selected. All of the parameters (menu items) for FILTER are explained in paragraph
2.9. Since the AUTO parameter has specific effects on DCI
and ACI, it is covered here.
AUTO: This parameter for a digital filter optimizes its use
for the present measurement function. The defaults for automatic filtering of DCI and ACI are listed in Table 2-14.
RESOLUTION
The RESOLUTION parameter sets the display resolution. It
is discussed in paragraph 2.4.1, DC and A C voltage. Only the
differences for DC and AC current are noted here.
AUTO: Refer to Table 2-15 for the resolution associated
with the integration time.
MEASUREMENT-MODE
This option selects the DC current measurement mode,
either normal or in-circuit measurements.
NORMAL: This option is for normal current measuring,
where the meter is placed in series with the current path and
the voltage across an internal shunt resistor is measured.
Table 2-14
DCI and ACI auto filter
Measurement
function and type State Type Readings
Noise
tolerance Mode
DC current On Advanced 10 1.0% Moving
DC in-circuit current On Advanced 10 1.0% Moving
AC current Off Advanced 10 5.0% Moving
2-25
Page 45

Front Panel Operation
Table 2-15
DCI and ACI auto resolution
Measurement
function and type Integration time Resolution
DC current 0.01 to <0.02 PLC
0.02 to <0.20 PLC
0.20 to <2.00 PLC
2.00 to 50 PLC
4.5d
5.5d
6.5d
7.5d
DC in-circuit current Not used 5.5d
RMS, average 0.01 to <0.02 PLC
0.02 to <10.00 PLC
10.00 to 50 PLC
Notes:
1. For normal DC current, if the resolution is AUTO and the integration
time is SET-BY-RSLN, the resolution will be 6.5 digits and the integration time 1.0 PLC.
2. For DC in-circuit current, the integration time setting is ignored.
3. For AC current, if the resolution is AUTO and the integration time is
SET-BY-RSLN, the resolution will be 5.5 digits and the integration
time 1.0 PLC.
4.5d
5.5d
6.5d
IN-CIRCUIT: In-circuit current is a calculation based on a
4-wire resistance measurement and a voltage measurement.
It is similar to an offset-compensated ohms measurement.
The current in a low resistance conductor (e.g., a printed
circuit trace) can be measured without breaking the current
path. The Model 2002 can do this with a pair of Kelvin test
probes across the conductor. See Figure 2-7. The method
follows:
1. Using one set of the Kelvin probe tips, the instrument
sources a known current (I
) through the conductor
SOURCE
and simultaneously measures the resulting voltage
(V
) with the other set of probe tips:
MEAS1
V
MEAS1
I
=
IN-CKTISOURCE
+()R
TRACE
or
V
MEAS1
R
TRACE
2. The instrument then measures the voltage (V
-------------------------------------------------=
I
+()
IN-CKTISOURCE
MEAS2
across the conductor without sourcing an additional
current:
V
MEAS2
I
()R
=
IN-CKT
TRACE
or
V
MEAS2
R
TRACE
----------------------=
I
()
IN-CKT
)
Model 2002
+00.207 ADC ICkt
Trace resistance: 1.0000Ω
PREV
DCV ACV DCI ACI Ω2 Ω4
DISPLAY
NEXT
REL TRIG STORE RECALL
POWER
INFO LOCAL CHAN SCAN CONFIG MENU EXIT ENTER
Caution : Maximum Input = +200mV on
(I
+ I
IN - CKT
I
= 10mA.
SOURCE
Figure 2-7
DC in-circuit current measurements
SOURCE
FILTER MATH
) • R
TRACE
2002 MULTIMETER
FREQ TEMP
, where
RANGE
RANGE
SENSE
INPUT
Ω 4 WIRE
HI
350V
PEAK
AUTO
1100V
PEAK
LO
500V
PEAK
INPUTS
F
FRONT/REAR
R
2A 250V
AMPS
CAL
Circuit
Under Test
Y
Note: The distance
"X" must be greater
than 10 times the
x
distance "Y" or
additional errors will
be introduced.
Y
2-26
Page 46

Front Panel Operation
3. It then calculates the in-circuit current by combining the
equations and solving for I
V
MEAS1
------------------------------------------------I
V
V
MEAS1IIN-CKT
V
MEAS1IIN-CKT
()V
MEAS1IIN-CKT
()V
()-V
()=V
I
IN-CKTVMEAS1-VMEAS2
+()
IN-CKTISOURCE
MEAS2IIN-CKT
MEAS2IIN-CKT
I
IN-CKT
MEAS2IIN-CKTISOURCE
()V
V
MEAS2ISOURCE
-----------------------------------------------=
V
()
MEAS1-VMEAS2
:
IN-CKT
V
MEAS2
----------------------=
I
()
IN-CKT
()V
MEAS2ISOURCE
()
+()=
()+=
MEAS2ISOURCE
()=
MEAS2ISOURCE
()
Because of accuracy considerations, in-circuit current readings are limited to traces with a resistance of 1mΩ to 10Ω. If
either of these limits is exceeded in the resistance calculation, the in-circuit current cannot be calculated. The bottom
line of the front panel display will show and update the trace
resistance.
A procedure to measure in-circuit current follows:
1. Select the in-circuit current measurement mode from the
CONFIGURE DCI menu and place the instrument in
the DCI function. Note that the 4W annunciator lights to
indicate this is a 4-wire measurement.
2. Connect a set of Kelvin test probes, such as Keithley
Model 5805 or 5806, to the Model 2002 INPUT HI and
LO terminals and SENSE HI and LO terminals.
3. For R
<50mΩ, or where the conductors are physi-
TRACE
cally hot, rel out (zero correct) any thermal offsets that
are present before measuring in-circuit current. With
power to the test circuit removed, place the probes on
the desired trace and enable rel from the DCI function.
4. Turn on the power to the test circuit and read the incircuit current calculation. The speed of this
measurement is four readings per second at 1PLC. Its
range is fixed at 12A. The default filter for in-circuit
current is a moving average of ten readings. Additional
filtering may be needed at low current levels.
A measurement overflow occurs for any of the following
conditions:
• The measured voltage exceeds |±200mV|.
• The trace resistance is less than 1mΩ or greater than
10Ω.
• The in-circuit current is greater than 12A.
COUPLING
This parameter selects the input coupling for the ACI
function.
AC: With AC coupling selected, a DC block capacitor is
placed in series with the AC measurement circuit (note that
the current shunt resistors are always DC coupled to the
inputs. This removes the DC component from the RMS and
average A CI measurement.
AC+DC: When AC+DC coupling is selected, the blocking
capacitor is removed. Subsequent RMS or average ACI
measurements reflect both the A C and DC components of the
signal.
Note that the coupling settings for A CI and A CV are discrete.
Thus, setting the coupling of ACI has no effect on the coupling of ACV.
AC-TYPE
This parameter selects the measurement type for the ACI
function. The Model 2002 directly measures RMS and aver age AC current.
RMS: W ith this parameter selected, the instrument performs
RMS AC current measurements.
AVERAGE: When this item is selected, the signal path in
the instrument bypasses the RMS converter, and the average
ACI measurement is the filtered output of a full wave
rectifier.
Multiple displays
The multiple displays for AC current that show multiple
functions are shown in Figure 2-8. There are no multifunction displays for DC current.
2-27
Page 47

Front Panel Operation
RMS (or AVG)
RANGE = Set by ACI range (auto or fixed).
Autoranges independently of other function.
REL = Operates normally.
SPEED = Set by ACI speed.
FILTER = Set by ACI filter.
RESOLUTION = Set by ACI resolution.
COUPLING = Set by ACI coupling.
AC-TYPE = Set by ACI AC-Type.
+000.000 µAAC RMS (or AVG)
+0.0000 Hz
FREQ
RANGE = Set by MAX-SIGNAL-LEVEL in CONFIGURE
FREQUENCY menu.
Autorange has no effect.
REL = No effect.
TRIGGER LEVEL = Set while in FREQ. Not available in
CONFIGURE FREQUENCY menu.
FILTER = Unaffected by ACI filter. FREQ has no filter.
RESOLUTION = Fixed at 5 digits.
COUPLING = Set by ACI coupling.
INPUT TERMINALS = Fixed on CURRENT
RMS
RANGE = Set by ACI range (auto or fixed).
Autoranges independently of other function.
REL = Operates normally.
SPEED = Set by ACI speed.
FILTER = Set by ACI filter.
RESOLUTION = Set by ACI resolution.
COUPLING = Set by ACI coupling.
+000.000 µAAC RMS
AVG=000.000 µAAC
AVG
RANGE = Set by ACI range (auto or fixed).
Autoranges independently of other function.
REL = No effect.
SPEED = Set by ACI speed.
FILTER = Unaffected by ACI filter.
RESOLUTION = Fixed at 5.5 digits.
COUPLING = Set by ACI coupling.
B. AC RMS and average current functions
A. AC RMS (or average) current and frequency
functions
Figure 2-8
AC current multifunction multiple displays
2.4.3 T wo and four-wire resistance
The Model 2002 can make 2-wire resistance measurements
from 100nΩ to 1.05GΩ and 4-wire resistance measurements
from 100nΩ to 2.1MΩ. The basic measurement procedures
for Ω2 and Ω4 are contained in the Getting Started manual.
Shielding
It helps to shield resistance greater than 100kΩ to achieve a
stable reading. Place the resistance in a shielded enclosure
and electrically connect the shield to the INPUT LO terminal
of the instrument.
Resistance configuration
The following information explains the various configuration options for 2-wire and 4-wire resistance measurements.
The configuration menus are summarized in Tables 2-16 and
2-17. The menus are accessed by pressing CONFIG and then
Ω2 or Ω4. Paragraph 2.3.5 summarizes the rules for navigating through the menus.
Note that a function does not have to be selected in order to
be configured. When the function is selected, it will assume
the programmed status.
2-28
Page 48

Table 2-16
CONFIGURE OHMS-2W menu structure
Menu item Description
Front Panel Operation
SPEED
NORMAL
FAST
MEDIUM
HIACCURACY
SET-SPEED-EXACTLY
SET-BY-RSLN
FILTER
AUTO
AVERAGING
ADVANCED
AVERAGING-MODE
RESOLUTION
AUTO
3.5d, 4.5d, 5.5d, 6.5d, 7.5d, 8.5d
OFFSETCOMP Enable/disable offset compensation (20Ω-20kΩ ranges).
MAXAUTORANGE
1GΩ, 200MΩ, 20MΩ, 2MΩ,
200kΩ, 20kΩ
Table 2-17
CONFIGURE OHMS-4W menu structure
Menu item Description
Measurement speed (integration time) menu:
Select 1 PLC (power line cycle, 16.67msec for 60Hz, 20msec for 50Hz and 400Hz).
Select 0.01 PLC.
Select 0.1 PLC.
Select 10 PLC.
Set integration time in PLC (0.01-50).
Default to setting appropriate for resolution.
Digital filter menu:
Default to filter appropriate for integration time.
Program a simple average filter (1-100 readings).
Program a simple average filter (1-100 readings) with a noise tolerance window (0-
100% of range).
Select moving average or repeating average mode.
Display resolution menu:
Default to resolution appropriate for integration time.
Select a specific resolution.
Set upper limit for autoranging of 2-wire resistance.
Select a specific range.
SPEED
NORMAL
FAST
MEDIUM
HIACCURACY
SET-SPEED-EXACTLY
SET-BY-RSLN
FILTER
AUTO
AVERAGING
ADVANCED
AVERAGING-MODE
RESOLUTION
AUTO
3.5d, 4.5d, 5.5d, 6.5d, 7.5d, 8.5d
OFFSETCOMP Enable/disable offset compensation (20Ω-20kΩ ranges).
MAXAUTORANGE
2MΩ, 200kΩ, 20kΩ, 2kΩ, 200Ω, 20Ω
Measurement speed (integration time) menu:
Select 1 PLC (power line cycle, 16.67msec for 60Hz, 20msec for 50Hz and
400Hz).
Select 0.01 PLC.
Select 0.1 PLC.
Select 10 PLC.
Set integration time in PLC (0.01-50).
Default to setting appropriate for resolution.
Digital filter menu:
Default to filter appropriate for integration time.
Program a simple average filter (1-100 readings).
Program a simple average filter (1-100 readings) with a noise tolerance window
(0-100% of range).
Select moving average or repeating average mode.
Display resolution menu:
Default to resolution appropriate for integration time.
Select a specific resolution.
Set upper limit for autoranging of 4-wire resistance.
Select a specific range.
2-29
Page 49

Front Panel Operation
SPEED
The SPEED parameter sets the integration time of the A/D
converter, the period of time the input signal is measured
(also known as aperture). It is discussed in paragraph 2.4.1,
DC and AC voltage. Only the differences for 2-wire and 4wire resistance are noted here.
SET-BY-RSLN: This parameter optimizes the integration
time for the present resolution setting. The defaults for setby-resolution integration times of Ω2 and Ω4 are listed in
Table 2-18.
Table 2-18
Ω
2 and Ω4 integration time set-by-resolution
Resolution Integration time
3.5d, 4.5d
5.5d
6.5d
7.5d
8.5d
Note: If the integration time is SET-BY-RSLN and
the resolution AUTO, the integration time will be 1.0
PLC and the resolution 7.5 digits.
0.01 PLC
0.02 PLC
0.10 PLC
1.00 PLC
10.00 PLC
FILTER
FILTER lets you set the digital filter response. The filter
menu is available from the function configuration menus (i.e.
CONFIGURE OHMS-2W) or by pressing CONFIGURE
FIL TER with the desired function already selected. All of the
parameters (menu items) for FILTER are explained in paragraph 2.9. Since the AUTO parameter has specific effects on
Ω2 and Ω4, it is covered here.
AUTO: This parameter for a digital filter optimizes its use
for the present measurement function. The defaults for automatic filtering of Ω2 and Ω4 are listed in Table 2-19.
RESOLUTION
The RESOLUTION parameter sets the display resolution. It
is discussed in paragraph 2.4.1, DC and A C voltage. Only the
differences for Ω2 and Ω4 are noted here.
Note that all scientific notation displays are 7-1/2 digits.
Labels on the far right, such as channel number, may be
omitted to provide the desired precision.
Table 2-19
Ω
2 and Ω4 auto filter
Measurement
function State Type Rdg.
2-wire resistance
4-wire resistanceOnOn
Advanced
Advanced1010
Noise
tolerance
1.0%
1.0%
Avg.
Mode
Moving
Moving
2-30
Page 50

Front Panel Operation
AUTO: Refer to Table 2-20 for the resolution associated
with the integration time.
Table 2-20
Ω
2 and Ω4 auto resolution
Integration time Resolution
0.01 to <0.02 PLC
0.02 to <0.10 PLC
0.10 to <1.00 PLC
1.00 to <10.00 PLC
10.00 to 50 PLC
Note: If the resolution is AUTO and the integration time SETBY-RSLN, the resolution will be 7.5 digits and the integration
time 1.0 PLC.
4.5d
5.5d
6.5d
7.5d
8.5d
OFFSETCOMP
Offset compensation is used to compensate for voltage
potentials, such as thermal offsets, across the device under
test. This feature eliminates errors due to a low le vel external
voltage source configured in series with the unknown resistor. Offsets up to ±0.2V on the 20Ω and 200Ω ranges, and
from -0.2V to +2V on the 2kΩ and 20kΩ ranges can be corrected with offset compensation. Offset compensation is
available for 2- and 4-wire resistance measurements.
During offset compensated resistance measurements, the
Model 2002 performs the following steps for each A/D conversion:
Note that the offset compensation settings of the ohms functions are discrete. Thus, enabling offset compensation in 2wire ohms has no effect on 4-wire ohms.
MAXAUTORANGE
By setting an upper limit on autoranging, you can prevent
changes to ranges that you do not want to use. This speeds up
the reading rate while still using auto-ranging.
MAXAUTORANGE selections for Ω2 and Ω4:
1GΩ, 200MΩ, 20MΩ, 2MΩ, 200kΩ or 20kΩ: Sets maxi-
mum autorange limit for Ω2.
2MΩ, 200kΩ, 20kΩ, 2kΩ, 200Ω or 20Ω: Sets maximum
autorange limit for Ω4.
Multiple displays
There are three multiple displays available just for the resistance functions:
• Source current
• Voltage drop
• Lead resistance (Ω4 only)
Source current: This is the value of the current being
sourced for the present resistance range. It is based on the
calibration constants and is shown as follows:
Source Current = 0.0000 mA
1. Makes a normal resistance measurement of the device.
In general, this consists of sourcing a current through
the device, and measuring the voltage drop across the
device.
2. Turns of f the internal current source and again measures
the voltage drop across the device. This is the voltage
caused by an external device.
3. Calculates and displays the corrected resistance value.
Offset compensation not only corrects for small error
voltages in the measurement circuit, but it also compensates
for thermal voltages generated within the Model 2002.
Consequently, the use of offset compensation yields greater
accuracy.
The OFFSETCOMP selections are explained as follows:
ON: Enables offset compensation
OFF: Disables offset compensation
Offset compensated readings are indicated by “OCmp” to
the right of the reading.
V oltage drop: This display shows the v oltage drop across the
resistance under test. It is shown as follows:
Voltage Drop = 0.0000 mV
This voltage drop is determined by multiplying the source
current by the resistance and does not include voltage contributions from other current that may be flowing through the
resistance.
Lead Resistance: This display, available only for 4-wire
ohms, shows the value of the lead resistance that is being
nulled by using the Ω4 function. You can use the information
to decide if a 4-wire measurement is necessary. The display
is as follows:
Lead Resistance = 0.0000 Ω
If the lead resistance exceeds 1kΩ, the display is:
2-WIRE OHMS measurement overflow
2-31
Page 51

Front Panel Operation
2.4.4 Frequency
The Model 2002 can make frequency measurements from
1Hz to 15MHz through its INPUT HI and INPUT LO terminals, and from 1Hz to 1MHz through its AMPS and INPUT
LO terminals. The basic measurement procedure for FREQ
is contained in the Getting Started manual.
Trigger level
The frequency function has an adjustable trigger level. An
appropriate trigger level is needed for the frequency counter
to operate properly. The instrument only counts cycles with
peak amplitudes that reach the trigger level. For example, if
the trigger level is set for 5V, cycles with peak amplitudes
less than 5V are not counted.
If using AC+DC coupling, make sure the trigger level
accounts for the DC bias level. For e xample, if a 1V peak-topeak input signal is riding on a 5V DC bias level, a trigger
level of 5.5V is appropriate.
While the display is showing frequency measurements, the
RANGE ▲ and ▼ keys can be used to change the trigger lev-
el of the measurement.
Frequency configuration
The following information explains the various configuration options for frequency measurements. The configuration
menu is summarized in T able 2-22. This menu is accessed by
pressing CONFIG and then FREQ. Paragraph 2.3.5 summarizes the rules for navigating through the menus.
Note that a function does not have to be selected in order to
be configured. When the function is selected, it will assume
the programmed status.
MAX-SIGNAL-LEVEL
The maximum signal level is used to specify the maximum
expected peak input voltage or current level for frequency
measurements.
The following MAX-SIGNAL-LEVEL selections depend on
which input terminals are presently selected (see INPUTTERMINALS):
1V, 10V, 100V, 1000V or TTL: Sets the maximum signal
level for the voltage input terminals. Selecting the TTL
parameter configures the maximum signal level to 10V and
the trigger level to +0.8V.
Each press of a RANGE ▲ or ▼ key adjusts the trigger lev el
by 0.5% of the presently selected maximum signal level to a
maximum of 60% of the range. The AUTO RANGE key
returns the trigger level to 0V or 0mA. After pressing one of
the range keys, the present trigger level is momentarily
displayed. The trigger level is also available as a multiple
display.
See Table 2-21 for the trigger level ranges and increments.
Table 2-21
Trigger level range and increments
Trigger level
Maximum
signal level
1V
10V
100V
1000V
1mA
10mA
100mA
1A
Range Increment
-0.600 to +0.600V
-6.00 to +6.00V
-60.0 to +60.0V
-600 to +600V
-0.600mA to +0.600mA
-6.00mA to +6.00mA
-60.0mA to +60.0mA
-600mA to +600mA
0.005V
0.05V
0.5V
5V
0.005mA
0.05mA
0.5mA
5mA
1mA, 10mA, 100mA or 1A: Sets the maximum signal level
for the AMPS input terminals.
The MAX-SIGNAL-LEVEL setting is critical to the accuracy of frequency measurements. If the selected level is too
large, the input signal is not large enough to trigger the
instrument’s zero-crossing circuitry, and a 0mHz reading
results.
To verify the proper level, use the AC voltage or AC current
function to measure the rms value of the input signal. The
resultant reading indicates the best level to use. For e xample,
if the rms value is 2V, a maximum signal level setting of 10V
is appropriate. Note that the coupling used in the AC
measurement should match that used in the frequency
measurement.
RESOLUTION
The available display resolutions are 4 digits and 5 digits.
There is no auto resolution parameter on the frequency function.
4-DIGITS: Sets display resolution for frequency measurements to 4-digits.
5-DIGITS: Sets display resolution for frequency measurements to 5-digits.
2-32
Page 52

Table 2-22
CONFIGURE FREQUENCY menu structure
Menu item Description
Front Panel Operation
MAX-SIGNAL-LEVEL
1V, 10V, 100V, 1000V, TTL
1mA, 10mA, 100mA, 1A
RESOLUTION
4-DIGITS, 5-DIGITS
INPUT-TERMINALS
VOLTAGE
CURRENT
COUPLING
AC
AC+DC
Notes:
1. The maximum signal level menu is coupled to the input terminals menu, i.e., voltage le v els are shown if v oltage is the selected
input.
2. With the Model 1801 Nanovolt Preamp installed and enabled, the maximum signal level is fixed at 2mV.
Display maximum signal level menu:
Select maximum voltage level for voltage inputs.
Select maximum current level for current inputs.
Display resolution menu:
Select a specific resolution.
Input terminals for frequency measurements menu:
Select INPUT HI and INPUT LO terminals.
Select AMPS and INPUT LO terminals.
Coupling menu:
Select AC coupled measurements.
Select DC coupled measurements.
INPUT-TERMINALS
Both the volts and amps input terminals can be used to measure frequency. The upper limit on the voltage terminals is
15MHz; on the amps terminals it is 1MHz. The voltage limit
is subject to the 2 × 10⁷V•Hz product.
VOLTAGE: Specifies the voltage input terminals for frequency measurements.
CURRENT: Specifies the AMPS input terminals for frequency measurements.
• Period calculation
• Trigger level
The multiple display showing the period of the waveform is
calculated from the frequency measurement and, as such, is
only available when the frequency does not equal 0Hz. It is
also unavailable when math is enabled.
The trigger level multiple display is the same message that is
displayed when the trigger level is changed, but it is a permanent display.
COUPLING
This parameter selects the input coupling for the frequency
function.
AC: With AC coupling selected, a DC blocking capacitor is
placed in series with the AC measurement circuit. This removes the DC component from the input signal.
AC+DC: When AC+DC coupling is selected, the blocking
capacitor is removed. Subsequent FREQ measurements reflect both the AC and DC components of the signal.
Multiple displays
There are two multiple displays just for the frequency
function:
2.4.5 T emperature
The Model 2002 measures temperature with two different
sensor types: RTDs and thermocouples. With RTDs, the
Model 2002 can measure temperature between -200°C and
+630°C. RTDs can be connected to the input terminals or the
optional Model 2001-SCAN scanner card.
When using thermocouples, the instrument measures temperature over a range that is dependent on the thermocouple
type (refer to the specifications in Appendix A). Thermocouples can be connected to the Model 2001-TCSCAN card
(which plugs into the option slot of the Model 2002), or to an
external thermocouple card, such as a Model 7057A or 7402
installed in a Model 7001 or 7002 Switch System.
2-33
Page 53
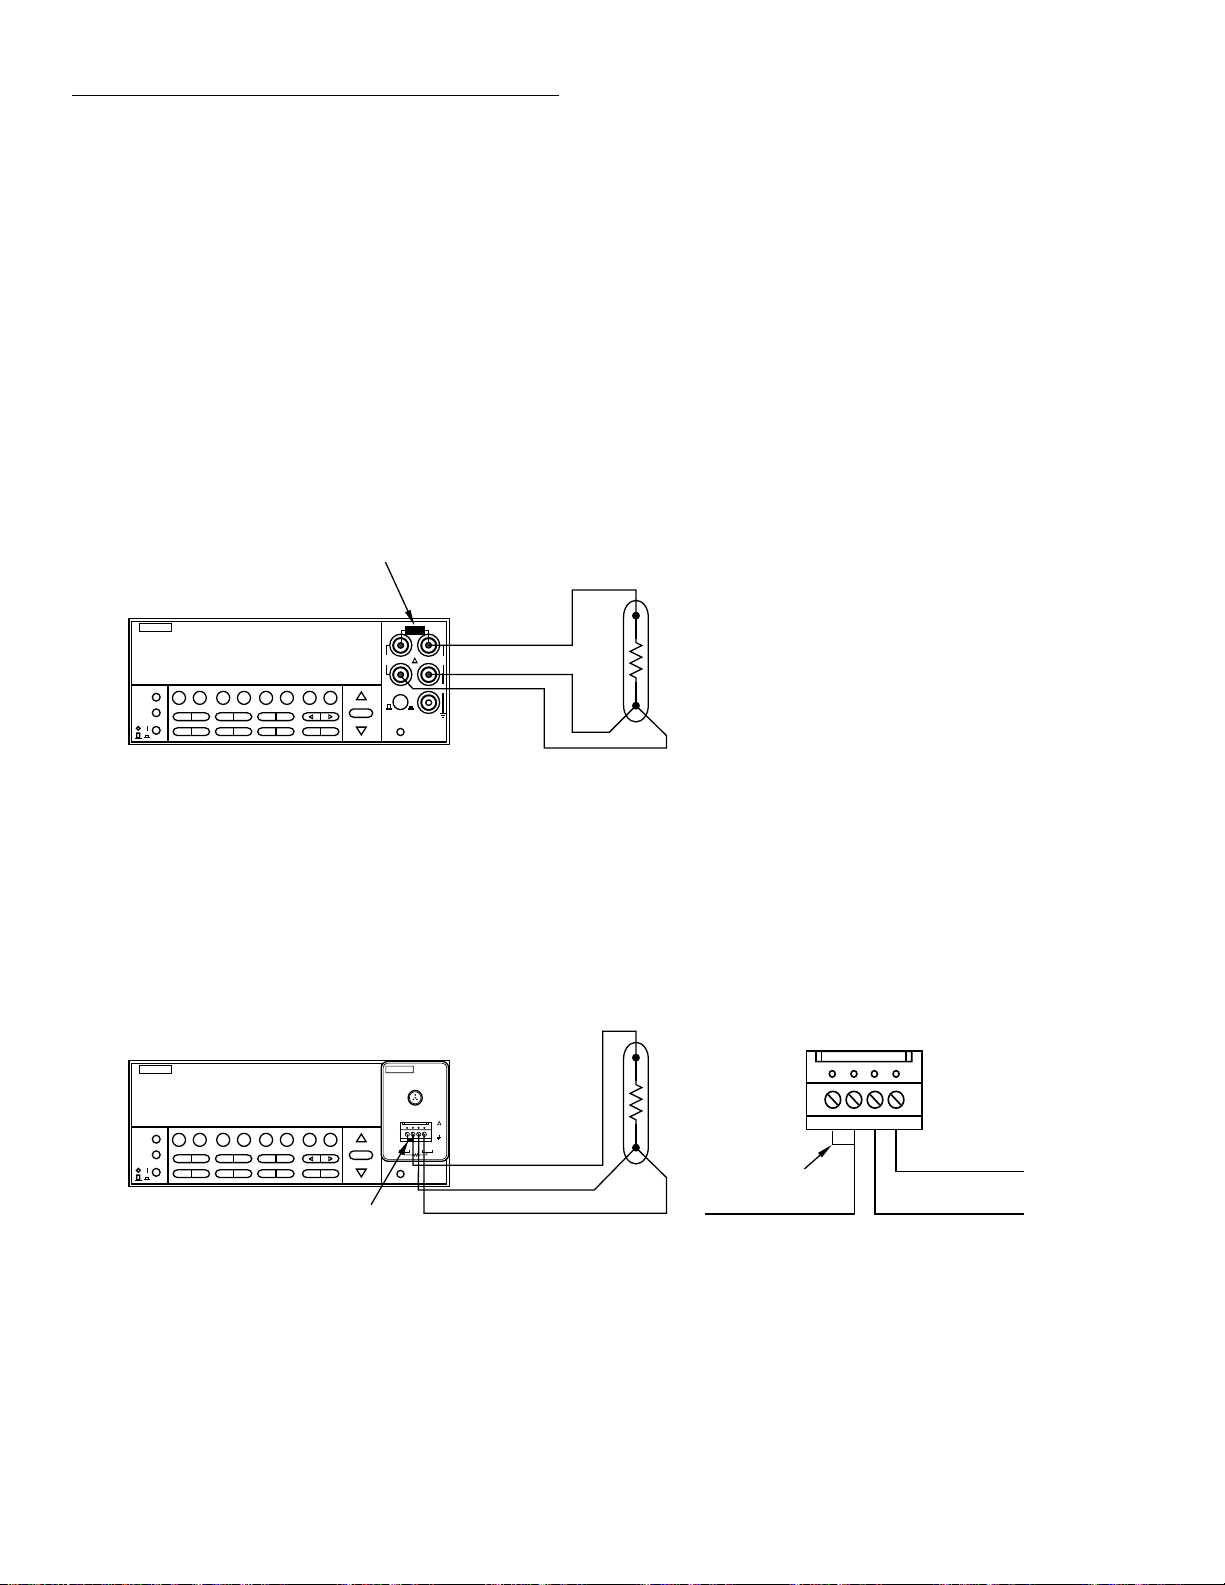
Front Panel Operation
Temperature measurements
The basic measurement procedure for 4-wire RTD temperature measurements is contained in the Getting Started manual. The procedure for measuring temperature with 3-wire and
2-wire RTDs is similar . Connection diagrams for these RTDs
are provided by Figures 2-9 and 2-10. Be sure that the temperature function is configured for the correct sensor type.
Use the 4-WIRE-RTD selection for a 3-wire RTD sensor.
If using the Model 2001-TCSCAN to make thermocouple
temperature measurements, refer to its instruction manual
for connection information and the measurement procedure.
If using the Model 7057A or 7402, connect the output of the
thermocouple card to INPUT HI and LO of the Model 2002
and refer to its instruction manual for operating information.
Short
Model 2002
+000.00 °C
4W-RTD type : PT385
PREV
DCV ACV DCI ACI Ω2 Ω4
DISPLAY
NEXT
REL TRIG STORE RECALL
POWER
INFO LOCAL CHAN SCAN CONFIG MENU EXIT ENTER
A. Connections to Banana Jacks
2002 MULTIMETER
FREQ TEMP
FILTER MATH
SENSE
INPUT
Ω 4 WIRE
HI
350V
PEAK
INPUTS
F
RANGE
FRONT/REAR
AUTO
RANGE
CAL
Input HI
1100V
PEAK
Input LO
LO
500V
PEAK
R
2A 250V
AMPS
The Models 7057A and 7402 use Channel 1 as the reference
junction, and must be configured on the Model 2002 for voltage references and offset.
Temperature configuration
The following information explains the various configuration options for temperature measurements. The configuration menu is summarized in Table 2-23. This menu is
accessed by pressing CONFIG and then TEMP. Paragraph
2.3.5 summarizes the rules for navigating through the menus.
Note that a function does not have to be selected in order to
be configured. When the function is selected, it will assume
the programmed status.
Platinum
RTD
Sense Ω4-wire LO
Model 2002
+000.00 °C
4W-RTD type : PT385
PREV
DCV ACV DCI ACI Ω2 Ω4
DISPLAY
NEXT
REL TRIG STORE RECALL
POWER
INFO LOCAL CHAN SCAN CONFIG MENU EXIT ENTER
B. Connections to Terminal Block
Figure 2-9
3-wire RTD temperature measurements
FILTER MATH
2002 MULTIMETER
FREQ TEMP
Short
RANGE
AUTO
RANGE
SENSE
8680
Ω 4 WIRE
HI
RTD PROBE ADAPTER
350V
PEAK
RANGE: -220°C TO 630°C
-360°F TO 1100°F
MADE
LO
IN
INPUTS
U.S.A.
F
R
HI
HI LO
SENSE
RTD
FRONT/REAR
CAL
INPUT
1100V
PEAK
42V
500V
PEAK
PEAK
LO
SENSE
2A 250V
Input HI
AMPS
Input LO
Sense Ω4-wire LO
WARNING : To avoid a shock hazard and possible
instrument damage, do not use the Model 8680 RTD
Probe Adapter to measure voltages exceeding 30V
RMS, 42.4V peak.
Platinum
RTD
Short
Input HI
1234
Sense Ω4-wire LO
Input LO
2-34
Page 54

Front Panel Operation
Model 2002
+000.00 °C
RTD type : PT385
PREV
DCV ACV DCI ACI Ω2 Ω4
DISPLAY
NEXT
REL TRIG STORE RECALL
POWER
INFO LOCAL CHAN SCAN CONFIG MENU EXIT ENTER
A. Connections to Banana Jacks
Model 2002
2002 MULTIMETER
FREQ TEMP
FILTER MATH
+000.00 °C
RTD type : PT385
PREV
DCV ACV DCI ACI Ω2 Ω4
DISPLAY
NEXT
REL TRIG STORE RECALL
POWER
INFO LOCAL CHAN SCAN CONFIG MENU EXIT ENTER
2002 MULTIMETER
FREQ TEMP
FILTER MATH
RANGE
AUTO
RANGE
RANGE
AUTO
RANGE
SENSE
INPUT
Ω 4 WIRE
HI
350V
PEAK
LO
INPUTS
F
R
FRONT/REAR
CAL
SENSE
8680
INPUT
Ω 4 WIRE
HI
RTD PROBE ADAPTER
350V
PEAK
RANGE: -220°C TO 630°C
-360°F TO 1100°F
MADE
LO
IN
INPUTS
U.S.A.
F
R
HI
HI LO
LO
SENSE
RTD
FRONT/REAR
CAL
1100V
2A 250V
AMPS
1100V
PEAK
SENSE
2A 250V
AMPS
PEAK
500V
PEAK
PEAK
42V
500V
PEAK
Input HI
Input LO
Input HI
Input LO
Platinum
RTD
WARNING : To avoid a shock hazard and possible
instrument damage, do not use the Model 8680 RTD
Probe Adapter to measure voltages exceeding 30V
RMS, 42.4V peak.
Platinum
RTD
1234
Input HI Input LO
B. Connections to Terminal Block
Figure 2-10
2-wire RTD temperature measurements
2-35
Page 55

Front Panel Operation
Table 2-23
CONFIG TEMPERATURE menu structure
Menu item Description
SENSOR
4-WIRE-RTD
PT100
D100
F100
USER
PT385
PT3916
SPRTD
RTD
PT100
D100
F100
USER
PT385
PT3916
SPRTD
THERMOCOUPLE
THERMOCOUPLE-TYPE
REF-JUNCTIONS
CONFIGURE
ACQUIRE-REF-TEMP
INTERNAL-TEMP
UNITS
DEG-C, DEG-F, K
Sensor type menu:
4-wire RTD type menu:
Select PT100 type.
Select D100 type.
Select F100 type.
Use to set R-zero, alpha, beta, delta.
Select PT385 type.
Select PT3916 type.
Select SPRTD type.
2-wire RTD type menu:
Select PT100 type.
Select D100 type.
Select F100 type.
Use to set R-zero, alpha, beta, delta.
Select PT385 type.
Select PT3916 type.
Select SPRTD type.
Thermocouple setup menu:
Select desired thermocouple type (J, K, T, E, R, S, B, N).
Configure reference junction menu (JCN1 thru JCN5):
Configure simulated or real junction.
Acquire reference temperature.
Select internal temperature transducer.
Temperature units menu:
Select desired temperature units.
SPEED
NORMAL
Measurement speed (integration time) menu:
Select 1 PLC (power line cycle, 16.67msec for 60Hz, 20msec for
50Hz and 400Hz).
FAST
MEDIUM
HIACCURACY
SET-SPEED-EXACTLY
SET-BY-RSLN
FILTER
AUTO
AVERAGING
AVERAGING-MODE
RESLN
AUTO
1°, 0.1°, 0.01°, 0.001°
Note: With the Model 1801 Nanovolt Preamp installed and enabled, the SENSOR menu item is used for differential thermocouple configuration.
Select 0.01 PLC.
Select 0.1 PLC.
Select 10 PLC.
Set integration time in PLC (0.01-50).
Default to setting appropriate for resolution.
Digital filter menu:
Default to filter appropriate for integration time.
Select simple average filter (1-100 readings).
Select moving average or repeating average mode.
Display resolution menu:
Default to resolution appropriate for sensor.
Select a specific resolution.
2-36
Page 56

Front Panel Operation
SENSOR
This parameter is used to select the temperature sensor.
4-WIRE-RTD or RTD: If using a 4-wire or 3-wire RTD
sensor, select 4-WIRE-RTD. If using a 2-wire RTD, select
RTD. Selecting an RTD sensor displays the options for RTD
standards. Five are configured for common RTDs and the
sixth allows you to enter your own RTD factors:
• PT100, D100, F100, PT385 and PT3916 — Selects the
following default parameters for the RTD standards:
RZero
Type Standard Alpha Beta Delta
PT100
D100
F100
PT385
PT3916
ITS-90
ITS-90
ITS-90
IPTS-68
IPTS-68
0.003850
0.003920
0.003900
0.003850
0.003916
0.10863
0.10630
0.11000
0.11100
0.11600
1.49990
1.49710
1.49589
1.50700
1.50594
( Ω at 0°C)
100.00000
100.00000
100.00000
100.00000
100.00000
• USER — This selection allows you to change one or
more of the RTD factors listed in the above table. The
equation using the factors are shown in Figure 2-11.
SPRTD: Choosing type SPRTD takes you to the SPRTD
COEFFICIENTS menu, which allows you to program the
following parameters:
R-ZERO: RTD 0˚C resistance value
A4: set A4 coefficient
B4: set B4 coefficient
A7: set A7 coefficient
B7: set B7 coefficient
C7: set C7 coefficient
The ITS-90 standard provides two reference equations for
Standard Platinum Resistance Thermometers covering the
temperature range 18.8033K to 1234.93K. A single SPRTD,
however, usually cannot be used to cover the entire range.
The temperature range is therefore broken up into several
subranges. These subranges depend on the calibration points
of the temperature scale and are based on the melting or triple points of various pure substances. For an exact list of the
elements needed and details on RTD calibration, refer to
NIST Technical Note 1265 "Guidelines For Realizing the
International Temperature Scale of 1990". In each subrange,
the calibration constants required for that range are listed.
An SPRTD as supplied from the manufacturer will come
with a certificate of calibration that lists the calibration
constants and the temperature range supported. In all cases
except subranges #4 and #7, translation of the supplied
coefficients to Model 2002 values will be required. In most
cases, this translation is done simply entering the A value
(for example) supplied with the SPRTD into the A4 position
(temperatures less than 0˚C) or A7 value (temperatures
above 0˚C) required by the Model 2002. The same procedure
is used for translating the B and, where applicable, C
constants.
The following table should be helpful in translating SPRTD
coefficients to Model 2002 SPRTD coefficients. The Model
2002 supports SPRTD temperatures between 83.805K and
933.473K. For any of the subranges below, only
temperatures within the range from 83.805K to 933.47K will
be measured.
Coefficients RTD coefficients to Model 2002 coefficients
Subrange #1: 13.8033K - 273.16K Not applicable
Subrange #2: 24.5561K - 273.16K A2 to A4, B2 to B4
Subrange #3: 54.3584K - 273.16K A3 to A4, B3 to B4
Subrange #4: 83.8058K - 273.16K No substitution needed
Subrange #5: 234.3156K - 302.9146K A5 to A4, A5 to A7, B5 to B4
B5 to B7, Set C7 = 0. A5 value entered for both
A4 and A7; B5 value entered for both B4 and B7
Subrange #6: 273.15K - 1234.93K Not applicable
Subrange #7: 273.15K - 933.473K No substitution needed
Subrange #8: 273.15K - 692.677K A8 to A7, B8 to B7, Set C7 = 0
Subrange #9: 273.15K - 505.078K A9 to A7, B9 to B7, Set C7 = 0
Subrange #10: 273.15K - 429.7485K A10 to A7, B10 to B7, Set C7 = 0
Subrange #11: 273.15K - 302.9146K A11 to A7, Set B7 = 0, C7 = 0
2-37
Page 57

K:
Front Panel Operation
Measurement Example: Suppose you are using an SPRTD
that has been calibrated for subrange #2 above, in which case
the RTD is calibrated for measurements between 24.5561
and 273.16K. The Model 2002, however, supports only
SPRTD temperatures down to 83.805K, so temperatures
below this value will be reported as an ov erflo w e v en though
the SPRTD is capable of measuring lower. The calibration
certificate lists A2, B2, C1, C2, and C3 as the calibration
coefficients. You can set up the Model 2002 for this measurement as follows:
1. Set the temperature sensor type to be FRTD (4-wire
measurement) from the CONFIG/TEMP/SENSOR/
TYPE menu.
2. Choose the SPRTD RTD type using the CONFIG/
TEMP/SENSOR/TYPE/FRTD/SPRTD menu.
3. From the SPRTD COEFFICIENTS menu, set the RTD
0˚C resistance value and the following coefficients:
• Set the Model 2002 A4 coefficient to the R TD certificate A2 value.
• Set the Model 2002 B4 coefficient to the RTD certificate B2 value.
Note that the A7, B7, and C7 values will not be used for this
sensor.
4. Switch to the temperature function, and begin taking
readings.
THERMOCOUPLE: Select THERMOCOUPLE when
using the Model 2001-TCSCAN (installed in the option slot
of the Model 2002), or an external thermocouple scanner
card (Model 7057A or Model 7402).
• THERMOCOUPLE-TYPE — This menu is used to
select the type of thermocouple that you are going to
use. Select one of the following thermocouple types:
J, K, T, E, R, S, B, or N
• REF-JUNCTION — Typically, a thermocouple card
uses a single reference junction. This menu item is used
to select one of the five following reference junctions
for further configuration:
JCN1, JCN2, JCN3, JCN4 or JCN5 — After choosing
one of these reference junctions you can configure it
further or acquire a reference temperature.
• CONFIGURE — This menu item displays the con-
figuration menu for the selected reference junction.
SIMULATED-TEMP — This option allows you to
enter a default temperature. Typical reference junction temperatures are 0°C and 23°C. Note the reference junction temperature is shown in the units
selected by the SET TEMP UNITS menu.
REAL-JUNCTION — This option lets you enter values for a temperature coefficient for the selected ref-
erence junction (in mV/°C) and an offset voltage (in
mV at 0°C). Consult the thermocouple card manual
for correct configuration.
• ACQUIRE-REF-TEMP — This option updates the
stored reference temperature used for generating a
temperature measurement. If the junction type (JCN)
is simulated, the defined simulated junction temperature is used. If the junction type is real, you must
manually close that channel from the scanner before
acquiring the temperature.
INTERNAL-TEMP: This option of the TEMP SENSOR
TYPE menu is used to select the internal temperature transducer. With this selection, the internal temperature dif ference
from the calibration temperature of the Model 2002 will be
displayed when the TEMP function is selected.
For T < 0°C:
RTR01ATBT2CT3T-100()++ +[]=
For 0°C < T < 630°C:
R
R01ATBT
T
++()=
2
Where:
A α 1
=
B αδ 10
C αβ 10
-------- -+
100
-4
•–=
-8
•–=
δ
Above 0°C, the equation solves faster by applying:
2
- 4B 1 -
A
–
A +
---------------------------------------------------------=
T
2B
R
T
------ -
R
0
Below 0°C, it is an iterative solution and it runs slower.
Figure 2-11
Temperature equations
UNITS
This parameter selects the displayed units for temperature
measurements.
DEG-C: Displays temperature measurement units in °C.
DEG-F: Displays temperature measurement units in °F.
Displays temperature measurement units in K (Kelvin).
2-38
Page 58

Front Panel Operation
There is a multiple display for the temperature function that
shows the reading expressed in all three temperature units.
SPEED
The SPEED parameter sets the integration time of the A/D
converter , the period of time the input signal is measured (also known as aperture). It is discussed in paragraph 2.4.1, DC
and AC voltage. Only the differences for temperature are
noted here.
SET-BY-RSLN: This parameter optimizes the integration
time for the present resolution setting. The defaults for setby-resolution integration times of temperature are listed in
Table 2-24.
Table 2-24
Temperature integration time set-by-resolution
Resolution
degrees
1 degree
0.1 degree
0.01 degree
0.001 degree
Note: If the integration time is SET-BY-RSLN and the resolution
AUTO, the integration time will be 1.0 PLC and the resolution
set by sensor.
Resolution
digits
3.5d
4.5d
5.5d
6.5d
Integration
time
1.0 PLC
1.0 PLC
1.0 PLC
1.0 PLC
RESLN
Resolution for temperature is not expressed in number of
digits, but in fractions of a degree, ranging from 1° to 0.001°.
AUTO: Display resolution is dictated by temperature sensor
type. Table 2-25 lists the resolution for the various sensor
types.
1°, 0.1°, 0.01°, or 0.001°: Sets display resolution for TEMP.
Table 2-25
Temperature auto resolution
Resolution
Sensor
RTDs 2-, 3-, or 4-wire
Thermocouples J, K, T, E
Thermocouples R, S, B, N
Note: If the resolution is AUTO and the integration time SET-BYRSLN, the integration time will be 1.0 PLC.
Degree Digits
0.01
0.1
1
5.5d
4.5d
3.5d
Multiple displays
The available multiple displays for temperature depend on
the presently selected sensor type, except for the multiple
display that shows temperature in three different units:
FILTER
FILTER lets you set the digital filter response. The filter
menu is available from the function configuration menus (i.e.
CONFIG TEMPERATURE) or by pressing CONFIGURE
FIL TER with the desired function already selected. All of the
parameters (menu items) for FILTER are explained in paragraph 2.9. Since the AUTO parameter has specific effects on
TEMP, it is covered here.
The advanced filter is not av ailable for the temperature function.
AUTO: This parameter for a digital filter optimizes its use
for the present measurement function. The defaults for automatic filtering of temperature are as follows:
Averaging
State Type Readings Mode
On Averaging 10 Moving
+0000.0 °C
+0000.0 °F +0000.0 K
RTD measurements have a multiple display for the resistance of the RTD, such as:
RTD Resistance = +0.0000 Ω
Thermocouple measurements have multiple displays for the
thermocouple voltage and reference junction temperature.
Sample displays are:
Thermocouple Voltage = 0.0000mV
Reference junction = 00.0 °C
Note that the reference junction temperature is shown in the
units selected by the SET TEMP UNITS menu. The display
of two blinking question marks at the right of the reference
junction temperature indicates an overflow of the reference
junction measurement. Thermocouple measurements will be
made normally using the existing reference temperature
value.
2-39
Page 59

Front Panel Operation
2.5 Range
The selected measurement range affects both the ultimate
resolution and accuracy of the measurements as well as the
maximum signal that can be measured. The range setting
(fixed or auto) for each measurement function is saved when
changing functions.
2.5.1 Display resolution
The display resolution of a Model 2002 reading depends on
the selected range and the resolution setting. The default and
maximum display resolutions for every range on each function are included in the specifications of Appendix A.
You can set the display resolution, as described in paragraph
2.4.
2.5.2 Maximum readings
The full scale readings for every range on each function are
included in the specifications of Appendix A. Input values
more than the maximum reading listed cause the “Overflow”
message to be displayed.
2.5.3 Manual ranging
To select a manual range, simply press the RANGE ▲ or ▼
key. The instrument changes one range per key press. The
selected range is displayed on the bottom line of the display.
If the instrument displays the “Overflow” message on a particular range, select a higher range until an on-range reading
is displayed. Use the lowest range possible without causing
an overflow to ensure best accuracy and resolution.
Note that the frequency and temperature functions have just
one range. For the frequency functions, the RANGE ▲ and
keys increase and decrease the trigger level by 0.5%. On
temperature the keys have no effect.
Note that up-ranging occurs at 105% of range, while downranging occurs at 10% of range.
To cancel autoranging, press AUTO or the RANGE ▲ or ▼
key. Pressing AUTO to cancel autoranging leaves the instrument on the present range.
Pressing the RANGE ▼ key when the instrument has autoranged to the lowest range displays the following momentary
typical message and leaves the instrument in autorange:
Range at minimum: 200 mVDC
The instrument operates similarly if the RANGE ▲ key is
pressed when the instrument has autoranged to the highest
range.
For the frequency function, pressing the AUTO key returns
the trigger level to 0.0V. The AUTO key has no effect in the
temperature function.
2.6 Relative
The rel (relative) operation subtracts a reference value from
actual readings. When rel is enabled by the REL key, the instrument uses the present reading as a relative value. Subsequent readings will be the difference between the actual
input value and the rel value. Y ou can also enter and enable a
relative value from the CONFIG-REL display (see paragraph 2.6.1).
A rel value can be established for each measurement function. The state and value of rel for each measurement function are saved when changing functions.
Once a rel value is established for a measurement function,
the value is the same for all ranges. For example, if 150V is
set as a rel value on the 200V range, the rel is also 150V on
the 1000V, 20V, 2V, and 200mV ranges.
▼
2.5.4 Autoranging
To enable autoranging, press the AUTO key. The AUTO
annunciator turns on when autoranging is selected. While
autoranging is selected, the instrument automatically
chooses the best range to measure the applied signal.
NOTE
Autoranging should not be used when optimum speed is required.
2-40
A relative value can be as large as the highest range for the
particular function. T able 2-26 lists the allo wable range of rel
values for each function.
Selecting a range that cannot accommodate the rel value
does not cause an overflow condition, but it also does not
increase the maximum allowable input for that range. For
example, on the 2mA range, the Model 2002 still overflows
for a 2.1mA input.
Page 60

Table 2-26
rel'd reading = actual value - relative value
displayed reading = math operation (rel'd reading)
Allowable rel values
Front Panel Operation
When rel is enabled, the resulting reading is the algebraic
difference between the actual input value and the rel value:
Function Rel range
DC voltage
AC voltage
DC current
AC current
2-wire
resistance
4-wire
resistance
Frequency
Temperature
-1.1e3 to +1.1e3
-7.75e2 to +7.75e2
-1.2e1 to +1.2e1
-2.1e0 to +2.1e0
0 to +1.05e9
0 to +2.1e6
0 to +1.5e7
-3.28e2 to +3.31e3
(±1100V)
(±775V)
(±12A)
(±2.1A)
(0 to 1.05GΩ)
(0 to 2.1MΩ)
(0 to 15MHz)
(-328 to +3310°)
2.6.1 Configuring rel
Pressing CONFIGURE REL displays the rel value for the
present measurement function. You can change the rel value
using the cursor keys ( and ) and the RANGE ▲ and
▼ keys. When ENTER is pressed, the instrument returns to
the measurement display state with that value of rel enabled.
If you try to enter an invalid rel value, a message indicating
the rel limit will be displayed and the rel operation will be
cancelled.
Previously stored rel values are converted if temperature or
AC voltage units are changed. For example, a rel value of
100 that was stored with units of DEG-C is converted to 212
if temperature units are changed to DEG-F.
Note that a bench or GPIB reset clears any stored rel values
and disables rel for all functions.
With math enabled, the rel’d reading is acted on by the math
operation:
A rel value expressed in dB or dBm is applied after the reading is referenced to the selected level.
2.6.3 Multiple display of rel
One of the “multiple displays” allows you to view the reading without rel applied on the bottom line of the display and
the rel’d reading on the top line. The display is available by
repeatedly pressing either the NEXT or PREVious DISPLAY key to scroll through the multiple displays of the particular function. The following is a typical message for a rel
multiple display:
+000.012 mVAC RMS
Actual=+001.012 (without REL)
2.7 T riggers
The following paragraphs discuss front panel triggering,
trigger configuration, and external triggering, including example setups.
Model 2002 triggers are set up in the CONFIGURE TRIGGER menu. The menu structure is shown and summarized in
Table 2-27. Some general rules to navigate menus are given
in paragraph 2.3.4.
2.6.2 Enabling rel
From the normal reading display, the REL k ey toggles the rel
operation on and off. Each time rel is enabled by the REL
key, the present reading becomes the new rel value for that
function. You cannot rel an overflow reading.
To make a new reading the rel value, rel must first be disabled and then enabled again. Disabling rel does not clear
any stored rel value.
2.7.1 T rigger model
The following information describes triggering of the Model
2002 from the front panel. The flowchart of Figure 2-12 summarizes front panel triggering. It is called the Trigger Model
because it is patterned after the SCPI commands sent over
the IEEE-488 bus to control triggering.
2-41
Page 61

Front Panel Operation
Table 2-27
CONFIGURE TRIGGER menu structure
Menu item Description
MEASURE
SOURCE
IMMEDIATE
EXTERNAL
MANUAL
GPIB
TRIGLINK
TIMER
HOLD
DELAY
COUNT
INFINITE
ENTER-CHAN-COUNT
CONTROL
SOURCE
ACCEPTOR
SCAN
SOURCE
IMMEDIATE
EXTERNAL
MANUAL
GPIB
TRIGLINK
TIMER
HOLD
DELAY
COUNT
INFINITE
ENTER-SCAN-COUNT
CONTROL
SOURCE
ACCEPTOR
Measure layer menu:
Select measure source:
Use to make measurements immediately.
Use external triggers to control measuring.
Use TRIG key to control measuring.
Use bus triggers to control measuring.
Use Trigger Link triggers to control measuring. Enter Trigger Link mode and
lines.
Use a timer to control measuring and enter interval between triggers (0.001-
999999.999sec.).
Use to hold up the measurement in the measure layer.
Use to delay measurement in the measure layer (0.001-999999.999sec.).
Define number of measurements to make:
Repeat measuring indefinitely.
Count = use defined value (1-99999).
Select trigger control mode:
Enable Source Bypass.
Disable Source Bypass.
Scan layer menu:
Select scan source:
Use to pass operation immediately into the measure layer.
Use external triggers to control scanning.
Use TRIG key to control scanning.
Use bus triggers to control scanning.
Use Trigger Link triggers to control scanning. Enter Trigger Link lines.
Use a timer to control scanning and enter interval between scans (0.001-
999999.999sec.).
Use to hold up the measurement in the scan layer.
Use to delay scan in the scan layer (0.001-999999.999sec.).
Define number of scans to be performed:
Repeat scanning indefinitely.
Count = user defined value (1-99999).
Select trigger control mode:
Enable Source Bypass.
Disable Source Bypass.
2-42
Page 62

Table 2-27
CONFIGURE TRIGGER menu structure (cont.)
Menu item Description
Front Panel Operation
ARM
SOURCE
IMMEDIATE
EXTERNAL
MANUAL
GPIB
TRIGLINK
RT-CLOCK
HOLD
COUNT
INFINITE
ENTER-ARM-COUNT
CONTROL
SOURCE
ACCEPTOR
HALT Use to halt triggers. Press TRIG key to resume triggering.
Arm layer menu:
Select arm source:
Use to arm meter immediately and pass operation into the scan layer.
Use external triggers to arm meter.
Use TRIG key to arm meter.
Use bus triggers to arm meter.
Use Trigger Link triggers to arm meter. Enter Trigger Link lines.
Use clock to arm meter. Enter time and date.
Use to hold up the measurement in the arm layer.
Define number of times to arm meter:
Continuously re-arm meter.
User defined count value (1-99999).
Select trigger control mode:
Enable Source Bypass.
Disable Source Bypass.
2-43
Page 63

Front Panel Operation
Halt triggers,
enable scanning or
burst mode
Idle
Arm Layer
(Arm Layer 1)
Idle
TRIG (or SCAN)
Arm Trigger Control = Source
(Source Bypass Enabled)*
Yes
No
Another
Arm
?
Arm Count
Scan Layer
(Arm Layer 2)
Measure Layer
(Trigger Layer)
Control
Source
Immediate
External
Manual
GPIB
Triglink
RT-Clock
Hold
Control
Source
Immediate
External
Manual
GPIB
Triglink
Timer
Hold
Scan Delay
Arm Event
Detection
Scan Trigger Control = Source
(Source Bypass Enabled)*
Scan Event
Detection
Delay
Measure Trigger Control = Source
(Source Bypass Enabled)*
Yes
Yes
No
No
Output
Trigger
Yes
Source
Bypass
Enabled
?
No
Another
Scan
?
Output
Trigger
Yes
Source
Bypass
Enabled
?
No
Another
Measure
?
Scan Count
Measure Count
Control
Source
Immediate
External
Manual
GPIB
Triglink
Timer
Hold
Measure Delay
Figure 2-12
Trigger model (front panel operation)
2-44
Measure Event
Detection
Delay
* Take bypass path the first time a layer is entered
Device
Action
Output
Trigger
Page 64

Front Panel Operation
Idle
The instrument is considered to be in the idle state whenever
it is not operating within one of the three layers of the Trigger
Model. The front panel ARM indicator is off when the instrument is in the idle state. While in the idle state, the instrument
cannot perform any measurement or scanning functions.
From the front panel there are four ways to put the instrument into idle:
• Select RESET GPIB from the SAVESETUP option of
the main menu. Press the TRIG key to take a reading.
After each reading, the instrument returns to the idle
state.
• Select HAL T from the CONFIGURE TRIGGER menu.
Press the TRIG key to resume triggering.
• Enable BURST-MODE from the CONFIGURE DATA
STORE menu. This places the instrument in idle until
the TRIG key is pressed. After each burst acquisition
the instrument returns to idle.
• Configure an internal or external scan with the SCAN
key. Disabling the scan resumes triggering.
Trigger Model Layers
As can be seen in Figure 2-12, the trigger model uses three
layers: the Arm Layer, Scan Layer and Measure Layer. For
IEEE-488 bus operation, these layers are known as Arm Layer 1, Arm Layer 2 and the Trigger Layer.
Once the Model 2002 is taken out of the idle state, operation
proceeds through the layers of the trigger model down to the
device action where a measurement occurs.
• Timer — Event detection is immediately satisfied on
the initial pass through the layer. Each subsequent
detection is satisfied when the programmed timer interval (1 to 999999.999 seconds) elapses. A timer resets to
its initial state when operation loops back to a higher
layer (or idle). Note that a timer is not available in the
Arm Layer.
• External — Event detection is satisfied when an input
trigger via the EXTERNAL TRIGGER connector is
received by the Model 2002.
• Triglink — Event detection is satisfied when an input
trigger via the TRIGGER LINK is received by the
Model 2002.
• Hold — W ith this selection, ev ent detection is not satisfied by any of the above control source e vents and oper ation is held up.
Source Bypasses — As can be seen in the flowchart, each
layer has a path that allows operation to loop around the control source. Each path is called a source bypass.
When a source bypass is enabled, and the external or trigger
link (triglink) control source is selected, operation loops
around the control source on the initial pass through the layer. If programmed for another event detection in the layer,
the bypass loop will not be in effect though it is still enabled.
The bypass loop resets (be in effect) if operation loops back
to a higher layer (or idle).
In the Arm Layer and Scan Layer, enabling a source bypass
also enables the respective output trigger . In the Trigger Layer, its output trigger is always enabled and occurs after e v ery
device action. See Output Triggers for more information.
Control Sources — In general, each layer contains a control
source which holds up operation until the programmed event
occurs. The control sources are described as follows:
• Immediate — With this control source selected, event
detection is immediately satisfied allowing operation to
continue.
• Manual — Event detection is satisfied by pressing the
TRIG key. Note that the Model 2002 must be taken out
of remote before it will respond to the TRIG key. Pressing LOCAL or sending LOCAL 716 over the bus takes
the instrument out of remote.
• GPIB — Event detection is satisfied when a bus trigger
(GET or *TRG) is received by the Model 2002.
• RT-Clock — Event detection in the Arm Layer is satisfied when the programmed time and date occurs. The
real-time clock control source is not available in the
Scan Layer and Measure Layer.
Delays — The Scan Layer and the Measure Layer have a
programmable delay (0 to 999999.999 seconds) that is enforced after an event detection.
Device Action — The primary device action is a measure-
ment. However, the device action could include a function
change and a channel scan (if scanner is enabled). A channel
is scanned (closed) before a measurement is made. When
scanning internal channels, the previous channel opens and
the next channel closes (break-before-make). Also included
in the device action is the internal settling time delay for the
relay.
Output Triggers — In the Arm Layer and Scan Layer the
output triggers are enabled only if their respective source bypasses are also enabled. If a trigger link (triglink) control
source is selected, the output trigger pulse is available on the
selected TRIGGER LINK output line. For all other control
2-45
Page 65

Front Panel Operation
source selections, the trigger pulse is available at the
METER COMPLETE connector.
In the Measure Layer, the output trigger is always enabled
and occurs after every device action. If the control source is
set for external, immediate, manual, GPIB or timer, the output trigger pulse is available at the METER COMPLETE
connector. If the trigger link (triglink) control source is
selected, output trigger action occurs on the selected TRIGGER LINK output line as follows:
• If the asynchronous Trigger Link mode is selected, the
output trigger pulse is available on the programmed
output line.
• If the semi-synchronous Trigger Link mode is selected
and the source bypass is disabled, the Trigger Link line
is released (goes high).
• If the semi-synchronous Trigger Link mode is selected
and the source bypass is enabled, the Trigger Link line
is pulled down low and then released.
Counters — All three layers use programmable counters
which allow operation to return to or stay in the respective
layer. F or example, programming the Measure Layer counter
for infinity keeps operation in the Measure Layer. After each
device action and subsequent output trigger, operation loops
back to the Trigger Layer control source. A counter resets
when operation loops back to a higher layer (or idle).
2.7.2 Configuring the measure layer
IMMEDIATE: With this selection, events (such as TIMER
and EXTERNAL triggers) do not control the measurement
interval. Once the Model 2002 starts measuring, it will take
readings as fast as its measurement configuration allows.
EXTERNAL: With this selection, external triggers are used
to control the measure source. Each trigger stimulus applied
to the Model 2002 performs a device action, as defined by
the trigger model. In addition to a measurement, this may
include range changing, filtering, calculations, data storing,
scanning, and other operations.
The external trigger is applied to the rear panel “EXTERNAL TRIGGER” BNC connector. See paragraph 2.7.6 for
detailed information on external triggering.
NOTE
The front panel TRIG key (see MANUAL) is active with external triggering selected. Pressing the TRIG key performs a
device action.
MANUAL: With this selection, the front panel TRIG key
controls the measure source. A device action is performed
when the TRIG key is pressed.
NOTE
The front panel TRIG key is active when
EXTERNAL, GPIB, TRIGLINK, or TIMER is selected.
The measure layer is used for the following operations:
• T o select the measuring ev ent (SOURCE) for the instrument.
• To delay operation in the measure layer.
• To designate the number of measurements the instrument will make (COUNT).
• To enable or disable the Source Bypass.
The measure layer is configured from the MEASURE item
of the CONFIGURE TRIGGER menu, which is displayed
by pressing the CONFIG key and then the TRIG ke y. General rules for navigating through the menu structure one contained in paragraph 2.3.4.
SOURCE
This menu item selects the event that controls the measure
source.
GPIB: With this selection, bus triggers control the measure
source. When the Model 2002 receiv es a bus trigger (GET or
*TRG), it performs a device action, as defined by the trigger
model. In addition to a measurement, this may include range
changing, filtering, calculations, data storing, scanning, and
other operations. See Section 3 for detailed information on
bus triggers.
NOTE
The front panel TRIG key (see MANUAL) is active with bus triggering selected.
Pressing the TRIG key performs a device
action.
TRIGLINK: With this selection, the measure source is con-
trolled by the Trigger Link of the Model 2002. Trigger Link
is an enhanced trigger system that uses up to six lines to
direct trigger pulses to and from other instruments.
2-46
Page 66

Front Panel Operation
When the Model 2002 receives a trigger over the Trigger
Link, it performs a device action, as defined by the trigger
model. In addition to a measurement, this may include range
changing, filtering, calculations, data storing, scanning, and
other operations.
See paragraph 2.7.7 for details on using the Trigger Link.
NOTE
The front panel TRIG key (see MANUAL) is active with the Trigger Link
selected. Pressing the TRIG key performs
a device action.
After selecting TRIGLINK as the measurement event, select
one of the following trigger link modes:
• ASYNCHRONOUS — The asc ynchronous trigger link
mode is used for trigger configurations that require
input and output triggers to be routed on separate lines.
After selecting this trigger link mode, you will be
prompted to select an input line and then an output line.
Note that you cannot use the same trigger line for both
input and output.
• SEMI-SYNCHRONOUS — In this mode, the input and
output triggers for the Model 2002 are assigned to the
same line. After selecting this trigger link mode, you
will be prompted to select the trigger line.
TIMER: Use the timer to control the time interval between
measurements.
HOLD: When HOLD is selected, the measure source is sup-
pressed. As a result, measuring is stopped and does not continue until HOLD is cancelled by selecting one of the other
measure source selections. Select HOLD from the SELECT
MEASURE SRC menu by placing the cursor on HOLD and
pressing ENTER. The instrument returns to the SETUP measure layer menu.
DELAY
This delay is used to hold up operation in the measure layer.
After the measure event occurs, the instrument waits until the
delay period times out (0 - 999999.999sec) before performing a device action.
COUNT
With this selection, you determine the number (count) of
measurements per scan sequence. The user programmed
count can be smaller, equal to, or larger than the number of
channels in the scan list. For example, if the scan list is made
up of four channels, you can program a count of 12. W ith this
count value, the instrument repeats the scan three times. An
advantage of repeating channels (rather than scans) is that
delays in the scan layer of operation are avoided. The measure delays among all 12 channels are the same.
INFINITE: Use this selection to continuously repeat mea-
surements (and looping in the measure layer).
ENTER-CHAN-COUNT: With this selection, the user
determines the number of readings per scan. You can program the Model 2002 to measure up to 99999 times.
The timer can be set for an interval from 0.001 seconds
(1msec) to 999999.999 seconds with 1msec resolution.
After a measurement is triggered to start, the next measurement starts at the end of the programmed timer interval. If
however, the programmed timer interval is shorter than the
time it takes to complete a single measurement, the next
measurement does not start until the previous one is done.
NOTE
The front panel TRIG key (see MANUAL) is active with the timer selected.
Pressing the TRIG key after the completion of a measurement starts the next measurement (assuming the Model 2002 is
programmed for another measurement;
see COUNT).
CONTROL
Use this menu item to enable or disable the source bypass.
The source bypass is used to bypass the measure event on the
first pass through the measure layer.
SOURCE: With this selection, the source bypass is enabled.
The measure event will be bypassed on the first pass through
the scan layer. This allows operation to proceed to the Delay
and Device Action without having to wait for the programmed event.
ACCEPTOR: With this selection, the source bypass is
disabled.
2-47
Page 67

Front Panel Operation
2.7.3 Configuring the scan layer
The scan layer is used for the following operations:
• To select the scanning event (SOURCE) for the instrument.
• To delay operation in the scan layer.
• To designate the number of scan sequences the instrument will perform (COUNT).
• To enable or disable the Source Bypass.
The scan layer is configured from the SCAN item of the
CONFIGURE TRIGGER menu, which is displayed by
pressing the CONFIG key and then the TRIG key. General
rules for navigating through the menu structure is contained
in paragraph 2.3.4.
SOURCE
This menu item selects the event that controls the scan
source.
IMMEDIATE: With this selection, operation passes imme-
diately into the measure layer.
EXTERNAL: With this selection, external triggers are used
to control the scan source. A trigger stimulus applied to the
Model 2002 passes operation into the measure layer. The
external trigger is applied to the rear panel “EXTERNAL
TRIGGER” BNC connector. See paragraph 2.7.6 for
detailed information on external triggering.
NOTE
The front panel TRIG key (see MANUAL) is active with external triggering
selected. Pressing the TRIG key passes
operation into the measure layer.
MANUAL: With this selection, the front panel TRIG key
controls the scan source. Operation passes into the measure
layer when the TRIG key is pressed.
NOTE
The front panel TRIG key is active when
EXTERNAL, GPIB, TRIGLINK, or
TIMER is selected.
GPIB: With this selection, bus triggers control the scan
source. Operation passes immediately into the measure layer
when a bus trigger (GET or *TRG) is received by the Model
2002. See Section 3 for detailed information on bus triggers.
NOTE
The front panel TRIG key (see MANUAL) is active with bus triggering
selected. Pressing the TRIG key passes
operation into the measure layer.
TRIGLINK: With this selection, the scan source is controlled by the Trigger Link of the Model 2002. Trigger Link
is an enhanced trigger system that uses up to six lines to
direct trigger pulses to and from other instruments. Operation passes into the measure layer when the Model 2002
receives a trigger ov er the Trigger Link. See paragraph 2.7.7
for details on using the Trigger Link.
NOTE
The front panel TRIG key (see MANUAL) is active with the Trigger Link
selected. Pressing the TRIG key passes
operation into the measure layer.
After selecting TRIGLINK, you will be prompted to select
an input line and then an output line. Note that you cannot
use the same trigger line for both input and output.
TIMER: Use the timer feature to control the time interval
between scan sequences when scanning. The timer can be set
for an interval from 0.001 seconds (1msec) to 999999.999
seconds with 1msec resolution.
After a scan sequence is triggered to start, the next scan
sequence starts at the end of the programmed timer interval.
If however , the programmed timer interv al is shorter than the
time it takes to complete a single scan sequence, the next
scan sequence does not start until the previous one is done.
NOTE
The front panel TRIG key (see MANUAL) is active with the timer selected.
Pressing the TRIG key after the completion of a scan sequence starts the next scan
sequence (assuming the Model 2002 is
programmed for another scan sequence;
see COUNT).
HOLD: When HOLD is selected, the scan source is sup-
pressed. As a result, operation does not pass into the measure
layer until HOLD is cancelled by selecting one of the other
scan source selections. Select HOLD from the SELECT
SCAN SOURCE menu by placing the cursor on HOLD and
pressing ENTER. The instrument returns to the SETUP
SCAN LAYER menu.
2-48
Page 68

Front Panel Operation
DELAY
This delay is used to hold up operation in the scan layer.
After the scan event occurs, the instrument waits until the
delay period times out (0 to 999999.999sec) before proceeding to the measure layer.
COUNT
This menu item defines the number of times operation
returns to the scan layer.
INFINITE: Use this selection to continuously return opera-
tion to the scan layer.
ENTER-SCAN-COUNT: With this selection, the user
determines the number of times operation returns to the scan
layer. You can program the Model 2002 to scan up to 99999
times.
CONTROL
Use this menu item to enable or disable the source bypass.
The source bypass is used to bypass the scan event on the
first pass through the scan layer.
SOURCE: With this selection, the source bypass is enabled.
The scan event will be bypassed on the first pass through the
scan layer. This allows operation to proceed into the measure
layer without having to wait for the programmed event.
ACCEPTOR: With this selection, the source bypass is
disabled.
IMMEDIATE: With this selection, operation passes imme-
diately into the scan layer.
EXTERNAL: With this selection, external triggers are used
to control the arm source. A trigger stimulus applied to the
Model 2002 passes operation into the scan layer. The external trigger is applied to the rear panel “EXTERNAL TRIGGER” BNC connector. See paragraph 2.7.6 for detailed
information on external triggering.
NOTE
The front panel TRIG key (see MANUAL) is active with external triggering
selected. Pressing the TRIG key passes
operation into the scan layer.
MANUAL: With this selection, the front panel TRIG key
controls the arm source. Operation passes into the scan layer
when the TRIG key is pressed.
NOTE
The front panel TRIG key is active when
EXTERNAL, GPIB, or TRIGLINK is
selected.
GPIB: With this selection, bus triggers control the arm
source. Operation passes immediately into the scan layer
when a bus trigger (GET or *TRG) is received by the Model
2002. See Section 3 for detailed information on bus triggers.
2.7.4 Configuring the arm layer
The arm layer is used for the following operations:
• To select the arming event (SOURCE) for the instrument.
• T o designate the number of times the instrument is to be
armed (COUNT).
• To enable or disable the Source Bypass.
The arm layer is configured from the ARM item of the CONFIGURE TRIGGER menu, which is displayed by pressing
the CONFIG key and then the TRIG key. General rules for
navigating through the menu structure is contained in paragraph 2.3.4.
SOURCE
This menu item selects the event that controls the arm
source.
NOTE
The front panel TRIG key (see MANUAL) is active with bus triggering
selected. Pressing the TRIG key passes
operation into the scan layer.
TRIGLINK: With this selection, the arm source is con-
trolled by the Trigger Link of the Model 2002. Trigger Link
is an enhanced trigger system that uses up to six lines to
direct trigger pulses to and from other instruments. Operation passes into the scan layer when the Model 2002 receives
a trigger over the Trigger Link. See paragraph 2.7.7 for
details on using the Trigger Link.
NOTE
The front panel TRIG key (see MANUAL) is active with the Trigger Link
selected. Pressing the TRIG key passes
operation into the scan layer.
2-49
Page 69

Front Panel Operation
After selecting TRIGLINK, you will be prompted to select
an input line and then an output line. Note that you cannot
use the same trigger line for both input and output.
RT-Clock: With this selection, the arm source is controlled
by the real-time clock. When the programmed time and date
occurs, the Model 2002 passes operation into the scan layer.
• SET-TIME — Use this selection to set the time (hour,
minute and second) for the arm event. Set the time using
the 12-hour format of “AM” or “PM” is displayed (see
CLOCK in paragraph 2.12.7). Otherwise, set the time
using the 24-hour format.
• SET -DATE — Use this selection to set the date (month,
day and year) for the arm event.
HOLD: When HOLD is selected, the arm source is sup-
pressed. As a result, operation does not pass into the scan layer until HOLD is cancelled by selecting one of the other arm
source selections. Select HOLD from the SELECT ARM
SOURCE menu by placing the cursor on HOLD and pressing ENTER. The instrument returns to the SETUP arm layer
menu.
COUNT
2.7.5 Halting triggers
The Halt option of the CONFIGURE TRIGGER menu is
used to disarm the instrument and place it in the idle state.
You can press the TRIG key to resume front panel triggers.
2.7.6 External triggering
The Model 2002 has BNC connections on the rear panel for
external triggering (see Figure 2-13). The EXTERNAL
TRIGGER INPUT jack allows the Model 2002 to be triggered by other instruments. The METER COMPLETE
OUTPUT jack allows the Model 2002 to trigger other instruments.
EXTERNAL
TRIGGER
INPUT
Figure 2-13
External triggering connectors (BNC)
METER
COMPLETE
OUTPUT
This menu item defines the number of times operation
returns to the arm layer.
INFINITE: Use this selection to continuously return opera-
tion to the arm layer.
ENTER-ARM-COUNT: With this selection, the user determines the number of times operation returns to the arm layer.
You can program the Model 2002 to arm up to 99999 times.
CONTROL
Use this menu item to enable or disable the source bypass.
The source bypass is used to bypass the arm event on the first
pass through the arm layer.
SOURCE: With this selection, the source bypass is enabled.
The arm event will be bypassed on the first pass through the
arm layer. This allows operation to proceed into the scan
layer without having to wait for the programmed event.
ACCEPTOR: With this selection, the source bypass is
disabled.
External trigger
The EXTERNAL TRIGGER INPUT jack requires a fallingedge, TTL-compatible pulse with the specifications shown in
Figure 2-14.
In general, external triggers can be used as events to control
measure operations. For the Model 2002 to respond to external triggers, the appropriate layers of trigger model must be
configured for it. Paragraphs 2.7.2 through 2.7.4 explain how
to program the three layers of the measurement.
Triggers on
Leading Edge
TTL High
(2V-5V)
TTL Low
(≤0.8V)
2µs
Minimum
Figure 2-14
External triggering and asynchronous trigger link input
pulse specifications
2-50
Page 70

Front Panel Operation
Meter complete
The METER COMPLETE OUTPUT jack provides a TTLcompatible output pulse that can be used to trigger other
instruments. The specifications for this trigger pulse are
shown in Figure 2-15.
Meter
Complete
TTL High
(3.4V Typical)
TTL Low
(0.25V Typical)
10µs
Minimum
Figure 2-15
Meter complete and asynchronous trig g er link output pulse
specifications
Typically, you would want the Model 2002 to output a trigger after the settling time of each measurement. (Settling
time includes the internally set measurement settling time
and the user programmed DELAY period.) An output completion pulse occurs after each measurement as long as the
measure source is set to external, timer, manual, or immedi-
ate. See paragraph 2.7.2 for details on programming the measure layer.
The Model 2002 can also output a completion pulse while in
the scan and/or arm layers of operation. Figure 2-12 shows
where these triggers occur in the trigger model. If the scan
layer Source Bypass is enabled (Control = Source) and the
Scan Source is programmed for External, an output trigger
occurs on each return path through the scan layer. If the arm
layer Source Bypass is enabled (Control = Source) and the
Arm Source is programmed for External, an output trigger
occurs on each return path through the arm layer. See paragraphs 2.7.3 and 2.7.4 for programming the Scan and arm
layers.
External triggering example #1
In a typical test system, you may want to close a channel and
then measure the DUT connected to that channel with a multimeter. Such a test system is shown in Figure 2-16, which
uses a Model 2002 Multimeter to measure ten DUTs
switched by a Model 7011 multiplexer card in a Model 7001
or 7002 Switch System.
The external trigger connections for this test are shown in
Figure 2-17. Channel Ready (output) of the Model 7001 or
7002 is connected to External Trigger Input of the Model
2002. Meter Complete Output of the Model 2002 is connected to External Trigger (input) of the Model 7001 or
7002.
DUT
DUT
DUT
#10
Figure 2-16
DUT test system
#1
#2
1
2
10
Card 1
7011 MUX Card
OUTPUT
PREV
DISPLAY
NEXT
POWER
2002 Multimeter
2002 MULTIMETER
Input HI
SENSE
INPUT
Ω 4 WIRE
HI
350V
PEAK
LO
INPUTS
F
R
FRONT/REAR
2A 250V
AMPS
CAL
1100V
PEAK
500V
PEAK
Input LO
2-51
Page 71

Front Panel Operation
External
Trigger
Meter
Complete
Output
Channel
7001 or 7002 Switch System
BNC to BNC
Cables (2)
Ready
7051-2
Figure 2-17
External trigger connectors
.
For this example, the Models 2002 and 7001/7002 are configured as follows:
Model 2002:
Idle State:
Bench reset = :INIT:CONT ON*
Arm layer:
Arm source = Immediate*
Arm count = 1*
Arm trigger control = Acceptor*
Scan layer:
Scan source = Immediate*
Scan count = Infinite*
Scan trigger control = Acceptor*
Measure layer:
Measure source = External
Measure count = Infinite*
Measure trigger control = Acceptor*
* Indicates that the setting is the BENCH RESET (and factory) default condition.
Model 7001 or 7002:
Idle State:
Reset = :INIT:CONT OFF*
Scan List = 1!1-1!10,
Arm layer:
Arm spacing = Immediate*
Arm count = 1*
Arm trigger control = Acceptor*
Scan layer:
Scan spacing = Immediate*
Number of scans = 1
Scan trigger control = Acceptor*
External
Trigger
Input
2002 Multimeter
Channel Layer:
Channel spacing = External
Number of channels = Use Scanlist length*
Channel trigger control = Source*
* Indicates that the setting is the RESET (and factory) default condition.
Notice that the Model 2002 is reset to BENCH defaults. W ith
this selection, the multimeter stays armed. Since the arm
source and scan source are set to Immediate, the Model 2002
waits in the measure layer for a trigger.
With the Channel Trigger Control of the switch system set
for Source, scan operation initially bypasses the need for an
external trigger to close the first channel. Since arm spacing
and scan spacing are set to Immediate, the scan starts as soon
as the scanner is taken out of the idle state by pressing the
STEP key. When the front panel STEP key is pressed:
• The scanner arms and closes the first channel.
• After Channel 1!1 settles, a trigger is sent from Channel
Ready of the Model 7001/7002 to External Trigger
Input of the Model 2002 to trigger a measurement of
DUT #1.
• After the Model 2002 completes the measurement, it
outputs a trigger from Meter Complete Output to External Trigger of the Model 7001/7002, which closes the
next channel.
• After Channel 1!2 settles, a trigger is sent to the Model
2002 to trigger a measurement of DUT #2.
This process continues until all ten channels are scanned and
measured.
The data store capability of the Model 2002 could be used to
store the measurements as they occur . Just press the STORE
2-52
Page 72

Front Panel Operation
key to set the number of readings to store, then press
ENTER. The Model 2002 waits (with the asterisk annunciator lit) for an external trigger from the Model 7001/7002
before taking a reading, storing it, and sending a trigger
pulse.
External triggering example #2
External triggering can also be used in a test system consisting of a Model 2002 Multimeter and a Model 706 Scanner
with an appropriate scanner card.
The external trigger connections are the same as those shown
in Figure 2-17 for the Models 2002 and 7001/7002. Channel
Ready Output of the Model 706 is connected to External
Trigger Input of the Model 2002. External Trigger Input of
the Model 706 is connected to Meter Complete Output of the
Model 2002.
The trigger configuration of the Model 2002 does not change
from the previous example. The Model 706 is configured for
external triggering.
2.7.7 T rigger Link
The Model 2002 has enhanced external triggering capabilities using the Trigger Link. The Trigger Link has six lines
allowing up to six instruments to be controlled over this trigger bus. The 8-pin micro-DIN sockets used for the Trigger
Link are shown in Figure 2-18.
Pin Trigger Link Line
6
8
7
5
43
21
IN OUT
TRIGGER LINK
Figure 2-18
Trigger link connectors
The two rear panel Trigger Link connectors are actually connected in parallel. It
does not matter which connector you use
when connecting the Trigger Link to another instrument.
8
5
21
6
7
43
NOTE
1 Line #1
2 Line #2
3 Line #3
4 Line #4
5 Line #5
6 Line #6
7 Digital Common
8 Digital Common
In general, Trigger Link input triggers to the Model 2002 are
used to control the measure operation. For the Model 2002 to
respond to Trigger Link compatible triggers, the appropriate
layers of the trigger model must be programmed for it. For
example, if you want Trigger Link input triggers to control
the measuring process, you must program Measure Source
for TRIGLINK trigger events. Typically, a Trigger Link output trigger from the Model 2002 would be used to trigger a
scanner to close the next channel.
There are two modes of operation for Trigger Link: asynchronous and semi-synchronous. In the asynchronous mode,
separate lines are used for input and output triggers; in the
semi-synchronous mode, the same line is used for both input
and output triggers.
Asynchronous operation
In the asynchronous operating mode, Trigger Link functions
fundamentally in the same manner as External Triggering
(see paragraph 2.7.6). Like External Triggering, the
asynchronous mode uses separate lines for input and output
triggers. Also, the asynchronous mode uses the same TTLcompatible pulses as External Triggering. The specifications
for the input and output trigger signals of asynchronous
mode are shown in Figure 2-14 and Figure 2-15,
respectively.
For typical asynchronous Trigger Link operation, the measure layer is configured with Measure Source set to
TRIGLINK and Triggerlink mode set to ASYNCHRONOUS. You must also select input and output lines for the
measure layer. Input and output triggers can be set to any of
the six lines, but they cannot use the same line. For example,
if you select line #1 for input triggers, then output triggers
must use one of the other five lines (#2 through #6).
During operation in the measure layer, each Trigger Link
input trigger makes a measurement. After the userprogrammed DELA Y and the measurement settling time, the
Model 2002 outputs a Trigger Link completion pulse
(typically to a scanner to close the next channel). The
measure layer is configured using the CONFIG-TRIG menu
(see paragraph 2.7.2).
The scan layer and/or arm layer can also be programmed for
Trigger Link, where Scan Source is set to TRIGLINK, and
Arm Source is set to TRIGLINK. When using Trigger Link
in these layers, you must also select input and output lines as
you did in the measure layer. Keep in mind that you can use
the same lines in the Scan and arm layers as selected in the
measure layer.
2-53
Page 73
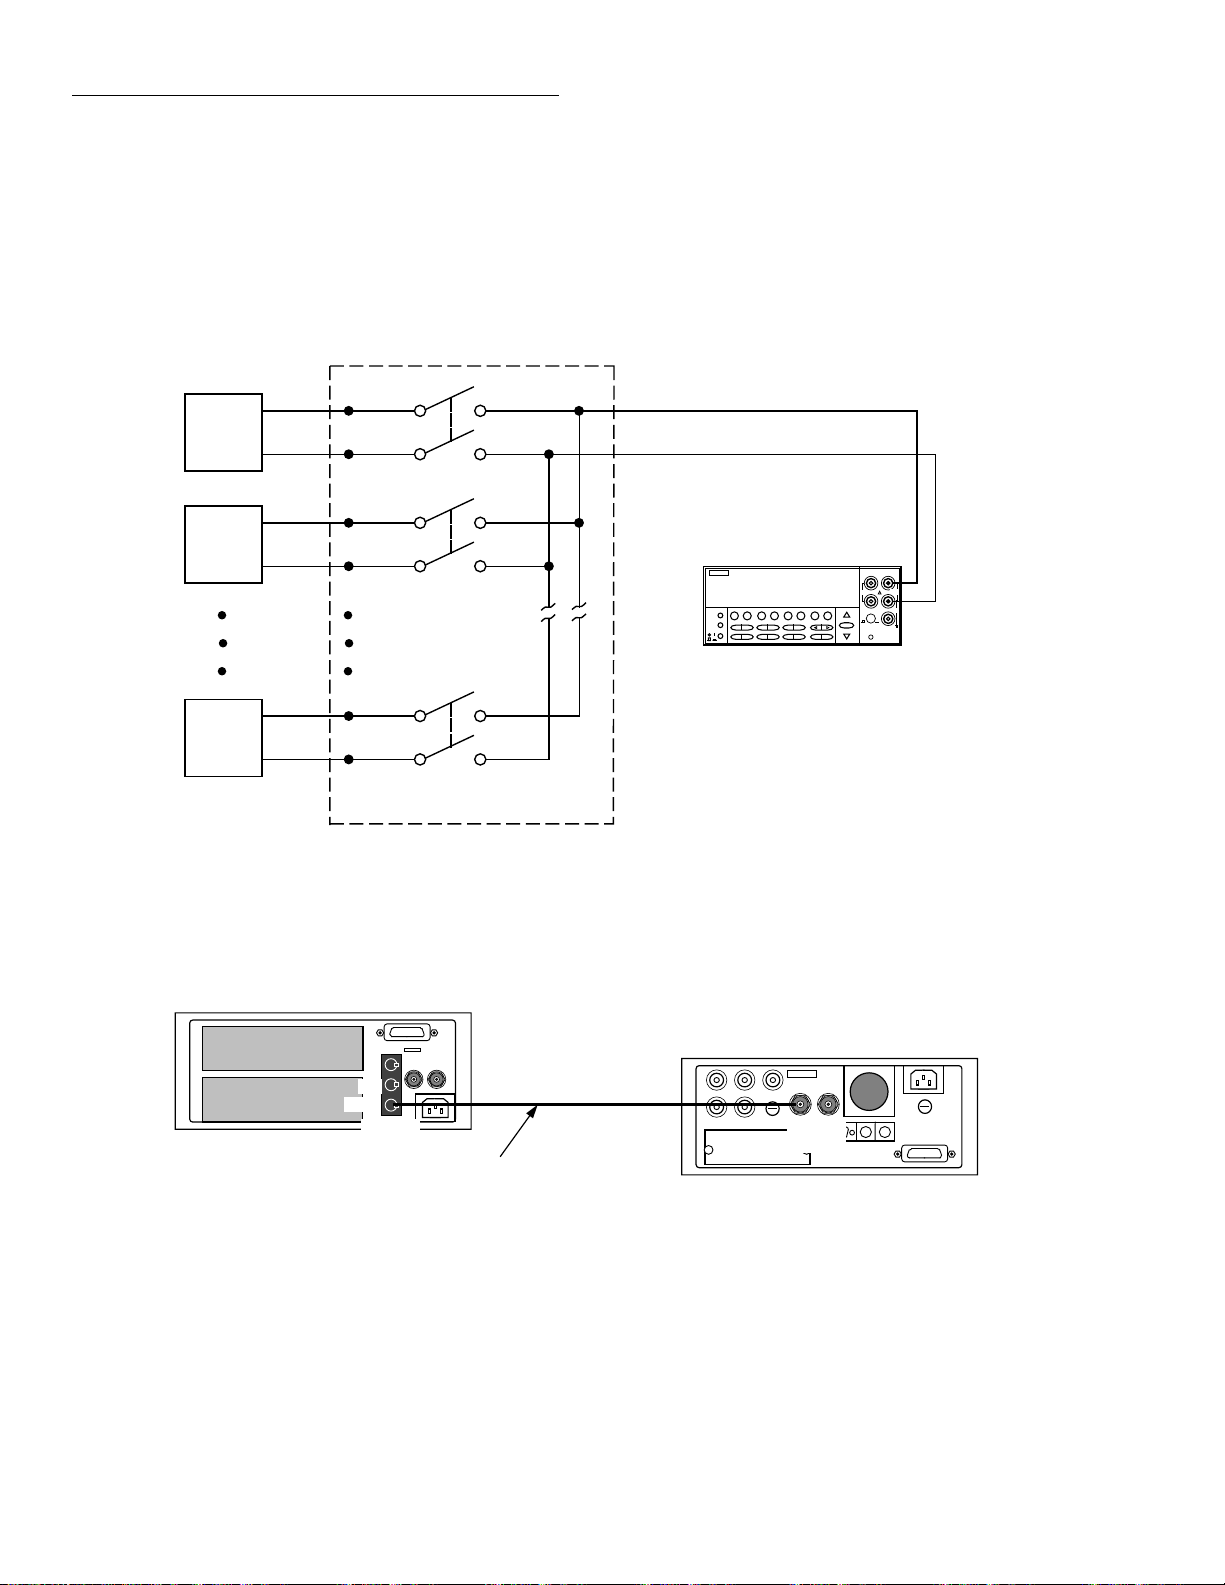
Front Panel Operation
Asynchronous Trigger Link example #1
In a typical test system, you may want to close a channel and
then measure the DUT connected to the channel with a multimeter. Such a test system is shown in Figure 2-19, which
uses a Model 2002 Multimeter to measure ten DUTs
switched by a Model 7011 multiplexer card in a Model 7001/
7002 Switch System.
DUT
#1
DUT
#2
DUT
#10
1
2
10
The Trigger Link connections for this test system are shown
in Figure 2-20. Trigger Link of the Model 2002 is connected
to Trigger Link of the Model 7001/7002 Switch System.
Notice that only one Trigger Link cable is needed.
OUTPUT
Input HI
SENSE
INPUT
Ω 4 WIRE
HI
350V
1100V
PEAK
PREV
DISPLAY
NEXT
POWER
2002 MULTIMETER
PEAK
LO
500V
PEAK
INPUTS
Input LO
F
R
FRONT/REAR
2A 250V
AMPS
CAL
2002 Multimeter
Card 1
7011 MUX Card
Figure 2-19
DUT test system
7001 or 7002 Switch System
IN
OUT
Trigger
Link
Trigger
Link Cable
(8501)
Figure 2-20
Trigger Link connections (asynchronous example #1)
IN OUT
Trigger
Link
2002 Multimeter
2-54
Page 74

Front Panel Operation
For this example, the Models 2002 and 7001/7002 are configured as follows:
Model 2002:
Idle state:
Bench reset = :INIT:CONT ON*
Arm layer:
Arm source = Immediate*
Arm count = 1*
Arm trigger control = Acceptor*
Scan layer:
Scan source = Immediate*
Scan count = Infinite*
Scan trigger control = Acceptor*
Measure layer:
Measure source = TrigLink
Trigger link mode = Asynchronous*
Input line = #2*
Output line = #1*
Measure count = 10
Measure trigger control = Acceptor*
* Indicates that the setting is the BENCH RESET (and factory) default condition.
Model 7001 or 7002:
Idle state:
Reset = :INIT:CONT OFF*
Scan list = 1!1-1!10,
Arm layer:
Arm spacing = Immediate*
Arm count = 1*
Arm trigger control = Acceptor*
Scan layer:
Scan spacing = Immediate*
Number of scans = 1
Scan trigger control = Acceptor*
Channel Layer:
Channel spacing = TrigLink
Trigger link mode = Asynchronous*
Input line = #1*
Output line = #2*
Number of channels = Use Scanlist length*
Channel trigger control = Source*
* Indicates that the setting is the RESET (and factory) default condition.
Notice that the Model 2002 is reset to BENCH defaults. W ith
this selection, the multimeter stays armed. Since the arm
source and scan source are set to Immediate, the Model 2002
waits in the measure layer for a trigger.
With the Channel Trigger Control of the Model 7001/7002
set for Source, scan operation initially bypasses the need for
a Trigger Link trigger to close the first channel. Since arm
spacing and scan spacing are set to Immediate, the scan starts
as soon as the scanner is taken out of the idle state by pressing the STEP key.
To run the test and store the readings in the Model 2002,
press STORE on the multimeter, enter the desired number of
readings (ten), and press ENTER. The Model 2002 waits
(with the asterisk annunciator lit) for a Trigger Link trigger
from the Model 7001/7002.
Press STEP on the Model 7001/7002 to start the scan. The
scanner’s output pulse triggers the Model 2002 to take a
reading, store it, and send a trigger pulse. The following explanation on operation is referenced to the operation model
shown in Figure 2-21.
A
The BENCH RESET condition arms the Model 2002
and places multimeter operation at point A in the flowchart,
where it is waiting for a Trigger Link trigger. Note that since
both the arm layer and scan layer are programmed for Immediate Source, operation immediately drops down to the measure layer at point A.
B
Pressing STEP takes the Model 7001/7002 out of the
idle state and places operation at point B in the flowchart.
Since both the arm layer and scan layer are programmed for
Immediate Spacing, operation drops down to the channel
layer at point B.
C
Since Channel Trigger Source is set to Source, the
scan does not wait at point B for a trigger. Instead, it bypasses “Wait for Trigger Link Trigger” and closes the first channel (point C). Note that the Bypass is in effect only on the
first pass through the model into a layer.
D
After the relay settles, the Model 7001/7002 outputs a
Channel Ready pulse (point D). Since the instrument is programmed to scan ten channels, operation loops back up to
point B, where it waits for an input trigger. Note that Bypass
is no longer in effect.
E F
and Remember that the Model 2002 operation is
at point A waiting for a trigger. The output Channel Ready
pulse from the Model 7001/7002 triggers the multimeter to
measure DUT #1 (point E). After the measurement is complete, the Model 2002 outputs a completion pulse (point F)
and then loops back to point A, where it waits for another input trigger.
The trigger applied to the Model 7001/7002 from the Model
2002 closes the next channel in the scan. This triggers the
multimeter to measure the next DUT. The process continues
until all ten channels are scanned and measured.
2-55
Page 75

Front Panel Operation
7001or 7002
Press STEP to start scan
Idle
2002
Arm
Bypass
C
D
No
Wait for
Trigger Link
Trigger
Scan
Channel
Output
Trigger
Scanned
10
Channels
?
B
Trigger Link
Measurement
Trigger
Trigger
Measurements
Wait for
Trigger
Make
Output
Trigger
Made
10
?
A
E
F
No
Yes
Figure 2-21
Operation model for asynchronous trigger link example #1
External Triggering and Trigger Link
As previously mentioned, the trigger pulses for the asynchronous Trigger Link are identical to the trigger pulses used for
External Triggering. The only thing that prevents them from
being used together in a test system is connection incompatibility. Trigger Link uses 8-pin micro-DIN connectors while
External Triggering uses BNC connectors.
This connection problem can be solved by using the Model
8502 Trigger Link Adapter . The adapter has two 8-pin microDIN connectors and six BNC connectors. The micro-DIN
connectors mate directly to the Trigger Link connector on
the Model 2002 using a trigger link cable. The BNC
connectors mate directly to the External Triggering BNC
connectors on other instruments using standard male BNC to
BNC cables.
Yes
Figure 2-22 shows how a K eithley Model 706 Scanner can be
connected to the Trigger Link of the Model 2002 using the
adapter. With this adapter, a Model 706 could be substituted
for the Model 7001/7002 in the previous example (Asynchronous Trigger Link e xample #1). With the Model 706 set
for External Triggering, the test would start when the single
scan mode is selected and initiated.
Asynchronous Trigger Link example #2
In this example, the test system (Figure 2-23) includes a
Model 2002 to measure each DUT at two different bias levels that are provided by a Model 230 voltage source. W ith the
source set to the first voltage level, the ten channels are
scanned and measured. The source is then set to the second
voltage level and the ten channels are again scanned and
measured.
2-56
Page 76

Front Panel Operation
1
Trigger
Link
OUT
Trigger
Link Cable
(8501)
IN
2002 Multimeter
Figure 2-22
Connections using Trigger Link adapter
DUT
COM
OUT
230 Voltage Source
DUT
2
8502
Trigger
Link
Adapter
BNC to BNC
Cables (2)
(7501)
Channel
Ready
External
Trigger
706 Scanner
#1
#2
1
2
Output
PREV
DISPLAY
NEXT
POWER
2002 Multimeter
2002 MULTIMETER
Input HI
Ω 4 WIRE
350V
PEAK
INPUTS
F
FRONT/REAR
SENSE
INPUT
HI
1100V
PEAK
LO
500V
PEAK
Input LO
R
2A 250V
AMPS
CAL
DUT
#10
Figure 2-23
DUT test system (asynchronous example #2)
10
Card 1
7011 MUX Card
2-57
Page 77

Front Panel Operation
7001 or 7002 Switch System
IN
OUT
Trigger
Link
Trigger
Link Cables
(8501)
OUT
IN
Trigger
Link
2002 Multimeter
External Trigger
IN
OUT
230 Voltage Source
Figure 2-24
Trigger Link connections (asynchronous example #2)
Since this example uses an instrument that does not have
Trigger Link (Model 230), the Model 8502 Trigger Link
Adapter is required. Connections are shown in Figure 2-24.
For this example, the Model 230 is programmed for External
Triggering and is set to source the first voltage level. The
Models 2002 and 7001/7002 are configured as follows:
Model 2002:
Idle state:
Bench reset = :INIT:CONT ON*
Arm layer:
Arm source = Immediate*
Arm count = 1*
Arm trigger control = Acceptor*
Scan layer:
Scan source = Immediate*
Scan count = Infinite*
Scan trigger control = Acceptor*
Measure layer:
Measure source = TrigLink
Trigger link mode = Asynchronous
Input line = #3
Output line = #4
Measure count = 20
Measure trigger control = Acceptor*
* Indicates that the setting is the BENCH RESET (and factory) default condition.
8502
23 4
BNC to BNC
561
Cables
(7501)
Trigger Link
Adapter
Model 7001 or 7002:
Idle state:
Reset = :INIT:CONT OFF*
Scan list = 1!1-1!10,
Arm layer:
Arm spacing = Immediate*
Arm count = 1*
Arm trigger control = Acceptor*
Scan layer:
Scan spacing = TrigLink
Trigger link mode = Asynchronous
Input line = #2
Output line = #1
Number of scans = 2
Scan trigger control = Source
Channel layer:
Channel spacing = TrigLink
Trigger link mode = Asynchronous
Input line = #4
Output line = #3
Number of channels = 20
Channel trigger control = Source*
* Indicates that the setting is the RESET (and factory) default condition.
Notice that the Model 2002 is reset to BENCH defaults. W ith
this selection, the multimeter stays armed. Since the arm
source and scan source are set to Immediate, the Model 2002
waits in the measure layer for a trigger.
2-58
Page 78

Front Panel Operation
To run the test and store the readings in the Model 2002,
press STORE on the multimeter, enter the desired number of
readings (20), and press ENTER. The Model 2002 waits
(with the asterisk annunciator lit) for a Trigger Link trigger
from the Model 7001/7002.
Press STEP on the Model 7001/7002 to start the scan. The
following explanation on operation is referenced to the operation model shown in Figure 2-25.
A
Pressing STEP on the Model 7001/7002 takes it out of
the idle state and places operation at point A in the flo wchart.
Since the arm layer is programmed for Immediate Spacing,
operation drops down to the scan layer at point A.
B
Since Scan Trigger Control of the Model 7001/7002 is
set for Source, the scan does not wait at point A for a trigger.
Instead, it bypasses “W ait for T rigger Link T rigger” and proceeds to point B. Note that this Bypass is in effect only on the
first pass through the model.
C
Since Channel Trigger Source of the Model 7001/
7002 is also set to Source, the scan does not wait at point B
for a trigger. Instead, it bypasses “Wait for Trigger Link T rigger” and closes the first channel (point C). Note that the Bypass is in effect only on the first pass through the model.
D
After the relay settles, the Model 7001/7002 outputs a
Trigger Link trigger pulse (point D). Since the instrument is
programmed to scan ten channels, operation loops back up to
point B, where it waits for an input trigger. Note that Bypass
is no longer in effect.
E
The trigger pulse from the Model 7001/7002 triggers
the Model 2002 to make a measurement of DUT #1. After
the measurement is complete, the multimeter outputs a Trigger Link trigger pulse (point E).
The trigger applied to the Model 7001/7002 from the Model
2002 closes the next channel in the scan, which in turn triggers the multimeter to measure the next DUT. This process
continues until all ten channels are scanned and measured.
F
After the last channel is scanned and measured, operation proceeds to point F, where the Model 7001/7002 outputs a trigger pulse. Since the Model 7001/7002 is
programmed to perform two scans, its operation loops back
up to point A, where it waits for an input trigger. Note that
Bypass is no longer in effect.
G
The trigger pulse from the Model 7001/7002 triggers
the Model 230 to output the next programmed voltage level.
After the voltage level is set, the Model 230 outputs a trigger
pulse (point G).
The trigger pulse applied to the Model 7001/7002 from the
Model 230 places operation at point B. The Bypass is again
in effect because this is the beginning of a new scan. This allows operation to drop down to point C, where the first channel is again closed and eventually measured. As previously
explained, all ten channels are scanned and measured.
After the last channel of the second scan is closed and measured, the Model 7001/7002 returns to the idle state.
2-59
Page 79

Front Panel Operation
7001or 7002
Press STEP
Idle
Bypass
Bypass
D
No
A
Wait for
Trigger Link
Trigger
B
Wait for
Trigger Link
Trigger
Scan
Channel
Output
Trigger
Scanned
10
Channels
?
C
Trigger
7001or
7002
Trigger 2002
to make
Measurement
and Output
Trigger
2002
E
Trigger
2002
Yes
Output
F
Trigger
Performed
No
2
Scans
?
Yes
Figure 2-25
Operation model for asynchronous Trigger Link example #2
Trigger
7001 or
7002
Trigger 230
to source
next voltage
level
and Output
Trigger
230
G
Trigger
230
2-60
Page 80
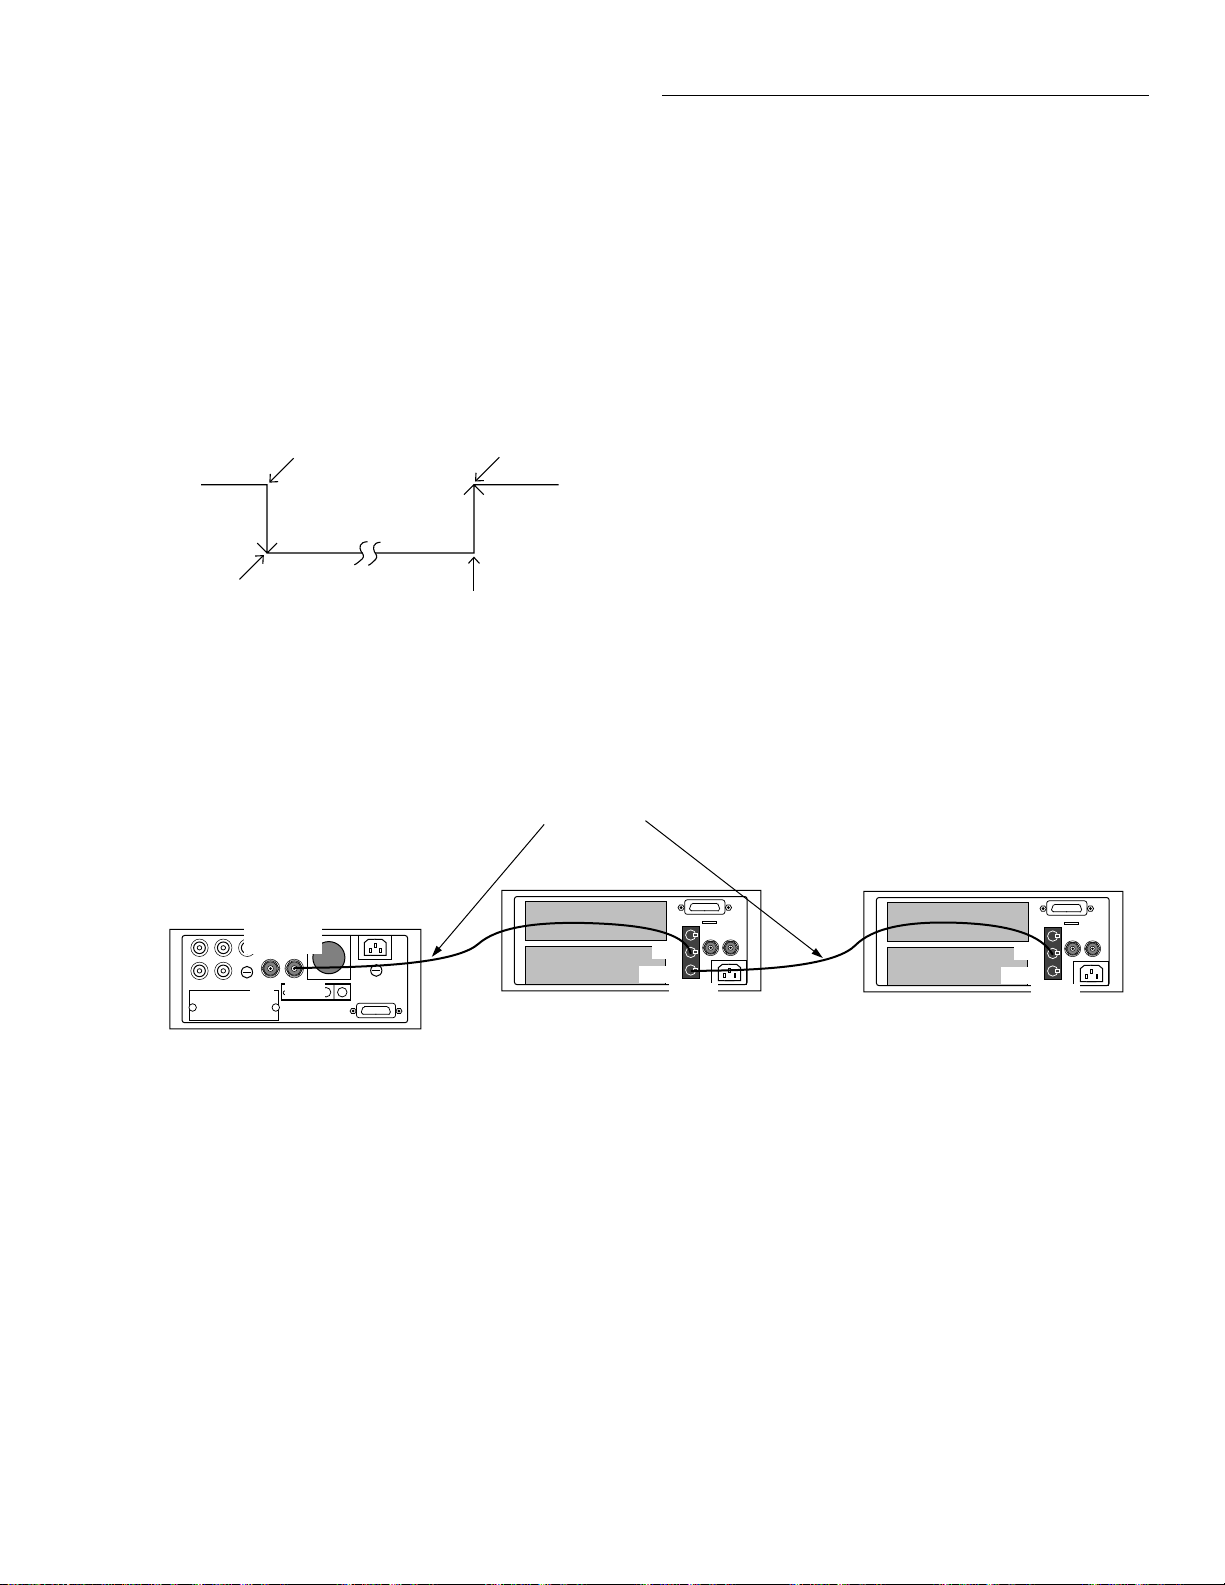
Front Panel Operation
Figure 2-27
Typical semi-synchronous mode connections
Trigger
Link
IN
OUT
Trigger
Link
7001 or 7002 Switch System
Trigger Link
Cables (2)
(8501)
2002 Multimeter
IN
OUT
Trigger
Link
IN OUT
Line #1
Line #1
7001 or 7002 Switch System
Semi-synchronous operation
In the Semi-synchronous Trigger Link mode, all triggering
(input and output) is controlled by a single line. When the
normally high (+5V) trigger line is pulled low (0V), a trigger
occurs on the negative-going edge. When the trigger line is
released, a trigger occurs on the positive-going edge (see
Figure 2-26). The advantage of this single line trigger is that
as long as one of the instruments in the system holds the line
low, the trigger is suppressed. In other words, the trigger
does not occur until all instruments in the system are ready.
ª +5V
0V
Pulled low by
source instrument
Trigger on
negative-going
edge
Trigger on
positive-going
edge
Released by
acceptor instruments
Figure 2-26
Semi-synchronous Trigger Link specifications
For example, assume that a Model 2002 is connected to two
Model 7001 or 7002 Switch Systems for semi-synchronous
operation, as shown in Figure 2-27. All three instruments are
programmed to use trigger line #1. The two Model 7001s/
7002s have relay settling times of 10msec and 50msec, respectively. The Model 2002 is designated as the trigger control source and the two Model 7001/7002 units as trigger
control acceptors.
Assume that the Model 2002 initially performs a measurement. After the reading is done, the Model 2002 drives the
trigger line low . The negati v e-going edge triggers both Model 7001s/7002s to close a channel. While the Model 7001s/
7002s are in the process of closing a channel, they hold the
trigger line low. Ten milliseconds after switch closure, the
first Model 7001/7002 releases the trigger line. However, the
second Model 7001/7002 continues to hold the line low since
it is not finished. Fifty milliseconds after switch closure, the
second Model 7001/7002 releases the trigger line. The positive-going edge triggers the Model 2002 to make a measurement and subsequently pull the trigger line back down to
close the next channels. This process continues until all
channels are scanned and measured.
2-61
Page 81

Front Panel Operation
Semi-synchronous Trigger Link example
This example uses the same test system (Figure 2-19) that
was used for the Asynchronous Trigger Link example #1.
However, triggering is done using the Semi-synchronous
mode. Trigger Link connections are shown in Figure 2-28.
The two instruments are configured as follows:
Model 2002:
Idle state:
Bench reset = :INIT:CONT ON*
Arm layer:
Arm source = Immediate*
Arm count = 1*
Arm trigger control = Acceptor*
Scan layer:
Scan source = Immediate*
Scan count = Infinite*
Scan trigger control = Acceptor*
Measure layer:
Measure source = TrigLink
Trigger link mode = Semi-synchronous
Semi-sync line = #1*
Measure count = 10
Measure trigger control = Acceptor*
* Indicates that the setting is the BENCH RESET (and factory) default
condition.
Model 7001 or 7002:
Idle state:
Reset = :INIT:CONT OFF*
Scan list = 1!1-1!10,
Arm layer:
Arm spacing = Immediate*
Arm count = 1*
Arm trigger control = Acceptor*
Scan layer:
Scan spacing = Immediate*
Number of scans = 1
Scan trigger control = Acceptor*
Channel layer:
Channel spacing = TrigLink
Trigger link mode = Semi-synchronous
Semi-sync line = #1
Number of channels = Use Scanlist length*
Channel trigger control = Source*
* Indicates that the setting is the RESET (and factory) default condition.
To run the test and store the readings in the Model 2002,
press STORE on the multimeter, enter the desired number of
readings (ten), and press ENTER. The Model 2002 waits
(with the asterisk annunciator lit) for a Trigger Link trigger
from the Model 7001/7002. Press STEP on the Model 7001/
7002 to start the scan.
The following explanation on operation is referenced to the
operation model shown in Figure 2-29.
IN
OUT
Trigger
Link
7001 or 7002 Switch System
Figure 2-28
Trigger Link connections (semi-synchronous example)
2-62
Line #1
Trigger Link
Cable (8501)
OUT
IN
Trigger
Link
2002 Multimeter
Page 82
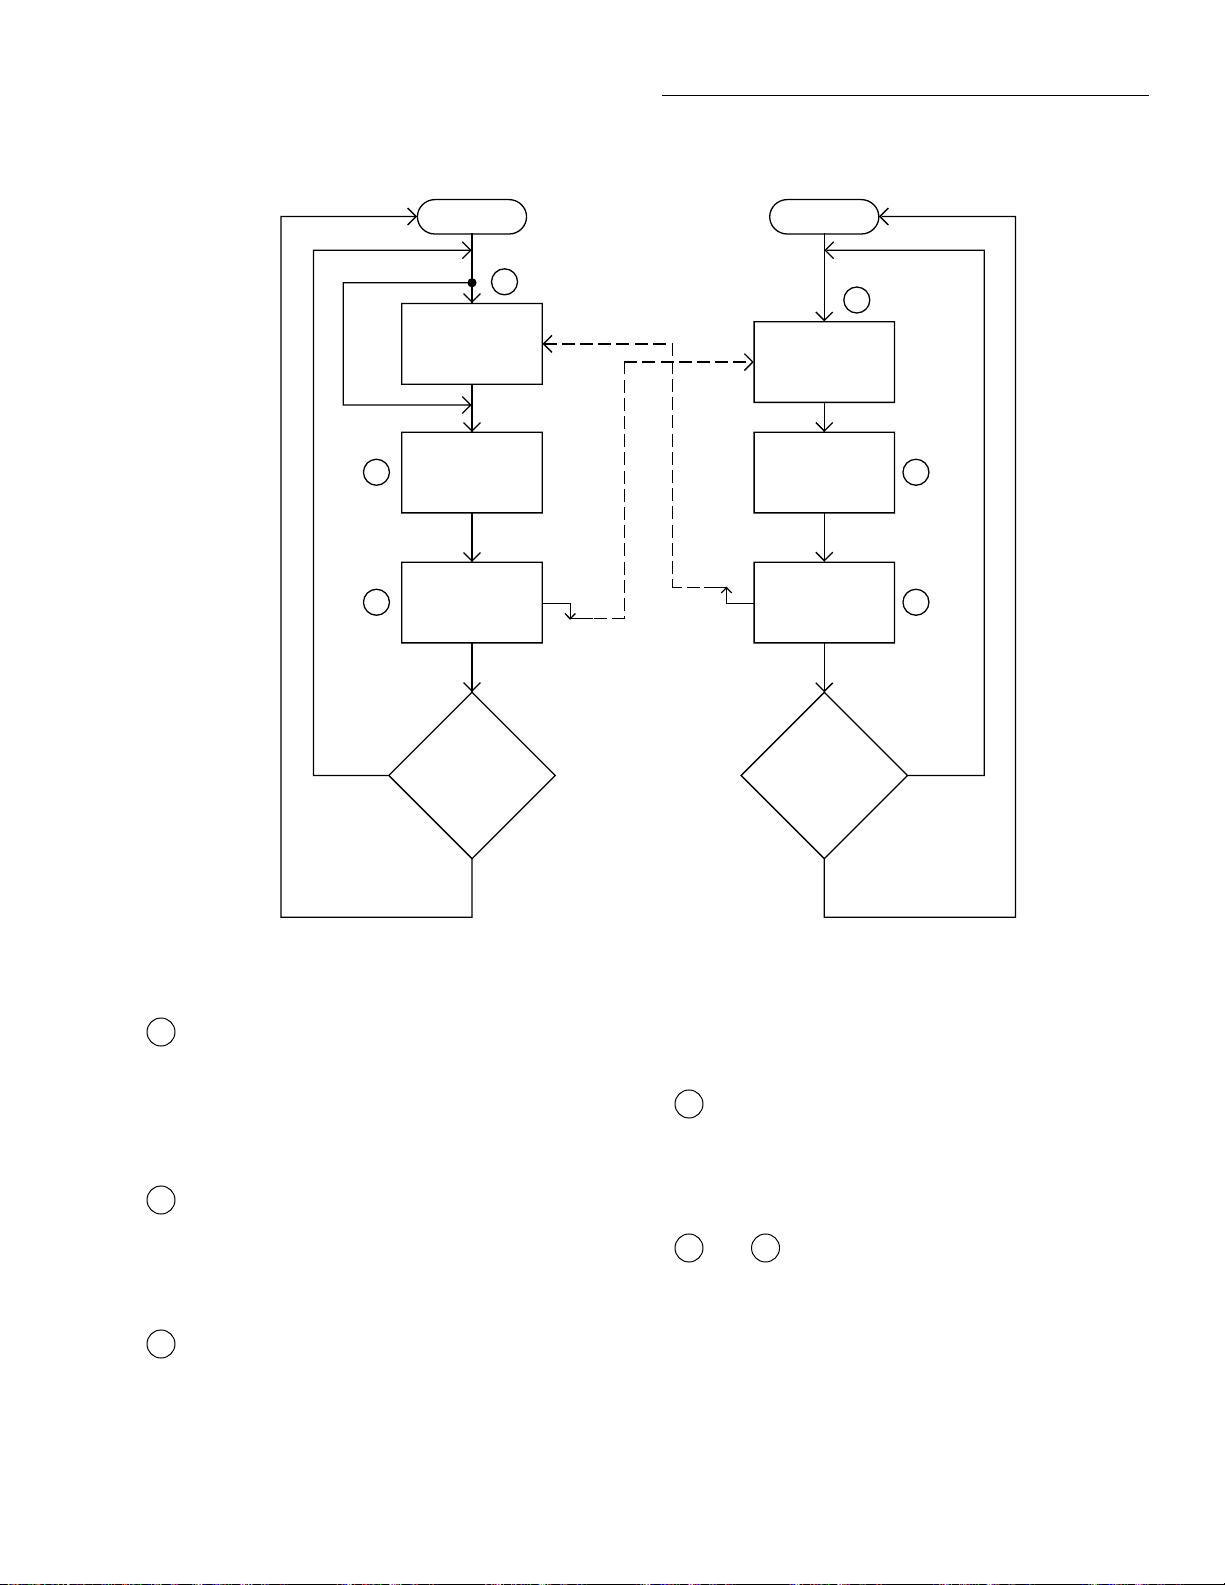
7001or 7002
Press STEP to start scan
Idle
Front Panel Operation
2002
Arm
Bypass
C
D
No
Wait for
Trigger Link
Trigger
Scan
Channel
Pull Trigger
Line Low
Scanned
10
Channels
?
B
Trigger Link
Measurement
Trigger Line
Measurements
Wait for
Trigger
Make
Release,
Made
10
?
A
E
F
No
Yes
Figure 2-29
Operation mode for semi-synchronous Trigger Link example
A
The BENCH RESET condition arms the Model 2002
and places multimeter operation at point A in the flowchart,
where it is waiting for a Trigger Link trigger. Note that since
both the arm layer and scan layer are programmed for Immediate Source, operation immediately drops down to the measure layer at point A.
B
Pressing STEP takes the Model 7001/7002 out of the
idle state and places operation at point B in the flowchart.
Since both the arm layer and scan layers are programmed for
Immediate Spacing, operation drops down to the Channel
Layer at point B.
C
Since Channel Trigger Source is set to Source, the
scan does not wait at point B for a trigger. Instead, it bypasses “Wait for Trigger Link Trigger” and closes the first chan-
Yes
nel (point C). Note that the Bypass is in effect only on the
first pass through the model.
D
After the relay settles, the Model 7001/7002 pulls
down the Trigger Link trigger line (point D). Since the instrument is programmed to scan ten channels, operation
loops back up to point B, where it waits for an input trigger.
Note that Bypass is no longer in effect.
E F
and Remember that the Model 2002 operation is
at point A waiting for a trigger. When the trigger line is
pulled low by the Model 7001/7002, the leading negativegoing edge triggers the Model 2002 to measure DUT #1
(point E). Note that the multimeter holds the trigger line low .
After the measurement is complete, The Model 2002
releases the trigger line (point F) and then loops back to point
A where it waits for another input trigger.
2-63
Page 83

Front Panel Operation
When the Model 2002 releases the trigger line, the leading
positive-going edge triggers the Model 7001/7002 to close
the next channel in the scan. This pulls the trigger line low,
triggering the Model 2002 to measure the next DUT. The
process continues until all ten channels are scanned and measured.
2.8 Buffer
The Model 2002 has a buffer to store reading data. It can
acquire readings at two different rates (normal and burst
modes). The maximum possible number of stored readings
depends on the installed memory option and the userprogrammable data group. (See Table 2-28.)
Table 2-28
Reading storage options
Data group
Memory Full Compact Type
Standard
MEM1 option
MEM2 option
404
1381
5980
2027
6909
29908
Volatile
Non-volatile
Non-volatile
A full data group includes the readings, units, channel#,
reading#, time-stamp, and status (overflow). A compact data
group does not include channel# or time-stamp information.
In addition to these items, recalled data also includes statistical information, such as minimum, maximum, average, and
standard deviation.
The following paragraphs discuss configuration of the buf fer
acquisition speed, data grouping, and buffer control, as well
as recalling buffered data. The CONFIG DATA STORE
menu structure is shown and summarized in Table 2-29.
2-64
Page 84

Table 2-29
CONFIGURE DATA STORE menu structure
Menu item Description
Front Panel Operation
Burst-mode
Data-group
Full
Compact
Control
Fill-and-stop
Pretrigger
Percentage
Reading-count
Event
Continuous
Never
Timestamp
Type
Relative-Time
Real-Time
Format
Absolute
Delta
Clear-all
Count
Enter-count
Use-trigger-model
Feed
After-calc
Before-calc
None
Acquire 4.5-digit readings at 2000 readings/sec and store in buffer.
Select data types to store in buffer.
Store reading, units, channel#, reading#, time-stamp, and status (overflow).
Store reading, units, reading#, and status (overflow).
Select type of buffer control.
Fill buffer with readings and stop.
Wait for pretrigger event; store before and after readings.
Enter percentage of stored readings before trigger.
Enter count of stored readings before trigger.
Select source for pretrigger event.
Store readings in buffer continuously.
Readings are not stored.
Configure timestamp:
Check or change type:
Reference timestamp to relative time.
Reference timestamp to real-time.
Select timestamp format:
Reference each timestamp to the first buffer reading (relati ve), or to the time and date (real).
Reference each timestamp to the previous buffer reading.
Clear all stored readings and buffer statistics.
Select buffer size.
Enter number of readings to store.
Use (finite) measure count from trigger model.
Select type of reading to store.
Store readings after math calculation.
Store readings before math calculation.
No readings are placed in the buffer.
2.8.1 Burst mode
The burst data acquisition mode maximizes the reading rate
of the Model 2002. Burst mode consists of two distinct phases:
• Acquiring raw readings (A/D counts).
• Post-processing the raw readings by applying calibration constants and storing the resulting readings in the
buffer.
In burst mode, the Model 2002 acquires 4.5-digit readings at
2000 readings/second. The post-processing takes about
2msec/reading. If any filter or math operations are enabled,
the post-processing time is longer. To make this reading rate
possible, certain tradeoffs are made with the unit’s functionality, as described in the following paragraph.
Configuring the unit for burst mode
Before burst mode can be enabled, the following changes
must be made to the present instrument configuration:
• Select a valid measurement function for the burst mode,
as listed in Table 2-30.
• Select a fixed range for the expected signal, or choose
autorange to let the instrument select a fixed range when
burst mode starts.
• Set the trigger event source in the measure layer to
immediate, external, trigger link, or timer.
• Disable any “multiple displays”.
• Disable scanning.
2-65
Page 85

Front Panel Operation
Table 2-30
Available functions in burst mode
Function Type
DC voltage
AC voltage
DC current
AC current
2-wire resistance
If these changes are not made, a “Settings conflict” error or
similar message is displayed when you attempt to turn on
burst mode.
Normal
RMS, average
Normal
RMS, average
Normal
then STORE. Rules for navigating menu structures are provided in paragraph 2.3.4.
BURST-MODE
This CONFIG DATA STORE menu selection is used to
enable or disable the burst mode:
OFF: Selecting this menu item returns the instrument to the
CONFIG DATA STORE menu.
ON: Select ON to enable burst mode. This action clears the
buffer, puts the unit into idle and takes it out of autorange.
The following typical message then prompts you for the
number of readings to store in the buffer:
BURST: 00100 READINGS
When burst mode is selected, the Model 2002 is automatically configured for taking fast measurements. (The instrument’s previous settings are restored when burst mode is
aborted.) Selecting burst mode makes these temporary
changes:
• Triggers are idled between bursts.
• Autoranging is disabled.
• Autozero is disabled.
• Integration time is set to 0.01 PLC (167µsec).
• Resolution is fixed at 4.5 digits.
• Buffer data group is set to compact.
• Buffer control is set to fill-and-stop.
NOTE
Some instrument settings allowed in burst
mode, such as a trigger event source of
timer in the measure layer, may affect the
acquisition speed of 2000 readings/
second.
Enabling burst mode
Once burst mode is enabled, the instrument is dedicated to
that purpose. Other than setting the buffer size, you cannot
change any configuration parameters until burst mode is
aborted.
Thus, make sure to configure the instrument’s function,
range and triggering to be compatible with burst mode before
enabling it. An incompatible configuration causes a “Settings conflict” error when you try to enable burst mode.
Burst mode is enabled through the CONFIG DATA STORE
menu. This menu us displayed by pressing CONFIG and
After ENTERing the desired buffer size, the following typical message will be displayed:
00100 READING BURST
Use TRIG to start; EXIT to abort
Burst mode operation
Table 2-31 details the sequence of steps during burst mode.
The steps assume just one burst of readings before aborting
the burst mode, but you are able to initiate more than one
burst, each time overwriting the previously stored readings.
As can be seen from the table, a front panel trigger starts the
burst acquisition. The Model 2002 remains looping in the
measure layer of the trigger model until the requested number of readings is acquired. To enhance burst acquisition
speed, the front panel is not updated until the raw readings
are being post-processed.
Meter Complete output pulses are sent at the rate of 2kHz
during the acquisition phase. (Note: The last one is not sent
until post-processing is done.)
After the acquisition phase, the unit returns to the idle state
and starts post-processing, which consists of converting the
raw readings into measurements by applying the calibration
constants. During the post- processing phase, the front panel
“*” annunciator is lit.
The acquisition phase of burst mode can be aborted by pressing the EXIT key. Then the Model 2002 starts post-processing on that portion of the reading buffer.
Since burst mode turns off autozero, an autozero refresh is
required once every 24 hours (by changing functions, resolution, or issuing an autozero bus command).
2-66
Page 86

Table 2-31
Burst mode sequence
Action Result Annunciators
Front Panel Operation
BURST MODE ON
ENTER
ENTER
TRIG
RECALL
EXIT
EXIT
BURST:00100 READINGS
Use , , ▲, ▼, ENTER, EXIT, or INFO
00100 READING BURST
Use TRIG to start; EXIT to abort
(burst readings acquired)
(post-processing of readings)
BURST:00100 READINGS
Processing rdg #xx of 1000
BURST:00100 READINGS
Storage complete; press RECALL
BURST:00100 READINGS
Use , , ▲, ▼, ENTER, EXIT, or INFO
Rdg#+00000
...
Rdg#+00099
BURST:00100 READINGS
Use , , ▲, ▼, ENTER, EXIT, or INFO
(press ENTER to loop back to start)
BURST MODE ABORTED
Use CONFIG → STORE to resume
ARM and AUTO off
ARM on
* on
ARM and * off
ARM and AUTO on
(normal reading display)
Notes:
1. This table assumes the unit was set for autorange before enabling burst.
2. Multiple displays of buffered readings are available when burst data is recalled. (See paragraph 2.5.4.)
2.8.2 Configuring data storage
The data storage configuration menu is used for the following operations:
• To acquire a burst of readings at high speed.
• To select the data types stored in the buffer.
• To select the buffer control.
• To clear the buffer of readings and statistics.
• To specify the number of readings to store.
• To specify the source of readings to be stored.
The buffer is configured from the CONFIG DATA STORE
menu (see Table 2-29). This menu is displayed by pressing
CONFIG and then STORE. Rules for navigating menu structures are provided in paragraph 2.3.4.
BURST-MODE
The burst mode is discussed in paragraph 2.8.1.
DATA-GROUP
This menu selection chooses the data items that are stored in
the buffer. Note that changing the data grouping clears the
buffer.
FULL: With this selection, for each reading, the following
information is stored: units, channel number (if applicable),
reading number, time-stamp, and status (overflow).
2-67
Page 87

Front Panel Operation
The “full” data group should be used for 6.5 digits or greater
resolution. It also allows you to change function, range, or
channel while storing.
COMPACT: With this selection, readings, units, reading
numbers, and status (overflow) are stored. This allows more
readings to be stored in the buffer.
“Compact” is only accurate and displayed to 5.5 digits. It
does not allow changes of function, range, or channel while
storing.
CONTROL
This menu item controls the type of data storage.
FILL-AND-STOP: This control selection fills the buffer
with the requested number of readings and stops. You can
then recall the readings.
PRETRIGGER: This selection continuously stores readings until a user-programmed trigger event occurs. It then
stores post-trigger readings. For example, with a buffer size
of 100 readings, there will be 50 readings stored before the
trigger event and 50 readings stored after the trigger.
The first reading after the trigger is reading zero. Pretrigger
readings have reading numbers and relative time-stamps
with a minus sign; post-trigger readings have reading numbers and relative time-stamps with a plus sign.
After selecting PRETRIGGER, configure pretrigger control
further as follows:
• PERCENTAGE or READING-COUNT — Specify the
number of readings to store before the trigger event as a
percentage of the total number of stored readings, or as
a number of pretrigger readings. You will be prompted
to enter the percentage or count value.
• EVENT — Selects the source of the pretrigger or
“mark-point” event. This can be a Manual, GPIB, Trigger Link or External trigger.
CONTINUOUS: With this control selection, readings are
always stored in the buffer. The process continues, with the
oldest readings being overwritten in a circular manner, until
storage is interrupted with the EXIT key.
NEVER: Gets set to this if data storage has been interrupted.
Pressing the STORE key changes NEVER to FILL-ANDSTOP.
CLEAR-ALL
This action can be used at any time to clear the data buffer of
all stored readings and buffer statistics. Since the MEM1 and
MEM2 memory options are non-volatile, clear-all is the only
way for the operator to clear the reading buffer.
TIMESTAMP
When using FULL data grouping (see DATA-GROUP), a
timestamp is included with each buffer reading. This menu
selection is used to check and/or change the timestamp type
and format.
TYPE: This menu item is used to check and/or change the
timestamp type. Note that changing the timestamp type
clears the buffer.
• RELATIVE-TIME — With this selection, timestamps
are oriented to a timer with the first buffer reading
timestamped at 0.000000 seconds. Each following
timestamp is then based on the currently selected format (see FORMAT). With the ABSOLUTE format
selected, the timestamp for each reading is referenced
(in seconds) to the first buffer reading. W ith the DELTA
format selected, each timestamp is referenced (in seconds) to the previous timestamp.
• REAL-TIME — With this selection, timestamps are
oriented to the real-time clock and are based on the currently selected format (see FORMAT). With the ABSOLUTE format selected, each reading is simply
timestamped with the actual time and date. Time can be
expressed in the 12-hour (AM, PM) format or the 24hour format (see CLOCK in paragraph 2.12.7).
With the DELTA format selected, the first buffer reading is timestamped at 00000d 00h 00m 00.00s (zero
days, hours, minutes and seconds). Each subsequent
timestamp is referenced (in days, hours, minutes and
seconds) to the previous timestamp.
Timestamp type for buffer readings is coupled to timestamp
type for bus readings. Thus, if you change timestamp type
from this menu structure, it also changes in the MAIN
MENU structure (see TIMESTAMP in paragraph 2.12.7).
FORMAT: This menu item is used to check and/or change
the timestamp format. Note that if format is changed after
readings are stored in the buffer, the timestamps will change
to reflect the alternate format.
• ABSOLUTE — With this selection, each timestamp
provides the time and date that the reading was taken
(see REAL-TIME timestamp type), or the number of
seconds from the first buffer reading that the reading
was taken (see RELATIVE-TIME timestamp type).
2-68
Page 88

Front Panel Operation
Table 2-32
Fill-and-stop sequence
Action Result Annunciator
STORE
ENTER
RECALL
EXIT
STORE 00100 READINGS
Storing reading #xx of 100
Storage complete; press RECALL
Rdg#+00000 @Time=+000.000000 sec
...
Rdg#+00099 @Time=+002.700473 sec
(normal reading display)
(* on)
(* off)
• DELTA — With this selection, each timestamp is referenced to the timestamp for the previous reading. This
provides the time between buffer readings. Timestamps
are provided in days, hours, minutes and seconds (see
REAL-TIME timestamp type) or in seconds (see RELATIVE-TIME timestamp type).
COUNT
With this menu selection, you specify the number of readings to store.
ENTER-COUNT: This item allows you to specify the b uf fer size in number of readings.
USE-TRIGGER-MODEL: This selection lets you default
to the measure count in the present trigger configuration, as
long as the measure count is a finite value.
FEED
This selection allows you to select the source of readings to
be placed in the buffer.
AFTER-CALC: With this item, readings are stored in the
buffer after any enabled math operations are performed.
BEFORE-CALC: With this item selected, readings are
placed in the buffer before any math is performed.
NONE: With NONE selected, no readings are placed in the
buffer when storage is performed. Pressing the STORE key
changes NONE to the AFTER-CALC selection.
2.8.3 Storing and recalling readings
T ables 2-32 through 2-34 detail the sequence of steps for the
various modes of buf fer control. The tables assume the buf fer
is configured as explained in paragraph 2.8.2.
Note that during data storage, the reading number on the bottom line of the display is one ahead of the reading on the top
line.
There are “multiple displays” available when recalling buffered readings. These are explained in paragraph 2.8.4.
2-69
Page 89

Front Panel Operation
Table 2-33
Continuous sequence
Action Result Annunciator
STORE
ENTER
RECALL
EXIT
RECALL
EXIT
EXIT
Table 2-34
Pretrigger sequence
Action Result Annunciator
STORE
ENTER
TRIG
RECALL
EXIT
Note: A manual trigger is used as an example. Other pretrigger events include GPIB, trigger link,
and external.
STORE 00100 READINGS
Storing reading #xx of 100
100 rdgs stored; continuous ON
Rdg#+00000 @Time=+003.903546 sec
...
100 rdgs stored; continuous ON
Rdg#+00000 @Time=+067.709331 sec
...
100 rdgs stored; continuous ON
STORAGE INTERRUPTED
Acquired 100 of 100 readings
(normal reading display)
STORE 00100 READINGS
Waiting for pretrigger event
Storing reading #xx of 50
Storage complete; press RECALL
Rdg#-00050 @Time=-004.999990 sec
...
Rdg#+00000 @Time=+000.000000 sec
...
Rdg#+00049 @Time=+004.899996 sec
(normal reading display)
(* on)
(* off)
(* on)
(* off)
2.8.4 Buffer multiple displays
Math operations performed on buffered readings are available when readings are recalled. Just press NEXT DISPLAY
to view the math operation on the bottom line of front panel
display, in the following order:
1. MAX maximum reading in buffer, for example:
MAX=+1.635968e+00 at RDG# +00090
Notes:
A. Display response may be slow due to calculation of
statistics for large buffers.
2-70
B. Exponents are in terms of primary units of function
on top line (i.e., volts, not millivolts).
2. MIN minimum reading in buffer, for example:
MIN=+1.627611e+00 at RDG# +00012
3. AVG This math operation displays the mean value of
the buffered readings, for example:
AVG=+1.6345e+00
Page 90

Front Panel Operation
The equation used to calculate the mean is:
n
X
∑
i
i1=
---------------=
y
n
where: xi is a stored reading, and
n is the number of stored readings.
Note: If n = 0, the result is NAN (not a number).
4. SDEV This operation displays the standard de viation
of the stored readings, for example:
SDEV=1.4944e-03
The equation used to calculate the standard deviation is:
2
n
X
∑
=
y
i=1
-----------------------------------------------
where: xi is a stored reading, and
n is the number of stored readings.
Note: If n ≤ 1, the result is NAN (not a number).
NOTE
These statistics are invalid if the measurement function changed during data store
(e.g., when scanning different functions).
n
1
2
-- -
-
i
n
n-1
∑
i=1
X
i
by pressing the FILTER key (FILT annunciator turns on).
Pressing FILTER a second time disables the filter.
Filtering is performed only on primary display measurements; it has no effect on multiple displays.
2.9.1 Filter types
The Model 2002 has two types of digital filters: averaging
and advanced. Both types are a simple average of one to 100
reading conversions. The difference between them is the
user-programmable noise “window” of the advanced filter.
The noise window, which is expressed as a percentage of
range (0-100%), allows a faster response time to large signal
step changes (e.g., scanned readings). A reading conversion
outside the plus or minus noise window fills the filter “stack”
immediately.
If the noise does not exceed the selected percentage of range,
the reading is based on an average of reading con versions. In
this case, the advanced filter works the same as the av eraging
filter. If the noise does exceed the selected percentage, the
reading is a single reading conversion, and new averaging
starts from this point. The two filter types are compared in
Figure 2-30.
2.9.2 Filter modes
The Model 2002 uses IEEE-754 floating
point format for math calculations.
The last display in this series allows you to dump the buffered readings to a printer. See paragraph 2.12.2 for details on
configuring printers.
2.9 Filter
Filtering stabilizes noisy measurements. The Model 2002
uses a digital filter, which is based on reading conversions.
The displayed, stored, or transmitted reading is simply an average of a number of reading conversions.
When a filter is enabled, the selected filter configuration for
that measurement function is in effect. Filtering is enabled
An additional filter parameter is the mode, either moving or
repeating. A moving filter is a first-in, first-out stack, where
the newest reading conversion replaces the oldest. An average of the stacked reading conversions yields a reading.
Therefore, after a selected number of conversions, a moving
filter gives a new reading for every new conversion.
A repeating filter takes a selected number of reading conversions, averages them, and yields a reading. It then flushes its
stack and starts over . This characteristic is useful when scanning channels.
If burst mode is enabled with filtering, the post-processing
time increases. A filter mode setting of repeating is ignored
in burst mode.
Filter modes are compared in Figure 2-31.
2-71
Page 91

Front Panel Operation
Voltage
+1% of range
Type = averaging
Conversions:
Readings = 5
Mode = moving
Conversions:Type = advanced
Readings = 5
Mode = moving
Noise level = 1% of range
B
Window
Violation
-1% of range
+1% of range
A
-1% of range
t
1
A
1
A
1
A
1
A
1
A
1
Reading
#1
A
1
A
1
A
1
A
1
A
1
Reading
#1
t
2
A
2
A
1
A
1
A
1
A
1
Reading
#2
A
2
A
1
A
1
A
1
A
1
Reading
#2
t
3
A
3
A
2
A
1
A
1
A
1
Reading
#3
A
3
A
2
A
1
A
1
A
1
Reading
#3
t
4
A
4
A
3
A
2
A
1
A
1
Reading
#4
A
4
A
3
A
2
A
1
A
1
Reading
#4
t
5
A
5
A
4
A
3
A
2
A
1
Reading
#5
A
5
A
4
A
3
A
2
A
1
Reading
#5
t
6
A
6
A
5
A
4
A
3
A
2
Reading
#6
A
6
A
5
A
4
A
3
A
2
Reading
#6
t
7
B
1
A
5
A
4
A
3
A
2
Reading
#7
B
1
B
1
B
1
B
1
B
1
Reading
#7
t
8
B
2
B
1
A
5
A
4
A
3
Reading
#8
B
2
B
1
B
1
B
1
B
1
Reading
#8
t
9
B
3
B
2
B
1
A
5
A
4
Reading
#9
B
3
B
2
B
1
B
1
B
1
Reading
#9
t
10
B
4
B
3
B
2
B
1
A
5
Reading
#10
B
4
B
3
B
2
B
1
B
1
Reading
#10
Integration
Time
t
11
B
5
B
4
B
3
B
2
B
1
Reading
#11
B
5
B
4
B
3
B
2
B
1
Reading
#11
Conversions:Type = averaging
Readings = 5
Mode = repeating
Type = advanced
Conversions:
Readings = 5
Mode = repeating
Noise level =1% of range
Figure 2-30
Averaging and advanced filter types
A
A
1
A
1
A
1
A
1
A
1
A
1
A
1
A
1
A
1
A
1
A
2
3
A
A
1
2
A
A
1
1
A
A
1
1
A
A
1
1
A
A
2
3
A
A
1
2
A
A
1
1
A
A
1
1
A
A
1
1
A
A
5
4
A
A
4
3
A
A
3
2
A
A
2
1
A
A
1
1
Reading
#1
A
A
5
4
A
A
4
3
A
A
3
2
A
A
2
1
A
A
1
1
Reading
#1
B
B
B
B
A
6
1
2
A
A
6
6
A
A
6
6
A
A
6
6
A
A
6
6
A
B
6
1
A
B
6
1
A
B
6
1
A
B
6
1
A
B
6
1
3
B
B
1
2
A
B
6
1
A
A
6
6
A
A
6
6
B
B
2
3
B
B
1
2
B
B
1
1
B
B
1
1
B
B
1
1
Reading
4
B
3
B
2
B
1
A
6
Reading
#2
B
4
B
3
B
2
B
1
B
1
#2
B
5
B
5
B
5
B
5
B
5
B
5
B
4
B
3
B
2
B
1
2-72
Page 92

Front Panel Operation
Conversion #10
#9
#8
#7
#6
#5
#4
#3
#2
Conversion #1
A. Type - Average, Readings = 10, Mode - Moving
Conversion #10
#9
#8
#7
#6
#5
#4
#3
#2
Conversion #1
Conversion #11
#10
Reading
#1
Conversion #2
Conversion #20
#19
Reading
#1
Conversion #11
#9
#8
#7
#6
#5
#4
#3
#18
#17
#16
#15
#14
#13
#12
Reading
Reading
Conversion #12
#11
#8
#2
Conversion #3
Conversion #30
#29
#26
#2
Conversion #21
#10
#9
#7
#6
#5
#4
#28
#27
#25
#24
#23
#22
Reading
#3
Reading
#3
B. Type - Average, Readings = 10, Mode - Repeating
Figure 2-31
Moving and repeating filter modes
2.9.3 Response time
The various filter parameters have the following effects on
the time needed to display, store, or output a filtered reading:
• Filter type: The time to the first reading is the same for
both types, but thereafter averaging mode yields a faster
reading than repeating mode. Also, advanced has a
faster response to changes in the input signal than
averaging.
• Number of reading conversions: Speed and accuracy
are tradeoffs.
• Noise window: For the advanced type, a tradeoff of
speed, accuracy, and response to input signal changes.
2.9.4 Auto filtering
For those measurement functions with a filter, one of the possible selections is automatic filtering. Depending on the measurement function and type, the A UT O selection may disable
filtering. Auto filtering is summarized in Table 2-35.
2-73
Page 93

Front Panel Operation
Table 2-35
Auto filters
Measurement Filter
Averaging
Function Type State Type Readings
DC voltage -- On Advanced 10 Moving 1%
AC voltage RMS, average, low fre-
quency RMS
Peak, pos. peak spikes,
neg. peak spikes
DC current Normal
In-circuit
AC current RMS, average Off Advanced 10 Moving 5%
2-wire resistance -- On Advanced 10 Moving 1%
4-wire resistance -- On Advanced 10 Moving 1%
Frequency -- (See
Temperature -- On Average 10 Moving -
Note: A filter is not available on the frequency function.
Off
On
On
On
note)
Advanced for
volts; A verage for
dB, dBm
Advanced for
volts; A verage for
dB, dBm
Advanced
Advanced
10
10
10
10
Mode
Moving
Moving
Moving
Moving
Noise
Tolerance
Level
5%
5%
1%
1%
2.9.5 Configuring the filters
Each measurement function except frequency has its own
configuration for a digital filter. A digital filter configuration
menu is shown in Table 2-36.
Table 2-36
CONFIGURE FILTER menu structure
Menu item Description
Auto Default to filter appropriate for mea-
surement function and type.
A veraging Program simple a verage filter (1-100
readings).
Advanced Program simple average filter (1-100
readings), with a noise tolerance
window
(0-100% of range).
Averaging-mode Select moving average or repeating
average mode.
Choosing the filter parameters for each function follows the
same procedure. There are three ways to display a filter configuration menu:
•T o configure the filter of the present function, just press
CONFIG, then FILTER.
•T o configure the filter of another function and remain in
the present function, press CONFIG, and the appropriate function key, then select FILTER from its
menu.
•To configure the filter of another function and change
to that function, press the appropriate function key,
and CONFIG, then FILTER.
AUTO
This menu item selects auto filtering. When chosen, auto filtering enables the filter parameters listed in Table 2-35 for
the function you are presently configuring. Note that selecting AUTO immediately enables the filter for that function
when the state listed in Table 2-35 is ON. In this case, if you
are configuring the filter for the present measurement function, the FILT annunciator comes on.
2-74
Page 94

Front Panel Operation
AVERAGING
Use this selection for a non-windowed averaging filter. A
message indicating the presently set number of reading conversions to average (the “stack” size) is displayed. If you
change the filter value, be sure to press ENTER.
Note that the number of reading conversions selected for the
averaging filter type is also coupled to that for the advanced
filter type.
ADVANCED
This selection is for an averaging filter with a noise window.
(It is not available with dB or dBm units, ratio or delta, temperature or frequency.) A message indicating the presently
set number of reading conversions to average (the “stack”
size) is displayed.
You can retain the present filter value or you can key in another value. In either case, press ENTER to display the maximum noise window.
The displayed level is the plus or minus percentage of range
window around the first reading conversion in the stack. Be
sure to press ENTER if you key in a different percentage.
• Math performed on buffered readings (maximum and
minimum values, average, and standard deviation).
• Math performed on single readings as a part of a pass/
fail limits test.
• Math performed on scanned readings (ratio and delta).
The first category is configured from the CONFIGURE
MATH menu and is described in this paragraph. Math operations on buffered readings are av ailable in multiple displays
of recalled data and are discussed in paragraph 2.8. Limit
tests are described in paragraph 2.12, under main menu operations. Ratio and delta calculations on scanned channels
are available from the CONFIGURE SCAN menu, as discussed in paragraph 2.11.
Note that once enabled for a function, the polynomial and the
percentage calculations are in effect across function changes.
NOTE
The Model 2002 uses IEEE-754 floating
point format for math calculations.
2.10.1 Polynomial
Note that the number of reading conversions (filter v alue) selected for the advanced filter is also coupled to that for the
averaging filter.
AVERAGING-MODE
This selection determines the mode of a digital filter for a
measurement function, either a moving or repeating average.
MOVING: This item selects a moving filter, where a new
reading conversion is shifted into a stack as the oldest conversion is shifted out (FIFO). When the stack is full, a simple
average is taken to yield a reading.
REPEAT: This menu item selects a repeating filter, where an
average of a selected number of reading con versions is tak en
for each reading.
2.10 Math
Model 2002 math operations are divided into four categories:
• Math performed on single readings (polynomial percent, and percent deviation).
This math operation allows you to mathematically manipulate normal display readings (X) according to the following
polynomial calculation:
Y = (a2)X
where: X is the normal display reading
a2, a1 and a0 are user entered constants
Y is the displayed result
The value of the “a2”, “a1” and “a0” constants can be
changed through the CONFIGURE MATH menu (see paragraph 2.10.4). The before and after calculation can be viewed
with one of the multiple displays, as described in paragraph
2.10.5. When necessary, the resulting Y value is displayed in
scientific notation.
The polynomial can be used in place of the more familiar
mX+b slope calculation. Simply let a2=0, a1=m and a0=b.
Over the bus, the mX+b calculation still exists and is coupled
to the polynomial calculation. Thus, changing a1 and/or a0
changes m and/or b respectively. See paragraph 3.11 for
details.
2
+ (a1)X + (a0)
2-75
Page 95

Front Panel Operation
2.10.2 Percent
This operation lets you specify a target reading value. The
displayed reading will be expressed as a percentage of the
target value, often in scientific notation. The percentage calculation is performed as follows:
Input Reading
Percent
As an example, consider the default target v alue for percentage calculations, where:
Therefore, on the 200µA range, a 100µA input would be
0.01% of the target value and a typical reading would be displayed as follows:
+1.0000e+04µAAC%
Range: 200 µAAC Coupling: AC
Note that the value is not 10000%, but 10000µ%, which
equals 0.01%. With the calculate multiple display selected,
as described in paragraph 3.10.5, the display would be:
+1.0000e+04µAAC%
Reading = +100.000
--------------------------------- Target Value
100% = +1.000000e+00
x 100=
2.10.4 Selecting and configuring math
The polynomial, percent or percent deviation calculation is
selected and configured from the CONFIGURE MATH
menu (see Table 2-37). The selected calculation is enabled
by pressing the MATH key. The Model 2002 then displays
the result of the calculation, using scientific notation where
necessary. Pressing MATH a second time disables the
calculation.
Table 2-37
CONFIGURE MATH menu structure
Menu item Description
None Select no calculation when MATH
key is pressed.
Polynomial Select polynomial calculation and
Percent Select percent calculation and enter
Percent deviation Select percent deviation calculation.
NONE
enter constants.
target (reference) value.
where the bottom line shows the reading (in the units and
multiplier prefix of the top line) before the percentage calculation is performed.
2.10.3 Percent deviation
The following math calculation provides the percent deviation between the normal display reading and the currently
stored REL value for the selected function:
X-Y()
---------------
PD
where: X is the normal display reading
Y is the REL value for the selected function
PD is the displayed result (percent deviation)
Percent Deviation is enabled through the CONFIGURE
MATH menu (see paragraph 2.10.4).
Note that Percent Deviation does not scale based on the m, k,
or M range factor. For example, 10% deviation on the 20k Ω
range will be displayed as 10.00000. If the number is too
large for the allowed number of leading zeroes (for example
10 on the 2k Ω range), the display will switch to 7-1/2 digit
scientific notation.
Y
x 100%=
With this menu item, no math operation goes into effect
when the MATH key is pressed. The MATH annunciator
lights, but NONE is displayed on the top line.
POLYNOMIAL
This menu item selects the polynomial calculation and
allows you to program the polynomial constants. The “a2”
constant is displayed first. You can retain the displayed value
or key in a new v alue. In either case, press ENTER to display
the “a1” constant. Retain or change this constant and press
ENTER to display the “a0” constant. If you change the “a0”
constant, be sure to again press ENTER.
PERCENT
This menu item selects the percent calculation and lets you
specify the target value. If you key in a new target value, be
sure to press ENTER.
PERCENT DEVIATION
This menu item selects the percent deviation calculation and
returns the display to the normal measurement state.
2-76
Page 96

Front Panel Operation
2.10.5 Calculate multiple display
One of the multiple displays lets you view the reading on the
bottom line of the display and the result of the calculation on
the top line. This display is available by repeatedly pressing
either the NEXT or PREVious DISPLAY key to scroll
through the multiple displays for the particular function. The
following is a typical message for a percentage calculation:
-7.0431e+01 VDC %
Reading = -0.704311
The display resolution on the bottom line follows that chosen
for the top line. If scientific notation is required on the top
line, it is fixed at 4.5 digits. The value on the bottom line
tracks the units and prefix of the top line. (For example, if the
top line displays µA, then the units on the bottom line are
µA.)
Note that this multiple display is not available on the frequency function.
2.11 Scanning
The Model 2002 can be used with an internal scanner card
(Model 2001-SCAN or 2001-TCSCAN) or with external
scanner cards installed in switching mainframes such as the
Models 706, 7001 and 7002. The following paragraphs discuss various aspects of using scanning with the Model 2002.
2.11.1 Scanning overview
A scanner allows you to switch among a number of input signals to the Model 2002 for measurement. The channel control and scanning capabilities depend on whether an internal
or external scanner card is being used, as well as on the capabilities of the scanner card in question. Refer to the documentation supplied with the scanner card for specific
connection information.
Using an internal scanner card
The optional Model 2001-SCAN scanner card allows you to
switch or scan up to ten 2-pole channels, or five 4-pole channels. Two of the channels use solid-state switching for highspeed multiplexing, ratio, or delta applications.
The optional Model 2001-TCSCAN Thermocouple/General
Purpose Scanner Card allows you to multiplex one of nine 2pole, or one of four 4-pole analog signals into the Model
2002, and/or any combination of 2- or 4-pole analog signals.
Refer to the instruction manual for the Model 2001-TCSCAN for complete operation information.
When using these cards, the Model 2002 can:
• Close and open individual channels.
• Scan through channels using a separate measurement
function for each channel, if desired.
• Perform ratio and delta measurements using two userdefined channels.
Using external scanner cards
When using external scanning, you can define separate measurement functions for a maximum of 80 channels. Note
however, that you cannot close or open external channels
using Model 2002 controls. Use the switching mainframe
controls to open and close individual channels.
In order to synchronize Model 2002 measurements with
external channel closure, connect the Model 2002 external
trigger inputs or the trigger link to the external switching
mainframe trigger inputs and outputs. Refer to paragraphs
2.7.6 and 2.7.7 for examples on using external triggering and
the trigger link.
2.11.2 Front panel scanner controls
Controls that affect scanner card operation include:
• CHAN: Allows you to open and close internal scanner
card channels.
• CONFIGURE CHAN: Defines the measurement functions for each internal and external scanner card channel, selects the number of external channels, defines
channels assigned to the internal scan list, and saves/
restores an alternate measurement function.
• CONFIGURE SCAN: Selects internal or external scanning and controls ratio/delta operation when using the
internal scanner.
• SCAN: Starts/stops scanning using the selected scan
list. Configures scan count, scan interval, and enables
buffer storage and recall if internal or external list is
selected.
• EXIT: Disables scanning and returns to normal
operation. (Trigger model is restored to pre-scanning
configuration.)
• and : Allows you to manually scan through channels.
• PREV/NEXT DISPLAY: Allo ws you to display the two
adjacent channels (manual scanning only).
2-77
Page 97

Front Panel Operation
2.11.3 Using CHAN key to close and open internal
channels
The CHAN key controls channels on the internal scanner
card only. The CHAN key allows you to directly:
• Close a specific channel (or channel pair for 4-wire
functions).
• Immediately open any internal closed channel (or channel pair for 4-wire functions).
Channel selection menu
T able 2-38 summarizes the channel selection menu structure
along with a brief description of each item. More detailed
descriptions of these menu items are presented in the following paragraphs. See paragraph 2.3.4 for general rules on navigating menus.
With a scanner card installed in the option slot of the Model
2002, the following options are available when CHAN is
pressed:
CLOSE-CHANNEL: This menu item prompts you to enter
the channel (from 1 to 10) that you wish to close. Use the
cursor keys ( and ) and the RANGE ▲ and ▼ keys to
display the channel and press ENTER. The number of the
closed channel will be displayed on the front panel along
with normal readings.
Selecting a different channel from the one that is presently
closed will cause the closed channel to open and allow a settling time before closing the selected channel.
Channel relays will be closed according to the presently
selected function. If a 2-wire function is used, only the relay
for that one channel will be closed. If a 4-wire function is
selected, both the selected channel relay and the matching
relay pair will close. For example, closing channel 2 will also
close the channel 7 relay. Fixed 4-pole relay pairs are:
• 1 and 6 (not available for Model 2001-TCSCAN)
• 2 and 7
• 3 and 8
• 4 and 8
• 5 and 10.
OPEN-ALL-CHANNELS: Selecting OPEN-ALL-CHAN-
NELS will immediately open any closed scanner card channels or channel pair for 4-wire functions.
Table 2-38
CHANNEL SELECTION menu structure
Menu item Description
CLOSE-CHANNEL
ENTER CHAN#01 (1-10)
OPEN-ALL-CHANNELS
Note: This menu is only available with a scanner card installed.
Close channel menu:
Use cursor, range, and ENTER keys.
Press ENTER to open closed channel(s).
2-78
Page 98

Front Panel Operation
Table 2-39
CONFIGURE CHANNELS menu structure
Menu item Description
INTERNAL-CHANS
SET INTERNAL CHANS
1=DCV 2=DCV 3=DCV 4=DCV 5=DCV
Defines internal functions:
Use range and cursor keys to select channels and functions.
EXTERNAL INPUTS
# EXTERNAL INPUTS=80
DEFAULT
CHOOSE-FUNCTIONS
SELECT CHAN=01
CHANNEL #01 FUNCTION
Sets number of external channels and functions:
# of external channels (1-80).
Selects default function for all external channels.
Use to select channel functions.
Select channel using range and cursor keys.
Select function using cursor keys.
SAVE-ALT-FCN
RESTORE-ALT-FUNCTION
Stores present function as alternate.
Restores saved alternate function.
2.11.4 Using CONFIGURE CHAN to configure
channels
The CONFIGURE CHANNELS menu allows you to:
• Select measurement functions for internal scanner card
channels, and define which channels to use when scanning.
• Select measurement functions and the number of channels in an external scanner used with the Model 2002.
• Define, save, and restore an alternate measurement
function which can then be assigned to specific channels.
Table 2-39 summarizes the CONFIGURE CHANNELS
menu structure, which is discussed in detail in the following
paragraphs. Again, see paragraph 2.3.4 for more information
on navigating menus.
The CONFIGURE CHANNELS menu is displayed by
pressing CONFIG and then CHAN.
INTERNAL CHAN
The INTERNAL-CHANS selection allows you to set the
measuring function for each of the internal scanner card
channels. When this selection is made the currently selected
function for each channel is displayed.
Changes are made by placing the cursor on the desired channel and using the RANGE ▲ and ▼ keys to select the desired
measurement function:
DCV: DC volts
ACV : A C volts
2W: 2-wire ohms
4W: 4-wire ohms
FRQ: Frequency
TMP: T emperature
ALT: alternate function (see below)
JN1...JN5: Reference junction type
--- : None
4W function: The Ω 4W function is valid only for chan-
nels 1-5 for the Model 2001-SCAN and channels 2-5 for the
Model 2001-TCSCAN. If selected, “PRD” (paired) will be
shown on the corresponding paired channel (6-10 for the
Model 2001-SCAN and 7-10 for the Model 2001-TCSCAN). Once Ω 4W is selected for a valid channel, changing
the assignment to a different function will de-assign the
paired channel and change the function to “---” (none).
TMP function: The TMP function is valid for the same
channels as the Ω 4W function if the temperature sensor is a
4-wire RTD type. If a 2-wire RTD type is used, channels 610 could be assigned to the TMP function, but if the sensor
type is later changed to a 4-wire RTD, any channel from 610 will then be set to “---” (none). Thermocouple TMP measurements, using the Model 2001-TCSCAN, can be assigned
to channels 2-10.
Ω
Ω
Ω
2-79
Page 99

Front Panel Operation
JN functions: Note that there are five reference temperature
functions available (JN1-JN5). With the Model 2001-TCSCAN, the reference junction must be assigned to channel 1.
Junction types are defined using the CONFIGURE TEMPERATURE menu.
NOTE
The JN functions in the internal menu are
intended for use with thermocouple
scanner card (Model 2001-TCSCAN).
The Model 2001-SCAN internal scanner
card is not intended to be used with
thermocouples.
No function (---): Selecting none (---) effectively removes
that channel from the scan list. When scanning, the instrument will skip any channels that have no function defined.
EXTERNAL-INPUTS
This menu item allows you to select measurement functions
for external scanner cards used with the Model 2002 Multimeter. When the EXTERNAL-INPUTS menu item is selected, the instrument will prompt you to enter the number of
channels being used.
peak function for that channel even if the instrument is measuring a different type of ACV (RMS for example).
You can also use the ALT function to store an existing main
function but with a different set of operating parameters. For
example, you could set up a specific set of operating parameters for the straight DCV function and a second DCV setup
as the ALT function. This arrangement allows you to specify
changes in virtually any measurement parameter from channel to channel even if the measurement functions are the
same.
NOTE
Some functions may not be compatible
with certain scanner cards. For example,
you should not use the DCI and ACI functions with the Model 2001-SCAN and
2001-TCSCAN internal scanner cards.
SAVE-ALT-FCN stores the presently selected function and
all its configured settings as the ALT function.
RESTORE-AL T-FCN restores the function that was saved as
the ALT function and all associated settings as if a normal
function change were taking place.
Use the cursor and range keys to select the number of channels (1-80), then press ENTER. Once the number of inputs is
selected, you will be prompted for channel functions.
Briefly, these menu items allow you to select the following:
DEFAULT: This selection assigns the presently selected
measurement function to all external channels.
CHOOSE-FUNCTION: This menu item allows you define
functions for each external channel. When selected, you will
be prompted to enter the channel to be programmed. Use the
cursor keys and the range keys to key in the channel and
press ENTER. The instrument will then display the available
functions.
Use the cursor keys to select the desired function, then press
ENTER. Repeat the procedure for every external channel to
be defined.
SAVE-ALT-FCN and RESTORE-ALT-FCN
An ALT (alternate) function is one that cannot be directly accessed with one of the eight function keys. For example, assume that you select the A CV peak function using CONFIGACV. You can then use SAVE- ALT to assign peak ACV to
the ALT function. Whenever the ALT function is encountered in the scan list, the instrument will switch to the ACV
2.11.5 Using CONFIG-SCAN to configure
scanning
The SCAN OPERATION menu allows you to configure the
following scanner aspects:
• Select the internal or external channel list for scanning.
• Enable ratio and delta operation.
Table 2-40 summarizes the SCAN OPERATION menu
structure, which is discussed in more detail in the following
paragraphs. See paragraph 2.3.4 for more information on
menu navigation.
Pressing CONFIG-SCAN will display the SCAN OPERATION menu. These choices select the action the instrument
will take when it is triggered.
INTERNAL
This selection enables scanning with the internal scanner
card. When this selection is chosen, the Model 2002 will
change to the function specified for the first channel and then
close the channel and take a reading. When the next trigger
is received, the instrument will open the present channel,
change to the specified measuring function for the next chan-
2-80
Page 100

Front Panel Operation
nel, and then close the channel and take a reading. The process repeats until all channels in the list are scanned.
The instrument defaults to this selection if it detects a scanner card on power-up.
Table 2-40
SCAN OPERATION menu structure
Menu item Description
INTERNAL Enables internal scanning.
EXTERNAL Enables external scanning.
RATIO
MEASURE
REFERENCE
FUNCTION
DELTA
MEASURE
REFERENCE
FUNCTION
Enables ratio mode (internal).
Selects measure channel.
Selects reference channel.
Selects ratio function.
Enables delta mode (internal).
Selects measure channel.
Selects reference channel.
Selects delta function.
EXTERNAL
This menu selection enables scanning with an external scanner card located in a switching mainframe. This selection
operates in a manner similar to INTERNAL except that the
internal scanner is not used. When this menu item is selected,
the instrument will immediately change to the selected measuring function for the first channel. When the multimeter is
triggered, it will take a measurement and then change to the
measurement function for the next channel. This process
repeats until all channels in the scan list are scanned.
The instrument defaults to this selection if it does not detect
a scanner card on power-up.
RATIO and DELTA
RATIO or DELTA is selected, the instrument will close the
scanner reference channel and then wait for a trigger. When
the reading is triggered, the unit will make a measurement on
the reference channel, switch to the measurement channel,
and then take a second measurement. After measuring the
measurement channel, the unit will compute and display the
ratio or delta value, and switch back to the reference channel
to wait for the next trigger. Note that the ratio mode uses 71/2 digits of display resolution, but the channel number will
not be displayed.
The following options are av ailable for RATIO and DELTA:
MEASURE: This option is used to select the measure chan-
nel. After selecting MEASURE, place the cursor on the
desired channel and press ENTER.
REFERENCE: This option is used to select the measure
channel. After selecting REFERENCE, place the cursor on
the desired channel and press ENTER.
FUNCTION: This option is used to select the function.
After selecting FUNCTION, place the cursor on the desired
function (DCV, Ω 2 or Ω 4) and press ENTER.
Ratio and Delta computation: During configuration, one
channel is defined as the reference channel, and a second
channel is defined as the measurement channel. Ratio and
delta are computed from signals measured on these channels
as follows:
Ratio
Delta = Measure - Reference
Measure
----------------------- -=
Reference
2.11.6 Using SCAN to configure scan parameters
Once an internal or external scan list is enabled, you use the
SCAN key to configure internal or external scanning. The
menu structure of Figure 2-32 shows the procedure.
Either of these two selections configures the Model 2002 to
measure the two specified internal scanner channels and then
compute the ratio or difference (delta) between them. When
The procedure changes scan layer parameters in the trigger
model. When scanning is disabled by the EXIT key, the trigger model is restored to its pre-scanning configuration.
2-81
 Loading...