

Page 1
Printing Recorder
with text printing and
LED dot-matrix display
B 70.6030.0
Operating Manual
2009-06-03/00353037
Page 2
Key functions
e - Paper (chart) fast-forward,
when recording is stopped
(in basic status)
- Abort parameter
entry (Exit)
- Leave the levels
S - Start/Stop
of recording
- Selection of decimal point
position when entering values
- For text entry:
Fast character selection
(jump to “ ”, “0”, “A”, “a”, “°”,
2”
“
, “À”, “à”)
F - Function key for special
functions
(press for at least 4sec)
factory setting:
print the scaling
l, r - Shift cursor left/right
(selecting position)
h, R - Select display:
- Instrument designation,
date & time
- Measurements of the
channels
- System status
- Parameter selection
- Channel selection
- Value selection
from a table of values
- Increment/decrement
present digit
E - Initiate parameter entry
-Confirm entry
- Acknowledge error message
- Activate/de-activate statistical
display (in basic status)
l + r - Activate/de-activate the
display of status/error
messages
h + R - Change to next level
Page 3

Contents
1 Introduction 7
1.1 Preface ......................................................................................................... 7
1.2 Arrangement of the documentation .......................................................... 8
1.2.1 Structure of this operating manual ............................................................... 8
1.3 Typographical conventions ........................................................................ 9
1.3.1 Warning signs ............................................................................................... 9
1.3.2 Note signs ..................................................................................................... 9
1.3.3 Presentation ............................................................................................... 10
2 Instrument description 11
2.1 Display and controls ................................................................................ 11
2.2 Basics of operation ................................................................................... 12
3 Operation and visualisation 23
3.1 Limit monitoring by limit comparators ................................................... 23
3.2 Open-collector outputs ............................................................................ 25
3.3 Different chart speeds (paper feed) ........................................................ 26
3.4 Graphic print-out ...................................................................................... 27
3.4.1 Measurement traces (signal traces) ............................................................ 29
3.4.2 Event traces ................................................................................................ 30
3.5 Text printing ............................................................................................... 31
3.5.1 Printing priorities ......................................................................................... 31
3.5.2 Printing modes ........................................................................................... 34
3.5.3 Queuing during text printing ....................................................................... 35
3.5.4 Limit comparator texts, external text, binary-linked external text .............. 36
3.5.5 Report ......................................................................................................... 38
3.5.6 Switching the chart speed .......................................................................... 41
3.5.7 “Power On” and “Power Off” texts ............................................................. 42
3.5.8 Scaling ........................................................................................................ 43
3.5.9 Time ............................................................................................................ 46
3.5.10 Print out channel numbers ......................................................................... 47
3.5.11 Recording start and stop ............................................................................ 47
3.5.12 Incrementing the two event counters ......................................................... 48
3.5.13 Print test ..................................................................................................... 49
3.5.14 Service print ................................................................................................ 50
Page 4

Contents
3.6 Colour assignment ................................................................................... 51
3.7 Relationship between measurement range and scaling ....................... 52
4 Configuration table 53
4.1 Operating examples ................................................................................. 53
4.2 Table of the configuration parameters ................................................... 55
4.2.1 Operating level (S-level) .............................................................................. 55
4.2.2 Parameter level (P-Level) ............................................................................ 56
4.2.3 Configuration level 1 (C1-level) ................................................................... 57
4.2.4 Configuration level 2 (C2-level) ................................................................... 63
4.2.5 Configuration level 3 (C3-level) ................................................................... 66
5 Identifying the instrument version 69
5.1 Instrument description ............................................................................. 69
5.2 Order details .............................................................................................. 70
6 Installation 71
6.1 Site and climatic conditions .................................................................... 71
6.2 Assembly in a control panel ..................................................................... 71
7 Electrical connection 73
7.1 Installation notes ...................................................................................... 73
7.2 Technical data ........................................................................................... 74
7.3 Connection diagram ................................................................................. 78
7.4 Electrical isolation .................................................................................... 81
8 Starting up 83
8.1 Opening and closing the door ................................................................. 83
8.2 Marking the channel label ........................................................................ 83
8.3 Fitting the print head ................................................................................ 84
9 Consumables 85
9.1 Consumables ............................................................................................ 85
Page 5

Contents
9.2 Removing and replacing the chart cassette .......................................... 86
9.2.1 Changing the roll chart ............................................................................... 88
9.2.2 Changing the fanfold chart ......................................................................... 89
10 Extra codes and accessories 91
10.1 Converting the chart cassette ................................................................. 91
10.2 “8 logic inputs”, “interface for ER8”,
“voltage output” ........................................................................................ 92
10.3 External relay module ER8 ....................................................................... 93
10.4 Setup program .......................................................................................... 95
10.5 Mathematics and logic module ............................................................... 97
10.6 Interface (RS422/RS485) .......................................................................... 98
11 Fault-finding 99
11.1 What to do if … ......................................................................................... 99
12 Appendix 101
12.1 Error messages ....................................................................................... 101
12.2 Hardware fault ......................................................................................... 103
12.3 Status messages .................................................................................... 104
12.4 Character set .......................................................................................... 105
12.5 Summary of the parameters .................................................................. 106
13 Index 109
Page 6

Contents
Page 7

1.1 Preface
E
B
1 Introduction
Please read this Operating Manual before commissioning the instrument.
Keep the operating manual in a place which is accessible to all users at all
times.
Please assist us to improve this manual, where necessary.
Your suggestions will be appreciated.
Phone in Germany (0661) 6003-727
from abroad (+49) 661 6003-0
Fax in Germany (0661) 6003-508
from abroad (+49) 661 6003-607
All the necessary settings are described in this manual. However, if
any problems should arise during start-up, you are asked not to
carry out any unauthorised manipulations. You could endanger
your rights under the warranty!
Please contact the nearest JUMO office or the head office.
When returning modules, assemblies or components, the
regulations of EN 61340-5-1 and EN 61340-5-2 “Protection of
electronic devices from electrostatic phenomena” must be
observed. Use only the appropriate ESD packaging for transport.
Please note that we cannot accept any liability for damage caused
by ESD.
ESD=electrostatic discharge
7
Page 8

1 Introduction
1.2 Arrangement of the documentation
The documentation for this instrument consists of the following parts:
Operating
Manual
B 70.6030.0
Interface
Description
B 70.6030.2
Setup
Program
B 70.6030.3
Online Help The online help is part of the setup program. It is a Windows
This operating manual is always supplied with the instrument. It is addressed
to OEMs (original equipment manufacturers) and users with the appropriate
technical know-how.
In addition to installation and electrical connections, it also includes
information on commissioning, operation, and setting the parameters in the
instrument, on extra codes and accessories.
This manual is supplied with the instrument if the Extra Code “RS422” or
“RS485” was ordered. It provides information about communication with
higher-level (supervisory) systems.
This manual describes the installation of the setup program, and also deals
with special features in the operation of the setup program.
1.2.1 Structure of this operating manual
This operating manual is laid out so that the user is immediately able to get on
with operating and configuring the instrument. To this end, the chapters which
describe procedures which are usually only carried out once, such as
description of the instrument, type designations, assembly and electrical
connections, are placed at the end of the manual.
1
online help.
1. Microsoft and Windows are registered trademarks
of the Microsoft Corporation
8
Page 9

1.3 Typographical conventions
V
E
v
1.3.1 Warning signs
The signs for Danger and Warning are used in this manual under the
following conditions:
Danger
This symbol is used where there may be danger to personnel if the
instructions are disregarded or not followed accurately!
Warning
This symbol is used where there may be danger to equipment or data if the
instructions are disregarded or not followed accurately!
Warning
This symbol is used where special care is required when handling
components which are liable to damage from electrostatic discharge.
1 Introduction
1.3.2 Note signs
Note
This symbol is used when your attention is drawn to a special remark.
Reference
This sign refers to further information in other manuals, chapters or sections.
Footnote
Footnotes are notes which refer to certain points in the text. Footnotes
consist of two parts:
Marking in the text and the footnote text.
The markings in the text are arranged as continuous superscript numbers.
Action
This symbol shows that an action to be performed is described.
The individual steps are designated by the star, for example:
h Press the
abc
h
1
h key
h Confirm with
E
9
Page 10

1 Introduction
1.3.3 Presentation
Keys
h + E
Program
Manager
Edit
Î
instrument data
Keys are shown in a box. Both symbols and texts are possible. If a key has
multiple functions, then the text shown is that which corresponds to the
currently active function.
Screen texts
Texts which are displayed in the setup program are distinguished by italic
script.
Menu items
The menu items in the setup program which are referred to in this manual are
shown in italic script. Menu name, menu item, and sub-menu item are
separated from one another by “
Δ.
10
Page 11
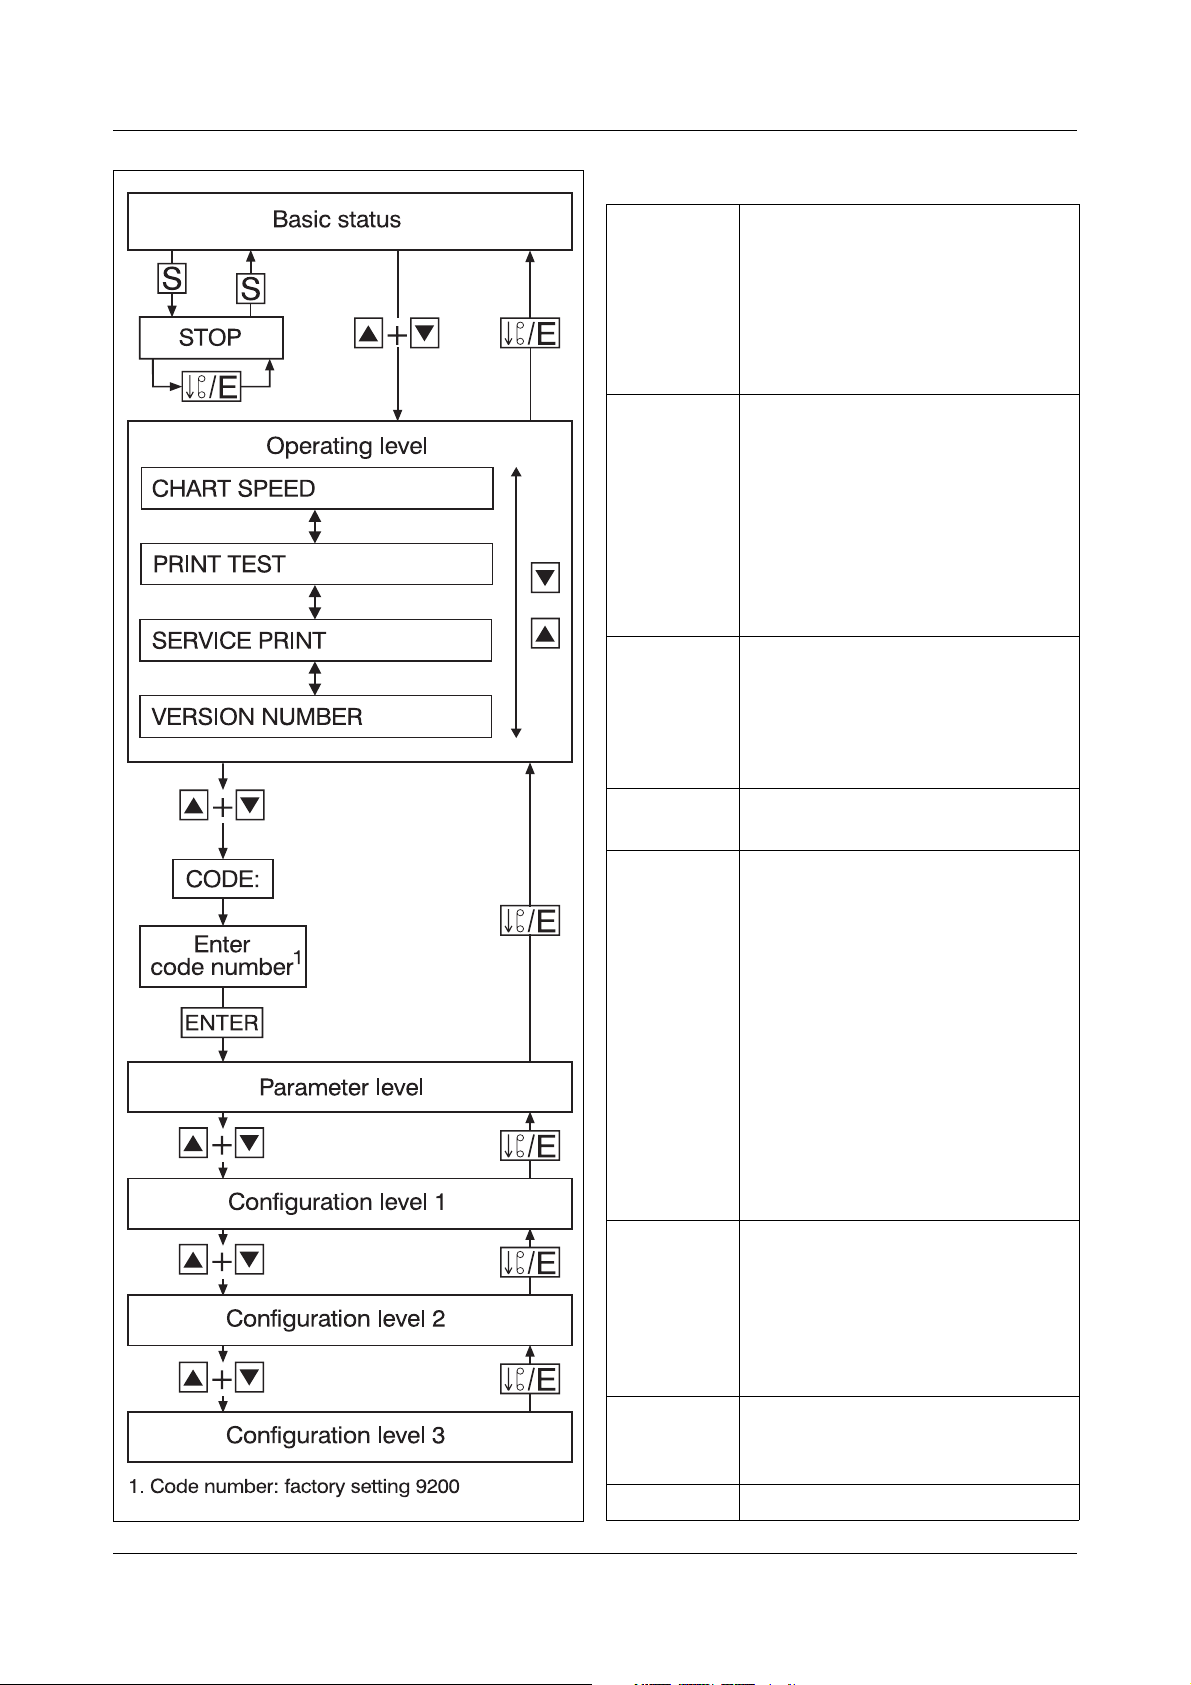
2 Instrument description
Fault signal LED
This lights up as soon as the recording is interrupted by the “end
of chart paper”, “stop” through pressing stop key S , or by an
external stop.
24-character green LED
dot-matrix display
Print head
Keys for
operating und programming
Setup interface
(behind the swing-up
LED dot-matrix)
Panel-mounting housing to IEC 61554 in galvanised steel sheet
Measurement channel label
Here you can enter the channel designation and/or the
corresponding measurement range
Chart paper
Housing door
to open or close
2.1 Display and controls
11
Page 12
2 Instrument description
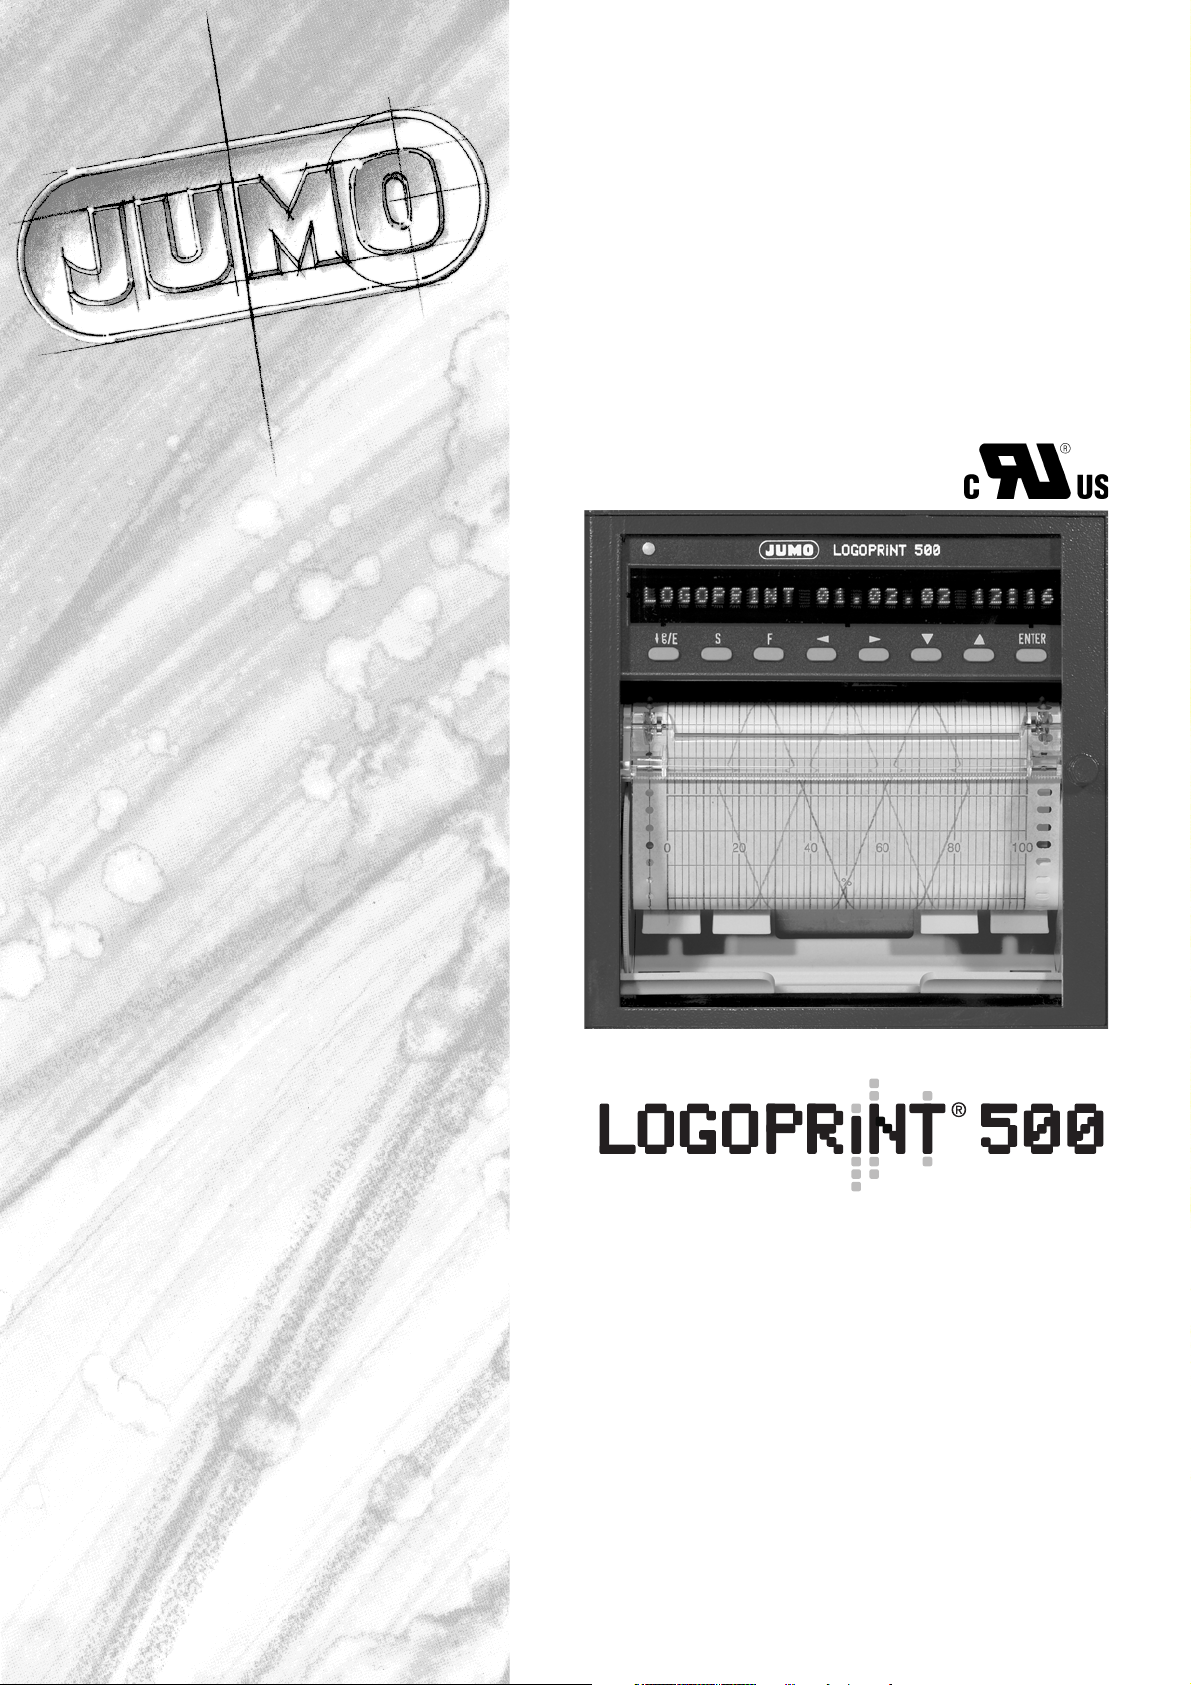
2.2 Basics of operation
In order to keep the operating and programming of the printing recorder clear
and simple, the individual parameters and functions are divided into several
levels:
- Basic status
- Operating level (S-level)
- Parameter level (P-level)
- Configuration level 1 (C1-level)
- Configuration level 2 (C2-level)
- Configuration level 3 (C3-level)
12
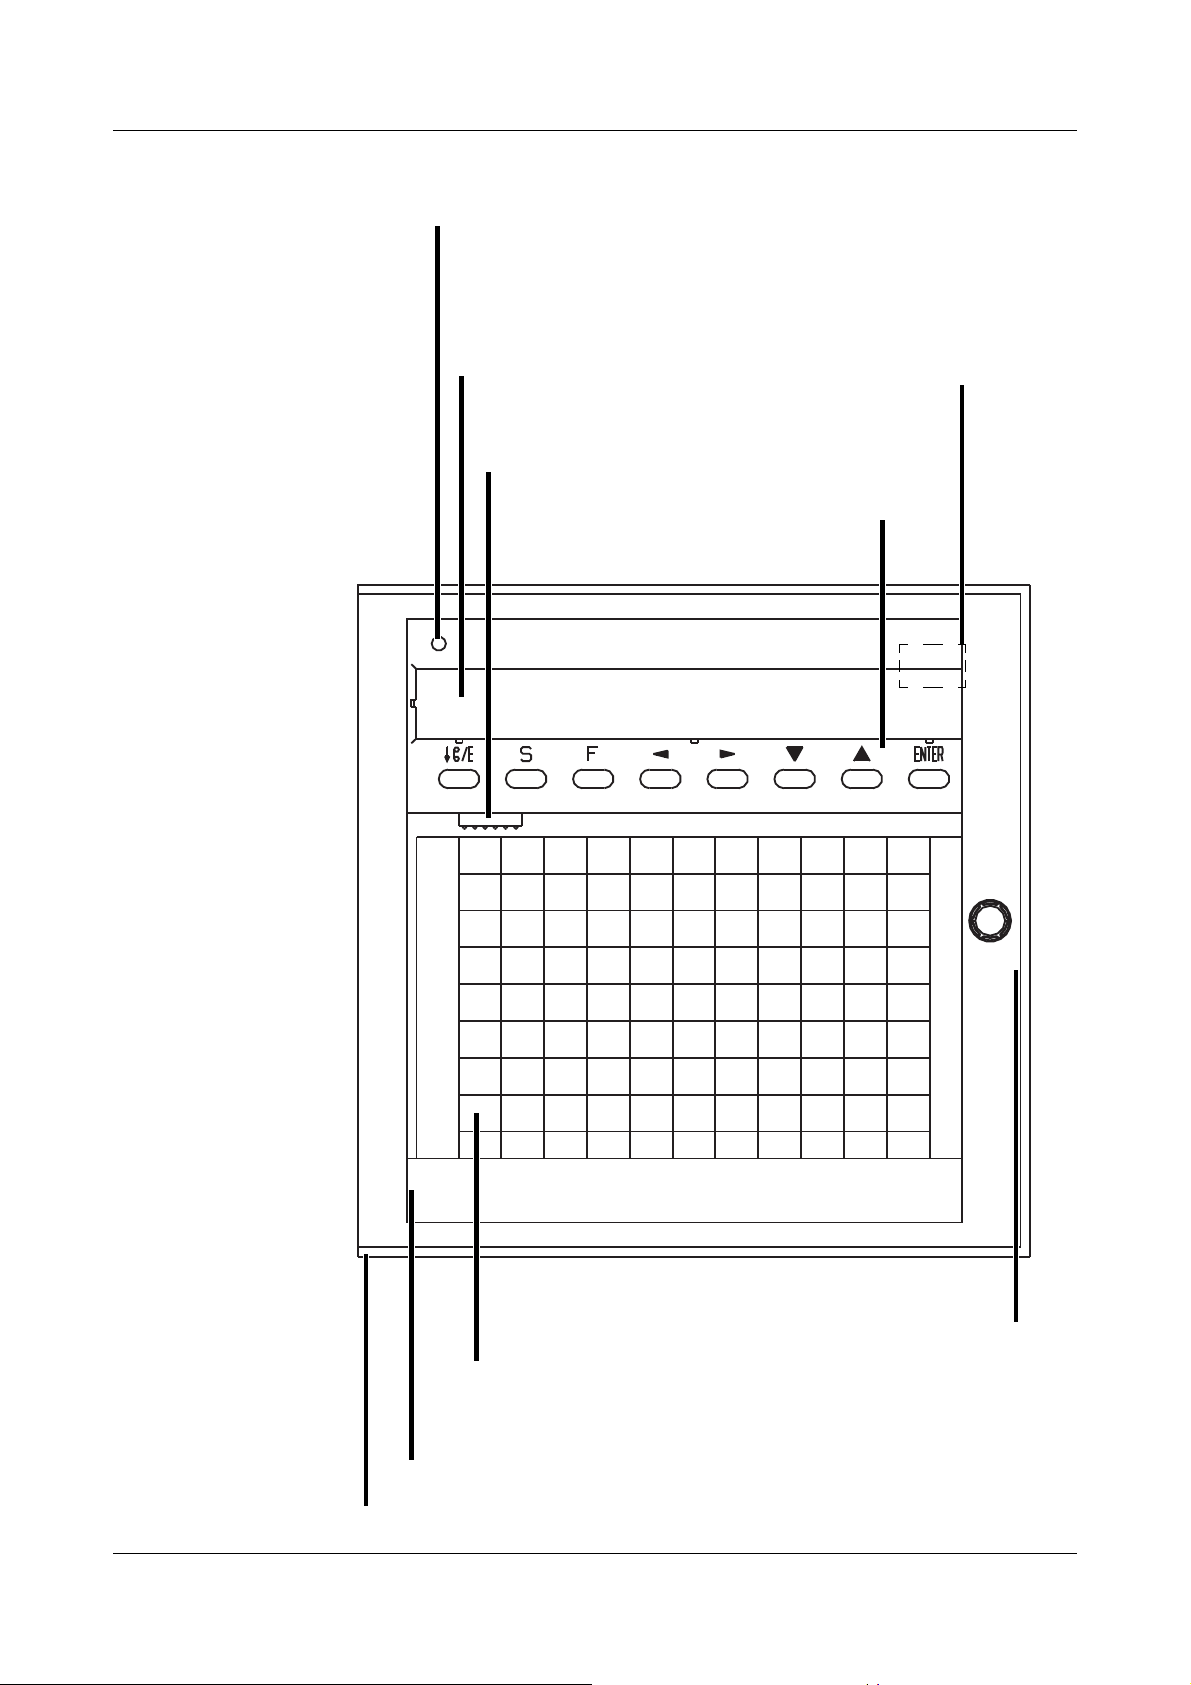
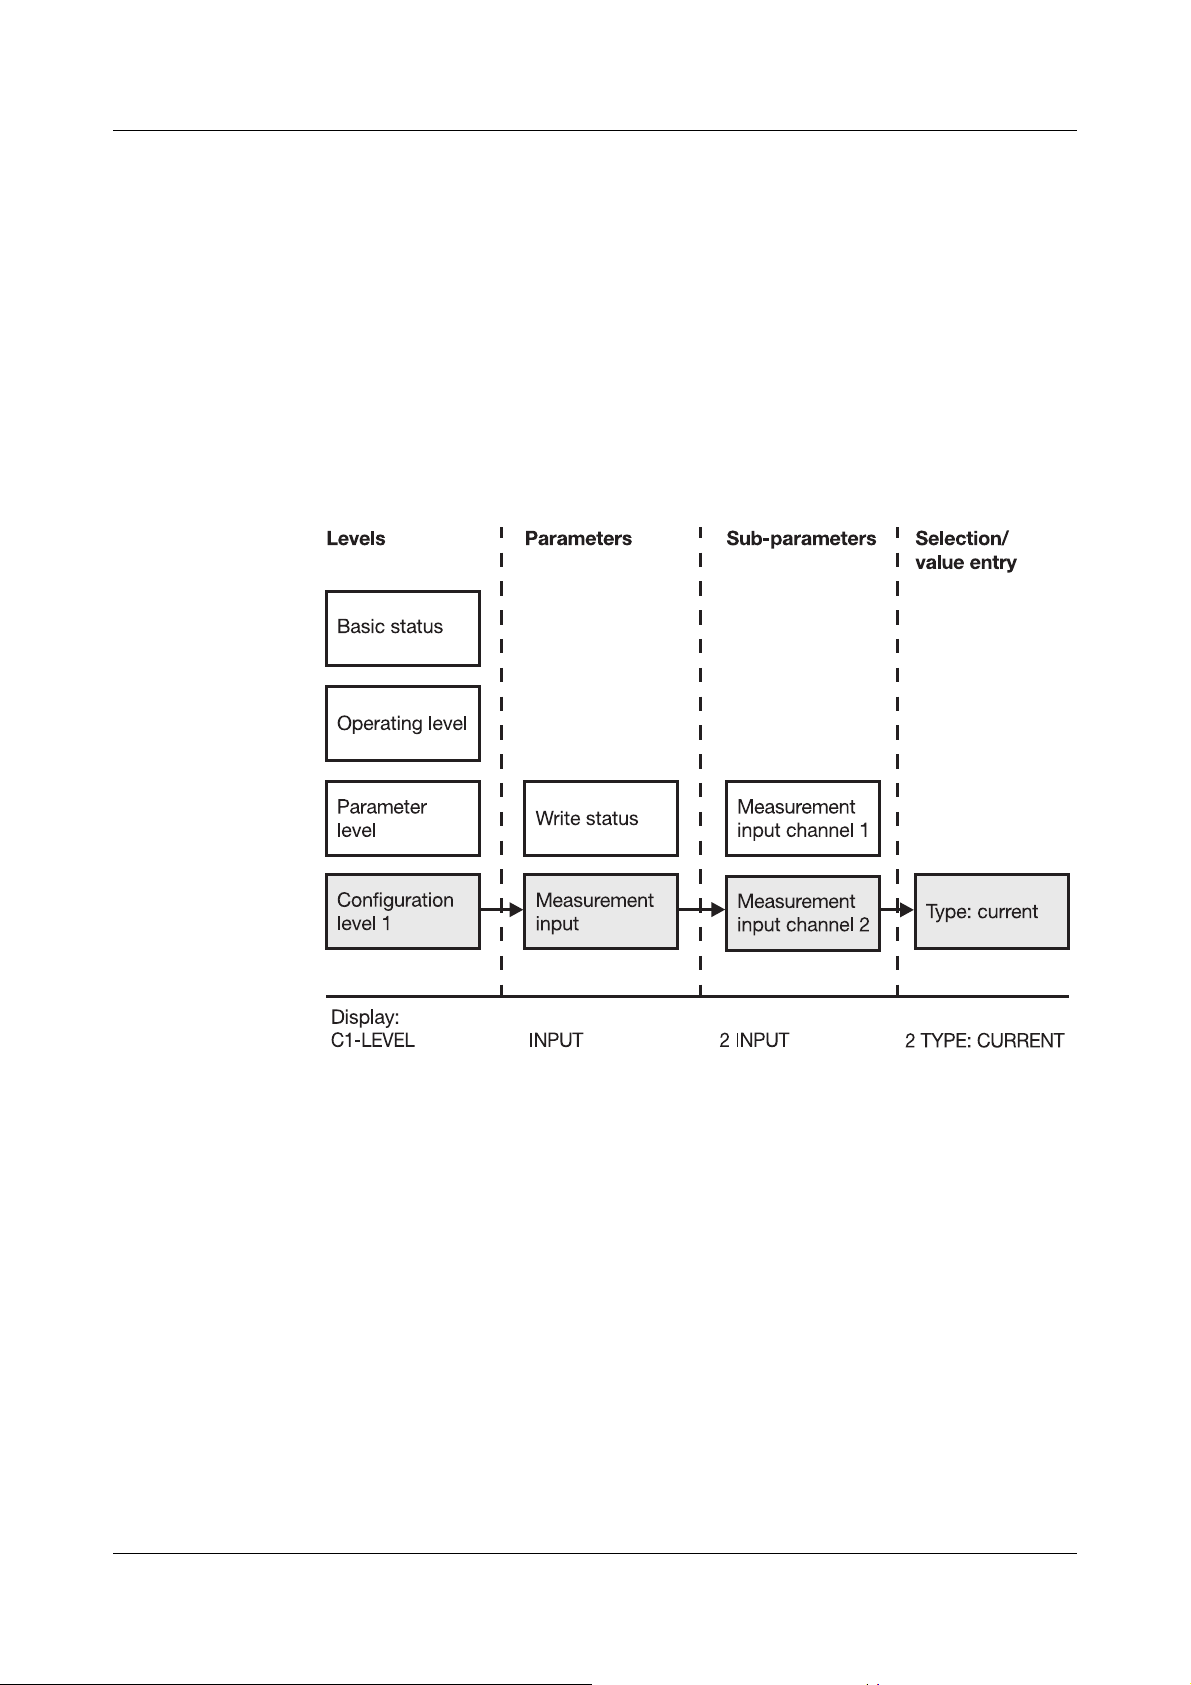
The levels, parameters and sub-parameters are arranged as a tree structure.
Starting from the basic status, it branches out into the individual levels, and
from there further into the corresponding parameters and, if available, subparameters.
If it is necessary to alter a certain parameter, then step through the relevant
level until this parameter is reached.
Pressing E starts the editing process.
If a parameter has several sub-parameters, these can also be accessed by
pressing E.
Page 13
2 Instrument description
Key
functions
e
S
F
l, r
h, R
Basic status Operating level after correct
code number
in parameter and
configuration levels
Chart fast-forward,
when recording is
stopped
Start/stop
recording mode
Function key
(reserved for
special functions)
----------------- ----------------- Shift cursor to left/right
Select display:
-Instrument
name,
date & time
-Channel
measurements
-System status
1
-Abort parameter
entry
(Exit)
-Leave the level
Start/stop
recording mode
Function key
(reserved for
special functions)
-Select parameter
-Select channel
-Select value
from table
-Enter figures:
Change the
place selection
-Abort parameter
entry
-Leave the level
Step
-for values:
Select the
decimal place
-for texts:
Quick selection
of character:
jump to “ ”, “0”,
“A”“, “a”, “°”, “
“à”
-----------------
(select place)
-Select parameter
-Select channel
-Select value
from table
-Enter text/figures:
Change the
place selection
2”
, “À”,
E
Key combinations
Change-over
between cyclic and
static display
l + r Activate/de-activate the
display of status/error
messages
-Initiate the
parameter entry
-Confirm the
entry
-Acknowledge any
error messages
----------------- -----------------
-Initiate the
parameter entry
-Confirm the
entry
-Acknowledge any
error messages
h + R Change to next level Change to next level Change to next level
1. Press the F key for at least 4 sec in the standard version: print out the
scaling of all the active channels (writing status = ON).
13
Page 14
2 Instrument description
For all alterations to the parameters (sub-parameters):
Confirmation of
parameters
Abort
programming
Error messages
during
programming
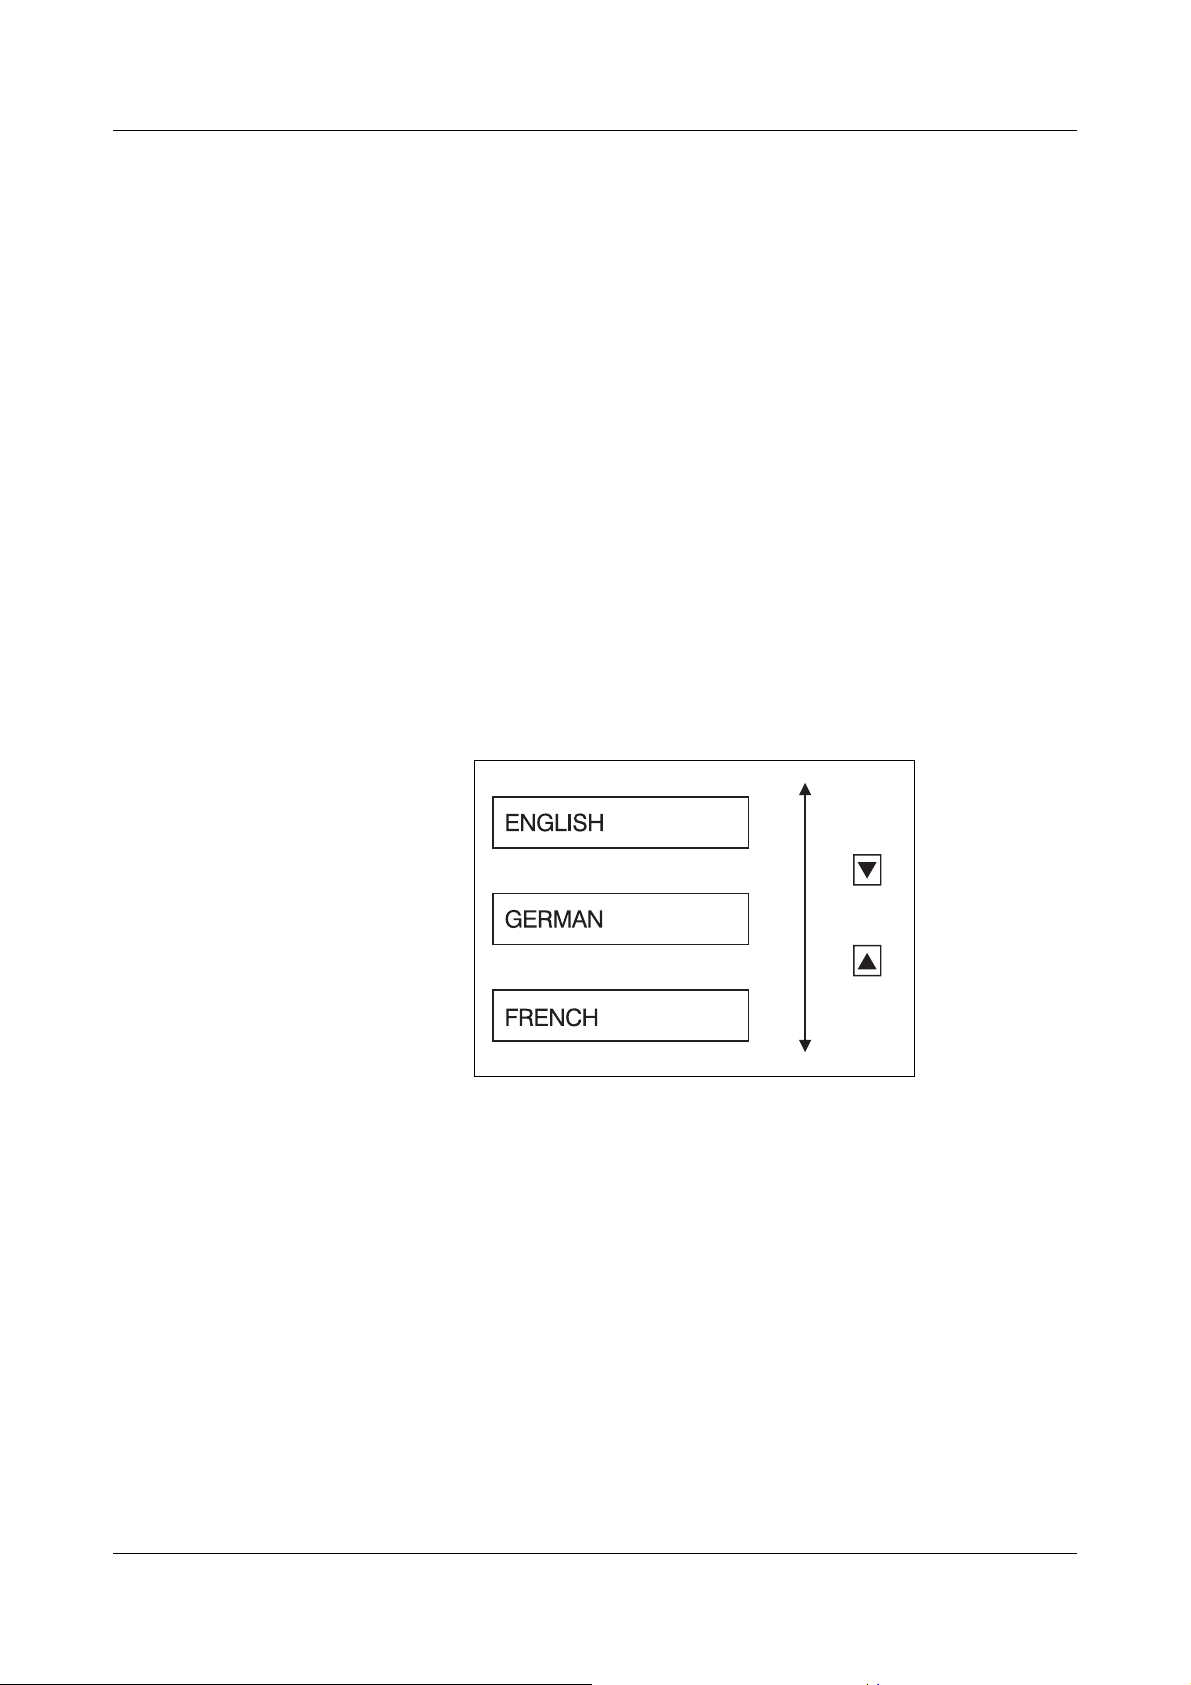
Selection A selection consists of a list of several options:
If there are no further sub-parameters available, then E transfers all the
data which belong to the parameter into the memory.
Inside a parameter, programming can be abandoned by pressing the e key.
If the last sub-parameter has not been confirmed, then the data
which were already edited for the parameter will be abandoned.
The old values for the sub-parameters will be retained.
If error messages occur during programming, as a result of erroneous entries,
then these messages must be acknowledged with E before the programming can be taken up again.
Three keys are used to select an option:
h Select the option with the h and R keys
h Confirm the selection with E
14
Page 15
2 Instrument description
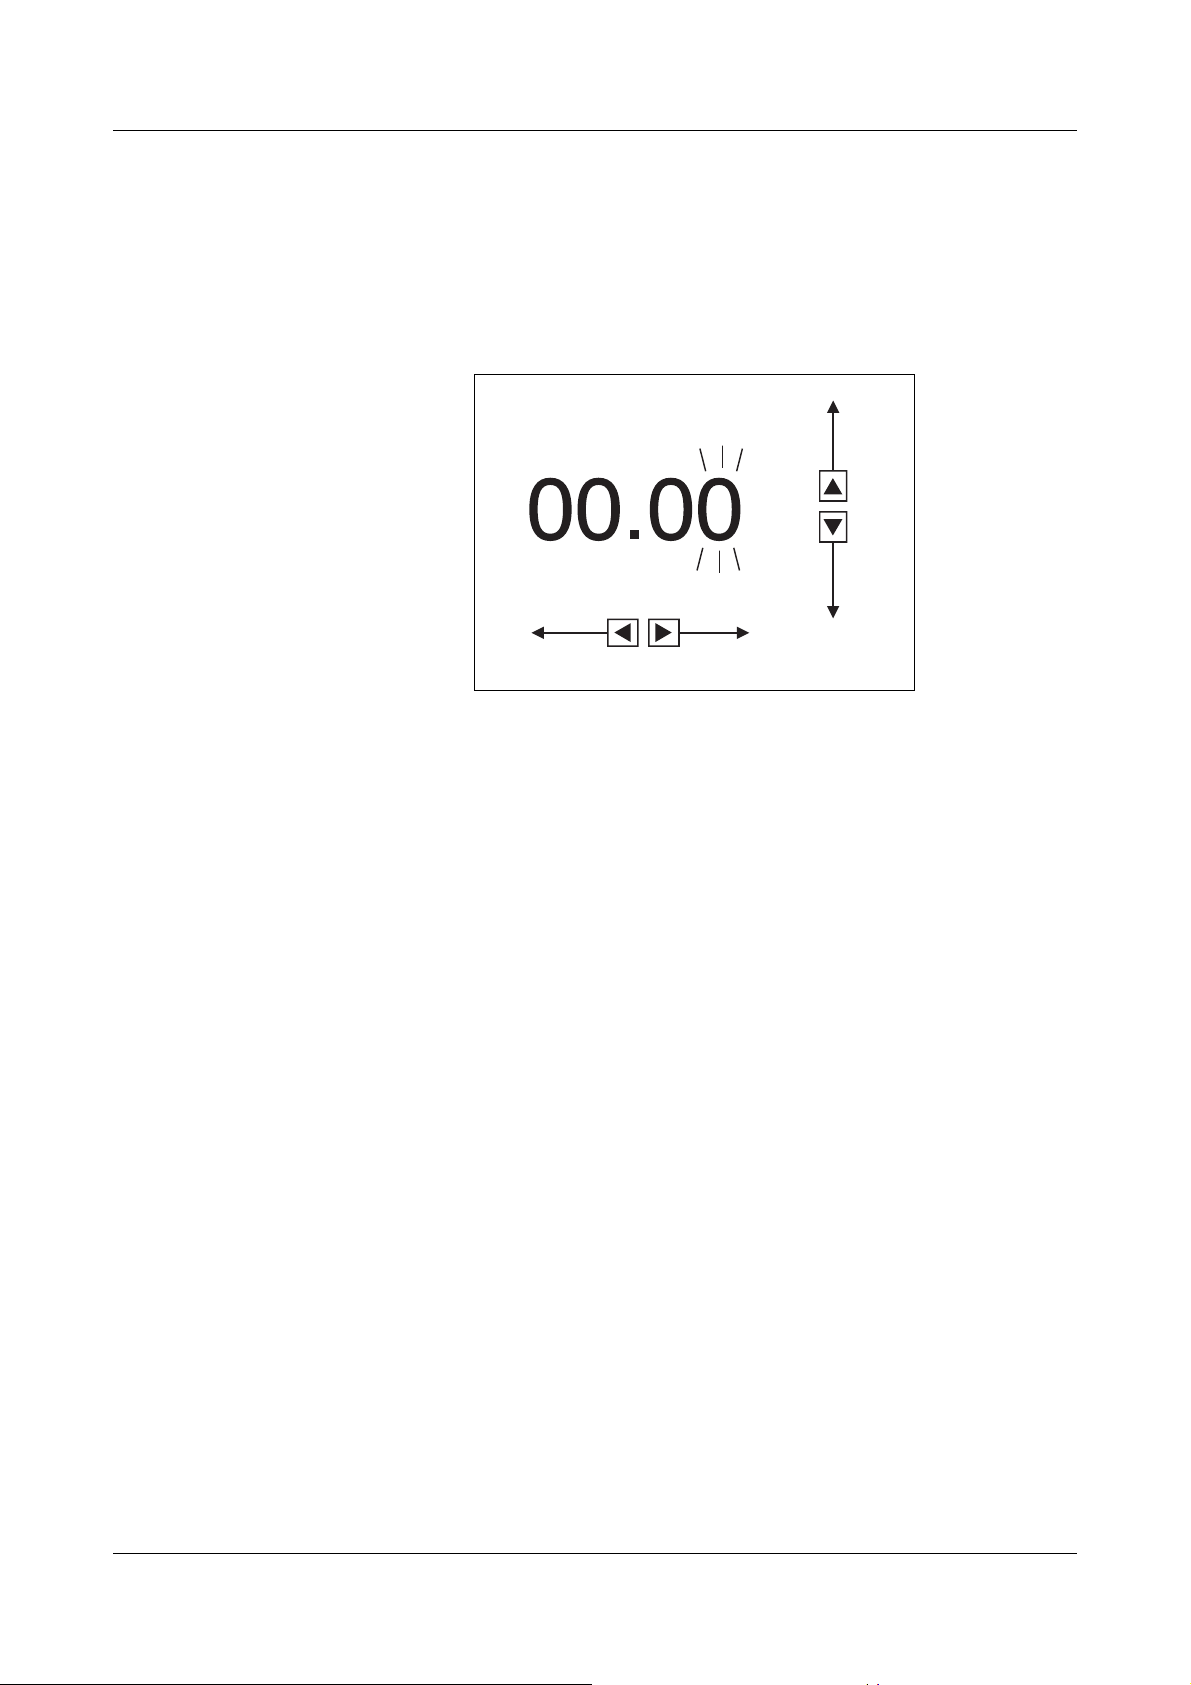
Value/text
entry
Five keys are used to enter values:
h select the position to be altered, using the l and r keys
h increment and decrement the selected position with the h and R keys
h move the decimal point with the S key
h confirm the value entered with E
An erroneous entry will cause an error message in the display
v Section 12.1 “Error messages”
The error message must be acknowledged by E
Afterwards, a new value can be entered.
Five keys are used to enter texts:
h select the character to be entered, using the l and r keys
h select the new character with the h and R keys
(quick character selection with the S key)
h confirm the text entry with E
15
Page 16

2 Instrument description
Key inhibit If the printing recorder is fitted with the extra code “logic inputs”, then it is
possible when a selected logic input is closed, in connection with the parameter Configuration level 3
The following keys or functions can be inhibited in the basic status:
- e chart fast-forward, when the recording mode is stopped
- S start/stop of recording mode
- F function key, to activate scaling print-out
- h + R change from the basic status to the operating level
Even when the keys are inhibited, certain functions are still possible in the ba-
sic status:
- l + r switch error messages on/off
- h , R channel selection
- E switch between cyclic and static display
Key inhibit has no effect as long as the printing recorder is in the basic status
or in one of the configuration levels. On leaving these levels the keys will be inhibited if the logic input is set. It is only possible to call up the operating or
configuration levels again after opening this logic input.
Î Inhibit keys, to inhibit the recorder keys.
16
Page 17

2 Instrument description
Basic status After the supply voltage has been applied, the printing recorder will be initial-
ised and is then in the basic status. Measurements are made, processed, and
recorded.
The 24-character LED dot-matrix display can show:
- instrument designation (name), date and time
(the time can be switched off via the parameter Parameter level
time)
- channel number and measurements (incl. units) of all active channels
(in pairs)
- channel number, name and measurement (incl. units) of all active channels
(sequentially)
- status and error messages
-interface texts
v Section 10.6 “Interface (RS422/RS485)”
- customer-specific texts
The display can be either cyclic or static:
Î Display
Cyclic display
The printing recorder switches automatically to the next display after about
3sec.
Static display
In the basic status, the static display is activated and de-activated with E.
If it is activated, then the present display remains, and is regularly updated.
In the basic status, the information in the display can be changed over with the
h and R keys.
Status and error messages will be identified in plain language by a regularly
flashing display, instead of the present display.
The display of status and error messages can be inhibited, or activated again,
by pressing l + r .
If a measurement is outside the valid range of the A/D converter
(out-of-range), or if a probe break has been detected, then the
character combination “>>>>>>” will appear in place of the value.
The recording can be stopped or re-started with the S key. In the stop status
“STOP” will flash in the LED dot-matrix display.
Using the e key, in the stop status, activates the chart fast-forward.
Pressing the F key for at least 4 sec will restart the scaling print-out.
The operating level can be accessed by pressing the h + R keys simultane-
ously.
17
Page 18

2 Instrument description
Example of the basic status for a 6-channel recorder
BUILDING28 03.11.98 08 : 54 Display instrument name, date and time
hR
1 -5.321m/h 2 +34.67°C Display the first 2 channels in one frame
hR
3 +76.20°C 4 +20.35bar Display the next two channels in one frame
hR
5 +35.08°C 6 +007.4U/m Display the next two channels in one frame
hR
1 CONVEYOR -5.321m/h Display the 6 channels, each in a separate frame
hR
2 MIXER +34.67°C
hR
Operating level
(S-level)
3 MOT7. BEARING +76.20°C
hR
4 PRESSURE +20.35 bar
hR
5 VENT.TEMP. +35.08°C
hR
6 SHAFT +007.4U/m
The operating level can be accessed from the basic status with the aid of the
h + R keys, from the parameter level by using e.
Signal acquisition and processing remain active in this level.
The following parameters can be altered:
- chart speed
-print test
- service print
- version number (display only)
18
It the operating level is active, then signal acquisition, processing
and recording, as well as limit monitoring, will all continue to be
performed.
Page 19

2 Instrument description
Parameter
level (P-level)
The parameter level can be accessed from the operating level with the aid of
the h + R keys, from the configuration level 1 by using e.
The parameter level and configuration levels are protected by a four-figure
code number.
There are two different code numbers:
- Code number for the restricted parameter set (factory setting 9200)
- Code number for the full parameter set (factory setting 9210)
The parameters which belong to the restricted parameter set are defined in the
setup program under Edit
Here, parameters which are not needed for the application, or only have to be
programmed once, can be appropriately marked. They will no longer be displayed on the recorder after the new setup has been transferred.
If one of the two code numbers is entered, then
- signal acquisition and
-recording
will be interrupted.
Furthermore
Î Instrument operation …
- events will no longer be recorded,
- reports will be aborted and reset,
- limits will no longer be monitored,
- the Code for the mathematics module will no longer be applied,
- the fault signal output will be set to fault, and
- all other outputs will remain in their last state.
The parameters can now be programmed.
If the wrong code number is entered, then the recorder will remain
in the normal mode. Signal acquisition, processing and recording
are still active.
The parameters can be looked at, but not programmed.
The code numbers can be altered through the setup program
Î Code numbers …) or on the instrument.
(Edit
v Section 4.2 “Table of the configuration parameters”
If customer-specific code numbers are entered, then the original
JUMO code numbers will be overwritten, and are no longer valid.
19
Page 20

2 Instrument description
If the same figures are used for both code numbers, then these
code numbers will be interpreted as code numbers for the complete parameter set.
The relays in the external relay module ER8 remain in their present
state. They will only be switchable again when the printing recorder has been returned to the operating level or the basic status.
After a valid code number has been entered, the following parameters can be
altered in the parameter level:
- language
- date & time
- summer time
- display brightness
Configuration
level 1 (C1-level)
-display time
Channel-specific parameters can be configured in configuration level 1. This
level can be accessed from the parameter level with the aid of the h + R keys,
or from configuration level 2 by using e.
If a correct code number is entered when calling up the parameter
level, then the signal acquisition and recording will be interrupted
in this level. The parameters can be viewed and altered.
The relays of the external relay module ER8 remain in the present
state. They will only be switchable again when the printing recorder has been returned to the operating level or the basic status.
Configuration level 1 includes the following channel-specific parameters:
-plot status
- signal input
-scaling
20
- channel name (word and number)
- limit comparator
- limit feed
-zoom
- presentation range (offset)
- peak value recording
Page 21

2 Instrument description
Configuration
level 2 (C2-level)
Configuration level 2 can be accessed from configuration level 1 with the aid
of the h + R keys, or from configuration level 3 by using e.
If a correct code number is entered when calling up the parameter
level, then the signal acquisition and recording will be interrupted
in this level. The parameters can be viewed and altered.
The relays of the external relay module ER8 remain in the present
state. They will only be switchable again when the printing recorder has been returned to the operating level or the basic status.
Configuration level 2 includes the following global parameters:
- unit name
-open-collector output
- chart speed in limit operation
- timed operation (feed time)
- print-out of speed change
- print-out of the “power on” text
- print-out of the “power off” text
-scaling print
-time print
- print channel number
-report
-start text
-end text
-presetting
-code number
21
Page 22

2 Instrument description
Configuration
level 3 (C3-level)
Configuration level 3 can be accessed from configuration level 2 with the aid
of the h + R keys.
If a correct code number is entered when calling up the parameter
level, then the signal acquisition and recording will be interrupted
in this level. The parameters can be viewed and altered.
The relays of the external relay module ER8 remain in the present
state. They will only be switchable again when the printing recorder has been returned to the operating level or the basic status.
Configuration level 3 contains parameters which mostly belong to the extra
codes and the mathematics module:
- relay output
1
- mathematical module
- interface
- external text
- text logic links
-external stop
- external speed
-event counter
-external scaling
-external report
- key inhibit
2
1
1
1
1
1
1
1
1
22
- event traces
1. The parameters can only be edited if the extra codes
“logic inputs” and “interface for ER8” have been implemented in the recorder.
2. The parameter can only be edited if the extra code “RS 422”
or “RS 485” has been implemented in the recorder.
Page 23
3 Operation and visualisation
The printing recorder has a large variety of possibilities for presenting the
measurements acquired at the signal inputs on the paper, for monitoring them,
and for control.
The functions are available for:
- limit monitoring through limit comparators
-open-collector outputs
- different chart paper speeds
- graphics printing
- text printing
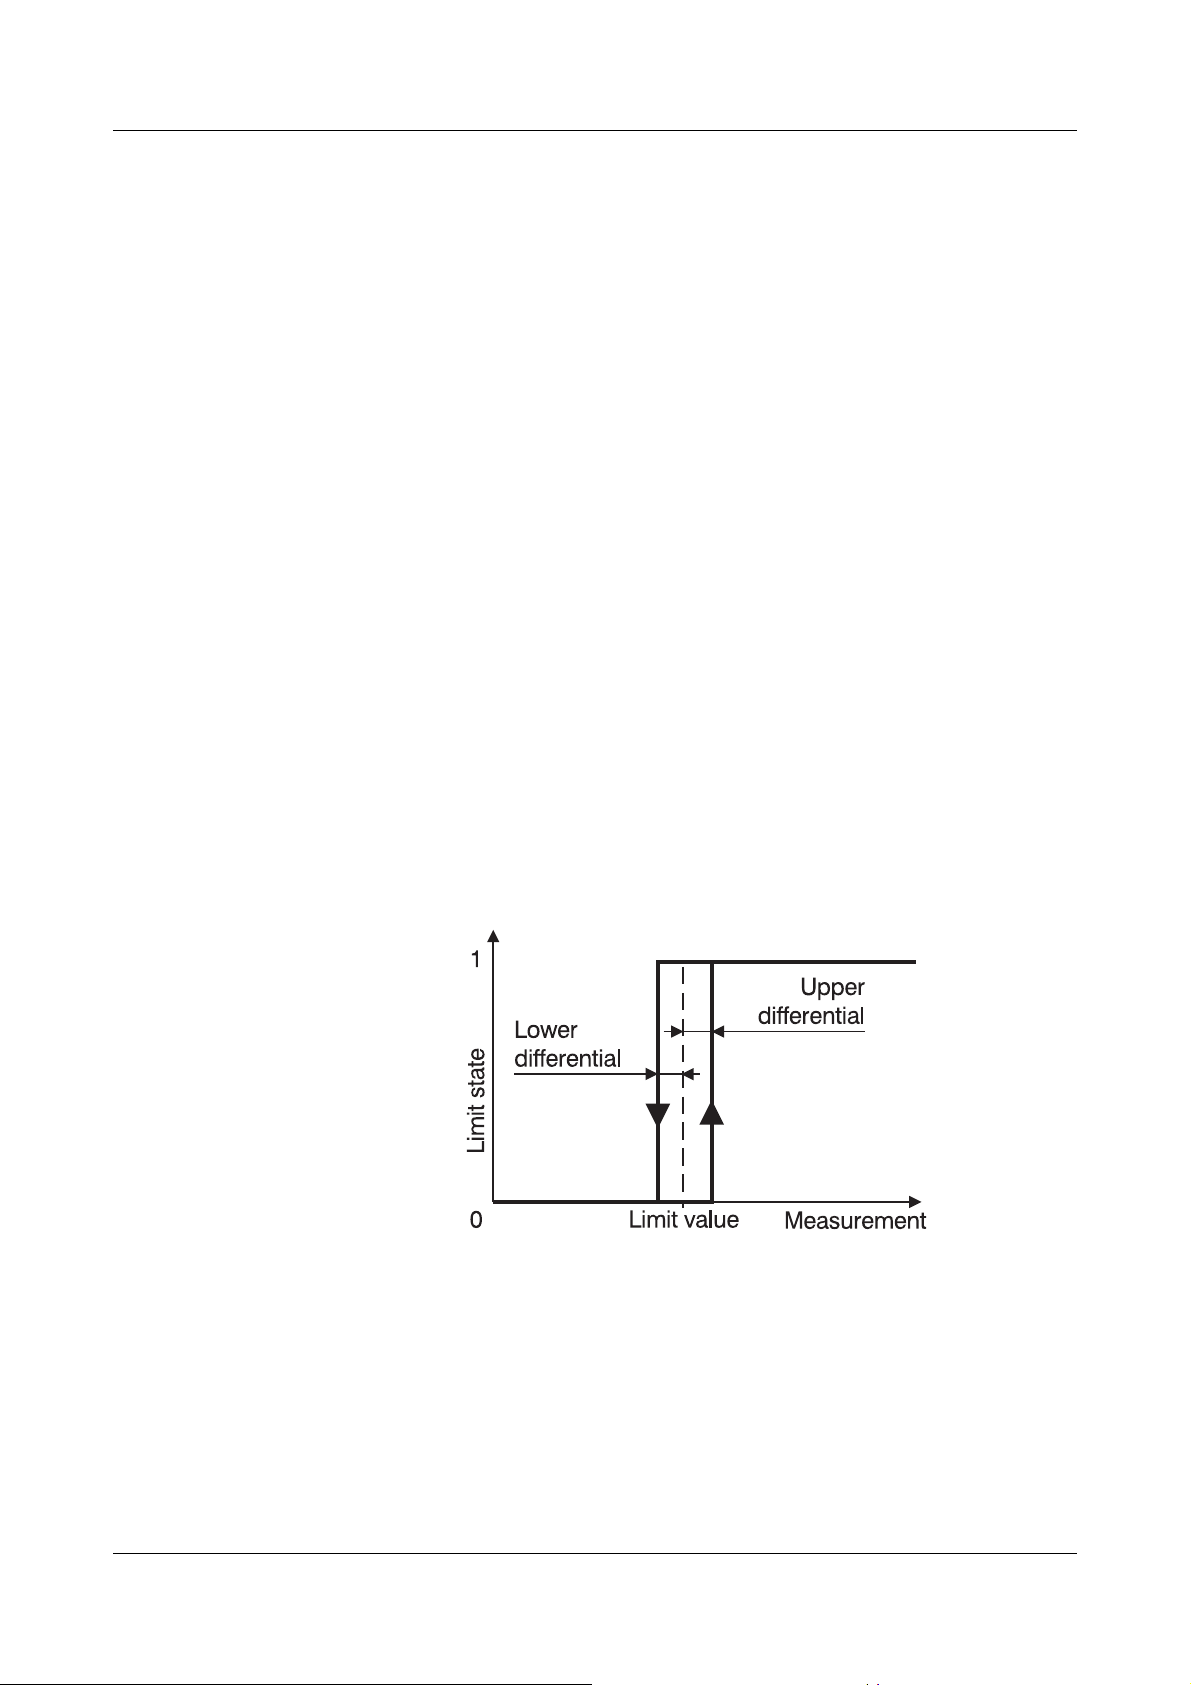
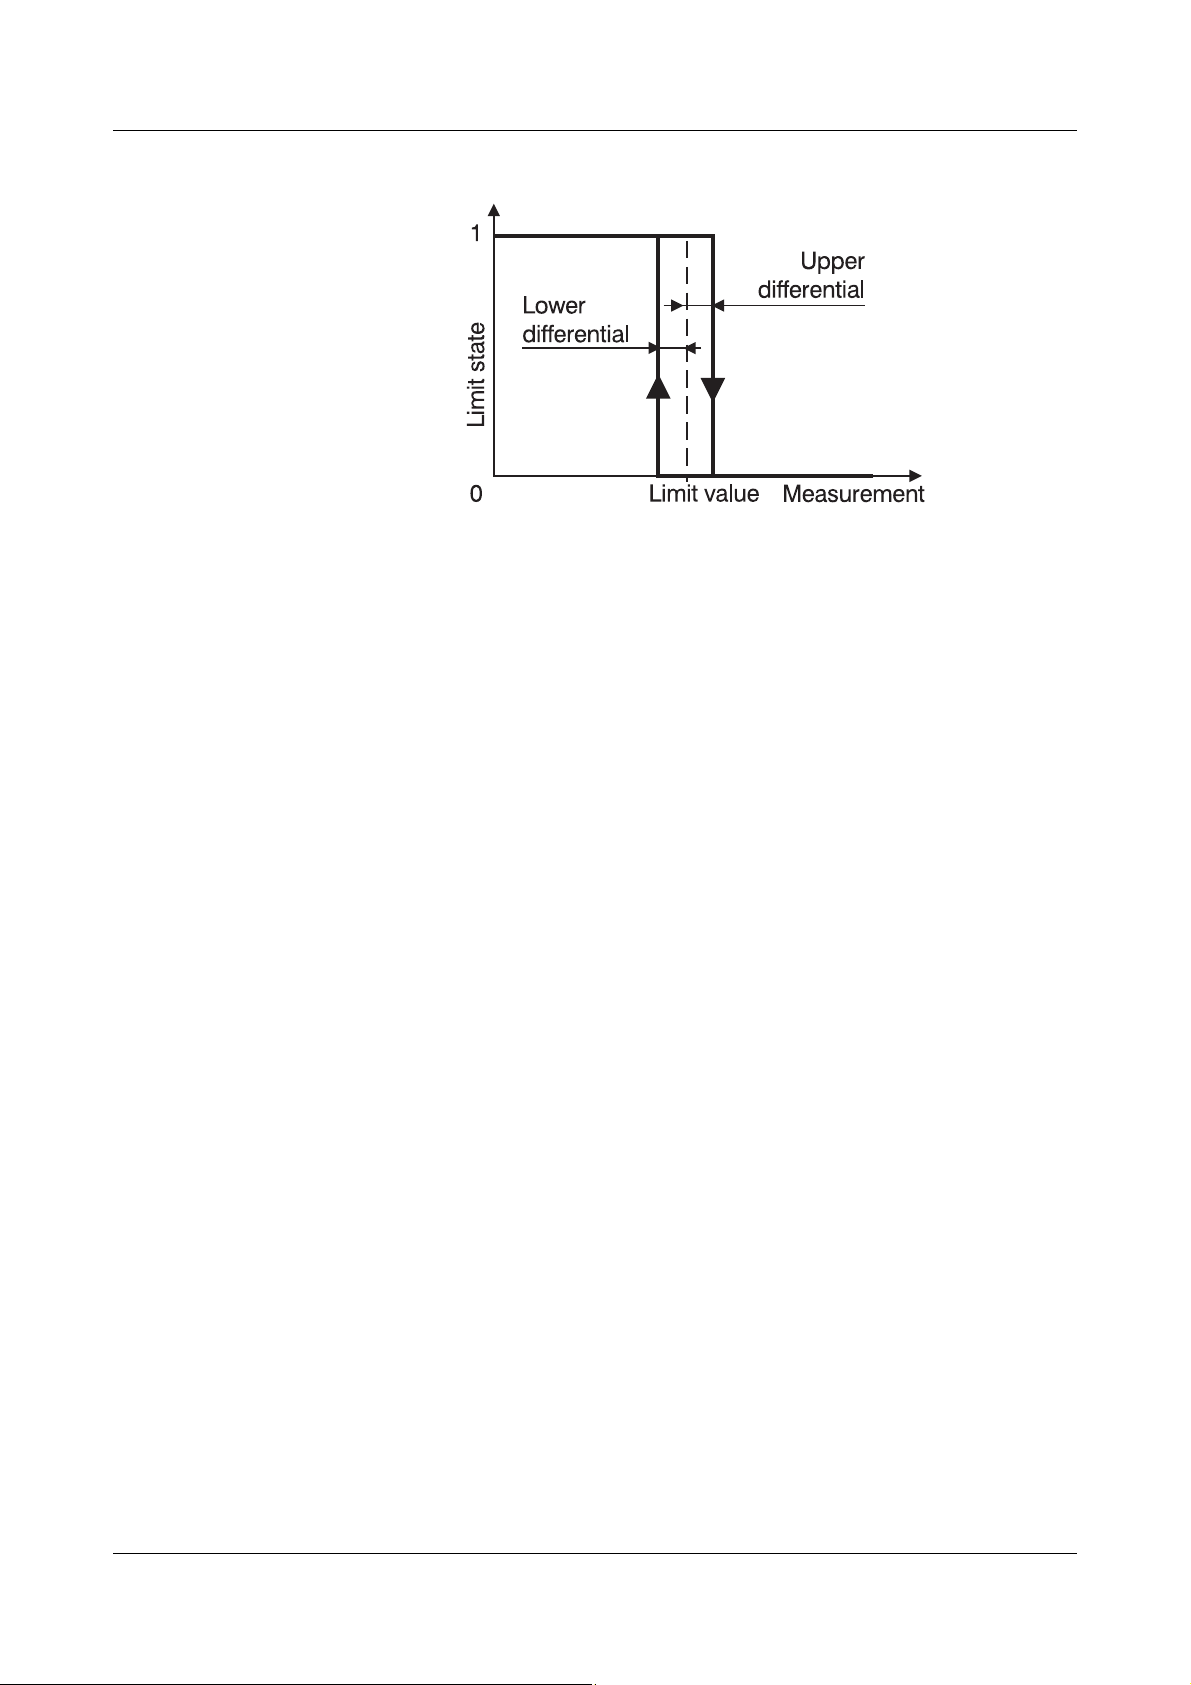
3.1 Limit monitoring by limit comparators
8 limit comparators are available for monitoring limits. They are set up through
the parameter Configuration level 1
rameters can be used to establish the limit values, switching differential (hysteresis) limits, texts, limit comparator functions (lk) and the response to a
probe break.
Î Limit comparator. Appropriate sub-pa-
The texts are printed out when the values go out-of-range or exceed the differential values, as described in the section on text printing.
v Section 3.5.4 “Limit comparator texts, external text, binary-linked external
text”
The limit comparators produce a logical 0 or 1 as output. The sub-parameter
“LK-function” also decides what the result of the limit state is.
LK function: lk7
23
Page 24
3 Operation and visualisation
LK function: lk8
As well as producing the text print-out, the results from
- limit comparators 1 to 3 can be fed to the open-collector outputs 1 to 3,
and/or
- those from limit comparators 1 to 8 to the relay outputs 1 to 8 (option).
The relay outputs are available as an option (extra code ER8).
v Section 10.3 “External relay module ER8”
The state of the limit comparators can be documented by using
the event traces on the chart paper.
v Section 3.4.2 “Event traces”
The response of the limit comparators to out-of-range measurements or a probe break can be defined with the parameter Config-
uration level 1 ➔ Limit comparator ➔ Probe break.
The limit values can be printed out in the form of limit marks (“l”)
together with the scaling.
v Section 3.5.8 “Scaling”
24
Page 25

3 Operation and visualisation
3.2 Open-collector outputs
The printing recorder is equipped with four open-collector outputs. The outputs 1 to 3 have a fixed assignment to the limit comparators 1 to 3. Output 4 is
used as a fault signal output. The outputs can be activated by using the parameter Configuration level 2
Fault output The fault signal output can be used to indicate a fault. During correct operation
of the printing recorder this output is active. In the event of a fault or disturbance, or if the status in the parameter Configuration level 2
is OFF, it becomes inactive (open).
The following causes will lead to a fault signal:
- Chart paper end
- Power off
- The battery of the recorder is discharged
- No communication with the external relay module ER8
- Fatal errors
Î Open-collector.
Î Open-collector
25
Page 26

3 Operation and visualisation
Differential
(Se - Sa) x (Ze - Za) x 0.01
100
------------------------------------------------------------
=
3.3 Different chart speeds (paper feed)
The printing recorder is equipped with several different chart speeds, so that
the measurements can always be optimally interpreted on the chart.
Normal chart
speed
Limit operation
(limit feed)
External
speed
The chart paper is transported with the speed which is programmed in the parameter Operating level
If the value goes above or below the programmable limits
(Configuration level 1
over to the speed programmed in Configuration level 2
To avoid excessively frequent chart speed changes, a switching
differential (hysteresis) of 0.5% is applied to the switching level.
The switching differential is referred to the scaling and zoom.
Se = scaling end
Sa = scaling start
Ze = zoom end
Za = zoom start
A signal at a logic input (extra code) can be used to switch to a chart paper
speed which is programmed in Configuration level 3
Î Chart speed.
Î Limit feed) then the paper transport will be switched
Î Feed limit.
Î External speed.
Timed
operation
(feed time)
This chart paper speed is valid for a programmable period of time, and is defined by the parameter Configuration level 2
If it is set so that start time = end time, then the timed operation is inactive.
Different priorities apply for the various speeds.
v Section 3.5.6 “Switching the chart speed”
Î Feed time.
26
Page 27

3.4 Graphic print-out
The printing recorder is fitted with a print head which always has 6 colour
pens, regardless of the number of channels. For the 3-channel version the colour sequence is: violet, red, black, violet, red, black. For the 6-channel version
it is: violet, red, black, green, blue, brown. This means that in the 3-channel
version the colours last twice as long. When using the setup program, if colours are assigned to a 3-channel recorder which are not available (green, blue,
brown), they will automatically be replaced (violet, red, black). The printing of
measurements and texts is always made in the same direction (unidirectional
printing).
The time which is needed to print out one line depends on the number of
points which have to be printed in this line. If the maximum number of points
are printed, then about 12 seconds are required for one line.
As the chart speed increases, more and more measurements, and so more
and more lines, have to be printed. So the printer must reduce the time which
it needs to try and print a line as the speed increases. These times can be seen
in the following table.
3 Operation and visualisation
Speed (mm/h) minimum time per line (sec)
5
10
20
60
120
240
300
360
600
720
288
144
72
24
12
9
6
5
4.8
4
Up to a speed of 120mm/h every line can be printed in the time available,
since there are never more than 12 seconds required. At higher speed, if the
time taken to print a line is longer than the value in the table, then the lag is
compensated for by speeding up to the next line.
Example:
At a speed of 300mm/h the printing recorder attempts to print a line every 6
seconds, according to the table. But it needs 9 seconds to print a line. This is
compensated by increasing the speed by 50% for the next line.
The recorder has been so developed that the printed traces are always as visible as possible. For instance, an alternating print of the different colours
avoids a mixing and waste of colour if the measurements are the same.
27
Page 28

3 Operation and visualisation
Example:
If three traces lie on top of one another, then the alternating print pattern ensures that no point has a multiple print, but that each channel uses one point
at a time, sequentially.
28
Page 29

3 Operation and visualisation
ZOOM-START
Mk - Sa()100 %⋅
Se - Sa
-----------------------------------------=
ZOOM-END
Mg - Sa()100 %⋅
Se - Sa
-----------------------------------------=
ZOOM-START
500m/h 0m/h–()100 %⋅
2000m/h 0m/h–()
----------------------------------------------------------
25 %==
ZOOM END–
1500m/h 0m/h–()100 %⋅
2000m/h 0m/h–()
----------------------------------------------------------------------- 75 %==
3.4.1 Measurement traces (signal traces)
In the factory setting, all the measurement traces are printed over the full chart
width. The parameters “zoom” and ”presentation range” offer the possibility of
altering the print-out.
Zoom
(plot area)
Zoom operation is used to record a section of the complete measurement
range in an enlargement. Zoom operation is activated by the parameter Con-
figuration level 1
The values to be entered for the start (ZOOM-START) and end (ZOOM-END)
are made in %, and can be calculated as follows:
Mk = smallest measurement to be recorded
Mg = largest measurement to be recorded
Sa = scaling start
Se = scaling end
The difference between start and end values must be at least 10%.
Example:
The selected input signal is a voltage in the range 0 — 10V, and the scaling is
set to the range 0 — 2000m/h. The section of the range from 500 — 1500m/h
is to be displayed.
Î Zoom.
Presentation
range (offset)
Peak value recording
This parameter can be used to determine a range of the chart paper on which
the trace will be recorded. Either the complete chart paper width of 100 mm
can be used, or just a portion. In this way it can be arranged that all the channels are presented next to one another (strip recording). The presentation
range is activated by the parameter Configuration level 1
The printing recorder can acquire considerably more values than it can print.
At a chart speed of 20 mm/h, for instance, approximately only every 24th
measurement is recorded on the chart. The peak value recording function can
deal with this situation.
Peak value recording = OFF:
When the peak value recording is switched off, the latest value present at the
instant of printing is recorded on the chart.
Peak value recording = ON:
When the peak value recording is switched on, the minimum and maximum
measurements are stored internally between two lines which are to be printed.
Î Offset.
29
Page 30

3 Operation and visualisation
These minimum and maximum values are printed when peak value recording
is activated. One advantage of the peak value recording is that at least an impression of the measurement trace on the chart can be gained, even at slow
chart speeds and after text printing in the “Interrupt measurement trace”
mode.
The peak value recording can be switched on and off for each channel by using the parameter Configuration level 1
Î Peak value recording.
Colour
assignment
The colours which are used to print the traces can be set with the aid of the
setup program.
In the basic status, for a 3-channel recorder, the colours violet, red and black
are assigned to the channels 1 — 3.
When using a 6-channel recorder, the colours green, blue and brown are also
used, for the additional channels 4 — 6.
3.4.2 Event traces
In addition to the measurement traces, the printing recorder offers the possibility of recording up to 8 event traces. The sources for the events can be the
limit comparators as well as the logic inputs (extra code).
The source selection and trace selection are made by the parameter Configu-
ration level 3
The setup program can be used to select the start position of the event traces
on the chart paper, between 0 and 100%.
If not all the event traces are selected, then a gap will appear at the corresponding positions. This means that every trace has the same spacing from
the defined start position.
Î Event traces.
Colour
assignment
30
In the 6-channel version, the colours violet, red, black, green, blue, brown, violet and red are assigned to the event traces 1 — 8. In the 3-channel version
the colours green, blue, brown are replaced by violet, red, black.
The colours can be changed with the aid of the setup program.
Page 31

3.5 Text printing
As well as the traces of the chart, the recorder can also print text. Text printing
is used to make comments on the traces and for recording events. The characters are printed in dots in a 7 x 9 matrix.
3.5.1 Printing priorities
There are different kinds of text which can have priorities and a printing mode
assigned to them by the setup program. These priorities determine the criteria
for interruption or cancellation when more than one text print is required at the
same time.
For all the following explanations, the rule is:
- Text 1 = text with higher priority
- Text 2 = text with lower priority
If Text 2 is being printed when a request for Text 1 appears, then the printing of
Text 2 is abandoned and Text 1 is printed. The abandoned text will not be continued and not repeated.
3 Operation and visualisation
If a request for Text 2 occurs while Text 1 is being printed, then Text 2 will be
printed out after Text 1 has been printed.
Example:
A report is printed from 12:00 to 12:05 with high priority. At 12:02 a limit is exceeded, so the corresponding text should be printed out. Since printing this
text is not possible at the moment, the text will be printed after the report is
finished.
31
Page 32

3 Operation and visualisation
Time Text-print request the actual text printed is:
12:07
12:06 12:02 Limit exceeded
12:05
12:04
12:03
12:02 Limit exceeded Report
12:01
12:00 Report
If texts with the same priority cannot be printed at once, then the order in
which they will be printed is not determined by the order in which the corresponding events occurred, but is determined by an internal order of precedence in the recorder.
-Start text
- Text on change of chart speed
-Report
- External text
- Binary-linked external text
- Limit comparator texts
- Print event counter
- Customized texts
- External scaling
-Print time
- Cyclic scaling
- Channel numbers
Example:
Although the priorities have been configured to be the same, the time will be
printed before the cyclic scaling.
If the recorder is put into the stop status, or switched off, then all the printing
requests which were already present or which occur during this period will be
cancelled. The print-out of the texts will not be dealt with when the recording
starts again. Exception: A request for the print-out of a report which occurs
during a stop status will not be cancelled. The report will be printed after the
stop is ended. But if a report which was being printed is interrupted by a stop
it will not be continued after the recording has been restarted.
32
Page 33

3 Operation and visualisation
In the following cases, all current request for text printing will be cancelled,
and any fresh ones will be ignored:
- Recorder goes into the stop status
- Recorder is switched off
One exception to this rule is the report.
v Section 3.5.5 “Report”
The following fixed priorities have been assigned for stop, service and print
test:
Priority Text
higher
lower
- Stop by S-key, external stop, no chart paper,
configuration by keys or via setup
-Print test
- Service print
- Text print according to the configured priority list
33
Page 34

3 Operation and visualisation
3.5.2 Printing modes
Texts can be printed in two modes:
- by interrupting the measurement trace (Outplot)
- overwrite the measurement trace (Inplot)
Interrupt
measurement
trace
Overwrite
measurement
trace
The text is printed as fast as possible. During the text printing there is no recording of measurements or event traces. The chart paper speed is optimised
for the text printing. It is not the same as the programmed chart speed.
Typically, a time of 10 — 40sec is needed to print a line of text.
Advantages:
-rapid text printing
- other messages are blocked for the shortest possible time
- an optimised chart speed ensures that the text is always perfectly legible
- text printing can also be carried out when the chart speed is programmed
to 0mm/h.
Disadvantages:
- measurements and event traces are not recorded during the text printing
- the chart speed is altered during the text printing. The time correlation is
lost.
The text is printed with the current chart speed. Measurements and event traces are printed at the same time. Text printing is not performed if the chart
speed is 0mm/h. At this chart speed, texts which would be printed in the
“Overwrite measurement trace” mode are not recognised in the priority evaluation.
The time taken to print a line of text will vary, depending on the programmed
chart speed.
Chart speed Time to print 1 text line
5mm/h
20mm/h
120mm/h
Advantages:
- the time correlation is also preserved during text printing
- the recording of measurements and events is not interrupted at any time.
approx. 43min.
approx. 11min.
approx. 2min.
34
Page 35

Disadvantages:
- the text printing can take a very long time
- the printing of other texts is blocked
- text printing is not possible at a chart speed of 0mm/h.
3.5.3 Queuing during text printing
External texts, binary-linked texts, limit comparator texts for going above and
below limit values, as well as event texts, are printed through a queue. This
means that, as long as the queue is not full, complete documentation is assured.
The print queue has:
- 24 entry positions for external texts
- 48 entry positions for binary-linked texts
- 48 entry positions for limit comparator texts
and
3 Operation and visualisation
- 20 entry positions for event texts
If the queue has filled its quota of a particular type, then any further texts of
this types will be lost, until entry positions are free again in the queue.
If a very large number of events need to be recorded, then use either the print mode “Interrupt measurement trace” or a sufficiently
high chart speed, since in this case the entry positions in the
queue will be freed much faster.
35
Page 36

3 Operation and visualisation
3.5.4 Limit comparator texts, external text, binary-linked external text
Limit
comparator
texts
External text
Limit comparator texts can be printed out. To do this, the parameter Configuration level 1
corresponding texts must be entered. Every time that a measurement goes
above or below a limit value, the appropriate text will be printed.
v Section 3.1 “Limit monitoring by limit comparators”
There are eight logic inputs available for external texts.
If a logic input is closed (positive edge triggering) then the corresponding text
will be printed. Opening the logic input has no effect.
Î Limit comparator Î Limtext state must be set to ON and the
Binary-linked
external text
(text logic links)
The function is activated by the parameter Configuration level 3
text.
Extra code “Logic inputs” is required.
If this extra code is not present, then the parameter will not be
displayed.
It is possible to interpret the signals on the first four logic inputs as a binary
number, and to associate a text with each binary number. Up to 16 texts can
be defined in this way.
The text which is assigned to the binary number is printed out after every
change of state of the logic inputs concerned.
Text printing can be switched off individually for each of the 16 texts.
Example:
If the binary number 1001 is present on the logic inputs, then text 9 will be
printed.
If logic input 1 is opened, then the binary number 1000 is present on the logic
inputs, and so text 8 will be printed.
Î External
36
Page 37

3 Operation and visualisation
1. logic input
4. logic input
Binary no. Decimal no. /text
0000
0001
0010
0011
0100
0101
0110
0111
1000
1001
1010
1011
1100
1101
1110
1111
0
1
2
3
4
5
6
7
8
9
10
11
12
13
14
15
Activation is carried out by the parameter Configuration level 3 Î Text logic
links.
Extra code “Logic inputs” is required.
If this extra code is not present, then the parameter will not be
displayed.
Colour
assignment
Print-outs of limit comparator texts are made in the colours of the corresponding measurement traces. The colours which are used for printing external and
binary-linked external texts can be selected with the aid of the setup program
(normal setting: black).
General For limit comparator texts, external texts and binary-linked external texts:
As well as the programmed text, the time when the text printing request was
initiated is also output.
The time reference mark “_” will not be printed, since the print-out
through the queue can happen after some delay.
37
Page 38

3 Operation and visualisation
Report no. and recorder designation
Start report (date + time)
till Report end (date + time)
MIN. MAX. AVER. DIM.
Designation ch. 1 min. value 1 max. value 1 average 1 unit
Designation ch. 2 min. value 1 max. value 1 average 1 unit
Designation ch. 3 min. value 1 max. value 1 average 1 unit
Designation ch. 4 min. value 1 max. value 1 average 1 unit
Designation ch. 5 min. value 1 max. value 1 average 1 unit
Designation ch. 6 min. value 1 max. value 1 average 1 unit
3.5.5 Report
The report is used to create statistics about the measurements, referred to a
definable period of time (statistical period).
The minimum, maximum and average values of the measurements are calculated for the statistical period. The result is printed out at the end of the statistical period, in the form of a table.
When selecting the report it is possible to choose between two types of report.
The instance number on the print-out (1 or 2) identifies the type.
The texts “to”, “MIN.”, “MAX.”, “AVER.” and “DIM.” are printed in the language
which has been configured. Only channels which are actually present and
which have the plot status activated are included in the report.
If an overrange or underrange has occurred during the statistical period, then
“--------” will be printed out instead of the minimum, maximum and average
values.
The report is activated through the parameter Configuration level 2
Available selections are: “periodic”, “weekly”, “monthly” or “external” report.
38
Example:
A “periodic report” has been selected, with “report time 17:15 hrs.“ and “interval 2 hrs.”. This means that the first report will be produced at 17:15. Further
reports will be made at 19:15, 21:15 etc.
Please note, that the calculation of the average value is more accurate for the “periodic” report than for all other types of report
(statistical period longer than one day).
Î Report.
Page 39

3 Operation and visualisation
External report The external report is controlled by a selectable logic input. In addition to the
parameter Configuration level 2
which is wanted must be selected through the parameter Configuration level 3
Î External report (e.g. LOG.INPUT 6). The statistical period starts when the
logic input is closed. The report is printed out when the logic input is opened
(negative-edge triggering).
Î Report (EXTERN.CONTACT), the logic input
Colour
assignment
As a result of the expansion to two reports from software version 105.02.XX,
up to two external reports are now available.
When the external report is used, the setting for the parameter
Configuration level 2
or second istance of the report.
Right:
Configuration level 2
Configuration level 3
Wrong:
Configuration level 2
Configuration level 3
The colour which is used to print the instrument designation can be defined
with the aid of the setup program (basic setting: black).
The minimum, maximum and average values are printed in the same colours
as the corresponding measurement traces. The colours for the traces can also
be altered in the setup program.
Î Report must define whether it uses the first
Î 1. Report = EXTERNAL CONTACT
Î 1. External report = Logic inp. 8
Î 2. Report = EXTERNAL CONTACT
Î 1. External report = Logic inp. 8
39
Page 40

3 Operation and visualisation
General For the report:
- If the printing recorder is switched off at the end of the statistical period,
then the print-out will be completely cancelled.
The same applies if the instrument is re-configured from the keys, or if the
setup connector is plugged in.
- If the print-out of a report has been interrupted by a stop, new configuration, setup, print test or service print, then the recording will not be continued after the recording has restarted.
- If the recorder is in the stop status at the time when the print-out should
begin, then the report will be printed after the stop has been removed.
The statistics for the new report will already be compiled from the originally
planned time.
Sample report The recorder is configured with the report type “periodic”, “time: 7:00 hrs.“
and “interval: 24hrs.”. This means than the statistical period ends, and the results are printed, every day at 7.00. The switch-on is on 03.11.98 at 10.30. On
05.11.98 it is in the stop status from 2.00 to 8.30. It is also in the stop status
from 21.00 on 06.11.98 till 08.00 on 10.11.98. At 11.30 on 11.11.98 a different
speed is programmed for the printing recorder, using the setup program on a
PC. At 10.00 on 12.11.98 the instrument is switched off.
The recorder will print out the following reports:
Time of
print-out
04.11.98 7:00 03.11.98 10:30 - 04.11.98 7:00
05.11.98 8:30 04.11.98 7:00 - 05.11.98 7:00
06.11.98 7:00 05.11.98 7:00 - 06.11.98 7:00
10.11.98 8:00 06.11.98 7:00 - 10.11.98 7:00
11.11.98 7:00 10.11.98 7:00 - 11.11.98 7:00
12.11.98 7:00 11.11.98 11:30 - 12.11.98 7:00
The statistical period can be selected from “periodic”, “weekly”, “monthly” or
“external”. If monthly report is selected, it is printed out on the first day of each
month.
Statistical period
40
Page 41

3.5.6 Switching the chart speed
Every change of chart speed is recorded by printing out a line with the time of
the change and the new chart speed, if the parameter “Print chart speed” is
set to ON in Configuration level 2
The style of the line provides information on the type of paper feed which is
used for recording after the change:
3 Operation and visualisation
Î Print speed change.
Normal operation
— — — — —
—-—-—-—-
---------------
Limit operation
External speed (feed)
Timed operation
The individual events have different priorities:
Event Priority
Limit operaton
External speed
Timed operation
Normal operation
higher
lower
The actual chart speed is that set for the event with the highest priority.
41
Page 42

3 Operation and visualisation
Fixing the printing priority applied to the text for Speed changeover affects not only the print-out of the marking at change-over,
but also the change-over itself.
v Section 3.5.1 “Printing priorities”
As long as a text with a higher priority is being printed, a change-
over will not happen if the parameter Configuration level 2
speed change is set to ON. Otherwise, the change-over takes
place at once.
Text printing in the mode “Overwrite measurement trace” can take
a very long time.
v Section 3.5.2 “Printing modes”
v In order not to delay the change-over of the paper speed, the
priorities for texts which are printed in this mode should be lower than the priority for speed/feed change-over.
Î Print
The line which indicates the type of change-over will still be printed, even if the corresponding text cannot be printed.
This is the case if, in the setup program, Text for speed change,
measurement trace: overwrite is configured under Edit
texts in Print mode and a paper feed/speed of 0 mm/h has been
set.
Text printing is relatively quick in the mode “Interrupt measurement
trace”.
v Section 3.5.2 “Printing modes”
In order to avoid text printing in this mode being cancelled by a
change-over of the paper feed, the priority for these texts should
be higher than the priority for paper feed change-over.
3.5.7 “Power On” and “Power Off” texts
The time of “Power On” and “Power Off” can be documented by using this
feature. Both texts are printed in red, with the date and time of the event. The
print-out can be inhibited through the configuration.
Î Print
42
The priority cannot be assigned. It is always higher than that for the texts
which have a configurable priority. Both texts are configured through the parameter Configuration level 2
Î Print “Power off” text.
Î Print “Power on” text and Configuration level 2
Page 43

3.5.8 Scaling
3 Operation and visualisation
The scaling can be printed in two different ways:
cyclic:
for each channel, at a configurable spacing
(Configuration level 2
triggered:
for each channel, when the F-key is pressed for at least 4 sec, or by closing a
logic input
(Configuration level 3
The basic rule is: scaling can only be carried out when the plot status is activated for the corresponding channel.
Î Print scale)
Î External scaling)
Cyclic
scaling print
Selectable spacings:
-approx. 30cm
-approx. 60cm
-approx. 90cm
-switched off
The scaling is printed in the colour selected for the channel. In the bottom line
is the programmed channel designation and the dimensional unit for the
measurements.
If the presentation range of 0 — 100mm has not been altered, then the scale
marks for 0%, 50% and 100% levels will be in the second line. If the presentation range has been restricted, then “I” marks will appear in this line, which
indicate the start and end of the presentation range. The corresponding numerical values will be shown in the next line.
Limit marks (“I”) for the channel concerned will be printed in the top line.
The limit marks are the threshold levels for the limit comparators, which are
programmed with the aid of the parameter Configuration level 1
parator
limit comparators is set up in the parameter Configuration level 1
parator
Î Limit value. The correlation between measurement channels and the
Î Channel.
Î Limit com-
Î Limit com-
The limit marks are only printed if the corresponding limit comparator is active,
i.e.:
- Limit-text state = ON
(Configuration level 1
or
- Open-collector output 1 — 3 = ON
(Configuration level 2
or
- Relay output 1 — 8 = ON
(Configuration level 3
Î Limit comparator Î Limit-text status)
Î Open-collector output Î Status)
Î Relay output Î Status)
43
Page 44

3 Operation and visualisation
Example:
- Channel 3
- Presentation range: 0 — 100mm
- Limit comparator thresholds at 200 and 500°C
Example:
- Channel 2
- Presentation range limited to: 50 — 100mm
- Limit comparator threshold at 300V
44
Page 45

3 Operation and visualisation
Triggered
scaling print
To start the triggered scaling print, the F-key must be pressed for at least 4
seconds.
Alternatively, the triggered scaling print can be initiated by a logic input (extra
code).
The scalings are printed out for all channels with an activated plot status.
The print-out is made up in the same layout as described for “Cyclic scaling
print”.
Example
- three channels have been activated
45
Page 46

3 Operation and visualisation
3.5.9 Time
The print-out is performed cyclically, at a configurable spacing (Configuration
level 2
Selectable spacings:
-approx. 2cm
-approx. 4cm
-approx. 6cm
-not time printing
Î Print time).
The spacings do not depend on the paper feed which has been set up. The
spacings listed above are only approximates, since the print is made at round
values of time.
For every fourth print-out of the time, there will also be produced, alternating
after the time, the actual current chart speed, the programmed instrument
name, or the date.
The date is also normally printed out when the date changes at 00:00 hrs.
To provide a precise time reference on the chart paper, a time reference mark
(“_”) is placed before the text.
46
Page 47

3.5.10 Print out channel numbers
03.11.98 13.20 Recording start
03.11.98 12.34 Recording stop
In order to be able to associate measurements more clearly with a channel, the
channel number can be printed next to the trace, in the channel colour. The
print-out is made cyclically, at a configurable spacing (Configuration level 2
Print channel numbers).
Selectable spacings:
-2cm
-4cm
-6cm
- print switched off
3 Operation and visualisation
Î
3.5.11 Recording start and stop
The start and stop of recording is registered by a configurable start and end
text (Configuration level 2
The text printing can be switched on or off independently for the start and end
texts. The print-out is made together with the time, and always in red.
Both texts will only be printed while the recording is enabled, i.e. the print of
the end text is always made “in arrears”.
Î Start text, Configuration level 2 Î End text).
The start text should always have the highest priority, to ensure
that it is always printed out at the start of recording.
47
Page 48

3 Operation and visualisation
13:22 Charge no. 23
3.5.12 Incrementing the two event counters
The event counter is assigned to a freely selected logic input. Every time the
corresponding logic input is closed, the event counter is incremented. It can
be pre-loaded with a value through the setup program and the keys on the recorder (Configuration level 3
Every time it is incremented, the event is registered by printing the time and
the programmed text, followed by the current state of the counter.
Î Event counter).
The time reference mark “_” will not be printed, since the print-out
may appear after being delayed in the print queue.
v Section 3.5.4 “Limit comparator texts, external text, binary-
linked external text”
If the counter state is larger than 99999, then the number can no
longer be displayed. The print-out will be “ ***** “ for the counter
state.
48
Page 49

3.5.13 Print test
_13.25 03.11.98 Print test
3 Operation and visualisation
The print test can only be initiated from the keys on the printing recorder (Operating level
and the print head.
Î Print test). It is used to test the function of the printing system
The print test carries on until it is stopped by Test print = Off.
Any text prints which have been started will be aborted and not
continued after the print test. This also applies to the statistical report.
All requests for text printing which occur during the print test will
be stored and carried out after the print test.
Six traces will also be printed out for the 3-channel version of the recorder,
since each colour occurs twice. This means that the functioning of all the pens
is tested. In this case, the parameter Configuration level 1
effect.
Î Plot status has no
49
Page 50

3 Operation and visualisation
13.45 03.11.98 SERVICE PRINT
Software version : 105.02.01
Power interrupts : 00012
Operating time [h] : 01234
Event counter 1 : 00000
Event counter 2 : 09000
Temp.-Min. : +20.32
Temp.-Max. : +31.02
3.5.14 Service print
The service print can only be initiated from the keys on the printing recorder
(Operating level
The print-out consists of:
- the current date and time
-the software version
- the number of mains power supply interruptions
- the total operational time of the recorder in hours
- the current state of the two event counters
- the minimum and maximum ambient temperatures of the internal Pt100
cold junction
Î Service print).
50
Any text print-outs which were started will be aborted and not
continued after the service print. This also applies to the statistical
report.
All requests for text printing which occur during the service print
will be stored and carried out after the service print.
If the mathematics/logic module is activated, an “M” will be printed
after the software version.
Page 51

3.6 Colour assignment
With the aid of the setup program you can select the colours which are used
for print-outs.
Selections can be made for:
- Measurement traces
- Event traces
- Instrument name
- External text
- Binary-linked external text
- Even texts, event counters
Texts which are associated with a channel (e.g. scaling, channel
number, limit comparator texts) are printed in the same colour as
the channel concerned. This also applies to the statistical report.
3 Operation and visualisation
The colours are fixed for:
- Start and end text always red
- “Power on” / “Power off” text always red
- Time print alternating
- Print change of feed/speed alternating
1. The colour changes for each print-out. This ensures an even consumption of the coloured inks.
1
1
51
Page 52

3 Operation and visualisation
3.7 Relationship between measurement range and scaling
The printing recorder offers the facility to differentiate between the measurement range for the input signals which are connected and the scaling on the
chart paper.
If the parameter Configuration level 1
is not programmed to linear, X1 or X2, then the selected measurement range is
automatically applied to the scaling. If the characteristic type is linear, X1 or X2
there is no automatic application of the measurement range to the scaling. So
in this case, the scaling should be checked, and altered if necessary (Configu-
ration level 1
Example:
The parameter Measurement input is programmed as a resistance thermome-
ter.
Type: resistance thermometer
Characteristic: Pt100
Connection: 2/3-wire
Dim. unit: °C
Range start: -200°C
Range end: +850°C
Filter: 0.1sec
The measurement range (-200 to +850°C) is automatically applied to the scaling (-200 to +850%).
Example:
The parameter Measurement input is programmed as a current input.
Î Scale).
Î Measurement input Î Characteristic
Ty pe : c ur re nt
Characteristic: linear
Range start: 0mA
Range end: 20mA
Filter: 0.1sec
The measurement range is not applied to the scaling. The parameter Configu-
ration level 1
sional unit).
Unit: l
Start value: 0l
End value: 1000l
Number format: AUTO
Î Scale can be used to alter the scaling (including the dimen-
52
Page 53

4 Configuration table
4.1 Operating examples
Example 1 The date, time and weekday are to be programmed.
l
Key Display Description
5 AMB. TEMP. +35.08°C Recorder is in basic status
h + R Call up operating level
S-LEVEL (now in operating level)
h + R Start code check
CODE: 9200 Enter 9200, by using the l, r, h, R
keys
E Conclude entry of code number
P-LEVEL (now in parameter level)
h Call 1st. parameter of the parameter
level
LANGUAGE
h Call next parameter
DATE & TIME
E Call parameter to be changed
DATE: 03.11.98 Alter date, by using the l, r, h, R
keys
E Confirm date
DAY: MONDAY Alter weekday, using the h, R keys
E Confirm weekday
TIME: 12:00 Change time, using the l, r, h, R
keys
E Confirm time
DATE & TIME Parameter entry is finished
e Leave parameter level
INITIALISATION As long as the display is flashing,
the recorder is being initialised
with the new data
S-LEVEL Recorder is in the operating level again
53
Page 54

4 Configuration table
Example 2 Starting from example 1, the instrument designation is to be changed.
l
Key Display Description
S-LEVEL
h + R Start code check
CODE: 9200 Enter 9200, by using the l, r, h, R
keys
E Conclude entry of code number
P-LEVEL
h + R Call up configuration level 1
C1-LEVEL
h + R Call up configuration level 2
C2-LEVEL
h Call 1st. parameter of this level
UNIT NAME (the name of the instrument)
E Call the parameter to be altered
TEXT: LOGOPRINT 500 Enter the new designation (UNIT
NAME), using the l, r, h, R and S
keys
E Confirm instrument designation
UNIT NAME Parameter entry is finished
e Leave level
C1-LEVEL
e Leave level
P-LEVEL
e Leave level
INITIALISATION As long as the display is flashing,
the recorder is being initialised
with the new data
S-LEVEL Recorder is in the operating level
again
54
e Leave operating level
LOGOPRINT 03.11.98 09:45 Recorder is in basic status again
Page 55

4.2 Table of the configuration parameters
All the parameters for the instrument are presented in the following table. The
parameters are explained in the order in which they appear in the recorder.
The first column of the table shows the path through the levels to the particular
parameter.
The “X” symbol stands for a number which is to be selected (e.g.
channel number 1 — 3 or 1 — 6). This number is shown in the display of the printing recorder for all the sub-parameters.
To preserve a clear layout, the “X” is only shown for the first subparameter in the table.
The settings or selections which are available for the parameter are shown in
the second column.
The third column contains a description of the parameter or the selection options, if the selection or the function of the parameter are not obvious.
4 Configuration table
4.2.1 Operating level (S-level)
Parameter Value/selection Description
Chart speed Operating level
➔ Chart speed
Chart speed: 0, 5, 10, 20, 60, 120, 240,
Print test Operating level
➔ Print test
Print test: OFF, ON
Service print Operating level
➔ Service print
Service print: NO, YES
Version number Operating level
➔ Version number
Version: 105.02.01
Setting the chart paper
speed
300, 360, 600, 720mm/h
Start print test
The print test can be used
to test the functioning of
the printing system
Start service print
The service print provides
information about the software version, no. of mains
power supply interruptions,
total no. of operational
hours of the recorder, the
count states of the event
counters 1 and 2, and the
minimum and maximum
ambient temperatures.
Displays the number of the
software version
55
Page 56

4 Configuration table
4.2.2 Parameter level (P-Level)
Parameter Value/selection Description
Language Parameter level
➔ Language
Language: ENGLISH
Date & time Parameter level
➔ Date & time
Date:
Weekday:
GERMAN
FRENCH
DD:MM:YY
MONDAY
TUESDAY
WEDNESDAY
THURSDAY
FRIDAY
SATURDAY
SUNDAY
Select language
The language setting
affects all the nonprogrammable texts in the
recorder which can be
displayed or printed out.
Programming the
system clock
The actual time is printed
out for certain events, and
is used as a reference time
for time-dependent events,
such as statistical reports,
timed operation, and summer time.
Time:
Summer time Parameter level
➔ Summer time
Summer time:
Start:
Start:
End:
End:
Display brightness Parameter level
➔ Display
Brightness: 1 — 4
Display time Parameter level
➔ Display time
Display time: ON, OFF
hh:mm
OFF, ON
Enter date:
DD:MM:YY
Enter time:
hh:mm
Enter date:
DD:MM:YY
Enter time:
hh:mm
Entry of the period during
which the system clock of
the recorder will be adjusted to summer time.
The period of summer time
is only valid for the defined
period of time.
It must be freshly programmed each year.
Start and end can only be
entered if the status is set
to ON.
Display brightness
1 = dark
4 = very bright
Select status for display of
time in the basic status
56
Page 57

4.2.3 Configuration level 1 (C1-level)
Parameter Value/selection Description
Plot status Configuration level 1
➔ Plot status
X Plot status 1 — 3 or 1 — 6
Status: ON, OFF
4 Configuration table
Setting for each writing
channel: should the signal
trace be printed on the
chart and appear in the
statistical report or not.
Measurement input Configuration level 1
➔ Measurement input
X Measurement input
Ty pe :
Configuration level 1
➔ Measurement input
Type: Resistance
thermometer
Characteristic: Pt100, Pt100 JIS, Pt500,
Connection: 2/3-wire
Unit:
(dimension)
Range start: -9999 to +9999 Enter start of
Range end: -9999 to +9999
1—3 or 1—6
RES.THERMOMETER
THERMOCOUPLE
POTENTIOMETER
RES. TRANSMITTER
VO LTAG E
CURRENT
SHUNT
Pt1000, Ni100, X1, X2,
4-wire
°C, °F
Measurement span ≥ 15°C
Select the type of probe/
sensor and input signal,
determine the measurement range + filter time
constant for each input
channel.
X1 = customer-specific
linearisation 1
X2 = customer-specific
linearisation 2
(with X1 or X2 : followed
immediately by the entry
for the filter parameter.
Determine the type of
connection for the
resistance thermometer.
measurement range
Enter end of
measurement range
1
1
Filter: 0.0 — 50.0sec Enter filter constant
Configuration level 1
➔ Measurement input
Type: thermocouple
Characteristic: L, J, U, T, K, E, N, S, R, B,
X1, X2
Unit:
(dimension)
1. The limits for range start and range end differ according to the characteristic
°C, °F
X1 = customer-specific
linearisation 1
X2 = customer-specific
linearisation 2
(with X1 or X2 : followed
immediately by the entry
for the filter parameter)
57
Page 58

4 Configuration table
Parameter Value/selection Description
Range start: -9999 to +9999 Enter start of
measurement range
1
Range end: -9999 to +9999
Cold junction:
(temp. comp.)
Cold junct. temp.:
(comp. temp.)
Filter: 0.0 — 50.0sec Enter filter constant
Configuration level 1
➔ Measurement input
Typ e: P ot ent io m et er
Characteristic: linear, X1, X2
Connection: 2/3-wire
Meas. span ≥ 100°C
for Type S, R, B ≥ 500°C
INTERN Pt 100
EXT. CONST.
Value range:
-50 to +100°C
4-wire
Enter end of
measurement range
Select cold junction
Enter cold junction temp.,
if cold junction = EXT.
CONST.
X1 = customer-specific
linearisation 1
X2 = customer-specific
linearisation 2
(with X1 or X2 : followed
immediately by the entry
for the filter parameter)
Determine type of connection for the potentiometer
1
Start res. Ro: 0 ≤ Ro ≤ 4000Ω Enter start resistance
Res. range Rp: 6 ≤ Rp ≤ 4000Ω
Ro + Rp ≤ 4000Ω
Meas. span ≥ 6Ω
Filter: 0.0 — 50.0sec Enter filter constant
Configuration level 1
➔ Measurement input
Type: res. transmitter
Characteristic: linear, X1, X2
Start res. Ra: 0 ≤ Ra ≤ 4000Ω Enter start resistance
Res. range Rs: 6 ≤ Rs ≤ 4000Ω Enter measurement range
1. The limits for range start and range end differ according to the characteristic
Enter measurement range
(resistance Rp)
X1 = customer-specific
linearisation 1
X2 = customer-specific
linearisation 2
(with X1 or X2 : followed
immediately by the entry
for the filter parameter)
58
Page 59

4 Configuration table
Parameter Value/selection Description
End res. Re: 0 ≤ Re ≤ 4000Ω
Ra + Rs + Re ≤ 4000Ω
Meas. span ≥ 6Ω
Filter: 0.0 — 50.0sec Enter filter constant
Configuration level 1
➔ Measurement input
Type: voltage
Characteristic: linear, Pt100, Pt100 JIS,
Pt500, Pt1000, Ni100, L, J,
U, T, K, E, N, S, R, B, X1,
X2
Unit: mV, V
Range start: -9999 to +9999
-10V ≤ range start < 10V
Enter end resistance
X1 = customer-specific
linearisation 1
X2 = customer-specific
linearisation 2
(with X1 or X2 : followed
immediately by the entry
for the filter parameter)
Enter start of
measurement range
1
Range end: -9999 to +9999
Temperature:
(dimension)
Temp. start: -9999 to +9999 Enter start of temperature
Temp. end: -9999 to +9999
Filter: 0.0 — 50.0sec Enter filter constant
Configuration level 1
➔ Measurement input
Type: current / shunt
Characteristic: linear, Pt 100, Pt 100 JIS,
Enter end of
-10V < range end ≤ 10V
Meas. span ≥ 5mV
°C, °F (only for thermocouples
Measurement span
-Resistance
thermometer ≥ 15°C
- Thermocouples
≥ 100°C
- S, R, B ≥ 500°C
Pt 500, Pt 1000, Ni 100, L,
J, U, T, K, E, N, S, R, B, X1,
X2
measurement range
and resistance
thermometers)
1
range
(only for thermocouples
and resistance
thermometers)
Enter end of temperature
1
range
(only for thermocouples
and resistance
thermometers)
X1 = customer-specific
linearisation 1
X2 = customer-specific
linearisation 2
(with X1 or X2 : followed
immediately by the entry
for the filter parameter)
1
Range start: -9999 to +9999
-20mA ≤ rge. start < 20mA
1. The limits for range start (temp. start) and range end (temp. end) differ
according to the characteristic
Enter start of measurement
1
range
59
Page 60

4 Configuration table
Parameter Value/selection Description
Range end: -9999 to +9999
-20mA < rge. end ≤ 20mA
Meas. span ≥ 0.5mA
Enter end of measurement
1
range
Temperature:
(dimension)
Temp. start: -9999 to +9999 Enter start of temperature
Temp. end: -9999 to +9999
Filter: 0.0 — 50.0sec Enter filter constant
Scale Configuration level 1
➔ Scale
X Scale: 1 — 3 or 1 — 6 Select reference channel
°C, °F (only for thermocouples
and resistance
thermometers)
1
range
(only for thermocouples
and resistance
thermometers)
Enter end of temperature
1
Measurement span
-Resistance
thermometer ≥ 15°C
- Thermocouples
≥ 100°C
- S, R, B ≥ 500°C
range
(only for thermocouples
and resistance
thermometers)
Channel name
(word and number)
Unit:
(dimension)
Zero: -9999 to +9999 Enter start of scaling
Full: -9999 to +9999 Enter end of scaling
Decimal point: AUTO, x.xxx, xx.xx, xxx.x,
Configuration level 1
➔ Word and number
X Word and number
Te xt :
1. The limits for range start (temp. start) and range end (temp. end) differ
according to the characteristic
5 characters
xxxx.
1—3 or 1—6
16 characters
Select position of
decimal point
Enter the designation for
each channel
The designation is used,
for instance, for the scaling
printed in the chart, and is
shown in the display,
together with the
measurement.
The complete character set
is available for use.
60
Page 61

Parameter Value/selection Description
Limit comparator Configuration level 1
➔ Limit comparator
X Limit comparator 1 — 8 Select limit comparator
Limit value: -9999 to +9999 Enter value for limit
Lower differential: 0 — 9999 Enter the hysteresis below
Upper differential: 0 — 9999 Enter the hysteresis above
4 Configuration table
the limit value
the limit value
Limit operation
(limit feed)
LK-function:
(LK=limit comparator)
Probe break: OFF = 0, ON = 1,
Limit-text status: OFF, ON Enter status for the print-
TXT L:
(L = lower)
TXT H:
(H = higher)
Channel: 1 — 3 or 1 — 6 Select reference channel
Configuration level 1
➔ Limit feed
X Limit feed 1 — 3 or 1 — 6 Select reference channel
lk7, lk8 Select limit comparator
function
Determine relay state for a
CONST.
16 characters Text for going below the
16 characters Text for exceeding the limit
probe break
(CONST. = constant: limit
state will be held)
out of out-of-limit signals
(for OFF, text entries are
not required)
limit value
value
for the limit comparator
Status: ON, OFF Select status for limits
Low: -9999 to +9999 Enter lower limit, if status
is ON
High: -9999 to +9999 Enter upper limit, if status
is ON
61
Page 62

4 Configuration table
Parameter Value/selection Description
Zoom Configuration level 1
➔ Zoom
X Zoom 1 — 3 or 1 — 6 Select reference channel
Low: 0 — 90 Enter measurement value
for start (in % of measurement range)
Presentation range
(offset)
Peak value
recording
High: 10 — 100
End – start ≥ 10%
Configuration level 1
➔ Offset
X Offset 1 — 3 or 1 — 6 Select reference channel
Low: 0 — 99mm Enter offset start in mm
High: 1 — 100mm
Start < End
Configuration level 1
➔ Peak value recording
X Peak value
recording
Status:
1-3 or 1-6
OFF, ON
Enter measurement value
for end (in % of measurement range)
Enter offset end in mm
Select reference channel
Select status
62
Page 63

4.2.4 Configuration level 2 (C2-level)
Parameter Value/selection Description
Unit name Configuration level 2
➔ Unit name
Text: 16 characters Enter instrument
Open-collector
output
Speed in limit
operation
(feed limit)
Timed operation
(feed time)
Print speed change Configuration level 2
Configuration level 2
➔ Open-collector output
X Output 1 — 4 Select open-collector
Status: OFF, ON Enter status
Configuration level 2
➔ Feed limit
Feed limit: 0, 5, 10, 20, 60, 120, 240,
Configuration level 2
➔ Feed time
Feed time: 0, 5, 10, 20, 60, 120, 240,
from - to: Enter any time for “from” Enter start time
from - to: Enter any time for “to” Enter end time
➔ Print speed change
Status: OFF, ON
4 Configuration table
300, 360, 600, 720mm/h
300, 360, 600, 720mm/h
designation
output
Select speed
The recorder switches to
this chart speed, if the
limits configured in the
parameter Configuration
level 1 Î Limit feed are
infringed
Select speed
This chart speed only
applies during the defined
period of time
Select the status for printout of an alteration or
change-over of the chart
speed
Print the
“Power on” text
Print the
“Power off” text
Print the
scaling
Configuration level 2
➔ Print the "power on" text
Status: OFF, ON Status for print-out of the
“power on” text (if OFF:
text entry not required)
Text: 16 characters Enter ”power on” text
Configuration level 2
➔ Print the “power off” text
Status: OFF, ON Status for the print-out of
the “power off” text (if OFF:
text entry is not required)
Text: 16 characters Enter “power off” text
Configuration level 2
➔ Print scale
Spacing: OFF, 30, 60, 90cm
Determine the regular interval at which the scaling
should be printed in the
chart
63
Page 64

4 Configuration table
Parameter Value/selection Description
Print the time Configuration level 2
➔ Print time
Spacing: OFF, 2, 4, 6cm
Print the
channel numbers
Report Configuration level 2
Configuration level 2
➔ Print channel numbers
Spacing: OFF, 2, 4, 6cm
➔ Report
X Report
1-2
Determine the regular interval at which the time
should be printed in the
chart
Determine the interval for
printing the traces in the
chart, labelled with the corresponding channel numbers
Select report/instance
number
Ty pe :
Configuration level 2
➔ Report
Typ e: P ER IOD IC
Report time:
Interval
Configuration level 2
➔ Report
Typ e: W EE KLY
REPORT
Report time:
WEEKDAY:
Configuration level 2
➔ Report
Type: MONTHLY
REPORT
OFF, PERIODIC,
WEEKLY REPORT,
MONTHLY REPORT,
EXTERN.CONTACT
Enter any time
1, 2, 3, 4, 6, 8, 12, 24h
Enter any time
MONDAY, TUESDAY,
WEDNESDAY,
THURSDAY, FRIDAY,
SATURDAY, SUNDAY
Select type of report
Enter start time for the first
report
Select a period
Enter time
Select weekday
The report is made on the
first day of the month
64
Report time: Enter any time
Configuration level 2
➔ Report
Type:EXTERN.
CONTACT
Time at which the report is
made
The report is initiated by a
logic input
(Configuration level 3 Î
External report)
Page 65

Parameter Value/selection Description
Start text Configuration level 2
➔ Start text
Status: OFF, ON Select the status for the
Text: 16 characters Enter start text
End text Configuration level 2
➔ End text
Status: OFF, ON Select the status for the
Text: 16 characters Enter end text
Default setting
(presetting)
Code number Configuration level 2
Configuration level 2
➔ Presetting
Presetting: NO, YES Overwrite parameters and
➔ Code
All parameters: 0 — 9999 Enter new code number for
4 Configuration table
print-out of the start text
(if OFF: text entry not
required)
print-out of the end text
(if OFF: text entry not
required)
configuration data with
standard values
the full parameter set
Select parameters: 0 — 9999 Enter new code number for
the limited parameter set
65
Page 66

4 Configuration table
4.2.5 Configuration level 3 (C3-level)
Parameter Value/selection Description
Relay output Configuration level 3
➔ Relay output
X Relay 1 — 8 Select relay
Status: OFF, ON OFF = relay inactive
Mathematical
module
Interface Configuration level 3
Configuration level 3
➔ Mathematical module
Mathematical m.: OFF, ON Activate/de-activate
➔ Interface
Protocol: J-BUS, MOD-BUS
ON = relay operates as an
LK output
mathematics module
Set up RS422/RS485
Select protocol
Baud: 0.15, 0.3, 1.2, 2.4, 4.8, 9.6,
Data format: 8/1/NO,
Address: 1 — 255 Select address
Min. response time: 0 — 500msec. Select minimum response
External text Configuration level 3
➔ External text
X External text 1 — 8 Select the number of the
Contact: OFF, Log. input 1,
19.2, 38.4, 125,
187.5kBaud
8/1/ODD,
8/1/EVEN,
8/2/NO,
8/1/ZERO
Log. input 2, Log. input. 3,
Log. input 4, Log. input 5,
Log. input 6, Log. input 7,
Log. input 8
Select baud rate
Select data format
(Data bits / stop bits /
parity)
time
external text
Select logic input.
(if OFF: the text entry is not
required)
Binary-linked
external text
(text logic links)
66
Text: 16 characters Enter text
Configuration level 3
➔ Text logic links
Link: OFF, Log. input 1,
Log. input 1-2,
Log. input 1-3,
Log. input 1-4
Select the inputs which are
to be binary-linked, (if OFF,
all further sub-parameters
are not required)
Page 67

Parameter Value/selection Description
Text logic links 00 — 01 (Log. input 1)
Text status: OFF, ON Select the status for the
Text: 16 characters Enter text
External stop Configuration level 3
➔ External stop
Contact: OFF, Log. input 1,
External speed Configuration level 3
➔ External speed
Contact: OFF, Log. input 1,
4 Configuration table
00 — 03 (Log. input 1-2)
00 — 07 (Log. input 1-3)
00 — 15 (Log. input 1-4)
Log. input 2, Log. input 3,
Log. input 4, Log. input 5,
Log. input 6, Log. input 7,
Log. input 8
Log. input 2, Log. input 3,
Log. input 4, Log. input 5,
Log. input 6, Log. input 7,
Log. input 8
Select binary combination
(text-no.)
text printing
Select logic input
Select logic input
External speed: 0, 5, 10, 20, 60, 120, 240,
Event counter Configuration level 3
➔ Event counter
X Event counter 1 — 2 Select event counter
Contact: OFF, Log. input 1,
EC status: OFF, ON Select status
Start value: -99999 to +99999 Enter start value for the
Text: 16 characters Text for designation of the
External scaling Configuration level 3
➔ External scaling
Contact: OFF, Log. input 1,
300, 360, 600, 720mm/h
Log. input 2, Log. input 3,
Log. input 4, Log. input 5,
Log. input 6, Log. input 7,
Log. input 8
Log. input 2, Log. input 3,
Log. input 4, Log. input 5,
Log. input 6, Log. input 7,
Log. input 8
Select speed when
contact <> OFF
Select logic input or
status (if OFF: all the following sub-parameters are
not required)
event counter
event counter
Select logic input
67
Page 68

4 Configuration table
Parameter Value/selection Description
External report Configuration level 3
➔ External report
X External report
1-2
Select report/instance
number
Contact:
Key inhibit Configuration level 3
➔ Key inhibit
Contact: OFF, Log. input 1,
Event traces Configuration level 3
➔ Event traces
X Event trace 1 — 8 Select event trace
Trace status: OFF, ON Enter status for the print-
Source: LOG.INPUT
OFF, Log. input 1,
Log. input 2, Log. input 3,
Log. input 4, Log. input 5,
Log. input 6, Log. input 7,
Log. input 8
Log. input 2, Log. input 3,
Log. input 4, Log. input 5,
Log. input 6, Log. input 7,
Log. input 8
LIMITCOMP.
Select logic input
Select logic input
out of the event trace
Select source for event
trace, if status is ON
68
Page 69

5 Identifying the instrument version
5.1 Instrument description
The printing recorder is equipped with 3 or (optionally) 6 signal inputs, which
are electrically isolated from one another. The evaluation of the measurement
traces of the printing recorder can be assisted by printed texts.
The programming of the instrument is possible either by using the 8 keys on
the front of the instrument or through a PC setup program. The configuration
data are permanently stored in an EEPROM.
A 24-character LED dot-matrix display is available for checking and configuring the parameters and displaying the latest measurements on the instrument.
Thermocouples, resistance thermometers, resistance transmitters, potentiometers, voltages or currents (standard signals) are all possible as input signals.
The appropriate linearisations are carried out automatically, and can also be
adjusted to customer-specific linearisation with the aid of the setup program.
Further outstanding features of this instrument, which are already included in
the basic model, are four open-collector outputs for signalling infringements of
limits and errors, as well as 8 event traces.
Eight logic inputs are available for control functions. The ER8 external relay
module, for mounting on standard C-rails, expands the printer with 8 switchable outputs. A 2-wire transmitter can be fed from an electrically isolated supply voltage.
The maths/logic module can be used in most cases to achieve an individual
adaptation, even for quite complex tasks.
In the event of a mains supply failure, the real-time clock is buffered by a lithium battery or a storage capacitor.
Block structure
69
Page 70

5 Identifying the instrument version
5.2 Order details
(1) Basic version
706030/14 LOGOPRINT 500 with 3 universal inputs
706030/15 LOGOPRINT 500 with 6 universal inputs
x x 888 factory setting
x x 999 configuration to customer specification
x 000 not used
x 888 factory setting
x 999 configuration to customer specification
x x 00 not used
x x 52 RS422, Jbus, MODbus
x x 53 RS485, Jbus, MODbus
x x 22 20 — 53V AC/DC, 48 — 63Hz
x x 23 110 — 240V AC +10/-15%, 48 — 63Hz
x x 020 lithium battery for memory buffering (ex factory)
x x 021 storage capacitor (instead of extra code 020)
x x 030 terminal with shunt (6 items)
x x 259 8 logic inputs, interface for external
x x 265 door with lock (IP54)
x x 266 IP65 seal, wide mounting brackets
x x 350 universal portable housing TG-35
x x 351 housing with carrying handle
x x 247 housing for wall mounting (can be rotated through 90°)
Order code ----/
Order example 706030/14 - 888 - 000 - 00 - 23 / 020
1. Please specify probe types and ranges in plain text.
2. This extra code is available in combination with supply voltage 110—240V AC, not with low supply voltage. UL approval is not available. The protection type in the carrying case corresponds to
IP20, outside IP20D.
3. UL approval is not available.
4. List extra codes in sequence, separated by commas.
(2) Inputs 1 — 3 (configurable)
1
(3) Inputs 4 — 6 (configurable)
1
(4) Interface
(5) Supply voltage
(6) Extra codes
relay module ER8, voltage output
24V DC 50mA
2
3
3
(1) (2) (3) (4) (5) (6)
,...
4
Programming
accessories
Standard
accessories
70
- Setup program, multilingual
- PC interface with TTL/RS232 converter
- PC interface with USB/TTL converter, adapter (socket) and adapter (pins)
- 1 Operating Manual B 70.6030.0
-2 fixing brackets
- cable-tie with foot (can be released) for tension relief
of the sensor leads connected
- one 3-colour print head (for 3-channel recorder)
or
one 6-colour print head (for 6-channel recorder)
- 1 roll of chart paper, 32m long
and
1 block of fanfold paper, 16m long
Page 71

6.1 Site and climatic conditions
The installation site should be as free as possible from vibration. Stray electromagnetic fields, for instance those caused by motors, transformers and the
like, should be avoided where possible.
The ambient temperature at the installation site must not go outside the range
0 to +50°C, at a relative humidity of 20 — 70%. No condensation is permitted.
Corrosive gases or vapour can affect the functioning and the operational life of
the printing recorder.
v Section 7.1 “Installation notes”
6.2 Assembly in a control panel
Views
6 Installation
Panel
cut-out
Dimension 26 increased to 27 when using the IP65 seal.
71
Page 72

6 Installation
Fixing bracket
Mounting h Insert the recorder from the front into the panel cut-out.
h From the back of the panel, hook the two mounting brackets into the cut-
outs in the sides of the housing. The flat faces of the brackets must lie
against the housing.
h Place the brackets against the rear of the panel, and tighten them evenly.
72
Page 73

7.1 Installation notes
k The rules of VDE 0100 “Regulations for the installation of high-current
equipment with rated voltages below 1000V” or the equivalent national
standards must be observed for the selection of cables, installation and
electrical connection of the instrument.
k Internal work on the instrument may only be carried out by properly qual-
ified personnel, and then only to the extent described. The same applies
to electrical connections.
k Ensure that the instrument is completely isolated from the mains power
before carrying out work where live components may be touched.
k The electromagnetic compatibility (EMC) corresponds to that of the
standards and regulations cited in the technical data.
k It is recommended that input, output and supply cables are routed sepa-
rately from one another, and not laid in parallel.
k All input and output lines that are not connected to the supply network
must be laid out as shielded and twisted cables. The shielding must be
grounded to the earth potential on the instrument side.
7 Electrical connection
k Earth the instrument by connecting the PE terminal on the instrument to
the protective earth. This lead must have the same cross-section as the
supply cable. Earthing leads must be routed in star configuration to a
common earthing point which is connected to the protective earth of the
supply voltage. Earthing leads must not be daisy-chained, i.e. led from
one instrument to another.
k No other apparatus is permitted to be connected to the mains supply
terminals of the instrument.
k The instrument is not suitable for operation in areas with an explosion
hazard.
k Inductive components in the neighbourhood of the instrument, such as
contactors or magnetic valves, must have RC combinations fitted for interference suppression.
k The instrument must be provided with external fusing and disconnection.
Depending on the supply voltage, the following fuse values apply for the
external fusing:
20 — 53V AC/DC, 48 — 63Hz fuse 5A slow
110 — 240V AC +10/-15%, 48 — 63Hz fuse 5A slow
73
Page 74

7 Electrical connection
7.2 Technical data
Thermocouple
input
Measurement range Linearisation accuracy
Fe-Con L
Fe-Con J EN 60584
Cu-Con U
Cu-Con T EN 60584
NiCr-Ni K EN 60584
NiCr-CuNi E EN 60584
NiCrSi-NiSi N E 60584
Pt10Rh-Pt S EN 60584
Pt13Rh-Pt R EN 60584
Pt30Rh-Pt6Rh B
EN 60584
Shortest measurement span Types L, J, U, T, K, E, N:
Range start/end freely programmable within the limits, in 0.1°C steps
Cold junction Pt100 internal or thermostat as external constant
Cold junction accuracy
(internal)
Cold junction temperature
(external)
Measurement time for 3 channels < 2sec; for 6 channels < 4sec
Input filter 2nd. order digital filter; filter constant adjustable from 0 to 50.0sec
Features also programmable in °F; customer-specific linearisation
1. The linearisation accuracy refers to the maximum measurement span.
The linearisation accuracy is reduced for shorter spans.
-200 to +900°C
-210 to +1200°C
-200 to +600°C
-270 to +400°C
-270 to +1372°C
-270 to +1000°C
-270 to +1300°C
-50 to +1768°C
-50 to +1768°C
0 to 1820°C
Types S, R, B:
-50 to +100°C, adjustable through setup software
±0.2%
±0.2% above -200°C
±0.3%
±0.5% above -200°C
±0.2% above -150°C
±0.2% above -200°C
±0.2% above -150°C
±0.5% above 0°C
±0.5% above 0°C
±0.5% above 500°C
100°C
500°C
± 1°C
1
Resistance
thermometer
input
Connection Range Linearisation
accuracy
Pt 100 EN 60751 2/3-wire
2/3-wire
4-wire
4-wire
Pt 100 JIS 2/3-wire
2/3-wire
4-wire
4-wire
Pt 500 DIN 2/3-wire
2/3-wire
4-wire
4-wire
Pt 1000 DIN 2/3-wire
2/3-wire
4-wire
4-wire
Ni 100 2/3-wire
2/3-wire
4-wire
4-wire
Connection type 2-, 3- or 4-wire circuit
Shortest measurement span 15°C
Probe lead resistance max. 30 Ω per core for 4-wire circuit
-200 to +250°C
-200 to +850°C
-200 to +250°C
-200 to +850°C
-200 to +260°C
-200 to +649°C
-200 to +260°C
-200 to +649°C
-200 to +150°C
-200 to +850°C
-200 to +150°C
-200 to +850°C
-200 to +250°C
-200 to +850°C
-200 to +250°C
-200 to +850°C
-60 to +125°C
-60 to +180°C
-60 to +125°C
-60 to +180°C
max. 20Ω per core for 2- and 3-wire circuit
for Pt100 up to 260°C max. 10 Ω per core in
2- and 3-wire circuit
±0.6°C
±1.0°C
±0.5°C
±0.8°C
±0.6°C
±1.0°C
±0.5°C
±0.8°C
±0.6°C
±1.0°C
±0.5°C
±0.8°C
±0.6°C
±1.0°C
±0.5°C
±0.8°C
±0.6°C
±1.0°C
±0.5°C
±0.8°C
Meas.
current
500μA
250μA
500μA
250μA
500μA
250μA
500μA
250μA
250μA
250μA
250μA
250μA
500μA
250μA
500μA
250μA
500μA
250μA
500μA
250μA
74
Page 75

Input from
resistance
transmitter or
potentiometer
7 Electrical connection
Range start/end freely programmable within the limits, in 0.1°C steps
Measurement time for 3 channels < 2sec; for 6 channels < 4sec
Input filter 2nd. order digital filter; filter constant adjustable from 0 to 50sec
Features also programmable in °F; customer-specific linearisation
Measurement range Accuracy Measurement current
up to 200Ω
up to 400Ω
up to 800Ω
up to 2000Ω
up to 4000Ω
Connection type resistance transmitter: 3-wire circuit
Shortest span 6Ω
Probe lead resistance max. 30Ω per core for 4-wire circuit
Resistance values freely programmable within the limits, in 0.1Ω steps
Measurement time for 3 channels < 2sec; for 6 channels < 4sec
Input filter 2nd. order digital filter; filter constant adjustable from 0 to 50.0 sec
±300mΩ
±600mΩ
±1Ω
±2Ω
±3Ω
potentiometer: 2-, 3- or 4-wire circuit
max. 20Ω per core for 2- and 3-wire circuits
up to 200 Ω range: max. 10Ω per core
in 2- and 3-wire circuits
500μA
250μA
250μA
500μA
250μA
DC voltage or
current input
Measurement range Accuracy Input resistance
-25 to +75mV
0 to 100mV
-100 to + 100mV
0 to 200mV
-500 to + 500mV
0to 1V
-1 to +1V
-5 to +5V
0to 10V
-10 to +10V
Shortest span 5mV
Range start/end freely programmable within the limits
4— 20mA
0— 20mA
-20 to +20mA
Shortest span 0.5mA
Range start/end freely programmable within the limits, in 0.1mA steps
Measurement time for 3 channels < 2 sec; for 6 channels < 4sec
Input filter 2nd. order digital filter; filter constant adjustable from 0 to 50.0sec
Features linearisation for thermocouples and resistance thermometers is
±100μV
±100μV
±150μV
±150μV
±1mV
±1mV
±2mV
±10mV
±10mV
±15mV
(up to 999mV in 0.01 mV steps, above 1 V in 1mV steps)
±20μA
±20μA
±40μA
adjustable (for connecting transmitters without linearisation)
R
> 10 MΩ
E
R
> 10 MΩ
E
R
> 10 MΩ
E
R
> 10 MΩ
E
R
> 10 MΩ
E
R
> 10 MΩ
E
R
> 10 MΩ
E
R
> 0.5 MΩ
E
R
> 0.5 MΩ
E
R
> 0.5 MΩ
E
burden voltage ≤ 2.6V
burden voltage ≤ 2.6V
burden voltage ≤ 2.6V
Transducer
short-circuit/
break
Short-circuit
Thermocouple not recognised recognised
Resistance thermometer recognised recognised
Resistance transmitter recognised recognised
Potentiometer not recognised recognised
Voltage up to ± 1V not recognised recognised
1
Break
1
2
2
75
Page 76

7 Electrical connection
Outputs
Printing system
Short-circuit
Voltage above ± 1V not recognised not recognised
Current not recognised not recognised
1. The print head is positioned to 0% , “>>>>>>” appears in the LED dot-matrix display.
2. In 4-wire circuit: only recognised at terminals 1 and 2.
3 open-collector
outputs
one open-collector output to signal faults (e.g. chart paper end)
Drive stepper motor
Sensitivity ≤ 0.2% referred to 100mm writing width
Reproducibility ≤ 0.25% referred to 100mm writing width
Display and recording
accuracy
Print head print head with pen-lift function – sufficent for approx. 1 million dots
Print colours violet, red, black for 3-channel printing recorder and
Over/underrun electronically limited to 0 — 100mm writing width
Chart speed programmable in stages 0, 5, 10, 20, 60, 120, 240, 300, 360, 600,
Paper feed by stepper motor and gearing
Chart paper cassette cassettes for roll chart and fanfold chart
Chart paper
total width
writing width
sprocket roller spacing
visible diagram length
total length
Class 0.5 referred to the measurement range limits and the basic
violet, red, black, green, blue, brown for 6-channel recorder.
The colour assignment can be changed at will, through the
1
to signal over/under limit
measurement ranges
(depending on the ambient temperature)
setup program.
720mm/h
( with tear-off edge and paper-end switch)
roll or fanfold chart paper to DIN 16 320
120mm
100mm
110mm
roll chart: 60mm; fanfold chart: 30 to 60 mm
roll chart: 16m or 32m; fanfold chart: 16m
Break
1
Electrical
data
76
Supply
(switch-mode power supply)
Electrical safety
Test voltages (type test)
- Mains supply to
measurement circuits
- Mains supply to
housing (protective earth)
- Between measurement
circuits
- Between measurement
circuits and housing
- Electrical isolation
between the
analogue inputs
Supply voltage sensitivity < 0.1% of the measurement span
AC: 110 — 240V +10/-15% 48 — 63Hz or
DC/AC: 20 — 53V 48 — 63Hz
to EN 61 010, Part 1 of March 1994
overvoltage category II, pollution degree 2
with AC supply 2.3kV/50 Hz, 1 min,
with DC/AC supply 510V/50 Hz, 1 min
with AC supply 1.5kV/50 Hz, 1 min,
with DC/AC supply 510V/50 Hz, 1 min
200V/50 Hz, 1 min
500V/50 Hz, 1 min
up to 30V AC or 50V DC
Page 77

7 Electrical connection
Power consumption max. 35VA
Data buffering Through a lithium battery in RAM > 4 years, or
with a storage capacitor: 2 days at 15 to 25°C ambient temperature.
Additional backup in EEPROM.
Electrical connection At rear through plug-in screw terminals,
conductor cross-section max. 2.5mm
Setup connector at front behind the flip-up
dot-matrix display.
EMC
- Interference emission
- Immunity to interference
Safety standard to EN 61 010
EN 61 326
Class B
to industrial requirements
2
or 2x 1.5mm2 with ferrules.
Housing
Approvals/
marks of
conformity
Housing type
- housing door
Transport mechanism in corrosion-resistant chrome-nickel steel
Chart paper cassette in plastic (polycarbonate)
Front bezel size 144mm x 144mm
Mounting depth 212mm without screw terminals;
Control panel cutout 138
Housing mounting in a control panel to DIN 43 834
Ambient temperature range 0 to +50°C
Ambient temperature error 0.2%/10°C
Storage temperature range -20 to +70°C (without print head), -20 to +55°C (with print head)
Climatic conditions 20 to 70% rel. humidity, no condensation
Operating position NL 90 ± 30, DIN 16 257 (vertical)
Protection to EN 60 529 Category 2,
Weight max. 3.5 kg
Mark of
conformity
c UL us Underwriters
Te st i ng
laboratory
Laboratories
Certificates /
certification numbers
E 201387 UL 3111-1
Housing for flush-panel mounting to IEC 61 554,
in zinc-plated steel sheet
die-cast zinc
227mm with screw terminals plugged in
front IP54 (IP65 with extra code 266),
+1.0
mm x 138
rear IP20
Test basis valid for
CAN/CSA
C22.2 No. 1010.1-92
+1.0
mm
the flush-mounted instrument;
not in conjunction with
extra codes 350, 351
and 247
77
Page 78

7 Electrical connection
7.3 Connection diagram
Rear view of
3/6-channel
version
Terminal assignment
3/6-channel version
Supply as on label N neutral
L1 line
PE earth
Analogue inputs Inputs
123456
field
Thermocouple
Resistance
thermometer
in 2-wire circuit
Resistance
thermometer
in 3-wire circuit
1. 2. 3. 4. 5. 6.
Terminal symbol
field
10.
78
Page 79

7 Electrical connection
Analogue inputs Inputs
123456
field
Resistance
thermometer
in 4-wire circuit
Resistance transmitter
with 3-wire connection
Potentiometer
2-wire circuit
A = start
S = slider
E = end
Potentiometer
in 3-wire circuit
Potentiometer
in 4-wire circuit
Voltage input
≤ ± 1V
Voltage input
> ± 1V
Current input
± 20mA
Current input (shunt)
≤ ±20mA
1. 2. 3. 4. 5. 6.
(when using transducers
with changeable internal resistance; extra code “terminal with shunt” is required)
79
Page 80

7 Electrical connection
External relay
module ER8
Voltage source
for external
2-wire
transmitter
Logic operating
inputs
min. pulse length:
HIGH 400msec
LOW 400msec
Communication
with external
relay module
24V / 45mA
± 5%
Contact operation
LOW =
R
≥ 100kΩ
OFF
HIGH =
≤ 50kΩ
R
ON
Voltage operation
LOW =
DC 0 — 5V
(not active)
HIGH =
DC 20 — 35V
(active)
Field
7.
contact no. 7 =
logic input 1
.
.
Open-collector
outputs
Serial interface
RS 422/RS 485
DOUT1 — DOUT4
U
= DC 32V
max
= 100mA
I
max
“On” voltage
DOUT active
U
DOUTactive
0.4 — 1.2V
Communication
with higherlevel systems
=
.
contact no. 14 =
logic input 8
8.
9.
80
Page 81

7.4 Electrical isolation
7 Electrical connection
81
Page 82

7 Electrical connection
82
Page 83

8.1 Opening and closing the door
Channel designation label
Turn the knob to open or close the door, .
8 Starting up
8.2 Marking the channel label
After the door has been opened, the measurement channel designation label
can be removed and marked, as required, with the channel specific data, such
as measurement range, zoom, and presentation range.
83
Page 84

8 Starting up
8.3 Fitting the print head
h Open the door
h Stop recording (press the S key)
In the stop state, the print head is always moved to the middle of
the recording band.
h Swing the display radially upwards
h Push the print head into the holder, up to the stop
h Swing the display downwards, until it snaps into place
h Start recording again (press the S key)
84
Page 85

9.1 Consumables
Print head
3 colours for 3-channel recorder
Packing unit: 2 pieces
Part No.: 00355244
6 colours for 6-channel recorder
Packing unit: 2 pieces
Part No.: 00355255
Roll chart paper
no name, % graduation, linear
overall length: 16m
overall width: 120mm
Packing unit: 5 rolls
Part No.: 00331497
no name, % graduation, linear
overall length: 32m
overall width: 120mm
Packing unit: 5 rolls
Part No.: 00331499
9 Consumables
no name, special graduation, linear
(printed as order specification)
Fanfold chart paper
no name, % graduation, linear
overall length: 16m
overall width: 120mm
Packing unit: 5 packs
Part No.: 00331490
no name, special graduation, linear
(printed as order specification)
Make sure you use the correct print head.
For instance, it is inappropriate to use a 3-colour print head in a
6-channel recorder.
85
Page 86

9 Consumables
9.2 Removing and replacing the chart cassette
86
Page 87

9 Consumables
- When inserting the chart cassette, take care that it is
centered on the tear-off edge and – guiding it with the
thumb and index finger – insert it into the cassette slot and
push it up gently, until the holding/ejector catch snaps into
position.
- When the cassette has been inserted, the paper feed
should immediately take up the slack in the paper (about
10mm feed).
- If the paper feed does not start up, then the cassette will
have to be removed and replaced in the correct position.
- Check that the holding catch is in the final (latched)
position.
87
Page 88

9 Consumables
9.2.1 Changing the roll chart
15
2
37
6
88
48
Page 89

9.2.2 Changing the fanfold chart
5 cm10 cm
15 cm
****** ***** ***** ****
1 m
ENDE
END
FIN
14
9 Consumables
25
3
89
Page 90

9 Consumables
90
Page 91

10 Extra codes and accessories
10.1 Converting the chart cassette
13
24
91
Page 92

10 Extra codes and accessories
10.2 “8 logic inputs”, “interface for ER8”, “voltage output”
The Extra Code provides 8 logic inputs, the serial interface for the external relay module ER8, and an electrically isolated power supply for 2-wire transmitters.
The eight logic inputs can operated by floating contacts or by the following
voltage levels:
inactive 0 — 5V
active 20 — 35V
The voltage levels must be applied for at least 0.4sec.
Possible functions:
- external text
- binary-linked external text
- external start/stop
- change chart drive over to external speed
-event counter
- start scaling print
- start/stop of external report
- inhibit keys
- event traces
92
Page 93

10 Extra codes and accessories
10.3 External relay module ER8
The external relay module ER8 adds 8 switching outputs to the recorder.
The sequence of the relays 1 — 8 is permanently assigned to the limit comparators 1 — 8 (limit state). The corresponding limit state is only transferred to
the relay if the relay has been activated (Configuration level 3
Î Status = ON).
v Section 3.1 “Limit monitoring by limit comparators”
v Section 3.5.4
“Limit comparator texts, external text, binary-linked external text”
v Section 4.2 “Table of the configuration parameters”
The external realy module ER8 can only be operated when the
Extra Code has been installed in the recorder.
When the setup connector is plugged into the recorder, all relays
are de-energised.
Î Relay output
93
Page 94

10 Extra codes and accessories
ER 8
Error
Power
(L+) (L-)
L1 N
97 98 99
(+)
TxD
RxD RxD
TxD GND
(-)
7.17.27.3
Connections
to ER8
94
Page 95

10.4 Setup program
The setup program provides convenient configuration of the recorder, using an
IBM-compatible PC.
In addition, the following functions are available for operating and programming the printing recorder:
- setting different print colours
- print mode and priorities
- determining which parameters can be set on the printing recorder
- settings can be printed out, using the setup program
- various setup settings can be managed, and transferred to the printing
recorder as required
- carry out an instrument test
10 Extra codes and accessories
Hardware
requirements
Software
requirements
- IBM-PC or compatible computer
- CPU from Intel 386
-4 MB RAM
- 3.5" diskette drive
- hard disk with at least 6 MB free space
- one free RS232 serial interface
-mouse
-VGA graphics
-Microsoft Windows
1
3.1/3.11/95/NT 4.0
1. Microsoft and Windows are registered trademarks of the
Microsoft Corporation
95
Page 96

10 Extra codes and accessories
The setup program is installed by means of an installation program for Microsoft Windows.
The operation of the setup program is described in the Installation Manual
(B 70.6030.3) and in Windows Online Help.
All the parameters of the printing recorder can be programmed with the aid of
the setup program.
A summary of all the parameters of the recorder is provided in the Appendix.
ÖSection 12.5 “Summary of the parameters”
If the setup connector is plugged into the recorder, then
- the signal acquisition and
-the recording
are interrupted.
Additionally,
- events are no longer registered,
- reports are aborted and reset,
- limits are no longer monitored and
- the outputs are no longer operated.
The relays are de-energised.
96
Page 97

10 Extra codes and accessories
10.5 Mathematics and logic module
If the maths/logic module is de-activated, then the signals which are measured
at the signal inputs are recorded according to the configuration of the inputs. If
the maths/logic module is activated, then the measured signals can be mathematically linked.
Example:
The sum/difference of two inputs is recorded on one channel. At the same
time, on another channel, a maximum value is recorded for as long as a specific logic input is open. Closing the logic input resets the maximum value recording.
Because of the large number of functions, operators and variables which are
available for the maths module, in most cases an individual adjustment can be
made to the requirements of the task.
On request, customer-specific maths programs can be created at the factory.
The setup program is then used to transfer these programs to the printing re-
order.
Switching on the maths/logic module can have a fundamental effect on the behaviour of the recorder.
The information given in the operating manual may then be largely
invalid
The maths module is activated in the instrument by the parameter Configura-
tion level 3
Î Mathematical module.
.
97
Page 98

10 Extra codes and accessories
10.6 Interface (RS422/RS485)
This interface is used for communication with higher-level systems (e. g. bus
systems). It is not the same as the setup interface, which is used to transfer
the data between the setup program and the recorder.
With the aid of the interface it is possible to implement the following functions:
- read out measurements from the recorder
- monitor the operating status of the recorder
- transmit values to the recorder, to be printed out
- transmit texts to the recorder, to be printed out
- transmit texts to the recorder, to be displayed
The RS422/RS485 interface is described in detail in the Interface Description
B 70.6030.2.
98
Page 99

11.1 What to do if …
11 Fault-finding
Display or printing
“>>>>>>”
Instead of a value
“ **** ”, “ ±*.***”, “ ±**.** ”,
“ ±***.* ”, “ ±****.”
is displayed or printed
No recording - The S key was pressed
- The value is outside the measuring range
(out-of-range)
- The transducer has been connected up incorrectly
- The signal inputs are configured incorrectly
- Probe break
- The value can no longer be represented:
alter the scaling with the setup program,
so that the value can always be represented.
- In the case of the event counter:
reset the event counter using the setup program or
the parameter Configuration level 3
- “External Stop” was configured, and the corresponding
logic input is closed
- The chart cassette has not been fitted correctly
vSection 9.2 “Removing and replacing the chart cassette”
Caution:
Insert the chart cassette by applying light upwards pressure
Î Event counter
- The take-up roll has not properly engaged with the
chart cassette
vSection 9.2.1 “Changing the roll chart”
- The end of the chart paper has been reached
vSection 9.2.1 “Changing the roll chart”
vSection 9.2.2 “Changing the fanfold chart”
- The chart speed has been programmed to 0 mm/h
vSection 4.2 “Table of the configuration parameters”
- The plot status is switched to “OFF”
vSection 4.2 “Table of the configuration parameters”
- The setup connector is still plugged in
Print head doesn‘t write - The print head has not been inserted properly
vSection 8.3 “Fitting the print head”
- The ink in the print head has been used up
99
Page 100

11 Fault-finding
Chart paper is not moving - The chart cassette has not been fitted correctly
vSection 9.2 “Removing and replacing the chart cassette”
- The take-up roll has not properly engaged with the
chart cassette
vSection 9.2.1 “Changing the roll chart”
- The chart speed has been programmed to 0mm/h
vSection 4.2 “Table of the configuration parameters”
- The paper perforation is not running correctly over the paperfeed sprocket
- The tear-off edge is not properly engaged
- The printing recorder is in the stop status
Measurements are not
recorded
Relay does not switch,
although limit is exceeded
- Check that the connection terminals are tightened properly
-Check the supply
- Check the input configuration (measurement range)
- Check the transducers and their leads, measure them if
appropriate
- The plot status may be switched off
- The signal inputs are not wired up according to the connection
diagram
- The recorder and the external relay module ER8
are not connected together properly
- The limit differential (hysteresis) has been ignored
- The relay status is “OFF”
- A wrong signal is being compared against a limit
- A signal input is in the “Out of Range” condition, and the response of the limit comparators to a probe break (Configuration
level 2 ➔ Limit comparator ➔ Probe break) has been configured
as “constant”
No programming
possible
No communication
with the setup program
100
- A wrong code number has been entered
- The code number has been changed
- The setup connector is not properly plugged in
- The printing recorder is already being configured by using the
keys: leave the parameter and configuration levels by pressing
the e key
 Loading...